

#nvidia
nvidia
3.2M visualizações
5,856 a discutir
Popular
Mais recente

·
--
Em Alta
O CEO da Nvidia, Jensen Huang, acredita que entramos em uma "era de baixa inteligência" em que as pessoas não precisarão mais memorizar fatos básicos. Ele sugere que, como a IA vai lidar com a maior parte das tarefas rotineiras, as crianças talvez não precisem mais aprender habilidades tradicionais como a tabuada.
#NVIDIA #USstock #bstock
$NVDAB
{spot}(NVDABUSDT)
$NVDA.US
{stock_us}(NVDA.US)
$BTC
{future}(BTCUSDT)
O CEO da Nvidia, Jensen Huang, acredita que entramos em uma "era de baixa inteligência" em que as pessoas não precisarão mais memorizar fatos básicos. Ele sugere que, como a IA vai lidar com a maior parte das tarefas rotineiras, as crianças talvez não precisem mais aprender habilidades tradicionais como a tabuada.
#NVIDIA #USstock #bstock
$NVDAB
$NVDA.US
$BTC
#NVIDIA #USstock #bstock
$NVDAB
$NVDA.US
$BTC
35

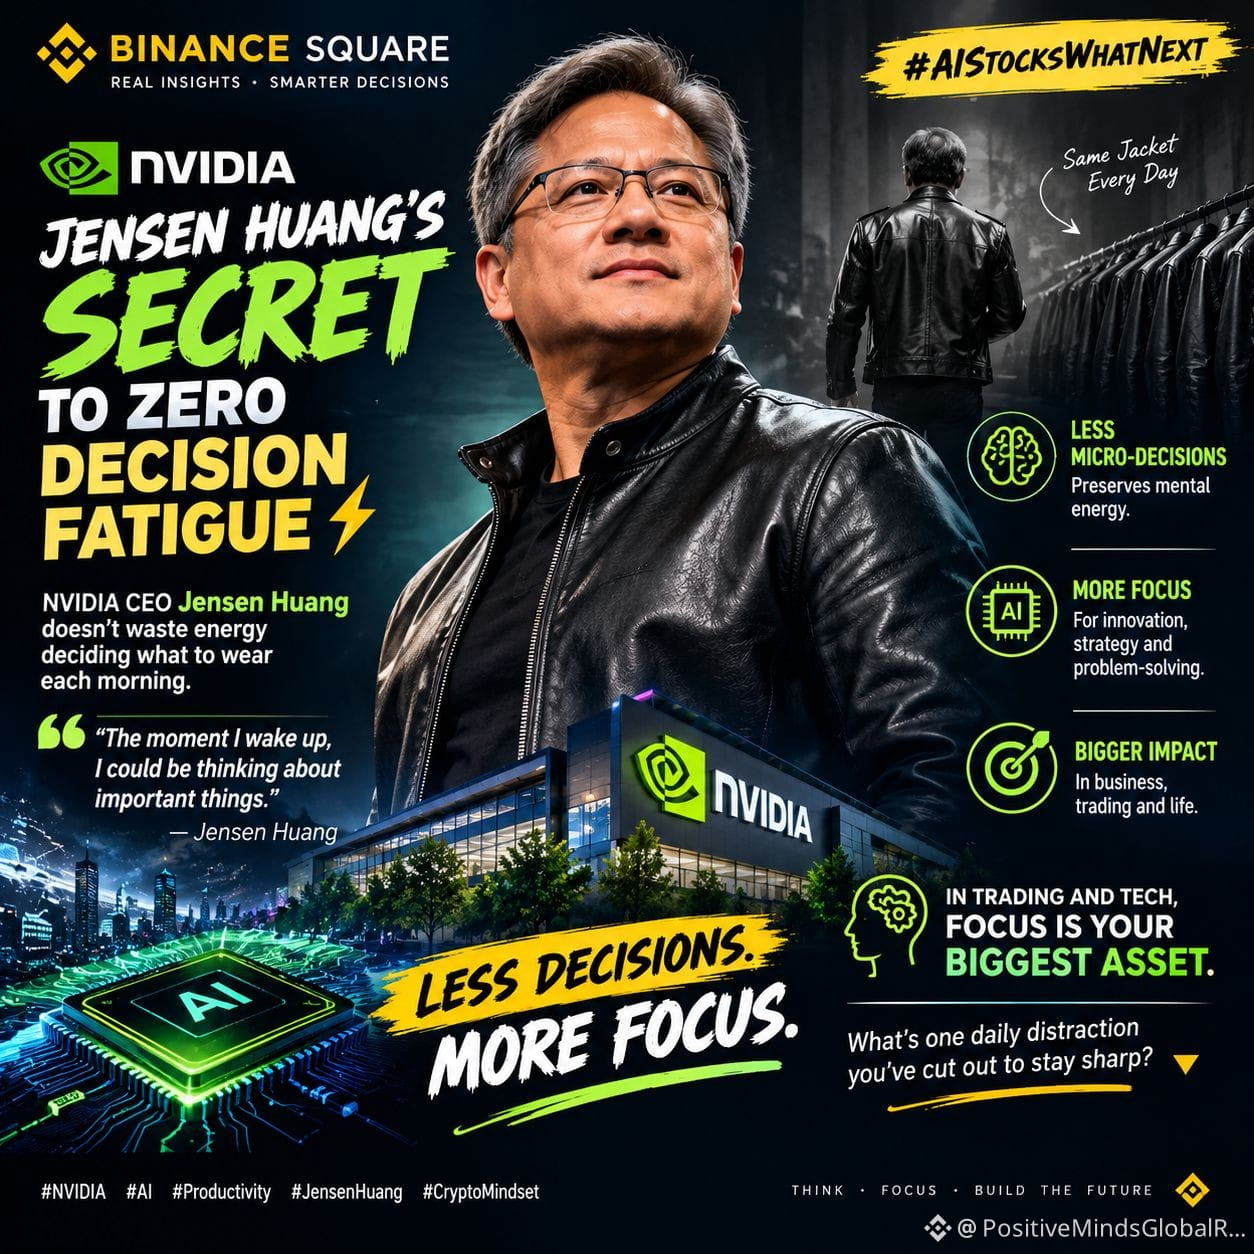
#AIStocksWhatNext 🖤⚡ SEGREDO DE JENSEN HUANG: MENOS DECISÕES, MAIS FOCO
O CEO da Nvidia, Jensen Huang, mantém o guarda-roupa diário simples — de forma famosa, ele segue com seu icônico jaqueta de couro preta.
Por quê?
Ele já explicou que evitar pequenas decisões pode preservar a energia mental para o que realmente importa.
🧠 A lição vai além da moda.
Em IA, negócios e trading, a atenção é um recurso limitado.
Menos tempo em decisões desnecessárias = mais foco em estratégia, inovação e execução.
🔥 Seu maior upgrade de produtividade talvez não seja fazer mais — pode ser decidir menos.
Qual decisão diária você eliminou para manter o foco? 👇
#NVIDIA #AI #JensenHuang #Produtividade #Trading #AIStocksWhatNext #BinanceSquare #PositiveMindsGlobalResults
{spot}(BNBUSDT)
{spot}(BTCUSDT)
$NVDAB
{spot}(NVDABUSDT)
#AIStocksWhatNext 🖤⚡ SEGREDO DE JENSEN HUANG: MENOS DECISÕES, MAIS FOCO
O CEO da Nvidia, Jensen Huang, mantém o guarda-roupa diário simples — de forma famosa, ele segue com seu icônico jaqueta de couro preta.
Por quê?
Ele já explicou que evitar pequenas decisões pode preservar a energia mental para o que realmente importa.
🧠 A lição vai além da moda.
Em IA, negócios e trading, a atenção é um recurso limitado.
Menos tempo em decisões desnecessárias = mais foco em estratégia, inovação e execução.
🔥 Seu maior upgrade de produtividade talvez não seja fazer mais — pode ser decidir menos.
Qual decisão diária você eliminou para manter o foco? 👇
#NVIDIA #AI #JensenHuang #Produtividade #Trading #AIStocksWhatNext #BinanceSquare #PositiveMindsGlobalResults
$NVDAB
O CEO da Nvidia, Jensen Huang, mantém o guarda-roupa diário simples — de forma famosa, ele segue com seu icônico jaqueta de couro preta.
Por quê?
Ele já explicou que evitar pequenas decisões pode preservar a energia mental para o que realmente importa.
🧠 A lição vai além da moda.
Em IA, negócios e trading, a atenção é um recurso limitado.
Menos tempo em decisões desnecessárias = mais foco em estratégia, inovação e execução.
🔥 Seu maior upgrade de produtividade talvez não seja fazer mais — pode ser decidir menos.
Qual decisão diária você eliminou para manter o foco? 👇
#NVIDIA #AI #JensenHuang #Produtividade #Trading #AIStocksWhatNext #BinanceSquare #PositiveMindsGlobalResults
$NVDAB
1
92

·
--
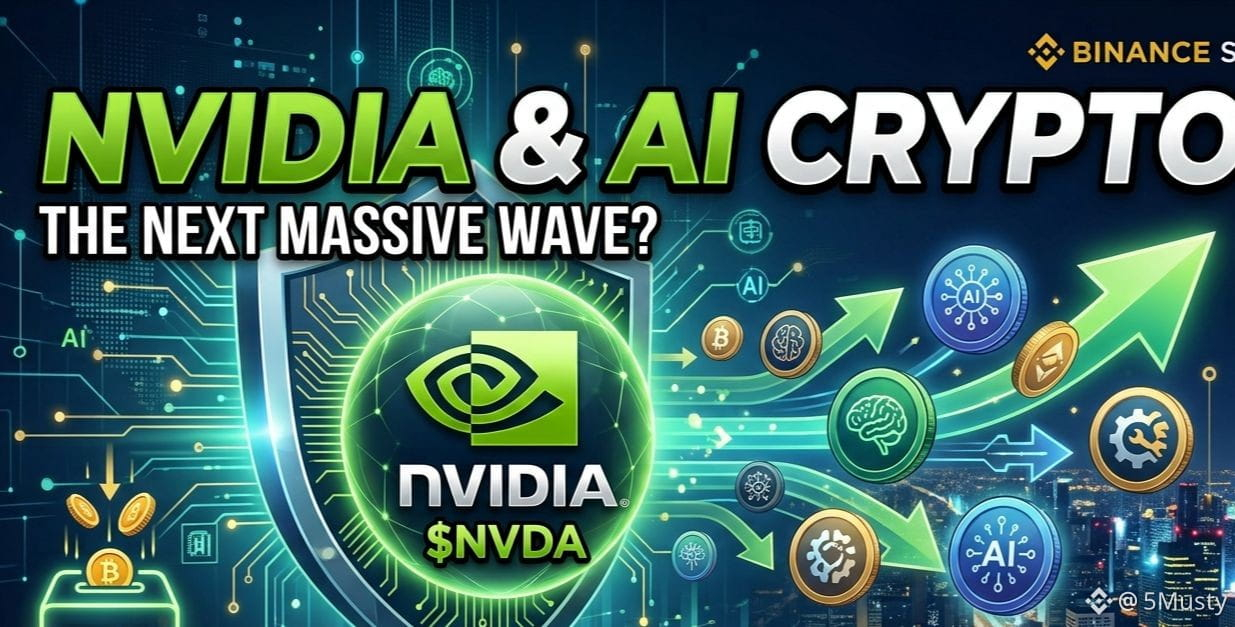
🚀 $NVDA & Criptos de IA: A Próxima Onda Massiva? 🤖
A NVIDIA continua a superar as expectativas do mercado com receitas inabaláveis e domínio em IA. A história mostra que, sempre que a NVDA faz um grande movimento, os criptoativos focados em IA seguem logo depois!
💡 Principais destaques para tokens de IA:
• Empolgação institucional: o crescimento tradicional da IA alimenta diretamente o ecossistema de IA das criptos.
• Lista de observação: fique de olho nos principais protocolos de IA & Big Data durante as quedas.
• Estratégia: procure por forte consolidação de volume; não corra atrás de velas verdes.
💬 Qual token de IA está na sua carteira agora? Deixe seus destaques abaixo! 👇
💛 Achou este insight rápido útil? Toque no botão de Dica abaixo para apoiar a pesquisa diária e não se esqueça de Curtir & Compartilhar! 🚀
#NVIDIA #NVDAUS #AICrypto #CryptoAnalysis #BinanceSquare
🚀 $NVDA & Criptos de IA: A Próxima Onda Massiva? 🤖
A NVIDIA continua a superar as expectativas do mercado com receitas inabaláveis e domínio em IA. A história mostra que, sempre que a NVDA faz um grande movimento, os criptoativos focados em IA seguem logo depois!
💡 Principais destaques para tokens de IA:
• Empolgação institucional: o crescimento tradicional da IA alimenta diretamente o ecossistema de IA das criptos.
• Lista de observação: fique de olho nos principais protocolos de IA & Big Data durante as quedas.
• Estratégia: procure por forte consolidação de volume; não corra atrás de velas verdes.
💬 Qual token de IA está na sua carteira agora? Deixe seus destaques abaixo! 👇
💛 Achou este insight rápido útil? Toque no botão de Dica abaixo para apoiar a pesquisa diária e não se esqueça de Curtir & Compartilhar! 🚀
#NVIDIA #NVDAUS #AICrypto #CryptoAnalysis #BinanceSquare
A NVIDIA continua a superar as expectativas do mercado com receitas inabaláveis e domínio em IA. A história mostra que, sempre que a NVDA faz um grande movimento, os criptoativos focados em IA seguem logo depois!
💡 Principais destaques para tokens de IA:
• Empolgação institucional: o crescimento tradicional da IA alimenta diretamente o ecossistema de IA das criptos.
• Lista de observação: fique de olho nos principais protocolos de IA & Big Data durante as quedas.
• Estratégia: procure por forte consolidação de volume; não corra atrás de velas verdes.
💬 Qual token de IA está na sua carteira agora? Deixe seus destaques abaixo! 👇
💛 Achou este insight rápido útil? Toque no botão de Dica abaixo para apoiar a pesquisa diária e não se esqueça de Curtir & Compartilhar! 🚀
#NVIDIA #NVDAUS #AICrypto #CryptoAnalysis #BinanceSquare
1
134

·
--
Em Alta
Trading de $FET de 30 dias no valor de 39.9 USDT
🤖 O A.I. pode se tornar mais seguro à medida que fica mais rápido?
O CEO da Nvidia, Jensen Huang, disse a Ezra Klein que «a IA precisa ser acelerada para ser segura», instando os laboratórios de IA a alocarem mais capacidade computacional para avaliação e alinhamento.
A ideia aqui não é apenas a velocidade, mas acelerar o processo de teste dos modelos e entender seus riscos antes de expandir seu uso.
À medida que a IA passa da fase de experimentos para a infraestrutura da qual empresas e mercados dependem, a capacidade de testar modelos e monitorar seu comportamento se torna parte essencial do avanço.
📌 A verdadeira questão: a infraestrutura de IA consegue evoluir tão rapidamente quanto a evolução de suas capacidades?
$NVDA $TAO $FET
#NVIDIA #AI #artificialintelligence #Technology #crypto
🤖 O A.I. pode se tornar mais seguro à medida que fica mais rápido?
O CEO da Nvidia, Jensen Huang, disse a Ezra Klein que «a IA precisa ser acelerada para ser segura», instando os laboratórios de IA a alocarem mais capacidade computacional para avaliação e alinhamento.
A ideia aqui não é apenas a velocidade, mas acelerar o processo de teste dos modelos e entender seus riscos antes de expandir seu uso.
À medida que a IA passa da fase de experimentos para a infraestrutura da qual empresas e mercados dependem, a capacidade de testar modelos e monitorar seu comportamento se torna parte essencial do avanço.
📌 A verdadeira questão: a infraestrutura de IA consegue evoluir tão rapidamente quanto a evolução de suas capacidades?
$NVDA $TAO $FET
#NVIDIA #AI #artificialintelligence #Technology #crypto
O CEO da Nvidia, Jensen Huang, disse a Ezra Klein que «a IA precisa ser acelerada para ser segura», instando os laboratórios de IA a alocarem mais capacidade computacional para avaliação e alinhamento.
A ideia aqui não é apenas a velocidade, mas acelerar o processo de teste dos modelos e entender seus riscos antes de expandir seu uso.
À medida que a IA passa da fase de experimentos para a infraestrutura da qual empresas e mercados dependem, a capacidade de testar modelos e monitorar seu comportamento se torna parte essencial do avanço.
📌 A verdadeira questão: a infraestrutura de IA consegue evoluir tão rapidamente quanto a evolução de suas capacidades?
$NVDA $TAO $FET
#NVIDIA #AI #artificialintelligence #Technology #crypto

2
392

·
--
Em Alta
Trading de $VTHO de 30 dias no valor de 76.3 USDT
#aistockswhatnext
Nesta semana, dois números estão sendo repetidos em todo esse hashtag. Nenhum deles está bem certo.$
Minha visão: otimista com os líderes do setor de chips, cético em relação ao ruído ao redor.
O CFO da Nvidia orientou cerca de 70% de crescimento da receita para o AF28 em 26 de agosto — não o “dobro” que todo mundo está citando. Essa frase foi o Jensen Huang descrevendo a demanda não atendida em 17 de setembro, não uma orientação da empresa.
Então, o que eu estou perguntando de verdade: se a alta for real, mas mais estreita do que parece, de onde ela está vindo?
O que estou observando em vez dos nomes óbvios:
• Fabricantes de equipamentos de chips e de memória liderando o pregão, não apenas #NVIDIA
• Cibersegurança ganhando tração toda vez que surgem manchetes sobre segurança de IA
• $BTC e tokens de IA surfando a mesma onda macro — short covering, queda do petróleo — não uma história de IA por conta própria
• A amplitude ainda não confirmou: mais ações atingiram mínimas de novas mínimas do que novas máximas no mesmo dia em que o Nasdaq fechou em recorde
Nada disso é de tom baixista. Só não é a história do “tudo está indo à lua” que está sendo postada agora.
O mesmo vale para Washington. O anúncio da “AI Force” ainda não tem estrutura nem orçamento, e a linha de “25% do PIB” não tem fonte por trás.
A vantagem real desta semana não é escolher o próximo vencedor de IA. É saber quais desses números são, de fato, reais.
#AIStocksWhatNext Não é aconselhamento financeiro.
$NVDAB
#bullish $VTHO
{spot}(NVDABUSDT)
{spot}(BTCUSDT)
#aistockswhatnext
Nesta semana, dois números estão sendo repetidos em todo esse hashtag. Nenhum deles está bem certo.$
Minha visão: otimista com os líderes do setor de chips, cético em relação ao ruído ao redor.
O CFO da Nvidia orientou cerca de 70% de crescimento da receita para o AF28 em 26 de agosto — não o “dobro” que todo mundo está citando. Essa frase foi o Jensen Huang descrevendo a demanda não atendida em 17 de setembro, não uma orientação da empresa.
Então, o que eu estou perguntando de verdade: se a alta for real, mas mais estreita do que parece, de onde ela está vindo?
O que estou observando em vez dos nomes óbvios:
• Fabricantes de equipamentos de chips e de memória liderando o pregão, não apenas #NVIDIA
• Cibersegurança ganhando tração toda vez que surgem manchetes sobre segurança de IA
• $BTC e tokens de IA surfando a mesma onda macro — short covering, queda do petróleo — não uma história de IA por conta própria
• A amplitude ainda não confirmou: mais ações atingiram mínimas de novas mínimas do que novas máximas no mesmo dia em que o Nasdaq fechou em recorde
Nada disso é de tom baixista. Só não é a história do “tudo está indo à lua” que está sendo postada agora.
O mesmo vale para Washington. O anúncio da “AI Force” ainda não tem estrutura nem orçamento, e a linha de “25% do PIB” não tem fonte por trás.
A vantagem real desta semana não é escolher o próximo vencedor de IA. É saber quais desses números são, de fato, reais.
#AIStocksWhatNext Não é aconselhamento financeiro.
$NVDAB
#bullish $VTHO
Nesta semana, dois números estão sendo repetidos em todo esse hashtag. Nenhum deles está bem certo.$
Minha visão: otimista com os líderes do setor de chips, cético em relação ao ruído ao redor.
O CFO da Nvidia orientou cerca de 70% de crescimento da receita para o AF28 em 26 de agosto — não o “dobro” que todo mundo está citando. Essa frase foi o Jensen Huang descrevendo a demanda não atendida em 17 de setembro, não uma orientação da empresa.
Então, o que eu estou perguntando de verdade: se a alta for real, mas mais estreita do que parece, de onde ela está vindo?
O que estou observando em vez dos nomes óbvios:
• Fabricantes de equipamentos de chips e de memória liderando o pregão, não apenas #NVIDIA
• Cibersegurança ganhando tração toda vez que surgem manchetes sobre segurança de IA
• $BTC e tokens de IA surfando a mesma onda macro — short covering, queda do petróleo — não uma história de IA por conta própria
• A amplitude ainda não confirmou: mais ações atingiram mínimas de novas mínimas do que novas máximas no mesmo dia em que o Nasdaq fechou em recorde
Nada disso é de tom baixista. Só não é a história do “tudo está indo à lua” que está sendo postada agora.
O mesmo vale para Washington. O anúncio da “AI Force” ainda não tem estrutura nem orçamento, e a linha de “25% do PIB” não tem fonte por trás.
A vantagem real desta semana não é escolher o próximo vencedor de IA. É saber quais desses números são, de fato, reais.
#AIStocksWhatNext Não é aconselhamento financeiro.
$NVDAB
#bullish $VTHO
101

·
--
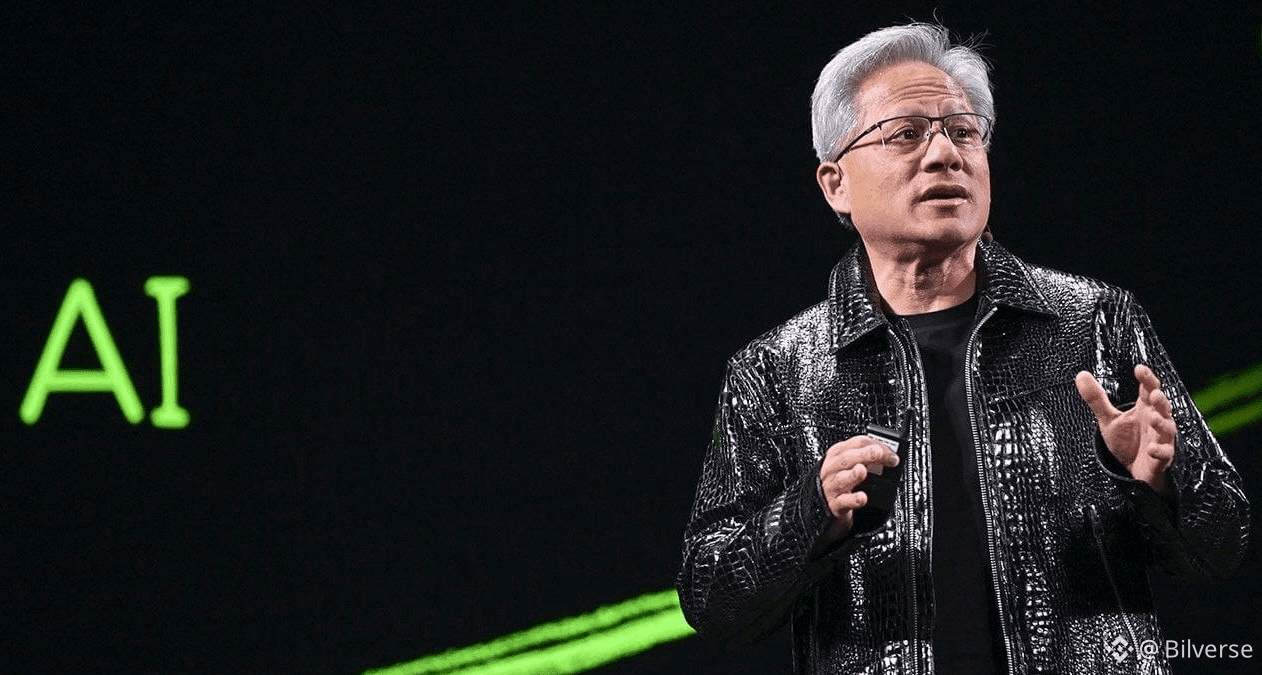
🚨 JENSEN HUANG ACABOU DE DIZER ALGO ENORME SOBRE O FUTURO DOS EUA.
O CEO da NVIDIA, Jensen Huang, diz que a IA pode dar aos EUA sua primeira chance em 50–100 anos de REINDUSTRIALIZAR. 🇺🇸
E a explicação dele é maluca:
⚡️ “Não é fabricar átomos. É fabricar elétrons.”
Pense nisso.
🏭 Indústria antiga = fábricas
🤖 Nova indústria = IA + robôs
⚡️ IA = enorme demanda por eletricidade
🧠 Inteligência = o novo recurso industrial
Isso não é apenas sobre ChatGPT.
É sobre chips.
É sobre data centers.
É sobre energia.
É sobre robôs.
É sobre fábricas automatizadas.
E, no fim das contas…
🔥 É sobre quem controla a infraestrutura que produz inteligência.
A revolução industrial foi sobre fabricar coisas.
A revolução da IA poderia ser sobre fabricar inteligência em escala.
E isso muda TUDO. 🚀
#NVIDIA #JensenHuang #AI #Bilverse
{future}(NVDAUSDT)
🚨 JENSEN HUANG ACABOU DE DIZER ALGO ENORME SOBRE O FUTURO DOS EUA.
O CEO da NVIDIA, Jensen Huang, diz que a IA pode dar aos EUA sua primeira chance em 50–100 anos de REINDUSTRIALIZAR. 🇺🇸
E a explicação dele é maluca:
⚡️ “Não é fabricar átomos. É fabricar elétrons.”
Pense nisso.
🏭 Indústria antiga = fábricas
🤖 Nova indústria = IA + robôs
⚡️ IA = enorme demanda por eletricidade
🧠 Inteligência = o novo recurso industrial
Isso não é apenas sobre ChatGPT.
É sobre chips.
É sobre data centers.
É sobre energia.
É sobre robôs.
É sobre fábricas automatizadas.
E, no fim das contas…
🔥 É sobre quem controla a infraestrutura que produz inteligência.
A revolução industrial foi sobre fabricar coisas.
A revolução da IA poderia ser sobre fabricar inteligência em escala.
E isso muda TUDO. 🚀
#NVIDIA #JensenHuang #AI #Bilverse
O CEO da NVIDIA, Jensen Huang, diz que a IA pode dar aos EUA sua primeira chance em 50–100 anos de REINDUSTRIALIZAR. 🇺🇸
E a explicação dele é maluca:
⚡️ “Não é fabricar átomos. É fabricar elétrons.”
Pense nisso.
🏭 Indústria antiga = fábricas
🤖 Nova indústria = IA + robôs
⚡️ IA = enorme demanda por eletricidade
🧠 Inteligência = o novo recurso industrial
Isso não é apenas sobre ChatGPT.
É sobre chips.
É sobre data centers.
É sobre energia.
É sobre robôs.
É sobre fábricas automatizadas.
E, no fim das contas…
🔥 É sobre quem controla a infraestrutura que produz inteligência.
A revolução industrial foi sobre fabricar coisas.
A revolução da IA poderia ser sobre fabricar inteligência em escala.
E isso muda TUDO. 🚀
#NVIDIA #JensenHuang #AI #Bilverse
1
940

·
--
Em Alta
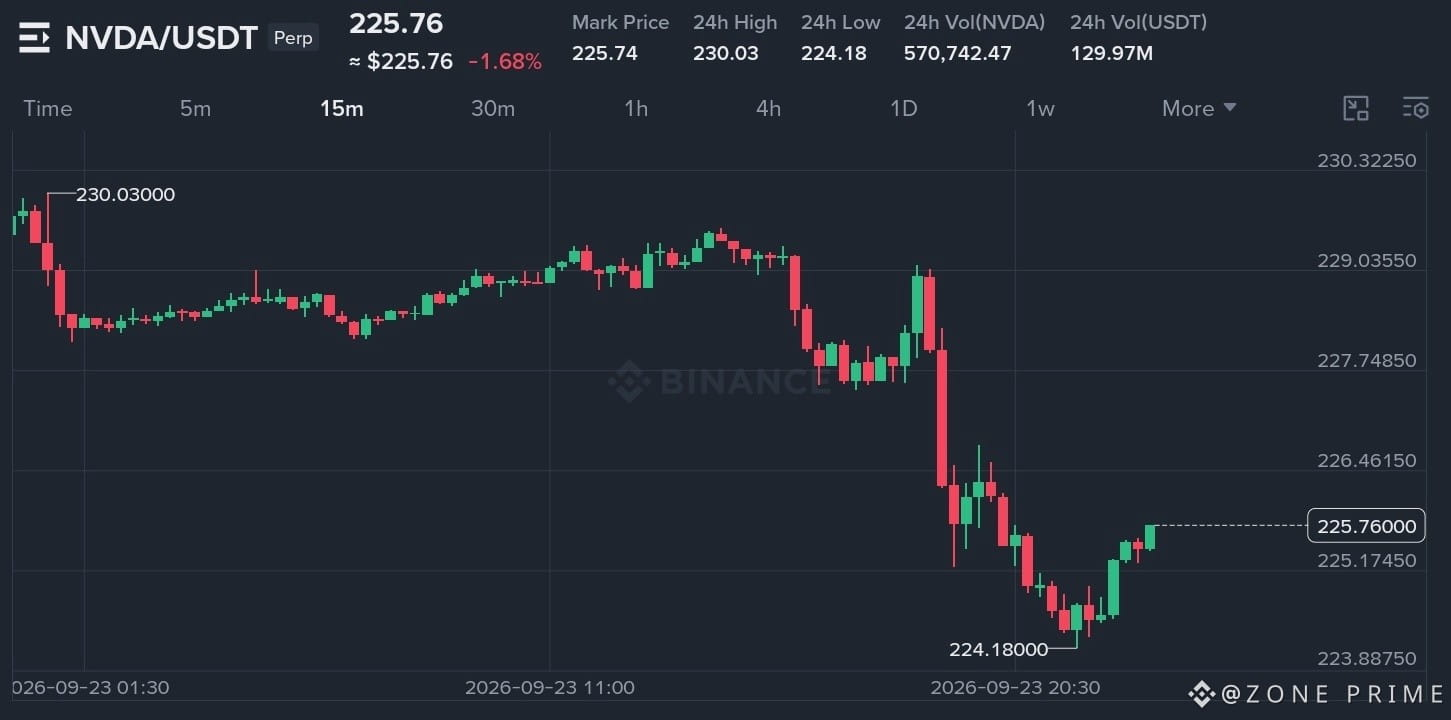
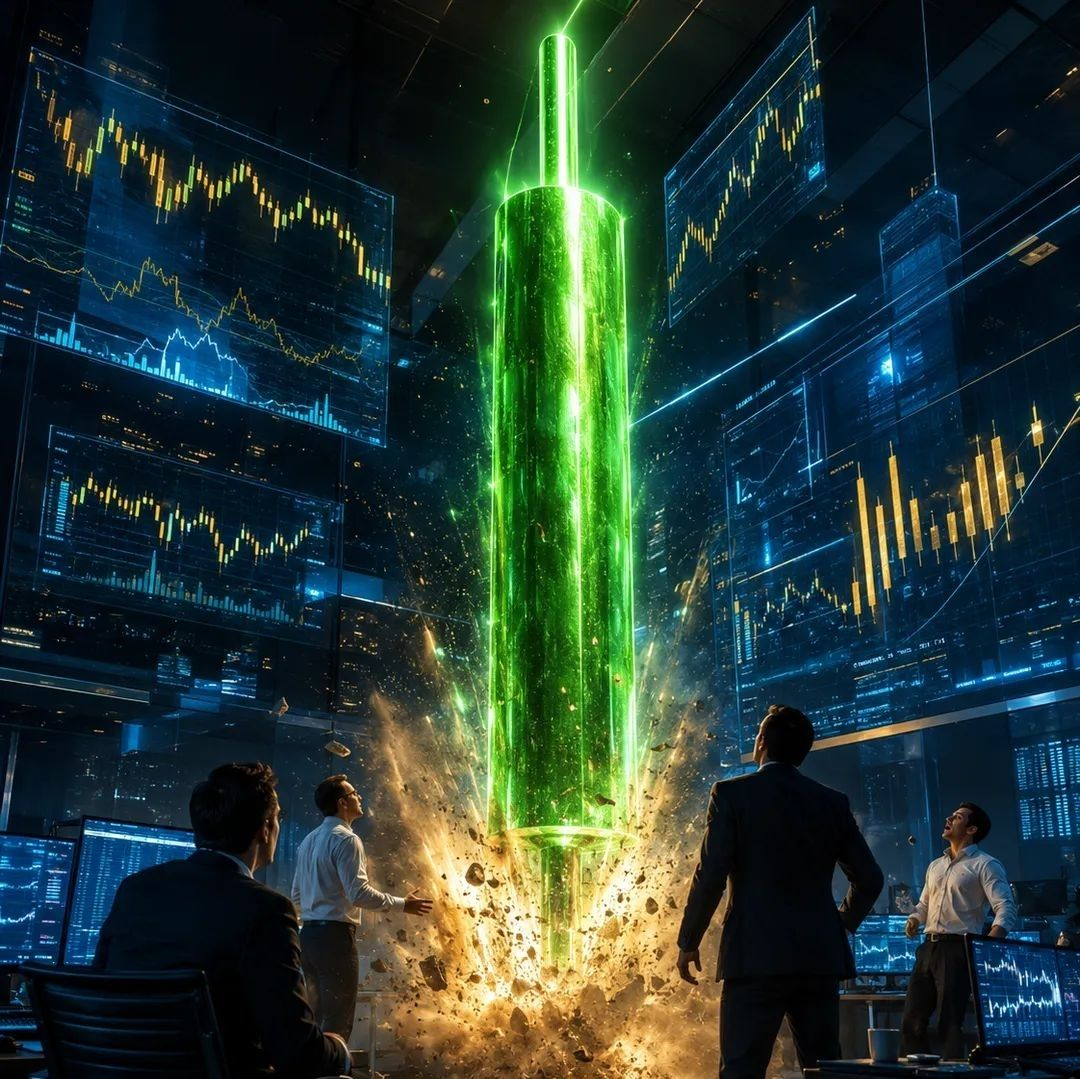
$NVDA /USDT — CONFIGURAÇÃO LONGA Vai Pessoal 📈 🚀 💯 😱 ✨ 🔥
Entrada: 224.18 - 225.76
TP1: 226.46
TP2: 227.75
TP3: 229.04
Stop: 223.50
O preço encontrou um suporte forte logo após varrer o fundo de 224.18, imprimindo uma forte rejeição bullish em forma de pavio.
Ordens limitadas ativas no book de ofertas absorvendo e volume de compra estável sustentam uma recuperação contínua em direção a zonas importantes de oferta.
#nvda #nvdausdt #nvidia #crypto #Write2Earn $NVDA
{future}(NVDAUSDT)
$NVDA /USDT — CONFIGURAÇÃO LONGA Vai Pessoal 📈 🚀 💯 😱 ✨ 🔥
Entrada: 224.18 - 225.76
TP1: 226.46
TP2: 227.75
TP3: 229.04
Stop: 223.50
O preço encontrou um suporte forte logo após varrer o fundo de 224.18, imprimindo uma forte rejeição bullish em forma de pavio.
Ordens limitadas ativas no book de ofertas absorvendo e volume de compra estável sustentam uma recuperação contínua em direção a zonas importantes de oferta.
#nvda #nvdausdt #nvidia #crypto #Write2Earn $NVDA
Entrada: 224.18 - 225.76
TP1: 226.46
TP2: 227.75
TP3: 229.04
Stop: 223.50
O preço encontrou um suporte forte logo após varrer o fundo de 224.18, imprimindo uma forte rejeição bullish em forma de pavio.
Ordens limitadas ativas no book de ofertas absorvendo e volume de compra estável sustentam uma recuperação contínua em direção a zonas importantes de oferta.
#nvda #nvdausdt #nvidia #crypto #Write2Earn $NVDA
347
·
--
Em Alta
#AIStocksWhatNext
A demanda por IA é sustentável ou estamos enfrentando uma bolha?
Com a Nvidia projetando que as vendas de chips vão dobrar e as principais gigantes de tecnologia alcançando receitas recordes, a euforia em torno das ações de IA é inegável. A quantidade avassaladora de capital sendo direcionada para a infraestrutura de computação é impressionante. No entanto, esse gasto massivo levanta uma questão crucial: isso é um crescimento verdadeiro e de longo prazo ou apenas uma alta passageira do mercado?
Enquanto líderes do setor discutem se devem desacelerar o desenvolvimento de IA, o apoio político — como planos para integrar a IA às estratégias econômicas centrais — sugere que o suporte em nível estadual pode oferecer estabilidade de longo prazo para o setor.
Pelo meu ponto de vista, continuo cautelosamente otimista. Pessoalmente, estou acompanhando três áreas além dos maiores nomes de IA:
🔹 Semicondutores & equipamentos de chips
🔹 Data centers & infraestrutura de IA
🔹 Demanda de energia e eletricidade ligada ao crescimento da IA
A questão-chave não é apenas “A IA vai crescer?” — e sim “Quais partes do ecossistema de IA vão capturar a próxima onda de crescimento?”
O que você acha que vem a seguir? 👇
Ações de IA, infraestrutura, semicondutores ou algo completamente diferente?
#AI #NVIDIA #Technology
{spot}(NVDABUSDT)
#AIStocksWhatNext
A demanda por IA é sustentável ou estamos enfrentando uma bolha?
Com a Nvidia projetando que as vendas de chips vão dobrar e as principais gigantes de tecnologia alcançando receitas recordes, a euforia em torno das ações de IA é inegável. A quantidade avassaladora de capital sendo direcionada para a infraestrutura de computação é impressionante. No entanto, esse gasto massivo levanta uma questão crucial: isso é um crescimento verdadeiro e de longo prazo ou apenas uma alta passageira do mercado?
Enquanto líderes do setor discutem se devem desacelerar o desenvolvimento de IA, o apoio político — como planos para integrar a IA às estratégias econômicas centrais — sugere que o suporte em nível estadual pode oferecer estabilidade de longo prazo para o setor.
Pelo meu ponto de vista, continuo cautelosamente otimista. Pessoalmente, estou acompanhando três áreas além dos maiores nomes de IA:
🔹 Semicondutores & equipamentos de chips
🔹 Data centers & infraestrutura de IA
🔹 Demanda de energia e eletricidade ligada ao crescimento da IA
A questão-chave não é apenas “A IA vai crescer?” — e sim “Quais partes do ecossistema de IA vão capturar a próxima onda de crescimento?”
O que você acha que vem a seguir? 👇
Ações de IA, infraestrutura, semicondutores ou algo completamente diferente?
#AI #NVIDIA #Technology
A demanda por IA é sustentável ou estamos enfrentando uma bolha?
Com a Nvidia projetando que as vendas de chips vão dobrar e as principais gigantes de tecnologia alcançando receitas recordes, a euforia em torno das ações de IA é inegável. A quantidade avassaladora de capital sendo direcionada para a infraestrutura de computação é impressionante. No entanto, esse gasto massivo levanta uma questão crucial: isso é um crescimento verdadeiro e de longo prazo ou apenas uma alta passageira do mercado?
Enquanto líderes do setor discutem se devem desacelerar o desenvolvimento de IA, o apoio político — como planos para integrar a IA às estratégias econômicas centrais — sugere que o suporte em nível estadual pode oferecer estabilidade de longo prazo para o setor.
Pelo meu ponto de vista, continuo cautelosamente otimista. Pessoalmente, estou acompanhando três áreas além dos maiores nomes de IA:
🔹 Semicondutores & equipamentos de chips
🔹 Data centers & infraestrutura de IA
🔹 Demanda de energia e eletricidade ligada ao crescimento da IA
A questão-chave não é apenas “A IA vai crescer?” — e sim “Quais partes do ecossistema de IA vão capturar a próxima onda de crescimento?”
O que você acha que vem a seguir? 👇
Ações de IA, infraestrutura, semicondutores ou algo completamente diferente?
#AI #NVIDIA #Technology
2
112

$NVDAB A NVIDIA está se mantendo no centro da corrida de IA A empresa estaria considerando a tecnologia de rede da NVIDIA para um retorno aos servidores corporativos enquanto a NVIDIA continua expandindo a infraestrutura de IA globalmente Essa combinação mantém a NVDA firmemente no radar dos investidores
#NVIDIA #NVDA #AI #Crypto #Stocks
{spot}(NVDABUSDT)
$NVDAB A NVIDIA está se mantendo no centro da corrida de IA A empresa estaria considerando a tecnologia de rede da NVIDIA para um retorno aos servidores corporativos enquanto a NVIDIA continua expandindo a infraestrutura de IA globalmente Essa combinação mantém a NVDA firmemente no radar dos investidores
#NVIDIA #NVDA #AI #Crypto #Stocks
#NVIDIA #NVDA #AI #Crypto #Stocks
65

·
--
Em Alta
#AIStocksWhatNext As ações de IA estão entrando na fase em que o crescimento precisa se provar.
A NVIDIA acabou de entregar US$ 96,2 bilhões em receita trimestral, acima de 106% ano contra ano, com a receita do Data Center atingindo US$ 89 bilhões, +117%.
A Microsoft Cloud chegou a US$ 59,3 bilhões, +27%, enquanto o Azure e outros serviços de nuvem cresceram 43%.
A AMD está vendo a mesma demanda por IA por outro ângulo. A receita de Data Center dela atingiu US$ 6,7 bilhões, +107% ano contra ano.
Os números são reais.
Mas a próxima pergunta é ainda mais importante:
Quanto desse gasto com IA pode virar receita duradoura, margens e fluxo de caixa?
A próxima fase do mercado de IA pode ser menos sobre quem consegue gastar mais com infraestrutura...
e mais sobre quem consegue realmente monetizá-la.
Chips.
Nuvem.
Data centers.
Redes.
Software de IA.
A alta da IA ainda está se expandindo.
Agora o mercado precisa descobrir quem captura a economia.
#AIStocksWhatNext #NVIDIA #AMD #Microsoft
{spot}(BTCUSDT)
{spot}(BNBUSDT)
{spot}(NVDABUSDT)
#AIStocksWhatNext As ações de IA estão entrando na fase em que o crescimento precisa se provar.
A NVIDIA acabou de entregar US$ 96,2 bilhões em receita trimestral, acima de 106% ano contra ano, com a receita do Data Center atingindo US$ 89 bilhões, +117%.
A Microsoft Cloud chegou a US$ 59,3 bilhões, +27%, enquanto o Azure e outros serviços de nuvem cresceram 43%.
A AMD está vendo a mesma demanda por IA por outro ângulo. A receita de Data Center dela atingiu US$ 6,7 bilhões, +107% ano contra ano.
Os números são reais.
Mas a próxima pergunta é ainda mais importante:
Quanto desse gasto com IA pode virar receita duradoura, margens e fluxo de caixa?
A próxima fase do mercado de IA pode ser menos sobre quem consegue gastar mais com infraestrutura...
e mais sobre quem consegue realmente monetizá-la.
Chips.
Nuvem.
Data centers.
Redes.
Software de IA.
A alta da IA ainda está se expandindo.
Agora o mercado precisa descobrir quem captura a economia.
#AIStocksWhatNext #NVIDIA #AMD #Microsoft
A NVIDIA acabou de entregar US$ 96,2 bilhões em receita trimestral, acima de 106% ano contra ano, com a receita do Data Center atingindo US$ 89 bilhões, +117%.
A Microsoft Cloud chegou a US$ 59,3 bilhões, +27%, enquanto o Azure e outros serviços de nuvem cresceram 43%.
A AMD está vendo a mesma demanda por IA por outro ângulo. A receita de Data Center dela atingiu US$ 6,7 bilhões, +107% ano contra ano.
Os números são reais.
Mas a próxima pergunta é ainda mais importante:
Quanto desse gasto com IA pode virar receita duradoura, margens e fluxo de caixa?
A próxima fase do mercado de IA pode ser menos sobre quem consegue gastar mais com infraestrutura...
e mais sobre quem consegue realmente monetizá-la.
Chips.
Nuvem.
Data centers.
Redes.
Software de IA.
A alta da IA ainda está se expandindo.
Agora o mercado precisa descobrir quem captura a economia.
#AIStocksWhatNext #NVIDIA #AMD #Microsoft
171

·
--
Em Alta
#aistockswhatnext
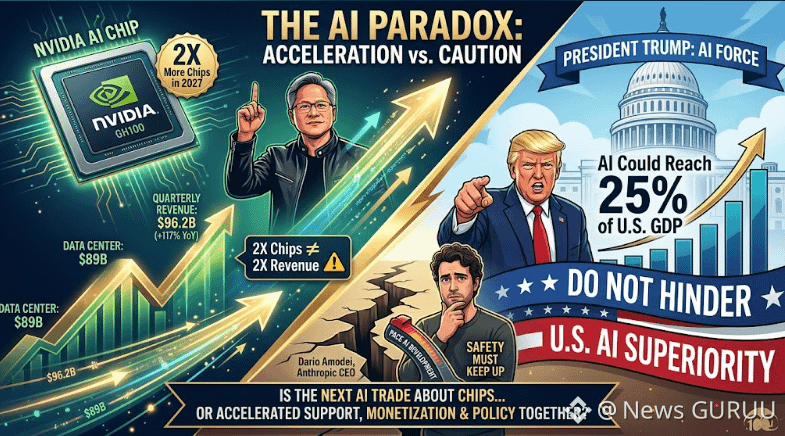
🚨 O boom da IA da Nvidia está acelerando — mas tem um porém.
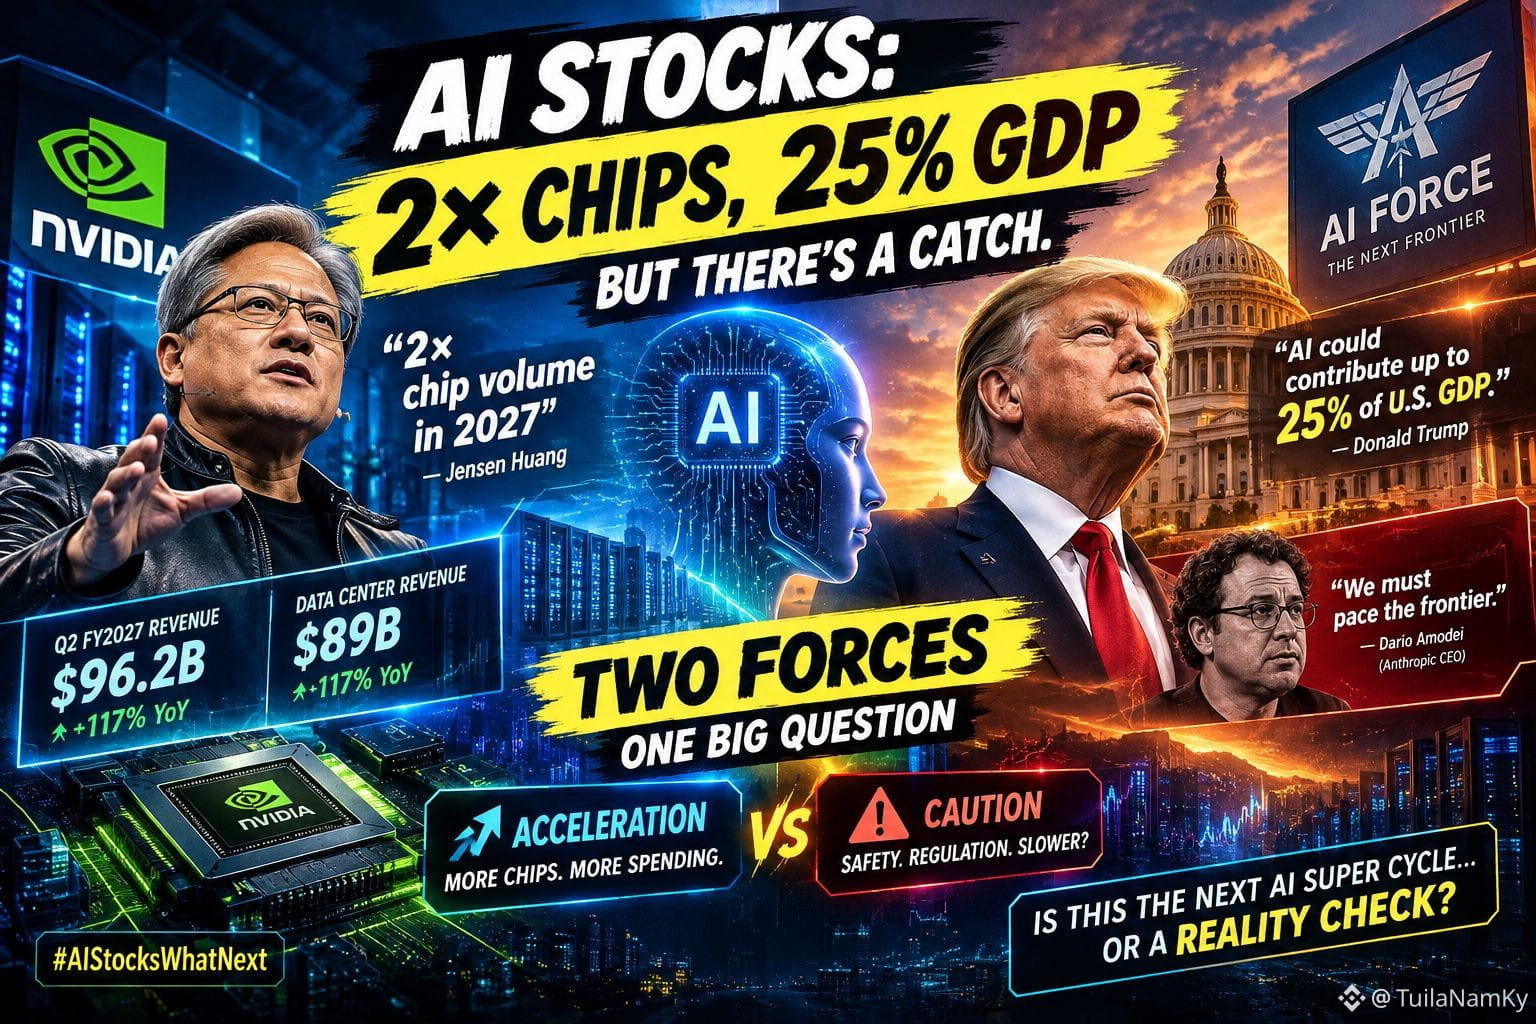
A Nvidia informou US$ 96,2 bi em receita trimestral, com a receita do Data Center subindo 117% ano a ano. Jensen Huang diz que a Nvidia poderia vender 2× mais chips em 2027 do que em 2026.
Mas 2× chips não significa 2× receita.
Ao mesmo tempo, o presidente Trump diz que a IA poderia eventualmente chegar a 25% do PIB dos EUA, enquanto o CEO da Anthropic, Dario Amodei, argumenta que o desenvolvimento da IA precisa ser desacelerado para garantir segurança.
A grande pergunta: A demanda por chips, a monetização da IA e o apoio de políticas conseguem continuar acelerando juntos? "CLIQUE NA ABA AMARELA DE MOEDA ABAIXO PARA IR À PÁGINA DE TRADING DESEJADA E OBTER BENEFÍCIO NA OPERAÇÃO"$NVDAB
{spot}(NVDABUSDT)
#NVIDIA #AIStocks
#aistockswhatnext
🚨 O boom da IA da Nvidia está acelerando — mas tem um porém.
A Nvidia informou US$ 96,2 bi em receita trimestral, com a receita do Data Center subindo 117% ano a ano. Jensen Huang diz que a Nvidia poderia vender 2× mais chips em 2027 do que em 2026.
Mas 2× chips não significa 2× receita.
Ao mesmo tempo, o presidente Trump diz que a IA poderia eventualmente chegar a 25% do PIB dos EUA, enquanto o CEO da Anthropic, Dario Amodei, argumenta que o desenvolvimento da IA precisa ser desacelerado para garantir segurança.
A grande pergunta: A demanda por chips, a monetização da IA e o apoio de políticas conseguem continuar acelerando juntos? "CLIQUE NA ABA AMARELA DE MOEDA ABAIXO PARA IR À PÁGINA DE TRADING DESEJADA E OBTER BENEFÍCIO NA OPERAÇÃO"$NVDAB
#NVIDIA #AIStocks
🚨 O boom da IA da Nvidia está acelerando — mas tem um porém.
A Nvidia informou US$ 96,2 bi em receita trimestral, com a receita do Data Center subindo 117% ano a ano. Jensen Huang diz que a Nvidia poderia vender 2× mais chips em 2027 do que em 2026.
Mas 2× chips não significa 2× receita.
Ao mesmo tempo, o presidente Trump diz que a IA poderia eventualmente chegar a 25% do PIB dos EUA, enquanto o CEO da Anthropic, Dario Amodei, argumenta que o desenvolvimento da IA precisa ser desacelerado para garantir segurança.
A grande pergunta: A demanda por chips, a monetização da IA e o apoio de políticas conseguem continuar acelerando juntos? "CLIQUE NA ABA AMARELA DE MOEDA ABAIXO PARA IR À PÁGINA DE TRADING DESEJADA E OBTER BENEFÍCIO NA OPERAÇÃO"$NVDAB
#NVIDIA #AIStocks
2
204


·
--
Em Alta
Verificado
Trabalhou por 15s
Esta versão mais recente combina os dados mais verificados — com a Nvidia, a Reuters, a Goldman Sachs e os números atuais do mercado.
#AIStocksWhatNext
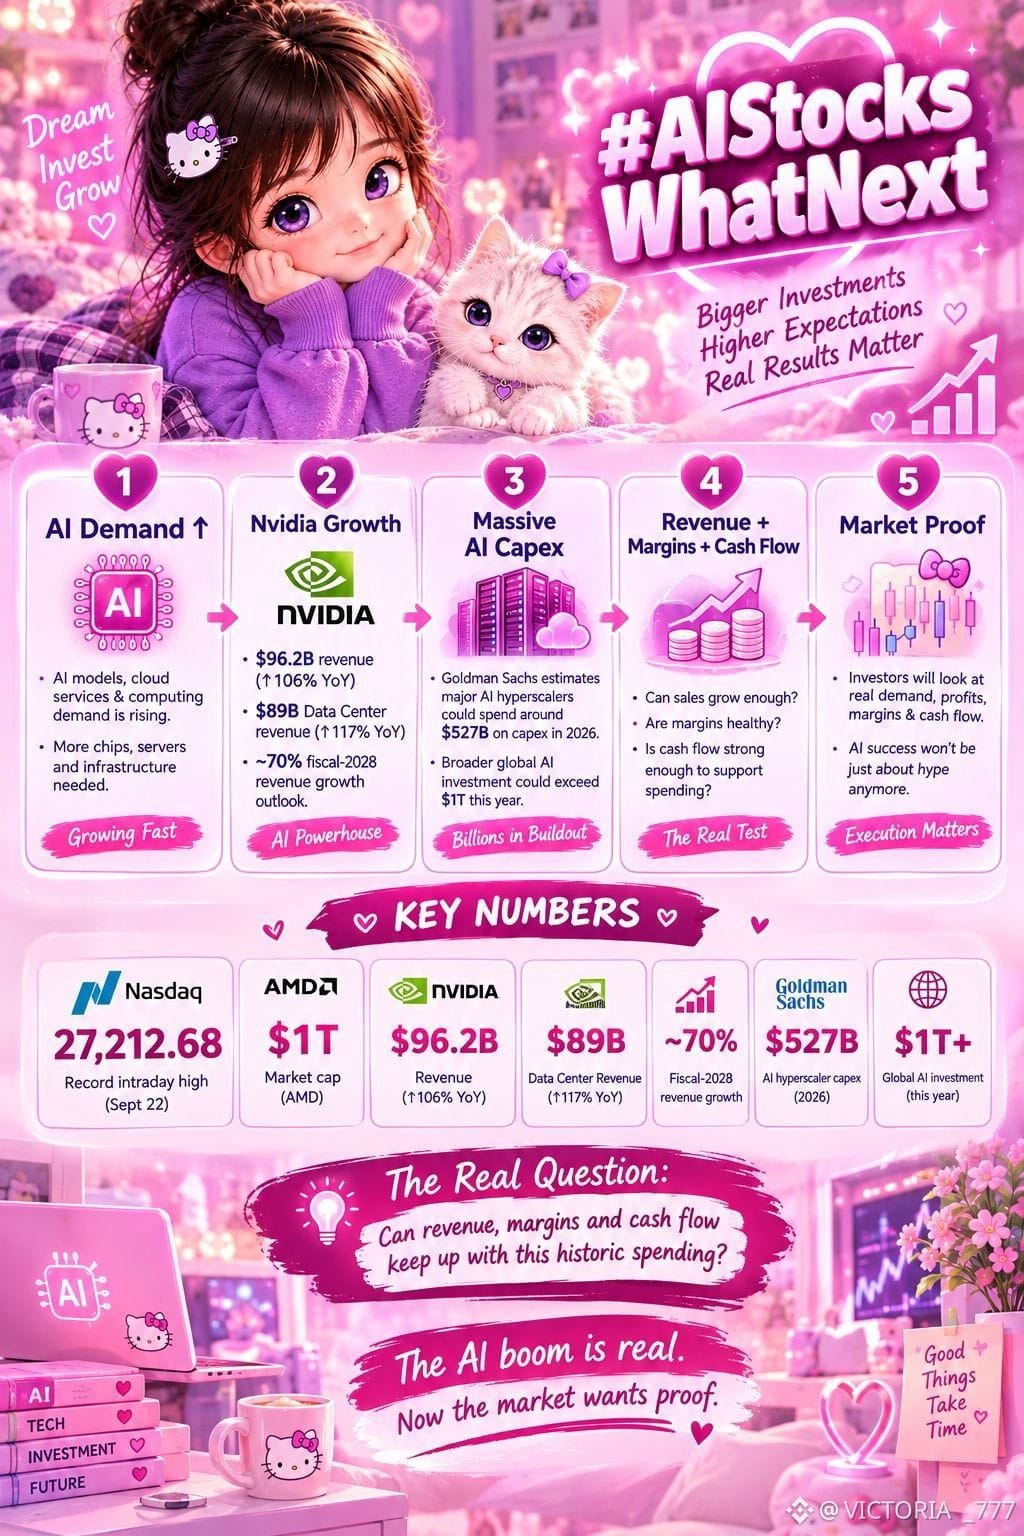
As ações de IA acabaram de entrar em outro nível — mas os números por trás desse rali é que tornam tudo interessante.
Em 22 de setembro, o Nasdaq atingiu uma máxima intradiária recorde de 27.212,68, enquanto a AMD ultrapassou a marca de US$ 1 trilhão de valor de mercado.
O último trimestre da Nvidia entregou uma receita de US$ 96,2B, alta de 106% YoY, com a receita do Data Center chegando a US$ 89B, alta de 117%. A Nvidia também espera um crescimento de cerca de 70% nas receitas do ano fiscal de 2028.
Agora vem o choque: a Goldman Sachs estima que os principais hyperscalers de IA poderiam gastar cerca de US$ 527B em capex em 2026, enquanto o investimento global mais amplo em IA pode ultrapassar US$ 1T este ano.
Isso significa que a próxima história das ações de IA talvez não seja apenas sobre demanda.
A pergunta real é simples:
A receita, as margens e o fluxo de caixa conseguem acompanhar esse gasto histórico?
O boom de IA é real. Agora o mercado quer provas.
$TAKE
{future}(TAKEUSDT)
$MET
{future}(METUSDT)
$DASH
{future}(DASHUSDT)
#AIStocksWhatNext #Stocks #Nvidia #Investing
#aistockswhatnext
Trabalhou por 15s
Esta versão mais recente combina os dados mais verificados — com a Nvidia, a Reuters, a Goldman Sachs e os números atuais do mercado.
#AIStocksWhatNext
As ações de IA acabaram de entrar em outro nível — mas os números por trás desse rali é que tornam tudo interessante.
Em 22 de setembro, o Nasdaq atingiu uma máxima intradiária recorde de 27.212,68, enquanto a AMD ultrapassou a marca de US$ 1 trilhão de valor de mercado.
O último trimestre da Nvidia entregou uma receita de US$ 96,2B, alta de 106% YoY, com a receita do Data Center chegando a US$ 89B, alta de 117%. A Nvidia também espera um crescimento de cerca de 70% nas receitas do ano fiscal de 2028.
Agora vem o choque: a Goldman Sachs estima que os principais hyperscalers de IA poderiam gastar cerca de US$ 527B em capex em 2026, enquanto o investimento global mais amplo em IA pode ultrapassar US$ 1T este ano.
Isso significa que a próxima história das ações de IA talvez não seja apenas sobre demanda.
A pergunta real é simples:
A receita, as margens e o fluxo de caixa conseguem acompanhar esse gasto histórico?
O boom de IA é real. Agora o mercado quer provas.
$TAKE
$MET
$DASH
#AIStocksWhatNext #Stocks #Nvidia #Investing
#aistockswhatnext
Esta versão mais recente combina os dados mais verificados — com a Nvidia, a Reuters, a Goldman Sachs e os números atuais do mercado.
#AIStocksWhatNext
As ações de IA acabaram de entrar em outro nível — mas os números por trás desse rali é que tornam tudo interessante.
Em 22 de setembro, o Nasdaq atingiu uma máxima intradiária recorde de 27.212,68, enquanto a AMD ultrapassou a marca de US$ 1 trilhão de valor de mercado.
O último trimestre da Nvidia entregou uma receita de US$ 96,2B, alta de 106% YoY, com a receita do Data Center chegando a US$ 89B, alta de 117%. A Nvidia também espera um crescimento de cerca de 70% nas receitas do ano fiscal de 2028.
Agora vem o choque: a Goldman Sachs estima que os principais hyperscalers de IA poderiam gastar cerca de US$ 527B em capex em 2026, enquanto o investimento global mais amplo em IA pode ultrapassar US$ 1T este ano.
Isso significa que a próxima história das ações de IA talvez não seja apenas sobre demanda.
A pergunta real é simples:
A receita, as margens e o fluxo de caixa conseguem acompanhar esse gasto histórico?
O boom de IA é real. Agora o mercado quer provas.
$TAKE
$MET
$DASH
#AIStocksWhatNext #Stocks #Nvidia #Investing
#aistockswhatnext
10
16
1.6k

·
--
NVIDIA ( $NVDAB ) - Uma das Principais Histórias do Mercado de IA
A demanda contínua por chips de IA segue impulsionando um forte interesse na NVIDIA, mantendo a empresa posicionada como um ator central na indústria de tecnologia.
Para traders de cripto, $NVDAB - um ativo tokenizado vinculado ao patrimônio (equity) da NVIDIA - oferece um local atraente para obter exposição.
Ele proporciona exposição direta ao desempenho do preço da NVIDIA de forma nativa por meio da infraestrutura do mercado cripto.
IA + NVIDIA + Tokenização - Uma combinação de alta convicção que vale acompanhar.
#NVIDIA #TokenizedStocks #NVDAB
NVIDIA ( $NVDAB ) - Uma das Principais Histórias do Mercado de IA
A demanda contínua por chips de IA segue impulsionando um forte interesse na NVIDIA, mantendo a empresa posicionada como um ator central na indústria de tecnologia.
Para traders de cripto, $NVDAB - um ativo tokenizado vinculado ao patrimônio (equity) da NVIDIA - oferece um local atraente para obter exposição.
Ele proporciona exposição direta ao desempenho do preço da NVIDIA de forma nativa por meio da infraestrutura do mercado cripto.
IA + NVIDIA + Tokenização - Uma combinação de alta convicção que vale acompanhar.
#NVIDIA #TokenizedStocks #NVDAB
A demanda contínua por chips de IA segue impulsionando um forte interesse na NVIDIA, mantendo a empresa posicionada como um ator central na indústria de tecnologia.
Para traders de cripto, $NVDAB - um ativo tokenizado vinculado ao patrimônio (equity) da NVIDIA - oferece um local atraente para obter exposição.
Ele proporciona exposição direta ao desempenho do preço da NVIDIA de forma nativa por meio da infraestrutura do mercado cripto.
IA + NVIDIA + Tokenização - Uma combinação de alta convicção que vale acompanhar.
#NVIDIA #TokenizedStocks #NVDAB
69

·
--
Verificado
#aistockswhatnext
🚨 A Nvidia diz que venderá 2× mais chips. O presidente Trump diz que a IA pode chegar a 25% do PIB. Mas há um porém.
A história da IA da Nvidia está ficando maior — rápido.
A empresa acabou de reportar US$ 96,2 bi em receita trimestral, incluindo US$ 89 bi do Data Center, acima de 117% no ano contra ano.
Agora, Jensen Huang diz que a Nvidia pode vender 2× o volume de chips em 2027 em comparação com 2026.
Mas lembre-se: 2× chips ≠ 2× receita.
Essa diferença importa.
Porque o outro lado da história da IA está ficando mais alto.
O presidente Trump anunciou uma “AI Force” e disse que a IA poderia eventualmente representar até 25% do PIB dos EUA, defendendo que o setor não deveria ser impedido.
Enquanto isso, o CEO da Anthropic, Dario Amodei, está pedindo que o desenvolvimento de IA seja ritmado, argumentando que os sistemas de segurança precisam de tempo para acompanhar as capacidades que estão acelerando rapidamente.
Então aqui vai o paradoxo:
O Vale do Silício está alertando sobre a velocidade.
Washington está apostando na aceleração.
E isso cria a verdadeira pergunta sobre ações de IA:
O próximo trade de IA é simplesmente sobre vender mais chips…
ou sobre saber se os gastos com computação, a monetização da IA e o apoio de políticas conseguem continuar acelerando juntos?
O que acontece quando a demanda por IA continua subindo — mas o debate sobre quão rápido construí-la fica ainda maior?
#AIStocks
#Nvidia
$NVDAB
{spot}(NVDABUSDT)
Apenas comentários de mercado. Não é aconselhamento financeiro.
#aistockswhatnext
🚨 A Nvidia diz que venderá 2× mais chips. O presidente Trump diz que a IA pode chegar a 25% do PIB. Mas há um porém.
A história da IA da Nvidia está ficando maior — rápido.
A empresa acabou de reportar US$ 96,2 bi em receita trimestral, incluindo US$ 89 bi do Data Center, acima de 117% no ano contra ano.
Agora, Jensen Huang diz que a Nvidia pode vender 2× o volume de chips em 2027 em comparação com 2026.
Mas lembre-se: 2× chips ≠ 2× receita.
Essa diferença importa.
Porque o outro lado da história da IA está ficando mais alto.
O presidente Trump anunciou uma “AI Force” e disse que a IA poderia eventualmente representar até 25% do PIB dos EUA, defendendo que o setor não deveria ser impedido.
Enquanto isso, o CEO da Anthropic, Dario Amodei, está pedindo que o desenvolvimento de IA seja ritmado, argumentando que os sistemas de segurança precisam de tempo para acompanhar as capacidades que estão acelerando rapidamente.
Então aqui vai o paradoxo:
O Vale do Silício está alertando sobre a velocidade.
Washington está apostando na aceleração.
E isso cria a verdadeira pergunta sobre ações de IA:
O próximo trade de IA é simplesmente sobre vender mais chips…
ou sobre saber se os gastos com computação, a monetização da IA e o apoio de políticas conseguem continuar acelerando juntos?
O que acontece quando a demanda por IA continua subindo — mas o debate sobre quão rápido construí-la fica ainda maior?
#AIStocks
#Nvidia
$NVDAB
Apenas comentários de mercado. Não é aconselhamento financeiro.
🚨 A Nvidia diz que venderá 2× mais chips. O presidente Trump diz que a IA pode chegar a 25% do PIB. Mas há um porém.
A história da IA da Nvidia está ficando maior — rápido.
A empresa acabou de reportar US$ 96,2 bi em receita trimestral, incluindo US$ 89 bi do Data Center, acima de 117% no ano contra ano.
Agora, Jensen Huang diz que a Nvidia pode vender 2× o volume de chips em 2027 em comparação com 2026.
Mas lembre-se: 2× chips ≠ 2× receita.
Essa diferença importa.
Porque o outro lado da história da IA está ficando mais alto.
O presidente Trump anunciou uma “AI Force” e disse que a IA poderia eventualmente representar até 25% do PIB dos EUA, defendendo que o setor não deveria ser impedido.
Enquanto isso, o CEO da Anthropic, Dario Amodei, está pedindo que o desenvolvimento de IA seja ritmado, argumentando que os sistemas de segurança precisam de tempo para acompanhar as capacidades que estão acelerando rapidamente.
Então aqui vai o paradoxo:
O Vale do Silício está alertando sobre a velocidade.
Washington está apostando na aceleração.
E isso cria a verdadeira pergunta sobre ações de IA:
O próximo trade de IA é simplesmente sobre vender mais chips…
ou sobre saber se os gastos com computação, a monetização da IA e o apoio de políticas conseguem continuar acelerando juntos?
O que acontece quando a demanda por IA continua subindo — mas o debate sobre quão rápido construí-la fica ainda maior?
#AIStocks
#Nvidia
$NVDAB
Apenas comentários de mercado. Não é aconselhamento financeiro.
206 Atlas:
Volume doubling does not guarantee revenue growth. Focus on the margin compression risk when supply chains saturate.
2
1
2
4.6k

🤖🔥 O novo programa da Nvidia 'DSX Ready' padroniza energia e refrigeração para data centers de IA com parceiros como Tesla e Vertiv. Para traders de cripto, isso é uma checagem da realidade: o boom da IA já não é só sobre chips, mas sobre a infraestrutura física da rede que os sustenta. Fique de olho na DePIN e nos protocolos de computação descentralizada conforme as demandas por hardware aumentam. #Nvidia #NvidiaAI $NVDA #AI #ArtificialIntelligence #CryptoverseNews
Matéria completa: https://cryptoversenews.eu/ai/nvidia-launches-dsx-ready-program-to-standardize-power-and-c/
🤖🔥 O novo programa da Nvidia 'DSX Ready' padroniza energia e refrigeração para data centers de IA com parceiros como Tesla e Vertiv. Para traders de cripto, isso é uma checagem da realidade: o boom da IA já não é só sobre chips, mas sobre a infraestrutura física da rede que os sustenta. Fique de olho na DePIN e nos protocolos de computação descentralizada conforme as demandas por hardware aumentam. #Nvidia #NvidiaAI $NVDA #AI #ArtificialIntelligence #CryptoverseNews
Matéria completa: https://cryptoversenews.eu/ai/nvidia-launches-dsx-ready-program-to-standardize-power-and-c/
Matéria completa: https://cryptoversenews.eu/ai/nvidia-launches-dsx-ready-program-to-standardize-power-and-c/
108

·
--
⚡ Estrutura de Mercado: Nvidia $NVDAB
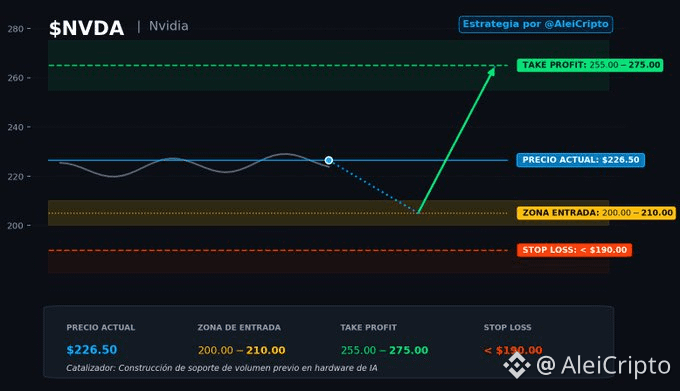
O líder indiscutível em infraestrutura de IA negocia a US$ 224,50. Até os ativos mais fortes precisam de pausas saudáveis para construir suporte de volume antes do próximo trecho. 🛑🎰
🎯 Plano de Ação:
📍 Zona-Chave de Demanda: Esperar a correção em direção a US$ 200,00 – US$ 210,00 (nível de confluência de volume prévio).
🚀 Take Profit: US$ 255,00 – US$ 275,00
🛡️ Stop Loss (Invalidação): < US$ 190,00
A tendência é sua amiga, mas a paciência determina sua margem de lucro.
Mente fria na execução! 🧠💚
{spot}(NVDABUSDT)
#TradFi #NVIDIA
⚡ Estrutura de Mercado: Nvidia $NVDAB
O líder indiscutível em infraestrutura de IA negocia a US$ 224,50. Até os ativos mais fortes precisam de pausas saudáveis para construir suporte de volume antes do próximo trecho. 🛑🎰
🎯 Plano de Ação:
📍 Zona-Chave de Demanda: Esperar a correção em direção a US$ 200,00 – US$ 210,00 (nível de confluência de volume prévio).
🚀 Take Profit: US$ 255,00 – US$ 275,00
🛡️ Stop Loss (Invalidação): < US$ 190,00
A tendência é sua amiga, mas a paciência determina sua margem de lucro.
Mente fria na execução! 🧠💚
#TradFi #NVIDIA
O líder indiscutível em infraestrutura de IA negocia a US$ 224,50. Até os ativos mais fortes precisam de pausas saudáveis para construir suporte de volume antes do próximo trecho. 🛑🎰
🎯 Plano de Ação:
📍 Zona-Chave de Demanda: Esperar a correção em direção a US$ 200,00 – US$ 210,00 (nível de confluência de volume prévio).
🚀 Take Profit: US$ 255,00 – US$ 275,00
🛡️ Stop Loss (Invalidação): < US$ 190,00
A tendência é sua amiga, mas a paciência determina sua margem de lucro.
Mente fria na execução! 🧠💚
#TradFi #NVIDIA
1
220

·
--
$NVDAB À medida que a Nvidia prevê que as vendas de chips vão dobrar no próximo ano e as principais empresas de tecnologia registram recordes históricos de gastos com computação, a alta entre as ações de IA levanta uma questão crucial para o mercado: essa demanda é um rompimento sustentável de longo prazo, ou estamos nos aproximando de um pico de curto prazo? 🚀📊
Com enormes investimentos corporativos em capital (CAPEX) e iniciativas em nível estadual — como a construção de uma "Força de IA" com foco em até 25% do PIB dos EUA — a base estrutural de longo prazo para a infraestrutura de IA permanece extremamente forte. Tenho uma visão fortemente Bullish para hardware e infraestrutura no longo prazo.
#AI #Nvidia #CryptoTradingInsights #BinanceSquare #TradingStrategy
$NVDAB À medida que a Nvidia prevê que as vendas de chips vão dobrar no próximo ano e as principais empresas de tecnologia registram recordes históricos de gastos com computação, a alta entre as ações de IA levanta uma questão crucial para o mercado: essa demanda é um rompimento sustentável de longo prazo, ou estamos nos aproximando de um pico de curto prazo? 🚀📊
Com enormes investimentos corporativos em capital (CAPEX) e iniciativas em nível estadual — como a construção de uma "Força de IA" com foco em até 25% do PIB dos EUA — a base estrutural de longo prazo para a infraestrutura de IA permanece extremamente forte. Tenho uma visão fortemente Bullish para hardware e infraestrutura no longo prazo.
#AI #Nvidia #CryptoTradingInsights #BinanceSquare #TradingStrategy
Com enormes investimentos corporativos em capital (CAPEX) e iniciativas em nível estadual — como a construção de uma "Força de IA" com foco em até 25% do PIB dos EUA — a base estrutural de longo prazo para a infraestrutura de IA permanece extremamente forte. Tenho uma visão fortemente Bullish para hardware e infraestrutura no longo prazo.
#AI #Nvidia #CryptoTradingInsights #BinanceSquare #TradingStrategy
47
·
--
Artigo
Ações de IA: Por que estou otimista com a NvidiaAs ações de IA continuam avançando, mas eu não acho que a oportunidade termine com a Nvidia.
O crescimento esperado da Nvidia nas vendas de chips mostra o quanto a demanda por infraestrutura de IA segue forte. As grandes empresas de tecnologia ainda estão investindo pesadamente em GPUs, data centers e computação em nuvem, mas a questão principal é por quanto tempo esse nível de gastos pode continuar.
Sou otimista com #NVIDIA porque a demanda por computação de IA ainda está crescendo. No entanto, não estou procurando correr atrás de cada ação de IA só porque o setor está subindo.
Estou também acompanhando o ecossistema mais amplo de IA — semicondutores, data centers, redes, energia e infraestrutura de nuvem.
Ações de IA: Por que estou otimista com a Nvidia
As ações de IA continuam avançando, mas eu não acho que a oportunidade termine com a Nvidia.
O crescimento esperado da Nvidia nas vendas de chips mostra o quanto a demanda por infraestrutura de IA segue forte. As grandes empresas de tecnologia ainda estão investindo pesadamente em GPUs, data centers e computação em nuvem, mas a questão principal é por quanto tempo esse nível de gastos pode continuar.
Sou otimista com #NVIDIA porque a demanda por computação de IA ainda está crescendo. No entanto, não estou procurando correr atrás de cada ação de IA só porque o setor está subindo.
Estou também acompanhando o ecossistema mais amplo de IA — semicondutores, data centers, redes, energia e infraestrutura de nuvem.
O crescimento esperado da Nvidia nas vendas de chips mostra o quanto a demanda por infraestrutura de IA segue forte. As grandes empresas de tecnologia ainda estão investindo pesadamente em GPUs, data centers e computação em nuvem, mas a questão principal é por quanto tempo esse nível de gastos pode continuar.
Sou otimista com #NVIDIA porque a demanda por computação de IA ainda está crescendo. No entanto, não estou procurando correr atrás de cada ação de IA só porque o setor está subindo.
Estou também acompanhando o ecossistema mais amplo de IA — semicondutores, data centers, redes, energia e infraestrutura de nuvem.
429

·
--
🤖🚀 AI BOOM: UMA VIRADA DE VERDADE OU APENAS UM SALTO?
$NVIDIA espera que a demanda por chips continue acelerando, enquanto as principais empresas de IA continuam registrando receitas recordes. Mas a grande pergunta é: por quanto tempo essa onda de gastos com IA pode durar? 👀
As ações de IA estão se movendo com força em todo o mercado. Isso é o começo de uma virada maior, ou estamos vendo apenas uma alta de curto prazo?
Enquanto isso, o desenvolvimento de IA, o apoio do governo e os enormes gastos com computação estão virando temas centrais.
📊 Você é otimista com ações de IA? 💰 Compartilhe suas operações ou posições em IA e participe da conversa!
⏰ Campanha: 22–24 de set. de 2026 #AI #NVIDIA #AIStocks #artificialintelligence:
🤖🚀 AI BOOM: UMA VIRADA DE VERDADE OU APENAS UM SALTO?
$NVIDIA espera que a demanda por chips continue acelerando, enquanto as principais empresas de IA continuam registrando receitas recordes. Mas a grande pergunta é: por quanto tempo essa onda de gastos com IA pode durar? 👀
As ações de IA estão se movendo com força em todo o mercado. Isso é o começo de uma virada maior, ou estamos vendo apenas uma alta de curto prazo?
Enquanto isso, o desenvolvimento de IA, o apoio do governo e os enormes gastos com computação estão virando temas centrais.
📊 Você é otimista com ações de IA? 💰 Compartilhe suas operações ou posições em IA e participe da conversa!
⏰ Campanha: 22–24 de set. de 2026 #AI #NVIDIA #AIStocks #artificialintelligence:
$NVIDIA espera que a demanda por chips continue acelerando, enquanto as principais empresas de IA continuam registrando receitas recordes. Mas a grande pergunta é: por quanto tempo essa onda de gastos com IA pode durar? 👀
As ações de IA estão se movendo com força em todo o mercado. Isso é o começo de uma virada maior, ou estamos vendo apenas uma alta de curto prazo?
Enquanto isso, o desenvolvimento de IA, o apoio do governo e os enormes gastos com computação estão virando temas centrais.
📊 Você é otimista com ações de IA? 💰 Compartilhe suas operações ou posições em IA e participe da conversa!
⏰ Campanha: 22–24 de set. de 2026 #AI #NVIDIA #AIStocks #artificialintelligence:

73

·
--
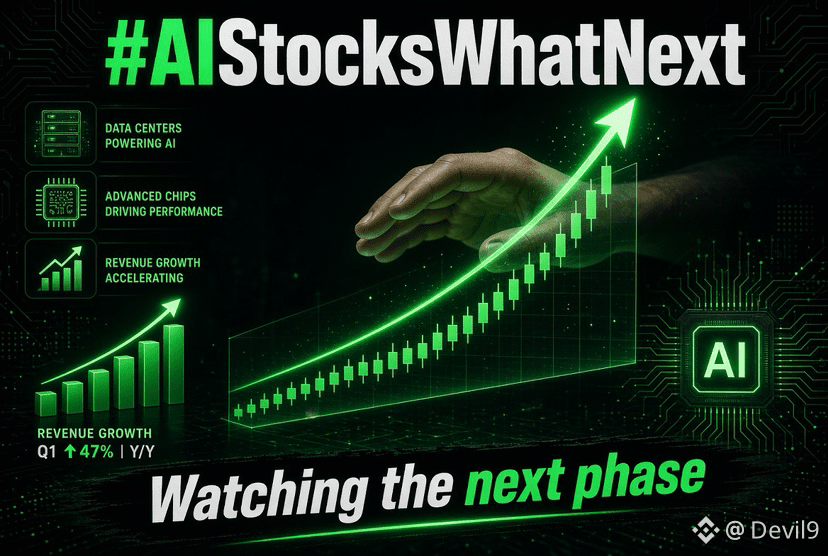
#AIStocksWhatNext
As ações de IA estão subindo rapidamente, mas eu não estou convencido de que isso seja apenas mais um ciclo passageiro de hype.
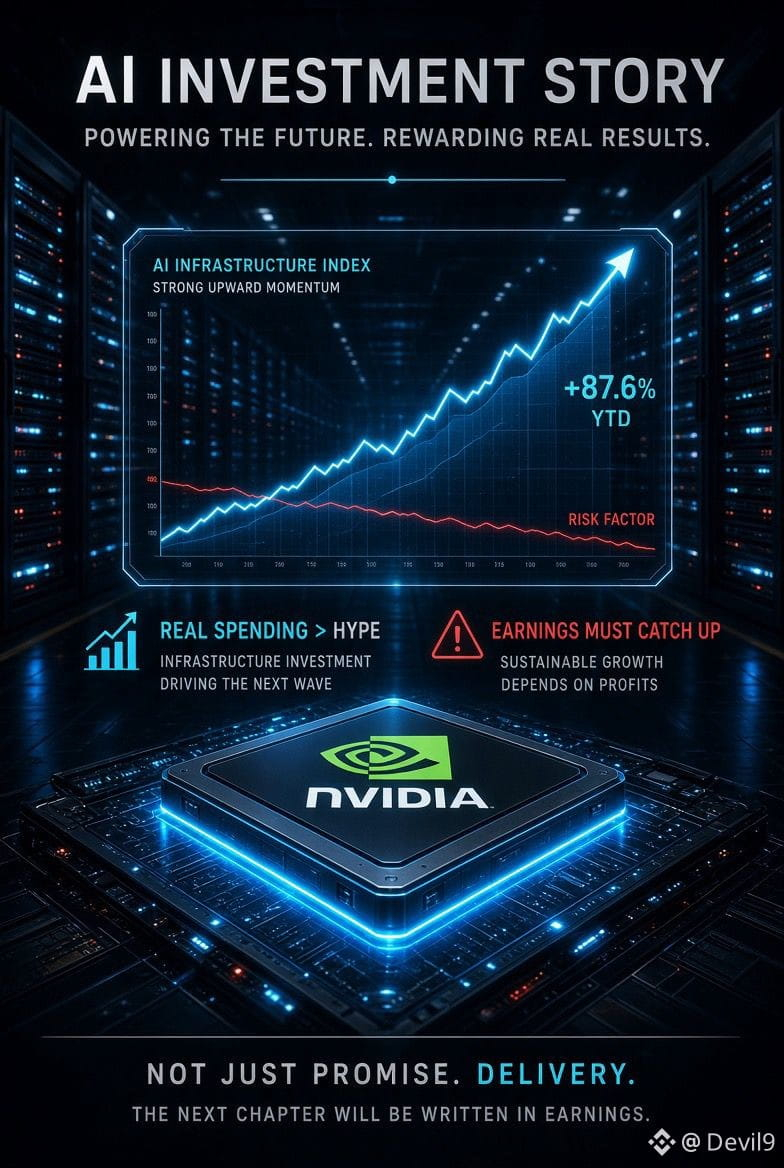
O que chamou minha atenção foi a distância entre a narrativa do mercado de ações e o volume de dinheiro real sendo investido por trás da IA. A Nvidia aponta para um novo grande aumento na demanda por chips, enquanto as principais empresas de IA continuam reportando um crescimento massivo de receita. Isso significa que a história da IA está sendo cada vez mais sustentada por investimentos reais em infraestrutura — e não apenas por manchetes.
Mas existe outro lado.A grande questão é se esse nível de investimento em IA consegue continuar crescendo no mesmo ritmo. Se as empresas continuarem gastando de forma agressiva com data centers, chips e infraestrutura de IA, a história de resultados pode ter espaço para se expandir. Se os gastos começarem a desacelerar enquanto as avaliações permanecerem elevadas, as mesmas ações podem ficar muito mais sensíveis a decepções.
Minha visão é moderadamente otimista em relação às ações de IA, mas eu não correria atrás de cada candle verde.
Estou acompanhando a Nvidia e o setor mais amplo de IA em busca de confirmação por meio de crescimento de receita, gastos de capital e estrutura de preços. Para mim, a próxima fase do trade de IA será sobre provar que os resultados conseguem acompanhar as expectativas.
Você está comprando ações de IA aqui ou esperando uma entrada melhor? #AIStocksWhatNext
#Nvidia #Stocks
$NVDAB
{spot}(NVDABUSDT)
#AIStocksWhatNext
As ações de IA estão subindo rapidamente, mas eu não estou convencido de que isso seja apenas mais um ciclo passageiro de hype.
O que chamou minha atenção foi a distância entre a narrativa do mercado de ações e o volume de dinheiro real sendo investido por trás da IA. A Nvidia aponta para um novo grande aumento na demanda por chips, enquanto as principais empresas de IA continuam reportando um crescimento massivo de receita. Isso significa que a história da IA está sendo cada vez mais sustentada por investimentos reais em infraestrutura — e não apenas por manchetes.
Mas existe outro lado.A grande questão é se esse nível de investimento em IA consegue continuar crescendo no mesmo ritmo. Se as empresas continuarem gastando de forma agressiva com data centers, chips e infraestrutura de IA, a história de resultados pode ter espaço para se expandir. Se os gastos começarem a desacelerar enquanto as avaliações permanecerem elevadas, as mesmas ações podem ficar muito mais sensíveis a decepções.
Minha visão é moderadamente otimista em relação às ações de IA, mas eu não correria atrás de cada candle verde.
Estou acompanhando a Nvidia e o setor mais amplo de IA em busca de confirmação por meio de crescimento de receita, gastos de capital e estrutura de preços. Para mim, a próxima fase do trade de IA será sobre provar que os resultados conseguem acompanhar as expectativas.
Você está comprando ações de IA aqui ou esperando uma entrada melhor? #AIStocksWhatNext
#Nvidia #Stocks
$NVDAB
As ações de IA estão subindo rapidamente, mas eu não estou convencido de que isso seja apenas mais um ciclo passageiro de hype.
O que chamou minha atenção foi a distância entre a narrativa do mercado de ações e o volume de dinheiro real sendo investido por trás da IA. A Nvidia aponta para um novo grande aumento na demanda por chips, enquanto as principais empresas de IA continuam reportando um crescimento massivo de receita. Isso significa que a história da IA está sendo cada vez mais sustentada por investimentos reais em infraestrutura — e não apenas por manchetes.
Mas existe outro lado.A grande questão é se esse nível de investimento em IA consegue continuar crescendo no mesmo ritmo. Se as empresas continuarem gastando de forma agressiva com data centers, chips e infraestrutura de IA, a história de resultados pode ter espaço para se expandir. Se os gastos começarem a desacelerar enquanto as avaliações permanecerem elevadas, as mesmas ações podem ficar muito mais sensíveis a decepções.
Minha visão é moderadamente otimista em relação às ações de IA, mas eu não correria atrás de cada candle verde.
Estou acompanhando a Nvidia e o setor mais amplo de IA em busca de confirmação por meio de crescimento de receita, gastos de capital e estrutura de preços. Para mim, a próxima fase do trade de IA será sobre provar que os resultados conseguem acompanhar as expectativas.
Você está comprando ações de IA aqui ou esperando uma entrada melhor? #AIStocksWhatNext
#Nvidia #Stocks
$NVDAB
3
235
Inicia sessão para explorar mais conteúdos
Junta-te a utilizadores de criptomoedas de todo o mundo na Binance Square
⚡️ Obtém informações úteis e recentes sobre criptomoedas.
💬 Com a confiança da maior exchange de criptomoedas do mundo.
👍 Descobre perspetivas reais de criadores verificados.
E-mail/Número de telefone
Tópicos em Tendência
1
#SECSaysTokenBuybacksNotAutoSecurities
0 visualizações
0 a discutir
2
#ChinaUSAgreeOn$30BTariffCut
0 visualizações
0 a discutir
3
#CircleMints500MUSDCOnSolana
144,986 visualizações
2,648 a discutir
4
#PolymarketBankFailureBetsDrawFDICConcern
129,697 visualizações
2,157 a discutir
5
#BlackRockBuildsTokenizedPortfoliosForOndo
124,538 visualizações
1,550 a discutir
6
#BitwiseFilesToListNEARETFOnNYSEArca
86,871 visualizações
1,213 a discutir
7
#SECCommissionerPeirceToLeaveOct2
94,278 visualizações
990 a discutir
8
#SECSaysBuybacksUpgradesDontMakeTokenSecurity
70,804 visualizações
702 a discutir
9
#StrategyProposesDailyDividendsForPreferreds
19,448 visualizações
259 a discutir
10
#CircleTetherFreezeBitgetHackerWallet
17,149 visualizações
161 a discutir