

#bitcoincore32.1raisespeerconnectionlimit
bitcoincore32.1raisespeerconnectionlimit
Popular
Mais recente

Verificado
#bitcoincore32.1raisespeerconnectionlimit
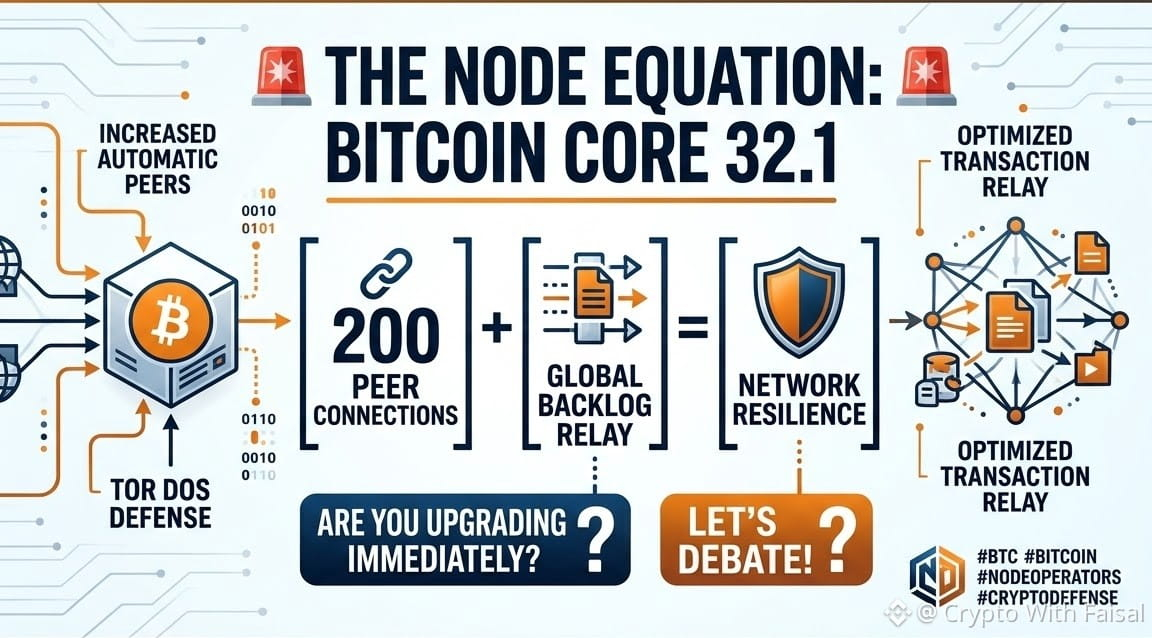
🚨 A EQUAÇÃO DO NÓ: BITCOIN CORE 32.1 🚨
Uma atualização crítica acabou de ser lançada para os nós completos do Bitcoin, e é uma grande vitória para a saúde da rede! Vamos detalhar o novo lançamento usando matemática pura 🧮👇
(200 conexões com pares) + (Retransmissão do backlog global) = Resiliência da rede 🛡️
Esta é a fórmula exata que impulsiona a atualização da rede Bitcoin de hoje:
Detalhes da atualização:
(A entrada) = O Bitcoin Core lançou a versão 32.1.
A expansão: Aumenta o número máximo padrão de conexões automáticas com pares de 125 para 200 .
A defesa: Adiciona defesas de prova de trabalho para serviços ocultos do Tor, a fim de combater ataques DoS.
A eficiência: Utiliza uma abordagem de "backlog global" para limitar a taxa de retransmissão de transações, otimizando o uso de memória e CPU.
A explicação:
Menos pares significam uma propagação mais lenta de blocos e transações. Ao aumentar as conexões e proteger os nós Tor, o Bitcoin Core 32.1 reforça significativamente a rede contra tentativas de censura e ataques DoS, reduzindo ao mesmo tempo os requisitos de recursos para os operadores de nós.
Se você opera um nó, vai atualizar imediatamente ou prefere esperar para testar? Vamos debater! 👇💬
$BTC
{future}(BTCUSDT)
$ETH
{future}(ETHUSDT)
$BNB
{future}(BNBUSDT)
#Bitcoin #CryptoSecurity #NodeOperators #BinanceSquare
#bitcoincore32.1raisespeerconnectionlimit
🚨 A EQUAÇÃO DO NÓ: BITCOIN CORE 32.1 🚨
Uma atualização crítica acabou de ser lançada para os nós completos do Bitcoin, e é uma grande vitória para a saúde da rede! Vamos detalhar o novo lançamento usando matemática pura 🧮👇
(200 conexões com pares) + (Retransmissão do backlog global) = Resiliência da rede 🛡️
Esta é a fórmula exata que impulsiona a atualização da rede Bitcoin de hoje:
Detalhes da atualização:
(A entrada) = O Bitcoin Core lançou a versão 32.1.
A expansão: Aumenta o número máximo padrão de conexões automáticas com pares de 125 para 200 .
A defesa: Adiciona defesas de prova de trabalho para serviços ocultos do Tor, a fim de combater ataques DoS.
A eficiência: Utiliza uma abordagem de "backlog global" para limitar a taxa de retransmissão de transações, otimizando o uso de memória e CPU.
A explicação:
Menos pares significam uma propagação mais lenta de blocos e transações. Ao aumentar as conexões e proteger os nós Tor, o Bitcoin Core 32.1 reforça significativamente a rede contra tentativas de censura e ataques DoS, reduzindo ao mesmo tempo os requisitos de recursos para os operadores de nós.
Se você opera um nó, vai atualizar imediatamente ou prefere esperar para testar? Vamos debater! 👇💬
$BTC
$ETH
$BNB
#Bitcoin #CryptoSecurity #NodeOperators #BinanceSquare
31

Ver tradução
#bitcoincore32.1raisespeerconnectionlimit
#writetoearn
🏦🛡️Bitcoin Core 32.1 se despliega: Una actualización de defensa total que expande las autopistas de la red p2p
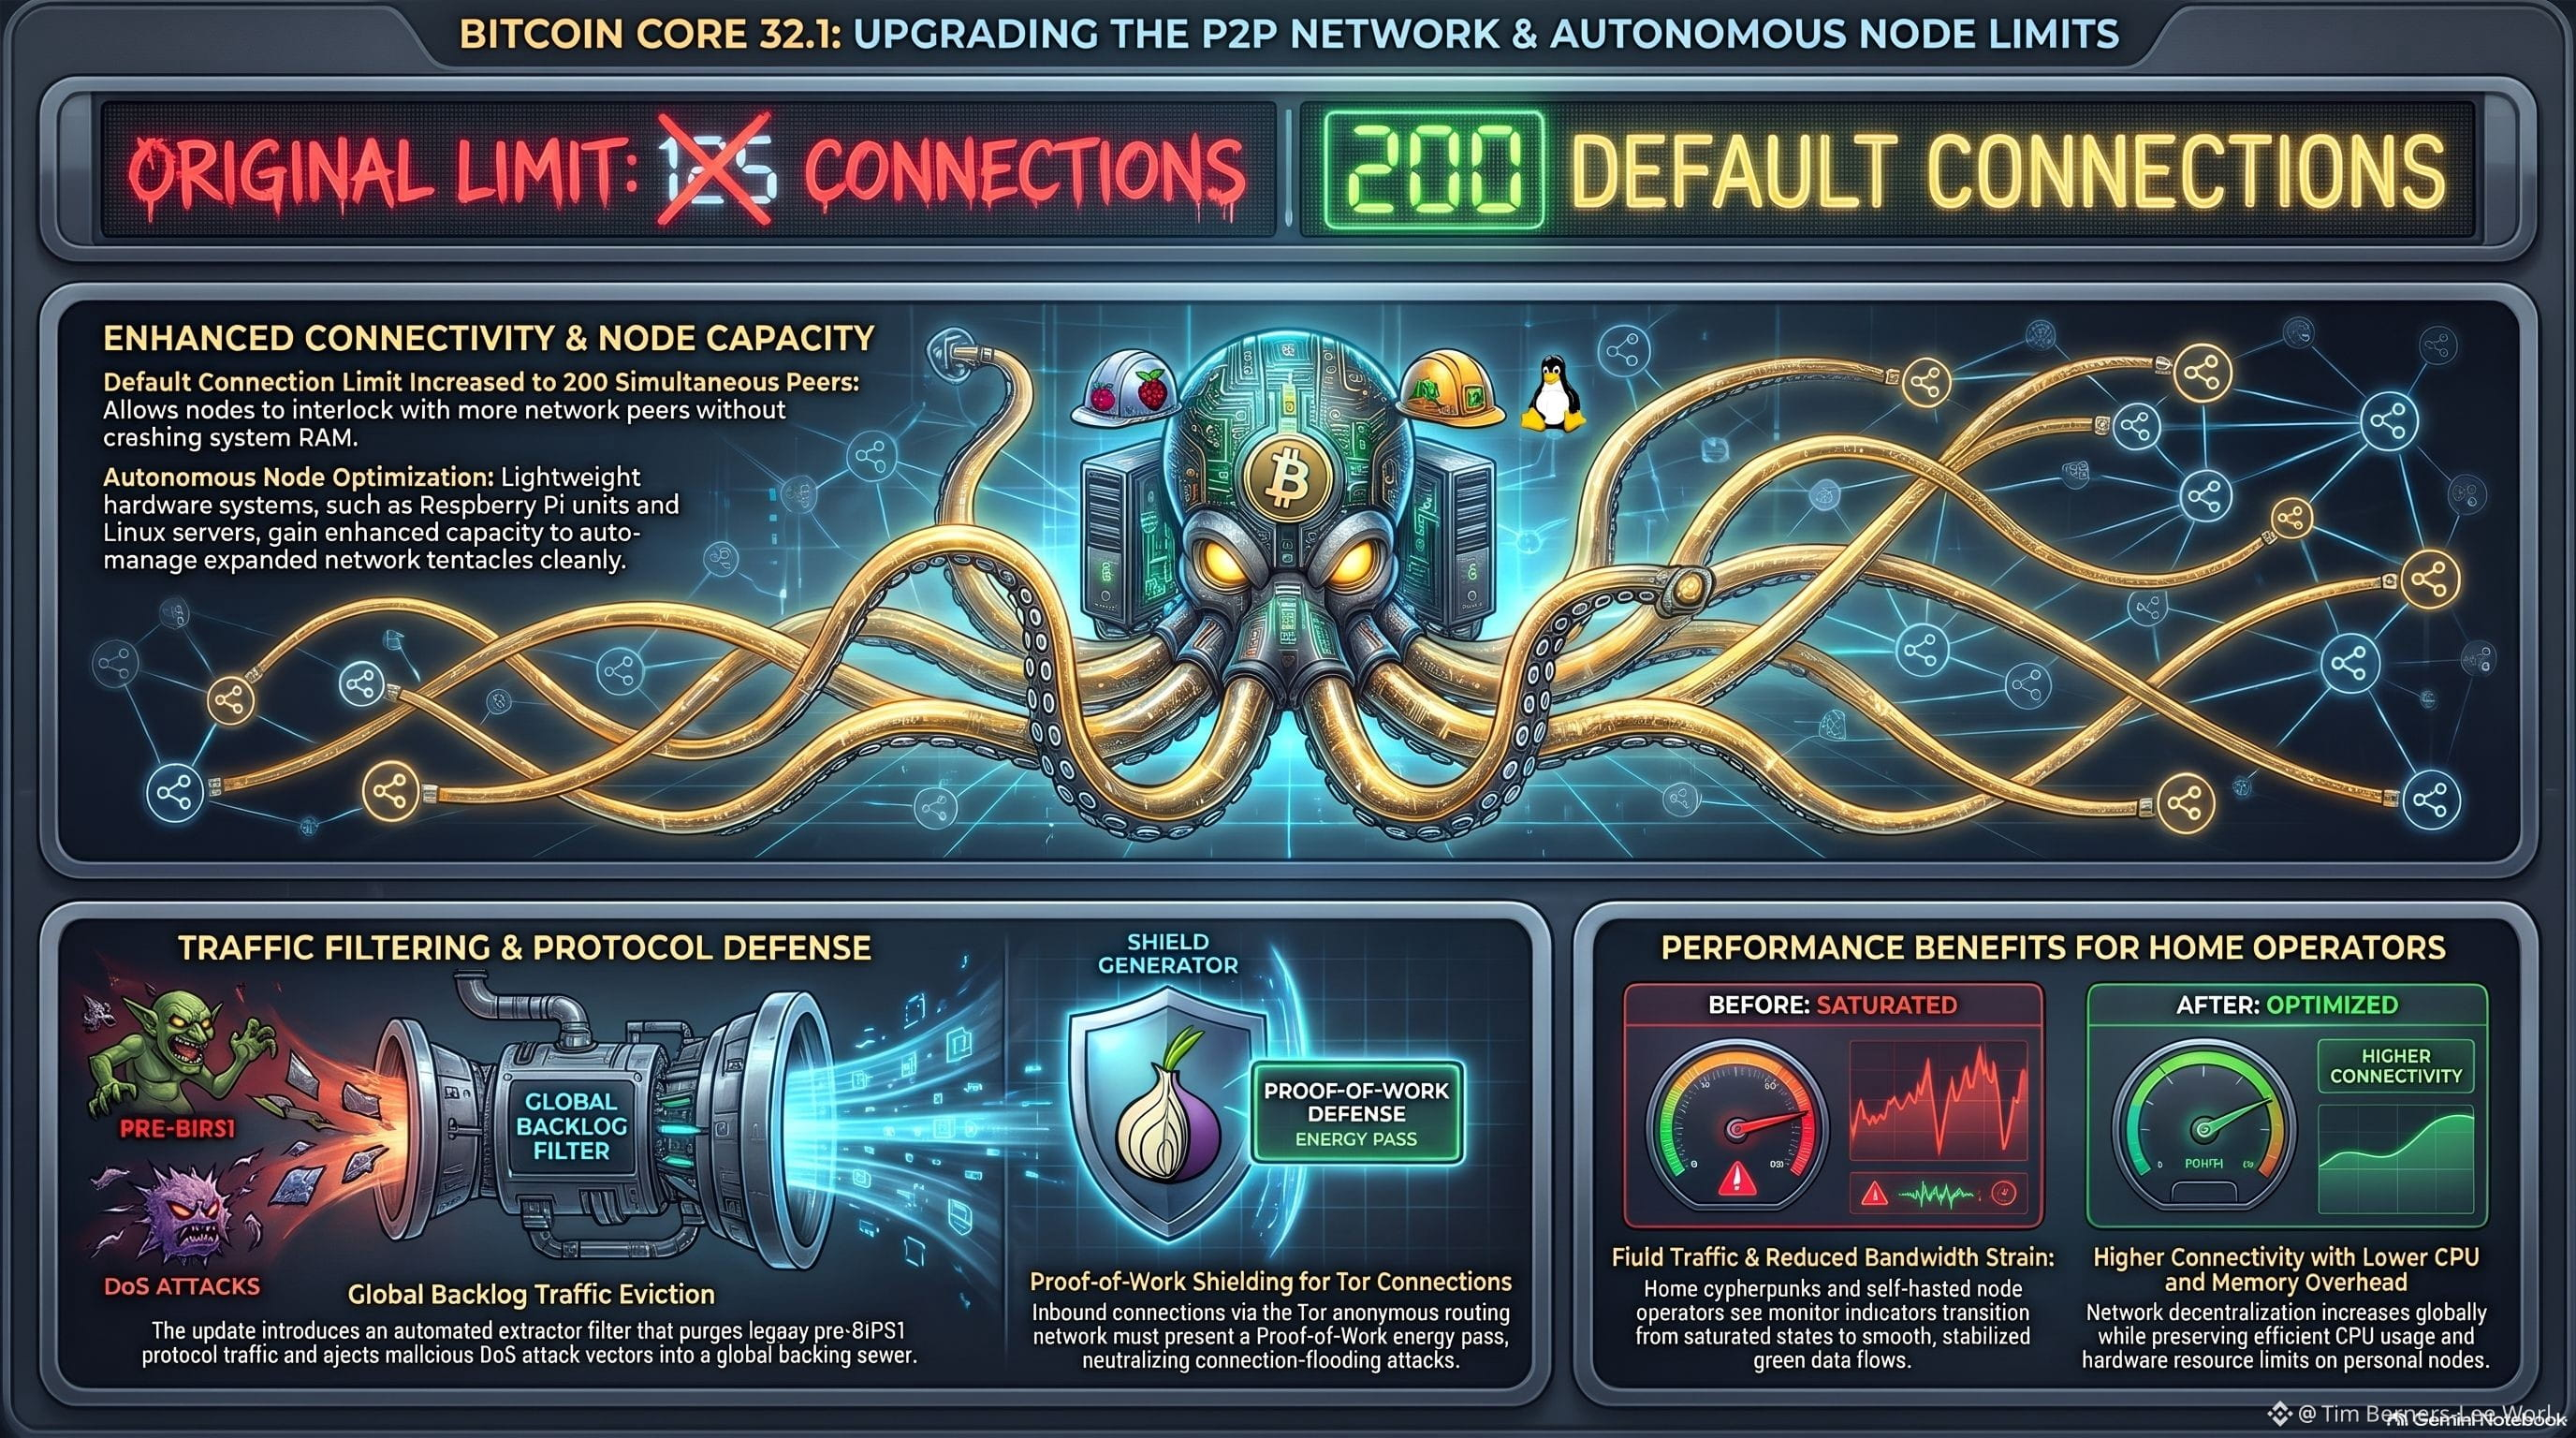
🏦🛡️En una respuesta técnica fulminante y coordinada tras la divulgación de vulnerabilidades de esta semana, el equipo de desarrollo de Bitcoin Core ha liberado oficialmente la versión 32.1 de su software de referencia. Aunque en la superficie este parche se presenta como una actualización menor de mantenimiento, en el fondo introduce modificaciones críticas en la arquitectura de red P2P (peer-to-peer), destacando un incremento en el límite por defecto de conexiones automáticas entre pares, que pasa de 125 a 200.
🏦🛡️Este incremento no es un simple capricho de ancho de banda. Al elevar el límite de conexiones automáticas, los desarrolladores buscan reforzar la topología de la red global de Bitcoin, haciéndola mucho más densa y resistente ante posibles ataques de eclipse o intentos de aislamiento de nodos. Para evitar que esta mayor apertura sature las computadoras domésticas que sostienen la red, la versión 32.1 introduce un sistema de limitación de tasa basado en un "backlog global", el cual reduce drásticamente el uso de CPU y memoria RAM cuando el volumen de transacciones en la mempool se dispara.
🏦🛡️El paquete defensivo de la actualización se completa con la implementación de defensas basadas en prueba de trabajo (PoW) para los servicios ocultos de la red Tor. Esto cierra la puerta a una de las tácticas de denegación de servicio (DoS) más comunes de los últimos meses, donde actores maliciosos aprovechaban el anonimato de Tor para abrumar los nodos con solicitudes de conexión falsas. 🏦🛡️Con el lanzamiento de la 32.1, la consigna para la comunidad minera, las casas de cambio y los operadores de nodos caseros es inequívoca: actualizar de inmediato no solo soluciona los fallos del pasado martes, sino que dota a la infraestructura de Bitcoin de los músculos necesarios para el ecosistema de 2027.$BTC $BTC
{future}(BTCUSDT)
#bitcoincore32.1raisespeerconnectionlimit
#writetoearn
🏦🛡️Bitcoin Core 32.1 se despliega: Una actualización de defensa total que expande las autopistas de la red p2p
🏦🛡️En una respuesta técnica fulminante y coordinada tras la divulgación de vulnerabilidades de esta semana, el equipo de desarrollo de Bitcoin Core ha liberado oficialmente la versión 32.1 de su software de referencia. Aunque en la superficie este parche se presenta como una actualización menor de mantenimiento, en el fondo introduce modificaciones críticas en la arquitectura de red P2P (peer-to-peer), destacando un incremento en el límite por defecto de conexiones automáticas entre pares, que pasa de 125 a 200.
🏦🛡️Este incremento no es un simple capricho de ancho de banda. Al elevar el límite de conexiones automáticas, los desarrolladores buscan reforzar la topología de la red global de Bitcoin, haciéndola mucho más densa y resistente ante posibles ataques de eclipse o intentos de aislamiento de nodos. Para evitar que esta mayor apertura sature las computadoras domésticas que sostienen la red, la versión 32.1 introduce un sistema de limitación de tasa basado en un "backlog global", el cual reduce drásticamente el uso de CPU y memoria RAM cuando el volumen de transacciones en la mempool se dispara.
🏦🛡️El paquete defensivo de la actualización se completa con la implementación de defensas basadas en prueba de trabajo (PoW) para los servicios ocultos de la red Tor. Esto cierra la puerta a una de las tácticas de denegación de servicio (DoS) más comunes de los últimos meses, donde actores maliciosos aprovechaban el anonimato de Tor para abrumar los nodos con solicitudes de conexión falsas. 🏦🛡️Con el lanzamiento de la 32.1, la consigna para la comunidad minera, las casas de cambio y los operadores de nodos caseros es inequívoca: actualizar de inmediato no solo soluciona los fallos del pasado martes, sino que dota a la infraestructura de Bitcoin de los músculos necesarios para el ecosistema de 2027.$BTC $BTC
58

·
--
#fedwatch
🚨 O FED MANTEVE AS TAXAS — MAS DOIS DIRIGENTES QUERIAM OUTRA ALTA! OS TOUROS DAS ALTCOINS ESTÃO COMEMORANDO CEDO DEMAIS? 👀🔥
Todos viram o Fed fazer uma pausa.
Mas eis o que passou despercebido para a maioria dos traders…
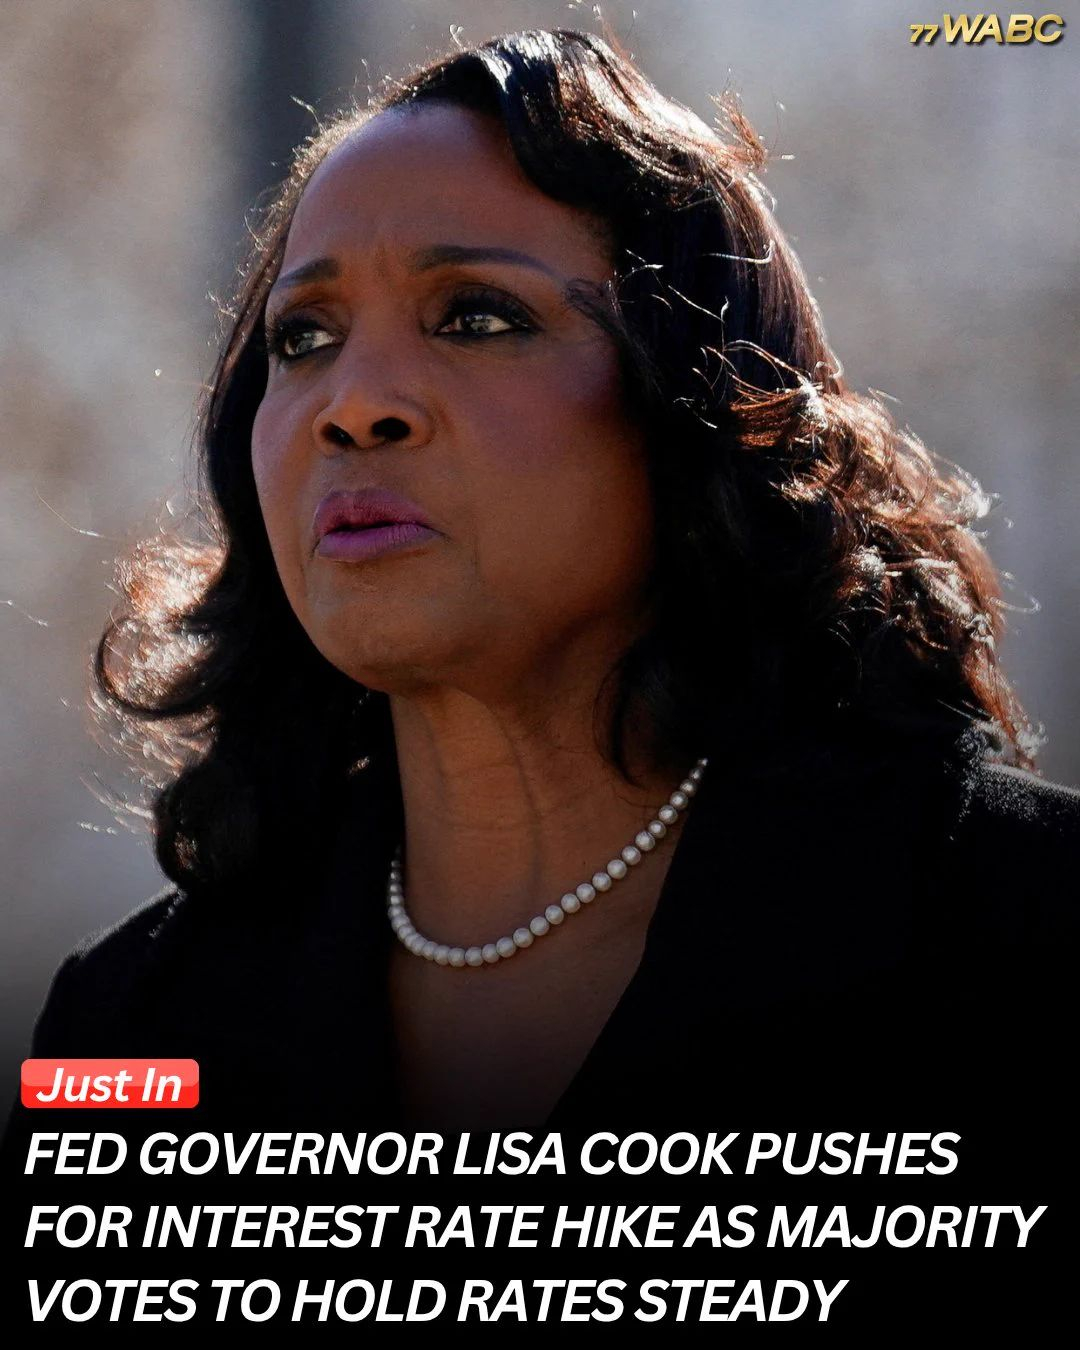
DOIS dirigentes do Fed votaram, na verdade, a FAVOR de uma alta de 25 pontos-base nas taxas.
🏦 RESULTADOS DO FOMC DE OUTUBRO:
✅ Taxas mantidas entre 3,75% e 4,00%
🔴 Lisa Cook: Queria uma alta de 25 pontos-base
🔴 Beth Hammack: Queria uma alta de 25 pontos-base
📊 Votação final: 10–2
E o Fed continua afirmando que a inflação permanece elevada.
ENTÃO, O QUE ISSO SIGNIFICA PARA OS TRADERS?
🥇 $XAU: Um dólar mais forte e rendimentos mais altos podem pressionar o ouro.
🥈 $XAG: A prata pode ter movimentos mais acentuados à medida que as expectativas sobre as taxas mudam.
🔥 $SOL: O apetite pelo risco é importante. Sinais mais agressivos podem pressionar as criptomoedas de beta elevado.
🐸 $DOGE: Ralis especulativos podem perder força se as condições de liquidez se apertarem.
💥 EIS A VERDADEIRA ARMADILHA…
Uma pausa do Fed não é o mesmo que um Fed acomodatício.
🐂 OTIMISTA: A inflação abranda → As expectativas de alta das taxas diminuem → O ouro e os ativos de risco podem recuperar.
🐻 PESSIMISTA: A inflação continua elevada → Crescem os receios de uma alta em dezembro → O dólar fortalece-se e os ativos especulativos ficam sob pressão.
O FED NÃO SUBIU AS TAXAS. MAS OS FALCÕES CONTINUAM NA SALA.
Isto não é aconselhamento financeiro. Faça a sua própria pesquisa.
{future}(XAGUSDT)
{future}(XAUUSDT)
{future}(DOGEUSDT)
#CanMicrosoftDeliverOnAI #CanGoogleDefindItsCore #BitcoinCore32.1RaisesPeerConnectionLimit #RippleExpects$900MAnnualizedProductRevenueRunRate
#fedwatch
🚨 O FED MANTEVE AS TAXAS — MAS DOIS DIRIGENTES QUERIAM OUTRA ALTA! OS TOUROS DAS ALTCOINS ESTÃO COMEMORANDO CEDO DEMAIS? 👀🔥
Todos viram o Fed fazer uma pausa.
Mas eis o que passou despercebido para a maioria dos traders…
DOIS dirigentes do Fed votaram, na verdade, a FAVOR de uma alta de 25 pontos-base nas taxas.
🏦 RESULTADOS DO FOMC DE OUTUBRO:
✅ Taxas mantidas entre 3,75% e 4,00%
🔴 Lisa Cook: Queria uma alta de 25 pontos-base
🔴 Beth Hammack: Queria uma alta de 25 pontos-base
📊 Votação final: 10–2
E o Fed continua afirmando que a inflação permanece elevada.
ENTÃO, O QUE ISSO SIGNIFICA PARA OS TRADERS?
🥇 $XAU: Um dólar mais forte e rendimentos mais altos podem pressionar o ouro.
🥈 $XAG: A prata pode ter movimentos mais acentuados à medida que as expectativas sobre as taxas mudam.
🔥 $SOL: O apetite pelo risco é importante. Sinais mais agressivos podem pressionar as criptomoedas de beta elevado.
🐸 $DOGE: Ralis especulativos podem perder força se as condições de liquidez se apertarem.
💥 EIS A VERDADEIRA ARMADILHA…
Uma pausa do Fed não é o mesmo que um Fed acomodatício.
🐂 OTIMISTA: A inflação abranda → As expectativas de alta das taxas diminuem → O ouro e os ativos de risco podem recuperar.
🐻 PESSIMISTA: A inflação continua elevada → Crescem os receios de uma alta em dezembro → O dólar fortalece-se e os ativos especulativos ficam sob pressão.
O FED NÃO SUBIU AS TAXAS. MAS OS FALCÕES CONTINUAM NA SALA.
Isto não é aconselhamento financeiro. Faça a sua própria pesquisa.
#CanMicrosoftDeliverOnAI #CanGoogleDefindItsCore #BitcoinCore32.1RaisesPeerConnectionLimit #RippleExpects$900MAnnualizedProductRevenueRunRate
1
1.4k
·
--
#fedwatch
🚨 O FED FEZ UMA PAUSA. ENTÃO POR QUE OS CUSTOS DOS EMPRÉSTIMOS DE LONGO PRAZO CONTINUAM A SUBIR? 👀📈
Toda a gente estava de olho na decisão do Fed sobre as taxas de juro.
Mas o mercado obrigacionista acabou de enviar um sinal bem diferente.
🏦 APÓS A REUNIÃO DO FED:
📈 Rendimento dos títulos do Tesouro dos EUA a 10 anos: 5.036%
📉 Rendimento dos títulos do Tesouro dos EUA a 2 anos: 4.702%
O Fed manteve as taxas entre 3.75% e 4.00%, mas os custos dos empréstimos de longo prazo continuam a subir.
E É AQUI QUE A COISA FICA INTERESSANTE…
Os rendimentos de curto prazo estão a descer, mas os investidores de longo prazo continuam a exigir retornos mais elevados.
Os receios de inflação, o endividamento do governo e a incerteza em relação à futura política do Fed estão todos em destaque.
💥 O QUE SIGNIFICA ISTO PARA OS TRADERS?
🥇 $XAU: Os rendimentos mais elevados de longo prazo podem pressionar o ouro, mesmo com as tensões geopolíticas a sustentarem a procura por ativos de refúgio.
🥈 $XAG: A prata pode sofrer oscilações mais acentuadas à medida que os traders reavaliam as taxas e o crescimento.
🚀 $SOL: O capital mais caro e uma menor apetência pelo risco podem pesar sobre os ativos especulativos.
🔥 $DOGE: Esteja atento a uma volatilidade repentina caso o sentimento em relação à liquidez mude.
O FED PODE PARAR DE SUBIR AS TAXAS SEM TORNAR O DINHEIRO MAIS BARATO.
E, se os rendimentos de longo prazo continuarem a subir, o mercado poderá enfrentar outra reavaliação das valorizações.
🐂 OTIMISTA: Os rendimentos das obrigações estabilizam → A apetência pelo risco melhora → O ouro e as altcoins podem recuperar.
🐻 PESSIMISTA: Os rendimentos a 10 anos sobem → As condições financeiras apertam → Os ativos de risco ficam sujeitos a pressão vendedora.
Isto não é aconselhamento financeiro. Faça a sua própria pesquisa.
#CanMicrosoftDeliverOnAI #CanGoogleDefindItsCore #BitcoinCore32.1RaisesPeerConnectionLimit #BitcoinCoreIdentifiesThreeVulnerabilities
467

Artigo
Ver tradução
Hormuz, the Fed and the Bitcoin Comeback: Is Altseason Really Close?Market analysis · October 29, 2026 · Figures as of October 28–29
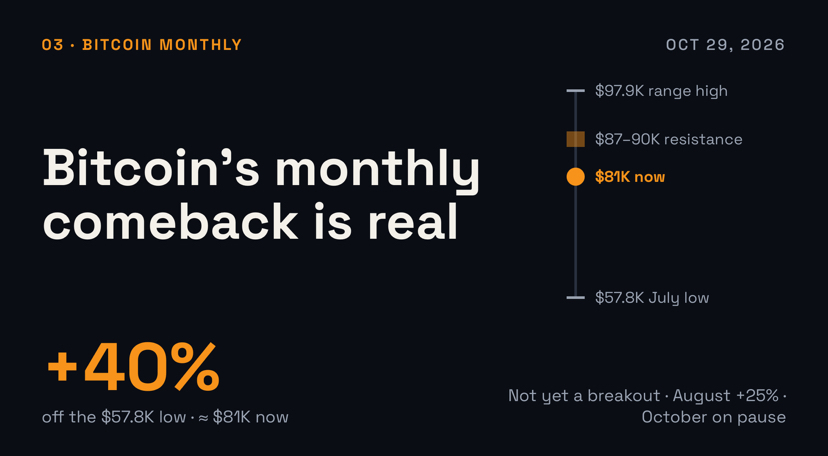
Bitcoin is trading around $81,000. That is roughly 40% above its summer low near $57,800, and still about 35% below its record high near $126,000 from October 2025. Three forces will decide what happens next: a US–Iran war that has pushed Brent crude to about $115, a Federal Reserve that is raising rates again with the 10-year Treasury yield above 5%, and an altcoin market that has yet to prove it can outrun Bitcoin.
This article takes each one in turn, shows how they connect, and sets out what would have to happen for an altseason to arrive.
The short version
Iran–US: the biggest swing factor. Talks are stuck, and Washington has reportedly told Gulf allies to prepare for a short, heavy campaign after the November 3 midterms.Interest rates: a headwind rather than a wall. The Fed hiked in September, held on October 28 with two votes for another hike, and markets lean toward a December increase.Bitcoin’s monthly recovery: real, but closer to a strong rebound inside a range than a breakout. August and September were green; October is tracking slightly red.Altseason: possible, not confirmed. The Altcoin Season Index is at 59 against a trigger of 75, and Bitcoin’s market share is near 60%.
Market snapshot
Bitcoin: about $81,000 on October 28.Fed funds rate: 3.75%–4.00%.10-year Treasury yield: about 5.0%, near its highest level since 2007.US inflation (September CPI): 3.7% year over year; core 2.6%.Brent crude: about $115, up roughly three-quarters from a year ago.Altcoin Season Index: 59. Bitcoin dominance: about 60%.
1. The Iran–US war: the macro wild card
How we got here. The US and Israel struck Iran on February 28. Iran answered by attacking US facilities in the region and restricting shipping through the Strait of Hormuz, the passage for roughly a fifth of the world’s oil. A two-week ceasefire arrived in April, Washington imposed a naval blockade on Iranian ports, and Pakistan and Qatar kept mediation alive. An interim deal reached in June collapsed on July 8 after attacks on commercial ships in the strait, followed by US strikes, Iranian retaliation against US bases in the Gulf, and the return of the blockade.
Where the two sides stand. Washington says any deal must permanently stop Iran from acquiring a nuclear weapon and wants the nuclear file addressed from the start. Vice President JD Vance has said Iran must scale back enrichment, and President Trump has said he will decide when the war ends. Tehran says it will make no concessions on the nuclear issue, wants the US blockade of its ports and the sanctions on its oil exports lifted first, rejects claims that its program has a military dimension, and says it is still giving diplomacy a chance. A Qatari proposal presented on October 25, built around seven days of confidence-building steps, was dismissed by a senior Iranian official as “unacceptable ideas”; accounts differ on whether it was a formal draft at all.
What markets are pricing. The Wall Street Journal reported that the US has told several Gulf states to prepare for a short, intense campaign after the November 3 midterms, while moving air defenses and munitions into position. Trump has said he would not strike before the election, and the White House says all options remain on the table. Iran has warned that any new attack would be answered with strikes on economic and energy targets across the region. Brent crude was trading near $115 on October 28.
How crypto has traded the war. So far the pattern is that Bitcoin sells off on escalation, largely through the oil-to-inflation-to-rates channel, and recovers when headlines cool. On February 28 it dipped to about $63,000 and was back in the low $70,000s within days, while spot ETFs took in roughly $619 million in the first week of March. It touched a two-week low near $76,700 on May 18, and traded near $62,800 on July 8 as fresh strikes lifted oil and rate-hike expectations. Each dip has been recovered so far, but three episodes are a pattern, not a guarantee.
2. High interest rates: the headwind that has not gone away
The Federal Reserve, now led by Chair Kevin Warsh, raised its policy rate by a quarter point on September 16, to 3.75%–4.00%. It was the first hike since July 2023. On October 28 the Fed held steady, but not unanimously: governor Lisa Cook and Cleveland Fed president Beth Hammack voted for another increase. The statement upgraded its description of growth from solid to strong and repeated that inflation remains elevated, and Warsh said the Fed will deliver price stability, “no ifs, ands or buts.” Investors widely expect a hike in December.
The driver is energy. September CPI rose 0.6% on the month and 3.7% on the year, with gasoline up 9.1% in a single month and energy up 20.4% from a year earlier. Core inflation, which strips out food and energy, rose 0.3% on the month and 2.6% annually. The Fed’s September projections showed a median policy rate of 4.1% at the end of 2026, which implies at least one more increase, and pushed the expected return of core PCE inflation to 2% out to 2029.
Bond markets have taken the message seriously. The 10-year Treasury yield is hovering around 5.0%, close to its highest level since 2007, the 30-year is near 5.3%, and the average 30-year mortgage rate has climbed to about 7.3%. Warsh also says he does not believe in forward guidance outside of a crisis, and the Fed will hold seven rate-setting meetings next year and six the year after, so each remaining decision carries more surprise risk.
What it means for crypto. Bitcoin pays no yield, so a 5% risk-free Treasury raises the bar for holding it, and tighter liquidity tends to hit the most speculative assets hardest. That is the textbook case for caution. Yet the tape has been more forgiving than the textbook: Bitcoin gained about 25% in August and about 6% in September, the month of the hike. Its October stall came with long-dated yields still near their highest levels in nearly two decades. On this evidence, rates are a brake on the recovery rather than a veto.
3. Bitcoin on the monthly chart: a real recovery, not yet a breakout
The base. Bitcoin ended February with five straight red monthly candles, a streak with only one precedent, in 2018–19. March then closed about 2% higher, the first green month in six. The second half of the year opened near $58,600, the low printed near $57,800, and the structure has been rebuilding since.
The recovery leg. August closed up roughly 25%, which analysts note is unusual for the year after a cycle peak. September added 6.4% to close at about $83,556. October is tracking roughly 3% lower, with Bitcoin around $81,000 after failing to hold a push toward $87,000 early in the month.
Is it “booming”? It is a strong rebound, about 40% off the low, and August’s candle is the kind of thrust bulls want to see. On the monthly scale, though, it is still a recovery inside a range: the price remains roughly 35% below the 2025 high, and October’s candle is a pause, not a continuation. The levels that matter, from analyst work published in the past week:
Support: $80,000–$82,000 first, then $73,000–$75,000 and about $67,000. The range floor is near $58,100.Resistance: $82,000–$83,000, then $87,000–$90,000. Coinbase Institutional notes that about 2.1 million BTC last changed hands between roughly $87,500 and $91,700, which is overhead supply. The six-month range high is near $97,900.Flows: spot Bitcoin ETFs took in about $2.65 billion in September, but late October has been choppy, with outflows of roughly $636 million on October 22 and $138 million on October 23 after an inflow of about $527 million on October 19.
What would upgrade or downgrade the picture. A monthly close above the $87,000–$90,000 zone, with ETF inflows returning, would turn a rebound into a trend. A loss of the roughly $78,000 midpoint of the second-half range would put $75,000 and $67,000 back in play. The October candle closes on Saturday, October 31.
4. Altseason: close, or still a few steps away?
The most-watched gauge is CoinMarketCap’s Altcoin Season Index, which measures how many of the top 100 altcoins (excluding stablecoins) have beaten Bitcoin over the past 90 days. Readings above 75 mark an altseason; readings below 25 mark a Bitcoin season.
Where things stand. The index was 59 on October 27, inside a range of roughly 53 to 64 over the past month and well short of 75. Bitcoin’s share of the total crypto market is about 60.1%, Ethereum’s is 10.6%, and every other altcoin together holds 29.4%. Altcoins in total are worth about $1.06 trillion against Bitcoin’s $1.60 trillion. Ether trades near $2,360, Solana near $102 and XRP near $1.32, which puts the ETH/BTC ratio at about 0.029.
The case that altseason is close.
The index has climbed from a low of 14 in December 2025 to the high 50s and low 60s, a big swing in ten months.Breadth improved on October 28, when Ether, XRP, Solana and BNB rose together ahead of the Fed decision.Some analysts say a broad altcoin gauge (TOTAL3) has reclaimed a long-term pattern and that altcoin monthly momentum has turned positive for the first time since 2020.
The case that it is not.
The index has slipped from 64 a month ago to 59, and Bitcoin’s share has risen, not fallen, because October’s sell-off hit altcoins harder: Ether, Solana and XRP each dropped roughly 10%–14%.Spot Ether ETFs shed about $542 million in a single week this month, a sign that capital is staying selective.Analyst Benjamin Cowen argues that restrictive policy and a firm dollar favor Bitcoin over altcoins, and expects altcoins to keep losing ground until conditions ease, which he sees as possibly a year or two away.Bitcoin set a record in October 2025 and the usual rotation into altcoins never arrived, which is why many analysts now ask whether a synchronized altseason still exists.
What to watch for confirmation. A sustained fall in Bitcoin dominance below roughly 59%, an index reading above 75, a rising ETH/BTC ratio, and net inflows into Ether and other altcoin funds. Easing yields and oil prices would likely help all four.
Verdict. On current evidence, altseason is a conditional call, not a confirmed one. The index is 16 points below its trigger and moving sideways, and the rotation has not yet shown up in dominance or in fund flows. “Somewhere close” is defensible only if oil and yields cooperate.
5. How the pieces connect
The four stories are really one chain. The war moves oil, oil moves inflation, inflation moves the Fed and Treasury yields, yields move liquidity, and liquidity moves Bitcoin first and altcoins most. The next few weeks offer three broad paths, none of which can be given reliable odds.
De-escalation or a deal. Oil eases, rate-hike bets fade, and Bitcoin has room to challenge $87,000–$90,000. Higher-beta altcoins would be the biggest beneficiaries, so this is the path where altseason talk becomes real.Renewed strikes after the midterms. If Iran follows through on its threats against Gulf energy targets, Brent could spike, pushing inflation and a December hike back to the front. Bitcoin could retest $75,000 or lower, dominance would likely climb, and altseason would slip out of view. Earlier shocks in 2026 were absorbed within days to weeks, but this time the Fed is hiking rather than holding.Stalemate. Brent stays near $100–$120, the Fed holds with a hawkish tilt or hikes, and Bitcoin chops between roughly $75,000 and $90,000. Altcoins rotate selectively by narrative rather than all at once.
6. Dates to watch
October 31: Bitcoin’s October monthly close.November 3: US midterm elections, after which the question of renewed strikes on Iran becomes live.Mid-November: the October CPI report, the next read on how much of the energy shock is feeding through.December: the next FOMC meeting, where a hike is the market’s base case.Ongoing: Qatar–Pakistan mediation, Brent crude, the 10-year yield around the 5% line, Bitcoin dominance, the Altcoin Season Index and ETF flows.
Bottom line
Bitcoin’s climb from the summer low is genuine, and August’s 25% monthly gain was a real thrust. But the macro setting is demanding: an unfinished war, oil near $115, inflation at 3.7%, a Fed that has turned to hikes and a 10-year yield near 5%. Bitcoin can keep grinding higher in that environment, as it did through September. A broad altseason is a bigger ask, because it has typically needed easier liquidity and a stronger appetite for risk. The cleanest read today is that Bitcoin’s recovery is on track while altseason remains a conditional possibility, one that the next few weeks of oil and rate news will either unlock or delay.
This article is for information only and is not financial advice. Crypto assets are highly volatile and you can lose money. Do your own research.
#CanMicrosoftDeliverOnAI
#CanGoogleDefindItsCore
#BitcoinCore32.1RaisesPeerConnectionLimit
#EarningsSeason
Sources and data notes
Figures are as of October 28–29, 2026 and change quickly; readings from data aggregators can differ by provider and time of day. Fed and rates coverage draws on CNBC, CNN, NPR and Yahoo Finance; inflation on the Bureau of Labor Statistics release as reported by Trading Economics and First Trust; oil on Trading Economics and Bloomberg; the Iran–US situation on Reuters reporting carried by several outlets and on the Wall Street Journal report as relayed by Anadolu Agency and Middle East Eye; Bitcoin price and flow data on Fortune, Investing.com, Farside Investors and SimpleMining; technical levels on Coin Edition and Coinbase Institutional commentary; altcoin data on TokenPost, Benzinga, Crypto Daily and AMBCrypto. Analyst views, including Benjamin Cowen’s, are the analysts’ own opinions.
Hormuz, the Fed and the Bitcoin Comeback: Is Altseason Really Close?
Market analysis · October 29, 2026 · Figures as of October 28–29
Bitcoin is trading around $81,000. That is roughly 40% above its summer low near $57,800, and still about 35% below its record high near $126,000 from October 2025. Three forces will decide what happens next: a US–Iran war that has pushed Brent crude to about $115, a Federal Reserve that is raising rates again with the 10-year Treasury yield above 5%, and an altcoin market that has yet to prove it can outrun Bitcoin.
This article takes each one in turn, shows how they connect, and sets out what would have to happen for an altseason to arrive.
The short version
Iran–US: the biggest swing factor. Talks are stuck, and Washington has reportedly told Gulf allies to prepare for a short, heavy campaign after the November 3 midterms.Interest rates: a headwind rather than a wall. The Fed hiked in September, held on October 28 with two votes for another hike, and markets lean toward a December increase.Bitcoin’s monthly recovery: real, but closer to a strong rebound inside a range than a breakout. August and September were green; October is tracking slightly red.Altseason: possible, not confirmed. The Altcoin Season Index is at 59 against a trigger of 75, and Bitcoin’s market share is near 60%.
Market snapshot
Bitcoin: about $81,000 on October 28.Fed funds rate: 3.75%–4.00%.10-year Treasury yield: about 5.0%, near its highest level since 2007.US inflation (September CPI): 3.7% year over year; core 2.6%.Brent crude: about $115, up roughly three-quarters from a year ago.Altcoin Season Index: 59. Bitcoin dominance: about 60%.
1. The Iran–US war: the macro wild card
How we got here. The US and Israel struck Iran on February 28. Iran answered by attacking US facilities in the region and restricting shipping through the Strait of Hormuz, the passage for roughly a fifth of the world’s oil. A two-week ceasefire arrived in April, Washington imposed a naval blockade on Iranian ports, and Pakistan and Qatar kept mediation alive. An interim deal reached in June collapsed on July 8 after attacks on commercial ships in the strait, followed by US strikes, Iranian retaliation against US bases in the Gulf, and the return of the blockade.
Where the two sides stand. Washington says any deal must permanently stop Iran from acquiring a nuclear weapon and wants the nuclear file addressed from the start. Vice President JD Vance has said Iran must scale back enrichment, and President Trump has said he will decide when the war ends. Tehran says it will make no concessions on the nuclear issue, wants the US blockade of its ports and the sanctions on its oil exports lifted first, rejects claims that its program has a military dimension, and says it is still giving diplomacy a chance. A Qatari proposal presented on October 25, built around seven days of confidence-building steps, was dismissed by a senior Iranian official as “unacceptable ideas”; accounts differ on whether it was a formal draft at all.
What markets are pricing. The Wall Street Journal reported that the US has told several Gulf states to prepare for a short, intense campaign after the November 3 midterms, while moving air defenses and munitions into position. Trump has said he would not strike before the election, and the White House says all options remain on the table. Iran has warned that any new attack would be answered with strikes on economic and energy targets across the region. Brent crude was trading near $115 on October 28.
How crypto has traded the war. So far the pattern is that Bitcoin sells off on escalation, largely through the oil-to-inflation-to-rates channel, and recovers when headlines cool. On February 28 it dipped to about $63,000 and was back in the low $70,000s within days, while spot ETFs took in roughly $619 million in the first week of March. It touched a two-week low near $76,700 on May 18, and traded near $62,800 on July 8 as fresh strikes lifted oil and rate-hike expectations. Each dip has been recovered so far, but three episodes are a pattern, not a guarantee.
2. High interest rates: the headwind that has not gone away
The Federal Reserve, now led by Chair Kevin Warsh, raised its policy rate by a quarter point on September 16, to 3.75%–4.00%. It was the first hike since July 2023. On October 28 the Fed held steady, but not unanimously: governor Lisa Cook and Cleveland Fed president Beth Hammack voted for another increase. The statement upgraded its description of growth from solid to strong and repeated that inflation remains elevated, and Warsh said the Fed will deliver price stability, “no ifs, ands or buts.” Investors widely expect a hike in December.
The driver is energy. September CPI rose 0.6% on the month and 3.7% on the year, with gasoline up 9.1% in a single month and energy up 20.4% from a year earlier. Core inflation, which strips out food and energy, rose 0.3% on the month and 2.6% annually. The Fed’s September projections showed a median policy rate of 4.1% at the end of 2026, which implies at least one more increase, and pushed the expected return of core PCE inflation to 2% out to 2029.
Bond markets have taken the message seriously. The 10-year Treasury yield is hovering around 5.0%, close to its highest level since 2007, the 30-year is near 5.3%, and the average 30-year mortgage rate has climbed to about 7.3%. Warsh also says he does not believe in forward guidance outside of a crisis, and the Fed will hold seven rate-setting meetings next year and six the year after, so each remaining decision carries more surprise risk.
What it means for crypto. Bitcoin pays no yield, so a 5% risk-free Treasury raises the bar for holding it, and tighter liquidity tends to hit the most speculative assets hardest. That is the textbook case for caution. Yet the tape has been more forgiving than the textbook: Bitcoin gained about 25% in August and about 6% in September, the month of the hike. Its October stall came with long-dated yields still near their highest levels in nearly two decades. On this evidence, rates are a brake on the recovery rather than a veto.
3. Bitcoin on the monthly chart: a real recovery, not yet a breakout
The base. Bitcoin ended February with five straight red monthly candles, a streak with only one precedent, in 2018–19. March then closed about 2% higher, the first green month in six. The second half of the year opened near $58,600, the low printed near $57,800, and the structure has been rebuilding since.
The recovery leg. August closed up roughly 25%, which analysts note is unusual for the year after a cycle peak. September added 6.4% to close at about $83,556. October is tracking roughly 3% lower, with Bitcoin around $81,000 after failing to hold a push toward $87,000 early in the month.
Is it “booming”? It is a strong rebound, about 40% off the low, and August’s candle is the kind of thrust bulls want to see. On the monthly scale, though, it is still a recovery inside a range: the price remains roughly 35% below the 2025 high, and October’s candle is a pause, not a continuation. The levels that matter, from analyst work published in the past week:
Support: $80,000–$82,000 first, then $73,000–$75,000 and about $67,000. The range floor is near $58,100.Resistance: $82,000–$83,000, then $87,000–$90,000. Coinbase Institutional notes that about 2.1 million BTC last changed hands between roughly $87,500 and $91,700, which is overhead supply. The six-month range high is near $97,900.Flows: spot Bitcoin ETFs took in about $2.65 billion in September, but late October has been choppy, with outflows of roughly $636 million on October 22 and $138 million on October 23 after an inflow of about $527 million on October 19.
What would upgrade or downgrade the picture. A monthly close above the $87,000–$90,000 zone, with ETF inflows returning, would turn a rebound into a trend. A loss of the roughly $78,000 midpoint of the second-half range would put $75,000 and $67,000 back in play. The October candle closes on Saturday, October 31.
4. Altseason: close, or still a few steps away?
The most-watched gauge is CoinMarketCap’s Altcoin Season Index, which measures how many of the top 100 altcoins (excluding stablecoins) have beaten Bitcoin over the past 90 days. Readings above 75 mark an altseason; readings below 25 mark a Bitcoin season.
Where things stand. The index was 59 on October 27, inside a range of roughly 53 to 64 over the past month and well short of 75. Bitcoin’s share of the total crypto market is about 60.1%, Ethereum’s is 10.6%, and every other altcoin together holds 29.4%. Altcoins in total are worth about $1.06 trillion against Bitcoin’s $1.60 trillion. Ether trades near $2,360, Solana near $102 and XRP near $1.32, which puts the ETH/BTC ratio at about 0.029.
The case that altseason is close.
The index has climbed from a low of 14 in December 2025 to the high 50s and low 60s, a big swing in ten months.Breadth improved on October 28, when Ether, XRP, Solana and BNB rose together ahead of the Fed decision.Some analysts say a broad altcoin gauge (TOTAL3) has reclaimed a long-term pattern and that altcoin monthly momentum has turned positive for the first time since 2020.
The case that it is not.
The index has slipped from 64 a month ago to 59, and Bitcoin’s share has risen, not fallen, because October’s sell-off hit altcoins harder: Ether, Solana and XRP each dropped roughly 10%–14%.Spot Ether ETFs shed about $542 million in a single week this month, a sign that capital is staying selective.Analyst Benjamin Cowen argues that restrictive policy and a firm dollar favor Bitcoin over altcoins, and expects altcoins to keep losing ground until conditions ease, which he sees as possibly a year or two away.Bitcoin set a record in October 2025 and the usual rotation into altcoins never arrived, which is why many analysts now ask whether a synchronized altseason still exists.
What to watch for confirmation. A sustained fall in Bitcoin dominance below roughly 59%, an index reading above 75, a rising ETH/BTC ratio, and net inflows into Ether and other altcoin funds. Easing yields and oil prices would likely help all four.
Verdict. On current evidence, altseason is a conditional call, not a confirmed one. The index is 16 points below its trigger and moving sideways, and the rotation has not yet shown up in dominance or in fund flows. “Somewhere close” is defensible only if oil and yields cooperate.
5. How the pieces connect
The four stories are really one chain. The war moves oil, oil moves inflation, inflation moves the Fed and Treasury yields, yields move liquidity, and liquidity moves Bitcoin first and altcoins most. The next few weeks offer three broad paths, none of which can be given reliable odds.
De-escalation or a deal. Oil eases, rate-hike bets fade, and Bitcoin has room to challenge $87,000–$90,000. Higher-beta altcoins would be the biggest beneficiaries, so this is the path where altseason talk becomes real.Renewed strikes after the midterms. If Iran follows through on its threats against Gulf energy targets, Brent could spike, pushing inflation and a December hike back to the front. Bitcoin could retest $75,000 or lower, dominance would likely climb, and altseason would slip out of view. Earlier shocks in 2026 were absorbed within days to weeks, but this time the Fed is hiking rather than holding.Stalemate. Brent stays near $100–$120, the Fed holds with a hawkish tilt or hikes, and Bitcoin chops between roughly $75,000 and $90,000. Altcoins rotate selectively by narrative rather than all at once.
6. Dates to watch
October 31: Bitcoin’s October monthly close.November 3: US midterm elections, after which the question of renewed strikes on Iran becomes live.Mid-November: the October CPI report, the next read on how much of the energy shock is feeding through.December: the next FOMC meeting, where a hike is the market’s base case.Ongoing: Qatar–Pakistan mediation, Brent crude, the 10-year yield around the 5% line, Bitcoin dominance, the Altcoin Season Index and ETF flows.
Bottom line
Bitcoin’s climb from the summer low is genuine, and August’s 25% monthly gain was a real thrust. But the macro setting is demanding: an unfinished war, oil near $115, inflation at 3.7%, a Fed that has turned to hikes and a 10-year yield near 5%. Bitcoin can keep grinding higher in that environment, as it did through September. A broad altseason is a bigger ask, because it has typically needed easier liquidity and a stronger appetite for risk. The cleanest read today is that Bitcoin’s recovery is on track while altseason remains a conditional possibility, one that the next few weeks of oil and rate news will either unlock or delay.
This article is for information only and is not financial advice. Crypto assets are highly volatile and you can lose money. Do your own research.
#CanMicrosoftDeliverOnAI
#CanGoogleDefindItsCore
#BitcoinCore32.1RaisesPeerConnectionLimit
#EarningsSeason
Sources and data notes
Figures are as of October 28–29, 2026 and change quickly; readings from data aggregators can differ by provider and time of day. Fed and rates coverage draws on CNBC, CNN, NPR and Yahoo Finance; inflation on the Bureau of Labor Statistics release as reported by Trading Economics and First Trust; oil on Trading Economics and Bloomberg; the Iran–US situation on Reuters reporting carried by several outlets and on the Wall Street Journal report as relayed by Anadolu Agency and Middle East Eye; Bitcoin price and flow data on Fortune, Investing.com, Farside Investors and SimpleMining; technical levels on Coin Edition and Coinbase Institutional commentary; altcoin data on TokenPost, Benzinga, Crypto Daily and AMBCrypto. Analyst views, including Benjamin Cowen’s, are the analysts’ own opinions.
12

·
--
Artigo
Ver tradução
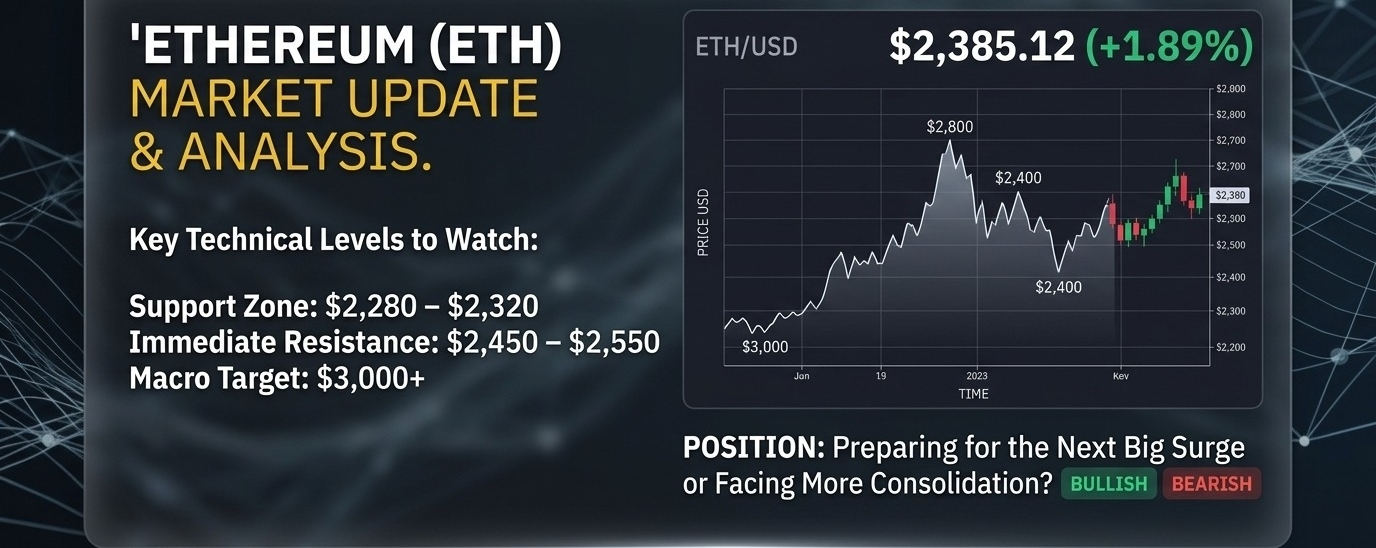
Ethereum ($ETH ) Market Update & Technical Analysis
Is $ETH Preparing for the Next Big Surge or FacEthereum (ETH) Market Update & Technical Analysis
Is $ETH Preparing for the Next Big Surge or Facing More Consolidation?
Ethereum ($ETH) is currently trading in a crucial zone near $2,340–$2,400 as the broader market responds to institutional movements, ETF flows, and key network developments.
Here is a deep dive into what is currently happening with $ETH and what you need to watch out for! 👇
🟢 1. Spot ETF Outflows & Institutional Shifts
In recent weeks, spot Ethereum ETFs have experienced cooling demand. Net assets decreased from $17.7 Billion down to $14.1 Billion. Institutional traders are taking a cautious "wait-and-see" approach amidst global market macroeconomic updates. However, long-term accumulation ranges remain active around major support levels.
🛠️ 2. Upgrade Roadmap & Network Security
The development team behind Ethereum continues to optimize mainnet efficiency and layer-2 scalability. While upcoming upgrade roadmaps (such as Glamsterdam) have undergone rigorous security testing and minor testnet delays via auditors, the long-term fundamentals around Ethereum’s proof-of-stake yield and burn mechanisms remain solid.
📊 3. Key Technical Levels to Watch
Support Zone: $2,280 – $2,320
If ETH holds this range, buyers could step in to form a strong double-bottom structure.
Immediate Resistance: $2,450 – $2,550
A breakout above this level with heavy volume could trigger a rally back toward $2,800+.
Macro Target: $3,000+
Sustained spot demand and renewed ETF inflows will be essential to push ETH back to major highs.
💡 Trader's Takeaway & Strategy
Short-Term: High volatility around current price action. Manage risk closely with proper stop-losses if trading futures.
Long-Term: Dollar-Cost Averaging (DCA) into fundamental spot assets like ETH continues to be a preferred strategy during market consolidation periods.
💬 What's your price prediction for $ETH by the end of the month?
Are you Bullish 🐂 or Bearish 🐻? Drop your thoughts below! 👇
#BitcoinCore32.1RaisesPeerConnectionLimit #EarningsSeason #SquareBinance #Ethereum #CryptoNews
Ethereum ($ETH ) Market Update & Technical Analysis Is $ETH Preparing for the Next Big Surge or Fac
Ethereum (ETH) Market Update & Technical Analysis
Is $ETH Preparing for the Next Big Surge or Facing More Consolidation?
Ethereum ($ETH) is currently trading in a crucial zone near $2,340–$2,400 as the broader market responds to institutional movements, ETF flows, and key network developments.
Here is a deep dive into what is currently happening with $ETH and what you need to watch out for! 👇
🟢 1. Spot ETF Outflows & Institutional Shifts
In recent weeks, spot Ethereum ETFs have experienced cooling demand. Net assets decreased from $17.7 Billion down to $14.1 Billion. Institutional traders are taking a cautious "wait-and-see" approach amidst global market macroeconomic updates. However, long-term accumulation ranges remain active around major support levels.
🛠️ 2. Upgrade Roadmap & Network Security
The development team behind Ethereum continues to optimize mainnet efficiency and layer-2 scalability. While upcoming upgrade roadmaps (such as Glamsterdam) have undergone rigorous security testing and minor testnet delays via auditors, the long-term fundamentals around Ethereum’s proof-of-stake yield and burn mechanisms remain solid.
📊 3. Key Technical Levels to Watch
Support Zone: $2,280 – $2,320
If ETH holds this range, buyers could step in to form a strong double-bottom structure.
Immediate Resistance: $2,450 – $2,550
A breakout above this level with heavy volume could trigger a rally back toward $2,800+.
Macro Target: $3,000+
Sustained spot demand and renewed ETF inflows will be essential to push ETH back to major highs.
💡 Trader's Takeaway & Strategy
Short-Term: High volatility around current price action. Manage risk closely with proper stop-losses if trading futures.
Long-Term: Dollar-Cost Averaging (DCA) into fundamental spot assets like ETH continues to be a preferred strategy during market consolidation periods.
💬 What's your price prediction for $ETH by the end of the month?
Are you Bullish 🐂 or Bearish 🐻? Drop your thoughts below! 👇
#BitcoinCore32.1RaisesPeerConnectionLimit #EarningsSeason #SquareBinance #Ethereum #CryptoNews
1
7

Ver tradução
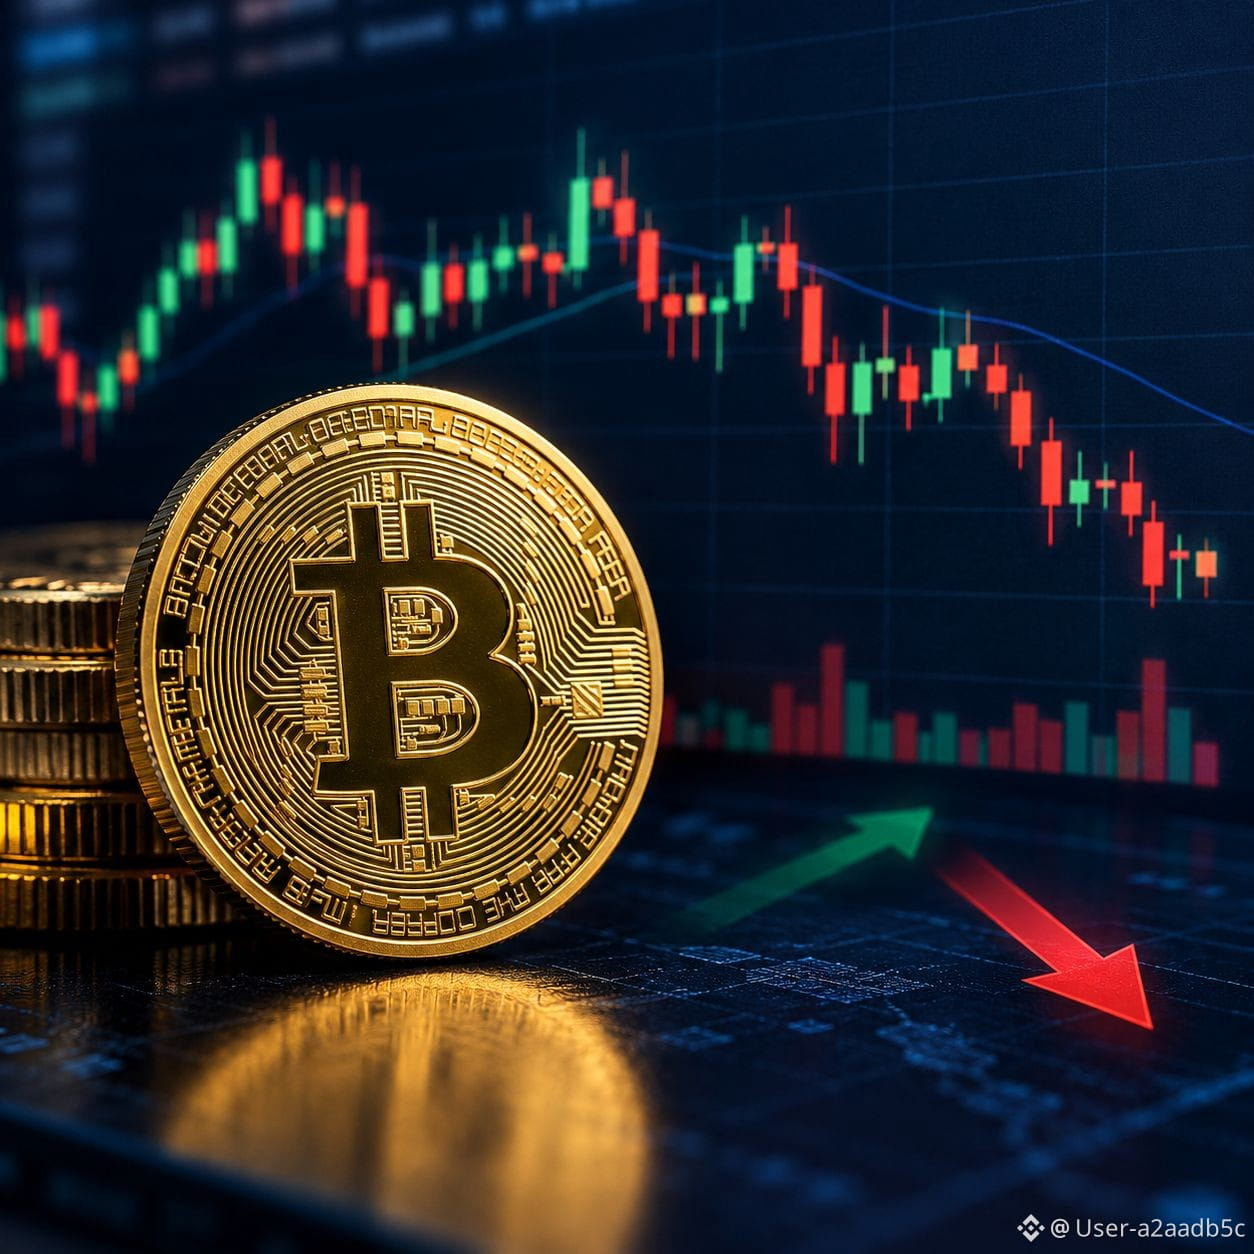
Bitcoin is facing renewed selling pressure after its recent recovery above $80,500 faded following the Federal Reserve’s latest decision. $BTC
{spot}(BTCUSDT)
is trading near the $80,000 area, with volatility remaining high.
Support: $79,500, then $77,000–$77,500.
Resistance: $81,400–$82,500.
Short-term outlook: Neutral to bearish while Bitcoin struggles to break above resistance. Holding support could allow another recovery attempt; breaking below it may trigger further losses.
Trading takeaway: Wait for confirmation before entering a trade. A sustained move above $82,500 would improve the bullish outlook, while a break below $79,500 would increase downside risk.
This is market commentary, not financial advice. Bitcoin is highly volatile, and support/resistance levels can change quickly.#CanMicrosoftDeliverOnAI #BitcoinCore32.1RaisesPeerConnectionLimit #BitcoinCoreIdentifiesThreeVulnerabilities #CanGoogleDefindItsCore
Bitcoin is facing renewed selling pressure after its recent recovery above $80,500 faded following the Federal Reserve’s latest decision. $BTC
is trading near the $80,000 area, with volatility remaining high.
Support: $79,500, then $77,000–$77,500.
Resistance: $81,400–$82,500.
Short-term outlook: Neutral to bearish while Bitcoin struggles to break above resistance. Holding support could allow another recovery attempt; breaking below it may trigger further losses.
Trading takeaway: Wait for confirmation before entering a trade. A sustained move above $82,500 would improve the bullish outlook, while a break below $79,500 would increase downside risk.
This is market commentary, not financial advice. Bitcoin is highly volatile, and support/resistance levels can change quickly.#CanMicrosoftDeliverOnAI #BitcoinCore32.1RaisesPeerConnectionLimit #BitcoinCoreIdentifiesThreeVulnerabilities #CanGoogleDefindItsCore
3

·
--
#fedtobeginshrinkingratesettingcalendarin2027
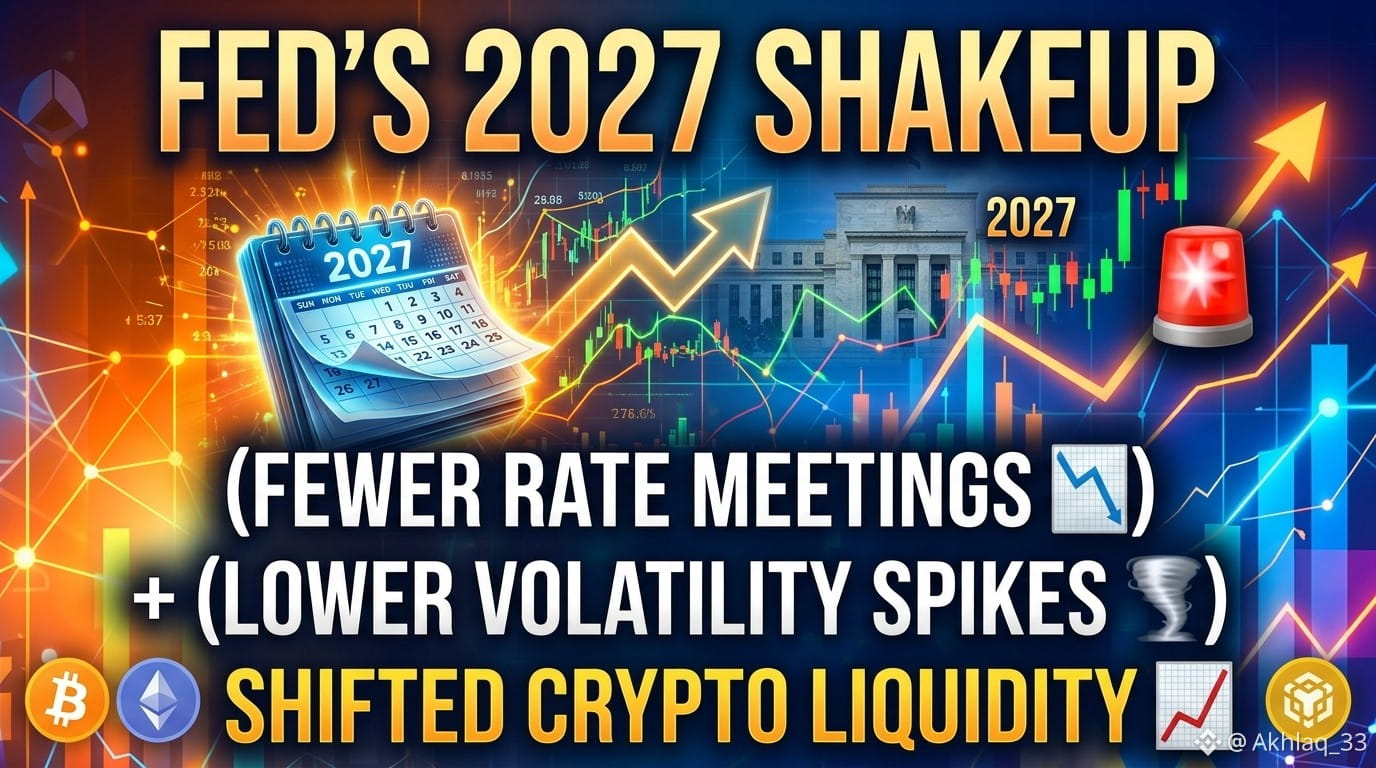
A mudança no calendário do Fed em 2027: menos ruído, mais sinal?
A discussão sobre o suposto plano do Federal Reserve de[ shrink its rate-setting calendar](https://www.binance.com/en/square/hashtag/fedtobeginshrinkingratesettingcalendarin2027) está dando origem a um debate interessante entre traders e observadores da macroeconomia.
Com as conversas apontando para menos reuniões de decisão sobre juros no futuro — passando das tradicionais 8 reuniões para menos sessões de política monetária ativa e mais discussões focadas em estratégia —, o ritmo dos mercados pode ser bem diferente.
O que isso pode significar para os mercados:
Menos “varridas de pavio”: decisões sobre juros menos frequentes podem significar menos picos repentinos de volatilidade impulsionados por fatores macroeconômicos, que frequentemente provocam liquidações rápidas nos mercados de derivativos.
Movimentos de preço mais orgânicos: em vez de se agarrarem a cada anúncio em busca de uma direção no curto prazo, os mercados talvez precisem se apoiar mais nos fundamentos subjacentes, na demanda à vista e em dados econômicos mais amplos.
Uma mudança de ritmo: traders acostumados a ficar acordados até tarde para acompanhar cada catalisador do FOMC talvez tenham de navegar por períodos mais longos de movimentos laterais.
Será que reuniões menos frequentes, mas de maior impacto, vão ajudar o mercado a amadurecer ou vamos sentir falta da ação de alta volatilidade? Vamos conversar nos comentários! 👇📉🚀
#CanMicrosoftDeliverOnAI #FedWatch #BitcoinCore32.1RaisesPeerConnectionLimit $BTC $ETH
#fedtobeginshrinkingratesettingcalendarin2027
A mudança no calendário do Fed em 2027: menos ruído, mais sinal?
A discussão sobre o suposto plano do Federal Reserve de shrink its rate-setting calendar está dando origem a um debate interessante entre traders e observadores da macroeconomia.
Com as conversas apontando para menos reuniões de decisão sobre juros no futuro — passando das tradicionais 8 reuniões para menos sessões de política monetária ativa e mais discussões focadas em estratégia —, o ritmo dos mercados pode ser bem diferente.
O que isso pode significar para os mercados:
Menos “varridas de pavio”: decisões sobre juros menos frequentes podem significar menos picos repentinos de volatilidade impulsionados por fatores macroeconômicos, que frequentemente provocam liquidações rápidas nos mercados de derivativos.
Movimentos de preço mais orgânicos: em vez de se agarrarem a cada anúncio em busca de uma direção no curto prazo, os mercados talvez precisem se apoiar mais nos fundamentos subjacentes, na demanda à vista e em dados econômicos mais amplos.
Uma mudança de ritmo: traders acostumados a ficar acordados até tarde para acompanhar cada catalisador do FOMC talvez tenham de navegar por períodos mais longos de movimentos laterais.
Será que reuniões menos frequentes, mas de maior impacto, vão ajudar o mercado a amadurecer ou vamos sentir falta da ação de alta volatilidade? Vamos conversar nos comentários! 👇📉🚀
#CanMicrosoftDeliverOnAI #FedWatch #BitcoinCore32.1RaisesPeerConnectionLimit $BTC $ETH
23

Artigo
FedWatch#fedwatch
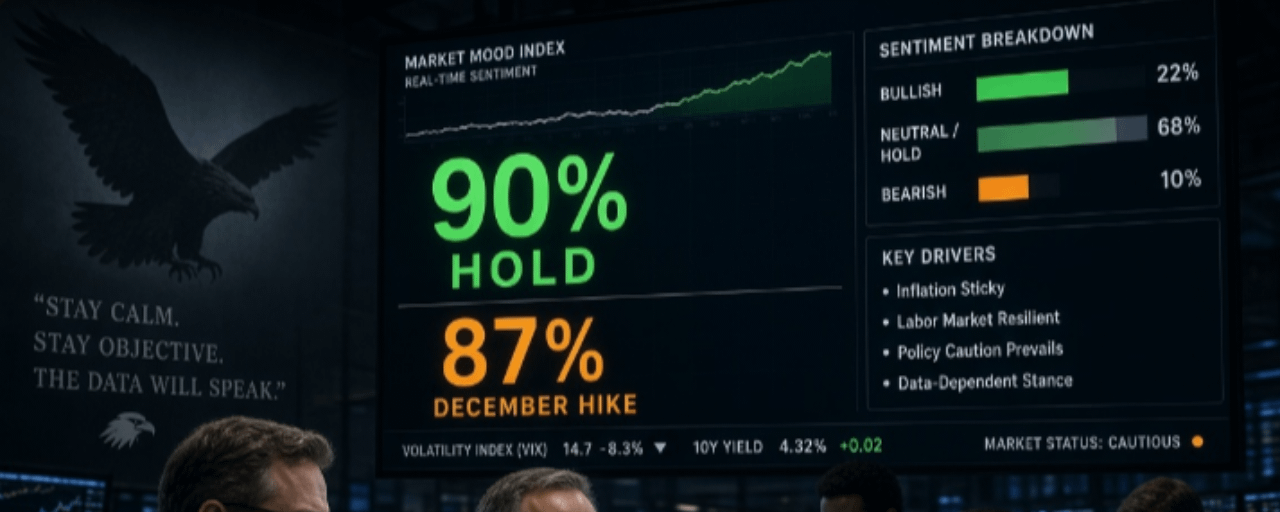
Com base nos dados da ferramenta CME FedWatch, as expectativas do mercado para a decisão do Federal Reserve sobre as taxas de juros em outubro de 2026 apontam, de forma predominante, para a manutenção das taxas, com uma probabilidade extremamente baixa de aumento.
Expectativa para a decisão sobre as taxas em outubro: é quase certo que permanecerão inalteradas
De acordo com os dados mais recentes da ferramenta CME FedWatch antes da decisão, a probabilidade de o Fed manter a faixa-alvo da taxa dos fundos federais em 3,75%-4,00% é de aproximadamente 90% ou até mais.
FedWatch
#fedwatch
Com base nos dados da ferramenta CME FedWatch, as expectativas do mercado para a decisão do Federal Reserve sobre as taxas de juros em outubro de 2026 apontam, de forma predominante, para a manutenção das taxas, com uma probabilidade extremamente baixa de aumento.
Expectativa para a decisão sobre as taxas em outubro: é quase certo que permanecerão inalteradas
De acordo com os dados mais recentes da ferramenta CME FedWatch antes da decisão, a probabilidade de o Fed manter a faixa-alvo da taxa dos fundos federais em 3,75%-4,00% é de aproximadamente 90% ou até mais.
1
39

Ver tradução
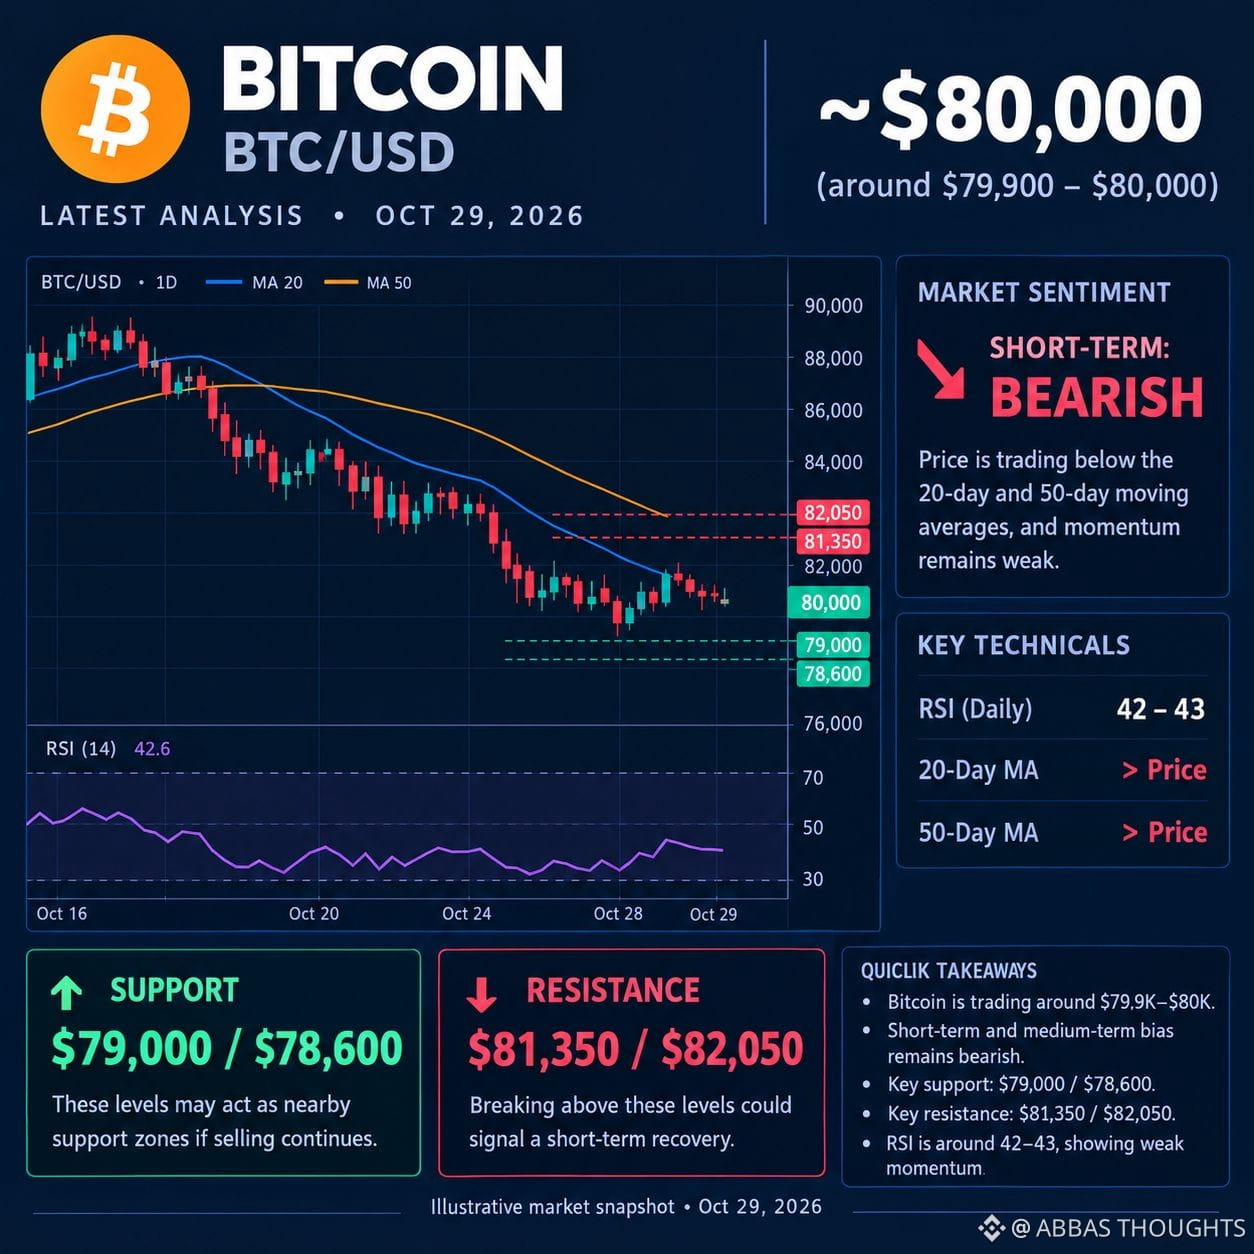
$BTC Resistance (selling pressure)
$81,350 – $82,050
Support (buying zone to watch)
$79,000 – $78,600
Technical levels reported for October 29, 2026.
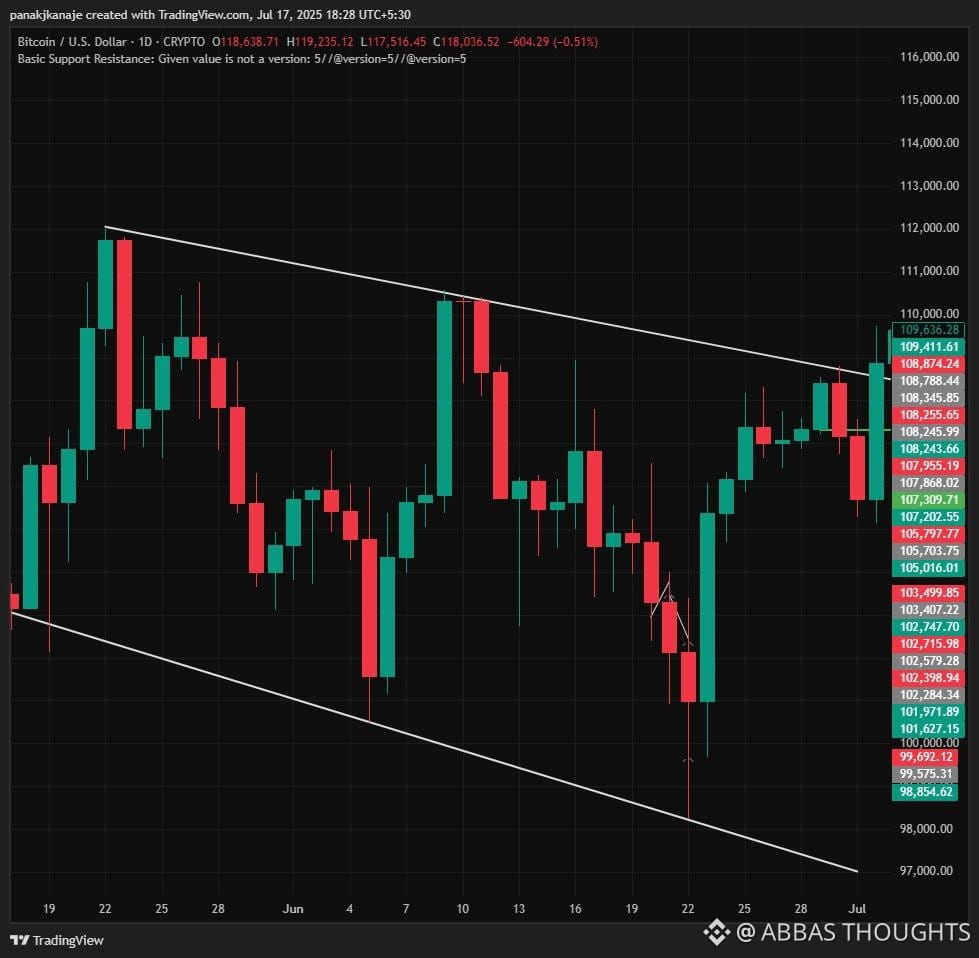
Bitcoin chart picture
Illustrative technical chart — not a live exchange chart.
What could happen next?
Bullish scenario: $BTC breaks above $82,050 and holds, potentially sporting a recovery.
Bearish scenario: $BTC falls below $78,600, increasing the risk of further downside.
Current view: Cautious to bearish in the short term; wait for confirmation before entering a trade.
My suggestion: Avoid chasing sudden price movements, and use a stop-loss if trading. Crypto is highly volatile, and these levels are not guaranteed
#BitcoinForecast #BitcoinAnalysis #BitcoinThoughts #BitcoinCore32.1RaisesPeerConnectionLimit #BitcoinWarnings
WHAT ABOUT YOUR THOUGHTS TELL ME IN COMMENTS ..!
{spot}(BTCUSDT)
$BTC Resistance (selling pressure)
$81,350 – $82,050
Support (buying zone to watch)
$79,000 – $78,600
Technical levels reported for October 29, 2026.
Bitcoin chart picture
Illustrative technical chart — not a live exchange chart.
What could happen next?
Bullish scenario: $BTC breaks above $82,050 and holds, potentially sporting a recovery.
Bearish scenario: $BTC falls below $78,600, increasing the risk of further downside.
Current view: Cautious to bearish in the short term; wait for confirmation before entering a trade.
My suggestion: Avoid chasing sudden price movements, and use a stop-loss if trading. Crypto is highly volatile, and these levels are not guaranteed
#BitcoinForecast #BitcoinAnalysis #BitcoinThoughts #BitcoinCore32.1RaisesPeerConnectionLimit #BitcoinWarnings
WHAT ABOUT YOUR THOUGHTS TELL ME IN COMMENTS ..!
17

·
--
Ver tradução
$ARB LONG SETUP — BUYERS EYE A RELIEF BOUNCE!
ARB is holding near local lows, with a potential recovery toward the next resistance zones if bullish momentum returns.
Entry: 0.16695 – 0.16779
TP1: 0.17546
TP2: 0.18193
Stop Loss: 0.16194
$ARB
{spot}(ARBUSDT)
#CanMicrosoftDeliverOnAI #CanGoogleDefindItsCore #FedWatch #BitcoinCore32.1RaisesPeerConnectionLimit #EarningsSeason
$ARB LONG SETUP — BUYERS EYE A RELIEF BOUNCE!
ARB is holding near local lows, with a potential recovery toward the next resistance zones if bullish momentum returns.
Entry: 0.16695 – 0.16779
TP1: 0.17546
TP2: 0.18193
Stop Loss: 0.16194
$ARB
#CanMicrosoftDeliverOnAI #CanGoogleDefindItsCore #FedWatch #BitcoinCore32.1RaisesPeerConnectionLimit #EarningsSeason

27

·
--
Ver tradução
#BitcoinCore32.1RaisesPeerConnectionLimit
🚀🔥 BNB BULLS ARE BACK — $780 NEXT OR A SURPRISE PULLBACK? 💛
$BNB is showing renewed strength, with the latest market data placing it around $750–$760. Buyers are pushing higher, but the real test is whether bulls can sustain the momentum and break through resistance! 📊 <Cite refs={["turn160615search1","turn160615search3"]}/>
📈 BULLISH ROADMAP 🟢 Break above $760 → Potential move toward $780 🚀 Strong follow-through → $800 comes into focus 💰 From $755 to $780 = approximately +3.3% 🔥 From $755 to $800 = approximately +6.0%
📉 BEARISH WARNING If BNB gets rejected near $760–$780, sellers could push the price back toward $745 or the $740 support zone.
🎯 MY MARKET VIEW: Bulls have a chance to extend the rally, but confirmation matters. A convincing breakout with strong volume would strengthen the bullish case; losing support could trigger another pullback.
💬 BNB COMMUNITY, MAKE YOUR CALL! $760, $780, $800 — or are bears preparing a comeback? 👇
❤️ Like | 🔁 Share | 💭 Drop your prediction!
⚠️ These are speculative scenarios, not guaranteed targets. Crypto is volatile. DYOR and manage your risk.

2

#fedwatch
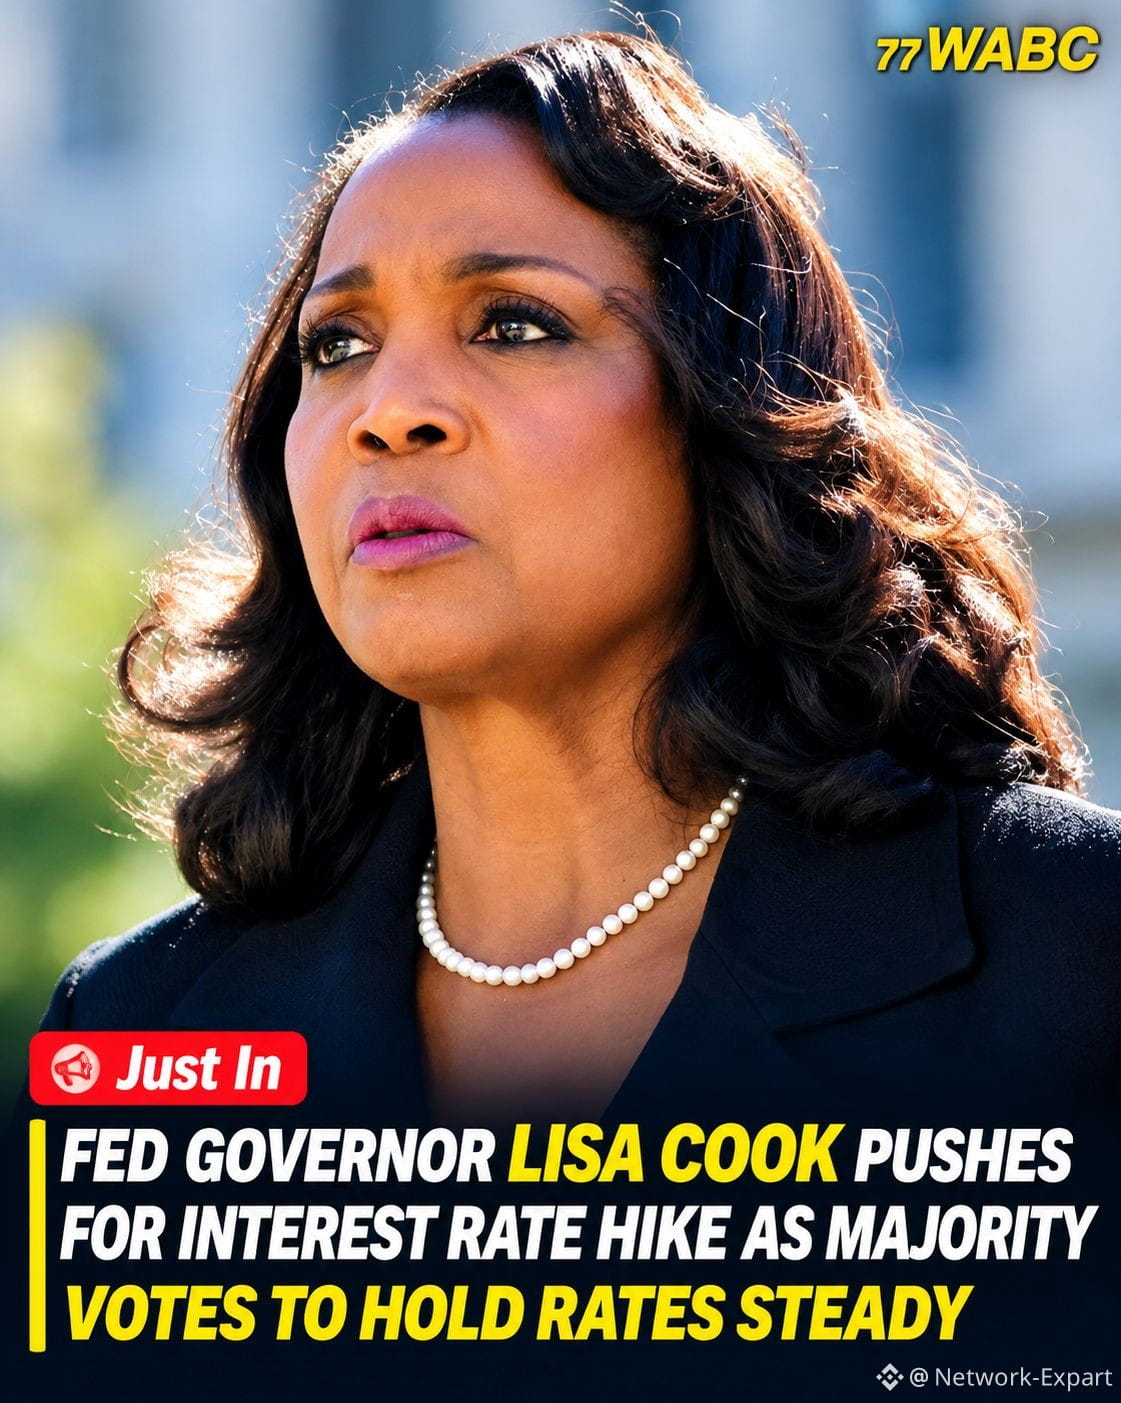
🚨🏦 O FED FEZ UMA PAUSA — MAS OS FALCÕES QUERIAM UM AUMENTO DOS JUROS! 👀🔥
O mercado cripto está comemorando cedo demais? 📉📈
Todos estão focados no fato de o Fed ter mantido as taxas de juros inalteradas. Mas há outro detalhe que os traders não devem ignorar: segundo relatos, dois dirigentes foram a favor de um aumento de 25 pontos-base nos juros. ⚠️
🏦 FOMC DE OUTUBRO: PRINCIPAIS CONCLUSÕES
✅ Taxas de juros mantidas entre 3,75% e 4,00% 🔴 Lisa Cook — segundo relatos, foi a favor de um aumento de 25 pontos-base 🔴 Beth Hammack — segundo relatos, foi a favor de um aumento de 25 pontos-base 📊 Votação divulgada: 10–2 ⚠️ A inflação continua elevada, deixando incertas as próximas decisões de política monetária.
🔥 O QUE ISSO PODE SIGNIFICAR PARA OS MERCADOS?
🥇 $XAU (OURO): Um dólar mais forte e a alta dos rendimentos dos títulos podem pressionar os preços do ouro.
🥈 $XAG (PRATA): Mudanças nas expectativas em relação aos juros podem provocar uma volatilidade mais intensa.
🚀 $SOL (SOLANA): Sinais agressivos do Fed podem reduzir o apetite por risco e pressionar criptoativos de alto beta.
🐕 $DOGE (DOGECOIN): Ralis especulativos podem enfrentar obstáculos se as condições de liquidez se tornarem mais restritivas.
💥 A MAIOR ARMADILHA QUE OS TRADERS DEVEM EVITAR!
Uma pausa do Fed NÃO significa automaticamente que o Fed adotou uma postura moderada.
🟢 CENÁRIO DE ALTA A inflação desacelera → Os temores de aumento dos juros diminuem → O dólar enfraquece → O ouro e os ativos de risco podem se recuperar.
🔴 CENÁRIO DE BAIXA A inflação continua elevada → As expectativas de aumento dos juros voltam → O dólar se fortalece → Os ativos especulativos enfrentam novas pressões.
🎯 O QUE OS TRADERS DEVEM ACOMPANHAR AGORA?
Próximos dados de inflação
Rendimentos dos títulos do Tesouro dos EUA e força do dólar
Os próximos sinais de política monetária do Fed
A reação do BTC e o impulso geral das altcoins
⚠️ RESUMINDO: O Fed não aumentou os juros, mas as vozes mais agressivas ainda importam. Não confunda uma pausa com um sinal garantido de alta.
💬 Qual é a sua previsão, família Binance?
🟢 Alta — A temporada das altcoins continua! 🔴 Baixa — Mais quedas pela frente?
#CanMicrosoftDeliverOnAI #CanGoogleDefindItsCore #BitcoinCore32.1RaisesPeerConnectionLimit #RippleRevolution
13
·
--
Ver tradução
#BitcoinCore32.1RaisesPeerConnectionLimit
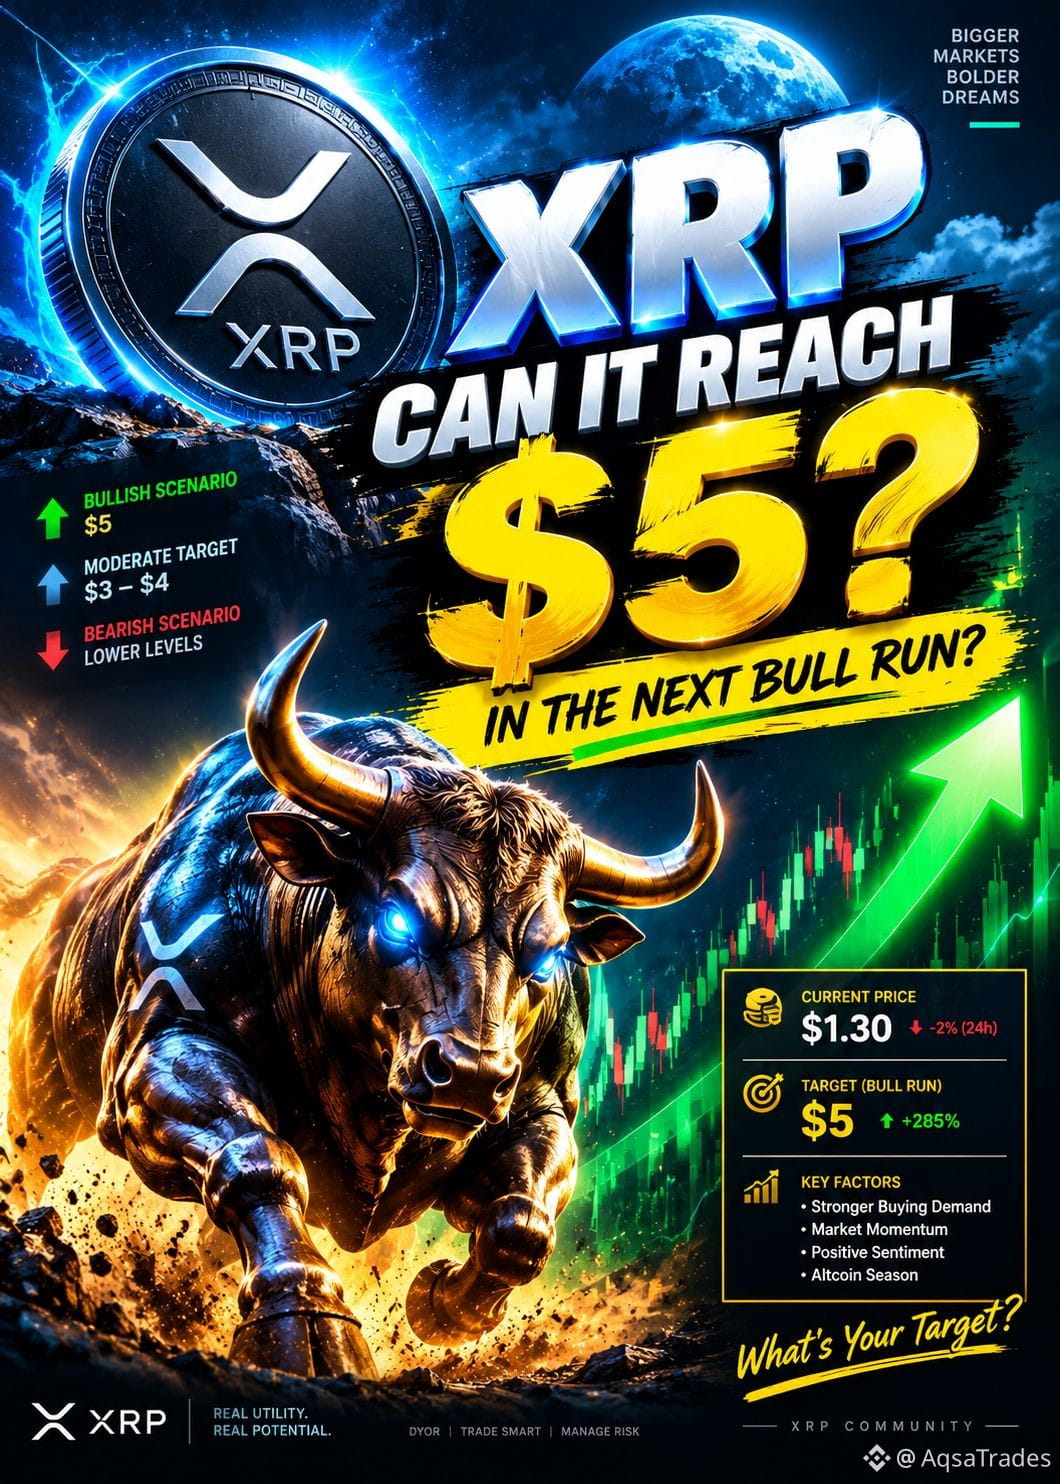
🚀 XRP TO $5? THE NEXT BULL RUN COULD CHANGE EVERYTHING! 🔥
$XRP is back in the spotlight as investors look ahead to the next major crypto rally. But can XRP really climb to $5, or is that target too ambitious for this cycle?
📈 Bullish Scenario: If buying pressure strengthens, market sentiment turns positive, and capital flows back into altcoins, XRP could gain significant momentum toward higher price levels.
📉 Bearish Scenario: If the market weakens or buyers lose momentum, XRP could face pullbacks and struggle to maintain its gains.
🎯 My Take: The $5 target is an interesting bull-run possibility, but it will require strong demand and sustained market momentum. Watch key support and resistance levels instead of relying on hype alone.
💬 XRP ARMY, LET’S TALK!
🔥 Bullish target: $5
📈 Moderate target: $3–$4
⚠️ Bearish scenario: Further downside if market conditions deteriorate
What’s your realistic XRP target for the next bull run?
#XRP #Ripple #CryptoMarket #AltcoinSeason #BullRun #CryptoTrading
⚠️ NFA. These are hypothetical scenarios, not guaranteed price predictions. Always manage risk and do your own research.
4

·
--
Ver tradução
Bitcoin ($BTC): Currently navigating around $88,000–$91,000 as market liquidity shifts. Investors are watching macroeconomic signals and interest rate expectations closely as BTC consolidated after recent highs.
Ripple ($XRP): Consolidating around $1.30. Ripple's enterprise expansion—highlighted by its RLUSD stablecoin integration with Coinbase—continues to reinforce utility, though $XRP faces strong short-term resistance levels.
$BTC #BitcoinCore32.1RaisesPeerConnectionLimit $XRP #Xrp🔥🔥
Bitcoin ($BTC ): Currently navigating around $88,000–$91,000 as market liquidity shifts. Investors are watching macroeconomic signals and interest rate expectations closely as BTC consolidated after recent highs.
Ripple ($XRP ): Consolidating around $1.30. Ripple's enterprise expansion—highlighted by its RLUSD stablecoin integration with Coinbase—continues to reinforce utility, though $XRP faces strong short-term resistance levels.
$BTC #BitcoinCore32.1RaisesPeerConnectionLimit $XRP #Xrp🔥🔥
Ripple ($XRP ): Consolidating around $1.30. Ripple's enterprise expansion—highlighted by its RLUSD stablecoin integration with Coinbase—continues to reinforce utility, though $XRP faces strong short-term resistance levels.
$BTC #BitcoinCore32.1RaisesPeerConnectionLimit $XRP #Xrp🔥🔥
25
·
--
Ver tradução
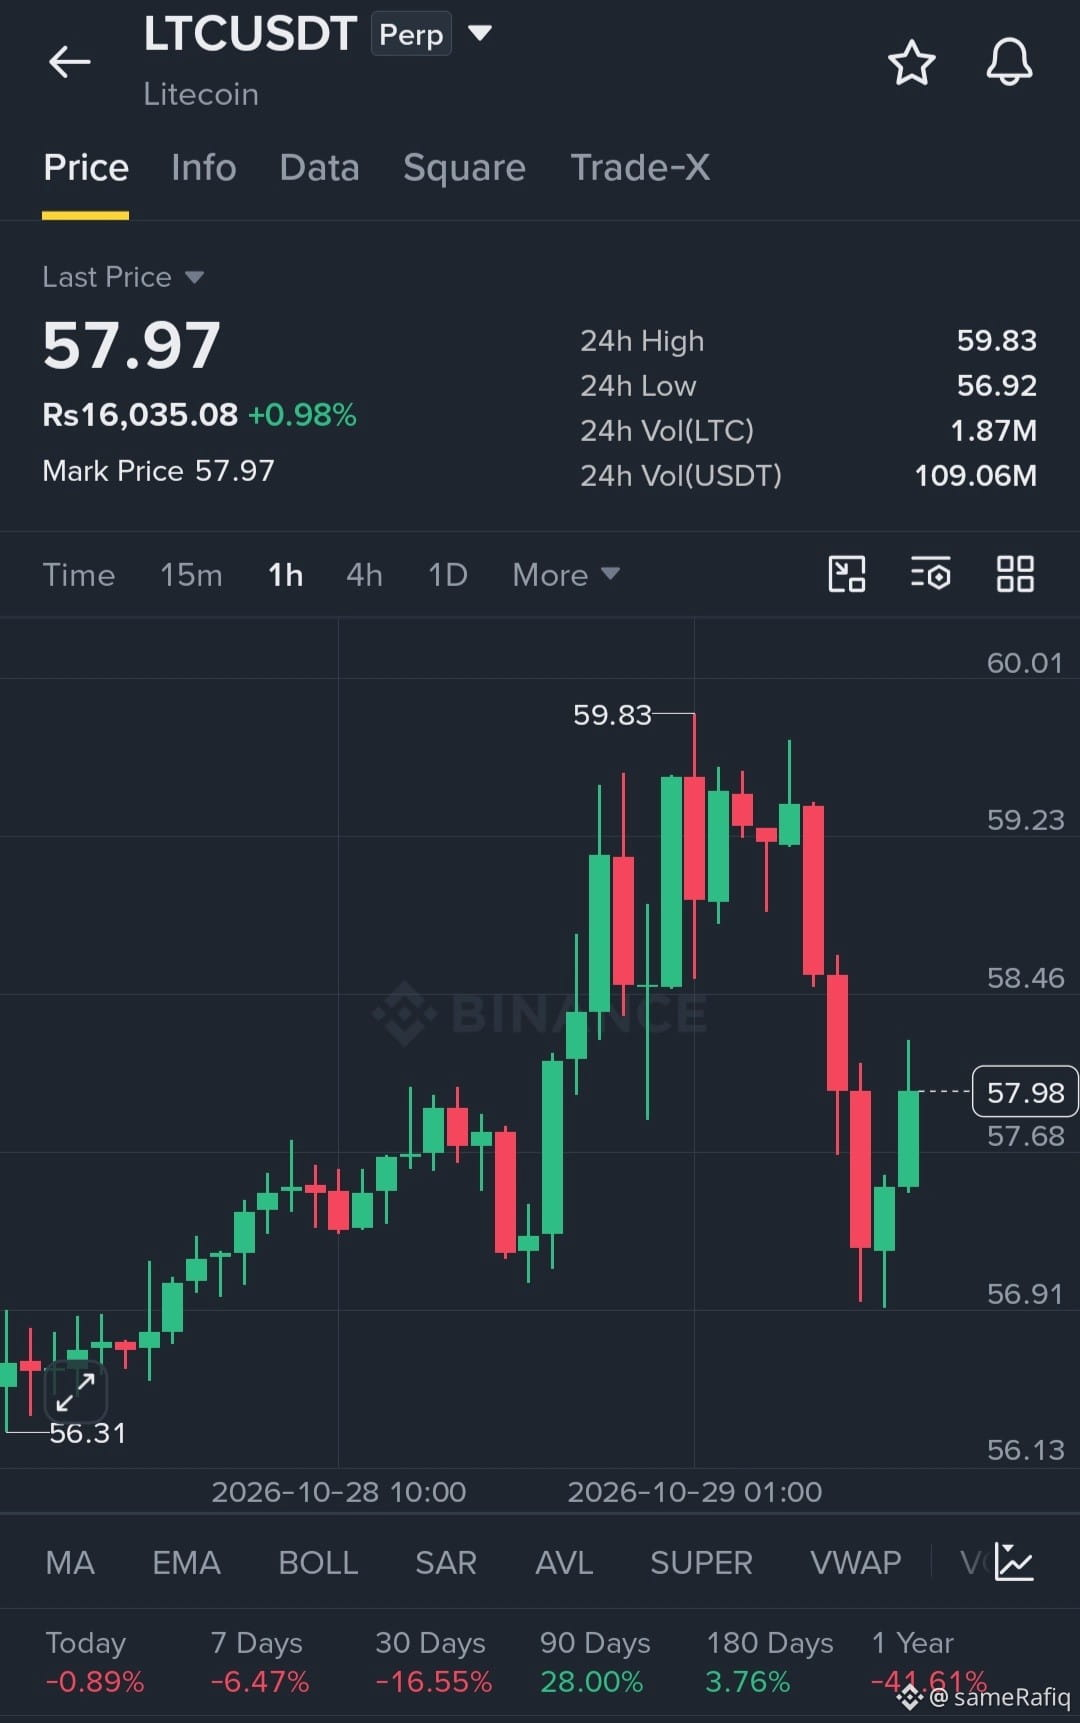
$LTC LONG SETUP — BULLS LOOK READY FOR A REBOUND!
LTC swept below $57 and is attempting to recover. Buyers need to reclaim resistance to confirm further upside.
Entry Zone: $57.77 – $58.06
TP1: $60.72
TP2: $62.96
Stop Loss: $56.04
$LTC
{spot}(LTCUSDT)
#CanMicrosoftDeliverOnAI #CanGoogleDefindItsCore #FedWatch #BitcoinCore32.1RaisesPeerConnectionLimit #EarningsSeason
$LTC LONG SETUP — BULLS LOOK READY FOR A REBOUND!
LTC swept below $57 and is attempting to recover. Buyers need to reclaim resistance to confirm further upside.
Entry Zone: $57.77 – $58.06
TP1: $60.72
TP2: $62.96
Stop Loss: $56.04
$LTC
#CanMicrosoftDeliverOnAI #CanGoogleDefindItsCore #FedWatch #BitcoinCore32.1RaisesPeerConnectionLimit #EarningsSeason
1
10


·
--
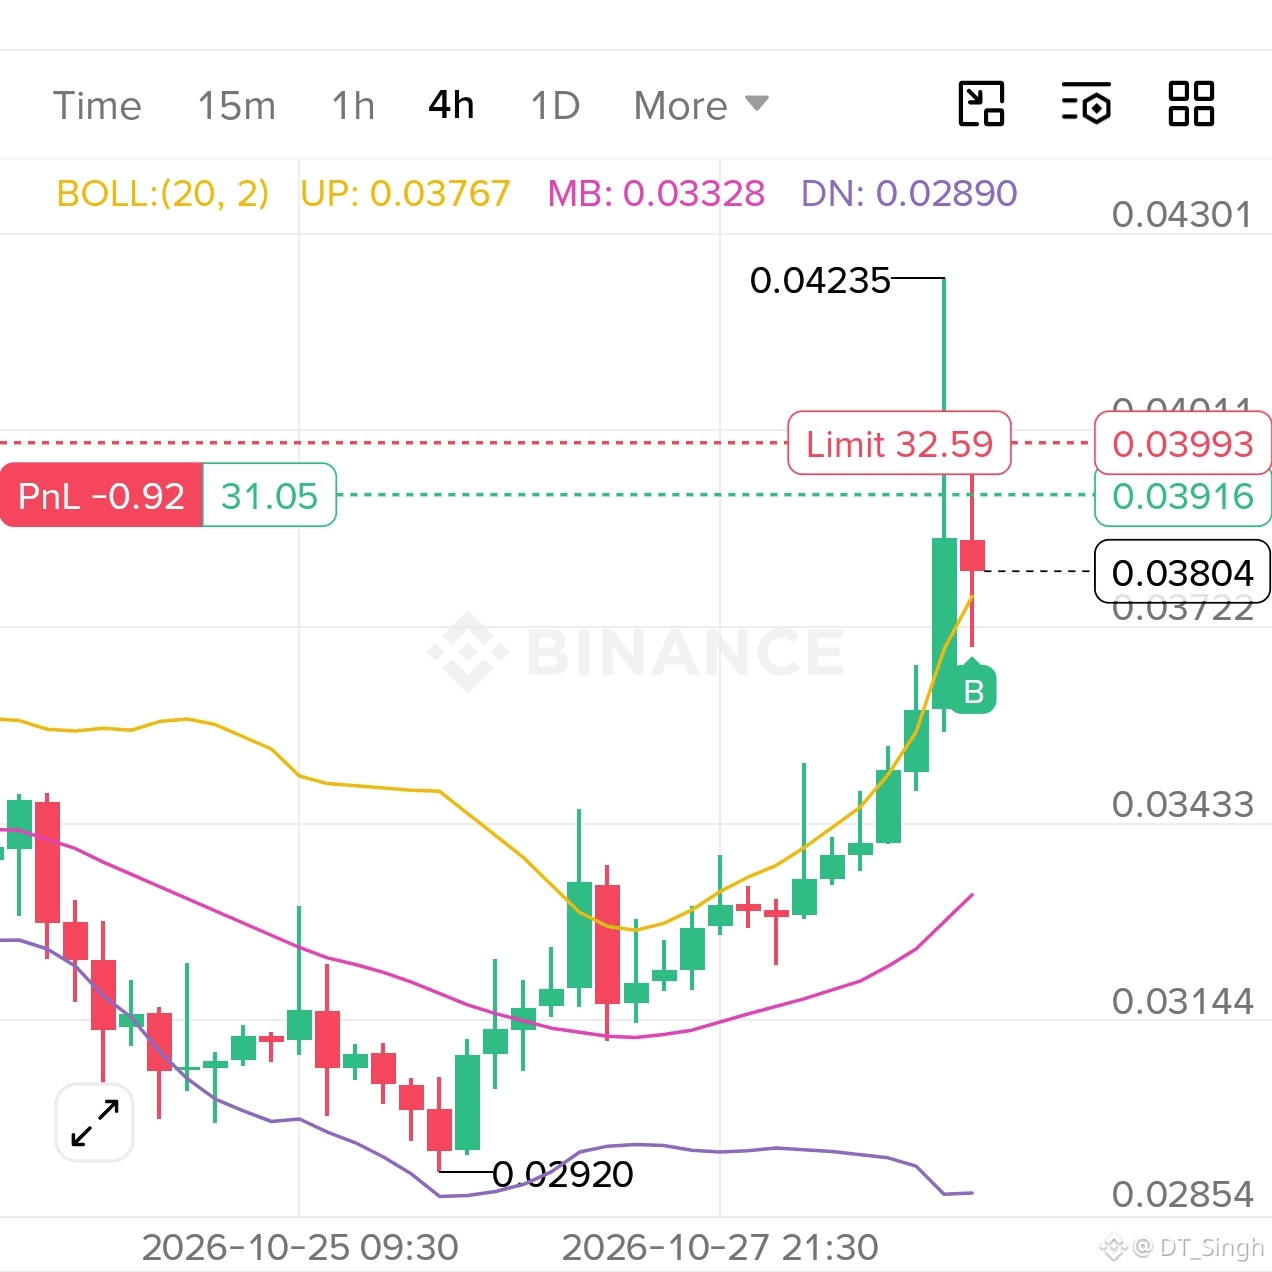
$STAR está em alta de 12,88% hoje, cotado a 0,03804, pouco abaixo da máxima de 24h de 0,04235
Níveis do gráfico que estou acompanhando
🔴 Resistência: 0,0423 – 0,0430 (máxima de 24h, onde se formou a longa sombra superior)
🟢 Suporte: 0,0372 – 0,0343 (zona de rompimento recente)
🟡 Nível-chave: 0,0329 (linha média do BOLL)
O gráfico de 4h mostra uma forte alta a partir de 0,0292, com um candle vertical acentuado perto do topo
O candle mais recente está vermelho, então os vendedores estão entrando perto das máximas
Contexto: +10,23% em 7 dias e +3,71% em 30 dias, mas -54,71% em 90 dias. O volume continua baixo (9,95M USDT em 24h), então os movimentos podem ser bruscos
Um fechamento firme acima de 0,0423 seria um sinal de alta. Perder 0,0343 pode levar a uma correção mais profunda
Você está entrando nesse rompimento ou esperando uma queda? 👇
#CanMicrosoftDeliverOnAI #FedWatch #EarningsSeason #BitcoinCore32.1RaisesPeerConnectionLimit
Observação baseada apenas no gráfico; isto não é aconselhamento financeiro. NFA, gerencie seu próprio risco
258

·
--
Ver tradução
$CELO
{future}(CELOUSDT)
is with 6.15M in reported activity in the provided snapshot. Celo focuses on blockchain infrastructure for stablecoin payments and global finance, giving its ecosystem a practical use case beyond speculative trading.
The important distinction is between network usage and token demand. Growing payment activity can strengthen the ecosystem, but price recovery still depends on buyers entering the market and defending important levels.
EP: 0.07850–0.07940
TP1: 0.08050
TP2: 0.08200
TP3: 0.08400
SL: 0.07720
I would monitor stablecoin transaction activity, spot volume, open interest, and whether CELO can reclaim nearby resistance without immediately losing momentum. A stronger price structure supported by sustained buying would be more meaningful than a brief bounce.
The next signal is whether CELO can establish a higher low while payment-network activity continues to support its longer-term utility.
#BitcoinCore32.1RaisesPeerConnectionLimit
$CELO
is with 6.15M in reported activity in the provided snapshot. Celo focuses on blockchain infrastructure for stablecoin payments and global finance, giving its ecosystem a practical use case beyond speculative trading.
The important distinction is between network usage and token demand. Growing payment activity can strengthen the ecosystem, but price recovery still depends on buyers entering the market and defending important levels.
EP: 0.07850–0.07940
TP1: 0.08050
TP2: 0.08200
TP3: 0.08400
SL: 0.07720
I would monitor stablecoin transaction activity, spot volume, open interest, and whether CELO can reclaim nearby resistance without immediately losing momentum. A stronger price structure supported by sustained buying would be more meaningful than a brief bounce.
The next signal is whether CELO can establish a higher low while payment-network activity continues to support its longer-term utility.
#BitcoinCore32.1RaisesPeerConnectionLimit
9
·
--
Ver tradução
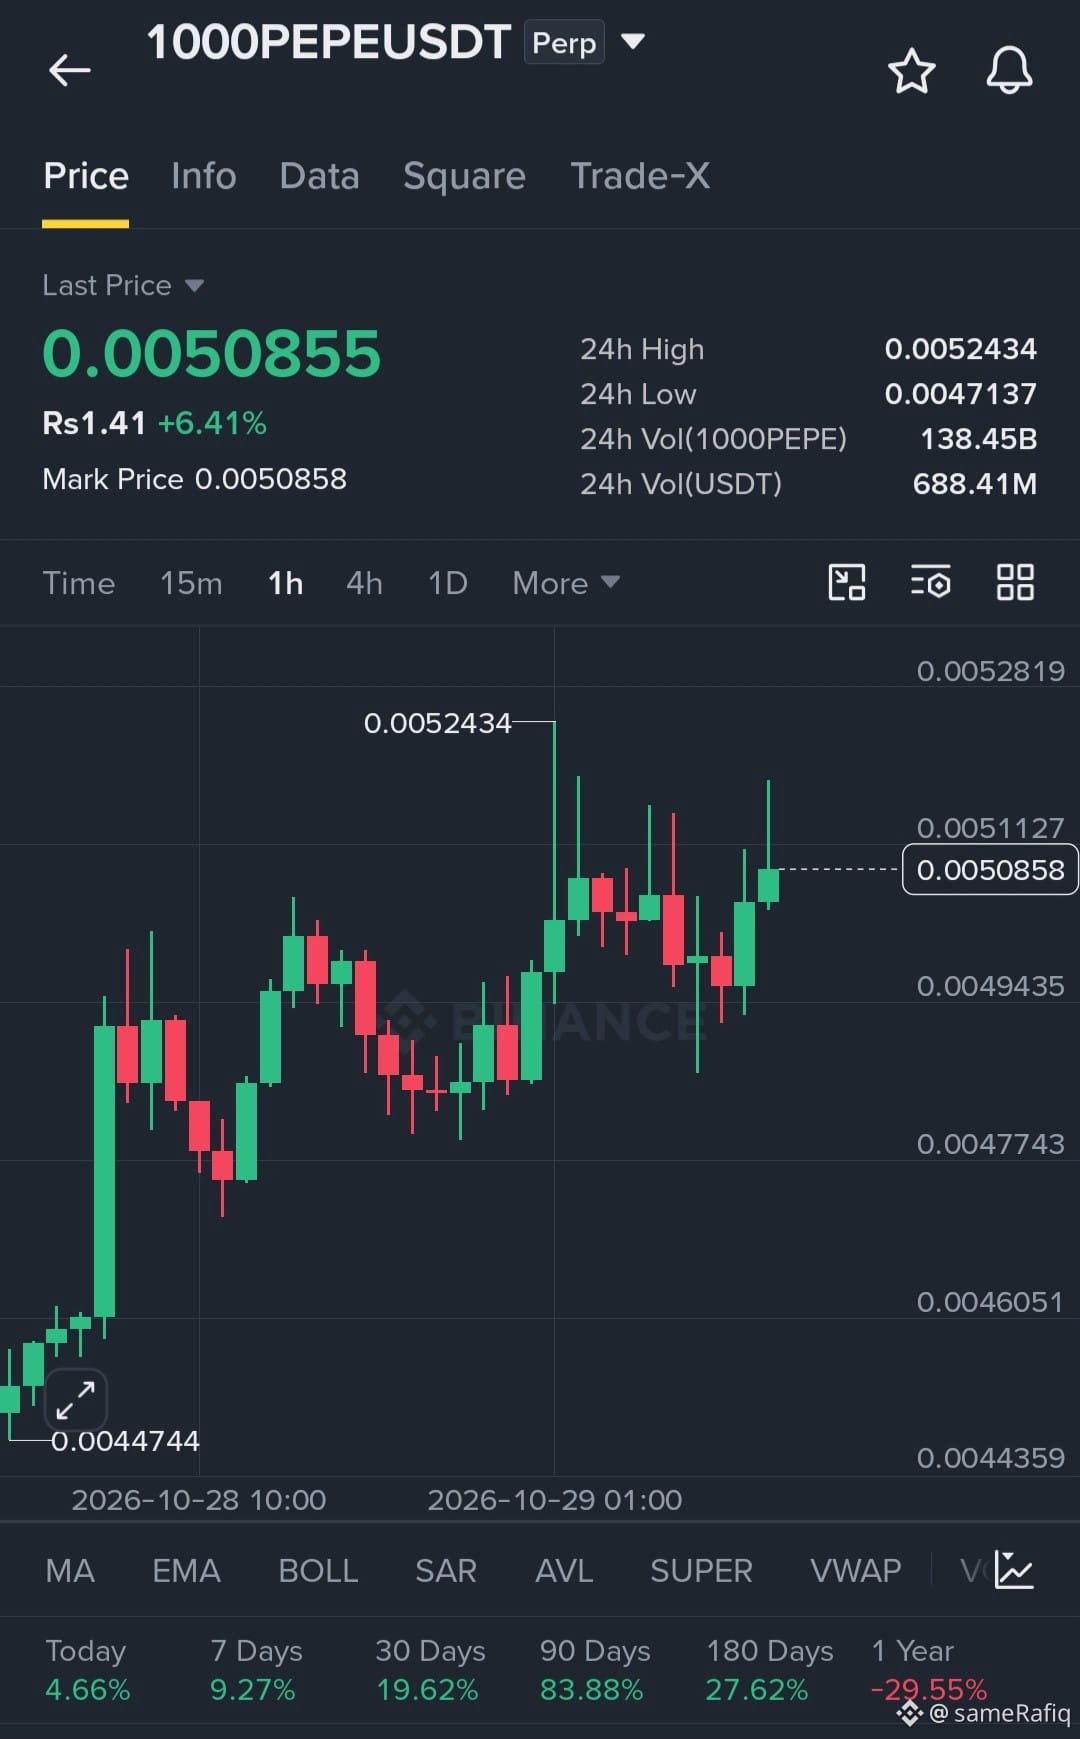
$1000PEPE LONG SETUP — FROG BULLS EYEING A BOUNCE!
$1000PEPE is approaching a potential recovery zone, with bulls looking to push price toward higher resistance levels.
Entry Zone: 0.0050184 – 0.0050802
TP1: 0.0052743
TP2: 0.0054543
Stop Loss: 0.0048678
$1000PEPE
{future}(1000PEPEUSDT)
#CanMicrosoftDeliverOnAI #CanGoogleDefindItsCore #FedWatch #BitcoinCore32.1RaisesPeerConnectionLimit #EarningsSeason
$1000PEPE LONG SETUP — FROG BULLS EYEING A BOUNCE!
$1000PEPE is approaching a potential recovery zone, with bulls looking to push price toward higher resistance levels.
Entry Zone: 0.0050184 – 0.0050802
TP1: 0.0052743
TP2: 0.0054543
Stop Loss: 0.0048678
$1000PEPE
#CanMicrosoftDeliverOnAI #CanGoogleDefindItsCore #FedWatch #BitcoinCore32.1RaisesPeerConnectionLimit #EarningsSeason
GUERRERO INMORTAL:
😉
1
23
·
--
Ver tradução
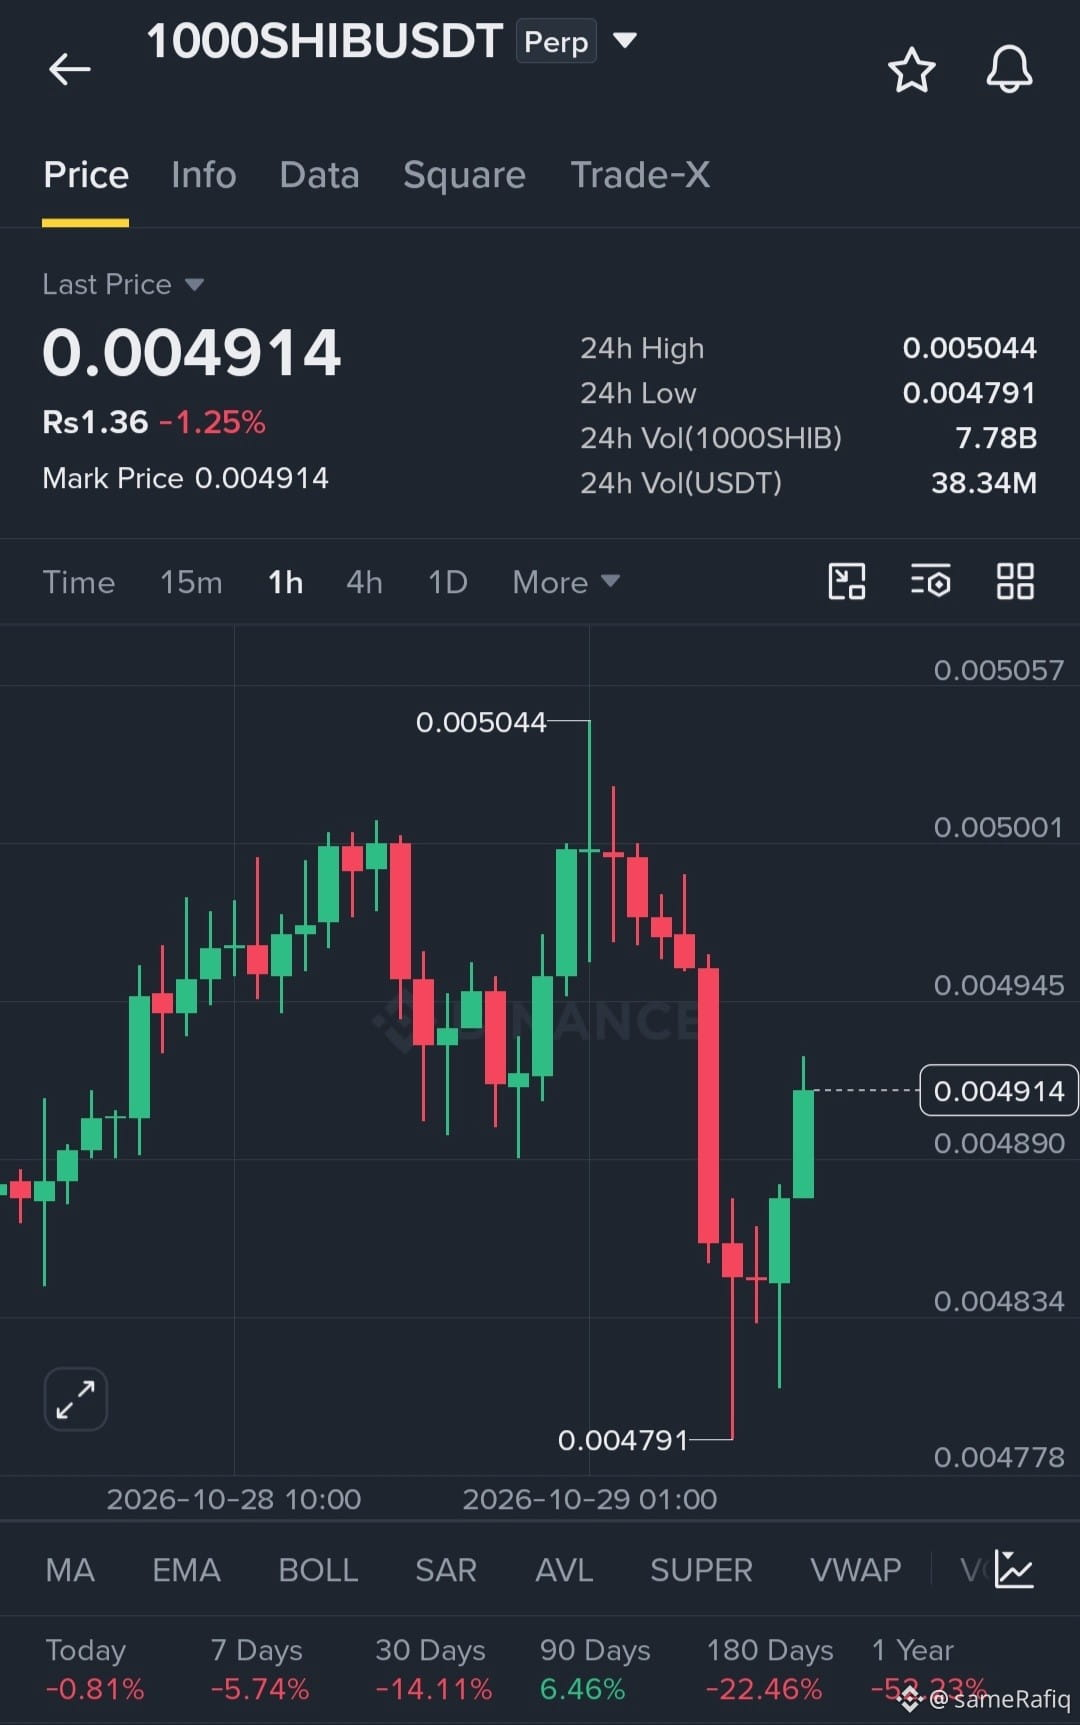
$1000SHIB LONG SETUP — BULLS ARE FIGHTING BACK!
SHIB is bouncing from the lows, with buyers eyeing a potential recovery toward local highs.
Entry: 0.004890 – 0.004915
TP1: 0.005139
TP2: 0.005328
Stop Loss: 0.004743
$1000SHIB
{future}(1000SHIBUSDT)
#CanMicrosoftDeliverOnAI #CanGoogleDefindItsCore #FedWatch #BitcoinCore32.1RaisesPeerConnectionLimit #EarningsSeason
.
$1000SHIB LONG SETUP — BULLS ARE FIGHTING BACK!
SHIB is bouncing from the lows, with buyers eyeing a potential recovery toward local highs.
Entry: 0.004890 – 0.004915
TP1: 0.005139
TP2: 0.005328
Stop Loss: 0.004743
$1000SHIB
#CanMicrosoftDeliverOnAI #CanGoogleDefindItsCore #FedWatch #BitcoinCore32.1RaisesPeerConnectionLimit #EarningsSeason
.
SHIB is bouncing from the lows, with buyers eyeing a potential recovery toward local highs.
Entry: 0.004890 – 0.004915
TP1: 0.005139
TP2: 0.005328
Stop Loss: 0.004743
$1000SHIB
#CanMicrosoftDeliverOnAI #CanGoogleDefindItsCore #FedWatch #BitcoinCore32.1RaisesPeerConnectionLimit #EarningsSeason
.
16
Inicia sessão para explorar mais conteúdos
Junta-te a utilizadores de criptomoedas de todo o mundo na Binance Square
⚡️ Obtém informações úteis e recentes sobre criptomoedas.
💬 Com a confiança da maior exchange de criptomoedas do mundo.
👍 Descobre perspetivas reais de criadores verificados.
E-mail/Número de telefone
Tópicos em Tendência
1
#CanMicrosoftDeliverOnAI
610,435 visualizações
3,963 a discutir
2
#CanGoogleDefindItsCore
374,692 visualizações
2,809 a discutir
3
#FedWatch
16.1M visualizações
37,127 a discutir
4
#BitcoinCore32.1RaisesPeerConnectionLimit
887 visualizações
36 a discutir
5
#EarningsSeason
6.1M visualizações
30,206 a discutir
6
#BitcoinCoreIdentifiesThreeVulnerabilities
10,609 visualizações
204 a discutir
7
#RippleExpects$900MAnnualizedProductRevenueRunRate
855 visualizações
10 a discutir
8
#GoogleToPreviewCryptoCustodySecuritySystem
3,084 visualizações
82 a discutir
9
#FedToBeginShrinkingRateSettingCalendarIn2027
4,111 visualizações
54 a discutir
10
#StrategyShareholdersApproveDailyDividends
3,888 visualizações
76 a discutir