🔍 BEHIND THE PUMP: WHAT REALLY DROVE BITCOIN’S RALLY ABOVE $80K? 💎🚀
Bitcoin’s massive surge from the mid-$60,000s to over $81,500 was one of its sharpest weekly rallies in recent history! But was it just high-leverage speculation, or real spot market demand?
New data from DeFiLlama and Binance Research reveals clear structural metrics behind the move:
📌 KEY BREAKOUT METRICS:
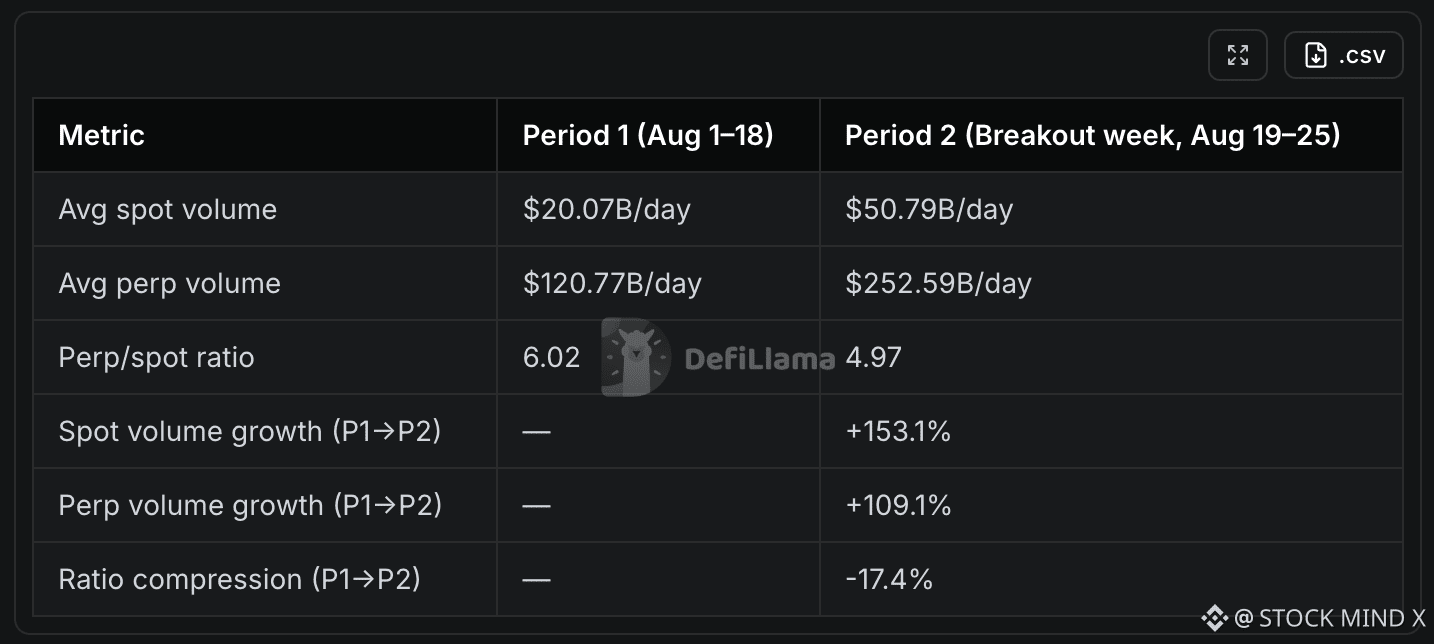
🟢 Spot Volume Outpaced Perpetuals: Average daily spot volume surged +153.1% (reaching $50.79B/day), while perpetual volume grew +109.1%. The perp/spot volume ratio compressed by -17.4%, proving that spot buying led the momentum.
🔻 Declining Leverage: Even as BTC price skyrocketed, perpetual open interest measured in BTC actually fell -8.5% (from 341k BTC to 312k BTC), showing long positions were taking profits rather than over-leveraging.
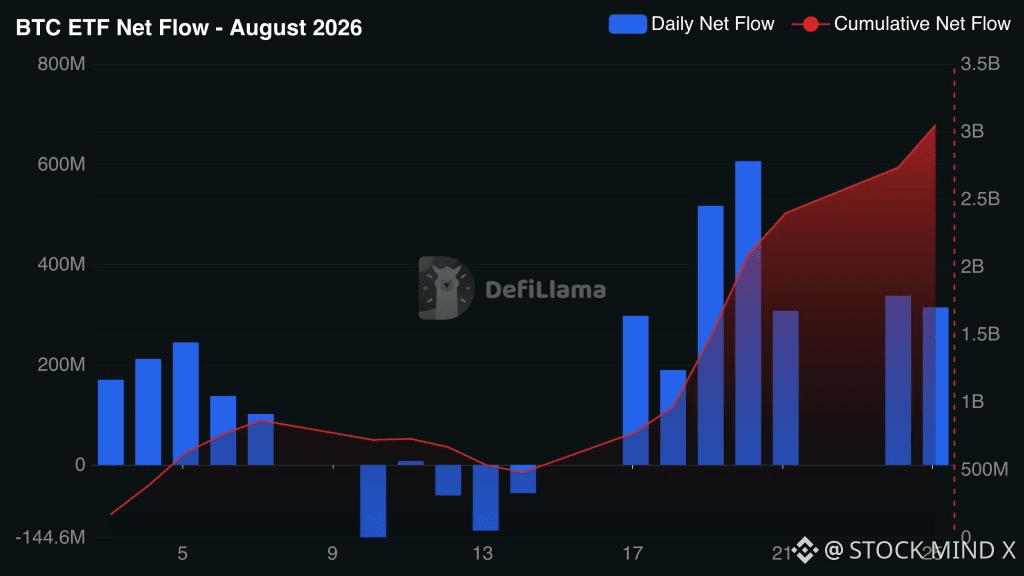
🏦 Record ETF Accumulation: U.S. Spot BTC ETFs reversed early outflows to post $3.52 Billion in net inflows for August—including 9 consecutive days of green flows!
🔶 Binance Dominance: Binance captured 46% of total spot volume among all tracked centralized exchanges, with daily spot trading jumping +188% to $13.69 Billion.
📈 TradFi to Crypto Shift: Binance users holding both equities and crypto increased their digital asset allocation from 64% to 72% over the breakout period.
💡 THE BOTTOM LINE: When spot volume and ETF inflows outpace derivatives growth, it signals organic, institutional-driven demand rather than a fragile leverage bubble.
How are you positioning your portfolio as BTC consolidates above $80K? Are you spot accumulating or trading the range? 💬👇
🔔 Follow for daily market analytics, institutional flow updates, and deep-dive crypto insights! 📊⚡
#bitcoin #BTC #Binance #CryptoMarket #DeFiLlama $BTC
Bitcoin’s massive surge from the mid-$60,000s to over $81,500 was one of its sharpest weekly rallies in recent history! But was it just high-leverage speculation, or real spot market demand?
New data from DeFiLlama and Binance Research reveals clear structural metrics behind the move:
📌 KEY BREAKOUT METRICS:
🟢 Spot Volume Outpaced Perpetuals: Average daily spot volume surged +153.1% (reaching $50.79B/day), while perpetual volume grew +109.1%. The perp/spot volume ratio compressed by -17.4%, proving that spot buying led the momentum.
🔻 Declining Leverage: Even as BTC price skyrocketed, perpetual open interest measured in BTC actually fell -8.5% (from 341k BTC to 312k BTC), showing long positions were taking profits rather than over-leveraging.
🏦 Record ETF Accumulation: U.S. Spot BTC ETFs reversed early outflows to post $3.52 Billion in net inflows for August—including 9 consecutive days of green flows!
🔶 Binance Dominance: Binance captured 46% of total spot volume among all tracked centralized exchanges, with daily spot trading jumping +188% to $13.69 Billion.
📈 TradFi to Crypto Shift: Binance users holding both equities and crypto increased their digital asset allocation from 64% to 72% over the breakout period.
💡 THE BOTTOM LINE: When spot volume and ETF inflows outpace derivatives growth, it signals organic, institutional-driven demand rather than a fragile leverage bubble.
How are you positioning your portfolio as BTC consolidates above $80K? Are you spot accumulating or trading the range? 💬👇
🔔 Follow for daily market analytics, institutional flow updates, and deep-dive crypto insights! 📊⚡
#bitcoin #BTC #Binance #CryptoMarket #DeFiLlama $BTC