

Smart Crypto Media
1.3k Publicações

Smart Crypto Media
Denunciar
Bloquear Utilizador
Smart Crypto Media:Your go-to source for the latest in crypto news, market analysis, trends, blockchain insights, and Web3 education.Stay informed, trade smart
Aberto ao trading
Trader Frequente
2.3 ano(s)
346 A seguir
3.5K+ Seguidores
6.8K+ Gostaram
Publicações
Portfólio
Tudo
Cotações
Vídeos
Em direto
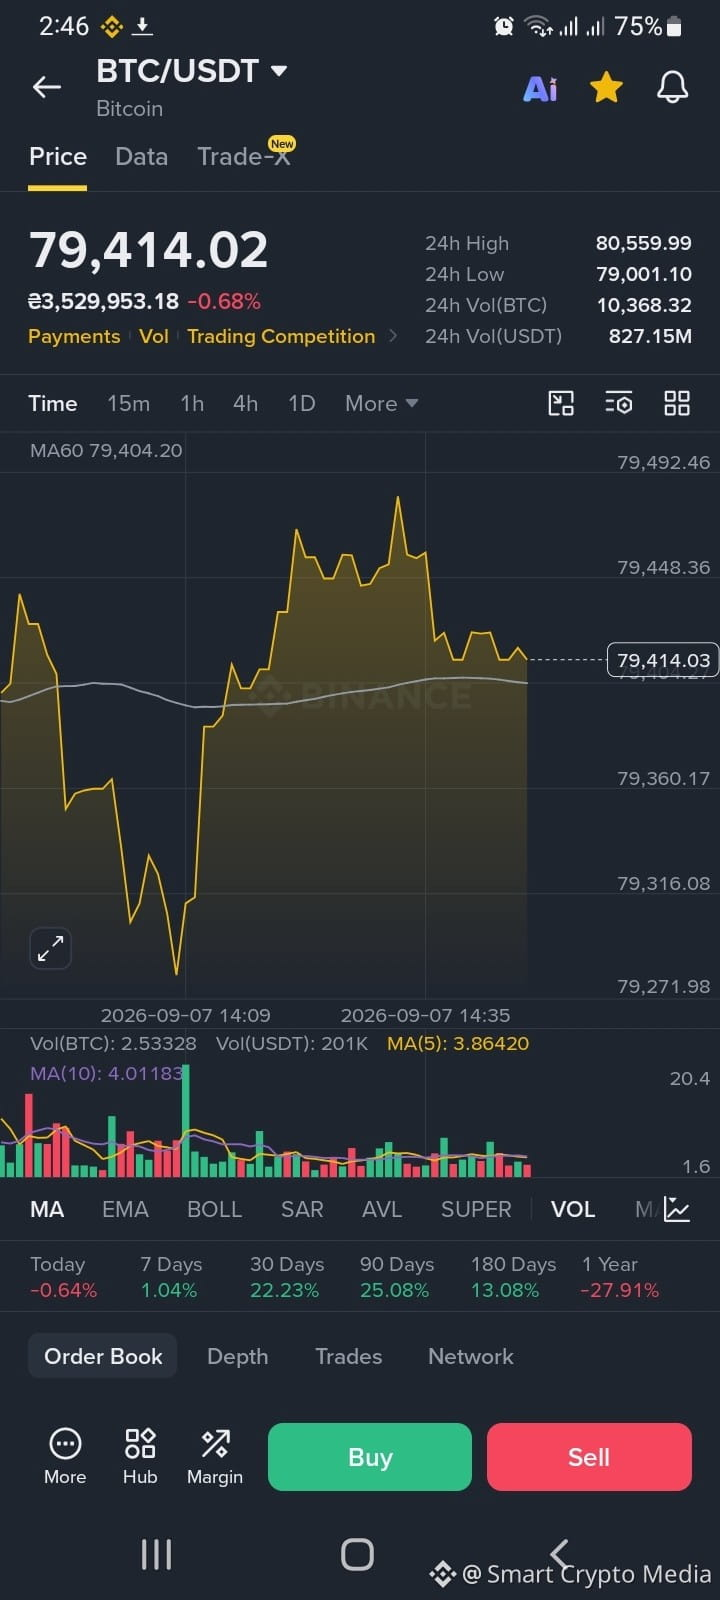
$BTC Mantenho abrindo o gráfico e não tenho certeza do que estou procurando mais.
79.414. Ok. Um pouco para baixo. Muita alta em relação ao mês passado. Ainda muito abaixo de onde estava há um ano. Eu não... Eu não sei o que fazer com essa combinação, sinceramente.
O ganho de 30 dias é de 22%. Isso deveria fazer bem. Faz, meio que. Mas aí você afasta e vê -27% no ano, e é tipo — estamos comemorando estar sendo menos machucados? É isso que estamos fazendo?
Vigiei as velas de 15 minutos por tempo demais hoje. O preço ficava pairando naquela linha da MA60. 79.404 vs 79.414. Distantes por dez dólares. Parecia que o mercado estava prendendo a respiração. Ou talvez fosse eu.
O volume estava em torno de 10K BTC. Eu não tenho um contexto muito bom para saber se isso é muito ou pouco agora. Não parece urgente. Nada do dia de hoje parece urgente, o que talvez seja a parte mais perturbadora. Tipo — a calma antes de alguma coisa, ou só... calma.
A variação de 7 dias mal fica verde. Um por cento. A de 90 dias parece saudável, mas eu lembro como aqueles 90 dias realmente foram e "saudável" não é a palavra que eu usaria.
Acho que quero convicção mais do que quero uma direção. Só — algo em que eu possa me apoiar. Por enquanto, é tudo possibilidade. E eu estou cansado de possibilidades.
#writetoearn
$BTC Mantenho abrindo o gráfico e não tenho certeza do que estou procurando mais.
79.414. Ok. Um pouco para baixo. Muita alta em relação ao mês passado. Ainda muito abaixo de onde estava há um ano. Eu não... Eu não sei o que fazer com essa combinação, sinceramente.
O ganho de 30 dias é de 22%. Isso deveria fazer bem. Faz, meio que. Mas aí você afasta e vê -27% no ano, e é tipo — estamos comemorando estar sendo menos machucados? É isso que estamos fazendo?
Vigiei as velas de 15 minutos por tempo demais hoje. O preço ficava pairando naquela linha da MA60. 79.404 vs 79.414. Distantes por dez dólares. Parecia que o mercado estava prendendo a respiração. Ou talvez fosse eu.
O volume estava em torno de 10K BTC. Eu não tenho um contexto muito bom para saber se isso é muito ou pouco agora. Não parece urgente. Nada do dia de hoje parece urgente, o que talvez seja a parte mais perturbadora. Tipo — a calma antes de alguma coisa, ou só... calma.
A variação de 7 dias mal fica verde. Um por cento. A de 90 dias parece saudável, mas eu lembro como aqueles 90 dias realmente foram e "saudável" não é a palavra que eu usaria.
Acho que quero convicção mais do que quero uma direção. Só — algo em que eu possa me apoiar. Por enquanto, é tudo possibilidade. E eu estou cansado de possibilidades.
#writetoearn
79.414. Ok. Um pouco para baixo. Muita alta em relação ao mês passado. Ainda muito abaixo de onde estava há um ano. Eu não... Eu não sei o que fazer com essa combinação, sinceramente.
O ganho de 30 dias é de 22%. Isso deveria fazer bem. Faz, meio que. Mas aí você afasta e vê -27% no ano, e é tipo — estamos comemorando estar sendo menos machucados? É isso que estamos fazendo?
Vigiei as velas de 15 minutos por tempo demais hoje. O preço ficava pairando naquela linha da MA60. 79.404 vs 79.414. Distantes por dez dólares. Parecia que o mercado estava prendendo a respiração. Ou talvez fosse eu.
O volume estava em torno de 10K BTC. Eu não tenho um contexto muito bom para saber se isso é muito ou pouco agora. Não parece urgente. Nada do dia de hoje parece urgente, o que talvez seja a parte mais perturbadora. Tipo — a calma antes de alguma coisa, ou só... calma.
A variação de 7 dias mal fica verde. Um por cento. A de 90 dias parece saudável, mas eu lembro como aqueles 90 dias realmente foram e "saudável" não é a palavra que eu usaria.
Acho que quero convicção mais do que quero uma direção. Só — algo em que eu possa me apoiar. Por enquanto, é tudo possibilidade. E eu estou cansado de possibilidades.
#writetoearn
214
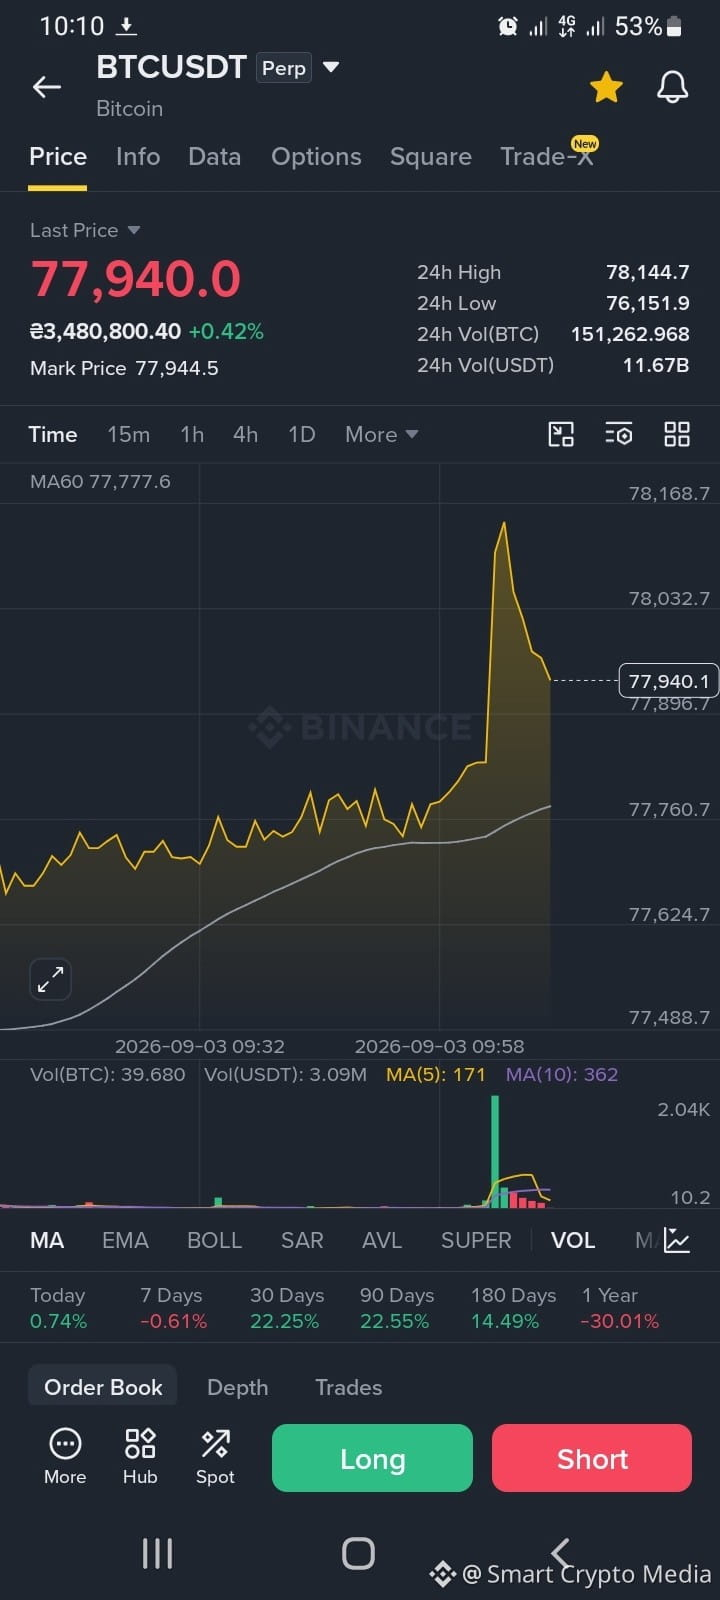
$BTC Tenho ficado encarando este gráfico nos últimos vinte minutos e ainda não sei o que fazer disso. O preço disparou até 78.168, meus alertas dispararam e, quando eu finalmente olhei para a tela, ele já tinha voltado para 77.940. Então — não aconteceu nada? Aconteceu alguma coisa? Difícil dizer.
O número que realmente chamou minha atenção não foi o pico; foi a coluna de um ano. Menos trinta por cento. Eu sempre esqueço que isso fica lá embaixo, por trás de todo o barulho do dia a dia. A gente fala em ganhos mensais de 22% como se fosse uma história de superação, e tecnicamente é, mas o quadro mais longo ainda está em vermelho. As duas coisas são verdade ao mesmo tempo e eu não acho que o Crypto Twitter seja feito para você segurar dois fatos contraditórios na cabeça de uma vez.
Não tenho uma leitura clara aqui. A MA60 fica logo abaixo do preço, o que normalmente eu leria como algo levemente construtivo, mas depois de ver esse pico evaporar em tempo real, estou menos confiante do que eu estava há uma hora. Talvez essa seja a postagem honesta de hoje — não um chamado, só uma admissão de que o gráfico parecia mais decisivo à distância do que parece de perto. Curioso se alguém mais viu aquela mesma vela e sentiu a mesma sensação de "espera, é só isso?".
#BTC #SmartCryptoMedia #writetoearn
$BTC Tenho ficado encarando este gráfico nos últimos vinte minutos e ainda não sei o que fazer disso. O preço disparou até 78.168, meus alertas dispararam e, quando eu finalmente olhei para a tela, ele já tinha voltado para 77.940. Então — não aconteceu nada? Aconteceu alguma coisa? Difícil dizer.
O número que realmente chamou minha atenção não foi o pico; foi a coluna de um ano. Menos trinta por cento. Eu sempre esqueço que isso fica lá embaixo, por trás de todo o barulho do dia a dia. A gente fala em ganhos mensais de 22% como se fosse uma história de superação, e tecnicamente é, mas o quadro mais longo ainda está em vermelho. As duas coisas são verdade ao mesmo tempo e eu não acho que o Crypto Twitter seja feito para você segurar dois fatos contraditórios na cabeça de uma vez.
Não tenho uma leitura clara aqui. A MA60 fica logo abaixo do preço, o que normalmente eu leria como algo levemente construtivo, mas depois de ver esse pico evaporar em tempo real, estou menos confiante do que eu estava há uma hora. Talvez essa seja a postagem honesta de hoje — não um chamado, só uma admissão de que o gráfico parecia mais decisivo à distância do que parece de perto. Curioso se alguém mais viu aquela mesma vela e sentiu a mesma sensação de "espera, é só isso?".
#BTC #SmartCryptoMedia #writetoearn
O número que realmente chamou minha atenção não foi o pico; foi a coluna de um ano. Menos trinta por cento. Eu sempre esqueço que isso fica lá embaixo, por trás de todo o barulho do dia a dia. A gente fala em ganhos mensais de 22% como se fosse uma história de superação, e tecnicamente é, mas o quadro mais longo ainda está em vermelho. As duas coisas são verdade ao mesmo tempo e eu não acho que o Crypto Twitter seja feito para você segurar dois fatos contraditórios na cabeça de uma vez.
Não tenho uma leitura clara aqui. A MA60 fica logo abaixo do preço, o que normalmente eu leria como algo levemente construtivo, mas depois de ver esse pico evaporar em tempo real, estou menos confiante do que eu estava há uma hora. Talvez essa seja a postagem honesta de hoje — não um chamado, só uma admissão de que o gráfico parecia mais decisivo à distância do que parece de perto. Curioso se alguém mais viu aquela mesma vela e sentiu a mesma sensação de "espera, é só isso?".
#BTC #SmartCryptoMedia #writetoearn
155
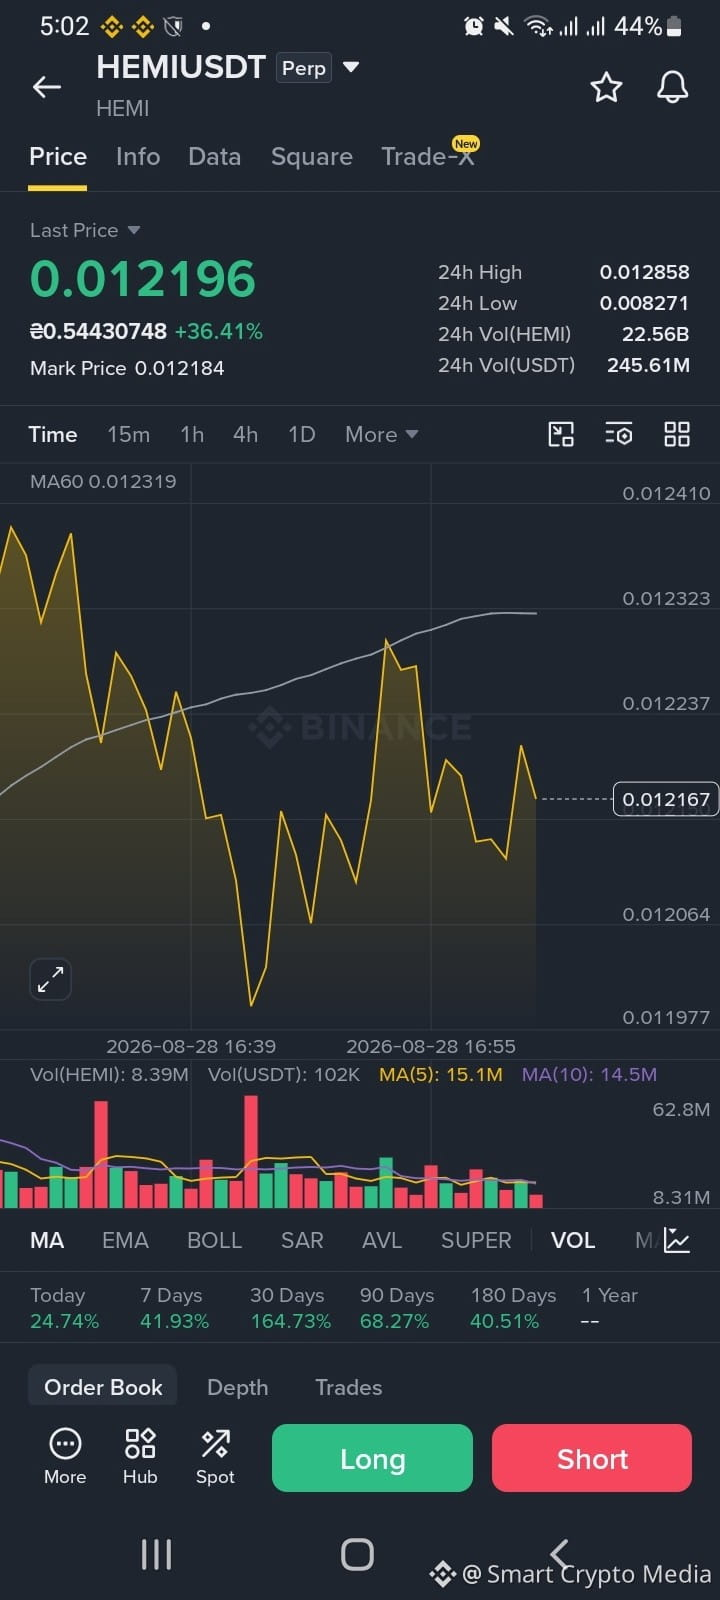
$HEMI Abri o gráfico e fiquei olhando só por um tempo.
HEMI está em algo como 0,012 depois de imprimir uma mínima perto de 0,008 antes. Velas verdes, depois vermelhas, e então verdes de novo. Os volumes ficam por toda parte. Parece familiar e, ao mesmo tempo, levemente fora do lugar.
Eu fico pensando no que o projeto realmente está tentando fazer. Segurança do Bitcoin mais ferramentas do Ethereum. Soa limpo quando você fala rápido. Aí você olha para o número de vezes que ideias parecidas aparecem e somem, e a confiança vai ficando mais fina.
Talvez essa aqui pegue. Talvez o hVM realmente mude a forma como as pessoas constroem. Ou talvez a gente só esteja vendo mais um ticker sendo repassado, enquanto o trabalho de infraestrutura de verdade acontece silenciosamente em algum outro lugar. Difícil dizer a partir de um gráfico de 15 minutos.
O ganho percentual impressiona até você lembrar o quão rápido esses números se invertem. Não sei se estou mais curioso ou mais cansado com esse padrão. Provavelmente os dois.
#HEMI #SmartCryptoMedia #writetoearn
$HEMI Abri o gráfico e fiquei olhando só por um tempo.
HEMI está em algo como 0,012 depois de imprimir uma mínima perto de 0,008 antes. Velas verdes, depois vermelhas, e então verdes de novo. Os volumes ficam por toda parte. Parece familiar e, ao mesmo tempo, levemente fora do lugar.
Eu fico pensando no que o projeto realmente está tentando fazer. Segurança do Bitcoin mais ferramentas do Ethereum. Soa limpo quando você fala rápido. Aí você olha para o número de vezes que ideias parecidas aparecem e somem, e a confiança vai ficando mais fina.
Talvez essa aqui pegue. Talvez o hVM realmente mude a forma como as pessoas constroem. Ou talvez a gente só esteja vendo mais um ticker sendo repassado, enquanto o trabalho de infraestrutura de verdade acontece silenciosamente em algum outro lugar. Difícil dizer a partir de um gráfico de 15 minutos.
O ganho percentual impressiona até você lembrar o quão rápido esses números se invertem. Não sei se estou mais curioso ou mais cansado com esse padrão. Provavelmente os dois.
#HEMI #SmartCryptoMedia #writetoearn
HEMI está em algo como 0,012 depois de imprimir uma mínima perto de 0,008 antes. Velas verdes, depois vermelhas, e então verdes de novo. Os volumes ficam por toda parte. Parece familiar e, ao mesmo tempo, levemente fora do lugar.
Eu fico pensando no que o projeto realmente está tentando fazer. Segurança do Bitcoin mais ferramentas do Ethereum. Soa limpo quando você fala rápido. Aí você olha para o número de vezes que ideias parecidas aparecem e somem, e a confiança vai ficando mais fina.
Talvez essa aqui pegue. Talvez o hVM realmente mude a forma como as pessoas constroem. Ou talvez a gente só esteja vendo mais um ticker sendo repassado, enquanto o trabalho de infraestrutura de verdade acontece silenciosamente em algum outro lugar. Difícil dizer a partir de um gráfico de 15 minutos.
O ganho percentual impressiona até você lembrar o quão rápido esses números se invertem. Não sei se estou mais curioso ou mais cansado com esse padrão. Provavelmente os dois.
#HEMI #SmartCryptoMedia #writetoearn
128
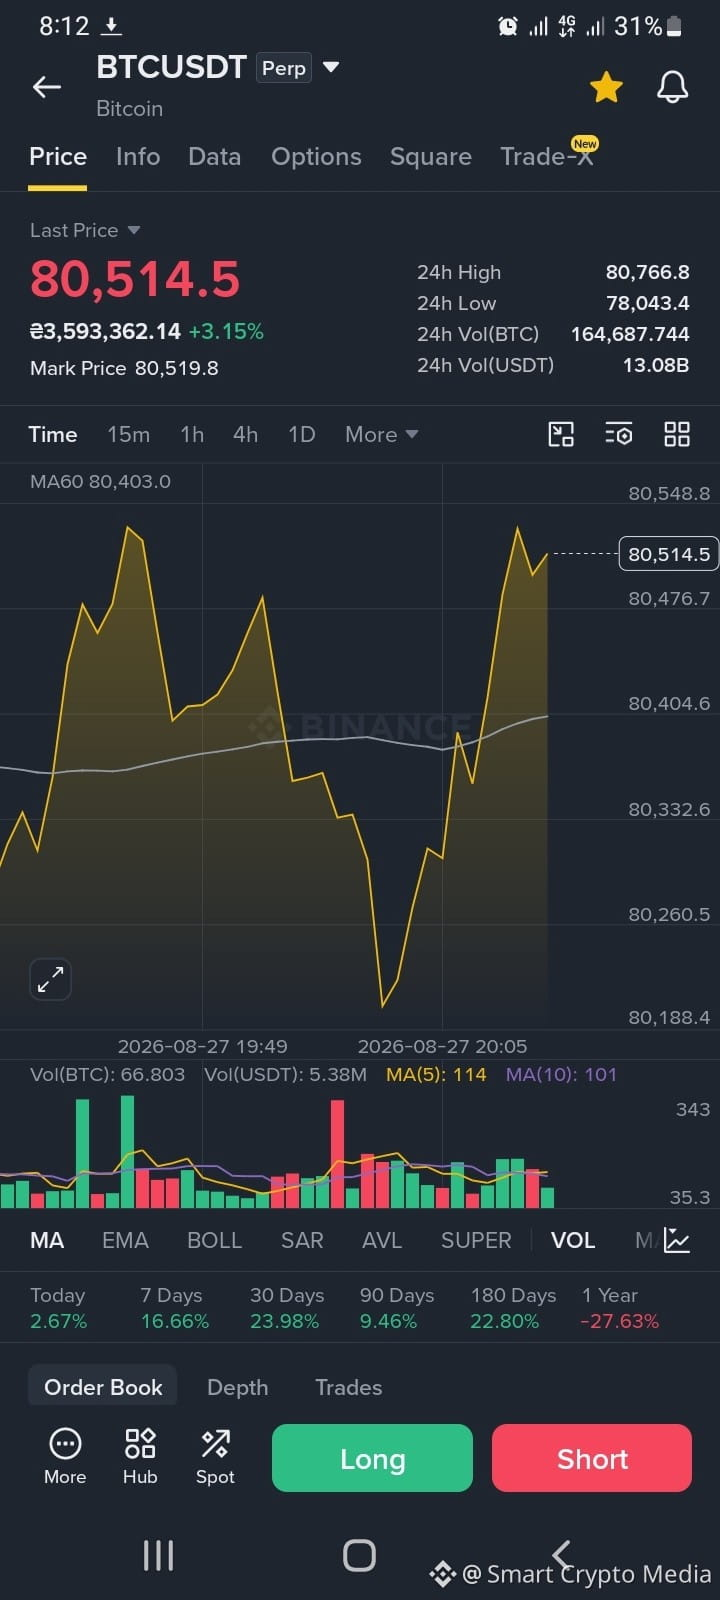
$BTC Tenho ficado encarando os gráficos hoje e, sinceramente, parece simplesmente exaustivo. Eu me lembro quando segurar BTC parecia fazer parte de algum experimento estranho de internet subterrânea. Havia energia nisso. Agora, eu abro meu app e parece olhar para um índice financeiro entediante.Maybe é isso mesmo que crescimento parece. Sucesso significa se tornar comum, eu acho. Mas às vezes eu sinto falta do caos. Agora é tudo sobre dados de CPI, entradas em ETF e o que algum banqueiro central diz em um púlpito. Parece que trocamos a alma do projeto por uma avaliação em fiat maior. E nem tenho certeza se foi um bom negócio. Às vezes eu penso se eu realmente ainda acredito nesse aspecto de futuro descentralizado, ou se eu só fiquei preso no hábito de checar meu celular a cada vinte minutos. A escassez ainda está no código, claro. Mas a mágica? Parece que foi corporatizada quando a gente não estava olhando. Mais uma linha em um balanço patrimonial institucional, e nós estamos todos apenas assistindo ela se mover meio de lado.
#Write2Earn!
$BTC Tenho ficado encarando os gráficos hoje e, sinceramente, parece simplesmente exaustivo. Eu me lembro quando segurar BTC parecia fazer parte de algum experimento estranho de internet subterrânea. Havia energia nisso. Agora, eu abro meu app e parece olhar para um índice financeiro entediante.Maybe é isso mesmo que crescimento parece. Sucesso significa se tornar comum, eu acho. Mas às vezes eu sinto falta do caos. Agora é tudo sobre dados de CPI, entradas em ETF e o que algum banqueiro central diz em um púlpito. Parece que trocamos a alma do projeto por uma avaliação em fiat maior. E nem tenho certeza se foi um bom negócio. Às vezes eu penso se eu realmente ainda acredito nesse aspecto de futuro descentralizado, ou se eu só fiquei preso no hábito de checar meu celular a cada vinte minutos. A escassez ainda está no código, claro. Mas a mágica? Parece que foi corporatizada quando a gente não estava olhando. Mais uma linha em um balanço patrimonial institucional, e nós estamos todos apenas assistindo ela se mover meio de lado.
#Write2Earn!
#Write2Earn!
110
$ETH voltou a ficar acima da sua tendência de curto prazo — mas o próximo movimento importa
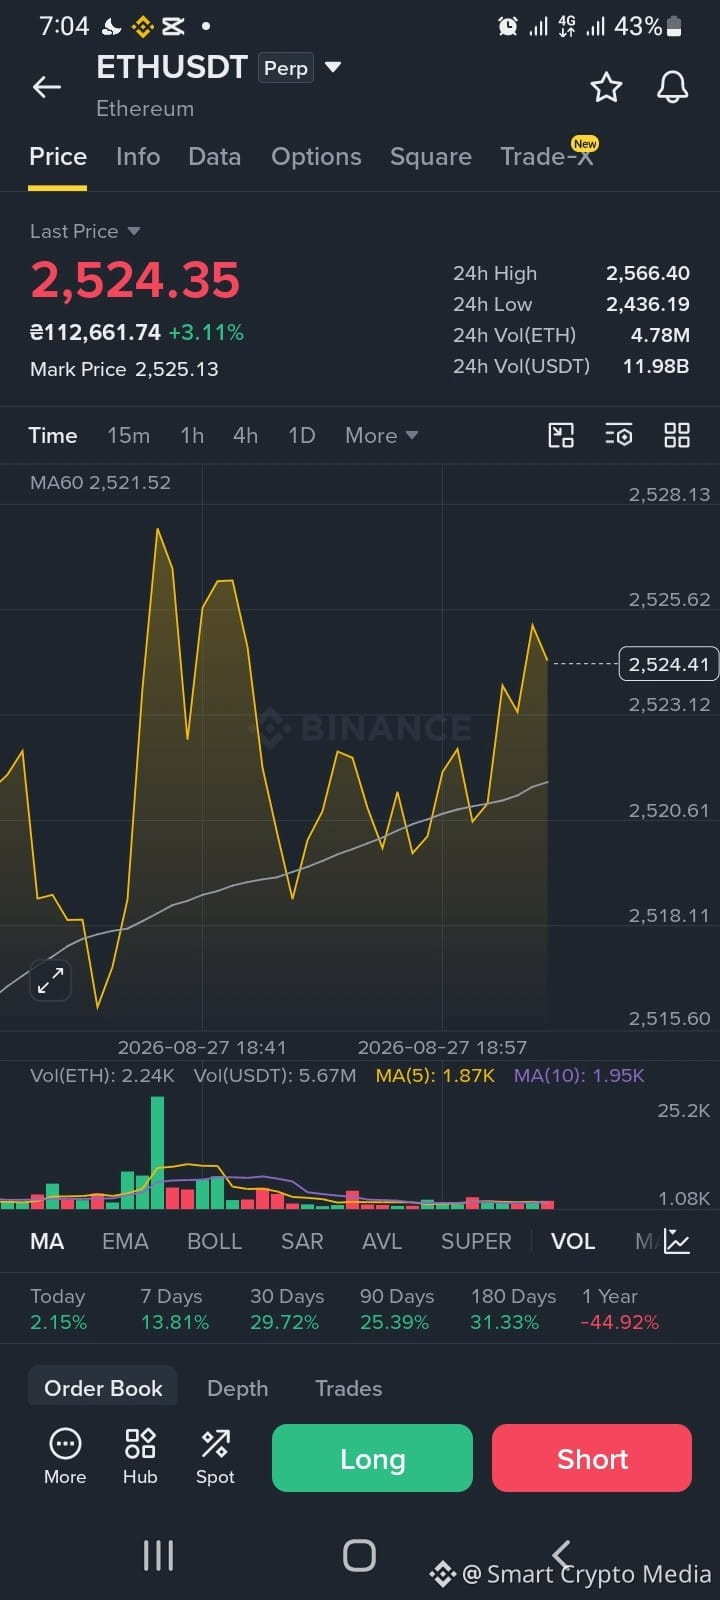
O Ethereum está sendo negociado por volta de US$ 2.524 na captura de tela, em alta de cerca de 3,1% no dia.
O que chama minha atenção não é apenas a vela verde.
No gráfico de 15 minutos, a ETH recuperou a MA60 em torno de US$ 2.521,5, colocando o preço ligeiramente acima da sua média de curto prazo. Isso dá ao gráfico uma estrutura melhor do que a que ele tinha durante a queda anterior na região de US$ 2.515.
Mas há outro detalhe que vale a pena observar.
A ETH já chegou a atingir US$ 2.566,40 hoje antes de recuar. Então o mercado mostrou que os vendedores ainda estão ativos acima do preço atual.
O perfil de volume também conta uma história interessante. Houve uma expansão clara do volume mais cedo, enquanto as velas recentes estão sendo negociadas com uma atividade bem mais leve.
Isso levanta uma pergunta simples:
Essa consolidação é antes de mais uma tentativa de alta, ou o impulso está começando a esfriar depois da recuperação?
Os números mais amplos também são intrigantes. Segundo a captura de tela, a ETH subiu cerca de 13,8% em 7 dias e quase 29,7% em 30 dias.
Portanto, o gráfico de curto prazo está melhorando, mas o preço está se aproximando de uma área onde as reações importam mais do que manchetes.
Você prefere ver a ETH romper US$ 2.566 primeiro, ou perder US$ 2.520?
#ETH #SmartCryptoMedia #writetoearn
$ETH voltou a ficar acima da sua tendência de curto prazo — mas o próximo movimento importa
O Ethereum está sendo negociado por volta de US$ 2.524 na captura de tela, em alta de cerca de 3,1% no dia.
O que chama minha atenção não é apenas a vela verde.
No gráfico de 15 minutos, a ETH recuperou a MA60 em torno de US$ 2.521,5, colocando o preço ligeiramente acima da sua média de curto prazo. Isso dá ao gráfico uma estrutura melhor do que a que ele tinha durante a queda anterior na região de US$ 2.515.
Mas há outro detalhe que vale a pena observar.
A ETH já chegou a atingir US$ 2.566,40 hoje antes de recuar. Então o mercado mostrou que os vendedores ainda estão ativos acima do preço atual.
O perfil de volume também conta uma história interessante. Houve uma expansão clara do volume mais cedo, enquanto as velas recentes estão sendo negociadas com uma atividade bem mais leve.
Isso levanta uma pergunta simples:
Essa consolidação é antes de mais uma tentativa de alta, ou o impulso está começando a esfriar depois da recuperação?
Os números mais amplos também são intrigantes. Segundo a captura de tela, a ETH subiu cerca de 13,8% em 7 dias e quase 29,7% em 30 dias.
Portanto, o gráfico de curto prazo está melhorando, mas o preço está se aproximando de uma área onde as reações importam mais do que manchetes.
Você prefere ver a ETH romper US$ 2.566 primeiro, ou perder US$ 2.520?
#ETH #SmartCryptoMedia #writetoearn
O Ethereum está sendo negociado por volta de US$ 2.524 na captura de tela, em alta de cerca de 3,1% no dia.
O que chama minha atenção não é apenas a vela verde.
No gráfico de 15 minutos, a ETH recuperou a MA60 em torno de US$ 2.521,5, colocando o preço ligeiramente acima da sua média de curto prazo. Isso dá ao gráfico uma estrutura melhor do que a que ele tinha durante a queda anterior na região de US$ 2.515.
Mas há outro detalhe que vale a pena observar.
A ETH já chegou a atingir US$ 2.566,40 hoje antes de recuar. Então o mercado mostrou que os vendedores ainda estão ativos acima do preço atual.
O perfil de volume também conta uma história interessante. Houve uma expansão clara do volume mais cedo, enquanto as velas recentes estão sendo negociadas com uma atividade bem mais leve.
Isso levanta uma pergunta simples:
Essa consolidação é antes de mais uma tentativa de alta, ou o impulso está começando a esfriar depois da recuperação?
Os números mais amplos também são intrigantes. Segundo a captura de tela, a ETH subiu cerca de 13,8% em 7 dias e quase 29,7% em 30 dias.
Portanto, o gráfico de curto prazo está melhorando, mas o preço está se aproximando de uma área onde as reações importam mais do que manchetes.
Você prefere ver a ETH romper US$ 2.566 primeiro, ou perder US$ 2.520?
#ETH #SmartCryptoMedia #writetoearn
466
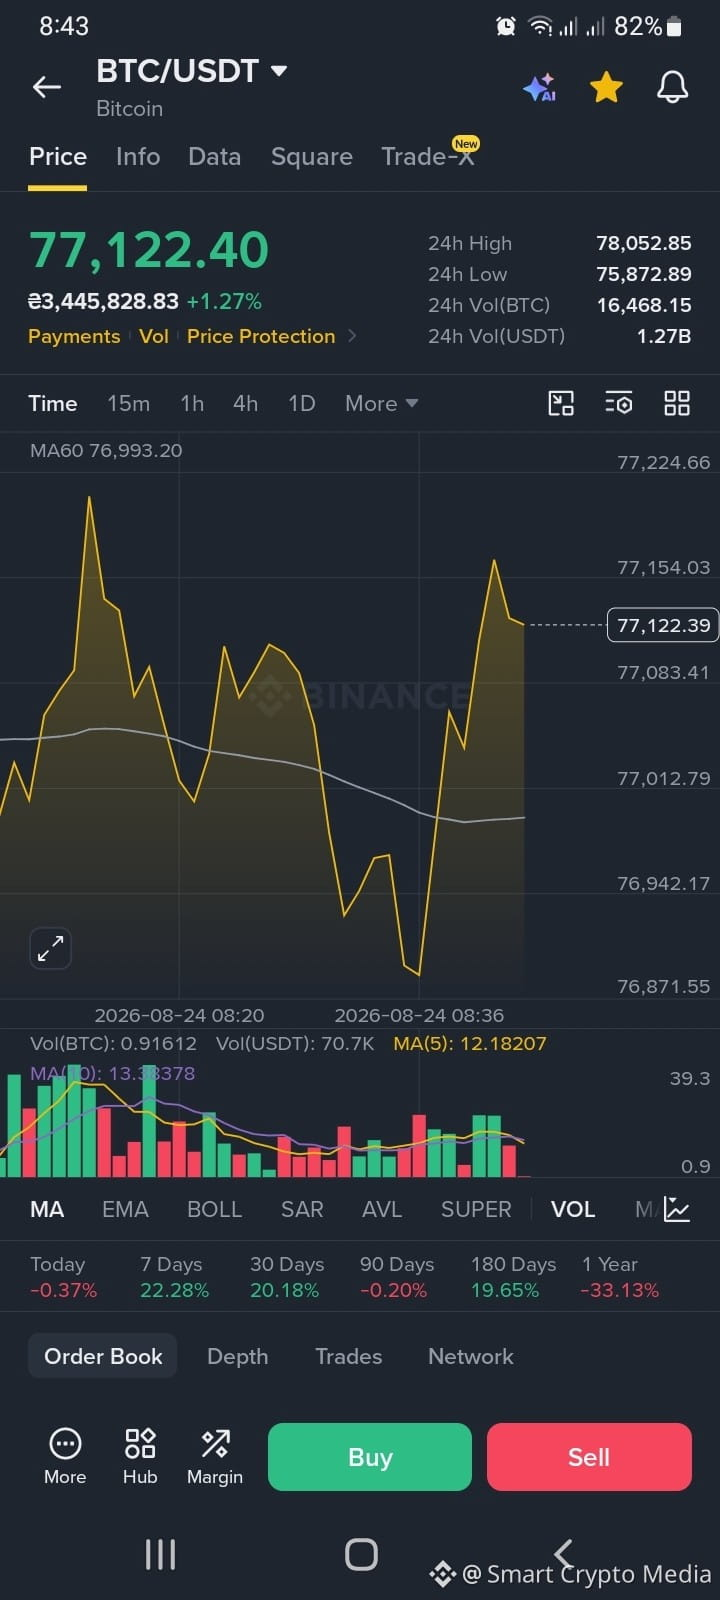
$BTC está sendo negociado em torno de US$ 77.122, com alta de cerca de 1,27% no dia, segundo o gráfico.
O que chama minha atenção não é o número verde em si.
É a relação entre o preço e a MA60, que está por volta de US$ 76.993.
O BTC está atualmente apenas acima dessa média móvel, o que coloca o mercado numa posição interessante no curto prazo. Os compradores conseguiram empurrar o preço de volta após uma queda para a região de US$ 76.870, mas a recuperação ainda precisa de confirmação.
O quadro intradiário maior também está bem claro:
máxima em 24h: US$ 78.052,85
mínima em 24h: US$ 75.872,89
preço atual: ~US$ 77.122
Então o BTC está situado aproximadamente na parte média-superior da faixa de hoje.
Isso significa que o próximo movimento pode ser mais importante do que o movimento atual.
Um impulso sustentado em direção a US$ 78K mostraria que os compradores estão dispostos a desafiar a máxima do dia. Por outro lado, perder a região de US$ 77K/MA60 pode trazer de volta o foco na fraqueza intradiária recente.
Sem previsão aqui. Só observando os níveis.
Você prefere ver o BTC recuperar US$ 78K primeiro, ou testar US$ 76K antes do próximo grande movimento?
#BTC #SmartCryptoMedia #writetoearn
$BTC está sendo negociado em torno de US$ 77.122, com alta de cerca de 1,27% no dia, segundo o gráfico.
O que chama minha atenção não é o número verde em si.
É a relação entre o preço e a MA60, que está por volta de US$ 76.993.
O BTC está atualmente apenas acima dessa média móvel, o que coloca o mercado numa posição interessante no curto prazo. Os compradores conseguiram empurrar o preço de volta após uma queda para a região de US$ 76.870, mas a recuperação ainda precisa de confirmação.
O quadro intradiário maior também está bem claro:
máxima em 24h: US$ 78.052,85
mínima em 24h: US$ 75.872,89
preço atual: ~US$ 77.122
Então o BTC está situado aproximadamente na parte média-superior da faixa de hoje.
Isso significa que o próximo movimento pode ser mais importante do que o movimento atual.
Um impulso sustentado em direção a US$ 78K mostraria que os compradores estão dispostos a desafiar a máxima do dia. Por outro lado, perder a região de US$ 77K/MA60 pode trazer de volta o foco na fraqueza intradiária recente.
Sem previsão aqui. Só observando os níveis.
Você prefere ver o BTC recuperar US$ 78K primeiro, ou testar US$ 76K antes do próximo grande movimento?
#BTC #SmartCryptoMedia #writetoearn
O que chama minha atenção não é o número verde em si.
É a relação entre o preço e a MA60, que está por volta de US$ 76.993.
O BTC está atualmente apenas acima dessa média móvel, o que coloca o mercado numa posição interessante no curto prazo. Os compradores conseguiram empurrar o preço de volta após uma queda para a região de US$ 76.870, mas a recuperação ainda precisa de confirmação.
O quadro intradiário maior também está bem claro:
máxima em 24h: US$ 78.052,85
mínima em 24h: US$ 75.872,89
preço atual: ~US$ 77.122
Então o BTC está situado aproximadamente na parte média-superior da faixa de hoje.
Isso significa que o próximo movimento pode ser mais importante do que o movimento atual.
Um impulso sustentado em direção a US$ 78K mostraria que os compradores estão dispostos a desafiar a máxima do dia. Por outro lado, perder a região de US$ 77K/MA60 pode trazer de volta o foco na fraqueza intradiária recente.
Sem previsão aqui. Só observando os níveis.
Você prefere ver o BTC recuperar US$ 78K primeiro, ou testar US$ 76K antes do próximo grande movimento?
#BTC #SmartCryptoMedia #writetoearn
98
$XRP Acabei de dar aos traders um daqueles “Espera… O quê?” movimentos
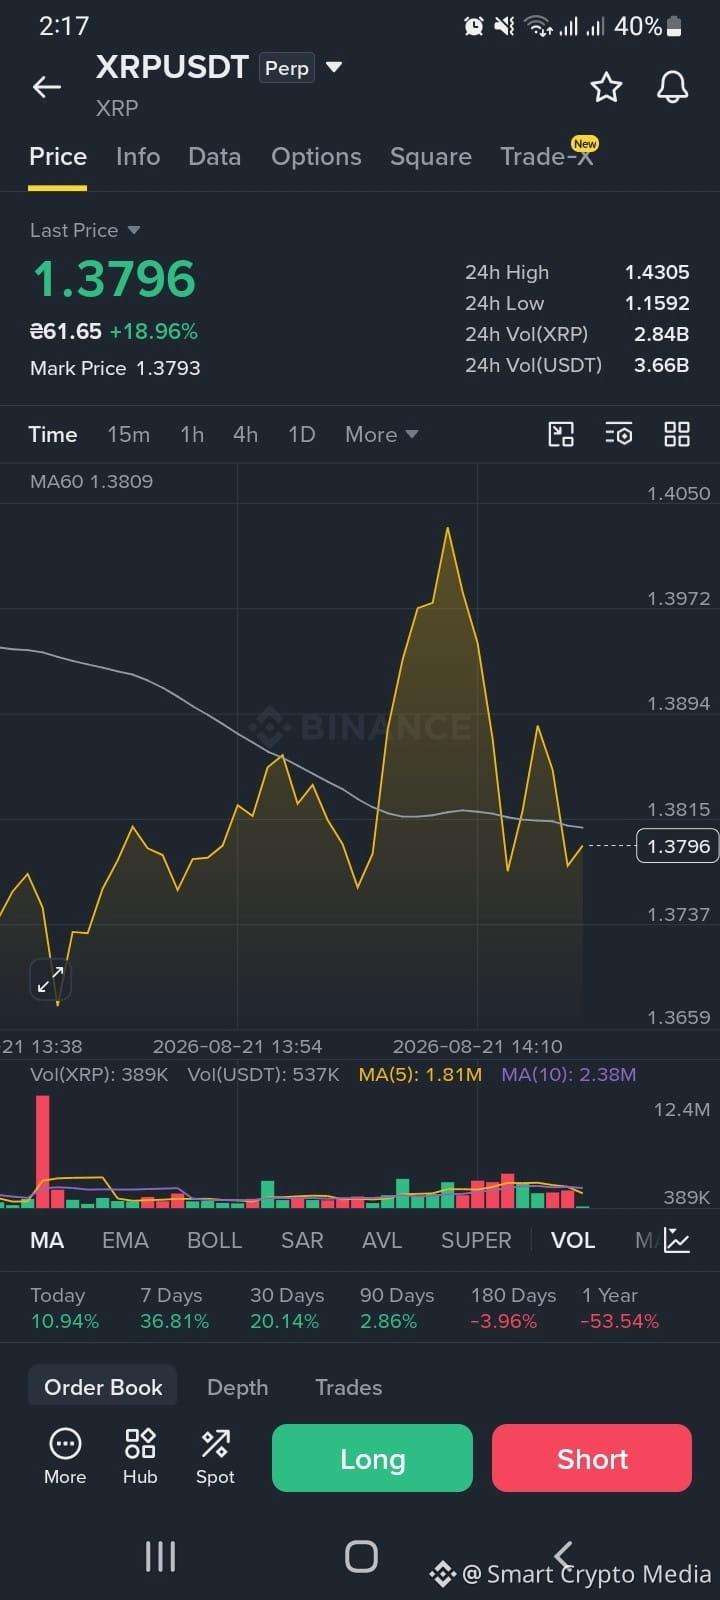
XRP por volta de US$ 1,38.
Quase 19% em alta no dia.
E de repente todo mundo começa a olhar para o gráfico de um jeito diferente.
Isso é a parte engraçada das criptos.
Algumas horas atrás, o mesmo preço poderia parecer entediante. Agora existe uma psicologia completamente diferente em torno dele.
A captura de tela mostra o XRP ganhando força forte em direção a US$ 1,40, recuando, voltando a saltar e depois escorregando de volta perto de US$ 1,38.
E, sinceramente… é a parte que eu acho mais interessante do que o número verde.
Porque depois de um movimento como esse, a decisão difícil não é reconhecer que o XRP está forte.
Qualquer um vê isso.
A parte difícil é entender se o mercado está construindo o próximo movimento ou simplesmente digerindo um enorme surto de compras.
A região de US$ 1,38 agora parece importante.
A região de US$ 1,40 parece ainda mais importante.
E a máxima anterior de US$ 1,4305 está lá como um lembrete de como as coisas podem mudar rapidamente.
Eu não gostaria de fingir que o gráfico nos dá certeza. Ele não dá.
Os mercados podem romper para cima quando todo mundo espera um recuo.
Eles também podem inverter quando todo mundo fica convencido de que o impulso vai continuar.
Então estou observando a reação do preço, não apenas a direção do preço.
Talvez o XRP continue em alta.
Talvez precise respirar primeiro.
O que faria você acreditar que esse movimento é uma continuação real, e não só um pico?
#XRP #SmartCryptoMedia #writetoearn
$XRP Acabei de dar aos traders um daqueles “Espera… O quê?” movimentos
XRP por volta de US$ 1,38.
Quase 19% em alta no dia.
E de repente todo mundo começa a olhar para o gráfico de um jeito diferente.
Isso é a parte engraçada das criptos.
Algumas horas atrás, o mesmo preço poderia parecer entediante. Agora existe uma psicologia completamente diferente em torno dele.
A captura de tela mostra o XRP ganhando força forte em direção a US$ 1,40, recuando, voltando a saltar e depois escorregando de volta perto de US$ 1,38.
E, sinceramente… é a parte que eu acho mais interessante do que o número verde.
Porque depois de um movimento como esse, a decisão difícil não é reconhecer que o XRP está forte.
Qualquer um vê isso.
A parte difícil é entender se o mercado está construindo o próximo movimento ou simplesmente digerindo um enorme surto de compras.
A região de US$ 1,38 agora parece importante.
A região de US$ 1,40 parece ainda mais importante.
E a máxima anterior de US$ 1,4305 está lá como um lembrete de como as coisas podem mudar rapidamente.
Eu não gostaria de fingir que o gráfico nos dá certeza. Ele não dá.
Os mercados podem romper para cima quando todo mundo espera um recuo.
Eles também podem inverter quando todo mundo fica convencido de que o impulso vai continuar.
Então estou observando a reação do preço, não apenas a direção do preço.
Talvez o XRP continue em alta.
Talvez precise respirar primeiro.
O que faria você acreditar que esse movimento é uma continuação real, e não só um pico?
#XRP #SmartCryptoMedia #writetoearn
XRP por volta de US$ 1,38.
Quase 19% em alta no dia.
E de repente todo mundo começa a olhar para o gráfico de um jeito diferente.
Isso é a parte engraçada das criptos.
Algumas horas atrás, o mesmo preço poderia parecer entediante. Agora existe uma psicologia completamente diferente em torno dele.
A captura de tela mostra o XRP ganhando força forte em direção a US$ 1,40, recuando, voltando a saltar e depois escorregando de volta perto de US$ 1,38.
E, sinceramente… é a parte que eu acho mais interessante do que o número verde.
Porque depois de um movimento como esse, a decisão difícil não é reconhecer que o XRP está forte.
Qualquer um vê isso.
A parte difícil é entender se o mercado está construindo o próximo movimento ou simplesmente digerindo um enorme surto de compras.
A região de US$ 1,38 agora parece importante.
A região de US$ 1,40 parece ainda mais importante.
E a máxima anterior de US$ 1,4305 está lá como um lembrete de como as coisas podem mudar rapidamente.
Eu não gostaria de fingir que o gráfico nos dá certeza. Ele não dá.
Os mercados podem romper para cima quando todo mundo espera um recuo.
Eles também podem inverter quando todo mundo fica convencido de que o impulso vai continuar.
Então estou observando a reação do preço, não apenas a direção do preço.
Talvez o XRP continue em alta.
Talvez precise respirar primeiro.
O que faria você acreditar que esse movimento é uma continuação real, e não só um pico?
#XRP #SmartCryptoMedia #writetoearn
162
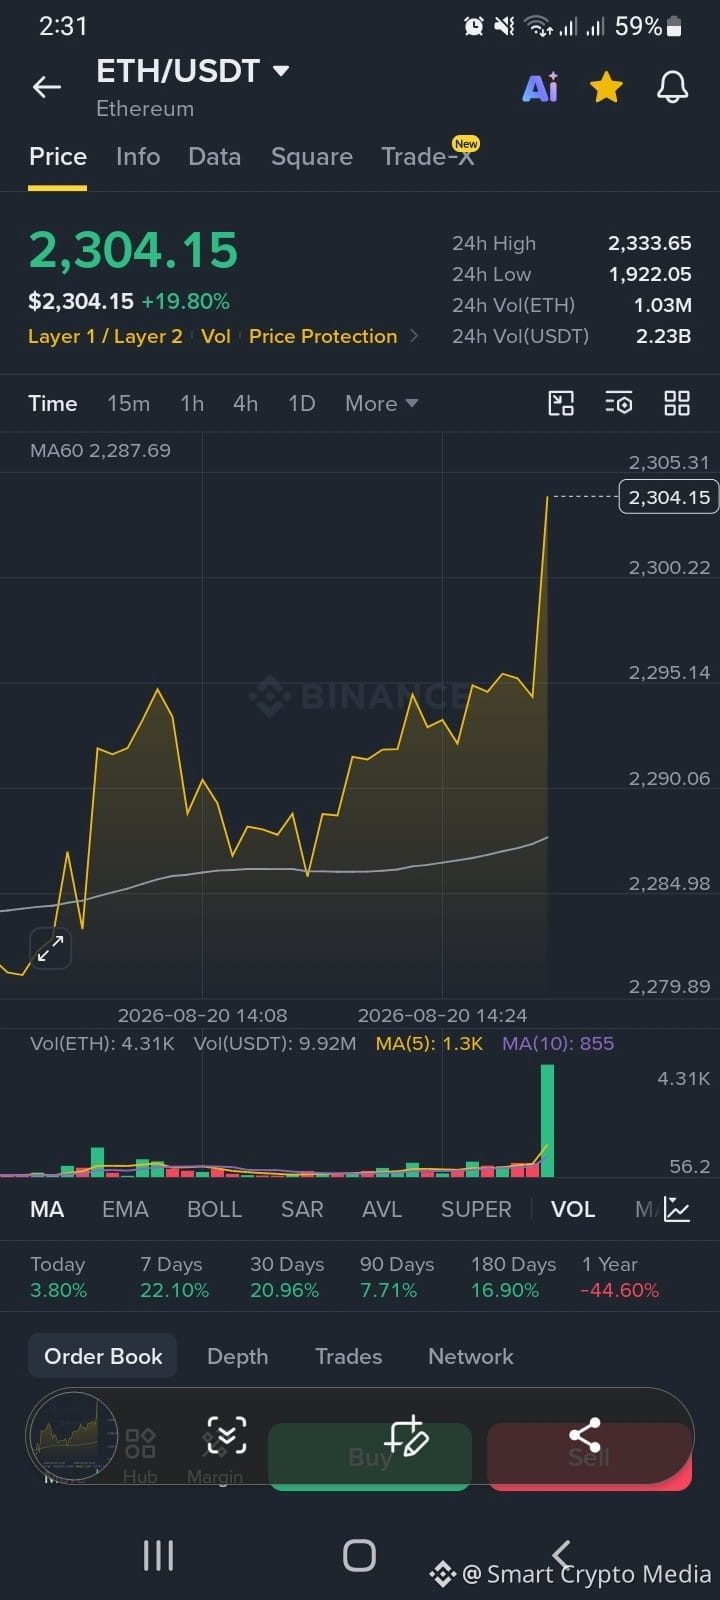
$ETH Abri o app e o número estava lá… parado. 2304. Verde. Grande verde. Pareceu estranho por um segundo porque eu fiquei encarando a mesma faixa por tanto tempo que uma quebra limpa quase não registra como algo real.
Assisti às últimas velas se formarem. A barra de volume parecia ter ficado irritada. Então as respostas começaram a inundar, com a mistura usual de comemorações e de “especialistas” repentinos. Não sei se isso se sustenta. Uma parte de mim já está calculando até onde poderia retrair antes que as pessoas chamem de falso rompimento. Outra parte só está quieta, observando a linha.
É um daqueles dias em que o gráfico fala por si e a sua mente tenta criar uma história ao redor disso. Ainda não sei qual versão estou escrevendo.
#ETH #SmartCryptoMedia #writetoearn
$ETH Abri o app e o número estava lá… parado. 2304. Verde. Grande verde. Pareceu estranho por um segundo porque eu fiquei encarando a mesma faixa por tanto tempo que uma quebra limpa quase não registra como algo real.
Assisti às últimas velas se formarem. A barra de volume parecia ter ficado irritada. Então as respostas começaram a inundar, com a mistura usual de comemorações e de “especialistas” repentinos. Não sei se isso se sustenta. Uma parte de mim já está calculando até onde poderia retrair antes que as pessoas chamem de falso rompimento. Outra parte só está quieta, observando a linha.
É um daqueles dias em que o gráfico fala por si e a sua mente tenta criar uma história ao redor disso. Ainda não sei qual versão estou escrevendo.
#ETH #SmartCryptoMedia #writetoearn
Assisti às últimas velas se formarem. A barra de volume parecia ter ficado irritada. Então as respostas começaram a inundar, com a mistura usual de comemorações e de “especialistas” repentinos. Não sei se isso se sustenta. Uma parte de mim já está calculando até onde poderia retrair antes que as pessoas chamem de falso rompimento. Outra parte só está quieta, observando a linha.
É um daqueles dias em que o gráfico fala por si e a sua mente tenta criar uma história ao redor disso. Ainda não sei qual versão estou escrevendo.
#ETH #SmartCryptoMedia #writetoearn
113
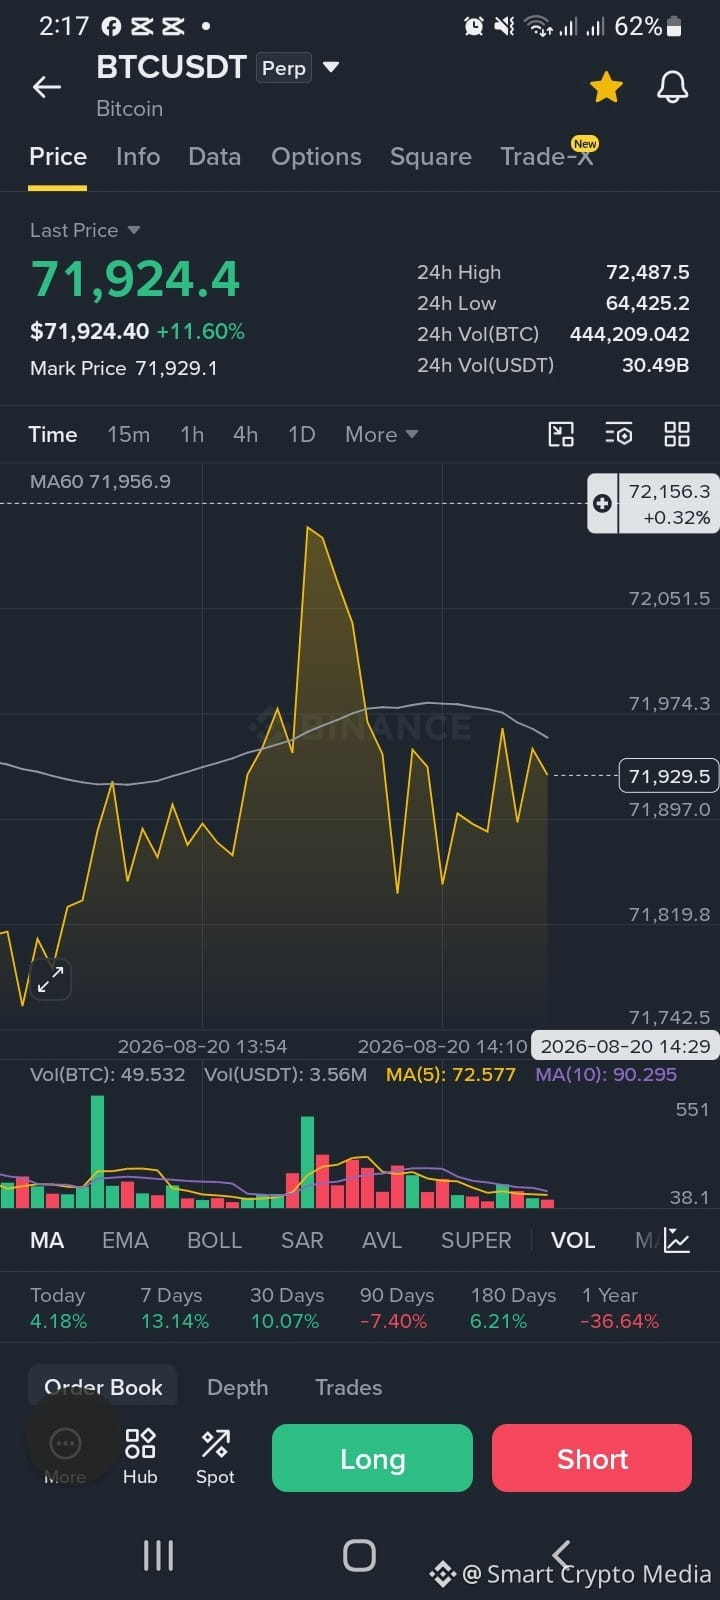
$BTC Ok então eu abri o aplicativo e — fiquei olhando para ele por um segundo. 71.924. Subiu 11,6%. Eu não acho que eu tenha processado totalmente esse número da primeira vez que li.
Basicamente, eu tinha parado de checar alertas de preço nas últimas semanas. A faixa estava entediante, todo mundo estava cansado, metade do meu feed discutindo se a gente já tinha chegado ao fundo ou não. E aí, um anúncio de títulos do Tesouro — de todas as coisas — vira o clima inteiro em um dia. O índice de medo e ganância saiu do medo e foi para a ganância durante a noite — eu também senti essa mudança em mim, não vou mentir.
Assistir ao gráfico sendo repetido a partir desta tarde é meio inquietante, honestamente. Essa parede vertical por volta das 14h, depois ele — fica indo e voltando, sobe, desce, sobe, desce, como se o mercado não conseguisse decidir se acreditava no movimento. Eu também não sei se acredito nisso ainda.
Não estou vendendo, nem comprando mais agora. Só ficando com isso por um minuto antes de dizer qualquer coisa definitiva. Parece um daqueles dias em que você vai querer lembrar exatamente como foi, qualquer que seja o rumo daqui.
#BTC #SmartCryptoMedia #Write2Earn!
$BTC Ok então eu abri o aplicativo e — fiquei olhando para ele por um segundo. 71.924. Subiu 11,6%. Eu não acho que eu tenha processado totalmente esse número da primeira vez que li.
Basicamente, eu tinha parado de checar alertas de preço nas últimas semanas. A faixa estava entediante, todo mundo estava cansado, metade do meu feed discutindo se a gente já tinha chegado ao fundo ou não. E aí, um anúncio de títulos do Tesouro — de todas as coisas — vira o clima inteiro em um dia. O índice de medo e ganância saiu do medo e foi para a ganância durante a noite — eu também senti essa mudança em mim, não vou mentir.
Assistir ao gráfico sendo repetido a partir desta tarde é meio inquietante, honestamente. Essa parede vertical por volta das 14h, depois ele — fica indo e voltando, sobe, desce, sobe, desce, como se o mercado não conseguisse decidir se acreditava no movimento. Eu também não sei se acredito nisso ainda.
Não estou vendendo, nem comprando mais agora. Só ficando com isso por um minuto antes de dizer qualquer coisa definitiva. Parece um daqueles dias em que você vai querer lembrar exatamente como foi, qualquer que seja o rumo daqui.
#BTC #SmartCryptoMedia #Write2Earn!
Basicamente, eu tinha parado de checar alertas de preço nas últimas semanas. A faixa estava entediante, todo mundo estava cansado, metade do meu feed discutindo se a gente já tinha chegado ao fundo ou não. E aí, um anúncio de títulos do Tesouro — de todas as coisas — vira o clima inteiro em um dia. O índice de medo e ganância saiu do medo e foi para a ganância durante a noite — eu também senti essa mudança em mim, não vou mentir.
Assistir ao gráfico sendo repetido a partir desta tarde é meio inquietante, honestamente. Essa parede vertical por volta das 14h, depois ele — fica indo e voltando, sobe, desce, sobe, desce, como se o mercado não conseguisse decidir se acreditava no movimento. Eu também não sei se acredito nisso ainda.
Não estou vendendo, nem comprando mais agora. Só ficando com isso por um minuto antes de dizer qualquer coisa definitiva. Parece um daqueles dias em que você vai querer lembrar exatamente como foi, qualquer que seja o rumo daqui.
#BTC #SmartCryptoMedia #Write2Earn!
124
$ETH parece calmo agora… talvez até demais.
Eu continuo olhando este gráfico de 15 minutos e tendo a mesma sensação:
Falta alguma coisa.
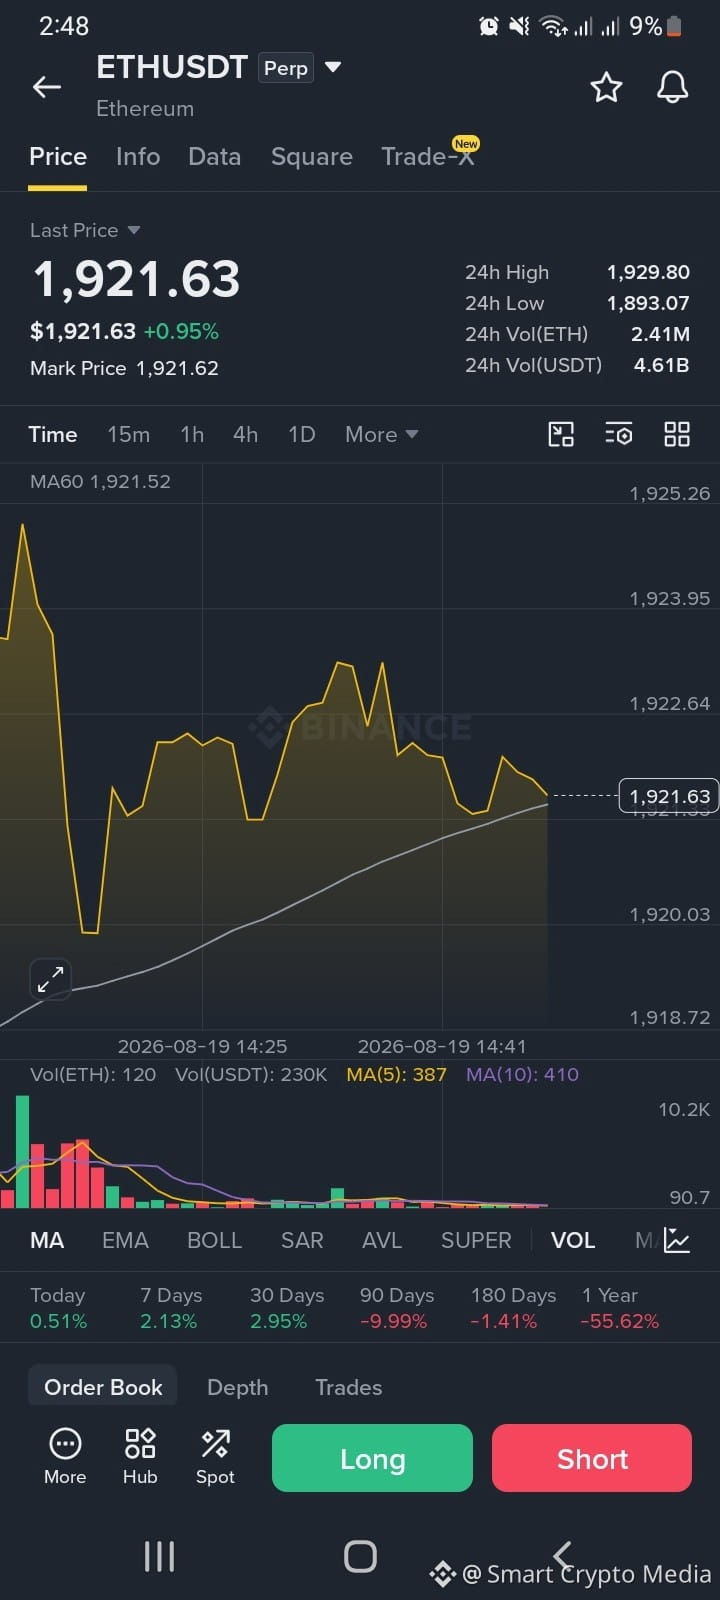
O ETH rebotou da parte inferior da faixa visível, se recuperou perto de US$ 1.923+, puxou para trás, voltou a subir… e agora está por volta de US$ 1.921,63.
Não é um movimento dramático.
Também não é uma quebra clara.
É só hesitação.
A MA60 está quase perfeitamente abaixo do preço em US$ 1.921,52, o que deixa o nível atual ainda mais interessante. Os compradores não perderam o controle totalmente, mas os vendedores também não desapareceram.
E o volume conta outra história.
As velas anteriores tinham muito mais atividade. As velas recentes estão visivelmente mais silenciosas.
Talvez seja acumulação.
Talvez o mercado esteja apenas esperando.
Talvez todo mundo esteja esperando que alguém faça o primeiro movimento.
É isso que torna essas faixas tão pequenas difíceis. O gráfico pode parecer altista porque o preço se recuperou, enquanto a falta de volume mantém o rompimento sem confirmação.
Para mim, a parte interessante não é prever a próxima vela.
É observar o que acontece quando o ETH finalmente deixa esse pequeno campo de batalha.
Acima de US$ 1.930. Abaixo de US$ 1.918–$1.920.
Um dos lados eventualmente precisa ceder.
Até lá, estou mais interessado em confirmação do que em chutar.
Você está vendo acumulação aqui, ou só uma pausa antes de outro movimento?
#ETH #SmartCryptoMedia #writetoearn
$ETH parece calmo agora… talvez até demais.
Eu continuo olhando este gráfico de 15 minutos e tendo a mesma sensação:
Falta alguma coisa.
O ETH rebotou da parte inferior da faixa visível, se recuperou perto de US$ 1.923+, puxou para trás, voltou a subir… e agora está por volta de US$ 1.921,63.
Não é um movimento dramático.
Também não é uma quebra clara.
É só hesitação.
A MA60 está quase perfeitamente abaixo do preço em US$ 1.921,52, o que deixa o nível atual ainda mais interessante. Os compradores não perderam o controle totalmente, mas os vendedores também não desapareceram.
E o volume conta outra história.
As velas anteriores tinham muito mais atividade. As velas recentes estão visivelmente mais silenciosas.
Talvez seja acumulação.
Talvez o mercado esteja apenas esperando.
Talvez todo mundo esteja esperando que alguém faça o primeiro movimento.
É isso que torna essas faixas tão pequenas difíceis. O gráfico pode parecer altista porque o preço se recuperou, enquanto a falta de volume mantém o rompimento sem confirmação.
Para mim, a parte interessante não é prever a próxima vela.
É observar o que acontece quando o ETH finalmente deixa esse pequeno campo de batalha.
Acima de US$ 1.930. Abaixo de US$ 1.918–$1.920.
Um dos lados eventualmente precisa ceder.
Até lá, estou mais interessado em confirmação do que em chutar.
Você está vendo acumulação aqui, ou só uma pausa antes de outro movimento?
#ETH #SmartCryptoMedia #writetoearn
Eu continuo olhando este gráfico de 15 minutos e tendo a mesma sensação:
Falta alguma coisa.
O ETH rebotou da parte inferior da faixa visível, se recuperou perto de US$ 1.923+, puxou para trás, voltou a subir… e agora está por volta de US$ 1.921,63.
Não é um movimento dramático.
Também não é uma quebra clara.
É só hesitação.
A MA60 está quase perfeitamente abaixo do preço em US$ 1.921,52, o que deixa o nível atual ainda mais interessante. Os compradores não perderam o controle totalmente, mas os vendedores também não desapareceram.
E o volume conta outra história.
As velas anteriores tinham muito mais atividade. As velas recentes estão visivelmente mais silenciosas.
Talvez seja acumulação.
Talvez o mercado esteja apenas esperando.
Talvez todo mundo esteja esperando que alguém faça o primeiro movimento.
É isso que torna essas faixas tão pequenas difíceis. O gráfico pode parecer altista porque o preço se recuperou, enquanto a falta de volume mantém o rompimento sem confirmação.
Para mim, a parte interessante não é prever a próxima vela.
É observar o que acontece quando o ETH finalmente deixa esse pequeno campo de batalha.
Acima de US$ 1.930. Abaixo de US$ 1.918–$1.920.
Um dos lados eventualmente precisa ceder.
Até lá, estou mais interessado em confirmação do que em chutar.
Você está vendo acumulação aqui, ou só uma pausa antes de outro movimento?
#ETH #SmartCryptoMedia #writetoearn
487
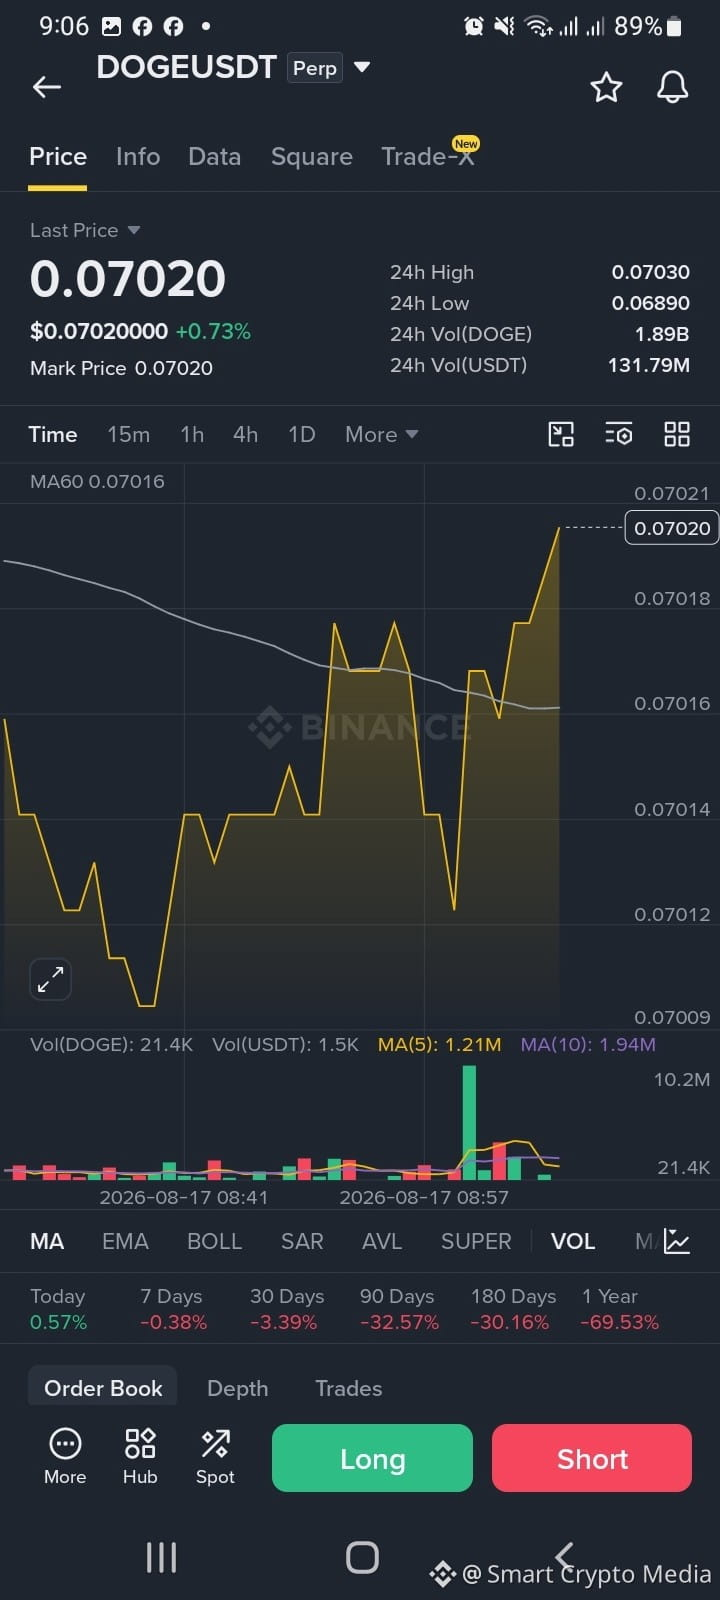
Continue verificando $DOGE hoje e é só... ali parado. US$ 0,0702. Verde, bem pouco. Parece quase anticlimático depois de todo o barulho que houve sobre essa zona de US$ 0,069 nos últimos meses.
Honestamente, não sei o que pensar sobre isso. Parte de mim olha o gráfico e pensa — ok, terceiro repique no mesmo nível, isso não é nada. Talvez os vendedores estejam realmente cansados. Outra parte de mim lembra que esta moeda valia três vezes isso há um ano e pensa, por que eu sequer estou analisando um repique em um nível que ainda está 70% abaixo.
A parada do DogeOS é real, eu acho. Desenvolvimento de verdade acontecendo, integração DeFi real agora também via Flare. Mas aí eu me pego — quantas vezes eu já li "DOGE finalmente ganha utilidade" só para ver ele negociar exatamente como qualquer outra moeda meme no segundo em que o BTC espirra.
Não estou tentando me convencer nem contra nem a favor de nada aqui. Só observando a mesma faixa de US$ 0,069–0,0703 ser testada de novo e pensando se estou vendo a paciência finalmente valendo a pena ou se é só... mais espera. Acho que a gente descobre quando ela realmente romper de um lado.
#DOGE #SmartCryptoMedia #writetoearn
Continue verificando $DOGE hoje e é só... ali parado. US$ 0,0702. Verde, bem pouco. Parece quase anticlimático depois de todo o barulho que houve sobre essa zona de US$ 0,069 nos últimos meses.
Honestamente, não sei o que pensar sobre isso. Parte de mim olha o gráfico e pensa — ok, terceiro repique no mesmo nível, isso não é nada. Talvez os vendedores estejam realmente cansados. Outra parte de mim lembra que esta moeda valia três vezes isso há um ano e pensa, por que eu sequer estou analisando um repique em um nível que ainda está 70% abaixo.
A parada do DogeOS é real, eu acho. Desenvolvimento de verdade acontecendo, integração DeFi real agora também via Flare. Mas aí eu me pego — quantas vezes eu já li "DOGE finalmente ganha utilidade" só para ver ele negociar exatamente como qualquer outra moeda meme no segundo em que o BTC espirra.
Não estou tentando me convencer nem contra nem a favor de nada aqui. Só observando a mesma faixa de US$ 0,069–0,0703 ser testada de novo e pensando se estou vendo a paciência finalmente valendo a pena ou se é só... mais espera. Acho que a gente descobre quando ela realmente romper de um lado.
#DOGE #SmartCryptoMedia #writetoearn
Honestamente, não sei o que pensar sobre isso. Parte de mim olha o gráfico e pensa — ok, terceiro repique no mesmo nível, isso não é nada. Talvez os vendedores estejam realmente cansados. Outra parte de mim lembra que esta moeda valia três vezes isso há um ano e pensa, por que eu sequer estou analisando um repique em um nível que ainda está 70% abaixo.
A parada do DogeOS é real, eu acho. Desenvolvimento de verdade acontecendo, integração DeFi real agora também via Flare. Mas aí eu me pego — quantas vezes eu já li "DOGE finalmente ganha utilidade" só para ver ele negociar exatamente como qualquer outra moeda meme no segundo em que o BTC espirra.
Não estou tentando me convencer nem contra nem a favor de nada aqui. Só observando a mesma faixa de US$ 0,069–0,0703 ser testada de novo e pensando se estou vendo a paciência finalmente valendo a pena ou se é só... mais espera. Acho que a gente descobre quando ela realmente romper de um lado.
#DOGE #SmartCryptoMedia #writetoearn
539
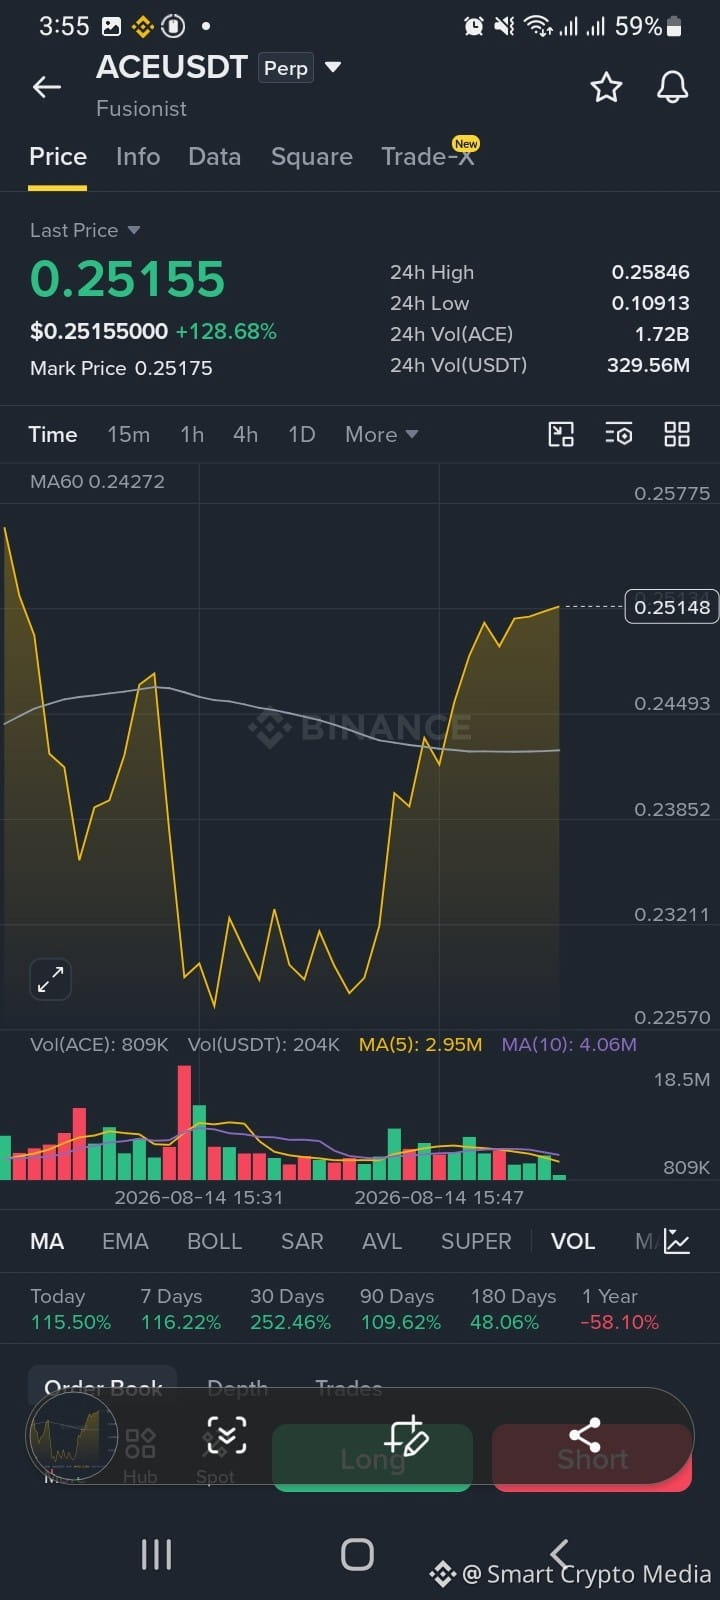
Assisti $ACE go a partir de um token de jogos tranquilo do qual ninguém estava falando até +128% em um dia e, sinceramente, não sei o que fazer com isso. Parte de mim quer chamar isso de óbvio — float baixo, base baixa, claro que ele se move assim quando o momentum aparece. Mas outra parte de mim só fica olhando uma vela dessas e sente a atração mesmo assim. A coisa chata deste mercado é essa. Saber os mecanismos não te imuniza totalmente contra o sentimento. Fui atrás de um motivo hoje — uma atualização, uma parceria, qualquer coisa — e cheguei a praticamente nada além de "tokens de jogos estão vivendo um momento juntos". Isso é algo real, a rotação acontece, mas não é a mesma coisa que um projeto fazendo algo de verdade. Também vai ter um desbloqueio em algumas semanas, e eu fico indo e voltando sobre se isso sequer importa para as pessoas presas num movimento como este. Provavelmente não, até que importe. Não estou negociando isso. Principalmente ficando com a sensação de como seis centavos viraram vinte e cinco, e de como quase nada dessa distância é explicado por algo que eu consiga apontar. Parece menos uma história e mais como um humor em que o mercado está agora.
#writetoearn
Assisti $ACE go a partir de um token de jogos tranquilo do qual ninguém estava falando até +128% em um dia e, sinceramente, não sei o que fazer com isso. Parte de mim quer chamar isso de óbvio — float baixo, base baixa, claro que ele se move assim quando o momentum aparece. Mas outra parte de mim só fica olhando uma vela dessas e sente a atração mesmo assim. A coisa chata deste mercado é essa. Saber os mecanismos não te imuniza totalmente contra o sentimento. Fui atrás de um motivo hoje — uma atualização, uma parceria, qualquer coisa — e cheguei a praticamente nada além de "tokens de jogos estão vivendo um momento juntos". Isso é algo real, a rotação acontece, mas não é a mesma coisa que um projeto fazendo algo de verdade. Também vai ter um desbloqueio em algumas semanas, e eu fico indo e voltando sobre se isso sequer importa para as pessoas presas num movimento como este. Provavelmente não, até que importe. Não estou negociando isso. Principalmente ficando com a sensação de como seis centavos viraram vinte e cinco, e de como quase nada dessa distância é explicado por algo que eu consiga apontar. Parece menos uma história e mais como um humor em que o mercado está agora.
#writetoearn
#writetoearn
209
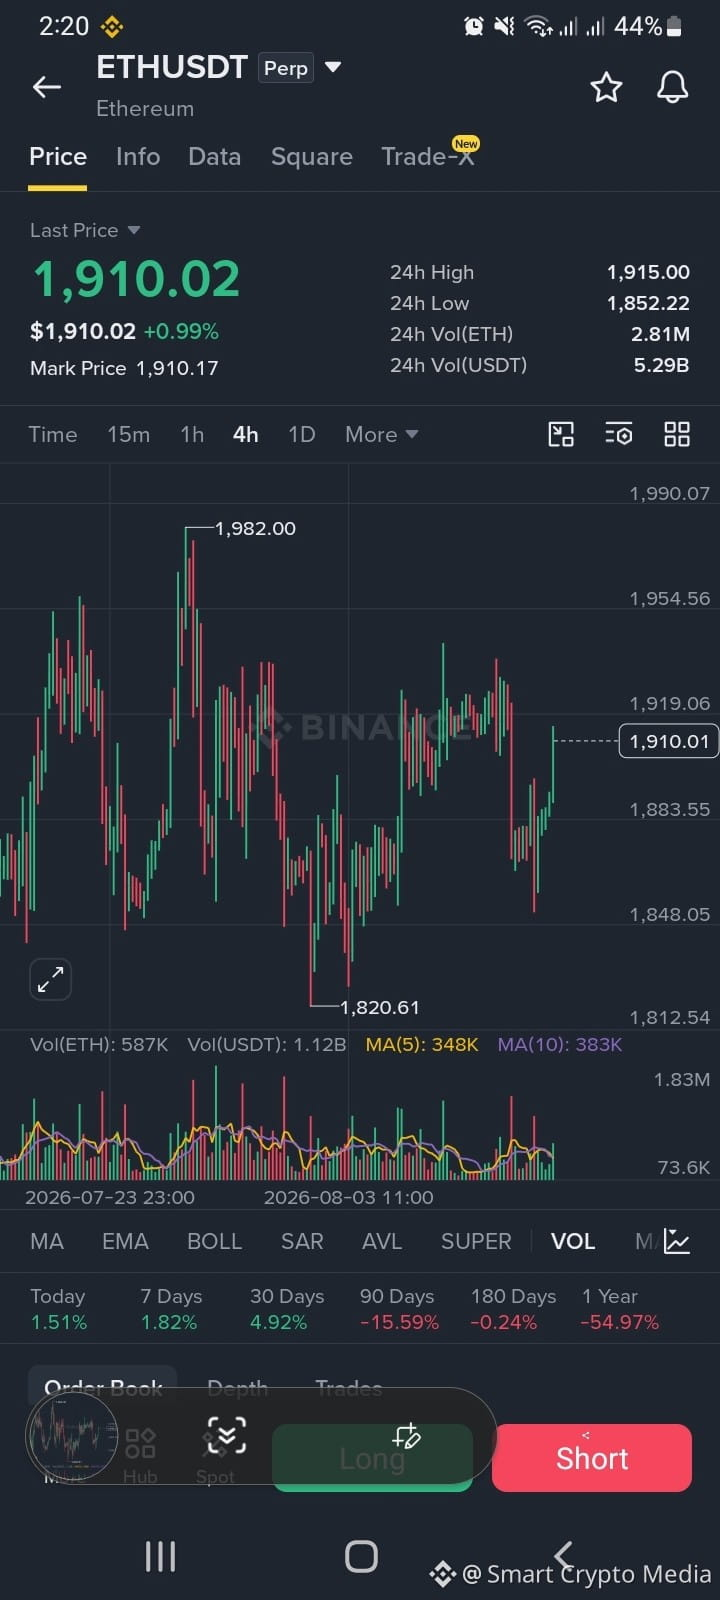
Assisti a $ETH do aquela rodada inteira de US$ 1.982 para US$ 1.820 ida e volta e, honestamente — não sei o que pensar disso mais. Toda vez que parece estar desabando, ele dá uma virada. Toda vez que parece que vai buscar US$ 2k, ele é rejeitado. Agora está de volta em US$ 1.910, basicamente onde ele fica caindo depois de todo esse barulho.
Eu vi os títulos de acumulação da Bitmine. Também li o tópico de retirada na exchange. Parte de mim quer interpretar isso como um sinal — tipo, ok, alguém com tamanho de verdade acha que esse é um nível que vale a pena comprar. Mas aí eu olho o gráfico anual. Em queda de mais de 50%. Esse número só fica ali, meio silenciosamente enfraquecendo toda aquela sensação de "é aqui que é o fundo" no curto prazo.
Talvez seja só assim que esse ciclo funciona — um vai e vem lento, pavios ocasionais, repete. Não estou tentando cravar topo ou fundo aqui, só reparando como é cansativo assistir o mesmo intervalo se repetir. US$ 1.850 segura, US$ 1.900 limita, enxágua.
Não é aconselhamento financeiro, obviamente. É só onde minha cabeça está enquanto observo as velas de 4h hoje.
#ETH #SmartCryptoMedia #Write2Earrn
Assisti a $ETH do aquela rodada inteira de US$ 1.982 para US$ 1.820 ida e volta e, honestamente — não sei o que pensar disso mais. Toda vez que parece estar desabando, ele dá uma virada. Toda vez que parece que vai buscar US$ 2k, ele é rejeitado. Agora está de volta em US$ 1.910, basicamente onde ele fica caindo depois de todo esse barulho.
Eu vi os títulos de acumulação da Bitmine. Também li o tópico de retirada na exchange. Parte de mim quer interpretar isso como um sinal — tipo, ok, alguém com tamanho de verdade acha que esse é um nível que vale a pena comprar. Mas aí eu olho o gráfico anual. Em queda de mais de 50%. Esse número só fica ali, meio silenciosamente enfraquecendo toda aquela sensação de "é aqui que é o fundo" no curto prazo.
Talvez seja só assim que esse ciclo funciona — um vai e vem lento, pavios ocasionais, repete. Não estou tentando cravar topo ou fundo aqui, só reparando como é cansativo assistir o mesmo intervalo se repetir. US$ 1.850 segura, US$ 1.900 limita, enxágua.
Não é aconselhamento financeiro, obviamente. É só onde minha cabeça está enquanto observo as velas de 4h hoje.
#ETH #SmartCryptoMedia #Write2Earrn
Eu vi os títulos de acumulação da Bitmine. Também li o tópico de retirada na exchange. Parte de mim quer interpretar isso como um sinal — tipo, ok, alguém com tamanho de verdade acha que esse é um nível que vale a pena comprar. Mas aí eu olho o gráfico anual. Em queda de mais de 50%. Esse número só fica ali, meio silenciosamente enfraquecendo toda aquela sensação de "é aqui que é o fundo" no curto prazo.
Talvez seja só assim que esse ciclo funciona — um vai e vem lento, pavios ocasionais, repete. Não estou tentando cravar topo ou fundo aqui, só reparando como é cansativo assistir o mesmo intervalo se repetir. US$ 1.850 segura, US$ 1.900 limita, enxágua.
Não é aconselhamento financeiro, obviamente. É só onde minha cabeça está enquanto observo as velas de 4h hoje.
#ETH #SmartCryptoMedia #Write2Earrn
125
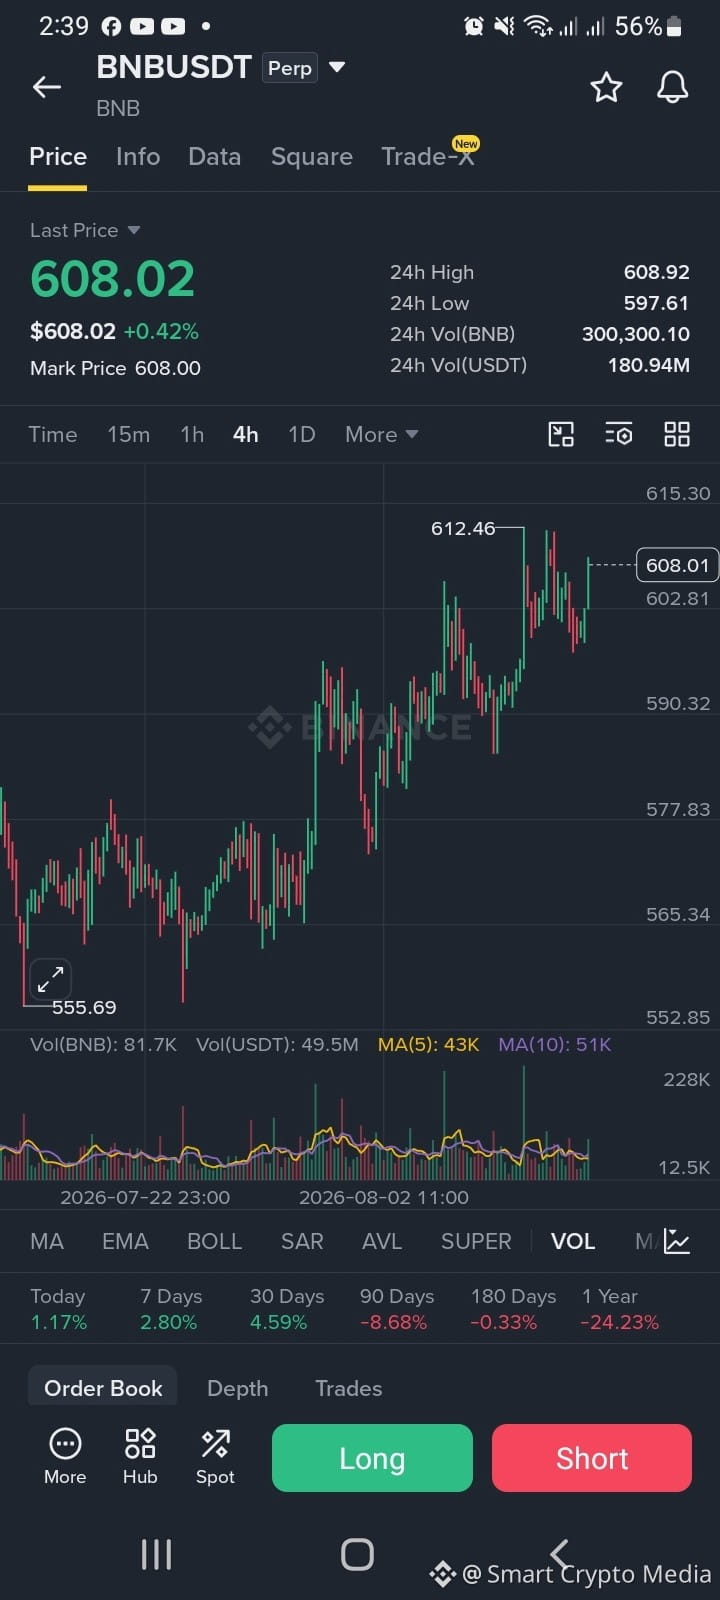
$BNB Tenho ficado encarando este gráfico de BNB por mais tempo do que provavelmente deveria. $608.02. Subiu quase meio por cento hoje. Não parece muito quando você diz em voz alta.
Mas aí você rola para a esquerda no gráfico e tem essa sequência inteira — lá perto de $555 não faz tanto tempo, depois essa alta até $612, e então… ele simplesmente estaciona. Fica aí. Oscila entre $602 e $608 como se não conseguisse decidir.
E eu fico indo e voltando sobre como me sentir em relação a isso. A semana parece boa, +2.80%. O mês parece bom, +4.59%. Aí eu vejo -24.23% no ano e alguma coisa em mim desanima um pouco. Tipo, ok, então ainda estamos bem abaixo do ponto de onde começamos, só que tivemos algumas semanas decentes.
Não sei se isso é uma história de recuperação ou só ruído dentro de uma queda maior. O volume tem sido bom durante o movimento, o que normalmente significa alguma coisa, mas "normalmente" está fazendo muito trabalho naquela frase.
Não estou tentando cravar topo ou fundo aqui. Só aceitando o fato de que um dia verde não apaga um ano vermelho, e também de que um ano vermelho não significa que os dias verdes não sejam reais. Observando $597 como o nível que importa agora.
#BNB #SmartCryptoMedia #writetoearn
$BNB Tenho ficado encarando este gráfico de BNB por mais tempo do que provavelmente deveria. $608.02. Subiu quase meio por cento hoje. Não parece muito quando você diz em voz alta.
Mas aí você rola para a esquerda no gráfico e tem essa sequência inteira — lá perto de $555 não faz tanto tempo, depois essa alta até $612, e então… ele simplesmente estaciona. Fica aí. Oscila entre $602 e $608 como se não conseguisse decidir.
E eu fico indo e voltando sobre como me sentir em relação a isso. A semana parece boa, +2.80%. O mês parece bom, +4.59%. Aí eu vejo -24.23% no ano e alguma coisa em mim desanima um pouco. Tipo, ok, então ainda estamos bem abaixo do ponto de onde começamos, só que tivemos algumas semanas decentes.
Não sei se isso é uma história de recuperação ou só ruído dentro de uma queda maior. O volume tem sido bom durante o movimento, o que normalmente significa alguma coisa, mas "normalmente" está fazendo muito trabalho naquela frase.
Não estou tentando cravar topo ou fundo aqui. Só aceitando o fato de que um dia verde não apaga um ano vermelho, e também de que um ano vermelho não significa que os dias verdes não sejam reais. Observando $597 como o nível que importa agora.
#BNB #SmartCryptoMedia #writetoearn
Mas aí você rola para a esquerda no gráfico e tem essa sequência inteira — lá perto de $555 não faz tanto tempo, depois essa alta até $612, e então… ele simplesmente estaciona. Fica aí. Oscila entre $602 e $608 como se não conseguisse decidir.
E eu fico indo e voltando sobre como me sentir em relação a isso. A semana parece boa, +2.80%. O mês parece bom, +4.59%. Aí eu vejo -24.23% no ano e alguma coisa em mim desanima um pouco. Tipo, ok, então ainda estamos bem abaixo do ponto de onde começamos, só que tivemos algumas semanas decentes.
Não sei se isso é uma história de recuperação ou só ruído dentro de uma queda maior. O volume tem sido bom durante o movimento, o que normalmente significa alguma coisa, mas "normalmente" está fazendo muito trabalho naquela frase.
Não estou tentando cravar topo ou fundo aqui. Só aceitando o fato de que um dia verde não apaga um ano vermelho, e também de que um ano vermelho não significa que os dias verdes não sejam reais. Observando $597 como o nível que importa agora.
#BNB #SmartCryptoMedia #writetoearn
1
97
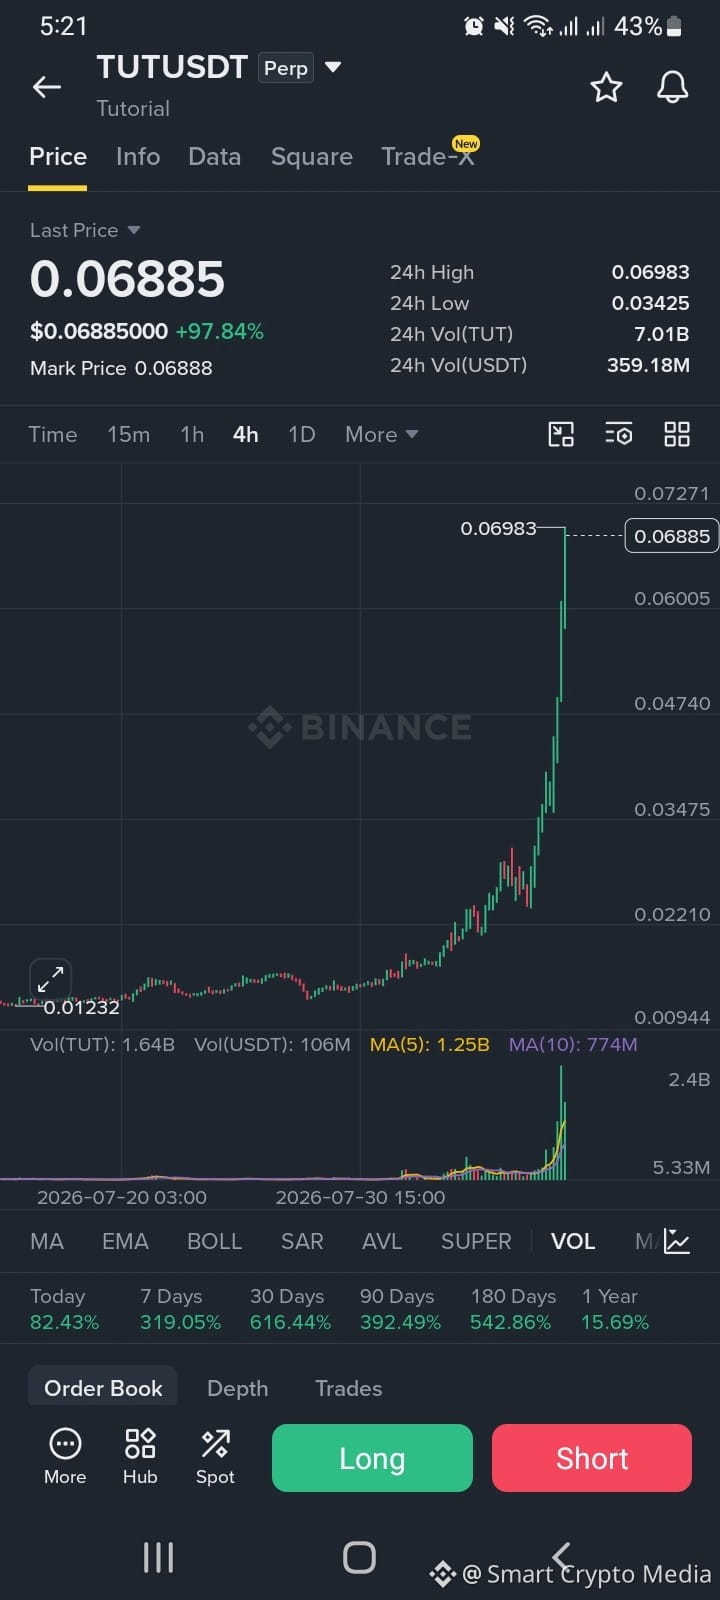
$TUT Continuo encarando este gráfico por mais tempo do que eu deveria. TUT — uma moeda que, se você voltar tempo suficiente, era literalmente o tutorial de alguém. Um exemplo didático. E agora há uma vela verde na tela indo quase em linha reta para cima, +97% em um dia, e as pessoas estão observando como você observa algo que não consegue acreditar.
Eu não sei o que fazer com isso. Uma parte de mim acha até meio engraçado — a demonstração virou o evento principal. Outra parte só está cansada de assistir gráficos fazerem isso, honestamente, porque eu já vi exatamente essa forma antes, neste mesmo token, mais de uma vez. Sobe rápido, segura perto do topo por um tempo e depois vem o longo e lento sangramento que ninguém captura em print.
Não estou dizendo para não assistir. Eu também estou assistindo. Só — percebendo como é fácil se sentir como se desta vez fosse diferente quando a vela está verde e subindo, e como essa sensação não tem nada a ver com o fato de realmente ser diferente. Curioso se alguém tem um motivo real para o movimento de hoje, porque eu olhei e não encontrei um. Talvez seja só o mercado fazendo o que mercados finos e alavancados fazem.#Write2Earrn
$TUT Continuo encarando este gráfico por mais tempo do que eu deveria. TUT — uma moeda que, se você voltar tempo suficiente, era literalmente o tutorial de alguém. Um exemplo didático. E agora há uma vela verde na tela indo quase em linha reta para cima, +97% em um dia, e as pessoas estão observando como você observa algo que não consegue acreditar.
Eu não sei o que fazer com isso. Uma parte de mim acha até meio engraçado — a demonstração virou o evento principal. Outra parte só está cansada de assistir gráficos fazerem isso, honestamente, porque eu já vi exatamente essa forma antes, neste mesmo token, mais de uma vez. Sobe rápido, segura perto do topo por um tempo e depois vem o longo e lento sangramento que ninguém captura em print.
Não estou dizendo para não assistir. Eu também estou assistindo. Só — percebendo como é fácil se sentir como se desta vez fosse diferente quando a vela está verde e subindo, e como essa sensação não tem nada a ver com o fato de realmente ser diferente. Curioso se alguém tem um motivo real para o movimento de hoje, porque eu olhei e não encontrei um. Talvez seja só o mercado fazendo o que mercados finos e alavancados fazem.#Write2Earrn
Eu não sei o que fazer com isso. Uma parte de mim acha até meio engraçado — a demonstração virou o evento principal. Outra parte só está cansada de assistir gráficos fazerem isso, honestamente, porque eu já vi exatamente essa forma antes, neste mesmo token, mais de uma vez. Sobe rápido, segura perto do topo por um tempo e depois vem o longo e lento sangramento que ninguém captura em print.
Não estou dizendo para não assistir. Eu também estou assistindo. Só — percebendo como é fácil se sentir como se desta vez fosse diferente quando a vela está verde e subindo, e como essa sensação não tem nada a ver com o fato de realmente ser diferente. Curioso se alguém tem um motivo real para o movimento de hoje, porque eu olhei e não encontrei um. Talvez seja só o mercado fazendo o que mercados finos e alavancados fazem.#Write2Earrn
260
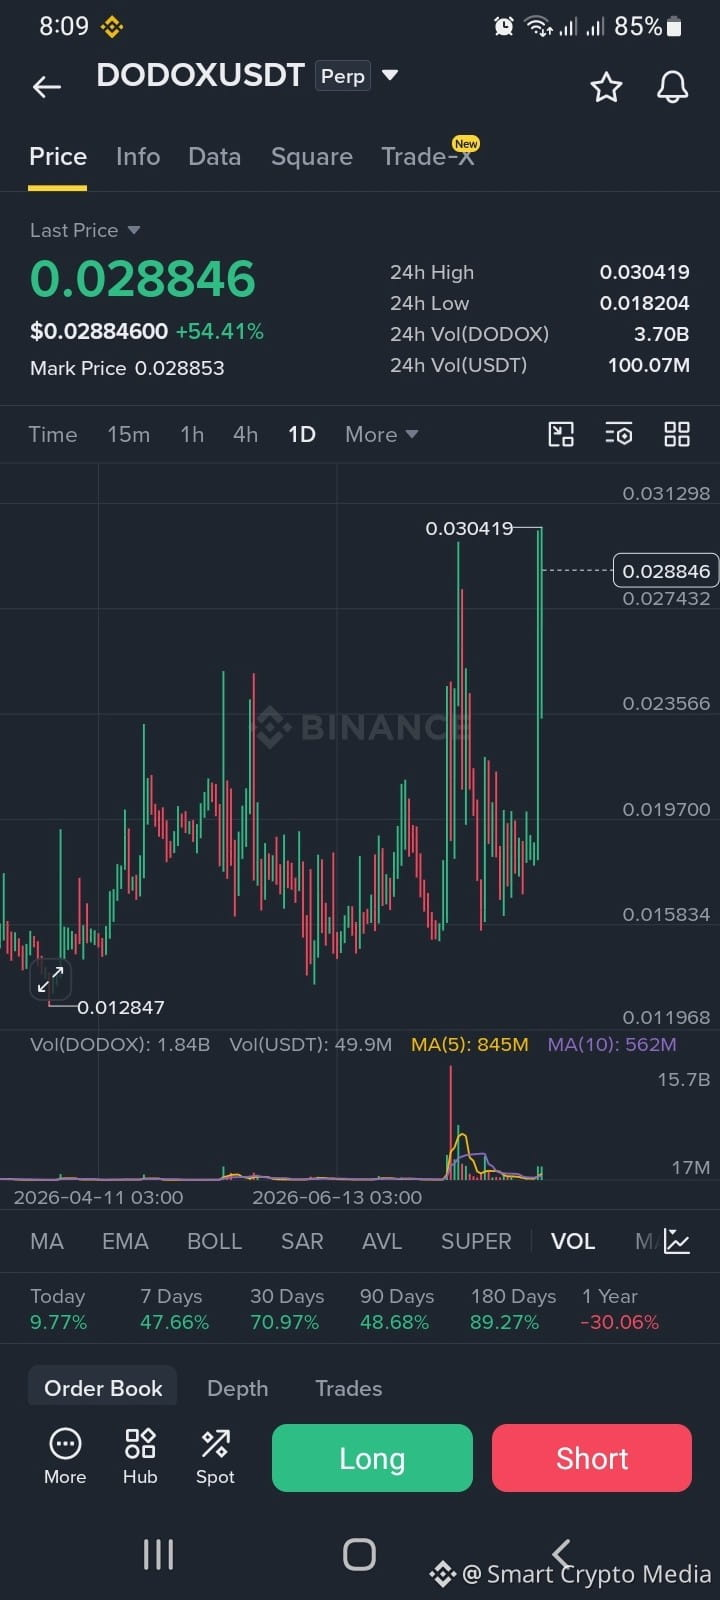
Peguei o gráfico $DODO bem no meio do pico esta manhã e fiquei ali por um segundo rolando de volta. De 0.0128 até 0.0304 em — o quê, semanas? E eu lembro quando isso era basicamente um gráfico fantasma. Ninguém falava sobre isso, volume quase nada, só velas vermelhas sangrando devagar por meses.
Parte de mim quer se empolgar. A outra parte lembra quantos desses gráficos de "reversão" eu já vi em tokens antigos de DeFi que dispararam 60% e depois devolveram tudo em silêncio no mês seguinte, quando os compradores iniciais tiraram o lucro. DODO especificamente — não é obscuro, é um DEX de verdade, modelo PMM, existe desde 2020. Isso não é nada. Mas ser real e estar pronto para rodar não é a mesma coisa.
Sinceramente, ainda não sei o que fazer com isso. Não encontrei nenhuma notícia clara por trás, o que me deixa mais cauteloso, não menos — movimentos sem uma história ligada são os que mais rápido invertem quando o volume inicial seca. Vou observar se ele sustenta acima daquela antiga zona de resistência antes de eu chamar isso de algo além de um dia verde muito barulhento em um gráfico que, na maior parte, foi esquecido.
#Write2Earrn
Peguei o gráfico $DODO bem no meio do pico esta manhã e fiquei ali por um segundo rolando de volta. De 0.0128 até 0.0304 em — o quê, semanas? E eu lembro quando isso era basicamente um gráfico fantasma. Ninguém falava sobre isso, volume quase nada, só velas vermelhas sangrando devagar por meses.
Parte de mim quer se empolgar. A outra parte lembra quantos desses gráficos de "reversão" eu já vi em tokens antigos de DeFi que dispararam 60% e depois devolveram tudo em silêncio no mês seguinte, quando os compradores iniciais tiraram o lucro. DODO especificamente — não é obscuro, é um DEX de verdade, modelo PMM, existe desde 2020. Isso não é nada. Mas ser real e estar pronto para rodar não é a mesma coisa.
Sinceramente, ainda não sei o que fazer com isso. Não encontrei nenhuma notícia clara por trás, o que me deixa mais cauteloso, não menos — movimentos sem uma história ligada são os que mais rápido invertem quando o volume inicial seca. Vou observar se ele sustenta acima daquela antiga zona de resistência antes de eu chamar isso de algo além de um dia verde muito barulhento em um gráfico que, na maior parte, foi esquecido.
#Write2Earrn
Parte de mim quer se empolgar. A outra parte lembra quantos desses gráficos de "reversão" eu já vi em tokens antigos de DeFi que dispararam 60% e depois devolveram tudo em silêncio no mês seguinte, quando os compradores iniciais tiraram o lucro. DODO especificamente — não é obscuro, é um DEX de verdade, modelo PMM, existe desde 2020. Isso não é nada. Mas ser real e estar pronto para rodar não é a mesma coisa.
Sinceramente, ainda não sei o que fazer com isso. Não encontrei nenhuma notícia clara por trás, o que me deixa mais cauteloso, não menos — movimentos sem uma história ligada são os que mais rápido invertem quando o volume inicial seca. Vou observar se ele sustenta acima daquela antiga zona de resistência antes de eu chamar isso de algo além de um dia verde muito barulhento em um gráfico que, na maior parte, foi esquecido.
#Write2Earrn
119
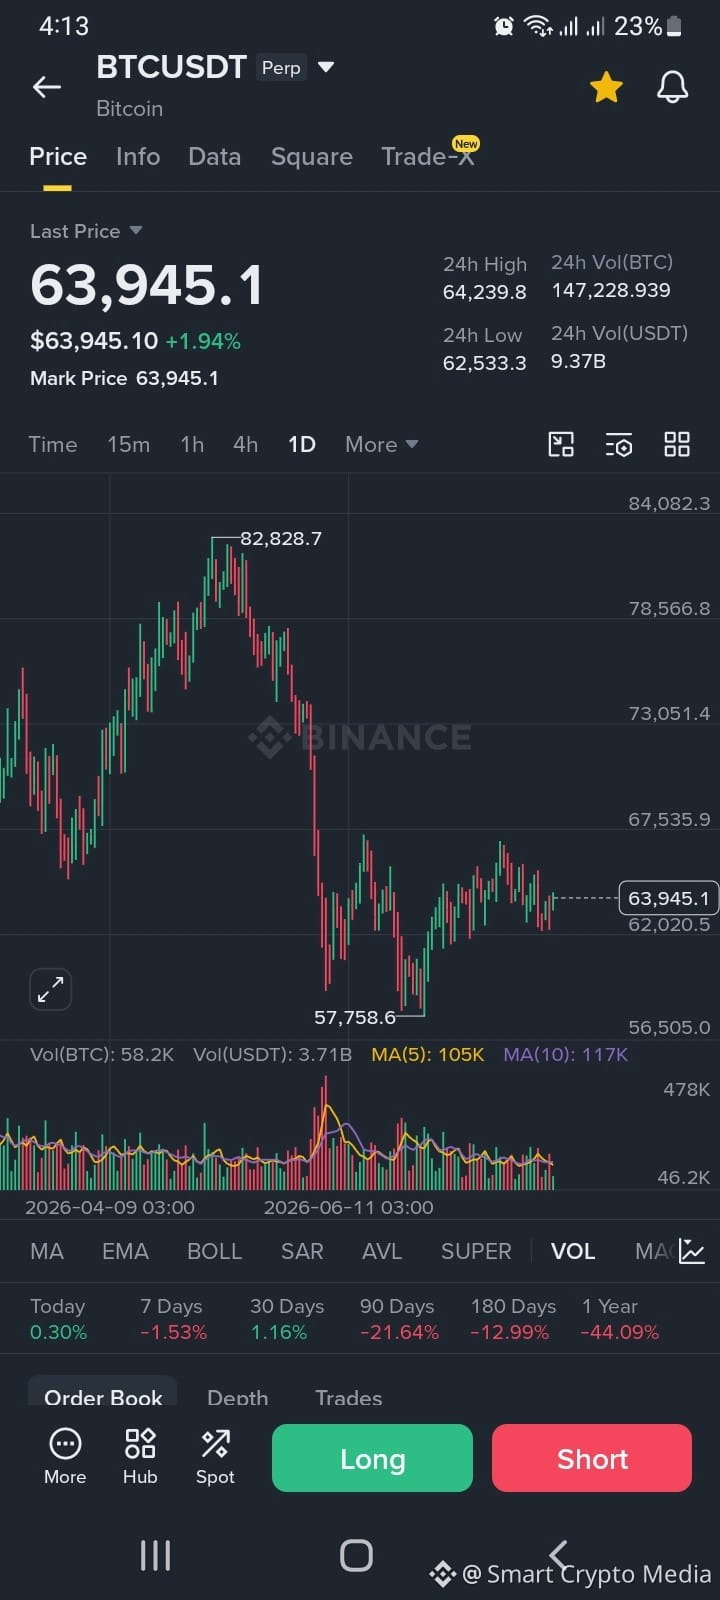
Tenho encarado esse gráfico $BTC por mais tempo do que provavelmente deveria hoje. Há algo quase hipnótico em ver uma moeda perder 30% e depois passar dois meses... andando de lado, recusando-se a se comprometer com qualquer direção. 57,7K em junho pareceu pânico. 64K agora parece... não sei, otimismo cauteloso? Ou exaustão. Às vezes é difícil dizer a diferença. Eu fico voltando e indo e voltando sobre se isso é realmente significativo ou se eu só estou fazendo correspondência de padrões porque quero que signifique alguma coisa. O número de 90 dias ainda está profundamente vermelho, -21,64%, e ainda assim a vela verde de hoje faz as pessoas (eu incluso, honestamente) sentirem que as coisas estão virando. Essa lacuna entre os dados e a sensação é onde eu acho que a maioria de nós se mete em problemas. Eu não tenho uma conclusão clara aqui. Parte de mim quer dizer que o pior já ficou para trás porque o preço estabilizou acima de 57K há semanas. Parte de mim lembra que os mercados se estabilizam bem antes de deixarem de se estabilizar. Talvez a resposta mais honesta seja: ainda não sei, e ninguém que posta gráficos confiantes hoje também sabe. Observando $64.239 de perto, porém — esse é o nível que disse não algumas vezes agora.
#Write2Earn
Tenho encarado esse gráfico $BTC por mais tempo do que provavelmente deveria hoje. Há algo quase hipnótico em ver uma moeda perder 30% e depois passar dois meses... andando de lado, recusando-se a se comprometer com qualquer direção. 57,7K em junho pareceu pânico. 64K agora parece... não sei, otimismo cauteloso? Ou exaustão. Às vezes é difícil dizer a diferença. Eu fico voltando e indo e voltando sobre se isso é realmente significativo ou se eu só estou fazendo correspondência de padrões porque quero que signifique alguma coisa. O número de 90 dias ainda está profundamente vermelho, -21,64%, e ainda assim a vela verde de hoje faz as pessoas (eu incluso, honestamente) sentirem que as coisas estão virando. Essa lacuna entre os dados e a sensação é onde eu acho que a maioria de nós se mete em problemas. Eu não tenho uma conclusão clara aqui. Parte de mim quer dizer que o pior já ficou para trás porque o preço estabilizou acima de 57K há semanas. Parte de mim lembra que os mercados se estabilizam bem antes de deixarem de se estabilizar. Talvez a resposta mais honesta seja: ainda não sei, e ninguém que posta gráficos confiantes hoje também sabe. Observando $64.239 de perto, porém — esse é o nível que disse não algumas vezes agora.
#Write2Earn
#Write2Earn
94
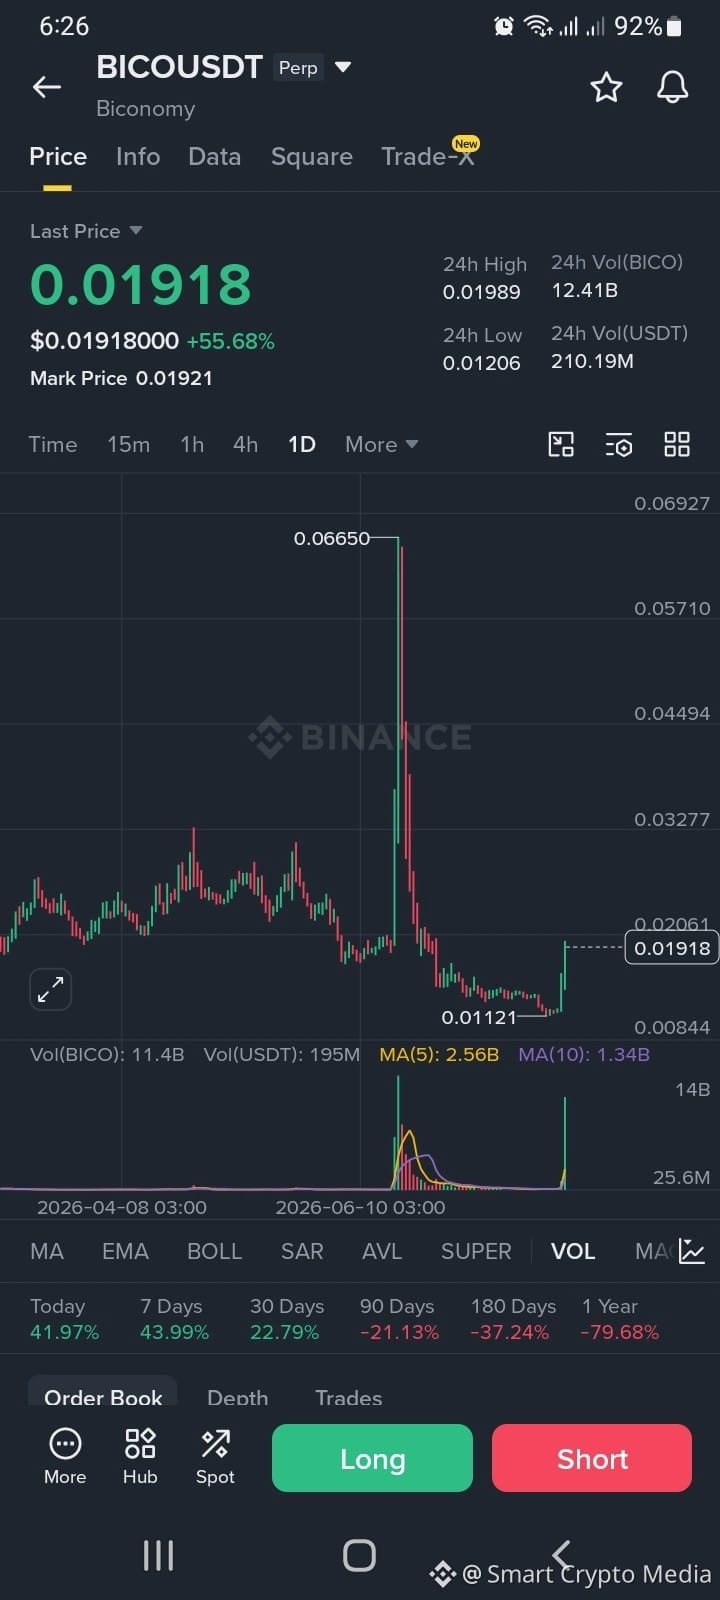
$BICO Olhei para o gráfico da BICO duas vezes.
Primeira reação? "Eu perdi."
Então olhei de novo.
Aquele candle enorme... o pico antigo de meses atrás... a longa queda depois dele. Padrão estranho. Me lembra o quanto as emoções mudam rápido no cripto.
Ontem algo parecia invisível.
Hoje todo mundo percebe.
Estou tentando não deixar as velas verdes tomarem decisões por mim. Mais fácil falar do que fazer. O medo de perder (FOMO) é real, especialmente quando o volume explode e os feeds sociais de repente ficam otimistas.
Talvez seja o começo de algo maior.
Talvez seja só o mercado acordando por um dia antes de voltar a dormir.
Eu sinceramente não sei.
Por isso acho que as próximas sessões de negociação importam mais do que a empolgação de hoje. Tendências não são construídas com uma única vela. Elas são feitas de confirmações repetidas, maior participação e compradores que não somem depois do primeiro impulso.
A BICO voltou a chamar a atenção de todo mundo.
Agora o mercado precisa decidir se essa atenção vira convicção... ou apenas mais uma história de curta duração.
#Write2Earn!
$BICO Olhei para o gráfico da BICO duas vezes.
Primeira reação? "Eu perdi."
Então olhei de novo.
Aquele candle enorme... o pico antigo de meses atrás... a longa queda depois dele. Padrão estranho. Me lembra o quanto as emoções mudam rápido no cripto.
Ontem algo parecia invisível.
Hoje todo mundo percebe.
Estou tentando não deixar as velas verdes tomarem decisões por mim. Mais fácil falar do que fazer. O medo de perder (FOMO) é real, especialmente quando o volume explode e os feeds sociais de repente ficam otimistas.
Talvez seja o começo de algo maior.
Talvez seja só o mercado acordando por um dia antes de voltar a dormir.
Eu sinceramente não sei.
Por isso acho que as próximas sessões de negociação importam mais do que a empolgação de hoje. Tendências não são construídas com uma única vela. Elas são feitas de confirmações repetidas, maior participação e compradores que não somem depois do primeiro impulso.
A BICO voltou a chamar a atenção de todo mundo.
Agora o mercado precisa decidir se essa atenção vira convicção... ou apenas mais uma história de curta duração.
#Write2Earn!
Primeira reação? "Eu perdi."
Então olhei de novo.
Aquele candle enorme... o pico antigo de meses atrás... a longa queda depois dele. Padrão estranho. Me lembra o quanto as emoções mudam rápido no cripto.
Ontem algo parecia invisível.
Hoje todo mundo percebe.
Estou tentando não deixar as velas verdes tomarem decisões por mim. Mais fácil falar do que fazer. O medo de perder (FOMO) é real, especialmente quando o volume explode e os feeds sociais de repente ficam otimistas.
Talvez seja o começo de algo maior.
Talvez seja só o mercado acordando por um dia antes de voltar a dormir.
Eu sinceramente não sei.
Por isso acho que as próximas sessões de negociação importam mais do que a empolgação de hoje. Tendências não são construídas com uma única vela. Elas são feitas de confirmações repetidas, maior participação e compradores que não somem depois do primeiro impulso.
A BICO voltou a chamar a atenção de todo mundo.
Agora o mercado precisa decidir se essa atenção vira convicção... ou apenas mais uma história de curta duração.
#Write2Earn!
142
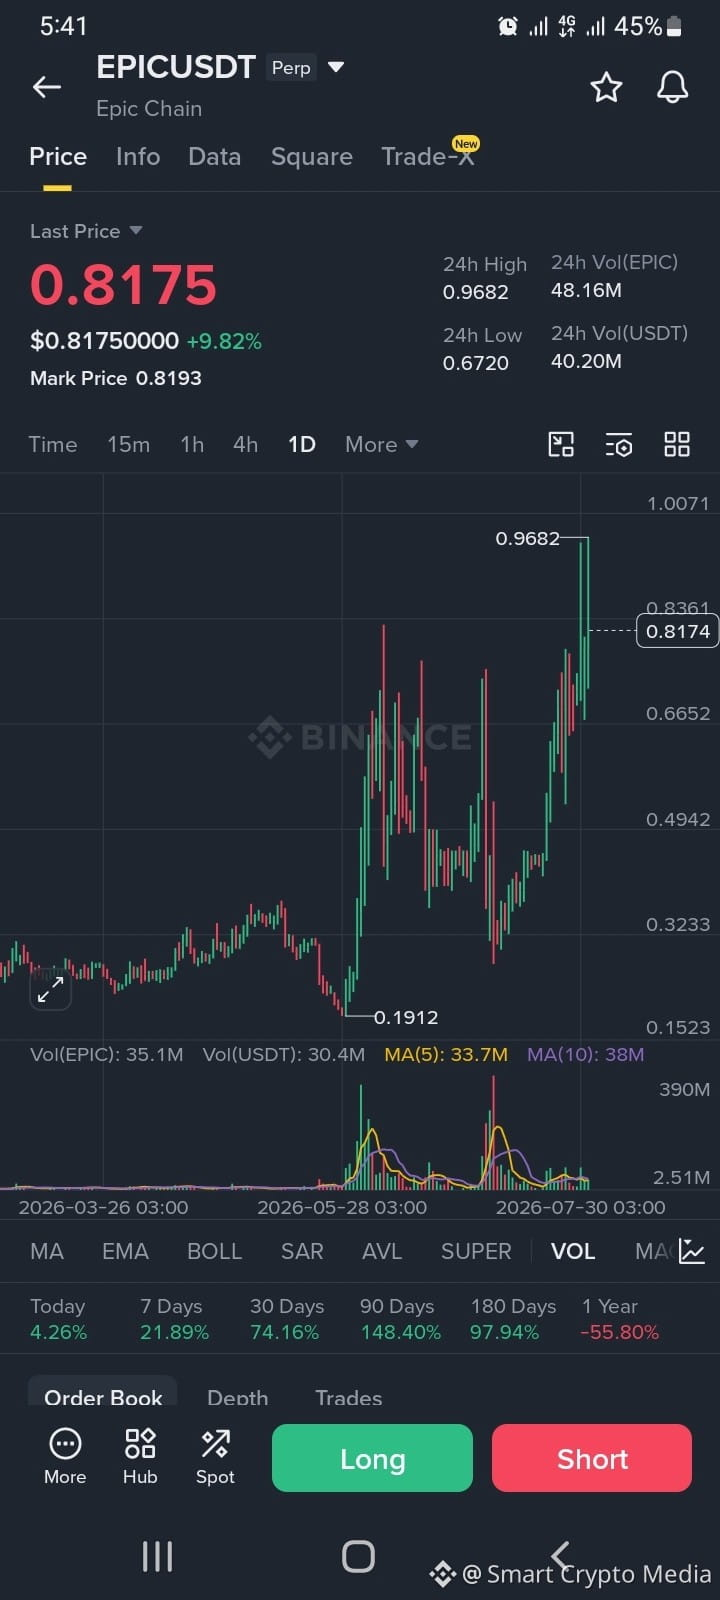
$EPIC é de 0,19 a 0,97 em cerca de seis semanas — essa é a faixa real no gráfico diário da EPIC, não um número de manchete arredondado. Neste momento, está por volta de 0,8175, perto de 10% no dia, depois de marcar 0,9682 e recuar a partir dele.
O que vale separar aqui é a diferença entre o movimento e o motivo. O movimento é mecânico: é um token de baixa liquidez e com “float” fino, e “float” fino mais um pico de demanda é basicamente a receita para uma sequência de vela cinco-x. Você também consegue ver isso no painel de volume — dois picos distintos nas linhas de MA(5)/MA(10), ambos coincidindo com as pernas mais fortes na subida.
O motivo, pelo que consigo ver, se conecta ao posicionamento da Epic Chain como um projeto de tokenização de ativos do mundo real — propriedade fracionada de coisas como imóveis e colecionáveis colocados on-chain. Essa narrativa vem ganhando atenção em vários small-caps neste ciclo, e a EPIC continua aparecendo nessa conversa.
A parte que eu realmente observaria não é a vela diária, e sim os números em múltiplos períodos abaixo dela: 7 dias +21,9%, 30 dias +74,2%, 90 dias +148,4% — uma curva realmente íngreme. Se essa curva mantém o formato ou se devolve, do jeito que a última perna de 0,9682 caiu para 0,67 em 24 horas, é a questão real, e é algo que vou continuar acompanhando em vez de responder hoje.
#Epic #SmartCryptoMedia #writetoearn
$EPIC é de 0,19 a 0,97 em cerca de seis semanas — essa é a faixa real no gráfico diário da EPIC, não um número de manchete arredondado. Neste momento, está por volta de 0,8175, perto de 10% no dia, depois de marcar 0,9682 e recuar a partir dele.
O que vale separar aqui é a diferença entre o movimento e o motivo. O movimento é mecânico: é um token de baixa liquidez e com “float” fino, e “float” fino mais um pico de demanda é basicamente a receita para uma sequência de vela cinco-x. Você também consegue ver isso no painel de volume — dois picos distintos nas linhas de MA(5)/MA(10), ambos coincidindo com as pernas mais fortes na subida.
O motivo, pelo que consigo ver, se conecta ao posicionamento da Epic Chain como um projeto de tokenização de ativos do mundo real — propriedade fracionada de coisas como imóveis e colecionáveis colocados on-chain. Essa narrativa vem ganhando atenção em vários small-caps neste ciclo, e a EPIC continua aparecendo nessa conversa.
A parte que eu realmente observaria não é a vela diária, e sim os números em múltiplos períodos abaixo dela: 7 dias +21,9%, 30 dias +74,2%, 90 dias +148,4% — uma curva realmente íngreme. Se essa curva mantém o formato ou se devolve, do jeito que a última perna de 0,9682 caiu para 0,67 em 24 horas, é a questão real, e é algo que vou continuar acompanhando em vez de responder hoje.
#Epic #SmartCryptoMedia #writetoearn
O que vale separar aqui é a diferença entre o movimento e o motivo. O movimento é mecânico: é um token de baixa liquidez e com “float” fino, e “float” fino mais um pico de demanda é basicamente a receita para uma sequência de vela cinco-x. Você também consegue ver isso no painel de volume — dois picos distintos nas linhas de MA(5)/MA(10), ambos coincidindo com as pernas mais fortes na subida.
O motivo, pelo que consigo ver, se conecta ao posicionamento da Epic Chain como um projeto de tokenização de ativos do mundo real — propriedade fracionada de coisas como imóveis e colecionáveis colocados on-chain. Essa narrativa vem ganhando atenção em vários small-caps neste ciclo, e a EPIC continua aparecendo nessa conversa.
A parte que eu realmente observaria não é a vela diária, e sim os números em múltiplos períodos abaixo dela: 7 dias +21,9%, 30 dias +74,2%, 90 dias +148,4% — uma curva realmente íngreme. Se essa curva mantém o formato ou se devolve, do jeito que a última perna de 0,9682 caiu para 0,67 em 24 horas, é a questão real, e é algo que vou continuar acompanhando em vez de responder hoje.
#Epic #SmartCryptoMedia #writetoearn
188
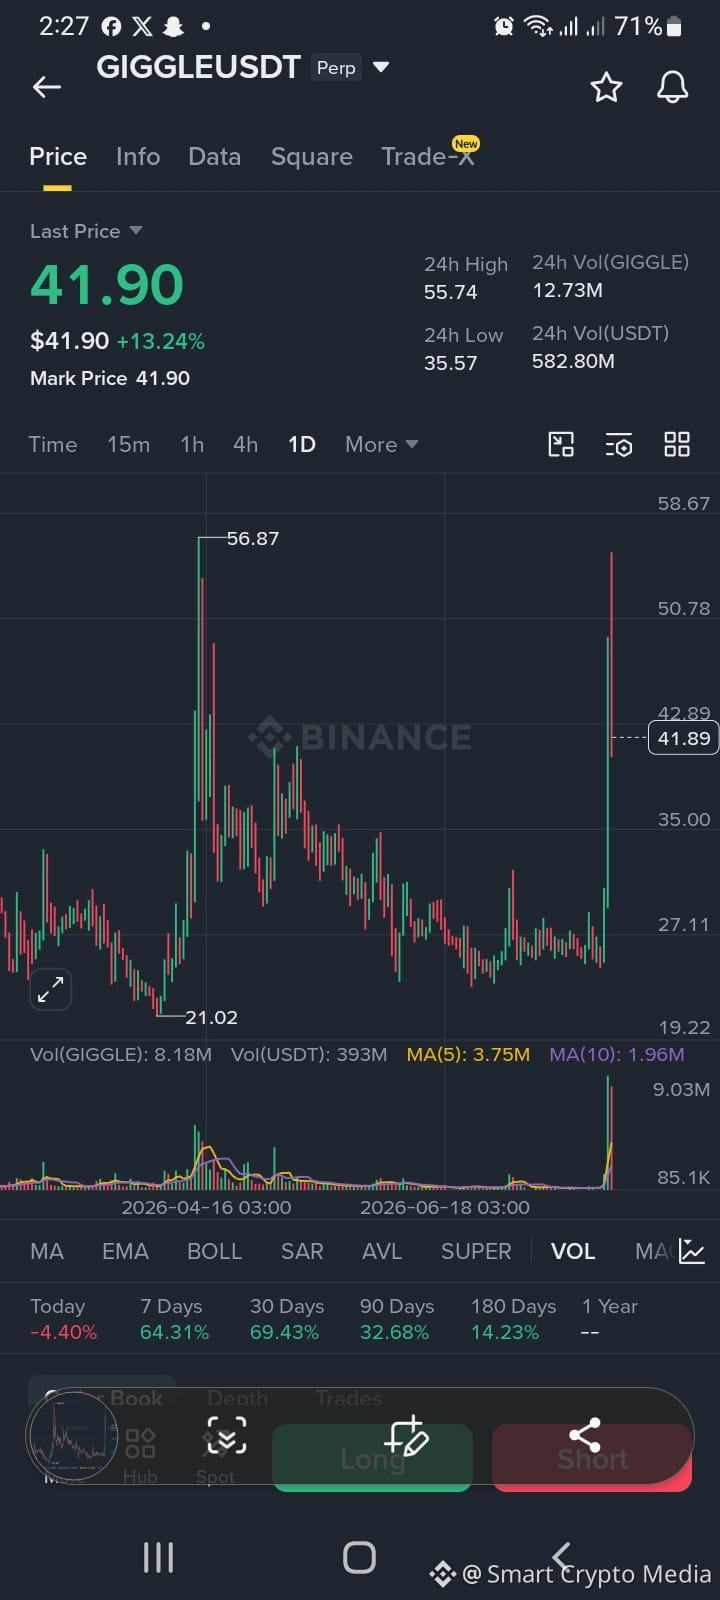
$GIGGLE Abri o gráfico do GIGGLE hoje e fiquei só olhando por um segundo. Mínima de 21, pico de 56, agora pairando em torno de 42. Isso nem é um gráfico — é um monitor de frequência cardíaca. E, de alguma forma, está ligado a um fundo de caridade, uma combinação tão estranha que eu ainda não sei exatamente o que fazer com isso emocionalmente.
Parte de mim quer torcer por isso — dinheiro indo para a educação porque as pessoas quiseram visibilidade para um meme é um acidente genuinamente estranho e, ao mesmo tempo, bonito, se funcionar. A outra parte só fica observando as sombras (wicks) e pensando em todo mundo que comprou o topo de 56 uma hora antes dele cair de volta.
Eu não acho que esses dois sentimentos se anulem. Eu acho que os dois são verdade ao mesmo tempo, e é exatamente isso que negociar memecoins com uma missão parece de forma geral: esperança e matemática lado a lado de um jeito desconfortável. Eu não vou fingir que tenho convicção sobre para onde isso vai a partir daqui. Eu não tenho. Eu só continuo atualizando o gráfico, meio investido no preço, meio investido em saber se o número da doação vai continuar subindo, independentemente do que as velas fazem.
#writetoearn
$GIGGLE Abri o gráfico do GIGGLE hoje e fiquei só olhando por um segundo. Mínima de 21, pico de 56, agora pairando em torno de 42. Isso nem é um gráfico — é um monitor de frequência cardíaca. E, de alguma forma, está ligado a um fundo de caridade, uma combinação tão estranha que eu ainda não sei exatamente o que fazer com isso emocionalmente.
Parte de mim quer torcer por isso — dinheiro indo para a educação porque as pessoas quiseram visibilidade para um meme é um acidente genuinamente estranho e, ao mesmo tempo, bonito, se funcionar. A outra parte só fica observando as sombras (wicks) e pensando em todo mundo que comprou o topo de 56 uma hora antes dele cair de volta.
Eu não acho que esses dois sentimentos se anulem. Eu acho que os dois são verdade ao mesmo tempo, e é exatamente isso que negociar memecoins com uma missão parece de forma geral: esperança e matemática lado a lado de um jeito desconfortável. Eu não vou fingir que tenho convicção sobre para onde isso vai a partir daqui. Eu não tenho. Eu só continuo atualizando o gráfico, meio investido no preço, meio investido em saber se o número da doação vai continuar subindo, independentemente do que as velas fazem.
#writetoearn
Parte de mim quer torcer por isso — dinheiro indo para a educação porque as pessoas quiseram visibilidade para um meme é um acidente genuinamente estranho e, ao mesmo tempo, bonito, se funcionar. A outra parte só fica observando as sombras (wicks) e pensando em todo mundo que comprou o topo de 56 uma hora antes dele cair de volta.
Eu não acho que esses dois sentimentos se anulem. Eu acho que os dois são verdade ao mesmo tempo, e é exatamente isso que negociar memecoins com uma missão parece de forma geral: esperança e matemática lado a lado de um jeito desconfortável. Eu não vou fingir que tenho convicção sobre para onde isso vai a partir daqui. Eu não tenho. Eu só continuo atualizando o gráfico, meio investido no preço, meio investido em saber se o número da doação vai continuar subindo, independentemente do que as velas fazem.
#writetoearn
266
Inicia sessão para explorar mais conteúdos
Junta-te a utilizadores de criptomoedas de todo o mundo na Binance Square
⚡️ Obtém informações úteis e recentes sobre criptomoedas.
💬 Com a confiança da maior exchange de criptomoedas do mundo.
👍 Descobre perspetivas reais de criadores verificados.
E-mail/Número de telefone
Tópicos em Tendência
ADAGains10%Above$0.27
12,090 visualizações
164 a discutir
#ADAGains10%Above$0.27
ADA recupera US$ 0,27 com pump de dois dígitos.
Catalisador: lançamento oficial do RealFi na mainnet da Cardano. Integração de RWA e infraestrutura de stablecoins.
Níveis técnicos:
Resistência: US$ 0,2887. Fechamento diário com volume acima abre caminho para US$ 0,30–0,31.
Suporte: US$ 0,2600. Perder esse nível sinaliza exaustão e devolve momentum para os ursos.
Cautela: RSI na casa dos 70 em curto prazo. Sobrecompra após expansão vertical.
ADA tem combustível para US$ 0,30 ou retesta o suporte primeiro?
Aviso: análise técnica apenas para fins educacionais. Não é aconselhamento financeiro. DYOR.
$ADA $RLC $FLUID
#ADA
Green Rock Sinal
·1 gostos
·95 visualizações
ETHUp70%InQ3ButLiquidityFalls
135,327 visualizações
985 a discutir
EthStakingExitQueueHits2026High
47,783 visualizações
711 a discutir