

MBE 1
48 Publicações

MBE 1
Denunciar
Bloquear Utilizador
Analyzing narratives and professional trader since 2017
x => https://x.com/0xBatu_
0 A seguir
0 Seguidores
0 Gostaram
Publicações
·
--
Ver tradução
$ETH | DAILY UPDATE ETH is around $2,357, trying to stabilise after the October decline. The recent low near $2,282 has held so far, but price is still below the support it lost earlier this month. That keeps this in the recovery-attempt stage for me. My first condition is a daily close above $2,406 and a successful hold or retest. The recent $2,392 high sits just below that area, so I want to see buyers work through the whole zone. After that, $2,527 is the next resistance, with $2,580 only coming into focus if that also clears. On the downside, $2,282 is the main support I’m watching. A daily close below it with no recovery would put the $2,200 round-number area on the map. I would treat that as a reference to reassess, not an automatic bounce level. The previous three weekly candles closed lower, and this week’s candle is still open. Holding support helps, but reclaiming lost resistance would give me stronger evidence that the pressure is easing. Hope this helps you with your own charts. 🫶 Give me a follow if you’d like to see more, I’ll keep sharing what I’m watching.
$ETH | DAILY UPDATE ETH is around $2,357, trying to stabilise after the October decline. The recent low near $2,282 has held so far, but price is still below the support it lost earlier this month. That keeps this in the recovery-attempt stage for me. My first condition is a daily close above $2,406 and a successful hold or retest. The recent $2,392 high sits just below that area, so I want to see buyers work through the whole zone. After that, $2,527 is the next resistance, with $2,580 only coming into focus if that also clears. On the downside, $2,282 is the main support I’m watching. A daily close below it with no recovery would put the $2,200 round-number area on the map. I would treat that as a reference to reassess, not an automatic bounce level. The previous three weekly candles closed lower, and this week’s candle is still open. Holding support helps, but reclaiming lost resistance would give me stronger evidence that the pressure is easing. Hope this helps you with your own charts. 🫶 Give me a follow if you’d like to see more, I’ll keep sharing what I’m watching.

·
--
Ver tradução
$ARB | DAILY UPDATE ARB is around $0.173 after another test of the $0.162 area. Buyers have defended that region several times this month, but price is still below the levels lost during October’s decline. A bounce alone does not repair that structure. The first improvement I want is a daily close above $0.1786, followed by a hold or retest. That would bring the earlier $0.1884 level into focus. Clearing that as well would make $0.2041 the next larger resistance to watch. The key support is $0.1621, close to the recent lows. If ARB closes below it and cannot reclaim the area, I’d watch the $0.1500 round-number region next. That is a reference area, not a guaranteed floor. The weekly chart still shows a pullback from September’s peak, with successive recovery attempts failing lower. This week’s candle is unfinished. I want buyers to take back resistance before treating the current support defence as a confirmed reversal. Hope this helps you with your own charts. 🫶 Give me a follow if you’d like to see more, I’ll keep sharing what I’m watching.
$ARB | DAILY UPDATE ARB is around $0.173 after another test of the $0.162 area. Buyers have defended that region several times this month, but price is still below the levels lost during October’s decline. A bounce alone does not repair that structure. The first improvement I want is a daily close above $0.1786, followed by a hold or retest. That would bring the earlier $0.1884 level into focus. Clearing that as well would make $0.2041 the next larger resistance to watch. The key support is $0.1621, close to the recent lows. If ARB closes below it and cannot reclaim the area, I’d watch the $0.1500 round-number region next. That is a reference area, not a guaranteed floor. The weekly chart still shows a pullback from September’s peak, with successive recovery attempts failing lower. This week’s candle is unfinished. I want buyers to take back resistance before treating the current support defence as a confirmed reversal. Hope this helps you with your own charts. 🫶 Give me a follow if you’d like to see more, I’ll keep sharing what I’m watching.

·
--
Ver tradução
$SOMI | DAILY UPDATE SOMI is around $0.192 after bouncing from $0.1683. Yesterday closed at $0.1954, above the previous $0.1933 hurdle, but today has slipped back below it. That makes the hold more important than the initial breakout. I want to see a daily close back above $0.1933, followed by a successful retest. The recent $0.1978 high is the next test, then $0.2053. Clearing those would bring $0.2210 into focus, where the earlier recovery ran into selling. On a pullback, I am watching the $0.1790 to $0.1810 area. A close below $0.1790 with no recovery would put $0.1683 back on the map. Losing that low would weaken the current rebound considerably. The bounce is encouraging, but the broader sequence of lower highs still needs repairing. Today’s candle and the weekly candle are both open, so I’m keeping the confirmation separate from the possibility. Hope this helps you with your own charts. 🫶 Give me a follow if you’d like to see more, I’ll keep sharing what I’m watching.
$SOMI | DAILY UPDATE SOMI is around $0.192 after bouncing from $0.1683. Yesterday closed at $0.1954, above the previous $0.1933 hurdle, but today has slipped back below it. That makes the hold more important than the initial breakout. I want to see a daily close back above $0.1933, followed by a successful retest. The recent $0.1978 high is the next test, then $0.2053. Clearing those would bring $0.2210 into focus, where the earlier recovery ran into selling. On a pullback, I am watching the $0.1790 to $0.1810 area. A close below $0.1790 with no recovery would put $0.1683 back on the map. Losing that low would weaken the current rebound considerably. The bounce is encouraging, but the broader sequence of lower highs still needs repairing. Today’s candle and the weekly candle are both open, so I’m keeping the confirmation separate from the possibility. Hope this helps you with your own charts. 🫶 Give me a follow if you’d like to see more, I’ll keep sharing what I’m watching.

·
--
Ver tradução
$SOL | DAILY UPDATE SOL is around $101.80 and still trying to build support near $100 after the pullback from September’s rally. Buyers have defended the October low so far, but the daily recovery highs are still getting lower. My first condition is a daily close above $103.85 and a successful hold or retest. That would put the earlier $105.71 level back in focus. Clearing that as well would make $109.20 the next meaningful resistance. The main support I’m watching is $98.62. If SOL closes below it and cannot recover, the September base near $95.82 comes back into view. Holding $100 during the day would not cancel that risk on its own. This week’s candle is still open and remains inside last week’s range so far. I want to see buyers take back a recovery high before treating the current base as a confirmed reversal. Hope this helps you with your own charts. 🫶 Give me a follow if you’d like to see more, I’ll keep sharing what I’m watching.
$SOL | DAILY UPDATE SOL is around $101.80 and still trying to build support near $100 after the pullback from September’s rally. Buyers have defended the October low so far, but the daily recovery highs are still getting lower. My first condition is a daily close above $103.85 and a successful hold or retest. That would put the earlier $105.71 level back in focus. Clearing that as well would make $109.20 the next meaningful resistance. The main support I’m watching is $98.62. If SOL closes below it and cannot recover, the September base near $95.82 comes back into view. Holding $100 during the day would not cancel that risk on its own. This week’s candle is still open and remains inside last week’s range so far. I want to see buyers take back a recovery high before treating the current base as a confirmed reversal. Hope this helps you with your own charts. 🫶 Give me a follow if you’d like to see more, I’ll keep sharing what I’m watching.

·
--
Ver tradução
TOTAL3 | DAILY UPDATE TOTAL3 is around $772B after retreating from the September area near $855B. This index excludes Bitcoin and Ethereum, so I use it to follow the market beyond those two largest assets. The $750B area is the first support I’m watching. Holding it would give the market room to rebuild, but I want a daily close above $795B and a successful retest before calling the recovery more convincing. Above $795B, $825B is the next resistance. If that also clears and holds, the larger $855B region becomes relevant again. A brief move above one level would not confirm the whole recovery. If $750B breaks and the index cannot recover it, I’d watch the broader $720B base. The weekly chart is still dealing with the pullback from its September recovery high, and this week’s candle is unfinished. I want stronger closes before assuming broad altcoin strength has returned. Hope this helps you with your own charts. 🫶 Give me a follow if you’d like to see more, I’ll keep sharing what I’m watching.
TOTAL3 | DAILY UPDATE TOTAL3 is around $772B after retreating from the September area near $855B. This index excludes Bitcoin and Ethereum, so I use it to follow the market beyond those two largest assets. The $750B area is the first support I’m watching. Holding it would give the market room to rebuild, but I want a daily close above $795B and a successful retest before calling the recovery more convincing. Above $795B, $825B is the next resistance. If that also clears and holds, the larger $855B region becomes relevant again. A brief move above one level would not confirm the whole recovery. If $750B breaks and the index cannot recover it, I’d watch the broader $720B base. The weekly chart is still dealing with the pullback from its September recovery high, and this week’s candle is unfinished. I want stronger closes before assuming broad altcoin strength has returned. Hope this helps you with your own charts. 🫶 Give me a follow if you’d like to see more, I’ll keep sharing what I’m watching.

·
--
Ver tradução
TOTAL2 | DAILY UPDATE TOTAL2 is around $1.06T, holding above the $1.03T support area after pulling back from roughly $1.20T. This is TradingView’s crypto market-cap index excluding Bitcoin, not the price of a tradable coin. The first improvement I want is a daily close above $1.08T, followed by a successful hold or retest. After that, $1.11T is the next resistance. Clearing that area would put the larger $1.20T zone back on the map. If $1.03T breaks and the index cannot recover it, I’d watch the $1.00T base. That would weaken the current support test and leave the broader recovery looking less secure. The weekly pullback has not yet turned into a confirmed reversal. I’m watching whether the market can rebuild above these lost levels before calling for a broader altcoin recovery. A rise in TOTAL2 alone would not prove that every altcoin is outperforming Bitcoin. Hope this helps you with your own charts. 🫶 Give me a follow if you’d like to see more, I’ll keep sharing what I’m watching.
TOTAL2 | DAILY UPDATE TOTAL2 is around $1.06T, holding above the $1.03T support area after pulling back from roughly $1.20T. This is TradingView’s crypto market-cap index excluding Bitcoin, not the price of a tradable coin. The first improvement I want is a daily close above $1.08T, followed by a successful hold or retest. After that, $1.11T is the next resistance. Clearing that area would put the larger $1.20T zone back on the map. If $1.03T breaks and the index cannot recover it, I’d watch the $1.00T base. That would weaken the current support test and leave the broader recovery looking less secure. The weekly pullback has not yet turned into a confirmed reversal. I’m watching whether the market can rebuild above these lost levels before calling for a broader altcoin recovery. A rise in TOTAL2 alone would not prove that every altcoin is outperforming Bitcoin. Hope this helps you with your own charts. 🫶 Give me a follow if you’d like to see more, I’ll keep sharing what I’m watching.

27
·
--
Ver tradução
$ZEC | DAILY UPDATE ZEC is back around $1,300 after recovering from the October low near $1,049. The rebound is holding above last week’s close, but buyers are still trading below the recent recovery highs. The first level I want to see cleared is $1,331 on a daily close, followed by a successful hold or retest. After that, the $1,368–$1,385 resistance area matters. Clearing that cluster would make the late-September region around $1,495 more relevant again. On the downside, $1,178 is this week’s support reference. If it breaks and ZEC cannot reclaim it, I’d watch the earlier $1,110–$1,119 area. Losing support would weaken the current rebound rather than confirm that the low is safely behind us. The weekly candle is still open. It has a higher low so far, but its high remains below last week’s high. I’m watching whether buyers can turn that recovery into a stronger close. Hope this helps you with your own charts. 🫶 Give me a follow if you’d like to see more, I’ll keep sharing what I’m watching.
$ZEC | DAILY UPDATE ZEC is back around $1,300 after recovering from the October low near $1,049. The rebound is holding above last week’s close, but buyers are still trading below the recent recovery highs. The first level I want to see cleared is $1,331 on a daily close, followed by a successful hold or retest. After that, the $1,368–$1,385 resistance area matters. Clearing that cluster would make the late-September region around $1,495 more relevant again. On the downside, $1,178 is this week’s support reference. If it breaks and ZEC cannot reclaim it, I’d watch the earlier $1,110–$1,119 area. Losing support would weaken the current rebound rather than confirm that the low is safely behind us. The weekly candle is still open. It has a higher low so far, but its high remains below last week’s high. I’m watching whether buyers can turn that recovery into a stronger close. Hope this helps you with your own charts. 🫶 Give me a follow if you’d like to see more, I’ll keep sharing what I’m watching.

27
·
--
Ver tradução
$TRX | DAILY UPDATE TRX is around $0.3314 and still moving inside a fairly tight October range. The $0.3270 support area has held several tests, while buyers have struggled to build a recovery above $0.3334. A daily close above $0.3334, followed by a successful hold or retest, would be the first improvement I’m watching. The next resistance is $0.3372. Clearing that would put the late-September $0.3409 high back in focus. If $0.3270 breaks and TRX cannot recover it, I’d watch the September base near $0.3217. Until support actually fails, I would treat that as an alternative scenario rather than assume the range is already breaking down. The weekly candles are overlapping rather than showing a decisive new trend. This week’s candle is also unfinished, so I’m waiting for price to leave the range and defend the move before taking a stronger view. Hope this helps you with your own charts. 🫶 Give me a follow if you’d like to see more, I’ll keep sharing what I’m watching.
$TRX | DAILY UPDATE TRX is around $0.3314 and still moving inside a fairly tight October range. The $0.3270 support area has held several tests, while buyers have struggled to build a recovery above $0.3334. A daily close above $0.3334, followed by a successful hold or retest, would be the first improvement I’m watching. The next resistance is $0.3372. Clearing that would put the late-September $0.3409 high back in focus. If $0.3270 breaks and TRX cannot recover it, I’d watch the September base near $0.3217. Until support actually fails, I would treat that as an alternative scenario rather than assume the range is already breaking down. The weekly candles are overlapping rather than showing a decisive new trend. This week’s candle is also unfinished, so I’m waiting for price to leave the range and defend the move before taking a stronger view. Hope this helps you with your own charts. 🫶 Give me a follow if you’d like to see more, I’ll keep sharing what I’m watching.

46
·
--
Ver tradução
$DOGE | DAILY UPDATE DOGE is back around $0.080 after bouncing from the October low near $0.07478. The recovery is making progress, but it is still approaching resistance rather than breaking into a clear uptrend. I want to see a daily close above $0.08090 and a successful hold or retest. That would bring $0.08380 back into focus. If buyers clear that recovery high too, $0.08814 is the next larger level I’m watching. The first support area is around $0.07600, where the early-week pullback found buyers. If that level fails and DOGE cannot get back above it, the $0.07480 October low becomes the next test. This week is recovering from last week’s weakness, but the weekly candle is still open. For me, a stronger close and defended support would say more than a quick move above resistance during the day. Hope this helps you with your own charts. 🫶 Give me a follow if you’d like to see more, I’ll keep sharing what I’m watching.
$DOGE | DAILY UPDATE DOGE is back around $0.080 after bouncing from the October low near $0.07478. The recovery is making progress, but it is still approaching resistance rather than breaking into a clear uptrend. I want to see a daily close above $0.08090 and a successful hold or retest. That would bring $0.08380 back into focus. If buyers clear that recovery high too, $0.08814 is the next larger level I’m watching. The first support area is around $0.07600, where the early-week pullback found buyers. If that level fails and DOGE cannot get back above it, the $0.07480 October low becomes the next test. This week is recovering from last week’s weakness, but the weekly candle is still open. For me, a stronger close and defended support would say more than a quick move above resistance during the day. Hope this helps you with your own charts. 🫶 Give me a follow if you’d like to see more, I’ll keep sharing what I’m watching.

51
·
--
Ver tradução
$HYPE | DAILY UPDATE HYPE has pushed back above $90 after recovering sharply from the October low near $74.45. The move has taken back several lost levels, but today’s daily candle is still open. The first area I want buyers to defend is $88.12. Holding it on a daily close and a later retest would make this recovery more convincing. Today’s high near $92.15 is the immediate hurdle, with $95.25 the next larger resistance if that level clears. If HYPE falls back below $88.12 and cannot recover it, I’d watch $82.54. Losing that area as well would bring the recent $79.55 region back into focus. A strong green candle still needs support underneath it. This week’s rebound is substantial, but the weekly candle is unfinished. Binance’s spot history for this pair is also short, so I’m keeping the analysis tied to the levels we can actually observe. Hope this helps you with your own charts. 🫶 Give me a follow if you’d like to see more, I’ll keep sharing what I’m watching.
$HYPE | DAILY UPDATE HYPE has pushed back above $90 after recovering sharply from the October low near $74.45. The move has taken back several lost levels, but today’s daily candle is still open. The first area I want buyers to defend is $88.12. Holding it on a daily close and a later retest would make this recovery more convincing. Today’s high near $92.15 is the immediate hurdle, with $95.25 the next larger resistance if that level clears. If HYPE falls back below $88.12 and cannot recover it, I’d watch $82.54. Losing that area as well would bring the recent $79.55 region back into focus. A strong green candle still needs support underneath it. This week’s rebound is substantial, but the weekly candle is unfinished. Binance’s spot history for this pair is also short, so I’m keeping the analysis tied to the levels we can actually observe. Hope this helps you with your own charts. 🫶 Give me a follow if you’d like to see more, I’ll keep sharing what I’m watching.

75
·
--
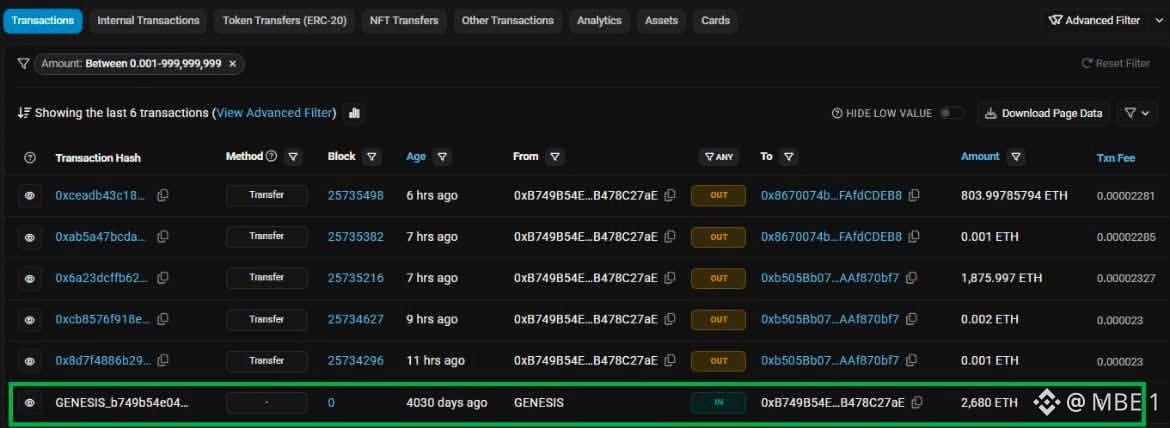
Alguém comprou 2.680 $ETH por apenas US$ 831 em 2015.
Ele manteve por 11 anos e não vendeu apesar de várias grandes quedas.
Hoje, ele transferiu suas participações, que agora valem US$ 5.000.000.
Alguém comprou 2.680 $ETH por apenas US$ 831 em 2015.
Ele manteve por 11 anos e não vendeu apesar de várias grandes quedas.
Hoje, ele transferiu suas participações, que agora valem US$ 5.000.000.
Ele manteve por 11 anos e não vendeu apesar de várias grandes quedas.
Hoje, ele transferiu suas participações, que agora valem US$ 5.000.000.
61
·
--
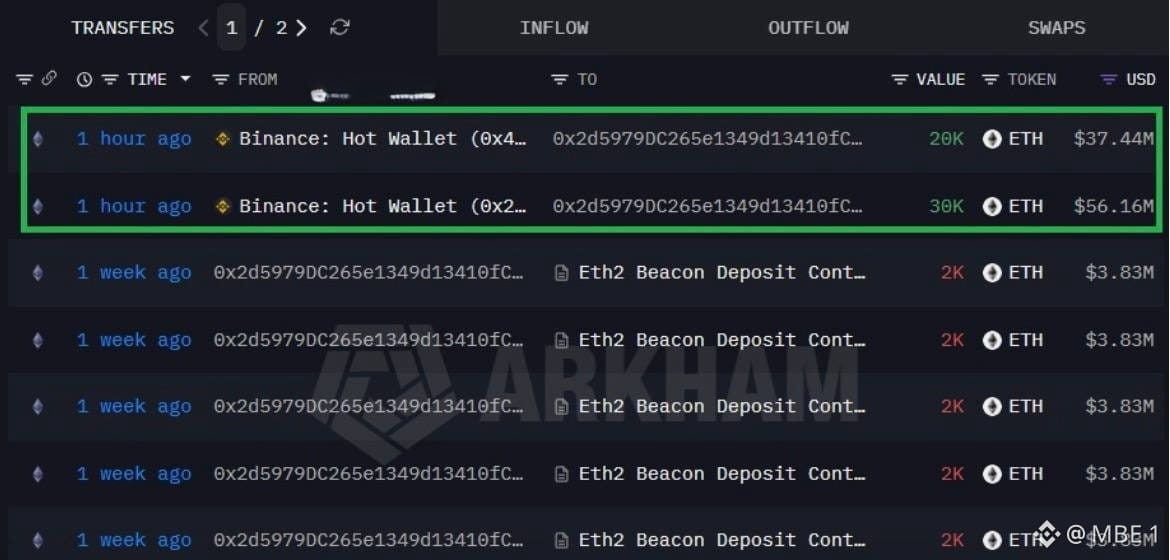
AGORA: Alguém acabou de comprar US$ 93.600.000 em $ETH na Binance
AGORA: Alguém acabou de comprar US$ 93.600.000 em $ETH na Binance
76
·
--
$BTC
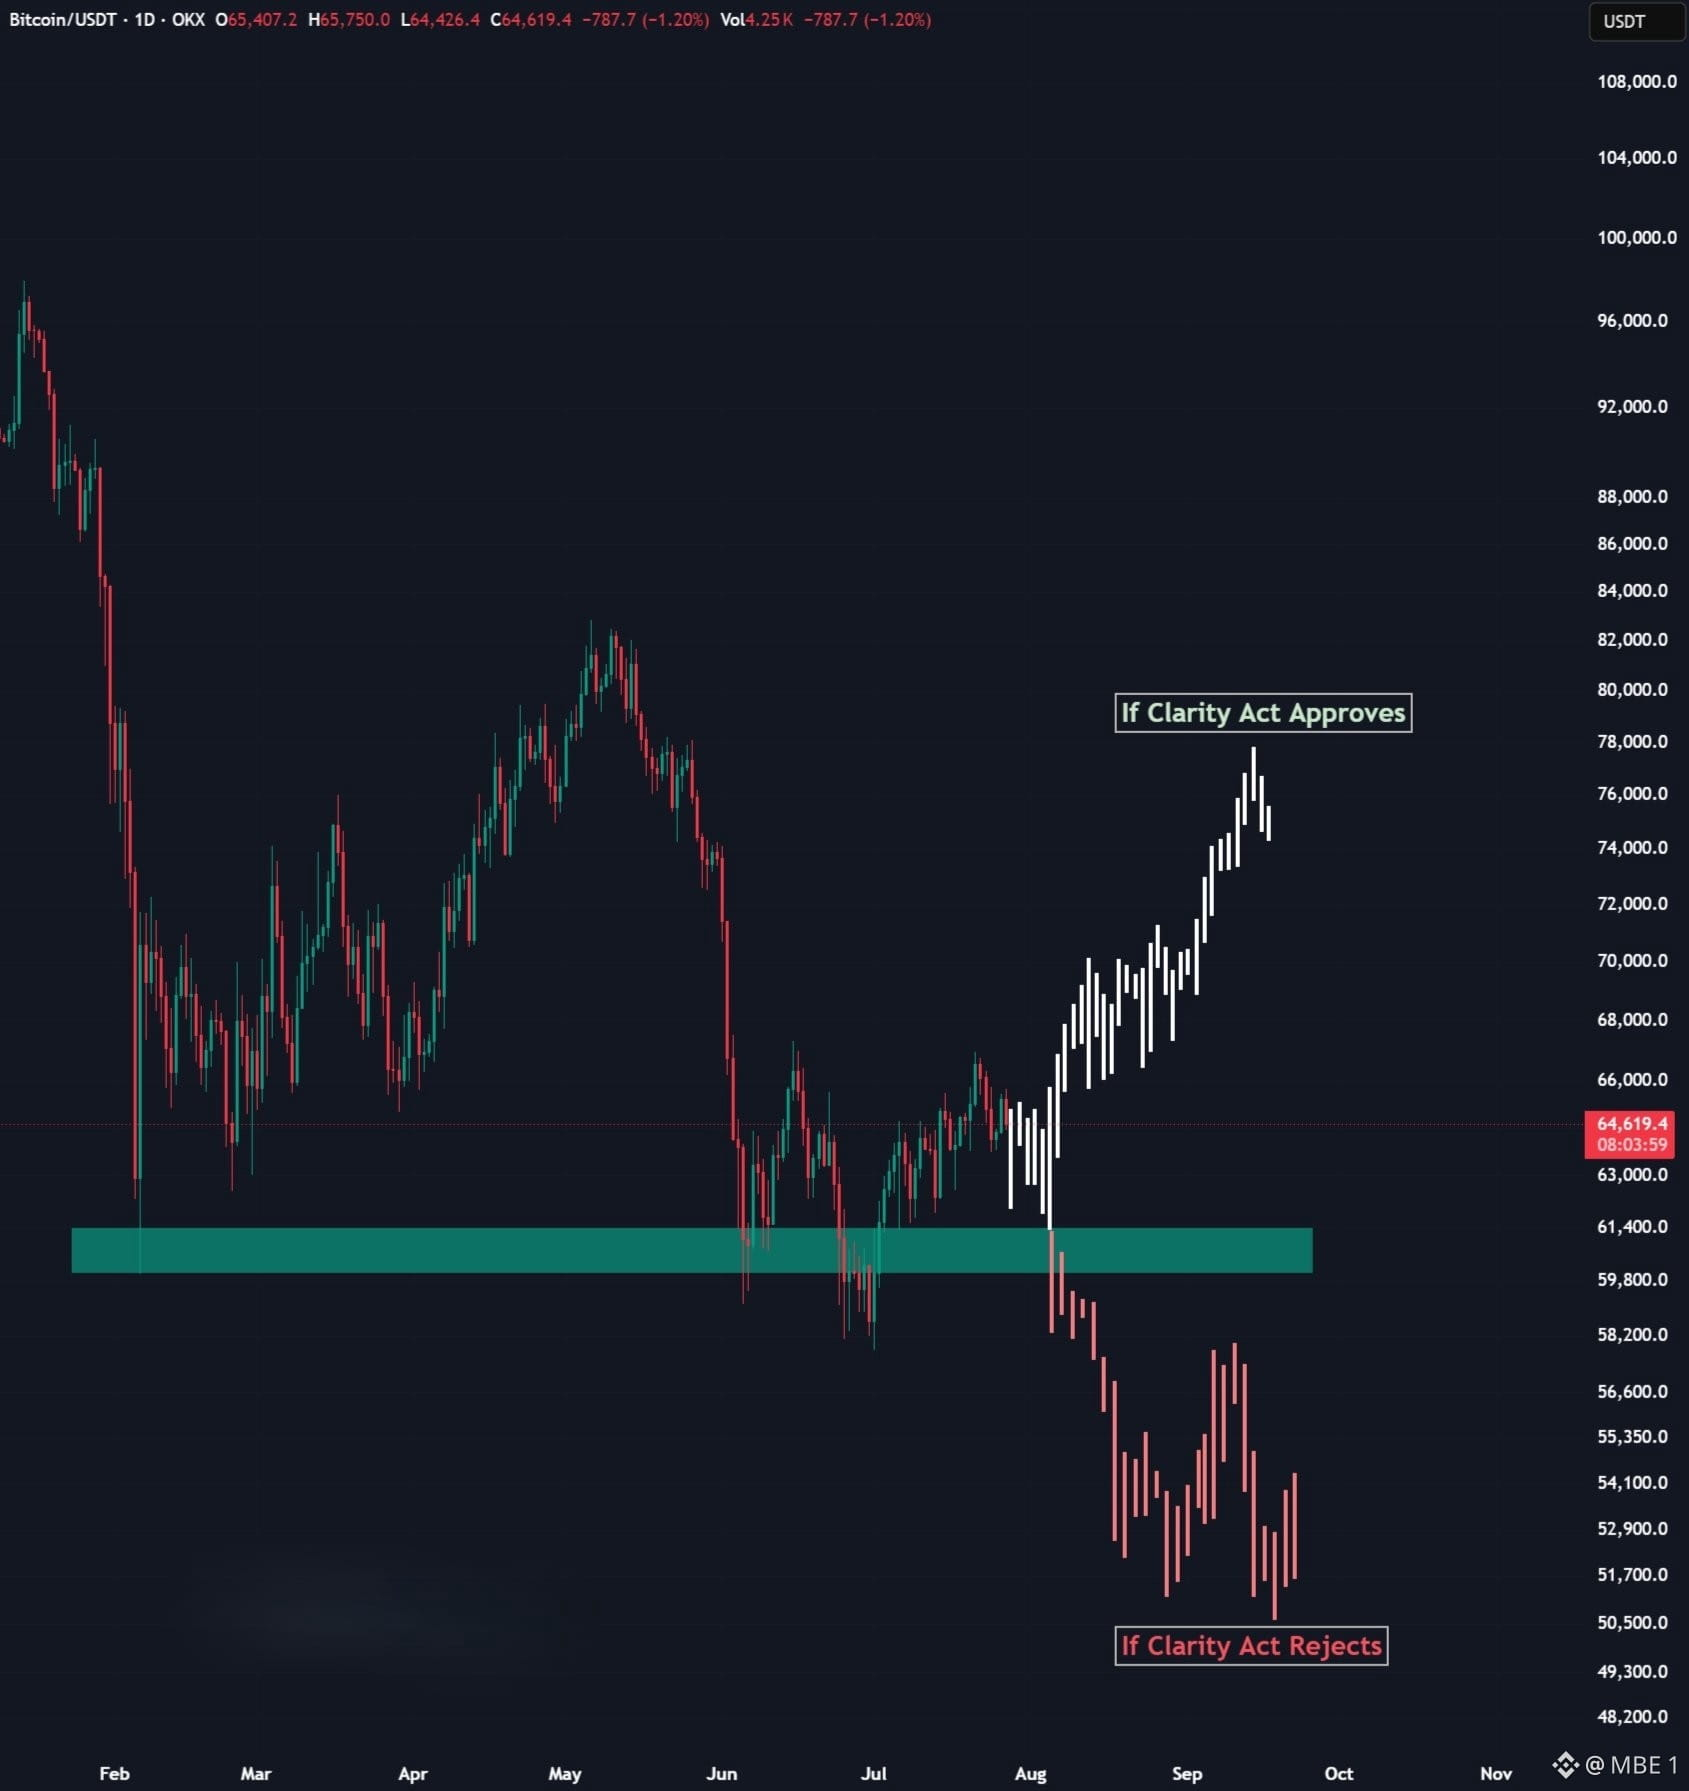
o próximo movimento depende principalmente do Clarity Act.
Se for aprovado, o Bitcoin poderá disparar para US$ 75.000 ou mais.
Se for rejeitado, o BTC poderá seguir em direção a US$ 50.000.
$BTC
o próximo movimento depende principalmente do Clarity Act.
Se for aprovado, o Bitcoin poderá disparar para US$ 75.000 ou mais.
Se for rejeitado, o BTC poderá seguir em direção a US$ 50.000.
o próximo movimento depende principalmente do Clarity Act.
Se for aprovado, o Bitcoin poderá disparar para US$ 75.000 ou mais.
Se for rejeitado, o BTC poderá seguir em direção a US$ 50.000.
83
·
--
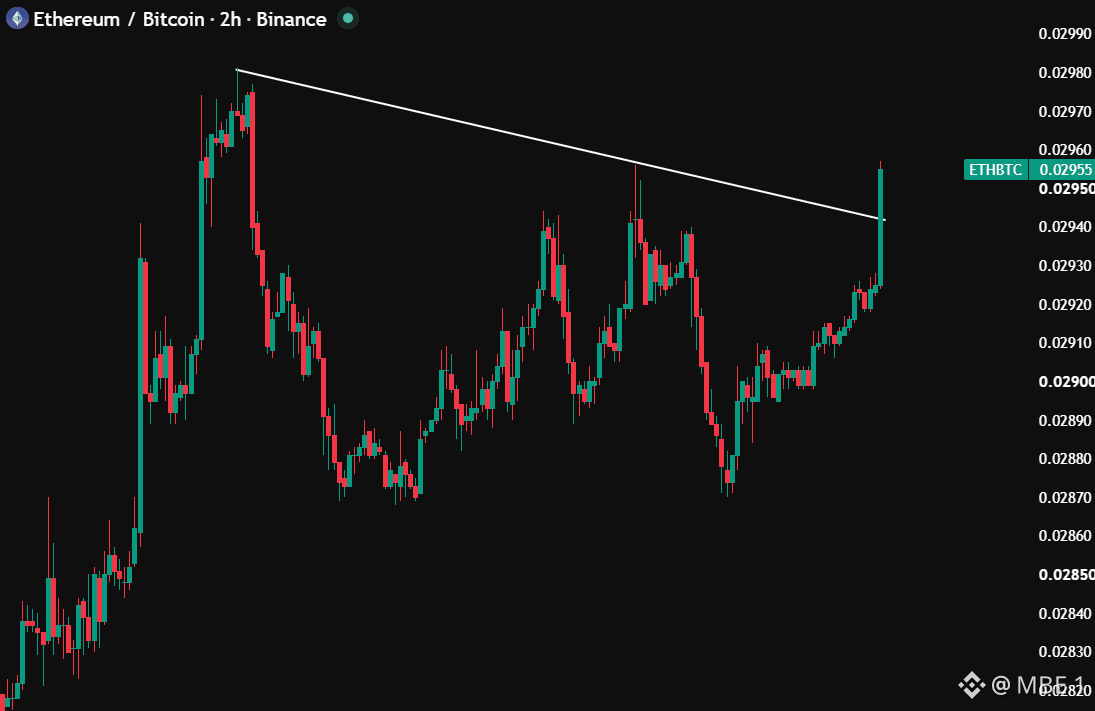
$ETH continua a manter-se acima da sua principal zona de suporte.
O Ethereum está a mostrar um impulso mais forte do que o Bitcoin, e o atual rali ainda pode ter espaço para continuar.
$ETH continua a manter-se acima da sua principal zona de suporte.
O Ethereum está a mostrar um impulso mais forte do que o Bitcoin, e o atual rali ainda pode ter espaço para continuar.
O Ethereum está a mostrar um impulso mais forte do que o Bitcoin, e o atual rali ainda pode ter espaço para continuar.
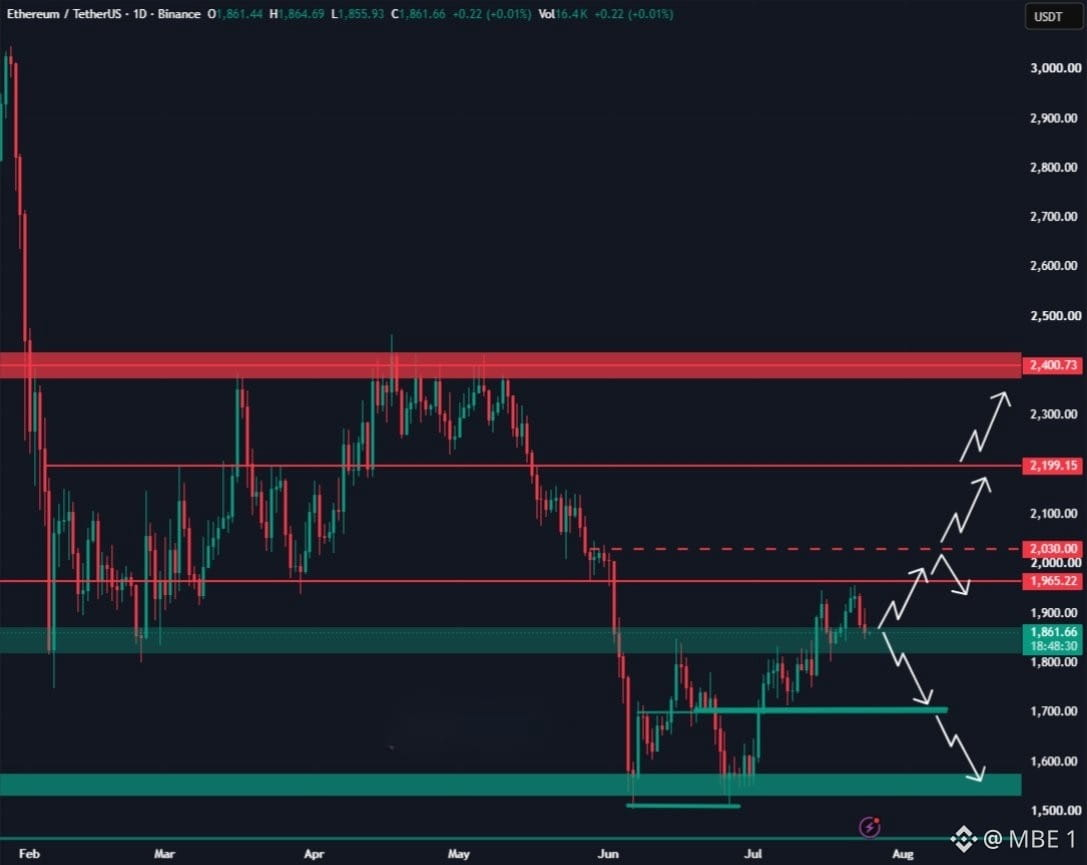
63
·
--
$BTC rompeu abaixo do nível de suporte de US$ 65.000.
A próxima área importante é de US$ 62.500–US$ 63.000. Manter essa zona pode preparar o terreno para o próximo movimento de alta do Bitcoin.
$BTC rompeu abaixo do nível de suporte de US$ 65.000.
A próxima área importante é de US$ 62.500–US$ 63.000. Manter essa zona pode preparar o terreno para o próximo movimento de alta do Bitcoin.
A próxima área importante é de US$ 62.500–US$ 63.000. Manter essa zona pode preparar o terreno para o próximo movimento de alta do Bitcoin.
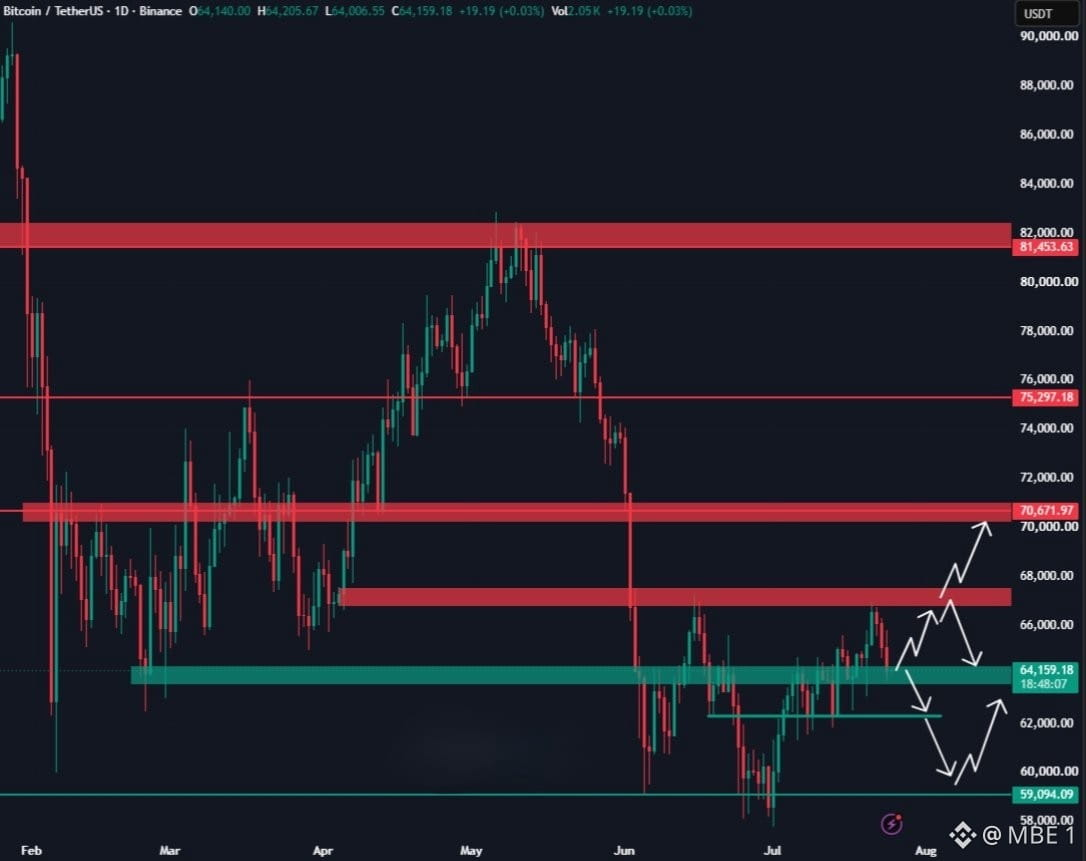
91
·
--
Os ETFs de Ethereum registraram aproximadamente US$ 196 milhões em entradas líquidas entre 14 de julho e 21 de julho, sugerindo que o interesse institucional em ETH está começando a retornar. No entanto, os ETFs de Bitcoin atraíram cerca de US$ 727 milhões em uma semana, o que significa que o Bitcoin ainda é o principal destino do capital institucional. Fluxos de ETFs de ETH · Fluxos de ETFs de BTC Existem três cenários possíveis: Se o $BTC consolidar entre $68K e $70K: Isso criaria o ambiente ideal para o ETH recuperar terreno, potencialmente permitindo que ETH/BTC rompa acima de 0.030. Se o BTC subir acima de $70K rápido demais: O capital pode permanecer concentrado no Bitcoin. O $ETH ainda pode subir em termos de dólares enquanto continua enfrentando dificuldades contra o BTC. Se o mercado voltar a condições de aversão ao risco: Ethereum pode ter desempenho inferior ao Bitcoin porque, em geral, é tratado como o ativo de maior risco. Minha visão: ETH/BTC começou a se recuperar do fundo, mas eu quero ver um fechamento semanal acima de 0.030 antes de confirmar a força relativa do Ethereum. Se isso acontecer, um movimento em direção a 0.032–0.035 se tornaria mais provável, junto com uma recuperação mais ampla no mercado de altcoins. Por enquanto, o panorama é inicialmente positivo, mas ainda não confirmado. #Macro Insights# #BTC Price Analysis#
Os ETFs de Ethereum registraram aproximadamente US$ 196 milhões em entradas líquidas entre 14 de julho e 21 de julho, sugerindo que o interesse institucional em ETH está começando a retornar. No entanto, os ETFs de Bitcoin atraíram cerca de US$ 727 milhões em uma semana, o que significa que o Bitcoin ainda é o principal destino do capital institucional. Fluxos de ETFs de ETH · Fluxos de ETFs de BTC Existem três cenários possíveis: Se o $BTC consolidar entre $68K e $70K: Isso criaria o ambiente ideal para o ETH recuperar terreno, potencialmente permitindo que ETH/BTC rompa acima de 0.030. Se o BTC subir acima de $70K rápido demais: O capital pode permanecer concentrado no Bitcoin. O $ETH ainda pode subir em termos de dólares enquanto continua enfrentando dificuldades contra o BTC. Se o mercado voltar a condições de aversão ao risco: Ethereum pode ter desempenho inferior ao Bitcoin porque, em geral, é tratado como o ativo de maior risco. Minha visão: ETH/BTC começou a se recuperar do fundo, mas eu quero ver um fechamento semanal acima de 0.030 antes de confirmar a força relativa do Ethereum. Se isso acontecer, um movimento em direção a 0.032–0.035 se tornaria mais provável, junto com uma recuperação mais ampla no mercado de altcoins. Por enquanto, o panorama é inicialmente positivo, mas ainda não confirmado. #Macro Insights# #BTC Price Analysis#
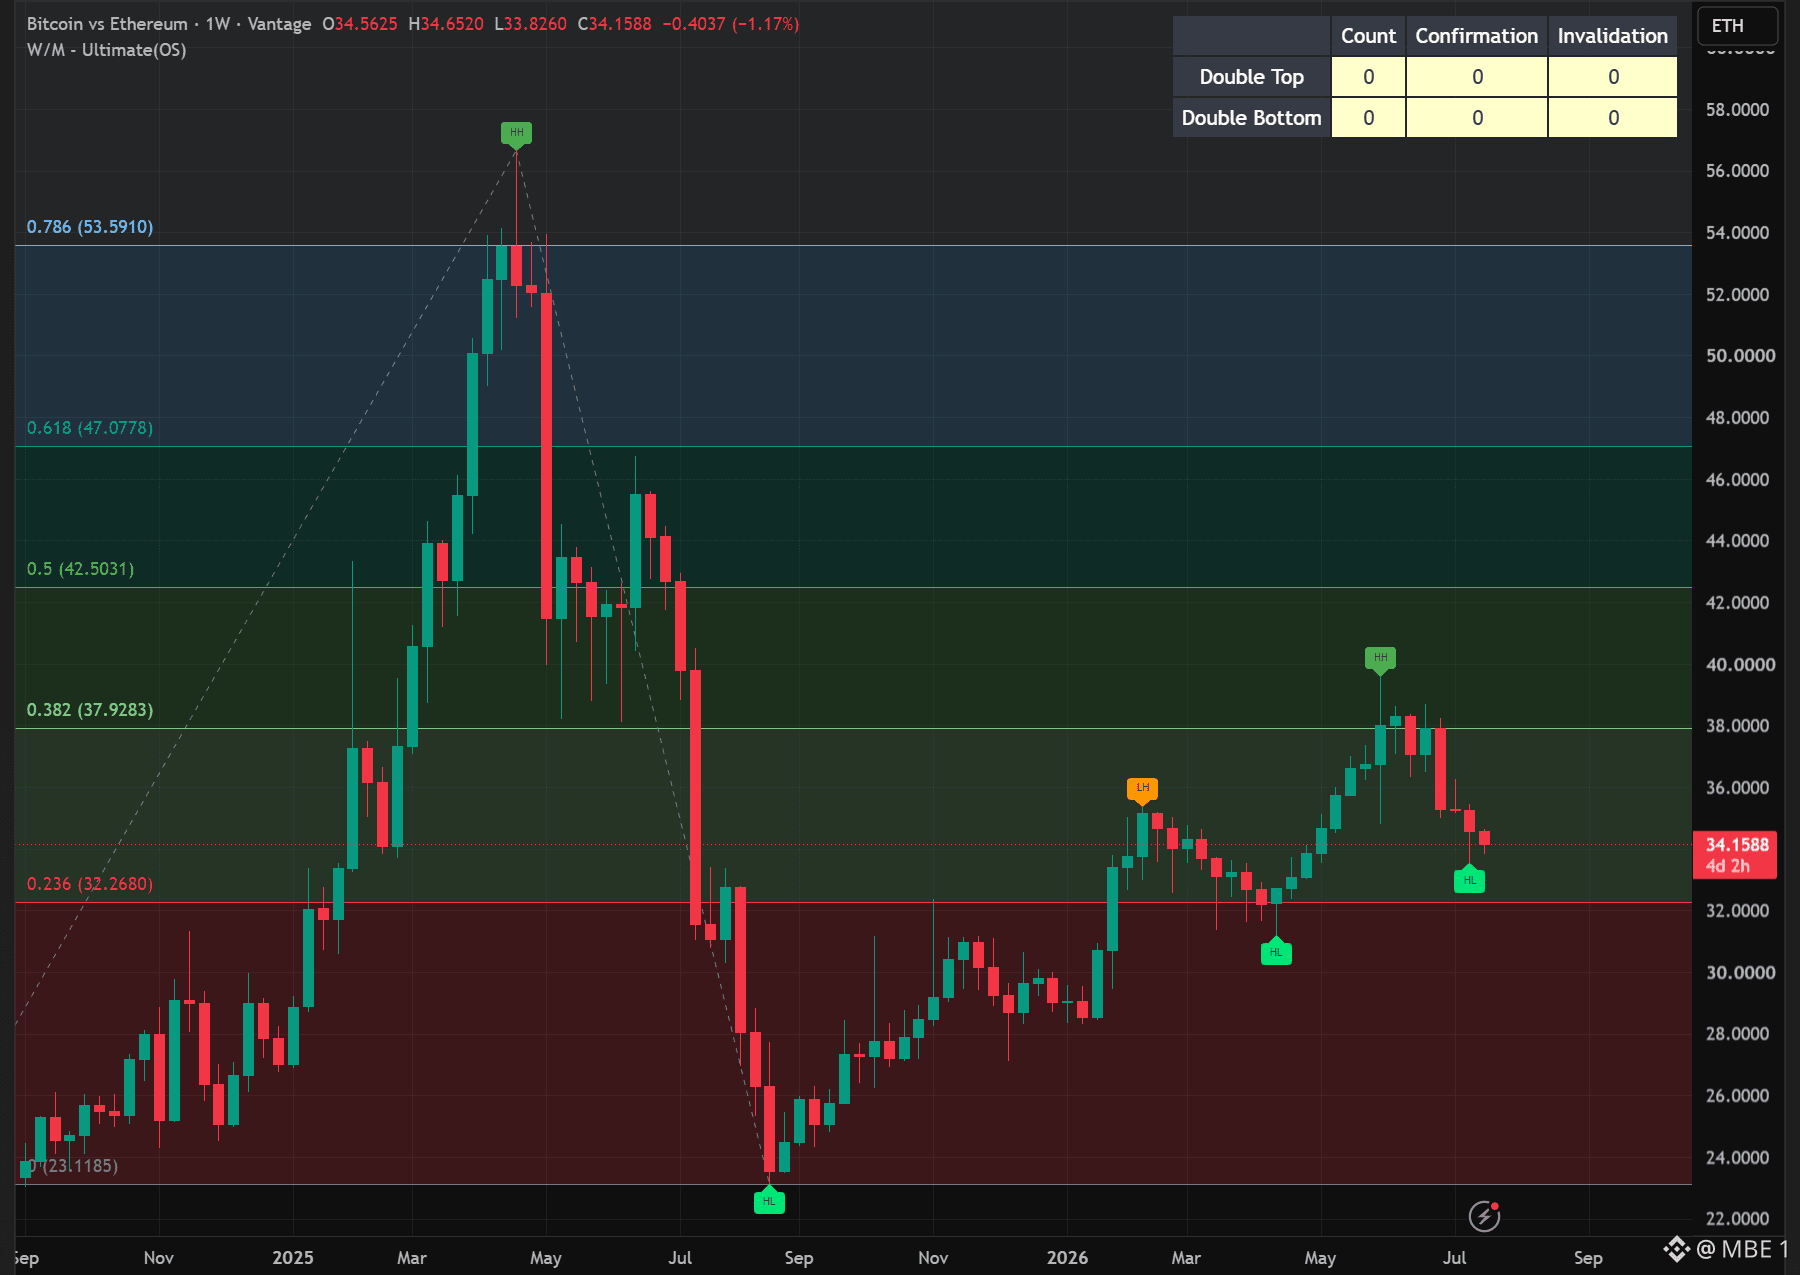
65
·
--
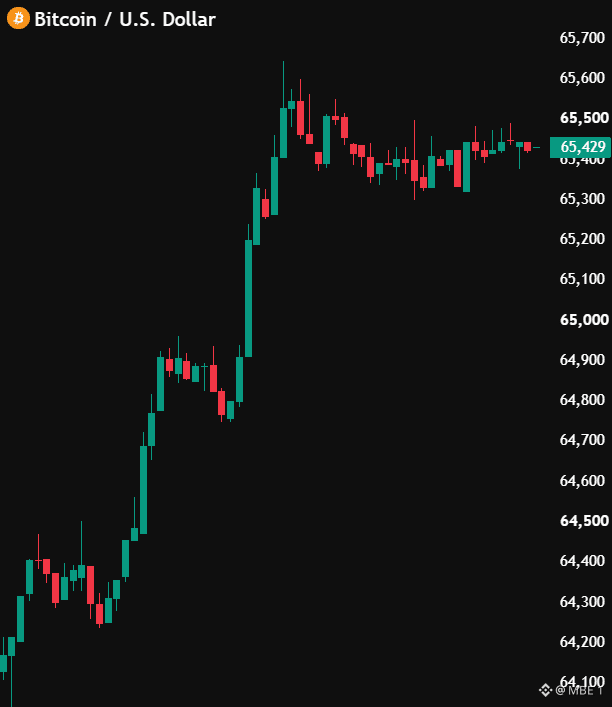
$BTC está demonstrando força real, apoiado por novas entradas de ETFs à vista. No entanto, essas entradas ainda não recuperaram as fortes saídas registradas em maio e junho. Enquanto o BTC mantiver $64.500–$65.000, a direção no curto prazo permanece positiva. Uma ruptura limpa acima de $68.000 abriria caminho para $70.000–$70.700. Esse é o verdadeiro nível de confirmação. Um fechamento diário ou semanal acima dele poderia estender a recuperação em direção a $74.000–$75.000. O principal risco é o macro. Preços do petróleo em alta, tensões geopolíticas e a próxima reunião do Fed podem gerar volatilidade. Se o BTC romper a resistência enquanto as entradas dos ETFs continuarem, eu confiaria no movimento. Se as entradas enfraquecerem enquanto o petróleo e os rendimentos subirem, a ruptura pode falhar. Minha visão: o Bitcoin está construindo uma reversão de alta, mas a mudança completa de tendência ainda não foi confirmada. Acima de $70.700, o cenário fica muito mais forte.
$BTC está demonstrando força real, apoiado por novas entradas de ETFs à vista. No entanto, essas entradas ainda não recuperaram as fortes saídas registradas em maio e junho. Enquanto o BTC mantiver $64.500–$65.000, a direção no curto prazo permanece positiva. Uma ruptura limpa acima de $68.000 abriria caminho para $70.000–$70.700. Esse é o verdadeiro nível de confirmação. Um fechamento diário ou semanal acima dele poderia estender a recuperação em direção a $74.000–$75.000. O principal risco é o macro. Preços do petróleo em alta, tensões geopolíticas e a próxima reunião do Fed podem gerar volatilidade. Se o BTC romper a resistência enquanto as entradas dos ETFs continuarem, eu confiaria no movimento. Se as entradas enfraquecerem enquanto o petróleo e os rendimentos subirem, a ruptura pode falhar. Minha visão: o Bitcoin está construindo uma reversão de alta, mas a mudança completa de tendência ainda não foi confirmada. Acima de $70.700, o cenário fica muito mais forte.
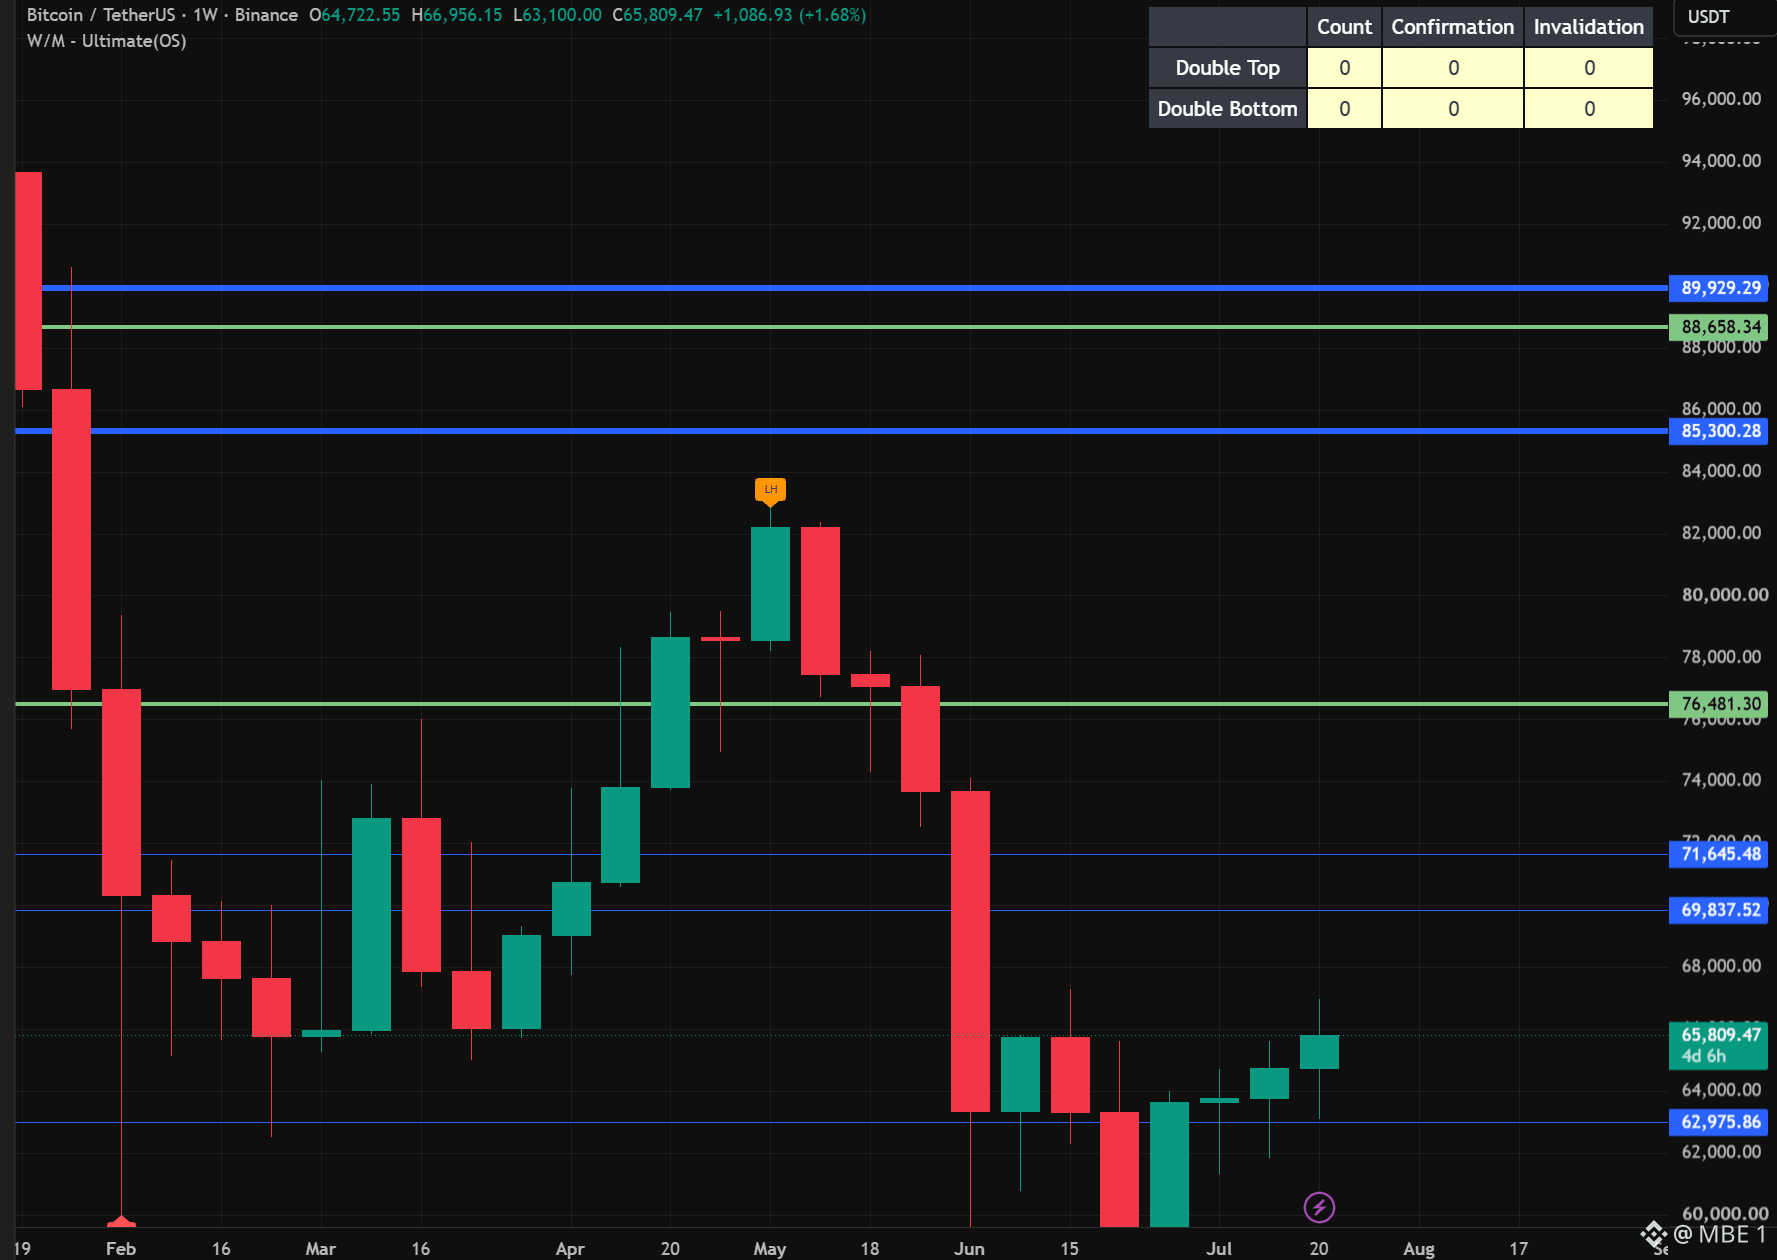
80
·
--
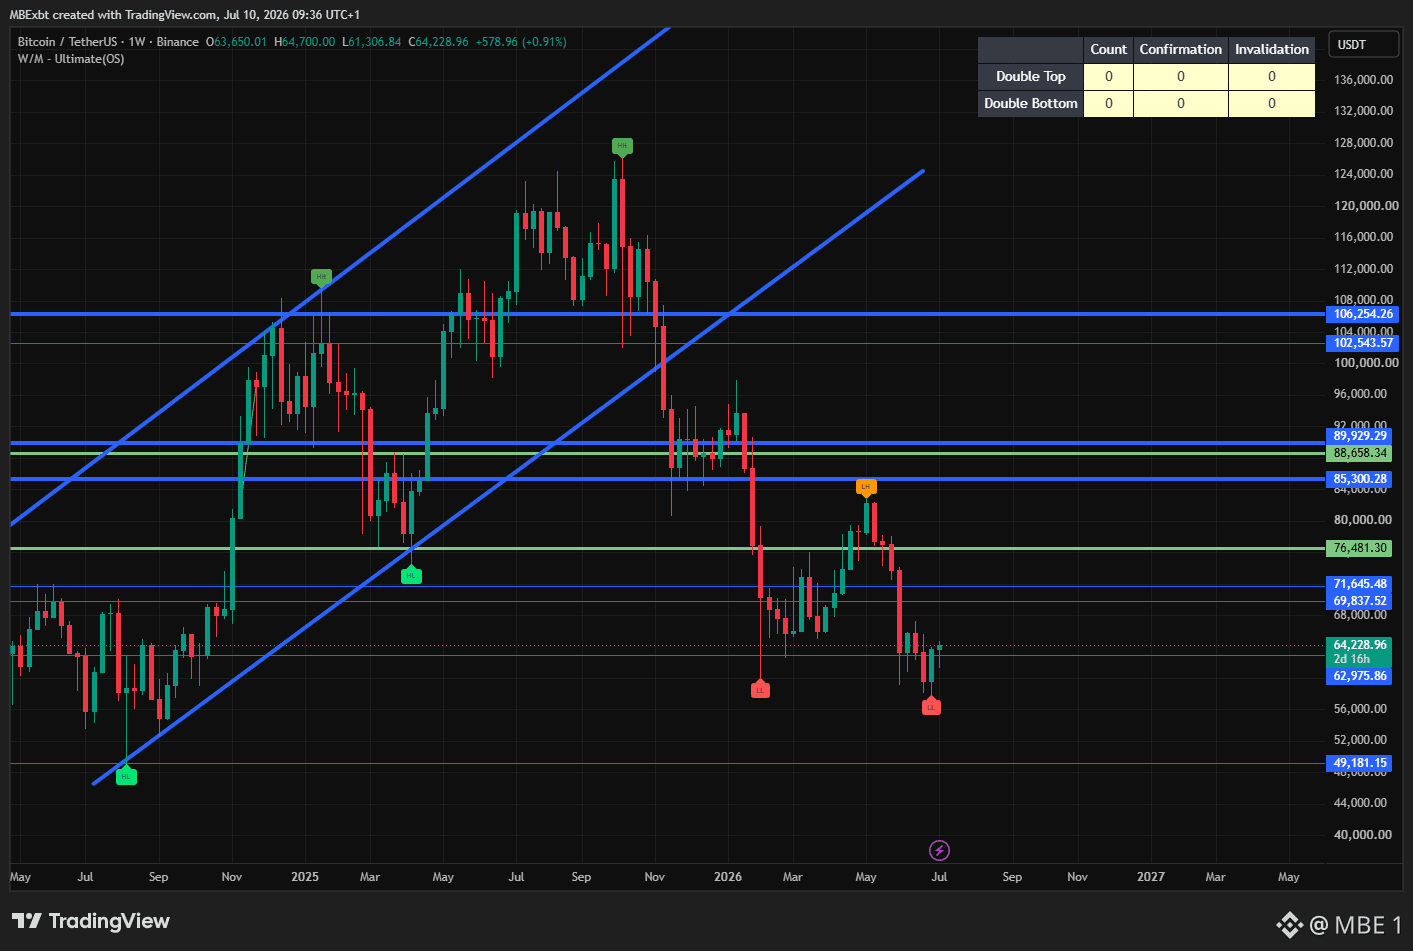
$BTC Você vê aquele enorme "W" se formando no gráfico semanal? A configuração parece ótima, mas as tensões globais e os medos do macro estão segurando o mercado. Se o mundo acalmar um pouco e tivermos alguma boa notícia, este padrão pode acontecer perfeitamente. O verdadeiro impulso começa acima da faixa de US$ 70K - US$ 72K. Se rompermos isso, o preço pode disparar rapidamente. Por enquanto, evite FOMO e continue apenas observando o gráfico e os manchetes. #BTC Price Analysis# #Macro Insights#
$BTC Você vê aquele enorme "W" se formando no gráfico semanal? A configuração parece ótima, mas as tensões globais e os medos do macro estão segurando o mercado. Se o mundo acalmar um pouco e tivermos alguma boa notícia, este padrão pode acontecer perfeitamente. O verdadeiro impulso começa acima da faixa de US$ 70K - US$ 72K. Se rompermos isso, o preço pode disparar rapidamente. Por enquanto, evite FOMO e continue apenas observando o gráfico e os manchetes. #BTC Price Analysis# #Macro Insights#
75
Inicia sessão para explorar mais conteúdos
Junta-te a utilizadores de criptomoedas de todo o mundo na Binance Square
⚡️ Obtém informações úteis e recentes sobre criptomoedas.
💬 Com a confiança da maior exchange de criptomoedas do mundo.
👍 Descobre perspetivas reais de criadores verificados.
E-mail/Número de telefone
Tópicos em Tendência
UniswapA16zSeekDeFiExemptionFromIllinoisCryptoTax
5,448 visualizações
345 a discutir
UNISWAP E a16z CONTESTAM AS REGRAS TRIBUTÁRIAS SOBRE CRIPTOMOEDAS — O DeFi ESTÁ EM UM MOMENTO DECISIVO?
Crypto Pulse Hub
·2 gostos
·362 visualizações
HKDollarStablecoinHKDAPToLaunchOnSolana
2,168 visualizações
186 a discutir
$1.5BInLeveragedCryptoBetsLiquidated
16,144 visualizações
184 a discutir