
William Henry
19.6k ပို့စ်များ

William Henry
 Square Verified+
တိုင်ကြားမည်
သုံးစွဲသူကို ဘလော့မည်
Trader, Crypto Lover • LFG • 2025 Last Marketing. Forex X. @Wi_lliam_12 . X KITE-991244
အမှန်တကယ်ရောင်းဝယ်နေ
Frequent Trader
2 နှစ်
80 ဖော်လိုလုပ်ထားသည်
45.1K+ ဖော်လိုလုပ်သူများ
65.0K+ လိုက်ခ်လုပ်ထားသည်
ပို့စ်များ
ပိုင်ဆိုင်မှုစာရင်း
အားလုံး
ဆိုဈေးများ
တိုက်ရိုက်ထုတ်လွှင့်ခြင်း
ဘာသာပြန်ဆိုချက် ကြည့်မည်
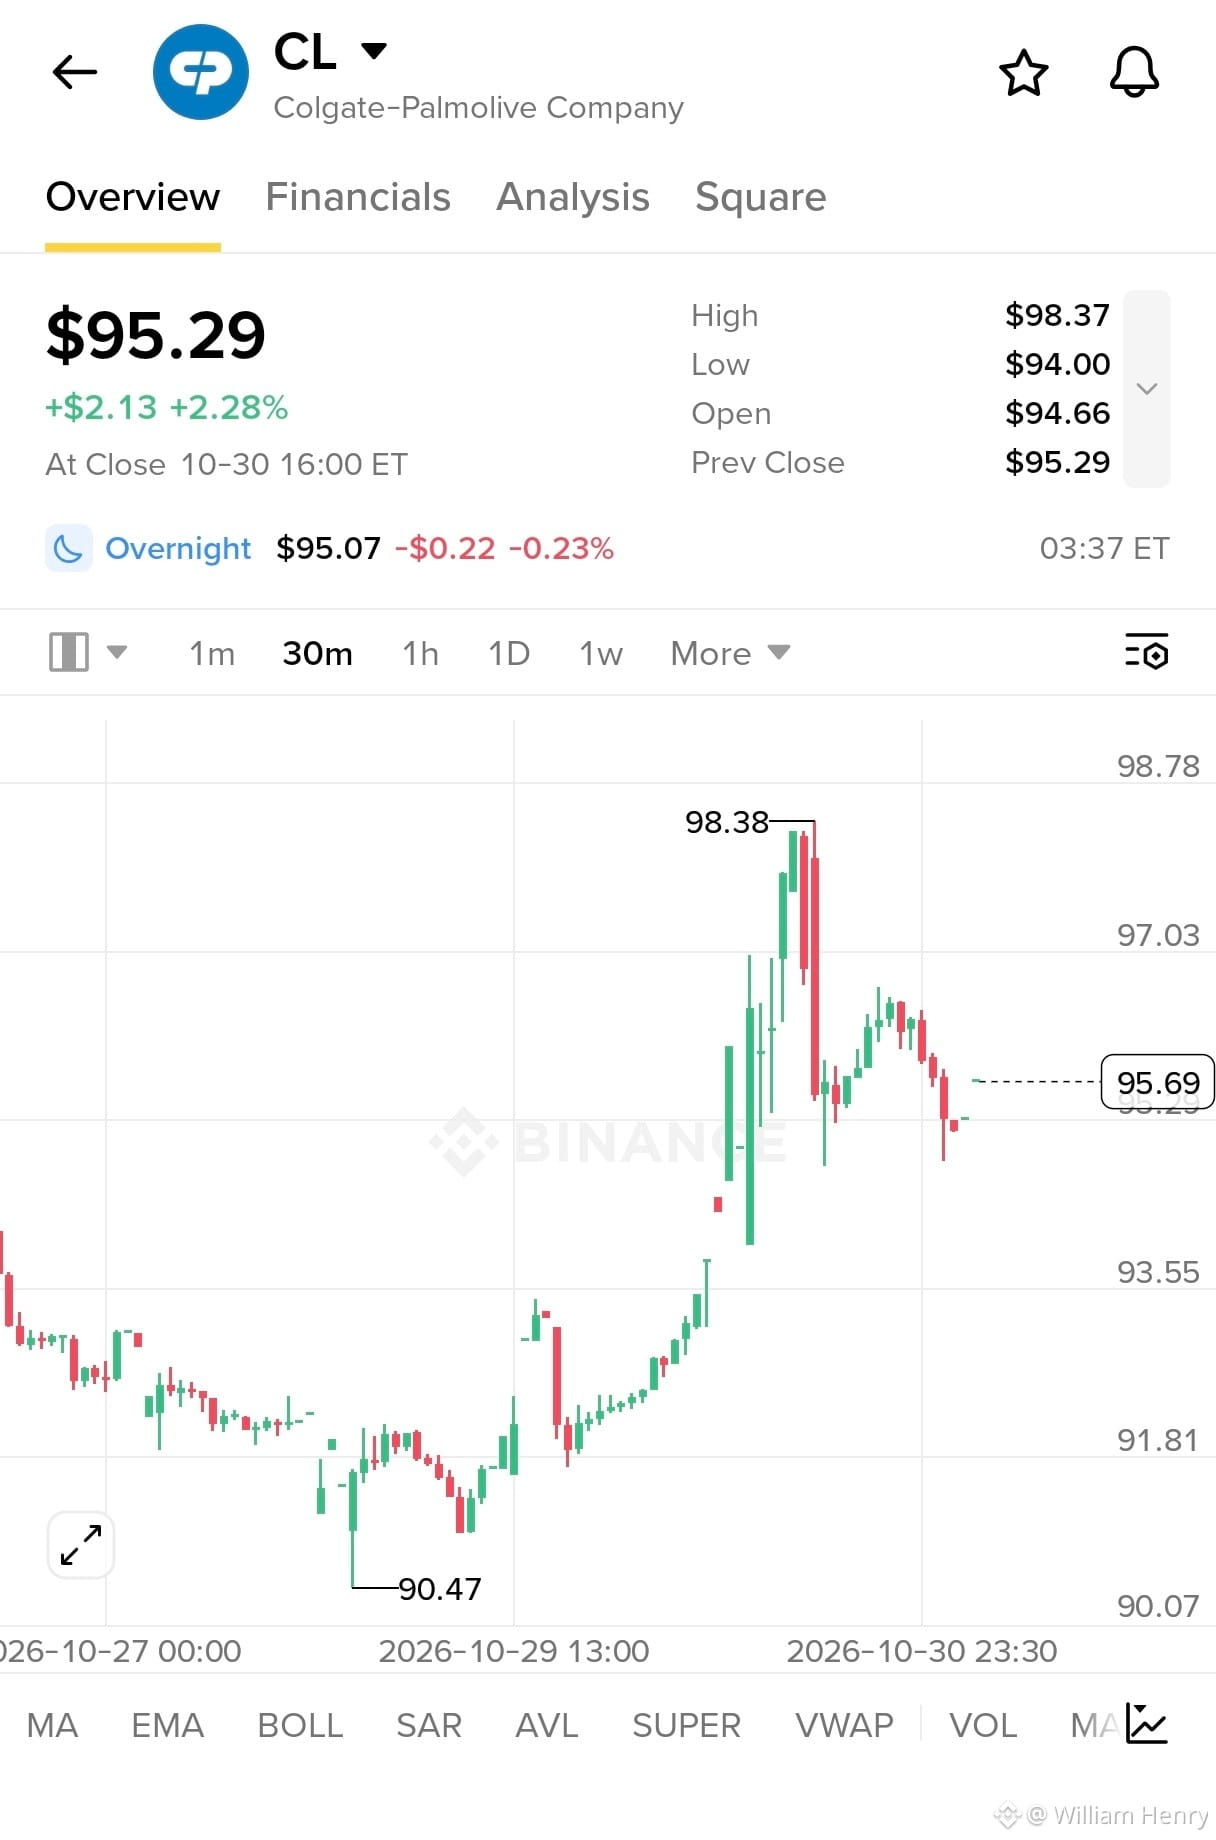
$CL is facing strong bearish pressure!
A massive $40.79K LONG liquidation hit at $99.93 on Binance. CL is trading near $100.74, with sellers dominating recent order flow. The $99.99–$99.41 support zone is now critical. A confirmed breakdown could trigger another wave of long liquidations.
TRADE SETUP: SHORT
Entry Zone: $100.60 – $101.20
TP1: $99.40
TP2: $98.42
TP3: $95.30
Stop Loss: $102.70
Key Levels:
Support: $99.99 / $99.41
Resistance: $102.66
A clean breakdown below $99.41 could accelerate downside momentum. Watch the support reaction before entering.
Stay disciplined. Let the price confirm the move!
$CL is facing strong bearish pressure!
A massive $40.79K LONG liquidation hit at $99.93 on Binance. CL is trading near $100.74, with sellers dominating recent order flow. The $99.99–$99.41 support zone is now critical. A confirmed breakdown could trigger another wave of long liquidations.
TRADE SETUP: SHORT
Entry Zone: $100.60 – $101.20
TP1: $99.40
TP2: $98.42
TP3: $95.30
Stop Loss: $102.70
Key Levels:
Support: $99.99 / $99.41
Resistance: $102.66
A clean breakdown below $99.41 could accelerate downside momentum. Watch the support reaction before entering.
Stay disciplined. Let the price confirm the move!
A massive $40.79K LONG liquidation hit at $99.93 on Binance. CL is trading near $100.74, with sellers dominating recent order flow. The $99.99–$99.41 support zone is now critical. A confirmed breakdown could trigger another wave of long liquidations.
TRADE SETUP: SHORT
Entry Zone: $100.60 – $101.20
TP1: $99.40
TP2: $98.42
TP3: $95.30
Stop Loss: $102.70
Key Levels:
Support: $99.99 / $99.41
Resistance: $102.66
A clean breakdown below $99.41 could accelerate downside momentum. Watch the support reaction before entering.
Stay disciplined. Let the price confirm the move!
737
ဘာသာပြန်ဆိုချက် ကြည့်မည်
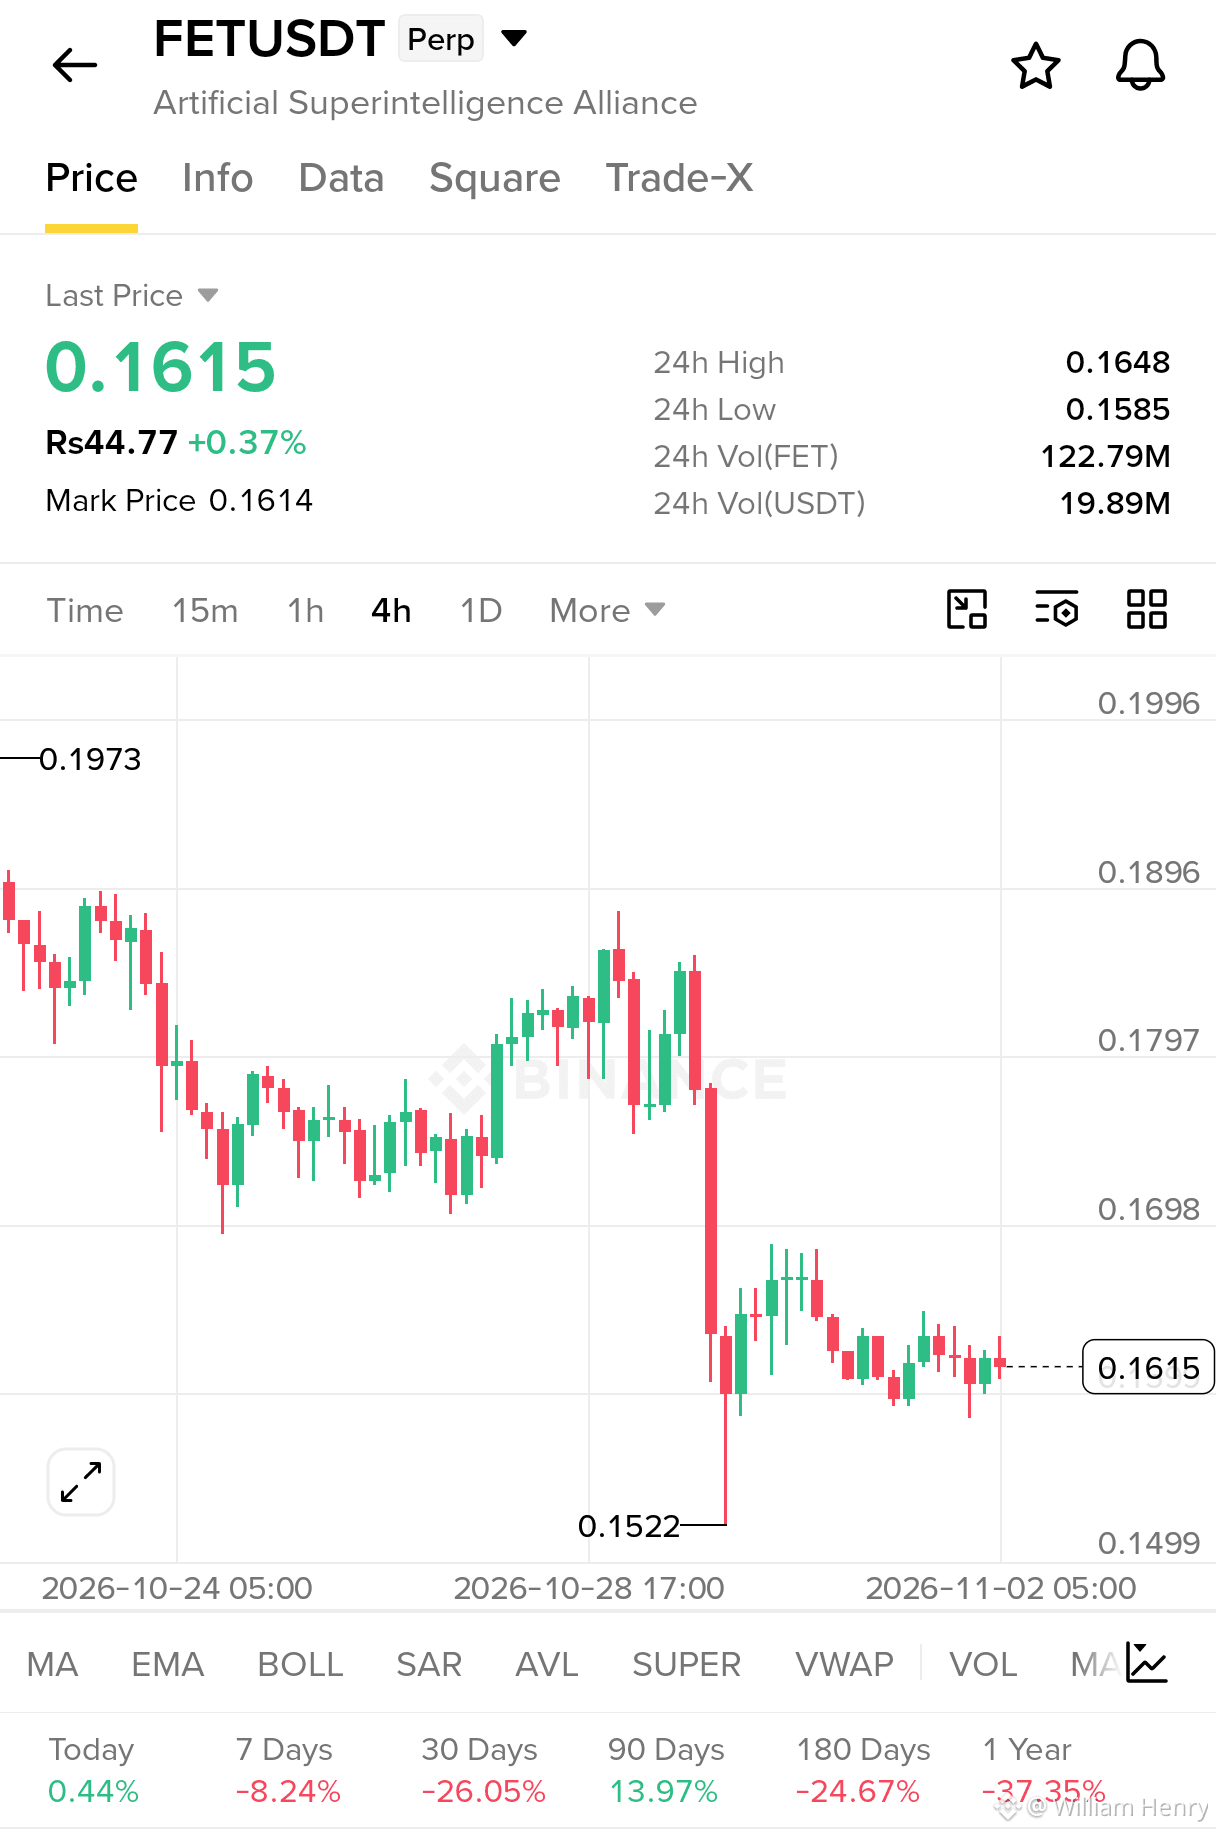
$FET BREAKOUT OR ANOTHER DROP? BE READY!
FET is trading at $0.1615, attempting to stabilize after a sharp 4H sell-off. Price remains under pressure, with $0.1648 acting as key resistance. A break below $0.1585 could expose the previous low at $0.1522.
Trade Setup – SHORT
Entry Zone: $0.1620–$0.1645
TP1: $0.1585
TP2: $0.1550
TP3: $0.1522
SL: $0.1670
Watch the $0.1648 resistance closely. Rejection could trigger another bearish move, while a strong breakout invalidates the short setup.
Trade smart. Wait for confirmation!
{future}(FETUSDT)
$FET BREAKOUT OR ANOTHER DROP? BE READY!
FET is trading at $0.1615, attempting to stabilize after a sharp 4H sell-off. Price remains under pressure, with $0.1648 acting as key resistance. A break below $0.1585 could expose the previous low at $0.1522.
Trade Setup – SHORT
Entry Zone: $0.1620–$0.1645
TP1: $0.1585
TP2: $0.1550
TP3: $0.1522
SL: $0.1670
Watch the $0.1648 resistance closely. Rejection could trigger another bearish move, while a strong breakout invalidates the short setup.
Trade smart. Wait for confirmation!
FET is trading at $0.1615, attempting to stabilize after a sharp 4H sell-off. Price remains under pressure, with $0.1648 acting as key resistance. A break below $0.1585 could expose the previous low at $0.1522.
Trade Setup – SHORT
Entry Zone: $0.1620–$0.1645
TP1: $0.1585
TP2: $0.1550
TP3: $0.1522
SL: $0.1670
Watch the $0.1648 resistance closely. Rejection could trigger another bearish move, while a strong breakout invalidates the short setup.
Trade smart. Wait for confirmation!
2
513
·
--
တက်ရိပ်ရှိသည်
စိစစ်အတည်ပြုထားသည်
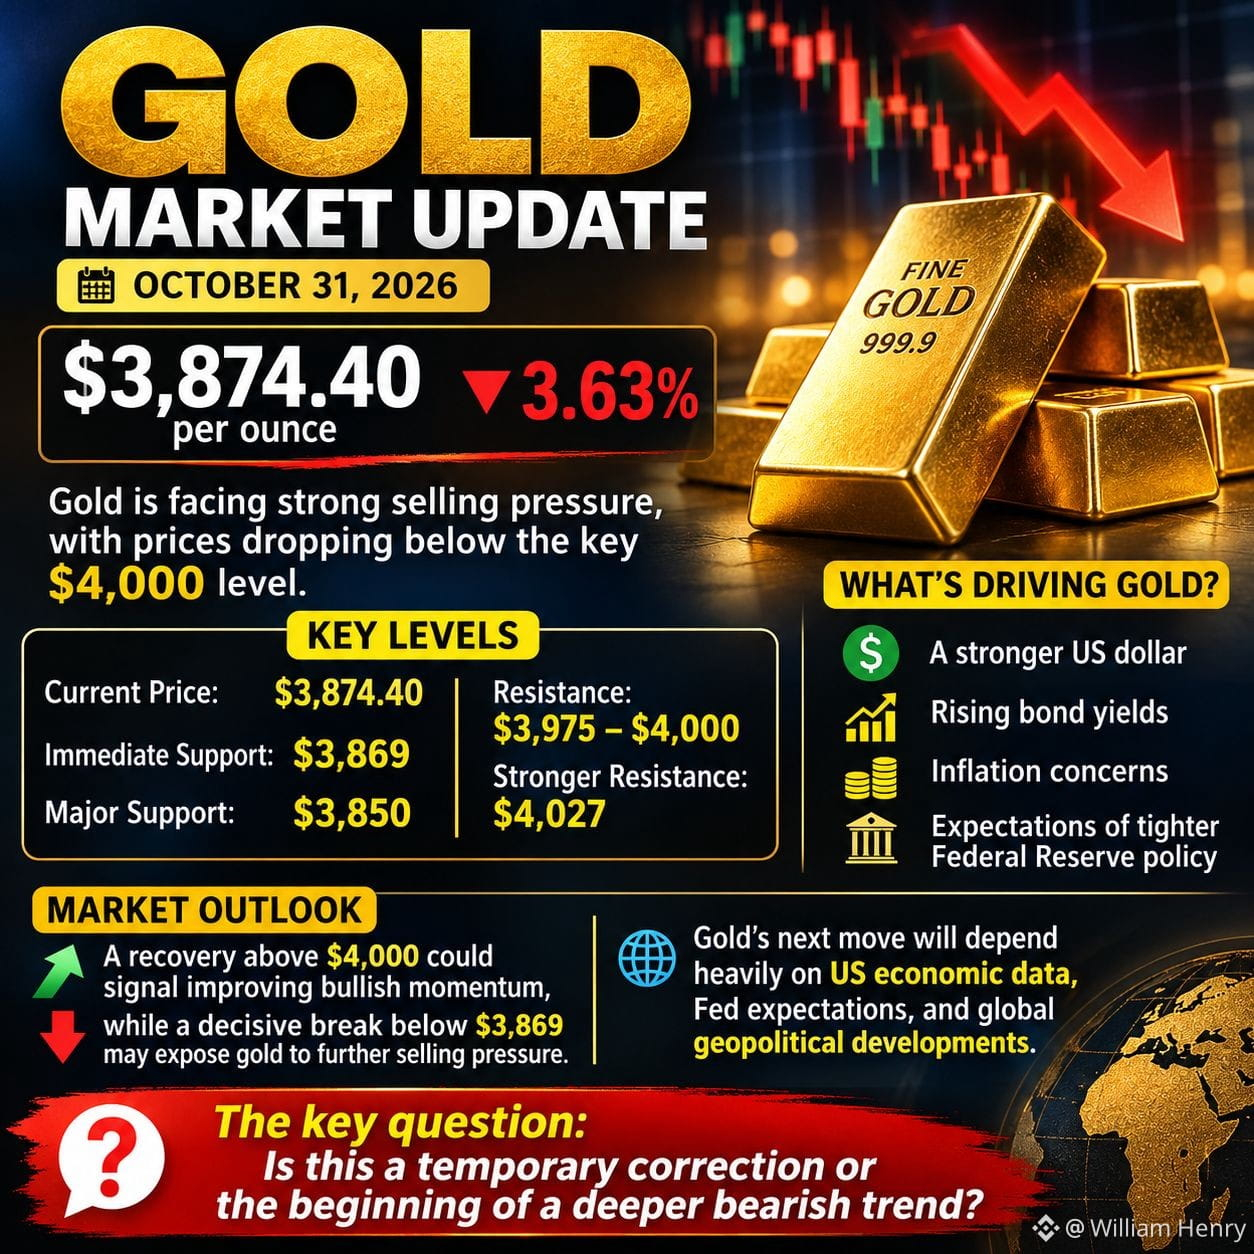
🟡 ရွှေဈေးကွက် နောက်ဆုံးအခြေအနေ | ၂၀၂၆ အောက်တိုဘာ ၃၁
ရွှေဈေးသည် ပြင်းထန်သော အရောင်းဖိအားနှင့် ရင်ဆိုင်နေရပြီး၊ နောက်ဆုံးအစီရင်ခံထားသည့် ကုန်သွယ်မှုကာလတွင် တစ်အောင်စလျှင် $3,874.40 ဝန်းကျင်ဖြင့် အရောင်းအဝယ်ဖြစ်နေကာ 3.63% ခန့် ကျဆင်းခဲ့သည်။
အဖိုးတန်သတ္တုဖြစ်သည့် ရွှေဈေးသည် အရေးပါသော စိတ်ပိုင်းဆိုင်ရာအဆင့်ဖြစ်သည့် $4,000 အောက်သို့ ကျဆင်းသွားသဖြင့် ထပ်မံကျဆင်းနိုင်ခြေအပေါ် စိုးရိမ်မှုများ မြင့်တက်လာသည်။
အရေးပါသော ဈေးနှုန်းအဆင့်များ:
- လက်ရှိဈေးနှုန်း: $3,874.40
- ချက်ချင်းထောက်ပံ့မှုအဆင့်: $3,869
- အဓိကထောက်ပံ့မှုအဆင့်: $3,850
- ခုခံမှုအဆင့်: $3,975–$4,000
- ပိုမိုအားကောင်းသော ခုခံမှုအဆင့်: $4,027
ရွှေဈေးကို ဘယ်အချက်တွေက လှုပ်ရှားစေနေတာလဲ?
အမေရိကန်ဒေါ်လာ အားကောင်းလာခြင်း၊ ငွေချေးစာချုပ်အတိုးနှုန်းများ မြင့်တက်လာခြင်း၊ ငွေကြေးဖောင်းပွမှုအပေါ် စိုးရိမ်မှုများနှင့် အမေရိကန်ဗဟိုဘဏ်က ပိုမိုတင်းကျပ်သော မူဝါဒချမှတ်မည်ဟူသော မျှော်လင့်ချက်များကြောင့် ရွှေဈေးအပေါ် ဖိအားများ ဖြစ်ပေါ်နေသည်။
ဈေးကွက်အလားအလာ:
$4,000 အထက်သို့ ပြန်တက်နိုင်ပါက အတက်ဘက်အရှိန်အဟုန် တိုးတက်လာကြောင်း ပြသနိုင်သည်။ သို့သော် $3,869 အောက်သို့ ပြတ်ပြတ်သားသား ကျဆင်းပါက ရွှေသည် ထပ်မံအရောင်းဖိအားနှင့် ရင်ဆိုင်ရနိုင်သည်။
ရွှေဈေး၏ နောက်တစ်ဆင့်လှုပ်ရှားမှုသည် အမေရိကန်စီးပွားရေးအချက်အလက်များ၊ အမေရိကန်ဗဟိုဘဏ်၏ မူဝါဒအပေါ် မျှော်လင့်ချက်များနှင့် ကမ္ဘာ့ပထဝီနိုင်ငံရေး အခြေအနေများအပေါ် များစွာမူတည်နေမည်ဖြစ်သည်။
အဓိကမေးခွန်းမှာ—ဤအခြေအနေသည် ယာယီပြင်ဆင်ကျဆင်းမှုလား၊ သို့မဟုတ် ပိုမိုနက်ရှိုင်းသော အကျဘက်လမ်းကြောင်း၏ အစလား?
$XAUT
{future}(XAUTUSDT)
$CINF.US
{stock_us}(CINF.US)
$BTC
{future}(BTCUSDT)
🟡 ရွှေဈေးကွက် နောက်ဆုံးအခြေအနေ | ၂၀၂၆ အောက်တိုဘာ ၃၁
ရွှေဈေးသည် ပြင်းထန်သော အရောင်းဖိအားနှင့် ရင်ဆိုင်နေရပြီး၊ နောက်ဆုံးအစီရင်ခံထားသည့် ကုန်သွယ်မှုကာလတွင် တစ်အောင်စလျှင် $3,874.40 ဝန်းကျင်ဖြင့် အရောင်းအဝယ်ဖြစ်နေကာ 3.63% ခန့် ကျဆင်းခဲ့သည်။
အဖိုးတန်သတ္တုဖြစ်သည့် ရွှေဈေးသည် အရေးပါသော စိတ်ပိုင်းဆိုင်ရာအဆင့်ဖြစ်သည့် $4,000 အောက်သို့ ကျဆင်းသွားသဖြင့် ထပ်မံကျဆင်းနိုင်ခြေအပေါ် စိုးရိမ်မှုများ မြင့်တက်လာသည်။
အရေးပါသော ဈေးနှုန်းအဆင့်များ:
- လက်ရှိဈေးနှုန်း: $3,874.40
- ချက်ချင်းထောက်ပံ့မှုအဆင့်: $3,869
- အဓိကထောက်ပံ့မှုအဆင့်: $3,850
- ခုခံမှုအဆင့်: $3,975–$4,000
- ပိုမိုအားကောင်းသော ခုခံမှုအဆင့်: $4,027
ရွှေဈေးကို ဘယ်အချက်တွေက လှုပ်ရှားစေနေတာလဲ?
အမေရိကန်ဒေါ်လာ အားကောင်းလာခြင်း၊ ငွေချေးစာချုပ်အတိုးနှုန်းများ မြင့်တက်လာခြင်း၊ ငွေကြေးဖောင်းပွမှုအပေါ် စိုးရိမ်မှုများနှင့် အမေရိကန်ဗဟိုဘဏ်က ပိုမိုတင်းကျပ်သော မူဝါဒချမှတ်မည်ဟူသော မျှော်လင့်ချက်များကြောင့် ရွှေဈေးအပေါ် ဖိအားများ ဖြစ်ပေါ်နေသည်။
ဈေးကွက်အလားအလာ:
$4,000 အထက်သို့ ပြန်တက်နိုင်ပါက အတက်ဘက်အရှိန်အဟုန် တိုးတက်လာကြောင်း ပြသနိုင်သည်။ သို့သော် $3,869 အောက်သို့ ပြတ်ပြတ်သားသား ကျဆင်းပါက ရွှေသည် ထပ်မံအရောင်းဖိအားနှင့် ရင်ဆိုင်ရနိုင်သည်။
ရွှေဈေး၏ နောက်တစ်ဆင့်လှုပ်ရှားမှုသည် အမေရိကန်စီးပွားရေးအချက်အလက်များ၊ အမေရိကန်ဗဟိုဘဏ်၏ မူဝါဒအပေါ် မျှော်လင့်ချက်များနှင့် ကမ္ဘာ့ပထဝီနိုင်ငံရေး အခြေအနေများအပေါ် များစွာမူတည်နေမည်ဖြစ်သည်။
အဓိကမေးခွန်းမှာ—ဤအခြေအနေသည် ယာယီပြင်ဆင်ကျဆင်းမှုလား၊ သို့မဟုတ် ပိုမိုနက်ရှိုင်းသော အကျဘက်လမ်းကြောင်း၏ အစလား?
$XAUT
$CINF.US
$BTC
ရွှေဈေးသည် ပြင်းထန်သော အရောင်းဖိအားနှင့် ရင်ဆိုင်နေရပြီး၊ နောက်ဆုံးအစီရင်ခံထားသည့် ကုန်သွယ်မှုကာလတွင် တစ်အောင်စလျှင် $3,874.40 ဝန်းကျင်ဖြင့် အရောင်းအဝယ်ဖြစ်နေကာ 3.63% ခန့် ကျဆင်းခဲ့သည်။
အဖိုးတန်သတ္တုဖြစ်သည့် ရွှေဈေးသည် အရေးပါသော စိတ်ပိုင်းဆိုင်ရာအဆင့်ဖြစ်သည့် $4,000 အောက်သို့ ကျဆင်းသွားသဖြင့် ထပ်မံကျဆင်းနိုင်ခြေအပေါ် စိုးရိမ်မှုများ မြင့်တက်လာသည်။
အရေးပါသော ဈေးနှုန်းအဆင့်များ:
- လက်ရှိဈေးနှုန်း: $3,874.40
- ချက်ချင်းထောက်ပံ့မှုအဆင့်: $3,869
- အဓိကထောက်ပံ့မှုအဆင့်: $3,850
- ခုခံမှုအဆင့်: $3,975–$4,000
- ပိုမိုအားကောင်းသော ခုခံမှုအဆင့်: $4,027
ရွှေဈေးကို ဘယ်အချက်တွေက လှုပ်ရှားစေနေတာလဲ?
အမေရိကန်ဒေါ်လာ အားကောင်းလာခြင်း၊ ငွေချေးစာချုပ်အတိုးနှုန်းများ မြင့်တက်လာခြင်း၊ ငွေကြေးဖောင်းပွမှုအပေါ် စိုးရိမ်မှုများနှင့် အမေရိကန်ဗဟိုဘဏ်က ပိုမိုတင်းကျပ်သော မူဝါဒချမှတ်မည်ဟူသော မျှော်လင့်ချက်များကြောင့် ရွှေဈေးအပေါ် ဖိအားများ ဖြစ်ပေါ်နေသည်။
ဈေးကွက်အလားအလာ:
$4,000 အထက်သို့ ပြန်တက်နိုင်ပါက အတက်ဘက်အရှိန်အဟုန် တိုးတက်လာကြောင်း ပြသနိုင်သည်။ သို့သော် $3,869 အောက်သို့ ပြတ်ပြတ်သားသား ကျဆင်းပါက ရွှေသည် ထပ်မံအရောင်းဖိအားနှင့် ရင်ဆိုင်ရနိုင်သည်။
ရွှေဈေး၏ နောက်တစ်ဆင့်လှုပ်ရှားမှုသည် အမေရိကန်စီးပွားရေးအချက်အလက်များ၊ အမေရိကန်ဗဟိုဘဏ်၏ မူဝါဒအပေါ် မျှော်လင့်ချက်များနှင့် ကမ္ဘာ့ပထဝီနိုင်ငံရေး အခြေအနေများအပေါ် များစွာမူတည်နေမည်ဖြစ်သည်။
အဓိကမေးခွန်းမှာ—ဤအခြေအနေသည် ယာယီပြင်ဆင်ကျဆင်းမှုလား၊ သို့မဟုတ် ပိုမိုနက်ရှိုင်းသော အကျဘက်လမ်းကြောင်း၏ အစလား?
$XAUT
$CINF.US
$BTC
546
·
--
တက်ရိပ်ရှိသည်
ဘာသာပြန်ဆိုချက် ကြည့်မည်
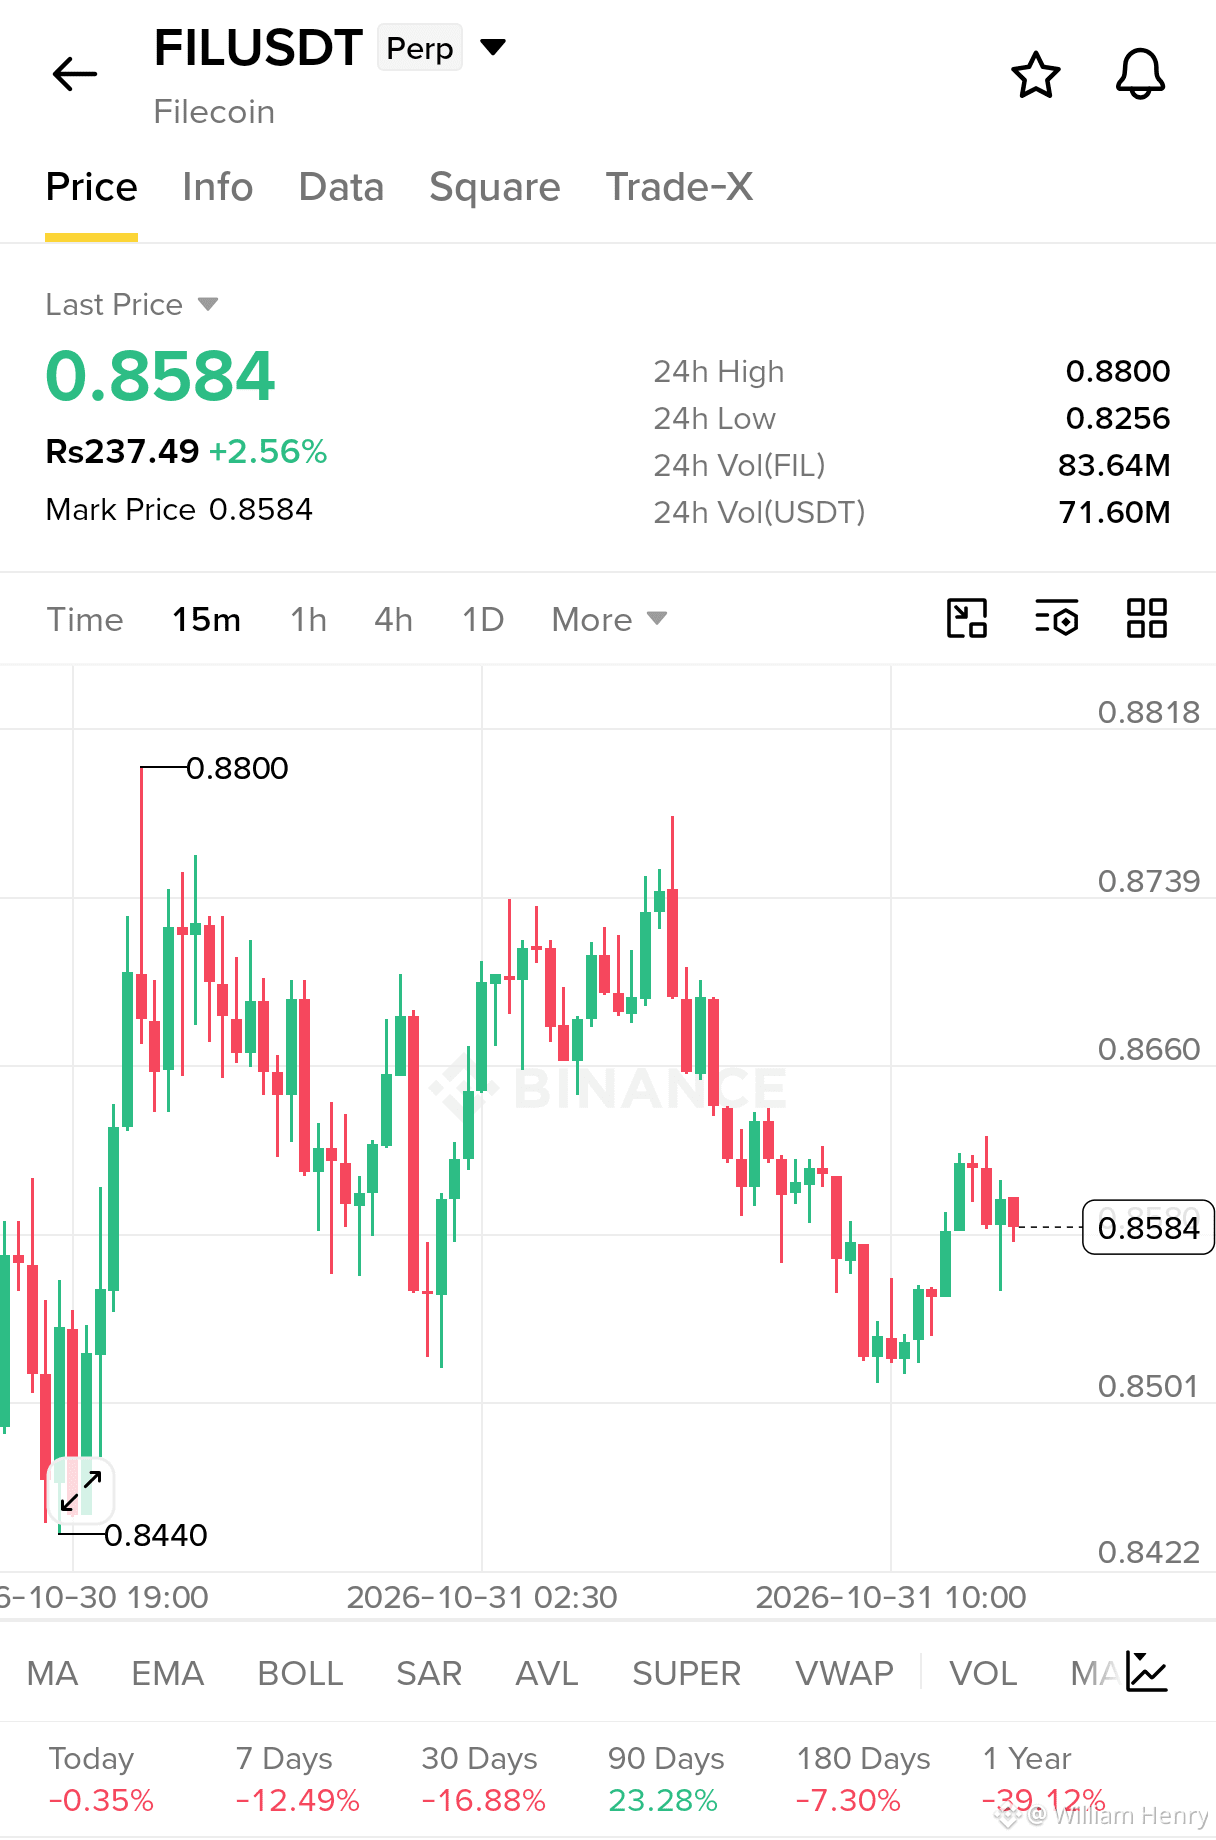
$FIL – BEARISH SETUP
FIL is struggling to reclaim resistance! Price is currently trading at $0.8584 (+2.56%) after bouncing from the $0.8500 support area. The 15M chart shows lower highs and selling pressure near $0.8620.
Trade Setup: LONG
Entry Zone: $0.8590 – $0.8620
TP1: $0.8550 TP2: $0.8500 TP3: $0.8440
Stop Loss: $0.8665
Bullish invalidation: A strong 15M close above $0.8665 could weaken the bearish setup.
Watch the $0.8600 resistance closely. A rejection could trigger another move lower.
Let's go $FIL
{future}(FILUSDT)
$FIL – BEARISH SETUP
FIL is struggling to reclaim resistance! Price is currently trading at $0.8584 (+2.56%) after bouncing from the $0.8500 support area. The 15M chart shows lower highs and selling pressure near $0.8620.
Trade Setup: LONG
Entry Zone: $0.8590 – $0.8620
TP1: $0.8550 TP2: $0.8500 TP3: $0.8440
Stop Loss: $0.8665
Bullish invalidation: A strong 15M close above $0.8665 could weaken the bearish setup.
Watch the $0.8600 resistance closely. A rejection could trigger another move lower.
Let's go $FIL
FIL is struggling to reclaim resistance! Price is currently trading at $0.8584 (+2.56%) after bouncing from the $0.8500 support area. The 15M chart shows lower highs and selling pressure near $0.8620.
Trade Setup: LONG
Entry Zone: $0.8590 – $0.8620
TP1: $0.8550 TP2: $0.8500 TP3: $0.8440
Stop Loss: $0.8665
Bullish invalidation: A strong 15M close above $0.8665 could weaken the bearish setup.
Watch the $0.8600 resistance closely. A rejection could trigger another move lower.
Let's go $FIL
1
609
·
--
တက်ရိပ်ရှိသည်
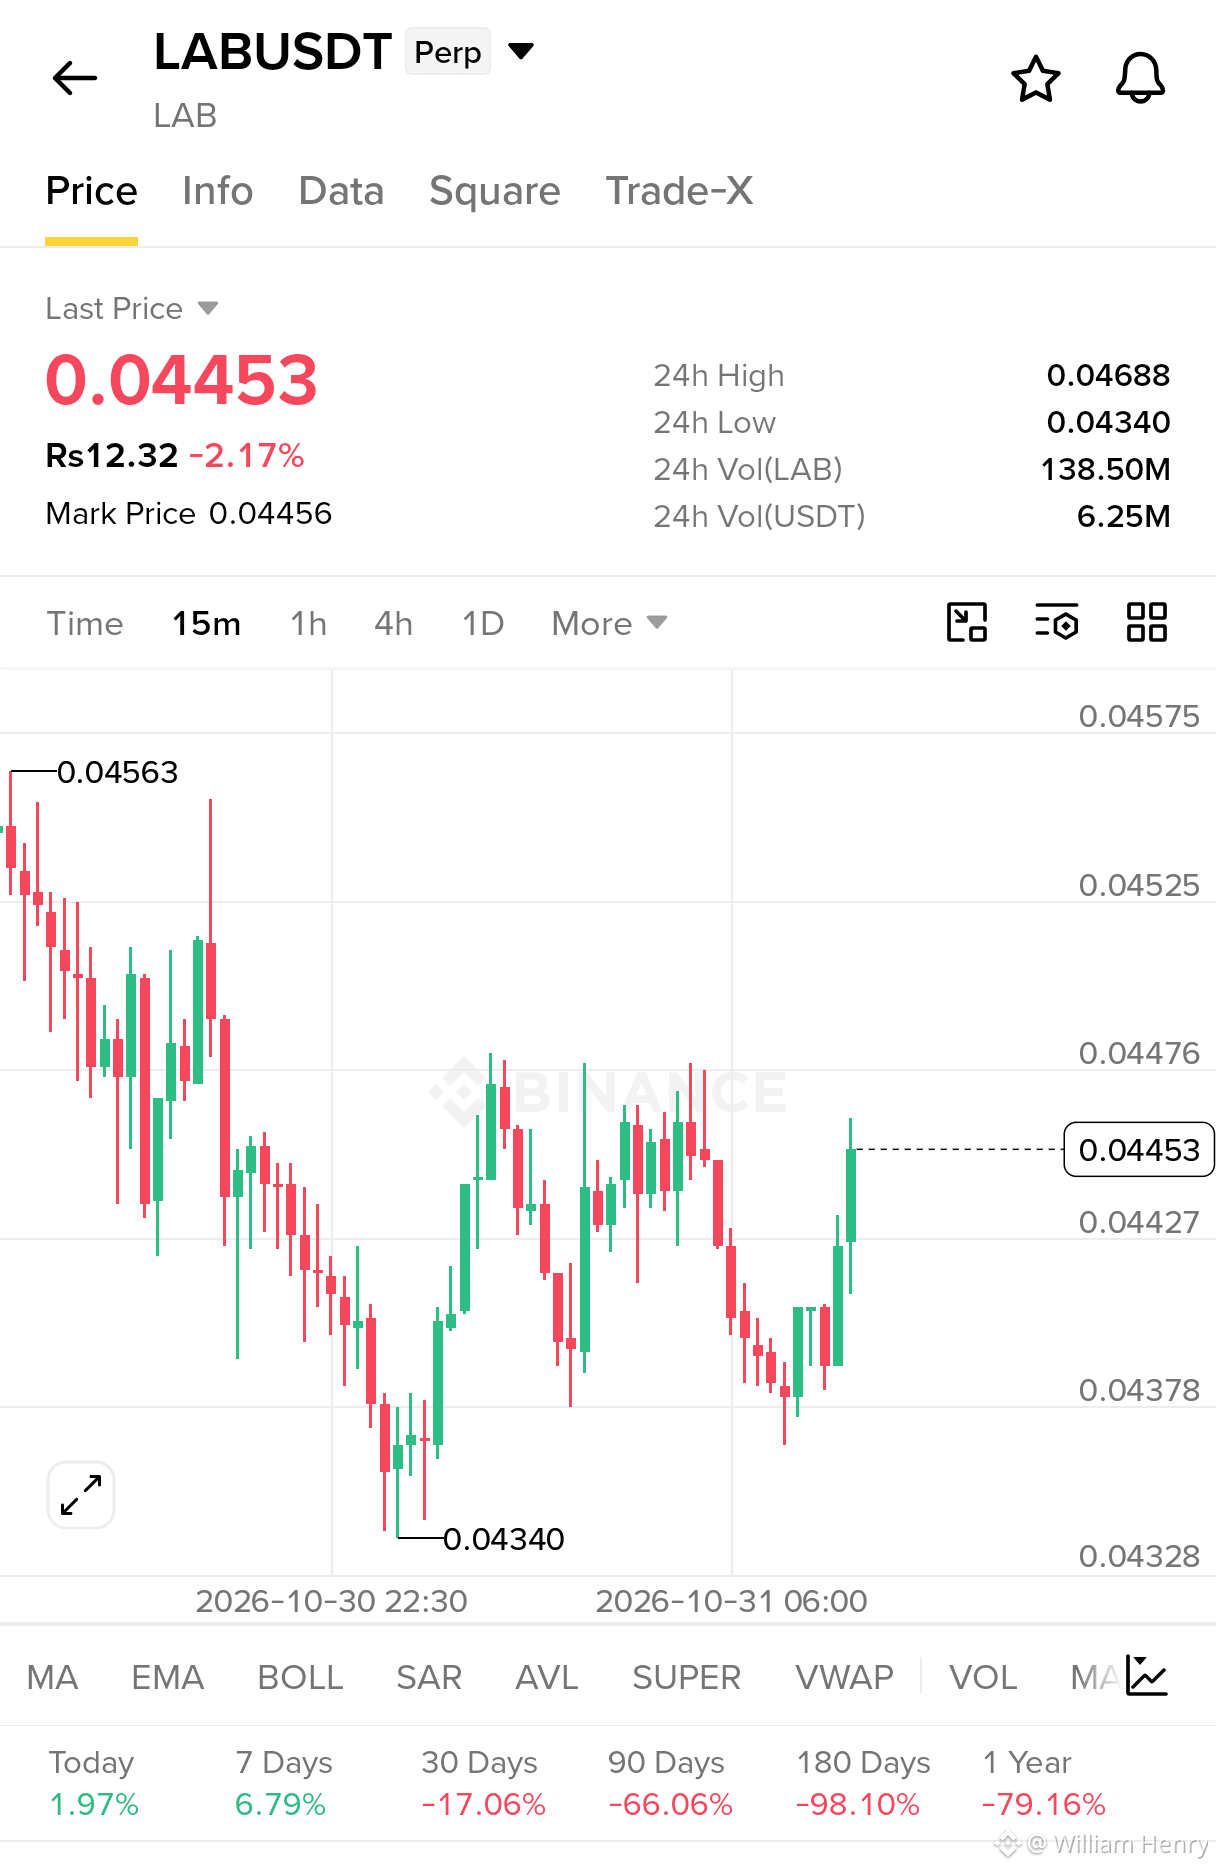
$LAB သည် 15 မိနစ်ဇယားတွင် ဝယ်ယူမှုအရှိန်သစ် ပြသနေပြီး၊ အနိမ့်ဆုံး $0.04340 မှ ပြန်တက်ကာ အနီးဆုံးခုခံမှုဖြစ်သော $0.04476 သို့ တက်လှမ်းနေသည်။
ကုန်သွယ်မှုအစီအစဉ်: LONG
ဝင်ရောက်ရန်ဈေးနှုန်းအပိုင်းအခြား: $0.04430 – $0.04455
TP1: $0.04476
TP2: $0.04500
TP3: $0.04525
Stop Loss: $0.04395
$0.04476 အထက်သို့ ခွဲထွက်တက်ပါက နောက်ထပ်အတက်လမ်းကြောင်းတစ်ခု ပွင့်လာနိုင်သည်။ မဝင်ရောက်မီ အတည်ပြုချက်ကို စောင့်ကြည့်ပါ။
စလိုက်ကြစို့ $LAB
{future}(LABUSDT)
$LAB သည် 15 မိနစ်ဇယားတွင် ဝယ်ယူမှုအရှိန်သစ် ပြသနေပြီး၊ အနိမ့်ဆုံး $0.04340 မှ ပြန်တက်ကာ အနီးဆုံးခုခံမှုဖြစ်သော $0.04476 သို့ တက်လှမ်းနေသည်။
ကုန်သွယ်မှုအစီအစဉ်: LONG
ဝင်ရောက်ရန်ဈေးနှုန်းအပိုင်းအခြား: $0.04430 – $0.04455
TP1: $0.04476
TP2: $0.04500
TP3: $0.04525
Stop Loss: $0.04395
$0.04476 အထက်သို့ ခွဲထွက်တက်ပါက နောက်ထပ်အတက်လမ်းကြောင်းတစ်ခု ပွင့်လာနိုင်သည်။ မဝင်ရောက်မီ အတည်ပြုချက်ကို စောင့်ကြည့်ပါ။
စလိုက်ကြစို့ $LAB
ကုန်သွယ်မှုအစီအစဉ်: LONG
ဝင်ရောက်ရန်ဈေးနှုန်းအပိုင်းအခြား: $0.04430 – $0.04455
TP1: $0.04476
TP2: $0.04500
TP3: $0.04525
Stop Loss: $0.04395
$0.04476 အထက်သို့ ခွဲထွက်တက်ပါက နောက်ထပ်အတက်လမ်းကြောင်းတစ်ခု ပွင့်လာနိုင်သည်။ မဝင်ရောက်မီ အတည်ပြုချက်ကို စောင့်ကြည့်ပါ။
စလိုက်ကြစို့ $LAB
1
613
·
--
တက်ရိပ်ရှိသည်
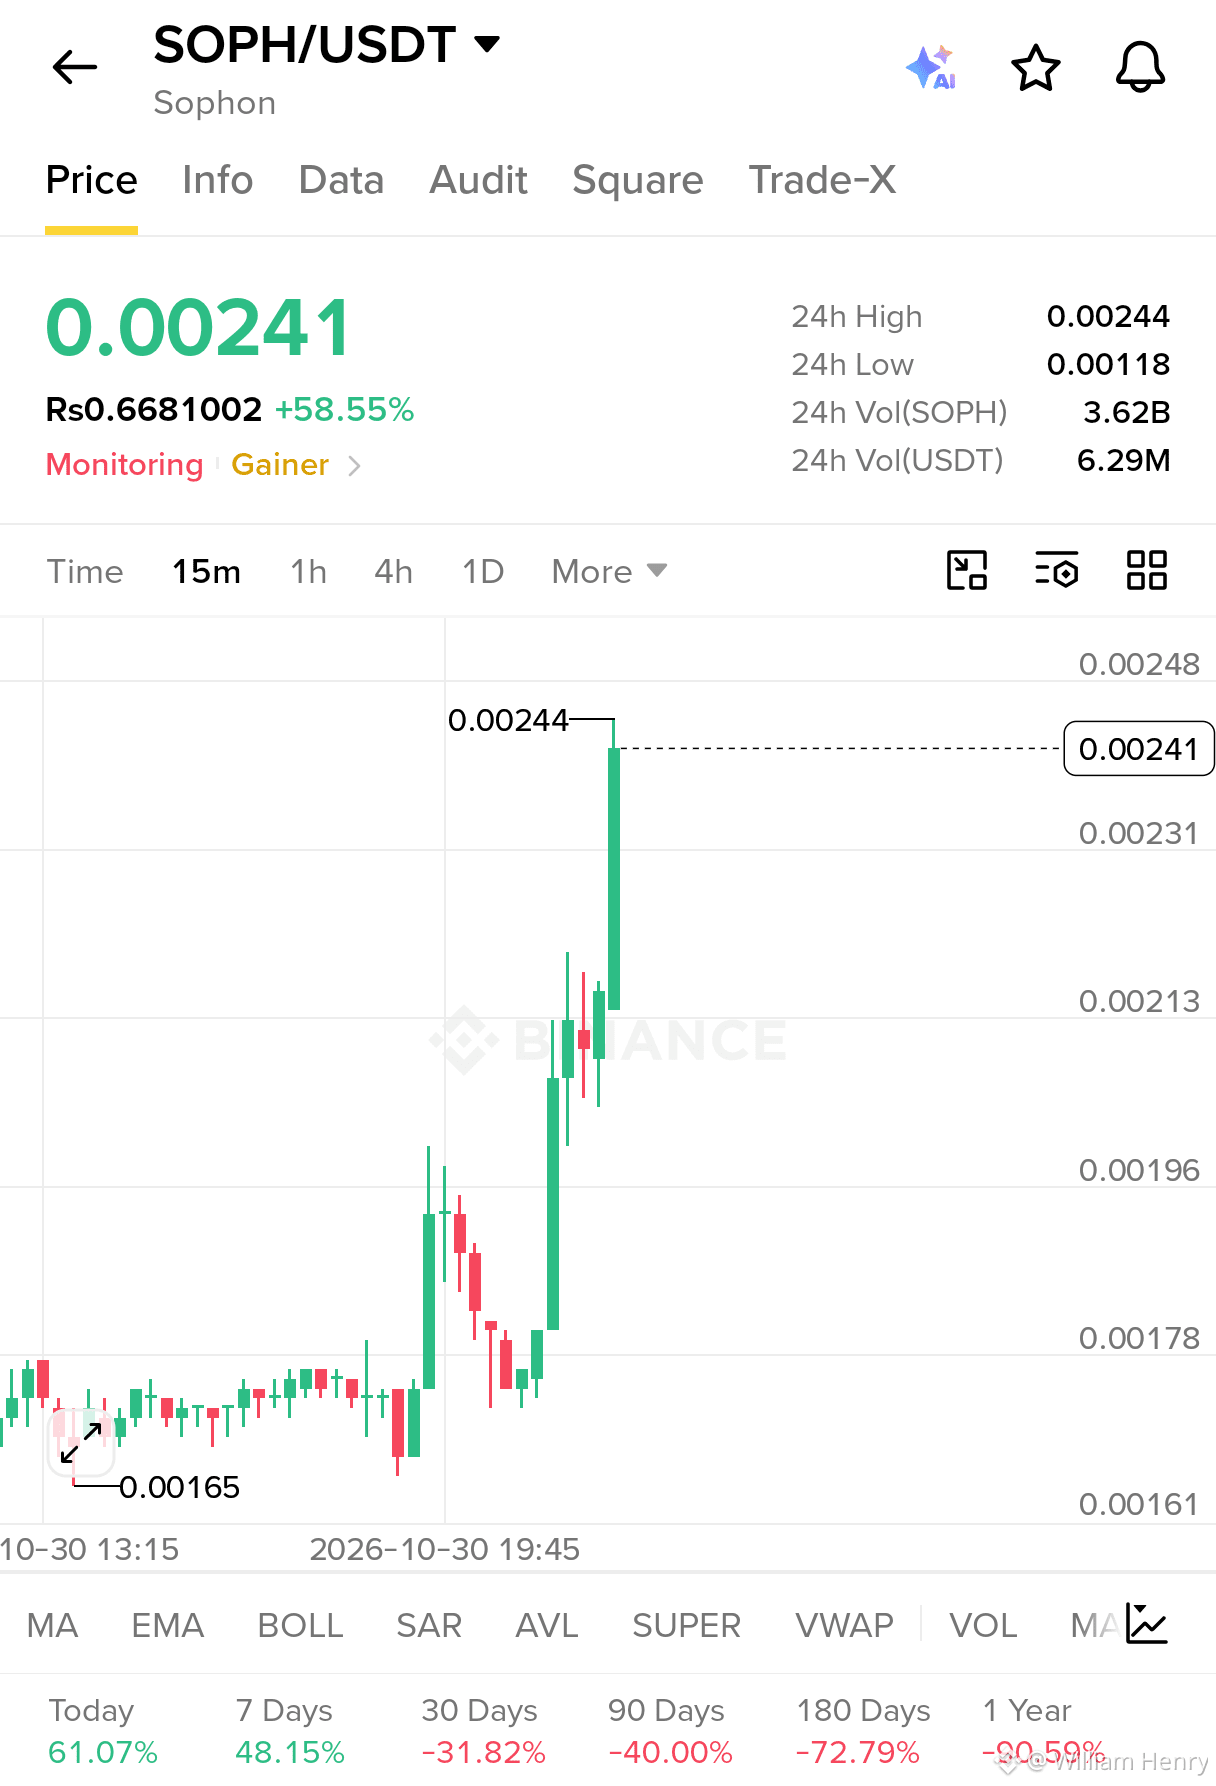
$SOPH — အတက်ဘက်သို့ ခွဲထွက်မှု သတိပေးချက်!
SOPH သည် 58.55% မြင့်တက်လာပြီး အားကောင်းသော 15M အတက်လှုပ်ရှားမှုအပြီး 0.00241 ဖြင့် အရောင်းအဝယ်ဖြစ်နေသည်။ အတက်ဘက်ဈေးကွက်က 0.00244 ခုခံဈေးကို စမ်းသပ်နေသည်။ သေချာစွာ ခွဲထွက်နိုင်ပါက နောက်ထပ် ဈေးတက်လှုပ်ရှားမှုတစ်ခု ဖြစ်ပေါ်နိုင်သည်။
ကုန်သွယ်မှုအစီအစဉ်: အဝယ် (LONG)
ဝင်ရောက်ဈေး: 0.00230–0.00238 (ပြန်လည်စမ်းသပ်မှု)
အမြတ်ယူဈေး 1: 0.00250
အမြတ်ယူဈေး 2: 0.00258
အမြတ်ယူဈေး 3: 0.00270
အရှုံးဖြတ်ဈေး: 0.00220
ဝင်ရောက်မည့်အချိန်မတိုင်မီ အတည်ပြုချက်ကို စောင့်ကြည့်ပါ။ ဈေးတက်နေမှုနောက်ကို မလိုက်ပါနှင့်။ စွန့်စားမှုစီမံခန့်ခွဲရေးကို ဦးစားပေးပါ။ 🔥
{future}(SOPHUSDT)
$SOPH — အတက်ဘက်သို့ ခွဲထွက်မှု သတိပေးချက်!
SOPH သည် 58.55% မြင့်တက်လာပြီး အားကောင်းသော 15M အတက်လှုပ်ရှားမှုအပြီး 0.00241 ဖြင့် အရောင်းအဝယ်ဖြစ်နေသည်။ အတက်ဘက်ဈေးကွက်က 0.00244 ခုခံဈေးကို စမ်းသပ်နေသည်။ သေချာစွာ ခွဲထွက်နိုင်ပါက နောက်ထပ် ဈေးတက်လှုပ်ရှားမှုတစ်ခု ဖြစ်ပေါ်နိုင်သည်။
ကုန်သွယ်မှုအစီအစဉ်: အဝယ် (LONG)
ဝင်ရောက်ဈေး: 0.00230–0.00238 (ပြန်လည်စမ်းသပ်မှု)
အမြတ်ယူဈေး 1: 0.00250
အမြတ်ယူဈေး 2: 0.00258
အမြတ်ယူဈေး 3: 0.00270
အရှုံးဖြတ်ဈေး: 0.00220
ဝင်ရောက်မည့်အချိန်မတိုင်မီ အတည်ပြုချက်ကို စောင့်ကြည့်ပါ။ ဈေးတက်နေမှုနောက်ကို မလိုက်ပါနှင့်။ စွန့်စားမှုစီမံခန့်ခွဲရေးကို ဦးစားပေးပါ။ 🔥
SOPH သည် 58.55% မြင့်တက်လာပြီး အားကောင်းသော 15M အတက်လှုပ်ရှားမှုအပြီး 0.00241 ဖြင့် အရောင်းအဝယ်ဖြစ်နေသည်။ အတက်ဘက်ဈေးကွက်က 0.00244 ခုခံဈေးကို စမ်းသပ်နေသည်။ သေချာစွာ ခွဲထွက်နိုင်ပါက နောက်ထပ် ဈေးတက်လှုပ်ရှားမှုတစ်ခု ဖြစ်ပေါ်နိုင်သည်။
ကုန်သွယ်မှုအစီအစဉ်: အဝယ် (LONG)
ဝင်ရောက်ဈေး: 0.00230–0.00238 (ပြန်လည်စမ်းသပ်မှု)
အမြတ်ယူဈေး 1: 0.00250
အမြတ်ယူဈေး 2: 0.00258
အမြတ်ယူဈေး 3: 0.00270
အရှုံးဖြတ်ဈေး: 0.00220
ဝင်ရောက်မည့်အချိန်မတိုင်မီ အတည်ပြုချက်ကို စောင့်ကြည့်ပါ။ ဈေးတက်နေမှုနောက်ကို မလိုက်ပါနှင့်။ စွန့်စားမှုစီမံခန့်ခွဲရေးကို ဦးစားပေးပါ။ 🔥
William Henry
·
--
ကျရိပ်ရှိသည်$GTC SHORT — ဝက်ဝံဈေးကွက်ဘက်က ပြန်လည်တိုက်ခိုက်လာပြီ!
15M ဇယားတွင် $GTC သည် $0.20717 ဝန်းကျင်၌ အရောင်းအဝယ်ဖြစ်နေပြီး $0.222 အနီးတွင် ပြင်းထန်စွာ ငြင်းပယ်ခံရပြီးနောက် ပြန်လည်တက်လာရန် ရုန်းကန်နေရသည်။ မကြာသေးမီက ပြန်တက်လာမှုသည် အရှိန်လျော့သွားပြီး ဈေးနှုန်းသည် ခုခံမှုအောက်တွင် စုစည်းနေသည်။ ထောက်ပံ့မှုအဆင့် ကျိုးပေါက်ပါက ရောင်းသူများက ထိန်းချုပ်မှုရယူနိုင်သည်။
ဝင်ရောက်ရန်ဇုန်: $0.2070–$0.2090
အရှုံးဖြတ်မှတ်: $0.2130
TP1: $0.2030
TP2: $0.1993
TP3: $0.1930
$0.2030 အောက်သို့ ကျိုးပေါက်ပါက ပိုနိမ့်သော ထောက်ပံ့မှုအဆင့်ဆီသို့ နောက်ထပ် အကျဘက်လှုပ်ရှားမှုတစ်ခု ဖြစ်ပေါ်လာနိုင်သည်။ မဝင်ရောက်မီ အတည်ပြုချက်ကို စောင့်ကြည့်ပါ။
သတိရှိပါ၊ သင့်ရင်းနှီးငွေကို ကာကွယ်ပါ၊ $GTC ကို ဆက်လုပ်ကြစို့
15M ဇယားတွင် $GTC သည် $0.20717 ဝန်းကျင်၌ အရောင်းအဝယ်ဖြစ်နေပြီး $0.222 အနီးတွင် ပြင်းထန်စွာ ငြင်းပယ်ခံရပြီးနောက် ပြန်လည်တက်လာရန် ရုန်းကန်နေရသည်။ မကြာသေးမီက ပြန်တက်လာမှုသည် အရှိန်လျော့သွားပြီး ဈေးနှုန်းသည် ခုခံမှုအောက်တွင် စုစည်းနေသည်။ ထောက်ပံ့မှုအဆင့် ကျိုးပေါက်ပါက ရောင်းသူများက ထိန်းချုပ်မှုရယူနိုင်သည်။
ဝင်ရောက်ရန်ဇုန်: $0.2070–$0.2090
အရှုံးဖြတ်မှတ်: $0.2130
TP1: $0.2030
TP2: $0.1993
TP3: $0.1930
$0.2030 အောက်သို့ ကျိုးပေါက်ပါက ပိုနိမ့်သော ထောက်ပံ့မှုအဆင့်ဆီသို့ နောက်ထပ် အကျဘက်လှုပ်ရှားမှုတစ်ခု ဖြစ်ပေါ်လာနိုင်သည်။ မဝင်ရောက်မီ အတည်ပြုချက်ကို စောင့်ကြည့်ပါ။
သတိရှိပါ၊ သင့်ရင်းနှီးငွေကို ကာကွယ်ပါ၊ $GTC ကို ဆက်လုပ်ကြစို့
2
107
·
--
ကျရိပ်ရှိသည်
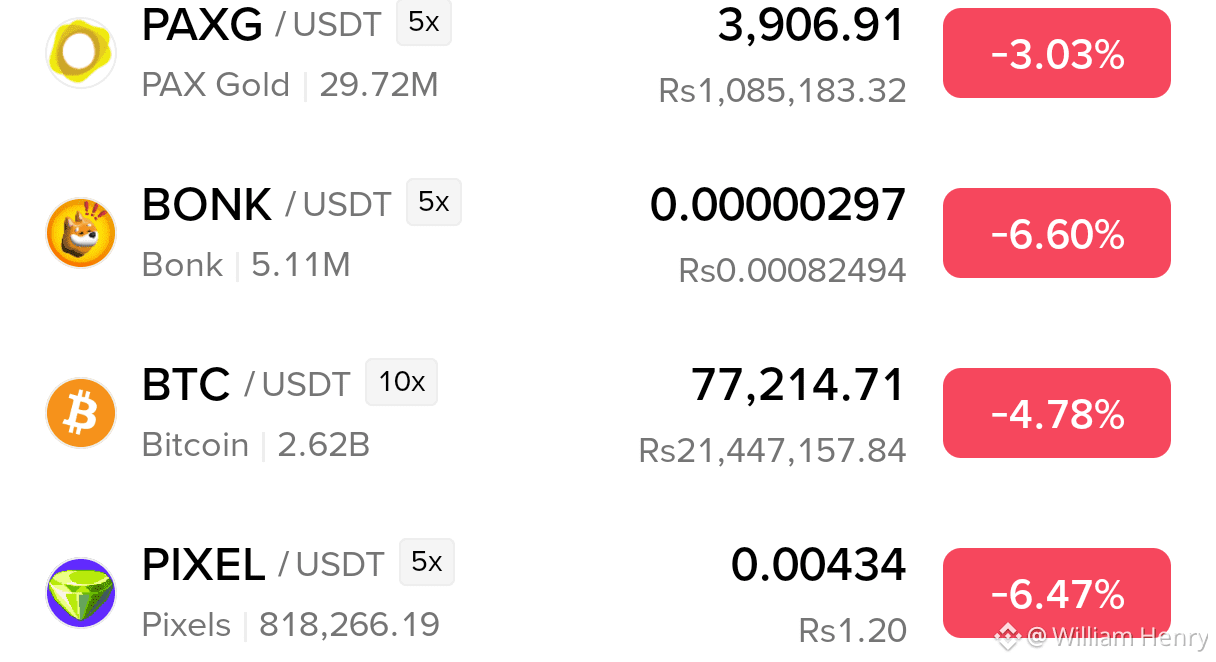
ဈေးကွက်သတိပေးချက်: ဈေးနှုန်းကျဆင်းမှုဘက်က ထိန်းချုပ်လာနေပြီ!
$PAXG ကျဆင်းမှု 3.03% | ဈေးနှုန်း: $3,906.91 | 5x
$BONK ကျဆင်းမှု 6.60% | ဈေးနှုန်း: $0.00000297 | 5x
$BTC ကျဆင်းမှု 4.78% | ဈေးနှုန်း: $77,214.71 | 10x
$PIXEL ကျဆင်းမှု 6.47% | ဈေးနှုန်း: $0.00434 | 5x
⚠️ ဈေးကွက်တစ်ခုလုံးမှာ အရောင်းဖိအား ပြင်းထန်နေပါတယ်! ပိုင်ဆိုင်မှုလေးမျိုးလုံး ဈေးကျနေပါတယ်။ ဈေးနှုန်းအတက်အကျ ပိုများလာနေတဲ့အတွက် သတိနဲ့ရောင်းဝယ်ပြီး အရေးကြီးတဲ့ ထောက်ပံ့ဈေးအဆင့်တွေကို စောင့်ကြည့်ပါ။
သတိရှိပါ။ ဆက်သွားကြရအောင်!
ဈေးကွက်သတိပေးချက်: ဈေးနှုန်းကျဆင်းမှုဘက်က ထိန်းချုပ်လာနေပြီ!
$PAXG ကျဆင်းမှု 3.03% | ဈေးနှုန်း: $3,906.91 | 5x
$BONK ကျဆင်းမှု 6.60% | ဈေးနှုန်း: $0.00000297 | 5x
$BTC ကျဆင်းမှု 4.78% | ဈေးနှုန်း: $77,214.71 | 10x
$PIXEL ကျဆင်းမှု 6.47% | ဈေးနှုန်း: $0.00434 | 5x
⚠️ ဈေးကွက်တစ်ခုလုံးမှာ အရောင်းဖိအား ပြင်းထန်နေပါတယ်! ပိုင်ဆိုင်မှုလေးမျိုးလုံး ဈေးကျနေပါတယ်။ ဈေးနှုန်းအတက်အကျ ပိုများလာနေတဲ့အတွက် သတိနဲ့ရောင်းဝယ်ပြီး အရေးကြီးတဲ့ ထောက်ပံ့ဈေးအဆင့်တွေကို စောင့်ကြည့်ပါ။
သတိရှိပါ။ ဆက်သွားကြရအောင်!
$PAXG ကျဆင်းမှု 3.03% | ဈေးနှုန်း: $3,906.91 | 5x
$BONK ကျဆင်းမှု 6.60% | ဈေးနှုန်း: $0.00000297 | 5x
$BTC ကျဆင်းမှု 4.78% | ဈေးနှုန်း: $77,214.71 | 10x
$PIXEL ကျဆင်းမှု 6.47% | ဈေးနှုန်း: $0.00434 | 5x
⚠️ ဈေးကွက်တစ်ခုလုံးမှာ အရောင်းဖိအား ပြင်းထန်နေပါတယ်! ပိုင်ဆိုင်မှုလေးမျိုးလုံး ဈေးကျနေပါတယ်။ ဈေးနှုန်းအတက်အကျ ပိုများလာနေတဲ့အတွက် သတိနဲ့ရောင်းဝယ်ပြီး အရေးကြီးတဲ့ ထောက်ပံ့ဈေးအဆင့်တွေကို စောင့်ကြည့်ပါ။
သတိရှိပါ။ ဆက်သွားကြရအောင်!
William Henry
·
--
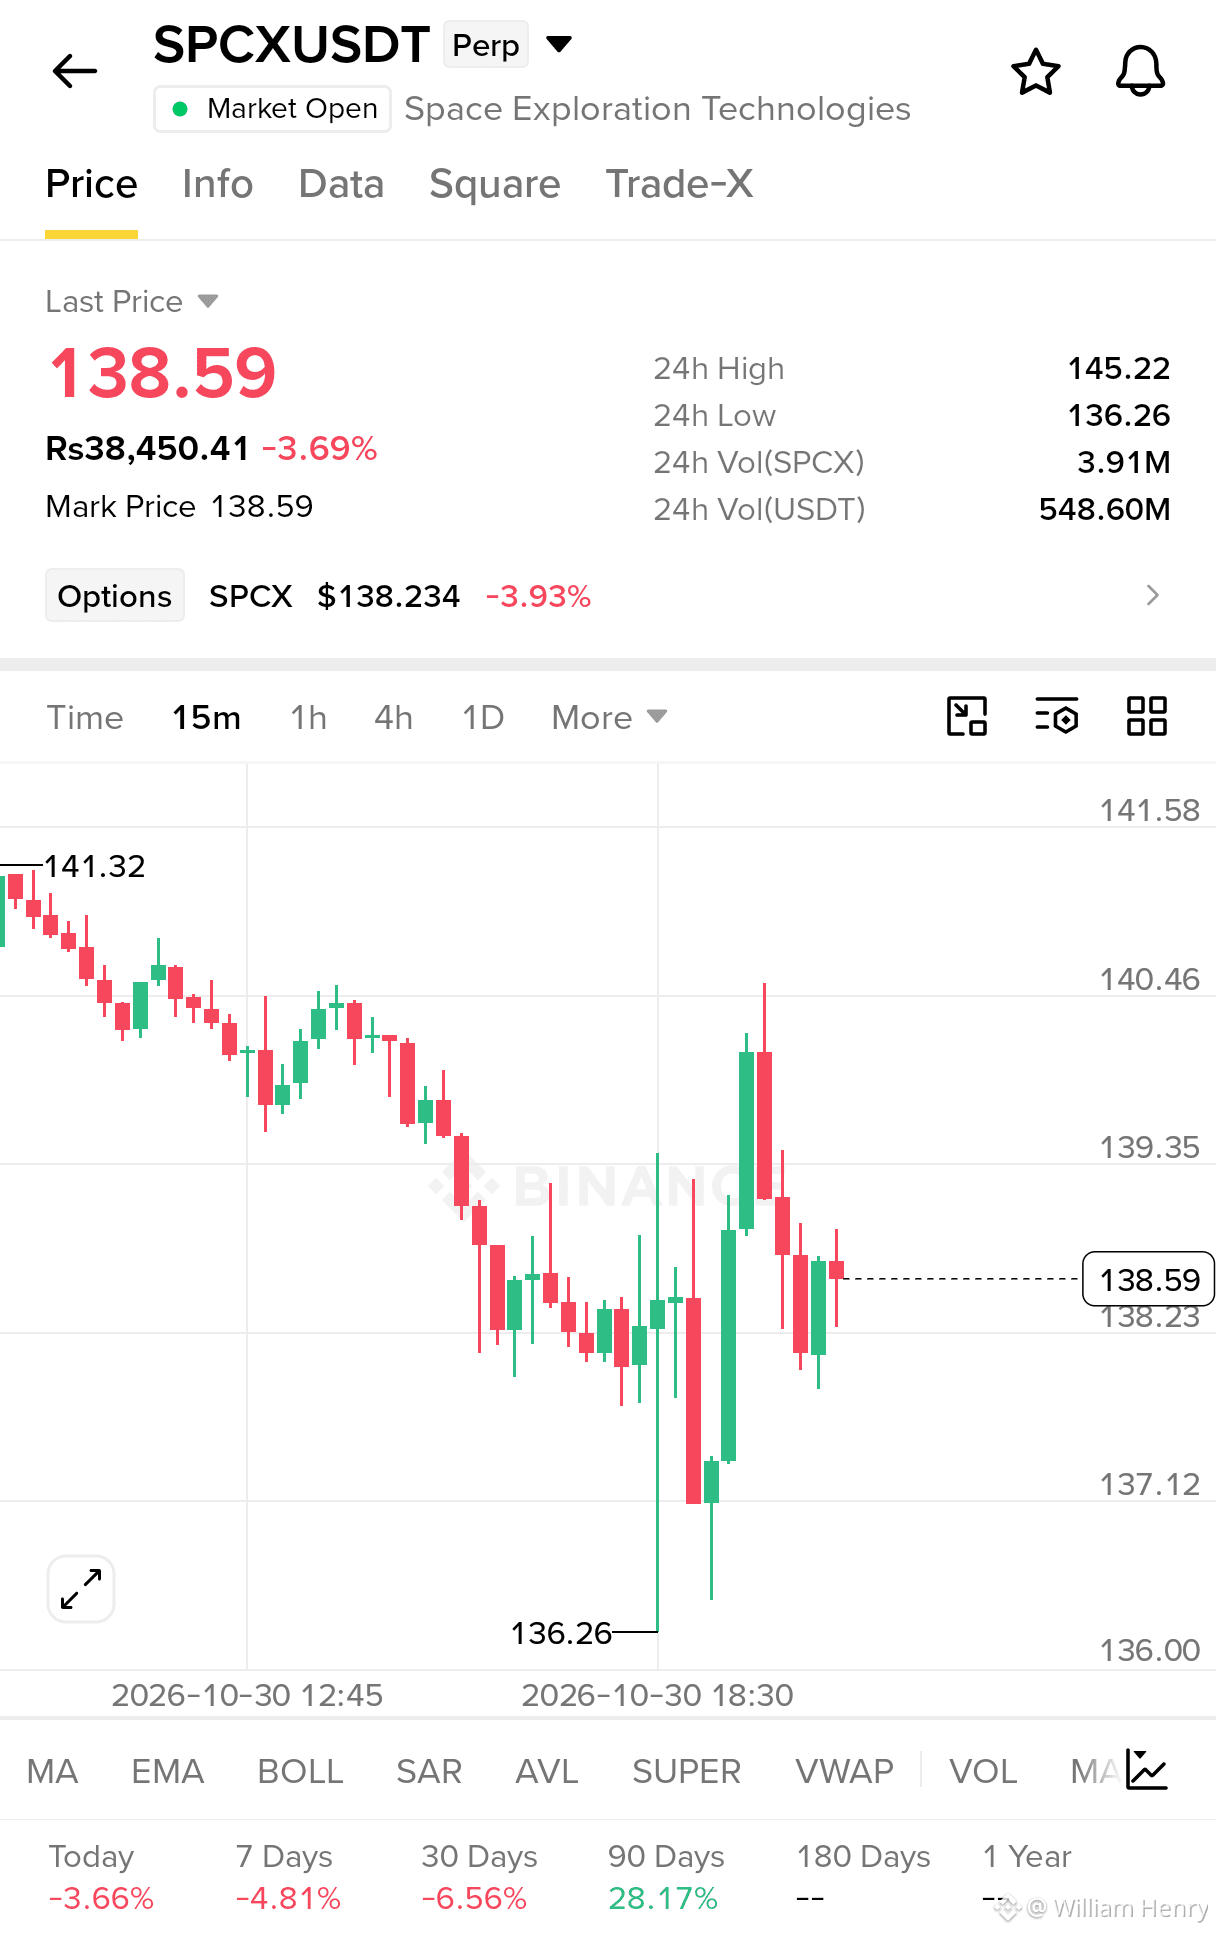
ကျရိပ်ရှိသည်$SPCXB ဝက်ဝံများက ထိန်းချုပ်မှုကို ဆက်လက်ရယူထားသည် — အတိုရောင်းရန်!
$SPCX သည် 138.59 ဖြင့် အရောင်းအဝယ်ဖြစ်နေပြီး 3.69% ကျဆင်းထားသည်။ 15 မိနစ်ဇယားတွင် ကျဆင်းသည့်ပုံစံကို ရှင်းလင်းစွာ တွေ့ရသည်။ 140.00–140.46 ခုခံဇုန်မှ ဈေးနှုန်းကို ငြင်းပယ်ခံရပြီးနောက် ရောင်းသူများ ဆက်လက်တက်ကြွနေသည်။
အရောင်းအဝယ်အစီအစဉ်:
ဦးတည်ချက်: အတိုရောင်းရန်
ဝင်ရောက်မည့်ဇုန်: 138.55–138.90
အရှုံးဖြတ်မှတ်: 139.45
ပထမအမြတ်ရယူမှတ်: 138.23
ဒုတိယအမြတ်ရယူမှတ်: 137.12
တတိယအမြတ်ရယူမှတ်: 136.26
138.23 အောက်သို့ ကျိုးကျသွားပါက 137.12 နှင့် 136.26 ရှိ ထောက်ပံ့မှုအဆင့်များဆီသို့ ရောင်းအားဖိအား ပိုမိုမြင့်တက်လာနိုင်သည်။ အရောင်းအဝယ်မဝင်မီ ကျိုးကျမှုကို အတည်ပြုနိုင်ရန် စောင့်ကြည့်ပါ။
ဝက်ဝံများက အသာစီးရနေသည်။
$BTC
$SPCX သည် 138.59 ဖြင့် အရောင်းအဝယ်ဖြစ်နေပြီး 3.69% ကျဆင်းထားသည်။ 15 မိနစ်ဇယားတွင် ကျဆင်းသည့်ပုံစံကို ရှင်းလင်းစွာ တွေ့ရသည်။ 140.00–140.46 ခုခံဇုန်မှ ဈေးနှုန်းကို ငြင်းပယ်ခံရပြီးနောက် ရောင်းသူများ ဆက်လက်တက်ကြွနေသည်။
အရောင်းအဝယ်အစီအစဉ်:
ဦးတည်ချက်: အတိုရောင်းရန်
ဝင်ရောက်မည့်ဇုန်: 138.55–138.90
အရှုံးဖြတ်မှတ်: 139.45
ပထမအမြတ်ရယူမှတ်: 138.23
ဒုတိယအမြတ်ရယူမှတ်: 137.12
တတိယအမြတ်ရယူမှတ်: 136.26
138.23 အောက်သို့ ကျိုးကျသွားပါက 137.12 နှင့် 136.26 ရှိ ထောက်ပံ့မှုအဆင့်များဆီသို့ ရောင်းအားဖိအား ပိုမိုမြင့်တက်လာနိုင်သည်။ အရောင်းအဝယ်မဝင်မီ ကျိုးကျမှုကို အတည်ပြုနိုင်ရန် စောင့်ကြည့်ပါ။
ဝက်ဝံများက အသာစီးရနေသည်။
$BTC
578
·
--
ကျရိပ်ရှိသည်
$SPCXB ဝက်ဝံများက ထိန်းချုပ်မှုကို ဆက်လက်ရယူထားသည် — အတိုရောင်းရန်!
$SPCX သည် 138.59 ဖြင့် အရောင်းအဝယ်ဖြစ်နေပြီး 3.69% ကျဆင်းထားသည်။ 15 မိနစ်ဇယားတွင် ကျဆင်းသည့်ပုံစံကို ရှင်းလင်းစွာ တွေ့ရသည်။ 140.00–140.46 ခုခံဇုန်မှ ဈေးနှုန်းကို ငြင်းပယ်ခံရပြီးနောက် ရောင်းသူများ ဆက်လက်တက်ကြွနေသည်။
အရောင်းအဝယ်အစီအစဉ်:
ဦးတည်ချက်: အတိုရောင်းရန်
ဝင်ရောက်မည့်ဇုန်: 138.55–138.90
အရှုံးဖြတ်မှတ်: 139.45
ပထမအမြတ်ရယူမှတ်: 138.23
ဒုတိယအမြတ်ရယူမှတ်: 137.12
တတိယအမြတ်ရယူမှတ်: 136.26
138.23 အောက်သို့ ကျိုးကျသွားပါက 137.12 နှင့် 136.26 ရှိ ထောက်ပံ့မှုအဆင့်များဆီသို့ ရောင်းအားဖိအား ပိုမိုမြင့်တက်လာနိုင်သည်။ အရောင်းအဝယ်မဝင်မီ ကျိုးကျမှုကို အတည်ပြုနိုင်ရန် စောင့်ကြည့်ပါ။
ဝက်ဝံများက အသာစီးရနေသည်။
{spot}(SPCXBUSDT)
$BTC
{future}(BTCUSDT)
$SPCXB ဝက်ဝံများက ထိန်းချုပ်မှုကို ဆက်လက်ရယူထားသည် — အတိုရောင်းရန်!
$SPCX သည် 138.59 ဖြင့် အရောင်းအဝယ်ဖြစ်နေပြီး 3.69% ကျဆင်းထားသည်။ 15 မိနစ်ဇယားတွင် ကျဆင်းသည့်ပုံစံကို ရှင်းလင်းစွာ တွေ့ရသည်။ 140.00–140.46 ခုခံဇုန်မှ ဈေးနှုန်းကို ငြင်းပယ်ခံရပြီးနောက် ရောင်းသူများ ဆက်လက်တက်ကြွနေသည်။
အရောင်းအဝယ်အစီအစဉ်:
ဦးတည်ချက်: အတိုရောင်းရန်
ဝင်ရောက်မည့်ဇုန်: 138.55–138.90
အရှုံးဖြတ်မှတ်: 139.45
ပထမအမြတ်ရယူမှတ်: 138.23
ဒုတိယအမြတ်ရယူမှတ်: 137.12
တတိယအမြတ်ရယူမှတ်: 136.26
138.23 အောက်သို့ ကျိုးကျသွားပါက 137.12 နှင့် 136.26 ရှိ ထောက်ပံ့မှုအဆင့်များဆီသို့ ရောင်းအားဖိအား ပိုမိုမြင့်တက်လာနိုင်သည်။ အရောင်းအဝယ်မဝင်မီ ကျိုးကျမှုကို အတည်ပြုနိုင်ရန် စောင့်ကြည့်ပါ။
ဝက်ဝံများက အသာစီးရနေသည်။
$BTC
$SPCX သည် 138.59 ဖြင့် အရောင်းအဝယ်ဖြစ်နေပြီး 3.69% ကျဆင်းထားသည်။ 15 မိနစ်ဇယားတွင် ကျဆင်းသည့်ပုံစံကို ရှင်းလင်းစွာ တွေ့ရသည်။ 140.00–140.46 ခုခံဇုန်မှ ဈေးနှုန်းကို ငြင်းပယ်ခံရပြီးနောက် ရောင်းသူများ ဆက်လက်တက်ကြွနေသည်။
အရောင်းအဝယ်အစီအစဉ်:
ဦးတည်ချက်: အတိုရောင်းရန်
ဝင်ရောက်မည့်ဇုန်: 138.55–138.90
အရှုံးဖြတ်မှတ်: 139.45
ပထမအမြတ်ရယူမှတ်: 138.23
ဒုတိယအမြတ်ရယူမှတ်: 137.12
တတိယအမြတ်ရယူမှတ်: 136.26
138.23 အောက်သို့ ကျိုးကျသွားပါက 137.12 နှင့် 136.26 ရှိ ထောက်ပံ့မှုအဆင့်များဆီသို့ ရောင်းအားဖိအား ပိုမိုမြင့်တက်လာနိုင်သည်။ အရောင်းအဝယ်မဝင်မီ ကျိုးကျမှုကို အတည်ပြုနိုင်ရန် စောင့်ကြည့်ပါ။
ဝက်ဝံများက အသာစီးရနေသည်။
$BTC
1
1
1.9k
·
--
တက်ရိပ်ရှိသည်
ဘာသာပြန်ဆိုချက် ကြည့်မည်
🚨 BINANCE IS READY FOR THE STORM!
With $6.34 BILLION reportedly available to absorb hack losses, Binance is sending a powerful message: SAFETY FIRST, TRUST ALWAYS.
Even in the toughest moments, confidence matters! 🔥
$BTC $ETH $BNB
🚨 BINANCE IS READY FOR THE STORM!
With $6.34 BILLION reportedly available to absorb hack losses, Binance is sending a powerful message: SAFETY FIRST, TRUST ALWAYS.
Even in the toughest moments, confidence matters! 🔥
$BTC $ETH $BNB
With $6.34 BILLION reportedly available to absorb hack losses, Binance is sending a powerful message: SAFETY FIRST, TRUST ALWAYS.
Even in the toughest moments, confidence matters! 🔥
$BTC $ETH $BNB

2
527
·
--
ကျရိပ်ရှိသည်
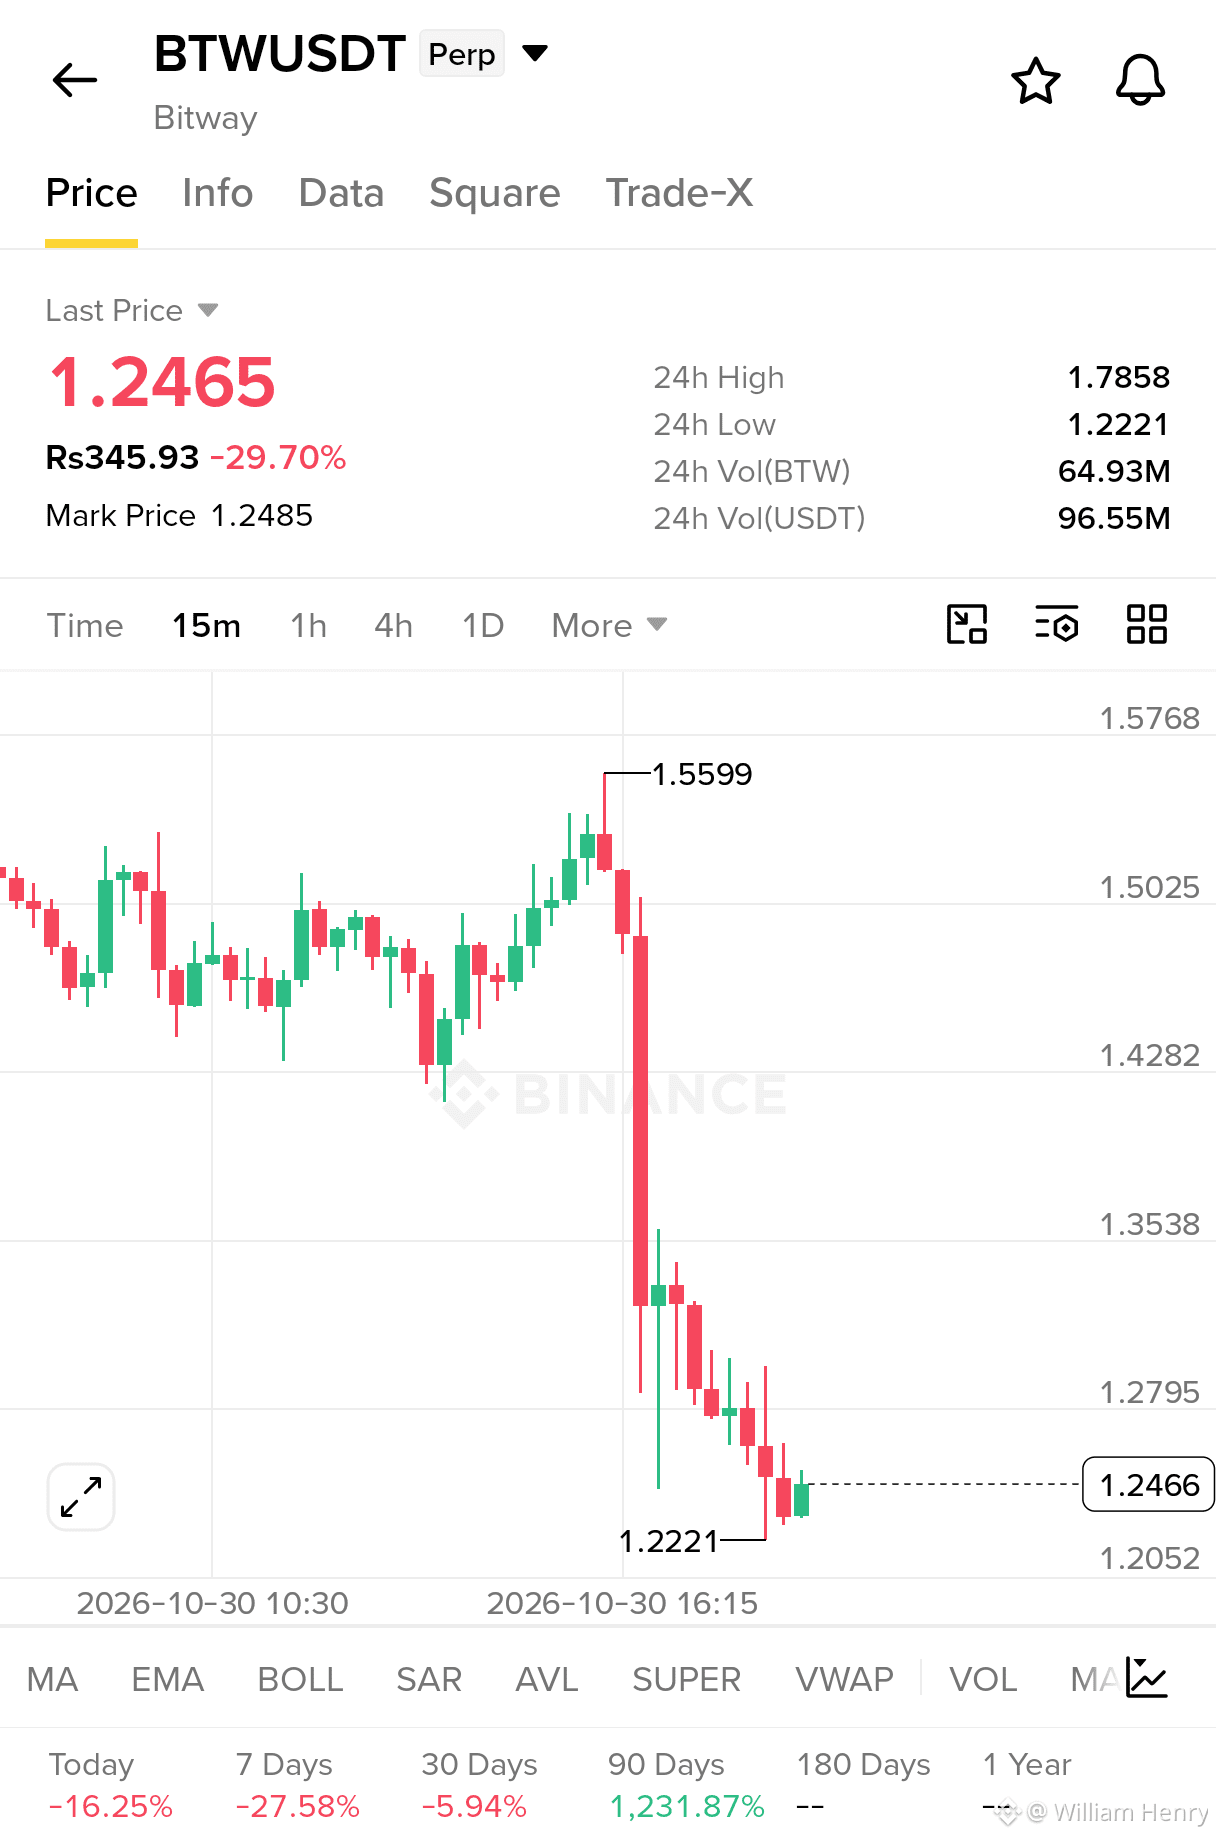
$BTW အတိုရောင်း — ဝက်ဝံများက အပြည့်အဝ ထိန်းချုပ်ထားသည်!
$1.55 ဝန်းကျင်မှ အကြီးအကျယ် ကျဆင်းသွားပြီးနောက် BTW သည် 15M ဇယားတွင် ပြင်းထန်သော ကျဆင်းအားကို ပြသနေသည်။ လက်ရှိဈေးနှုန်းမှာ $1.2465 ဝန်းကျင်တွင် အရောင်းအဝယ်ဖြစ်နေပြီး 30% နီးပါး ကျဆင်းထားကာ အရောင်းသမားများက 24H အနိမ့်ဆုံးဖြစ်သော $1.2221 သို့ တွန်းပို့နေသည်။
ကုန်သွယ်မှုအစီအစဉ်: အတိုရောင်း
လက်ရှိဈေးနှုန်း: $1.2465
ဝင်ရောက်ရန်ဇုန်: $1.2600–$1.2795
အရှုံးဖြတ်ဈေး: $1.3538
TP1: $1.2221
TP2: $1.2052
* TP3: ကျဆင်းအား ဆက်လက်ရှိနေပါက အမြတ်ကို နောက်လိုက်ကာ ထိန်းသိမ်းပါ။
ဈေးကွက်အလားအလာ: ဈေးကွက်ဖွဲ့စည်းပုံမှာ ပြင်းထန်စွာ ကျဆင်းနေဆဲဖြစ်သည်။ $1.2221 အောက်သို့ အတည်ပြုကျဆင်းပါက နောက်ထပ် ပြင်းထန်သော ရောင်းချမှုလှိုင်းတစ်ခု ဖြစ်ပေါ်နိုင်သည်။ ဈေးနှုန်းလှုပ်ရှားမှုနောက်ကို အလျင်စလို မလိုက်ပါနှင့်။ သင့်လျော်သော ပြန်လည်စမ်းသပ်မှုကို စောင့်ပါ။
ဤဇယားတွင် ဝက်ဝံများက လွှမ်းမိုးထားသည်။ စလိုက်ကြစို့ $BTW
{future}(BTWUSDT)
$BTW အတိုရောင်း — ဝက်ဝံများက အပြည့်အဝ ထိန်းချုပ်ထားသည်!
$1.55 ဝန်းကျင်မှ အကြီးအကျယ် ကျဆင်းသွားပြီးနောက် BTW သည် 15M ဇယားတွင် ပြင်းထန်သော ကျဆင်းအားကို ပြသနေသည်။ လက်ရှိဈေးနှုန်းမှာ $1.2465 ဝန်းကျင်တွင် အရောင်းအဝယ်ဖြစ်နေပြီး 30% နီးပါး ကျဆင်းထားကာ အရောင်းသမားများက 24H အနိမ့်ဆုံးဖြစ်သော $1.2221 သို့ တွန်းပို့နေသည်။
ကုန်သွယ်မှုအစီအစဉ်: အတိုရောင်း
လက်ရှိဈေးနှုန်း: $1.2465
ဝင်ရောက်ရန်ဇုန်: $1.2600–$1.2795
အရှုံးဖြတ်ဈေး: $1.3538
TP1: $1.2221
TP2: $1.2052
* TP3: ကျဆင်းအား ဆက်လက်ရှိနေပါက အမြတ်ကို နောက်လိုက်ကာ ထိန်းသိမ်းပါ။
ဈေးကွက်အလားအလာ: ဈေးကွက်ဖွဲ့စည်းပုံမှာ ပြင်းထန်စွာ ကျဆင်းနေဆဲဖြစ်သည်။ $1.2221 အောက်သို့ အတည်ပြုကျဆင်းပါက နောက်ထပ် ပြင်းထန်သော ရောင်းချမှုလှိုင်းတစ်ခု ဖြစ်ပေါ်နိုင်သည်။ ဈေးနှုန်းလှုပ်ရှားမှုနောက်ကို အလျင်စလို မလိုက်ပါနှင့်။ သင့်လျော်သော ပြန်လည်စမ်းသပ်မှုကို စောင့်ပါ။
ဤဇယားတွင် ဝက်ဝံများက လွှမ်းမိုးထားသည်။ စလိုက်ကြစို့ $BTW
$1.55 ဝန်းကျင်မှ အကြီးအကျယ် ကျဆင်းသွားပြီးနောက် BTW သည် 15M ဇယားတွင် ပြင်းထန်သော ကျဆင်းအားကို ပြသနေသည်။ လက်ရှိဈေးနှုန်းမှာ $1.2465 ဝန်းကျင်တွင် အရောင်းအဝယ်ဖြစ်နေပြီး 30% နီးပါး ကျဆင်းထားကာ အရောင်းသမားများက 24H အနိမ့်ဆုံးဖြစ်သော $1.2221 သို့ တွန်းပို့နေသည်။
ကုန်သွယ်မှုအစီအစဉ်: အတိုရောင်း
လက်ရှိဈေးနှုန်း: $1.2465
ဝင်ရောက်ရန်ဇုန်: $1.2600–$1.2795
အရှုံးဖြတ်ဈေး: $1.3538
TP1: $1.2221
TP2: $1.2052
* TP3: ကျဆင်းအား ဆက်လက်ရှိနေပါက အမြတ်ကို နောက်လိုက်ကာ ထိန်းသိမ်းပါ။
ဈေးကွက်အလားအလာ: ဈေးကွက်ဖွဲ့စည်းပုံမှာ ပြင်းထန်စွာ ကျဆင်းနေဆဲဖြစ်သည်။ $1.2221 အောက်သို့ အတည်ပြုကျဆင်းပါက နောက်ထပ် ပြင်းထန်သော ရောင်းချမှုလှိုင်းတစ်ခု ဖြစ်ပေါ်နိုင်သည်။ ဈေးနှုန်းလှုပ်ရှားမှုနောက်ကို အလျင်စလို မလိုက်ပါနှင့်။ သင့်လျော်သော ပြန်လည်စမ်းသပ်မှုကို စောင့်ပါ။
ဤဇယားတွင် ဝက်ဝံများက လွှမ်းမိုးထားသည်။ စလိုက်ကြစို့ $BTW
1
1.2k
·
--
ကျရိပ်ရှိသည်
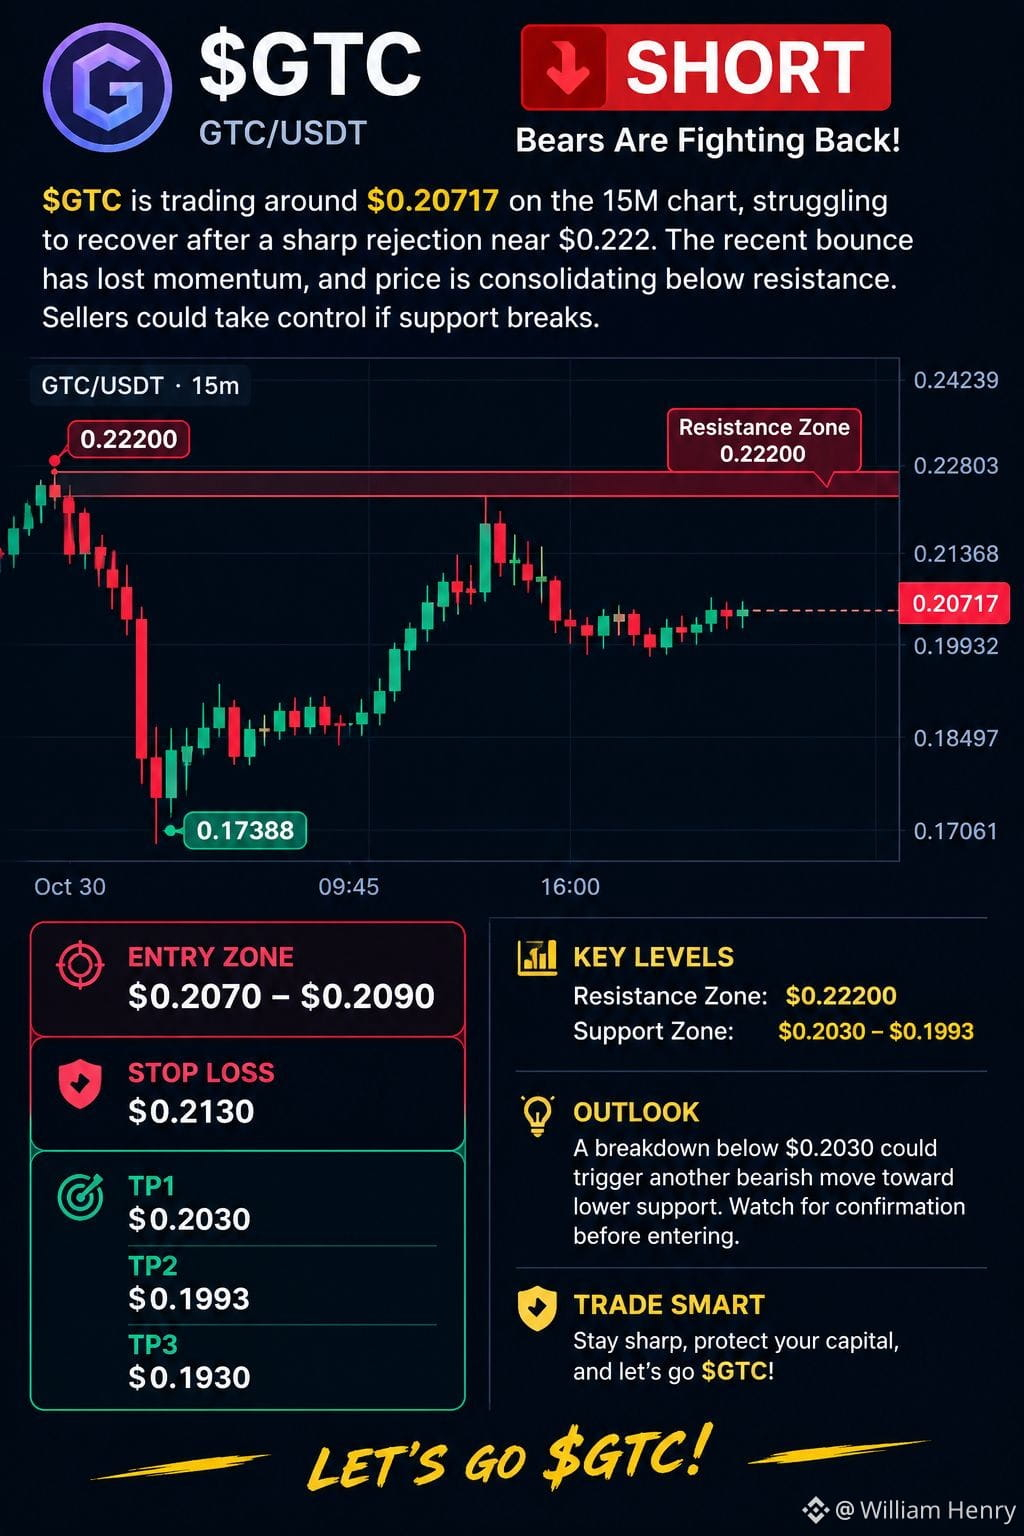
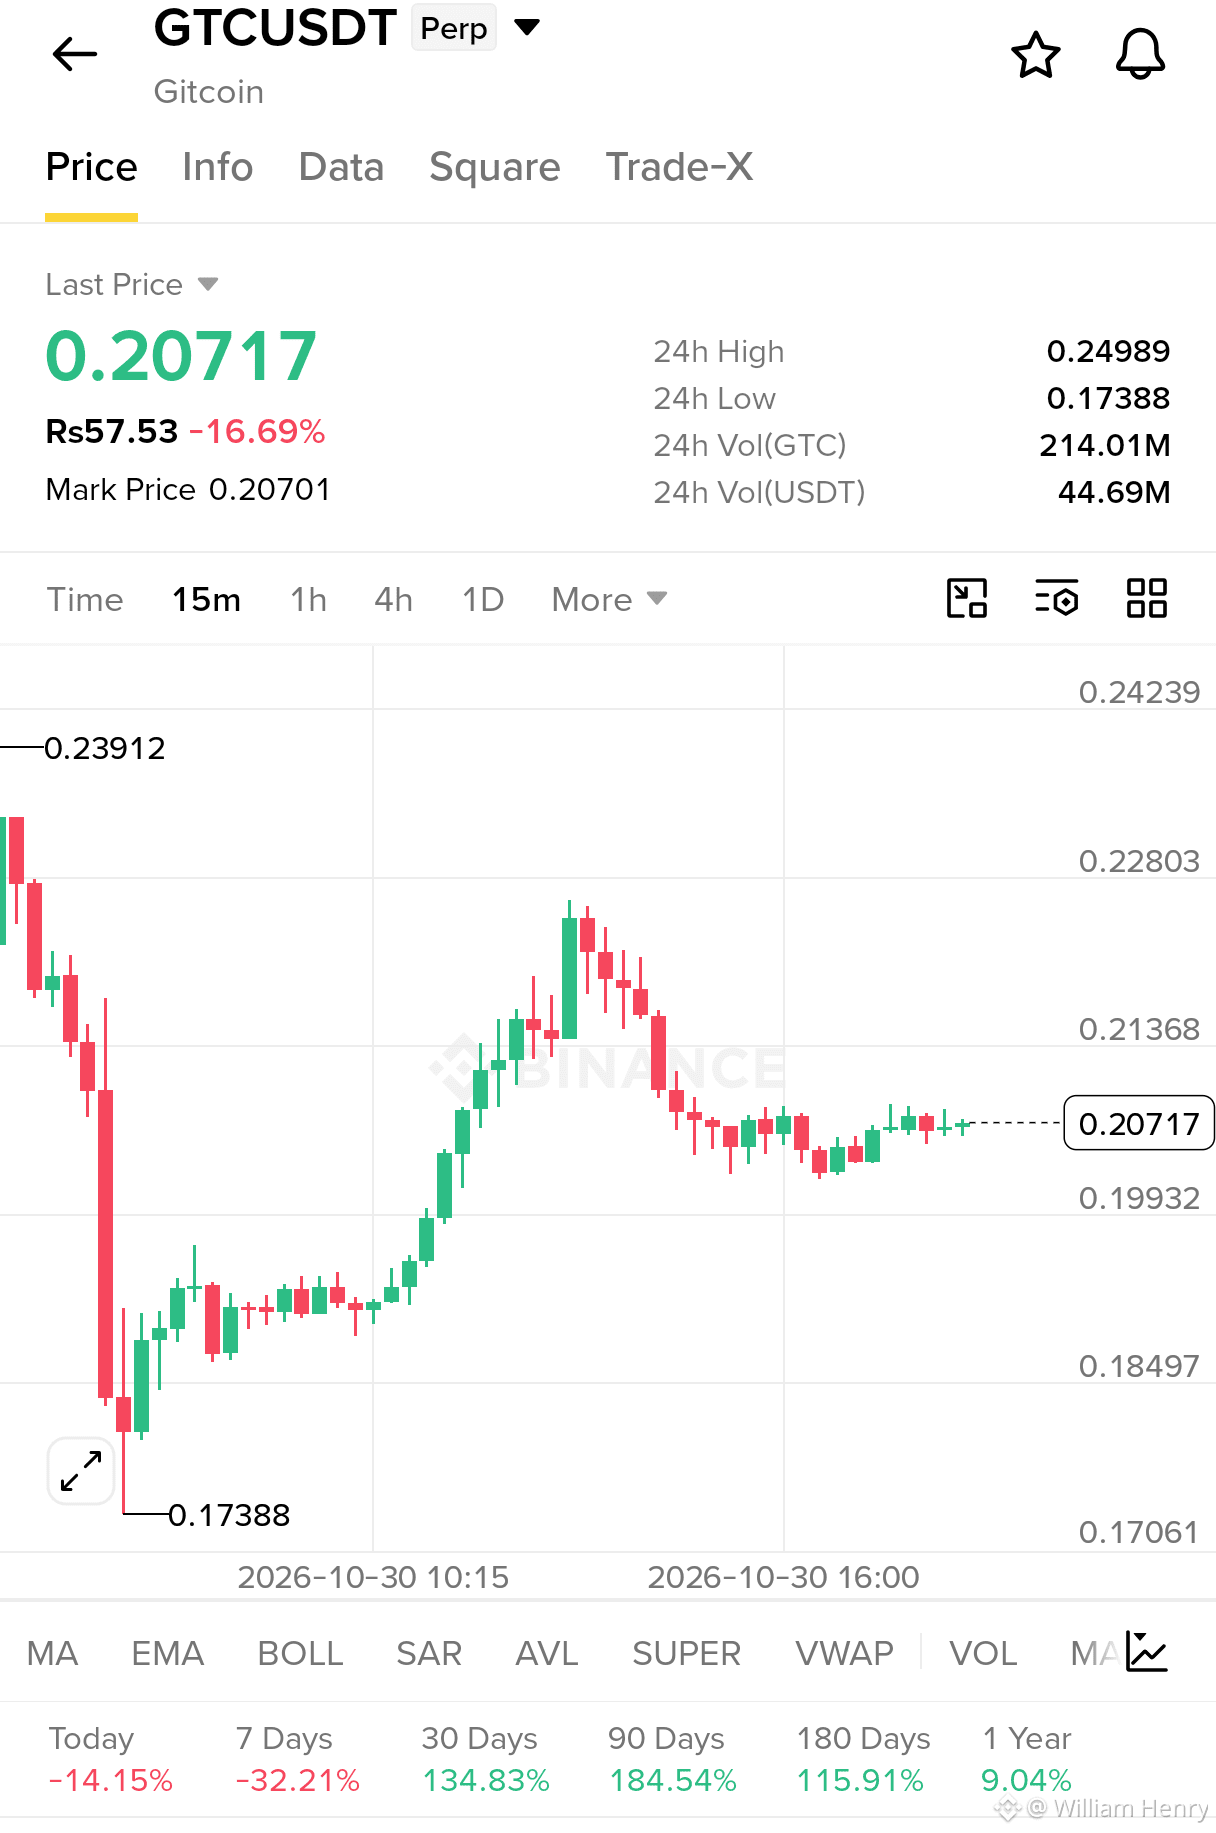
$GTC SHORT — ဝက်ဝံဈေးကွက်ဘက်က ပြန်လည်တိုက်ခိုက်လာပြီ!
15M ဇယားတွင် $GTC သည် $0.20717 ဝန်းကျင်၌ အရောင်းအဝယ်ဖြစ်နေပြီး $0.222 အနီးတွင် ပြင်းထန်စွာ ငြင်းပယ်ခံရပြီးနောက် ပြန်လည်တက်လာရန် ရုန်းကန်နေရသည်။ မကြာသေးမီက ပြန်တက်လာမှုသည် အရှိန်လျော့သွားပြီး ဈေးနှုန်းသည် ခုခံမှုအောက်တွင် စုစည်းနေသည်။ ထောက်ပံ့မှုအဆင့် ကျိုးပေါက်ပါက ရောင်းသူများက ထိန်းချုပ်မှုရယူနိုင်သည်။
ဝင်ရောက်ရန်ဇုန်: $0.2070–$0.2090
အရှုံးဖြတ်မှတ်: $0.2130
TP1: $0.2030
TP2: $0.1993
TP3: $0.1930
$0.2030 အောက်သို့ ကျိုးပေါက်ပါက ပိုနိမ့်သော ထောက်ပံ့မှုအဆင့်ဆီသို့ နောက်ထပ် အကျဘက်လှုပ်ရှားမှုတစ်ခု ဖြစ်ပေါ်လာနိုင်သည်။ မဝင်ရောက်မီ အတည်ပြုချက်ကို စောင့်ကြည့်ပါ။
သတိရှိပါ၊ သင့်ရင်းနှီးငွေကို ကာကွယ်ပါ၊ $GTC ကို ဆက်လုပ်ကြစို့
{future}(GTCUSDT)
$GTC SHORT — ဝက်ဝံဈေးကွက်ဘက်က ပြန်လည်တိုက်ခိုက်လာပြီ!
15M ဇယားတွင် $GTC သည် $0.20717 ဝန်းကျင်၌ အရောင်းအဝယ်ဖြစ်နေပြီး $0.222 အနီးတွင် ပြင်းထန်စွာ ငြင်းပယ်ခံရပြီးနောက် ပြန်လည်တက်လာရန် ရုန်းကန်နေရသည်။ မကြာသေးမီက ပြန်တက်လာမှုသည် အရှိန်လျော့သွားပြီး ဈေးနှုန်းသည် ခုခံမှုအောက်တွင် စုစည်းနေသည်။ ထောက်ပံ့မှုအဆင့် ကျိုးပေါက်ပါက ရောင်းသူများက ထိန်းချုပ်မှုရယူနိုင်သည်။
ဝင်ရောက်ရန်ဇုန်: $0.2070–$0.2090
အရှုံးဖြတ်မှတ်: $0.2130
TP1: $0.2030
TP2: $0.1993
TP3: $0.1930
$0.2030 အောက်သို့ ကျိုးပေါက်ပါက ပိုနိမ့်သော ထောက်ပံ့မှုအဆင့်ဆီသို့ နောက်ထပ် အကျဘက်လှုပ်ရှားမှုတစ်ခု ဖြစ်ပေါ်လာနိုင်သည်။ မဝင်ရောက်မီ အတည်ပြုချက်ကို စောင့်ကြည့်ပါ။
သတိရှိပါ၊ သင့်ရင်းနှီးငွေကို ကာကွယ်ပါ၊ $GTC ကို ဆက်လုပ်ကြစို့
15M ဇယားတွင် $GTC သည် $0.20717 ဝန်းကျင်၌ အရောင်းအဝယ်ဖြစ်နေပြီး $0.222 အနီးတွင် ပြင်းထန်စွာ ငြင်းပယ်ခံရပြီးနောက် ပြန်လည်တက်လာရန် ရုန်းကန်နေရသည်။ မကြာသေးမီက ပြန်တက်လာမှုသည် အရှိန်လျော့သွားပြီး ဈေးနှုန်းသည် ခုခံမှုအောက်တွင် စုစည်းနေသည်။ ထောက်ပံ့မှုအဆင့် ကျိုးပေါက်ပါက ရောင်းသူများက ထိန်းချုပ်မှုရယူနိုင်သည်။
ဝင်ရောက်ရန်ဇုန်: $0.2070–$0.2090
အရှုံးဖြတ်မှတ်: $0.2130
TP1: $0.2030
TP2: $0.1993
TP3: $0.1930
$0.2030 အောက်သို့ ကျိုးပေါက်ပါက ပိုနိမ့်သော ထောက်ပံ့မှုအဆင့်ဆီသို့ နောက်ထပ် အကျဘက်လှုပ်ရှားမှုတစ်ခု ဖြစ်ပေါ်လာနိုင်သည်။ မဝင်ရောက်မီ အတည်ပြုချက်ကို စောင့်ကြည့်ပါ။
သတိရှိပါ၊ သင့်ရင်းနှီးငွေကို ကာကွယ်ပါ၊ $GTC ကို ဆက်လုပ်ကြစို့
1
2
1.6k
·
--
တက်ရိပ်ရှိသည်
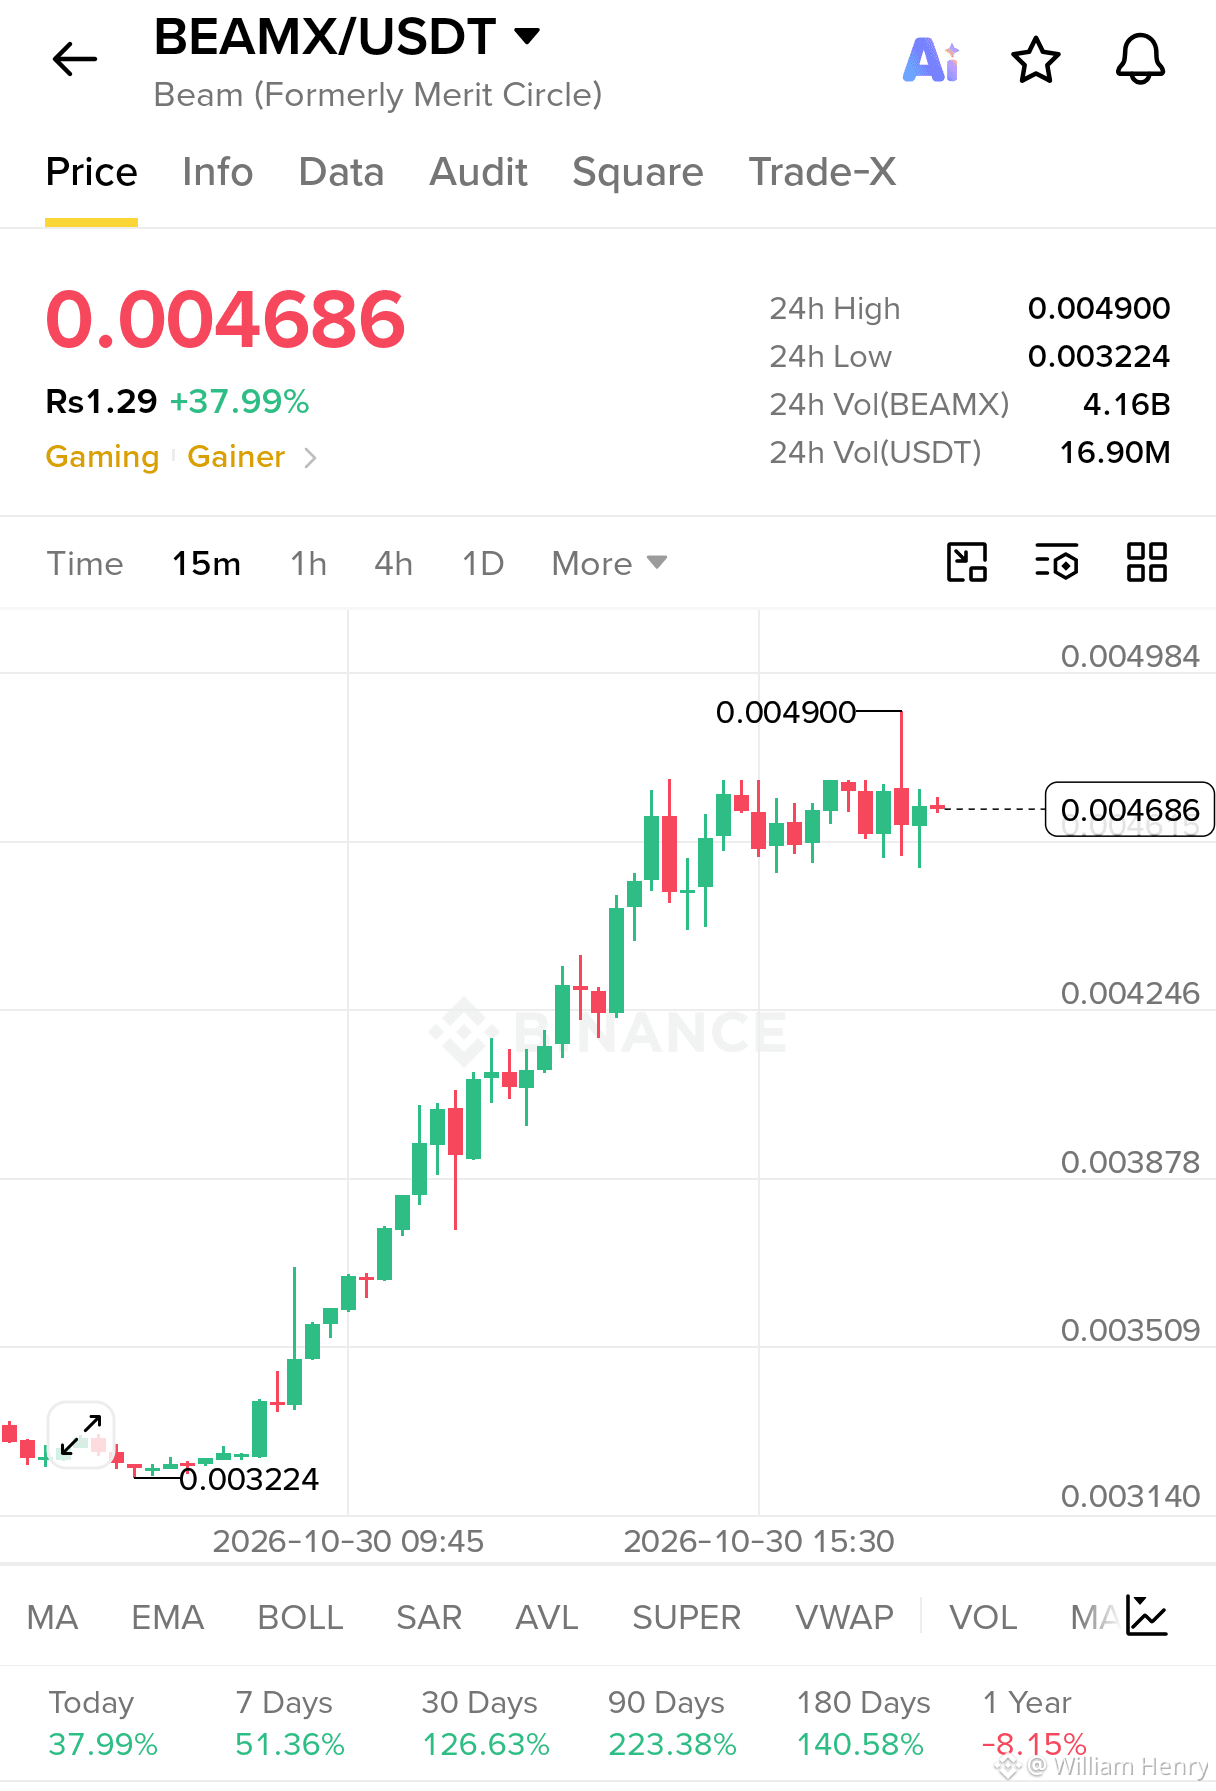
$BEAMX LONG — အတက်ဈေးကွက် အားကောင်းလာပြီ! ရှေ့တွင် အရှိန်အဟုန်ပြင်းထန်လာနိုင်သည်!
$BEAMX သည် လက်ရှိ $0.004686 ဝန်းကျင်တွင် အရောင်းအဝယ်ဖြစ်နေပြီး ယနေ့တစ်ရက်အတွင်း 38% နီးပါး မြင့်တက်လာသည်။ 15M ဇယားတွင် $0.003224 မှ စတင်သည့် အားကောင်းသော အတက်လမ်းကြောင်းကို တွေ့ရပြီး၊ ဈေးနှုန်းသည် $0.004900 ခုခံဈေးအနီးတွင် စုစည်းနေသည်။ ဝယ်သူများ၏ အားကောင်းမှုမှာ ဆက်လက်ထင်ရှားနေသည်။
ဝင်ရောက်ရန် ဈေးနှုန်းဇုန်: $0.00462–$0.00468
အရှုံးဖြတ်ဈေး: $0.00448
TP1: $0.00490
TP2: $0.00510
TP3: $0.00535
$0.004900 အထက်သို့ ရှင်းလင်းစွာ ချိုးတက်နိုင်ပါက နောက်ထပ် အရှိန်အဟုန်ပြင်းသော ဈေးတက်မှုတစ်ခု ဖြစ်ပေါ်လာနိုင်သည်။ မဝင်ရောက်မီ ခုခံဈေးအထက်တွင် အားကောင်းစွာ ပိတ်သိမ်းနိုင်ခြင်းကို စောင့်ကြည့်ပါ။
အတက်ဈေးကွက်က နောက်တစ်ကြိမ် ထပ်မံတက်ရန် အသင့်ဖြစ်နေပြီ! သွားကြစို့ $BEAMX
{future}(BEAMXUSDT)
$BEAMX LONG — အတက်ဈေးကွက် အားကောင်းလာပြီ! ရှေ့တွင် အရှိန်အဟုန်ပြင်းထန်လာနိုင်သည်!
$BEAMX သည် လက်ရှိ $0.004686 ဝန်းကျင်တွင် အရောင်းအဝယ်ဖြစ်နေပြီး ယနေ့တစ်ရက်အတွင်း 38% နီးပါး မြင့်တက်လာသည်။ 15M ဇယားတွင် $0.003224 မှ စတင်သည့် အားကောင်းသော အတက်လမ်းကြောင်းကို တွေ့ရပြီး၊ ဈေးနှုန်းသည် $0.004900 ခုခံဈေးအနီးတွင် စုစည်းနေသည်။ ဝယ်သူများ၏ အားကောင်းမှုမှာ ဆက်လက်ထင်ရှားနေသည်။
ဝင်ရောက်ရန် ဈေးနှုန်းဇုန်: $0.00462–$0.00468
အရှုံးဖြတ်ဈေး: $0.00448
TP1: $0.00490
TP2: $0.00510
TP3: $0.00535
$0.004900 အထက်သို့ ရှင်းလင်းစွာ ချိုးတက်နိုင်ပါက နောက်ထပ် အရှိန်အဟုန်ပြင်းသော ဈေးတက်မှုတစ်ခု ဖြစ်ပေါ်လာနိုင်သည်။ မဝင်ရောက်မီ ခုခံဈေးအထက်တွင် အားကောင်းစွာ ပိတ်သိမ်းနိုင်ခြင်းကို စောင့်ကြည့်ပါ။
အတက်ဈေးကွက်က နောက်တစ်ကြိမ် ထပ်မံတက်ရန် အသင့်ဖြစ်နေပြီ! သွားကြစို့ $BEAMX
$BEAMX သည် လက်ရှိ $0.004686 ဝန်းကျင်တွင် အရောင်းအဝယ်ဖြစ်နေပြီး ယနေ့တစ်ရက်အတွင်း 38% နီးပါး မြင့်တက်လာသည်။ 15M ဇယားတွင် $0.003224 မှ စတင်သည့် အားကောင်းသော အတက်လမ်းကြောင်းကို တွေ့ရပြီး၊ ဈေးနှုန်းသည် $0.004900 ခုခံဈေးအနီးတွင် စုစည်းနေသည်။ ဝယ်သူများ၏ အားကောင်းမှုမှာ ဆက်လက်ထင်ရှားနေသည်။
ဝင်ရောက်ရန် ဈေးနှုန်းဇုန်: $0.00462–$0.00468
အရှုံးဖြတ်ဈေး: $0.00448
TP1: $0.00490
TP2: $0.00510
TP3: $0.00535
$0.004900 အထက်သို့ ရှင်းလင်းစွာ ချိုးတက်နိုင်ပါက နောက်ထပ် အရှိန်အဟုန်ပြင်းသော ဈေးတက်မှုတစ်ခု ဖြစ်ပေါ်လာနိုင်သည်။ မဝင်ရောက်မီ ခုခံဈေးအထက်တွင် အားကောင်းစွာ ပိတ်သိမ်းနိုင်ခြင်းကို စောင့်ကြည့်ပါ။
အတက်ဈေးကွက်က နောက်တစ်ကြိမ် ထပ်မံတက်ရန် အသင့်ဖြစ်နေပြီ! သွားကြစို့ $BEAMX
1
949
·
--
ကျရိပ်ရှိသည်
ဘာသာပြန်ဆိုချက် ကြည့်မည်
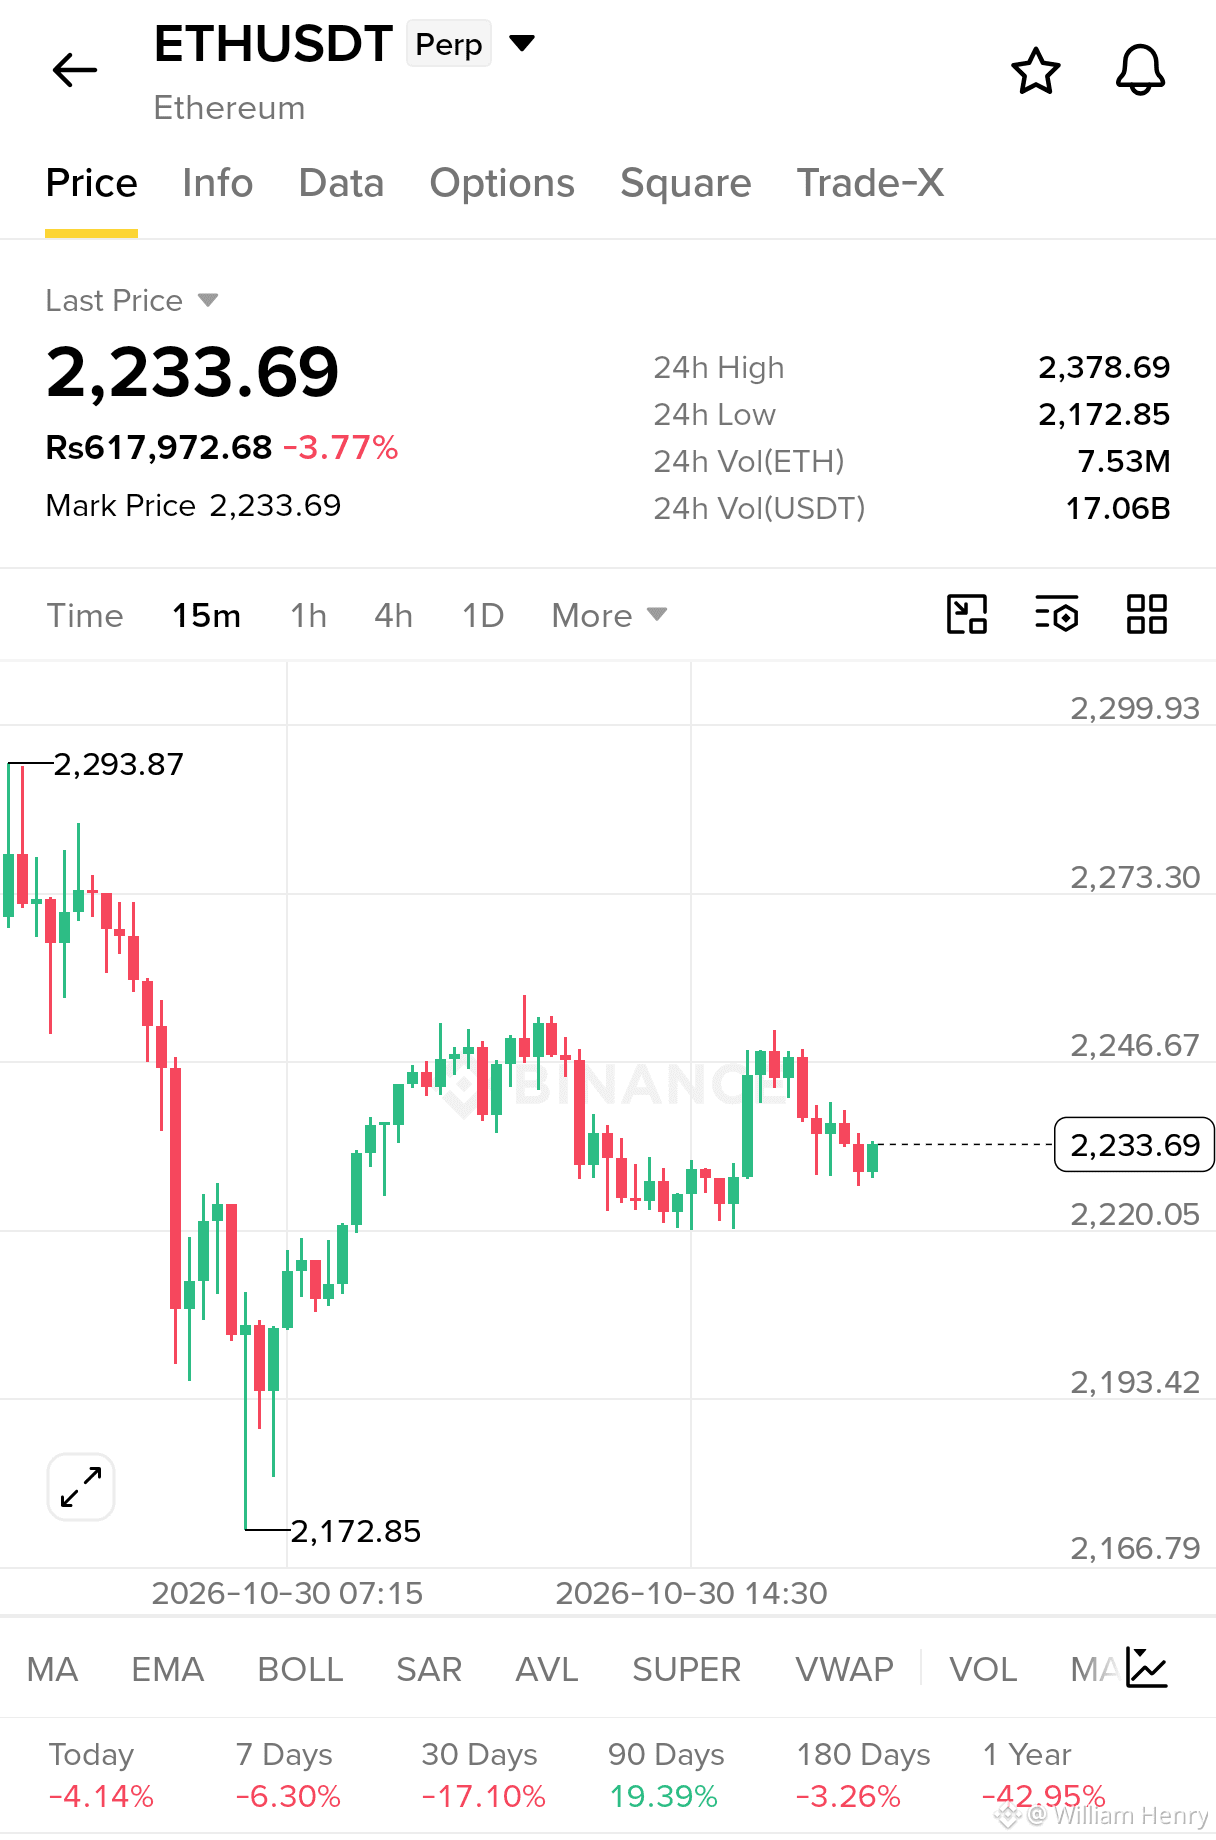
$ETH SHORT — Sellers Are Taking Control!
ETH is trading near $2,233.69 on the 15M chart, showing weakness after rejection from the $2,246 resistance zone. Bears are defending higher levels, while price struggles to regain bullish momentum.
Entry Zone: $2,233–$2,240
Stop Loss: $2,252
TP1: $2,220
TP2: $2,193
TP3: $2,173
A breakdown below $2,220 could accelerate selling pressure toward lower support levels. Watch for rejection before entering.
Stay disciplined and manage your risk. Let's go $ETH
{future}(ETHUSDT)
$ETH SHORT — Sellers Are Taking Control!
ETH is trading near $2,233.69 on the 15M chart, showing weakness after rejection from the $2,246 resistance zone. Bears are defending higher levels, while price struggles to regain bullish momentum.
Entry Zone: $2,233–$2,240
Stop Loss: $2,252
TP1: $2,220
TP2: $2,193
TP3: $2,173
A breakdown below $2,220 could accelerate selling pressure toward lower support levels. Watch for rejection before entering.
Stay disciplined and manage your risk. Let's go $ETH
ETH is trading near $2,233.69 on the 15M chart, showing weakness after rejection from the $2,246 resistance zone. Bears are defending higher levels, while price struggles to regain bullish momentum.
Entry Zone: $2,233–$2,240
Stop Loss: $2,252
TP1: $2,220
TP2: $2,193
TP3: $2,173
A breakdown below $2,220 could accelerate selling pressure toward lower support levels. Watch for rejection before entering.
Stay disciplined and manage your risk. Let's go $ETH
2
690
·
--
ကျရိပ်ရှိသည်
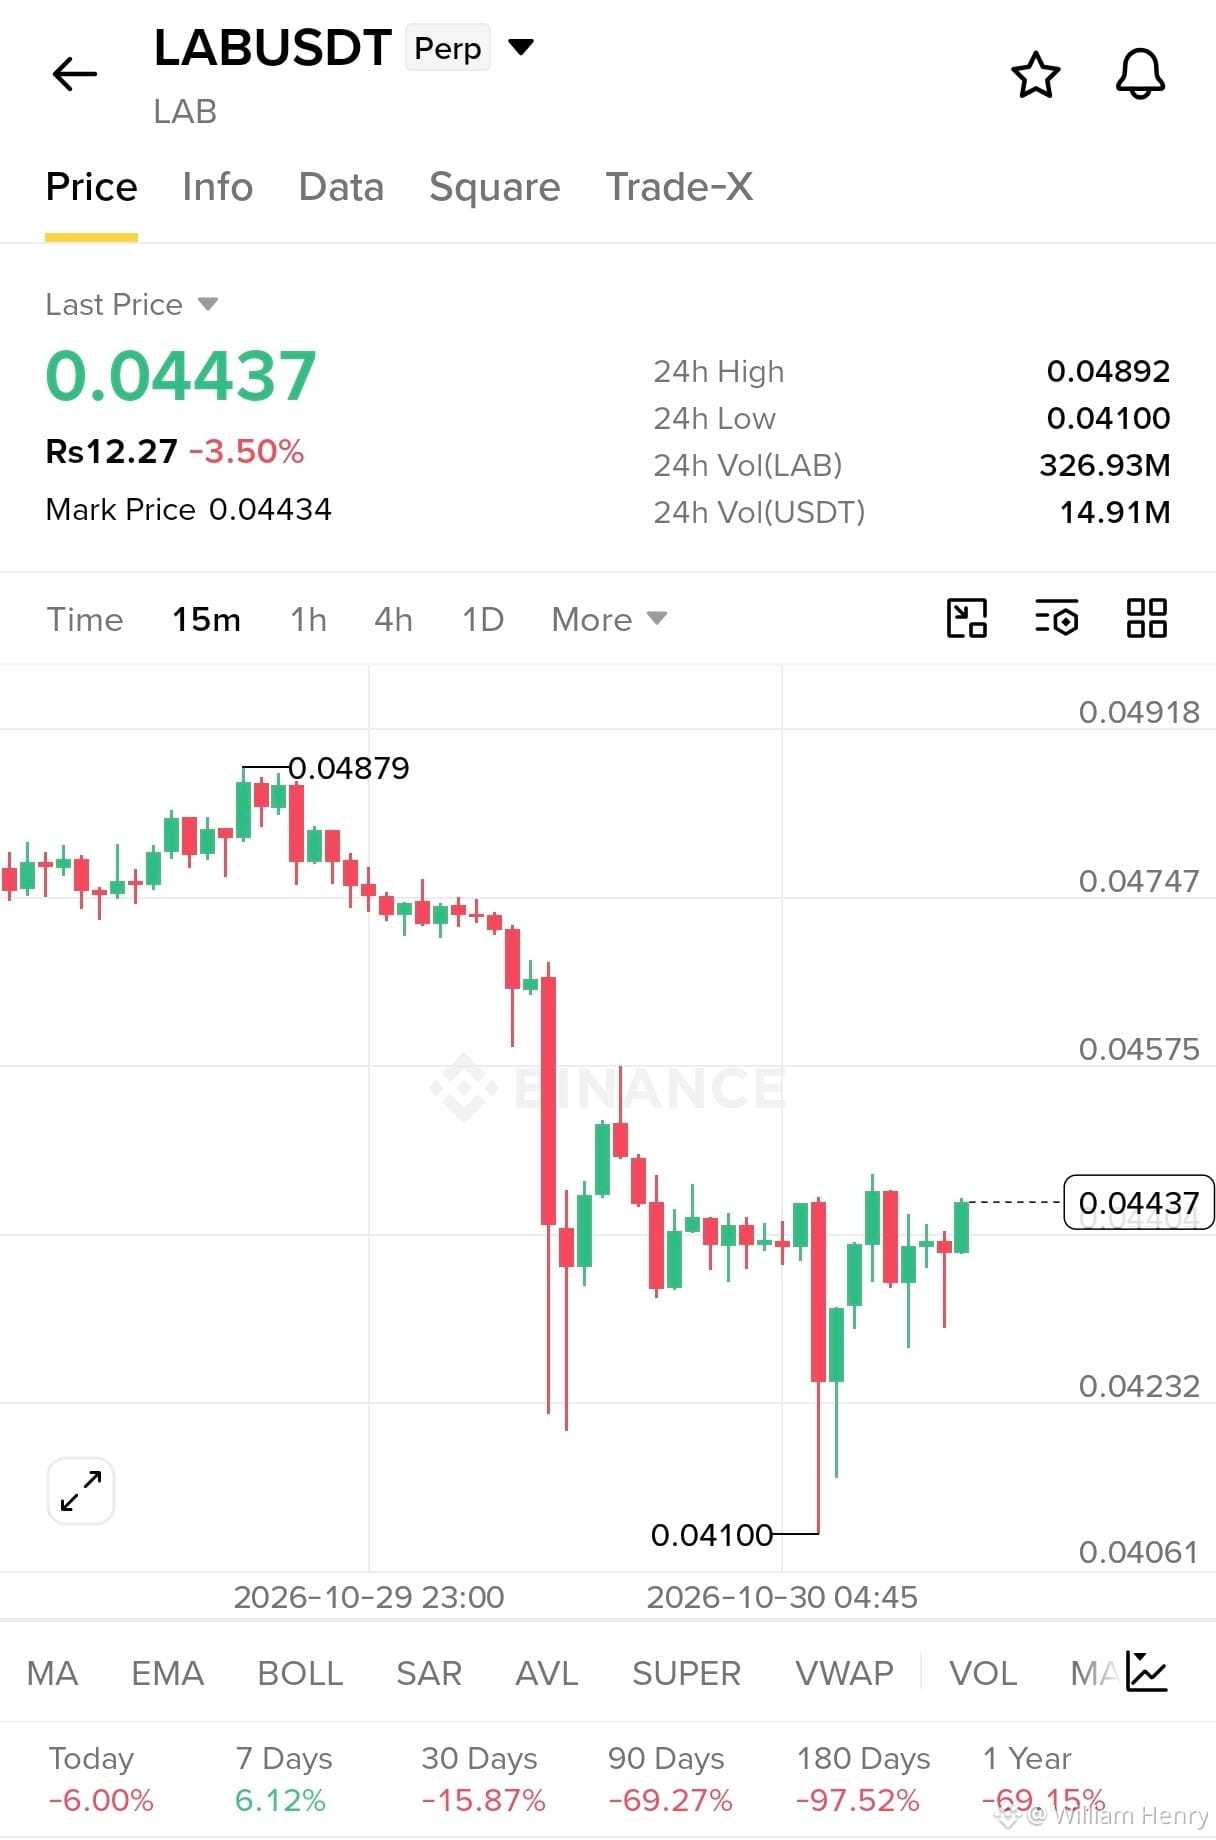
$LAB အရောင်းအချက်ပြ
လက်ရှိဈေးနှုန်း: 0.04437
ဦးတည်ချက်: အရောင်း
ဝင်ရောက်မည့်ဈေးနှုန်းအပိုင်းအခြား: 0.04430 – 0.04470
အမြတ်ယူဈေး 1: 0.04380
အမြတ်ယူဈေး 2: 0.04320
အမြတ်ယူဈေး 3: 0.04180
အရှုံးဖြတ်ဈေး: 0.04520
ခုခံဈေး: 0.04480
ထောက်ပံ့ဈေး: 0.04320
ဈေးကွက်သုံးသပ်ချက်:
0.04879 အမြင့်ဆုံးဈေးမှ အရှိန်ပြင်းစွာ ကျဆင်းပြီးနောက် LAB သည် အကျဘက်အရှိန်ကို ပြသနေသည်။ လက်ရှိပြန်လည်တက်လာမှုသည် လမ်းကြောင်းပြောင်းပြီဟု အတည်ပြုနိုင်သည့်အခြေအနေထက် ဈေးနှုန်းစုစည်းမှုဖြစ်နိုင်ခြေ ပိုများသည်။ ဈေးနှုန်းသည် 0.04480 အထက်သို့ မကျော်နိုင်ပါက ရောင်းသူများက ထိန်းချုပ်မှုကို ပြန်လည်ရရှိနိုင်သည်။
အရောင်းအဝယ်အတည်ပြုချက်:
အရောင်းအဝယ်ဝင်ရောက်ခြင်းမပြုမီ 0.04430–0.04470 ဝန်းကျင်တွင် ဈေးနှုန်းပြန်လည်ကျဆင်းမှုကို စောင့်ပါ။ ခုခံဈေးအထက်သို့ အားကောင်းစွာ ဖောက်ထွက်ပါက ဤအစီအစဉ်သည် ပျက်ပြယ်မည်။
{future}(LABUSDT)
$LAB အရောင်းအချက်ပြ
လက်ရှိဈေးနှုန်း: 0.04437
ဦးတည်ချက်: အရောင်း
ဝင်ရောက်မည့်ဈေးနှုန်းအပိုင်းအခြား: 0.04430 – 0.04470
အမြတ်ယူဈေး 1: 0.04380
အမြတ်ယူဈေး 2: 0.04320
အမြတ်ယူဈေး 3: 0.04180
အရှုံးဖြတ်ဈေး: 0.04520
ခုခံဈေး: 0.04480
ထောက်ပံ့ဈေး: 0.04320
ဈေးကွက်သုံးသပ်ချက်:
0.04879 အမြင့်ဆုံးဈေးမှ အရှိန်ပြင်းစွာ ကျဆင်းပြီးနောက် LAB သည် အကျဘက်အရှိန်ကို ပြသနေသည်။ လက်ရှိပြန်လည်တက်လာမှုသည် လမ်းကြောင်းပြောင်းပြီဟု အတည်ပြုနိုင်သည့်အခြေအနေထက် ဈေးနှုန်းစုစည်းမှုဖြစ်နိုင်ခြေ ပိုများသည်။ ဈေးနှုန်းသည် 0.04480 အထက်သို့ မကျော်နိုင်ပါက ရောင်းသူများက ထိန်းချုပ်မှုကို ပြန်လည်ရရှိနိုင်သည်။
အရောင်းအဝယ်အတည်ပြုချက်:
အရောင်းအဝယ်ဝင်ရောက်ခြင်းမပြုမီ 0.04430–0.04470 ဝန်းကျင်တွင် ဈေးနှုန်းပြန်လည်ကျဆင်းမှုကို စောင့်ပါ။ ခုခံဈေးအထက်သို့ အားကောင်းစွာ ဖောက်ထွက်ပါက ဤအစီအစဉ်သည် ပျက်ပြယ်မည်။
လက်ရှိဈေးနှုန်း: 0.04437
ဦးတည်ချက်: အရောင်း
ဝင်ရောက်မည့်ဈေးနှုန်းအပိုင်းအခြား: 0.04430 – 0.04470
အမြတ်ယူဈေး 1: 0.04380
အမြတ်ယူဈေး 2: 0.04320
အမြတ်ယူဈေး 3: 0.04180
အရှုံးဖြတ်ဈေး: 0.04520
ခုခံဈေး: 0.04480
ထောက်ပံ့ဈေး: 0.04320
ဈေးကွက်သုံးသပ်ချက်:
0.04879 အမြင့်ဆုံးဈေးမှ အရှိန်ပြင်းစွာ ကျဆင်းပြီးနောက် LAB သည် အကျဘက်အရှိန်ကို ပြသနေသည်။ လက်ရှိပြန်လည်တက်လာမှုသည် လမ်းကြောင်းပြောင်းပြီဟု အတည်ပြုနိုင်သည့်အခြေအနေထက် ဈေးနှုန်းစုစည်းမှုဖြစ်နိုင်ခြေ ပိုများသည်။ ဈေးနှုန်းသည် 0.04480 အထက်သို့ မကျော်နိုင်ပါက ရောင်းသူများက ထိန်းချုပ်မှုကို ပြန်လည်ရရှိနိုင်သည်။
အရောင်းအဝယ်အတည်ပြုချက်:
အရောင်းအဝယ်ဝင်ရောက်ခြင်းမပြုမီ 0.04430–0.04470 ဝန်းကျင်တွင် ဈေးနှုန်းပြန်လည်ကျဆင်းမှုကို စောင့်ပါ။ ခုခံဈေးအထက်သို့ အားကောင်းစွာ ဖောက်ထွက်ပါက ဤအစီအစဉ်သည် ပျက်ပြယ်မည်။
1
1.3k
·
--
တက်ရိပ်ရှိသည်
ဘာသာပြန်ဆိုချက် ကြည့်မည်
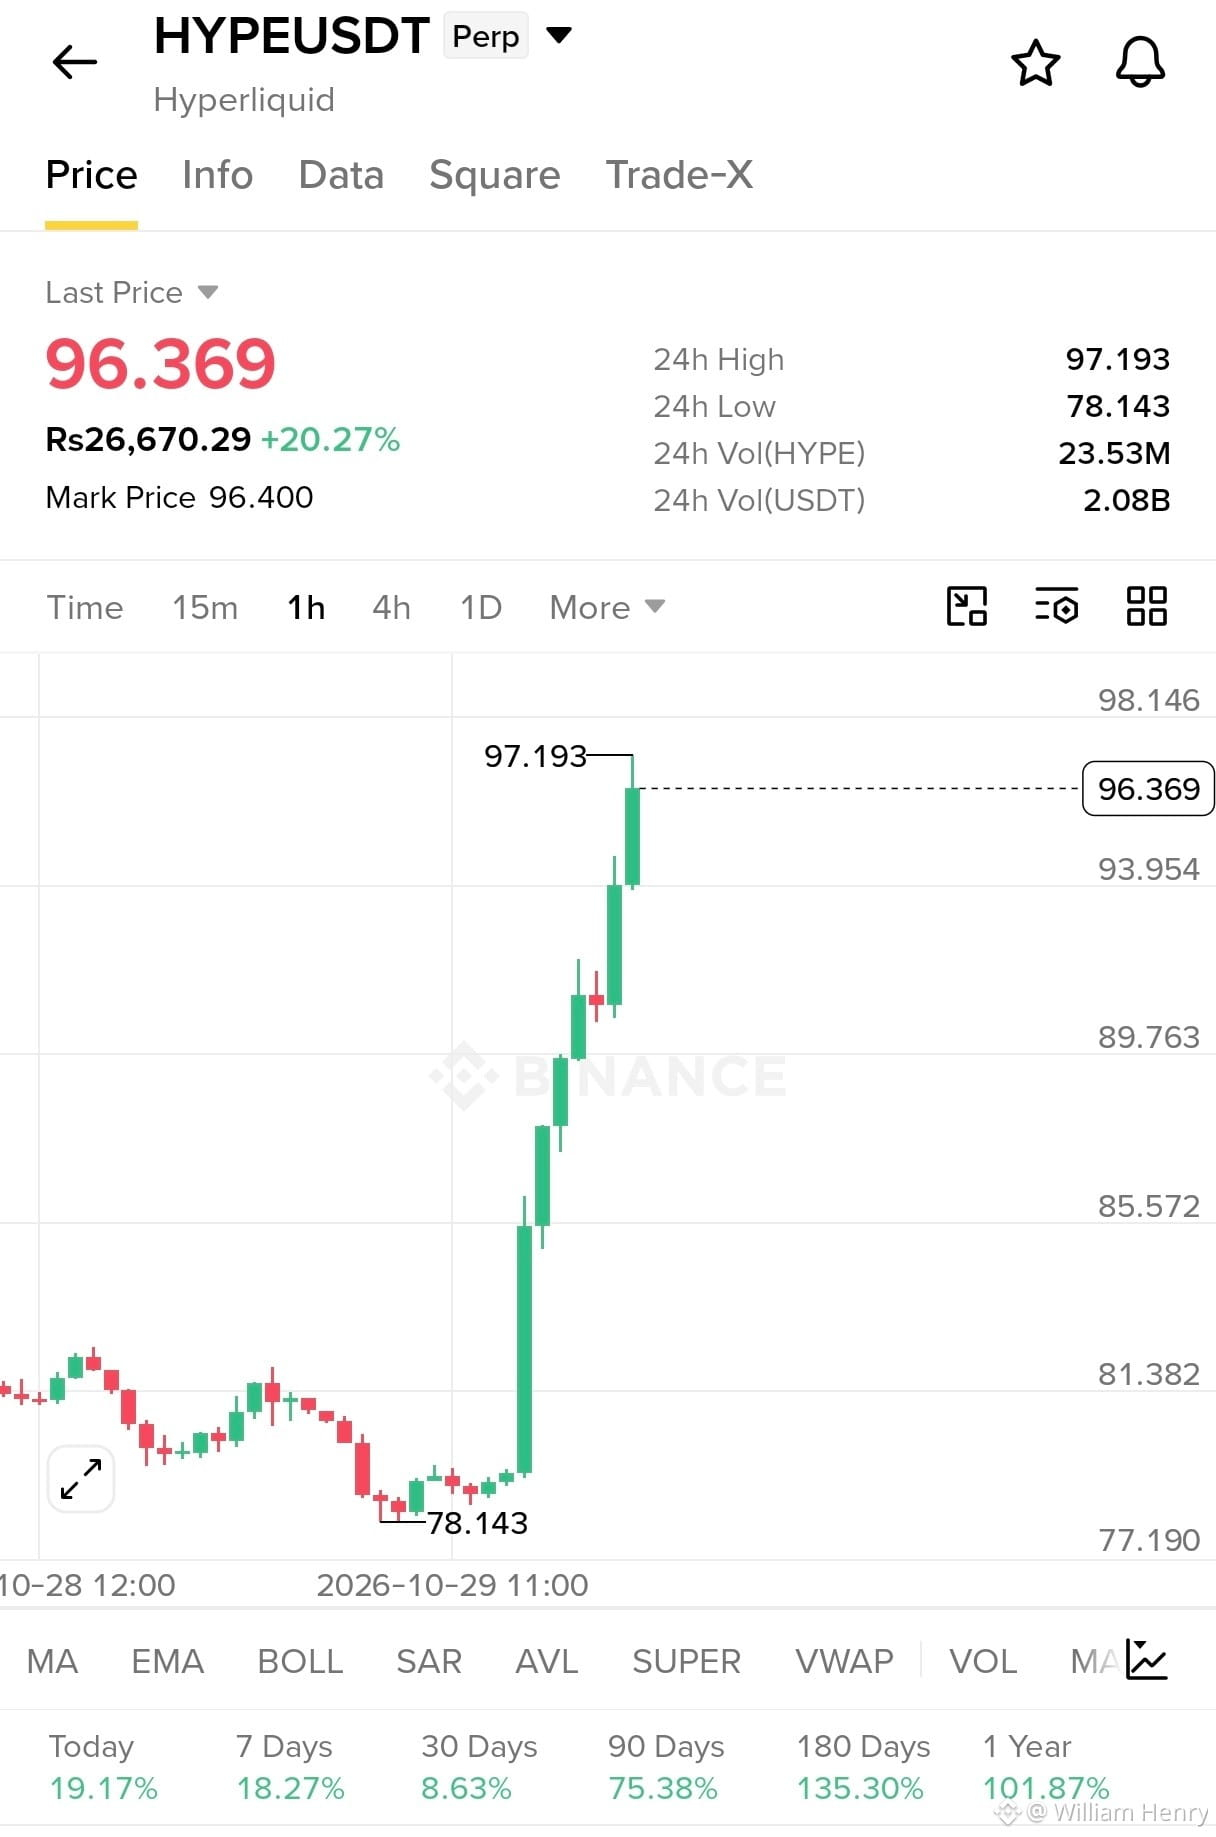
$HYPE USDT — STRONG BULLISH SETUP
HYPE is showing strong upward momentum, trading at $96.369, up 20.27% in 24 hours. Price is approaching resistance at $97.193, so confirmation is important before entering.
Direction: LONG
Entry: $94.500 – $96.000
TP1: $97.200
TP2: $98.500
TP3: $100.000
SL: $92.800
Current Price: $96.369
Resistance: $97.193
Support: $93.954
Wait for breakout confirmation before entry. If resistance holds, a pullback is possible. Use proper risk management and avoid excessive leverage.
HYPEUSDT — TRADE WITH DISCIPLINE
{future}(HYPEUSDT)
$HYPE USDT — STRONG BULLISH SETUP
HYPE is showing strong upward momentum, trading at $96.369, up 20.27% in 24 hours. Price is approaching resistance at $97.193, so confirmation is important before entering.
Direction: LONG
Entry: $94.500 – $96.000
TP1: $97.200
TP2: $98.500
TP3: $100.000
SL: $92.800
Current Price: $96.369
Resistance: $97.193
Support: $93.954
Wait for breakout confirmation before entry. If resistance holds, a pullback is possible. Use proper risk management and avoid excessive leverage.
HYPEUSDT — TRADE WITH DISCIPLINE
HYPE is showing strong upward momentum, trading at $96.369, up 20.27% in 24 hours. Price is approaching resistance at $97.193, so confirmation is important before entering.
Direction: LONG
Entry: $94.500 – $96.000
TP1: $97.200
TP2: $98.500
TP3: $100.000
SL: $92.800
Current Price: $96.369
Resistance: $97.193
Support: $93.954
Wait for breakout confirmation before entry. If resistance holds, a pullback is possible. Use proper risk management and avoid excessive leverage.
HYPEUSDT — TRADE WITH DISCIPLINE
472
·
--
တက်ရိပ်ရှိသည်
ဘာသာပြန်ဆိုချက် ကြည့်မည်
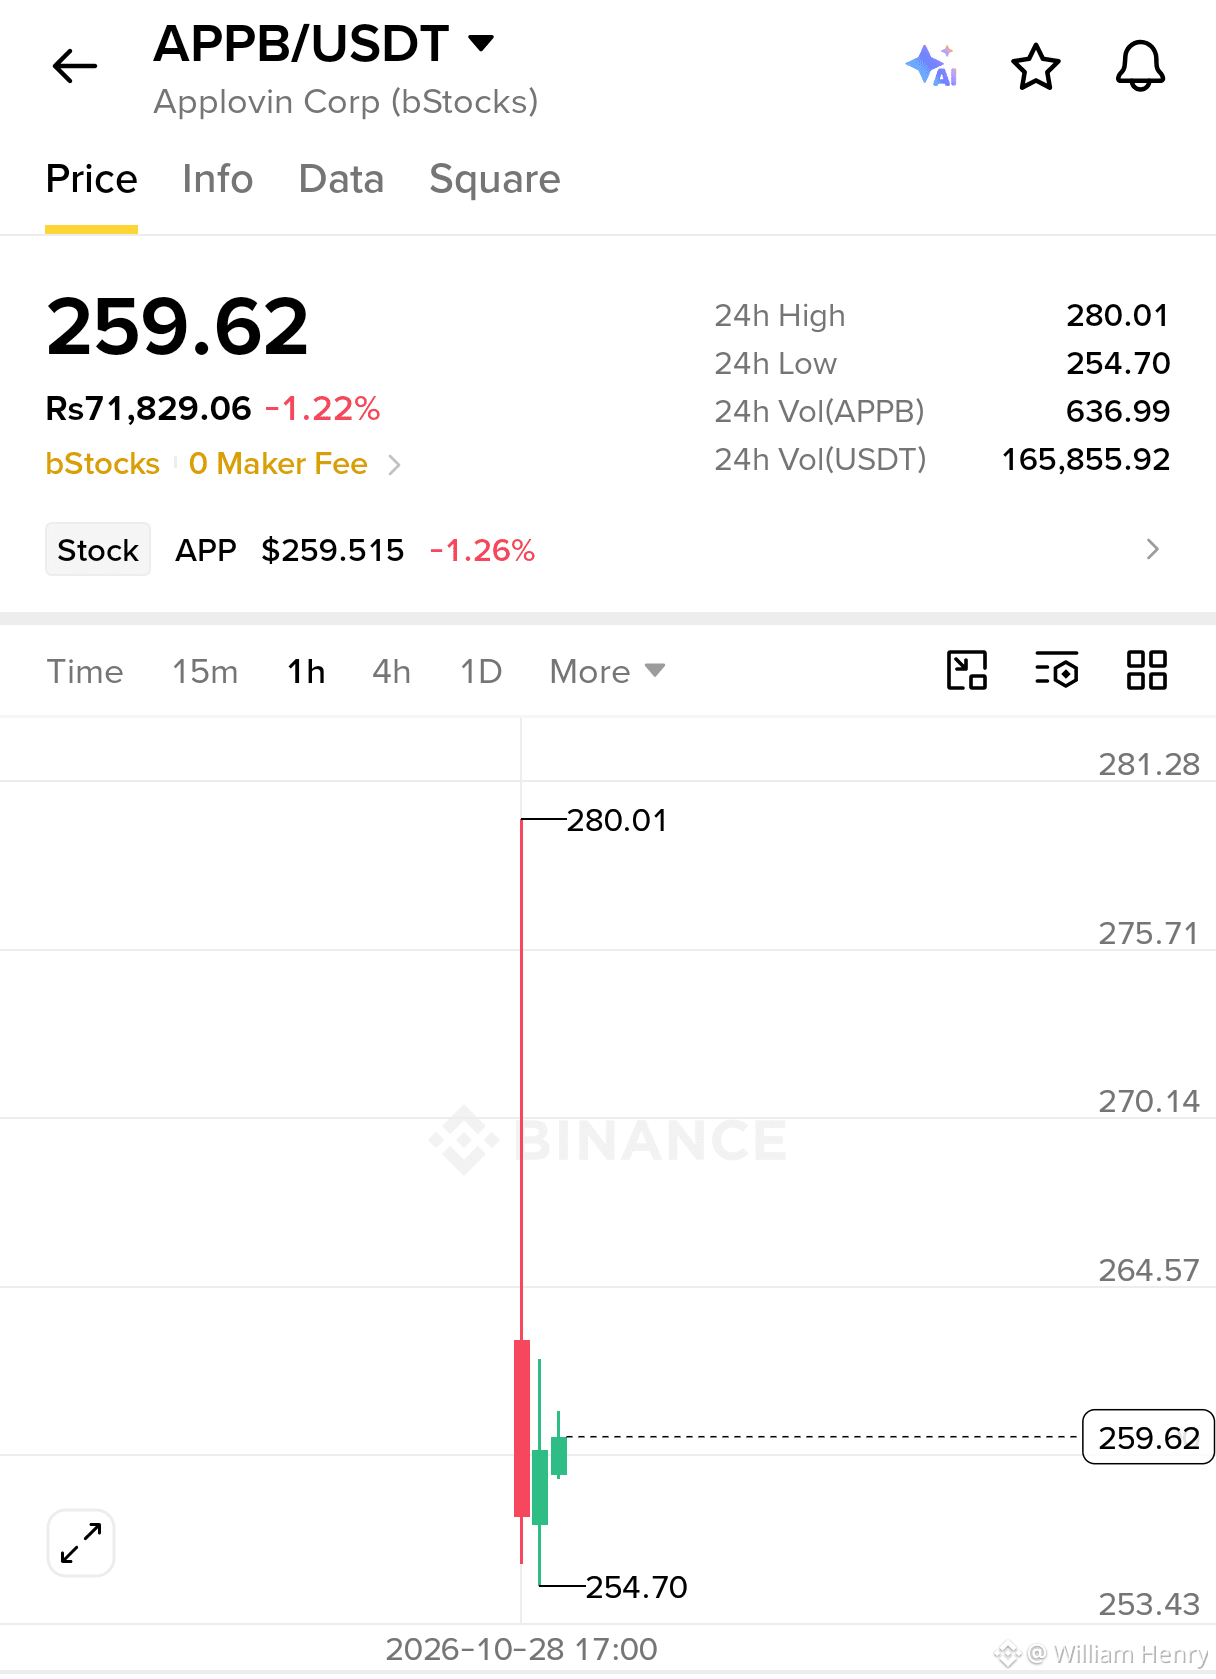
$APPB I'm watching this 1H setup closely. Price is sitting at $259.62 after bouncing from $254.70, showing buyers are trying to recover after a sharp rejection from $280.01.
Trade Setup
Entry: $259.50–$260.00
Stop Loss: $254.00
Targets:
Target 1: $264.57
Target 2: $270.14
Target 3: $275.71
Target 4: $280.01
Why it's possible
I'm watching the $254.70 support because buyers stepped in after the sell-off. Two green candles suggest a short-term recovery, but bulls still need to prove their strength.
A breakout above $264.57 could attract momentum buyers and push price toward $270.14. Reclaiming higher resistance levels could open a retest of $280.01, where sellers previously took control.
The 24-hour volume stands at 636.99 APPB, with price down 1.22%. I'd like to see stronger buying volume confirm the recovery. If $254.70 breaks, the bullish setup weakens, so I'm keeping risk management in focus.
Let's wait for confirmation and trade the setup, not the hype.
$APPB I'm watching this 1H setup closely. Price is sitting at $259.62 after bouncing from $254.70, showing buyers are trying to recover after a sharp rejection from $280.01.
Trade Setup
Entry: $259.50–$260.00
Stop Loss: $254.00
Targets:
Target 1: $264.57
Target 2: $270.14
Target 3: $275.71
Target 4: $280.01
Why it's possible
I'm watching the $254.70 support because buyers stepped in after the sell-off. Two green candles suggest a short-term recovery, but bulls still need to prove their strength.
A breakout above $264.57 could attract momentum buyers and push price toward $270.14. Reclaiming higher resistance levels could open a retest of $280.01, where sellers previously took control.
The 24-hour volume stands at 636.99 APPB, with price down 1.22%. I'd like to see stronger buying volume confirm the recovery. If $254.70 breaks, the bullish setup weakens, so I'm keeping risk management in focus.
Let's wait for confirmation and trade the setup, not the hype.
Trade Setup
Entry: $259.50–$260.00
Stop Loss: $254.00
Targets:
Target 1: $264.57
Target 2: $270.14
Target 3: $275.71
Target 4: $280.01
Why it's possible
I'm watching the $254.70 support because buyers stepped in after the sell-off. Two green candles suggest a short-term recovery, but bulls still need to prove their strength.
A breakout above $264.57 could attract momentum buyers and push price toward $270.14. Reclaiming higher resistance levels could open a retest of $280.01, where sellers previously took control.
The 24-hour volume stands at 636.99 APPB, with price down 1.22%. I'd like to see stronger buying volume confirm the recovery. If $254.70 breaks, the bullish setup weakens, so I'm keeping risk management in focus.
Let's wait for confirmation and trade the setup, not the hype.
1
2
323
🚨🇺🇸 ဒေါ်လာရဲ့ နောက်ထပ် အင်အားပြသမှုက ကရစ်ပတိုကနေ လာနိုင်ပါတယ်! 🔥
အမေရိကန် ဘဏ္ဍာရေးဝန်ကြီး Scott Bessent က ကရစ်ပတိုနဲ့ တည်ငြိမ်ဒင်္ဂါးတွေဟာ ကမ္ဘာ့ငွေကြေးအဖြစ် ဒေါ်လာရဲ့ လွှမ်းမိုးမှုကို ပိုမိုခိုင်မာစေနိုင်တယ်လို့ ပြောပါတယ်။
💵 တည်ငြိမ်ဒင်္ဂါးတွေရဲ့ 90% ကျော်ဟာ အမေရိကန်ဒေါ်လာနဲ့ ကျောထောက်နောက်ခံပြုထားတာကြောင့် အမေရိကန်အစိုးရငွေချေးစာချုပ်တွေအပေါ် ဝယ်လိုအား ပိုတိုးလာနိုင်ပါတယ်။
🌍 ကရစ်ပတိုဟာ ဘဏ္ဍာရေးလောကကို ပြောင်းလဲနေတာတင်မကဘဲ — ဒေါ်လာရဲ့ လွှမ်းမိုးမှုအနာဂတ်ကိုပါ ပြန်လည်ပုံဖော်နိုင်ပါတယ်! 🚀
$TRUMP
{future}(TRUMPUSDT)
🚨🇺🇸 ဒေါ်လာရဲ့ နောက်ထပ် အင်အားပြသမှုက ကရစ်ပတိုကနေ လာနိုင်ပါတယ်! 🔥
အမေရိကန် ဘဏ္ဍာရေးဝန်ကြီး Scott Bessent က ကရစ်ပတိုနဲ့ တည်ငြိမ်ဒင်္ဂါးတွေဟာ ကမ္ဘာ့ငွေကြေးအဖြစ် ဒေါ်လာရဲ့ လွှမ်းမိုးမှုကို ပိုမိုခိုင်မာစေနိုင်တယ်လို့ ပြောပါတယ်။
💵 တည်ငြိမ်ဒင်္ဂါးတွေရဲ့ 90% ကျော်ဟာ အမေရိကန်ဒေါ်လာနဲ့ ကျောထောက်နောက်ခံပြုထားတာကြောင့် အမေရိကန်အစိုးရငွေချေးစာချုပ်တွေအပေါ် ဝယ်လိုအား ပိုတိုးလာနိုင်ပါတယ်။
🌍 ကရစ်ပတိုဟာ ဘဏ္ဍာရေးလောကကို ပြောင်းလဲနေတာတင်မကဘဲ — ဒေါ်လာရဲ့ လွှမ်းမိုးမှုအနာဂတ်ကိုပါ ပြန်လည်ပုံဖော်နိုင်ပါတယ်! 🚀
$TRUMP
အမေရိကန် ဘဏ္ဍာရေးဝန်ကြီး Scott Bessent က ကရစ်ပတိုနဲ့ တည်ငြိမ်ဒင်္ဂါးတွေဟာ ကမ္ဘာ့ငွေကြေးအဖြစ် ဒေါ်လာရဲ့ လွှမ်းမိုးမှုကို ပိုမိုခိုင်မာစေနိုင်တယ်လို့ ပြောပါတယ်။
💵 တည်ငြိမ်ဒင်္ဂါးတွေရဲ့ 90% ကျော်ဟာ အမေရိကန်ဒေါ်လာနဲ့ ကျောထောက်နောက်ခံပြုထားတာကြောင့် အမေရိကန်အစိုးရငွေချေးစာချုပ်တွေအပေါ် ဝယ်လိုအား ပိုတိုးလာနိုင်ပါတယ်။
🌍 ကရစ်ပတိုဟာ ဘဏ္ဍာရေးလောကကို ပြောင်းလဲနေတာတင်မကဘဲ — ဒေါ်လာရဲ့ လွှမ်းမိုးမှုအနာဂတ်ကိုပါ ပြန်လည်ပုံဖော်နိုင်ပါတယ်! 🚀
$TRUMP

230
ဘာသာပြန်ဆိုချက် ကြည့်မည်
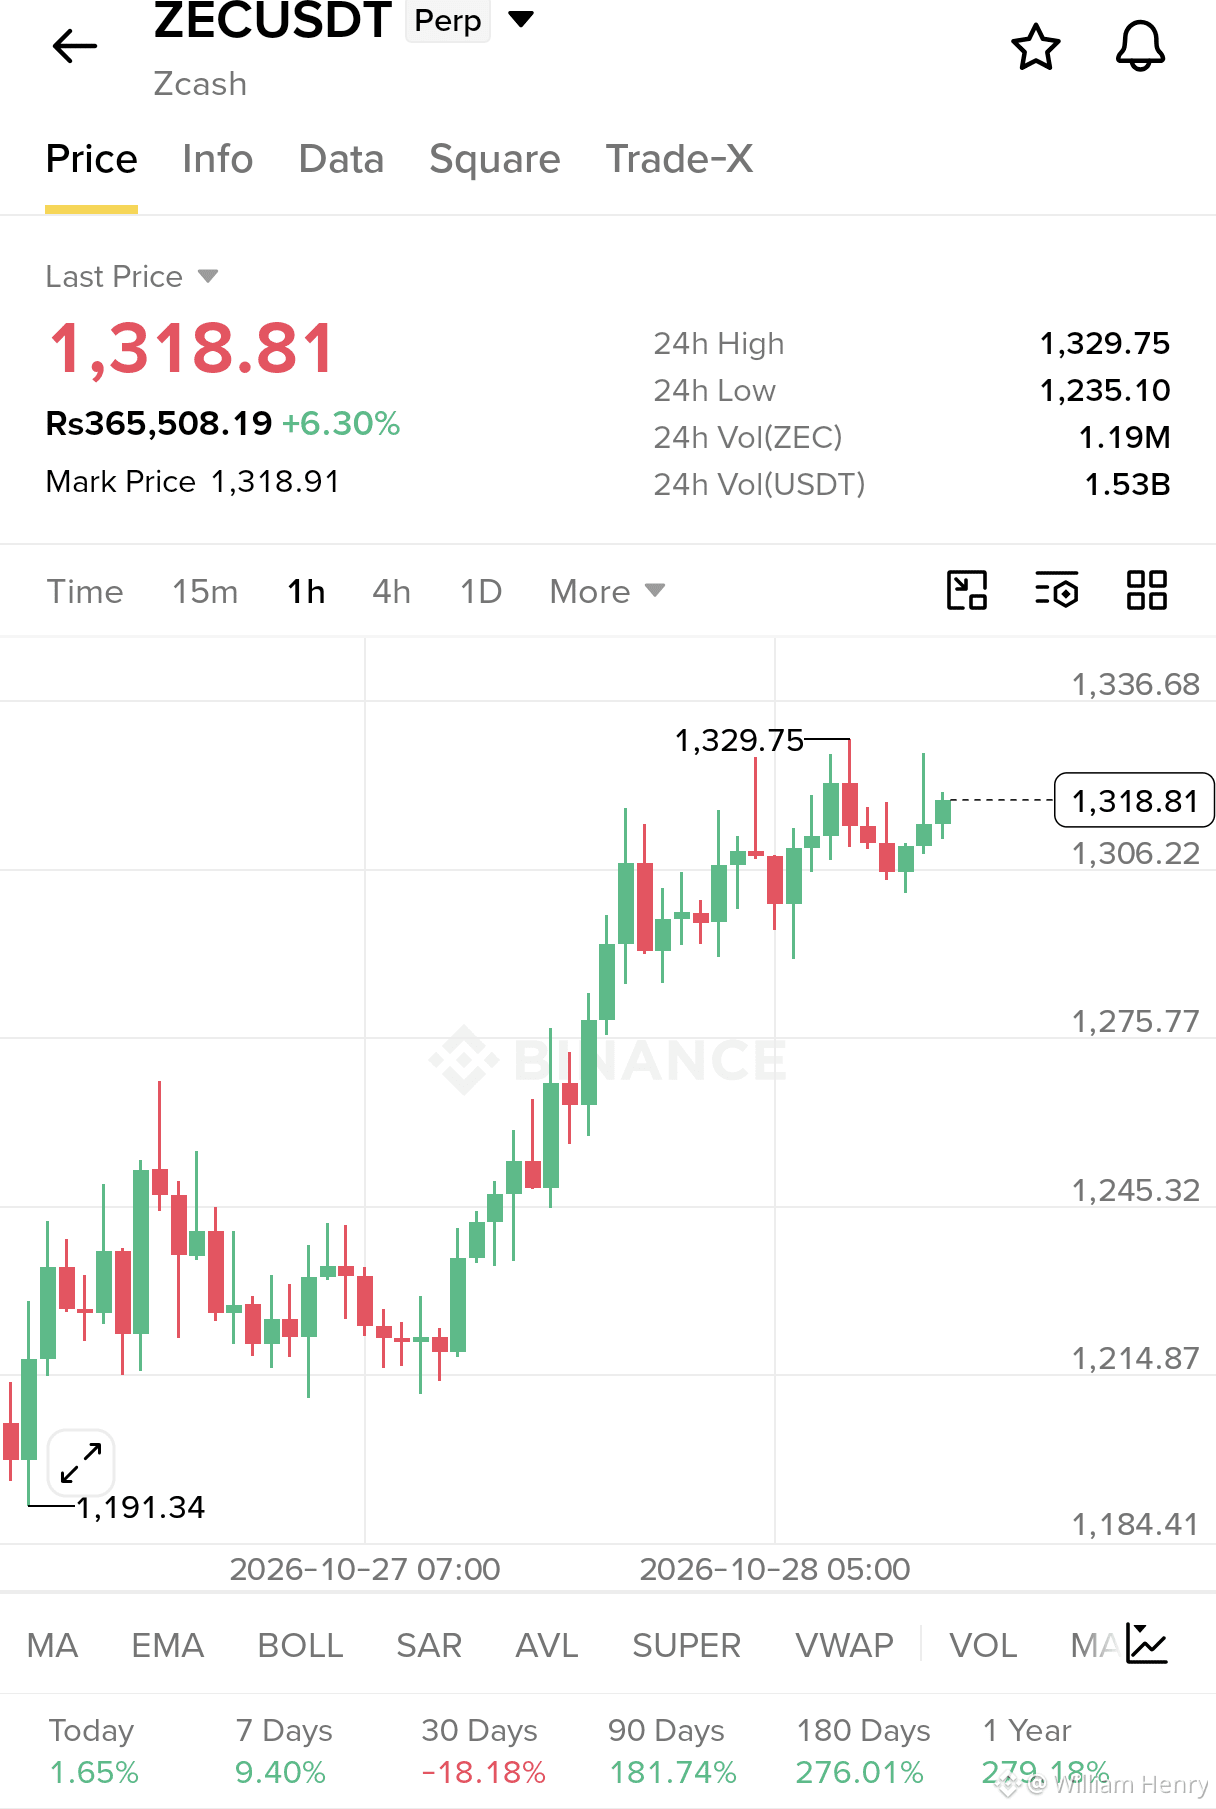
$ZEC 🔥 Bulls are pushing hard! Up 6.3% in 24 hours, Zcash is trading near $1,319 after a powerful rally from $1,191. 🚀
Now all eyes are on $1,330 resistance! A clean breakout could trigger another explosive move, while $1,300 remains a key support zone.
Will ZEC smash resistance and fly higher? 👀📈
{future}(ZECUSDT)
#CanMicrosoftDeliverOnAI
$ZEC 🔥 Bulls are pushing hard! Up 6.3% in 24 hours, Zcash is trading near $1,319 after a powerful rally from $1,191. 🚀
Now all eyes are on $1,330 resistance! A clean breakout could trigger another explosive move, while $1,300 remains a key support zone.
Will ZEC smash resistance and fly higher? 👀📈
#CanMicrosoftDeliverOnAI
Now all eyes are on $1,330 resistance! A clean breakout could trigger another explosive move, while $1,300 remains a key support zone.
Will ZEC smash resistance and fly higher? 👀📈
#CanMicrosoftDeliverOnAI
2
553
ဘာသာပြန်ဆိုချက် ကြည့်မည်
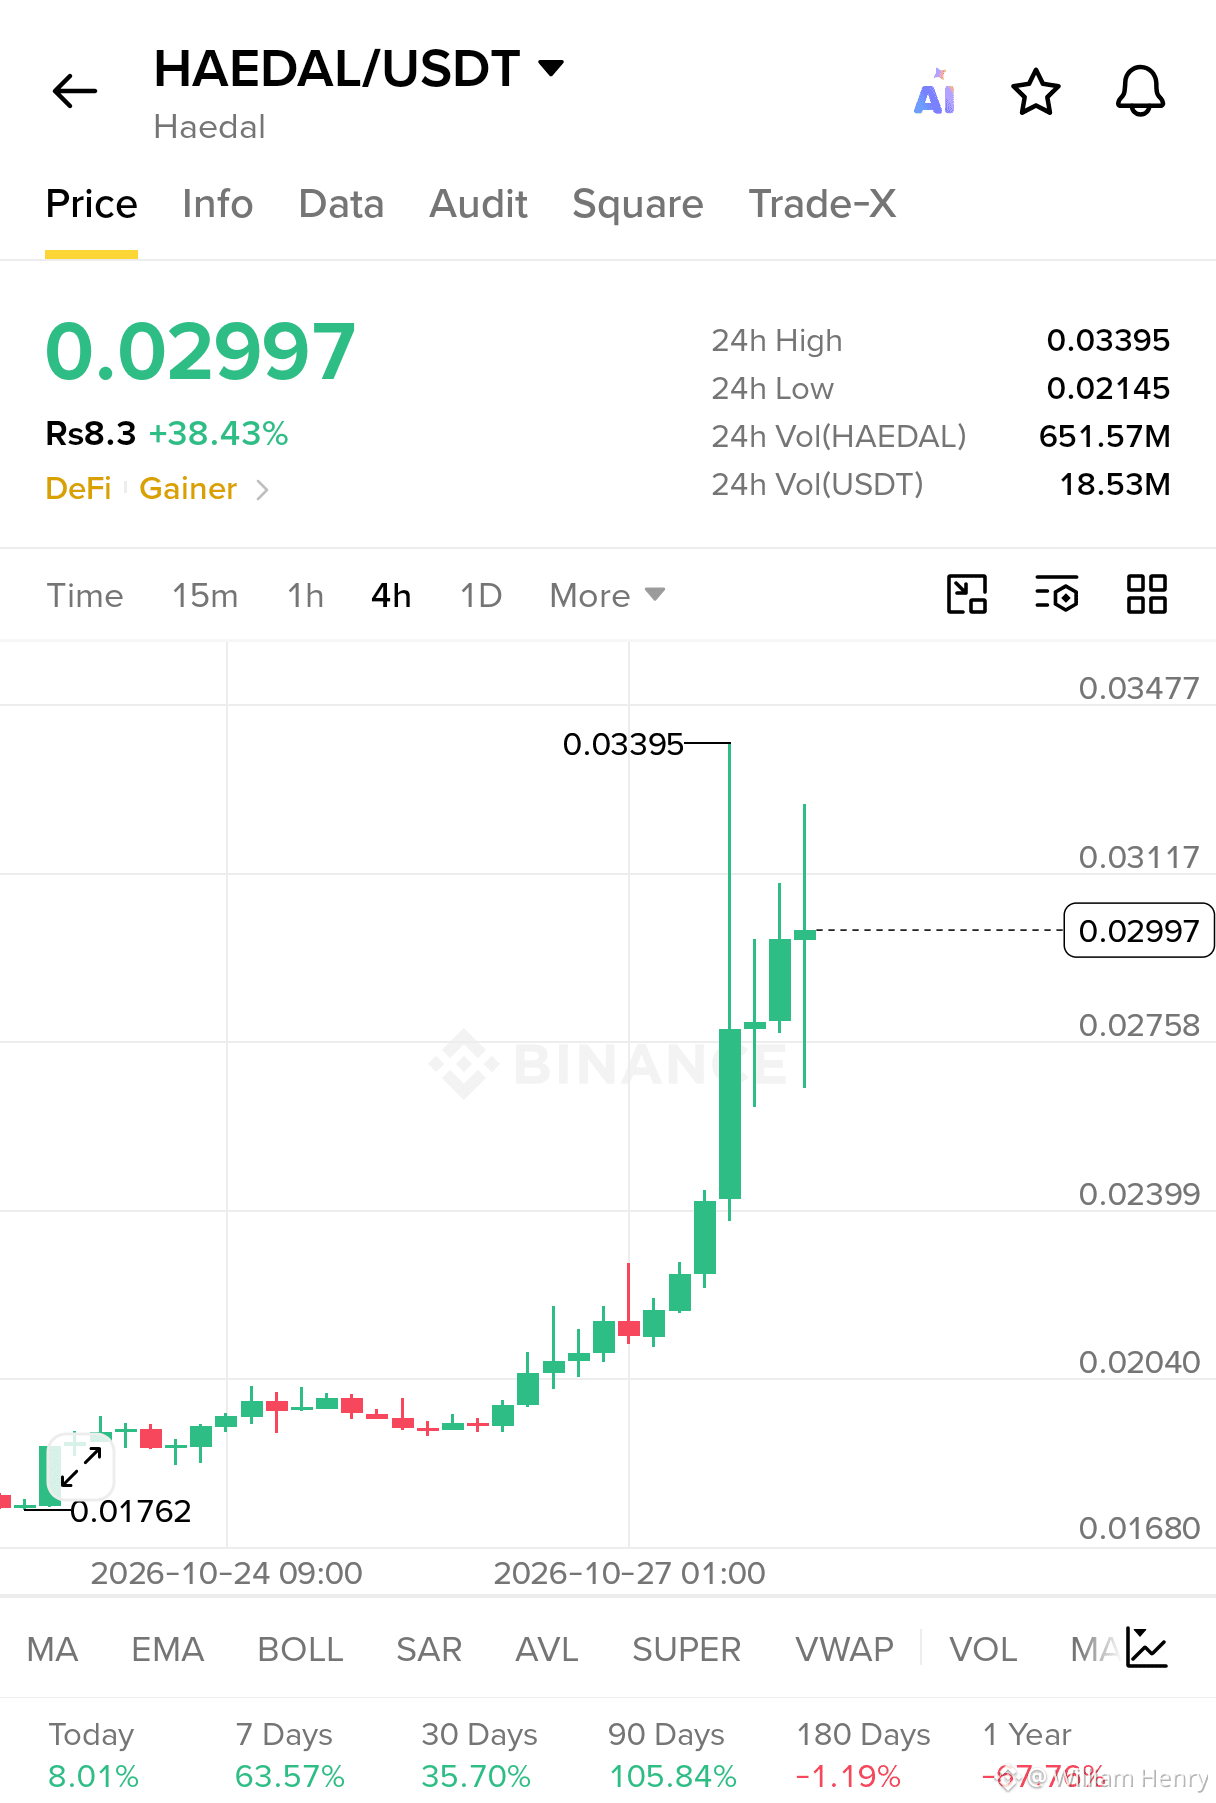
$HAEDAL is showing serious bullish momentum on the 4H chart. I'm watching this setup closely after a strong breakout from the $0.0200 region toward $0.03395. Price is now consolidating near $0.02997 after a sharp rally, with buyers still defending higher levels. The key is whether bulls can reclaim $0.03117 and challenge the recent high.
Trade Setup
Entry: $0.02850–$0.03000
Stop Loss: $0.02680
Targets:
Target 1: $0.03117
Target 2: $0.03395
Target 3: $0.03600
Target 4: $0.03800
Why it's possible
The 4H structure shows a strong upward move with consecutive bullish candles and expanding trading volume. This suggests aggressive buying, although the long upper wicks indicate potential selling pressure near resistance.
I'm watching for support to hold and a clean breakout above $0.03117. A failure to hold support could trigger a deeper pullback, so risk management matters.
Let's see if buyers can push $HAEDAL higher.
{future}(HAEDALUSDT)
#BitmineAdds10452ETH
$HAEDAL is showing serious bullish momentum on the 4H chart. I'm watching this setup closely after a strong breakout from the $0.0200 region toward $0.03395. Price is now consolidating near $0.02997 after a sharp rally, with buyers still defending higher levels. The key is whether bulls can reclaim $0.03117 and challenge the recent high.
Trade Setup
Entry: $0.02850–$0.03000
Stop Loss: $0.02680
Targets:
Target 1: $0.03117
Target 2: $0.03395
Target 3: $0.03600
Target 4: $0.03800
Why it's possible
The 4H structure shows a strong upward move with consecutive bullish candles and expanding trading volume. This suggests aggressive buying, although the long upper wicks indicate potential selling pressure near resistance.
I'm watching for support to hold and a clean breakout above $0.03117. A failure to hold support could trigger a deeper pullback, so risk management matters.
Let's see if buyers can push $HAEDAL higher.
#BitmineAdds10452ETH
Trade Setup
Entry: $0.02850–$0.03000
Stop Loss: $0.02680
Targets:
Target 1: $0.03117
Target 2: $0.03395
Target 3: $0.03600
Target 4: $0.03800
Why it's possible
The 4H structure shows a strong upward move with consecutive bullish candles and expanding trading volume. This suggests aggressive buying, although the long upper wicks indicate potential selling pressure near resistance.
I'm watching for support to hold and a clean breakout above $0.03117. A failure to hold support could trigger a deeper pullback, so risk management matters.
Let's see if buyers can push $HAEDAL higher.
#BitmineAdds10452ETH
783
ဘာသာပြန်ဆိုချက် ကြည့်မည်
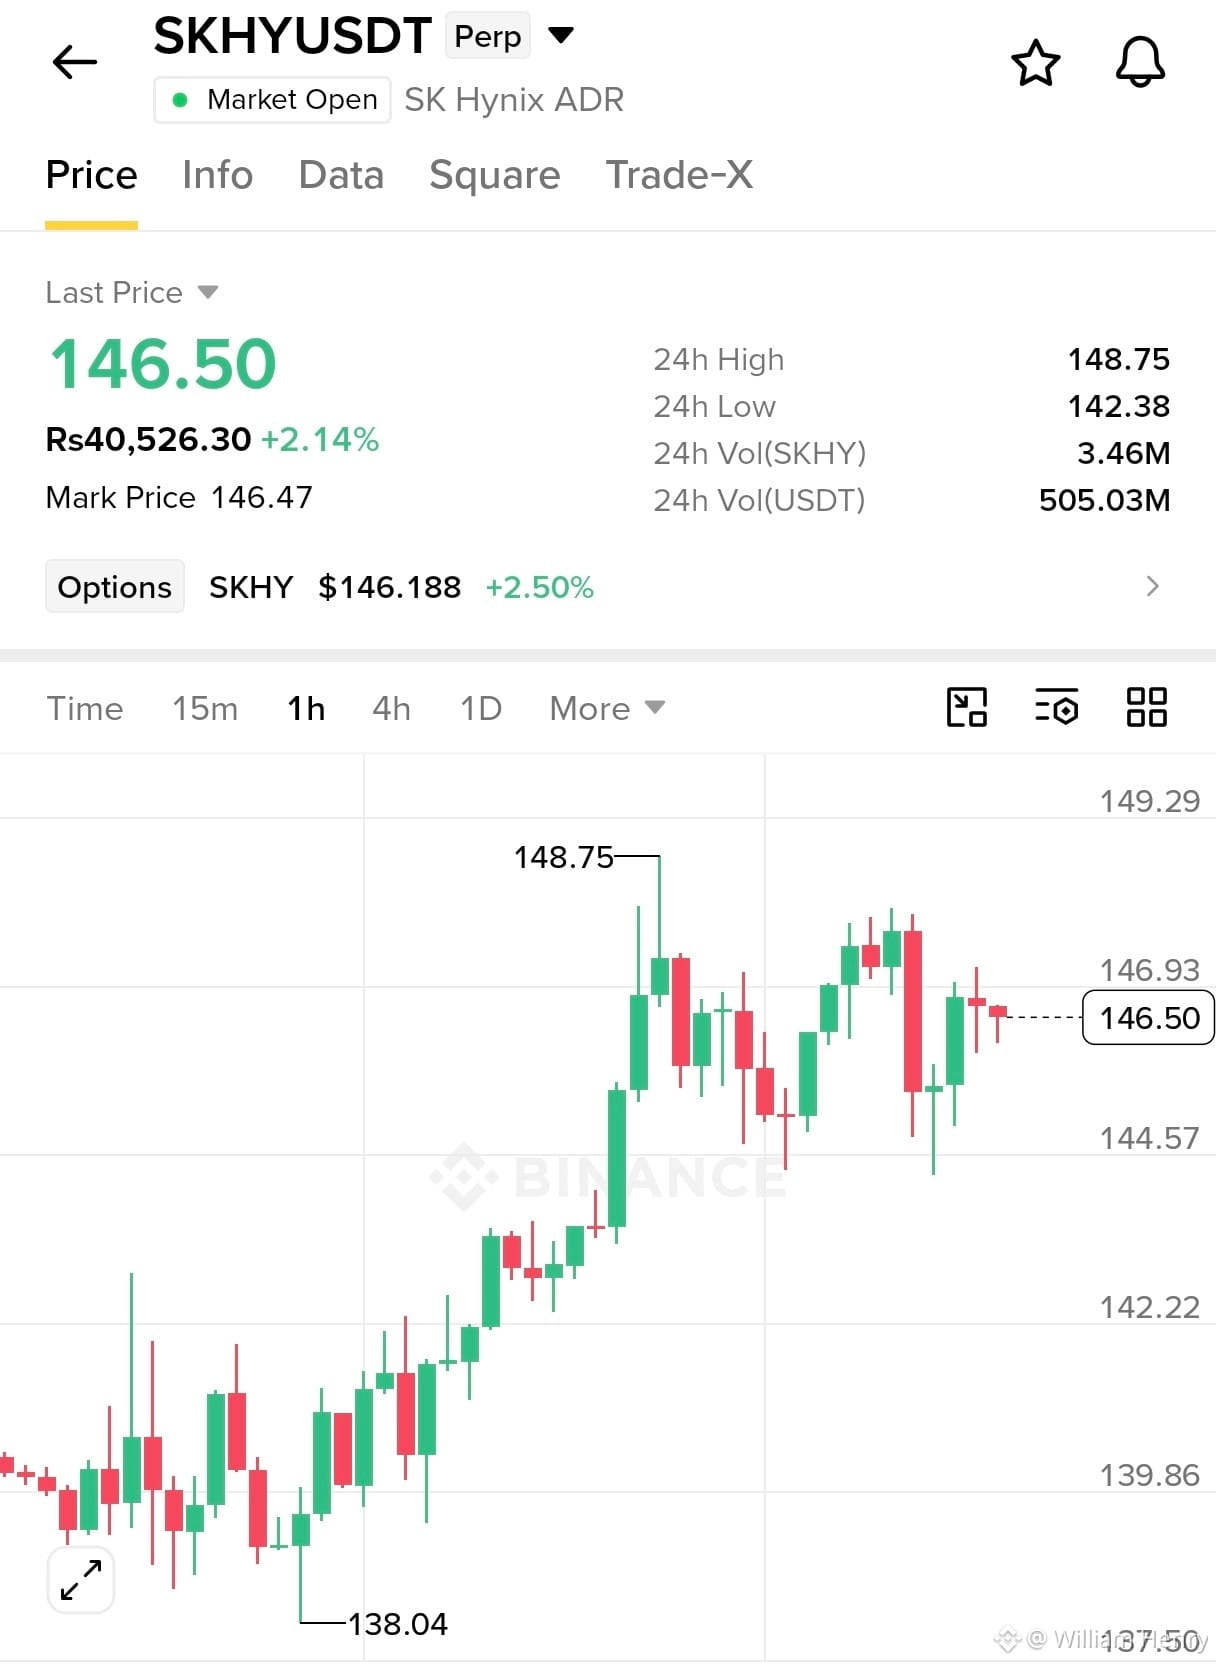
$SKHY is holding a bullish structure on the 1H chart, and I'm watching for another push toward $148.75. Price rallied strongly from $138.04 and is now consolidating around $146.50 after facing resistance near the recent high.
I'm looking for buyers to defend the $145.00–$144.50 support zone and build momentum for a fresh breakout. The setup remains constructive, but confirmation is important because repeated rejection near resistance could trigger another pullback.
Trade Setup
Entry: $146.20–$146.60
Stop Loss: $144.30
Targets:
Target 1: $147.00
Target 2: $147.80
Target 3: $148.75
Target 4: $150.00
Why it's possible
The 1H chart shows a strong upward move followed by consolidation. Buyers have recovered from the recent dip, suggesting demand remains present.
A clean break above $147.00 could open the way to retest $148.75, where breakout momentum may develop. However, resistance is still active, and volume confirmation is unavailable on this chart.
I'm keeping risk controlled and waiting for price to prove the move.
Let's go and trade now $SKHY
{future}(SKHYUSDT)
#CanMicrosoftDeliverOnAI
$SKHY is holding a bullish structure on the 1H chart, and I'm watching for another push toward $148.75. Price rallied strongly from $138.04 and is now consolidating around $146.50 after facing resistance near the recent high.
I'm looking for buyers to defend the $145.00–$144.50 support zone and build momentum for a fresh breakout. The setup remains constructive, but confirmation is important because repeated rejection near resistance could trigger another pullback.
Trade Setup
Entry: $146.20–$146.60
Stop Loss: $144.30
Targets:
Target 1: $147.00
Target 2: $147.80
Target 3: $148.75
Target 4: $150.00
Why it's possible
The 1H chart shows a strong upward move followed by consolidation. Buyers have recovered from the recent dip, suggesting demand remains present.
A clean break above $147.00 could open the way to retest $148.75, where breakout momentum may develop. However, resistance is still active, and volume confirmation is unavailable on this chart.
I'm keeping risk controlled and waiting for price to prove the move.
Let's go and trade now $SKHY
#CanMicrosoftDeliverOnAI
I'm looking for buyers to defend the $145.00–$144.50 support zone and build momentum for a fresh breakout. The setup remains constructive, but confirmation is important because repeated rejection near resistance could trigger another pullback.
Trade Setup
Entry: $146.20–$146.60
Stop Loss: $144.30
Targets:
Target 1: $147.00
Target 2: $147.80
Target 3: $148.75
Target 4: $150.00
Why it's possible
The 1H chart shows a strong upward move followed by consolidation. Buyers have recovered from the recent dip, suggesting demand remains present.
A clean break above $147.00 could open the way to retest $148.75, where breakout momentum may develop. However, resistance is still active, and volume confirmation is unavailable on this chart.
I'm keeping risk controlled and waiting for price to prove the move.
Let's go and trade now $SKHY
#CanMicrosoftDeliverOnAI
1
1
592
Log in to explore more content
Join global crypto users on Binance Square
⚡️ Get latest and useful information about crypto.
💬 Trusted by the world’s largest crypto exchange.
👍 Discover real insights from verified creators.
အီးမေးလ် / ဖုန်းနံပါတ်
ရေပန်းစားနေသော ခေါင်းစဉ်များ
BinanceRestores28FiatWithdrawals
ကြည့်ရှုမှု 30,985 ကြိမ်
556 ဦး ဆွေးနွေးနေသည်
Binance က USD၊ AED နဲ့ အာရှငွေကြေးသုံးမျိုးအတွက် Fiat ငွေထုတ်ယူမှုတွေကို ပြန်လည်ဖွင့်လှစ်ပြီး စုစုပေါင်း ၂၈ မျိုးအထိ ရှိလာ
Binance News
·နှစ်သက်မှု 17 ခု
·ကြည့်ရှုမှု 8.3k ကြိမ်
BinanceProcesses$4.65BWithdrawals
ကြည့်ရှုမှု 73,962 ကြိမ်
319 ဦး ဆွေးနွေးနေသည်
HKMALaunchesSAGEAgenticFinanceProject
ကြည့်ရှုမှု 293 ကြိမ်
34 ဦး ဆွေးနွေးနေသည်