

TopCryptoNews
10.1k ပို့စ်များ

TopCryptoNews
 Square Verified+
တိုင်ကြားမည်
သုံးစွဲသူကို ဘလော့မည်
Lastest News | Technical Analysis | Signals | Web3 | Advertise | Top News on Crypto World | Projects | Business Offer

Creator Awards 2024

#BinanceTurns7

Excellence Award (Top Voice)
35 ဖော်လိုလုပ်ထားသည်
294.1K+ ဖော်လိုလုပ်သူများ
339.4K+ လိုက်ခ်လုပ်ထားသည်
7 တံဆိပ်များ
ပို့စ်များ
အားလုံး
Quotes
ဗီဒီယိုများ
တိုက်ရိုက်ထုတ်လွှင့်ခြင်း
ပုံသေထားသည်
🔴 FSB placed Pavel Durov under international arrest warrant
The founder of Telegram, Pavel Durov, has been placed under international arrest warrant for aiding terrorism, report media citing the Russian FSB.
According to the FSB, Ukrainian special services allegedly used Telegram chat bots to recruit Russian citizens. The agency claims that the Telegram administration did not remove the service after it was added to the registry of banned resources, which became the basis for the charges.
At the time of publication, no official comments from Pavel Durov had been received.
#PavelDurov | #TON | $TON
🔴 FSB placed Pavel Durov under international arrest warrant
The founder of Telegram, Pavel Durov, has been placed under international arrest warrant for aiding terrorism, report media citing the Russian FSB.
According to the FSB, Ukrainian special services allegedly used Telegram chat bots to recruit Russian citizens. The agency claims that the Telegram administration did not remove the service after it was added to the registry of banned resources, which became the basis for the charges.
At the time of publication, no official comments from Pavel Durov had been received.
#PavelDurov | #TON | $TON
The founder of Telegram, Pavel Durov, has been placed under international arrest warrant for aiding terrorism, report media citing the Russian FSB.
According to the FSB, Ukrainian special services allegedly used Telegram chat bots to recruit Russian citizens. The agency claims that the Telegram administration did not remove the service after it was added to the registry of banned resources, which became the basis for the charges.
At the time of publication, no official comments from Pavel Durov had been received.
#PavelDurov | #TON | $TON

27
8
204
434.3k
ပုံသေထားသည်
စိစစ်အတည်ပြုထားသည်
🌕 CZ-owned Trust Wallet launches AI agents that can execute crypto trades
The digital wallet owned by Binance founder Changpeng Zhao, which has more than 220 million customers, said Thursday that users can now employ artificial intelligence-powered agents to perform a variety of crypto transactions.
"Today, Trust Wallet launches the Trust Wallet Agent Kit (TWAK) — infrastructure that lets AI agents execute real crypto transactions, across more than 25 blockchains, within rules that users define and control," the company said in a blog post. The agents can handle cross-chain swaps across several networks, including Solana and Bitcoin, in addition to managing recurring buys.
Crypto firms are increasingly experimenting with AI-powered automation, aiming to allow users to enlist agents that can actively manage portfolios and execute trades.
The new toolkit offers two ways to operate, one where the AI agent has its own wallet and can execute trades automatically based on set rules, and the other where it suggests transactions that users then need to approve.
"Trust Wallet has always been built on a single principle: your keys, your crypto. TWAK extends that principle into the age of AI agents," also according to the blog post. "With WalletConnect mode, an AI can help you act on your portfolio — research, propose, execute — without ever holding your keys. You stay in control."
While the cryptocurrency exchange initially bought Trust Wallet in 2018, it now operates as an independent company.
#CZ | #AI
🌕 CZ-owned Trust Wallet launches AI agents that can execute crypto trades
The digital wallet owned by Binance founder Changpeng Zhao, which has more than 220 million customers, said Thursday that users can now employ artificial intelligence-powered agents to perform a variety of crypto transactions.
"Today, Trust Wallet launches the Trust Wallet Agent Kit (TWAK) — infrastructure that lets AI agents execute real crypto transactions, across more than 25 blockchains, within rules that users define and control," the company said in a blog post. The agents can handle cross-chain swaps across several networks, including Solana and Bitcoin, in addition to managing recurring buys.
Crypto firms are increasingly experimenting with AI-powered automation, aiming to allow users to enlist agents that can actively manage portfolios and execute trades.
The new toolkit offers two ways to operate, one where the AI agent has its own wallet and can execute trades automatically based on set rules, and the other where it suggests transactions that users then need to approve.
"Trust Wallet has always been built on a single principle: your keys, your crypto. TWAK extends that principle into the age of AI agents," also according to the blog post. "With WalletConnect mode, an AI can help you act on your portfolio — research, propose, execute — without ever holding your keys. You stay in control."
While the cryptocurrency exchange initially bought Trust Wallet in 2018, it now operates as an independent company.
#CZ | #AI
The digital wallet owned by Binance founder Changpeng Zhao, which has more than 220 million customers, said Thursday that users can now employ artificial intelligence-powered agents to perform a variety of crypto transactions.
"Today, Trust Wallet launches the Trust Wallet Agent Kit (TWAK) — infrastructure that lets AI agents execute real crypto transactions, across more than 25 blockchains, within rules that users define and control," the company said in a blog post. The agents can handle cross-chain swaps across several networks, including Solana and Bitcoin, in addition to managing recurring buys.
Crypto firms are increasingly experimenting with AI-powered automation, aiming to allow users to enlist agents that can actively manage portfolios and execute trades.
The new toolkit offers two ways to operate, one where the AI agent has its own wallet and can execute trades automatically based on set rules, and the other where it suggests transactions that users then need to approve.
"Trust Wallet has always been built on a single principle: your keys, your crypto. TWAK extends that principle into the age of AI agents," also according to the blog post. "With WalletConnect mode, an AI can help you act on your portfolio — research, propose, execute — without ever holding your keys. You stay in control."
While the cryptocurrency exchange initially bought Trust Wallet in 2018, it now operates as an independent company.
#CZ | #AI

113
46
451
100.4k
·
--
တက်ရိပ်ရှိသည်
🤖 AI crypto FET surges 16%, hits 3 month high – $0.28 possible IF…
Artificial Superintelligence Alliance [FET] rebounded from $0.19, reclaimed $0.20 and touched a three-month high near $0.23. At press time, FET traded around $0.229, up 16% in 24 hours.
Trading activity rose with the price. Volume increased 44% over the same period, while Daily Turnover reached a three-month high of $61 million.
But after FET’s previous rally faded, could this round of buying hold?
🔸 Why did FET rebound?
An earlier AMBCrypto report found that rising Exchange Reserves had complicated $FET’s previous advance. This time, spot activity suggested buyers had stepped in after the dip.
Spot Buy Volume rose to 123 million FET over 24 hours. Meanwhile, Delta exceeded 9 million FET, indicating that buying outpaced selling on the measured spot markets.
Exchange Netflow also turned negative after two consecutive positive days. It stood near -241,000 FET at press time, suggesting more tokens left exchanges than entered them.
That shift eased the immediate exchange-supply concern. Derivatives traders, however, sent a less uniform signal.
🔸 Are FET traders betting on more gains?
Derivatives Volume climbed 63% to $272 million, while Open Interest rose 21% to $125 million. Together, those increases showed that traders were taking more positions as FET rallied.
On Binance, Artificial Superintelligence Alliance’s [FET] Long/Short Ratio held above 2, showing a strong lean toward long positions among the measured traders.
However, the overall Long/Short Ratio remained below 1. Bullish positioning on one exchange had yet to spread across the broader derivatives market.
🔸 Can FET hold $0.23?
Directional indicators supported the recent price move. The positive directional indicator rose to 33, while the negative directional indicator fell to 8.
Artificial Superintelligence Alliance’s RSI also held in bullish territory.
#FET | $FET
{spot}(FETUSDT)
🤖 AI crypto FET surges 16%, hits 3 month high – $0.28 possible IF…
Artificial Superintelligence Alliance [FET] rebounded from $0.19, reclaimed $0.20 and touched a three-month high near $0.23. At press time, FET traded around $0.229, up 16% in 24 hours.
Trading activity rose with the price. Volume increased 44% over the same period, while Daily Turnover reached a three-month high of $61 million.
But after FET’s previous rally faded, could this round of buying hold?
🔸 Why did FET rebound?
An earlier AMBCrypto report found that rising Exchange Reserves had complicated $FET ’s previous advance. This time, spot activity suggested buyers had stepped in after the dip.
Spot Buy Volume rose to 123 million FET over 24 hours. Meanwhile, Delta exceeded 9 million FET, indicating that buying outpaced selling on the measured spot markets.
Exchange Netflow also turned negative after two consecutive positive days. It stood near -241,000 FET at press time, suggesting more tokens left exchanges than entered them.
That shift eased the immediate exchange-supply concern. Derivatives traders, however, sent a less uniform signal.
🔸 Are FET traders betting on more gains?
Derivatives Volume climbed 63% to $272 million, while Open Interest rose 21% to $125 million. Together, those increases showed that traders were taking more positions as FET rallied.
On Binance, Artificial Superintelligence Alliance’s [FET] Long/Short Ratio held above 2, showing a strong lean toward long positions among the measured traders.
However, the overall Long/Short Ratio remained below 1. Bullish positioning on one exchange had yet to spread across the broader derivatives market.
🔸 Can FET hold $0.23?
Directional indicators supported the recent price move. The positive directional indicator rose to 33, while the negative directional indicator fell to 8.
Artificial Superintelligence Alliance’s RSI also held in bullish territory.
#FET | $FET
Artificial Superintelligence Alliance [FET] rebounded from $0.19, reclaimed $0.20 and touched a three-month high near $0.23. At press time, FET traded around $0.229, up 16% in 24 hours.
Trading activity rose with the price. Volume increased 44% over the same period, while Daily Turnover reached a three-month high of $61 million.
But after FET’s previous rally faded, could this round of buying hold?
🔸 Why did FET rebound?
An earlier AMBCrypto report found that rising Exchange Reserves had complicated $FET ’s previous advance. This time, spot activity suggested buyers had stepped in after the dip.
Spot Buy Volume rose to 123 million FET over 24 hours. Meanwhile, Delta exceeded 9 million FET, indicating that buying outpaced selling on the measured spot markets.
Exchange Netflow also turned negative after two consecutive positive days. It stood near -241,000 FET at press time, suggesting more tokens left exchanges than entered them.
That shift eased the immediate exchange-supply concern. Derivatives traders, however, sent a less uniform signal.
🔸 Are FET traders betting on more gains?
Derivatives Volume climbed 63% to $272 million, while Open Interest rose 21% to $125 million. Together, those increases showed that traders were taking more positions as FET rallied.
On Binance, Artificial Superintelligence Alliance’s [FET] Long/Short Ratio held above 2, showing a strong lean toward long positions among the measured traders.
However, the overall Long/Short Ratio remained below 1. Bullish positioning on one exchange had yet to spread across the broader derivatives market.
🔸 Can FET hold $0.23?
Directional indicators supported the recent price move. The positive directional indicator rose to 33, while the negative directional indicator fell to 8.
Artificial Superintelligence Alliance’s RSI also held in bullish territory.
#FET | $FET

4
2.3k
·
--
တက်ရိပ်ရှိသည်
🔵 Chainlink (LINK) Open Interest Hits 25% in Last 24 Hours: Breakout Is Happening
As LINK approaches $14, Chainlink is going through another increase in both market and derivatives activity. Over the course of the last day, open interest has increased by about 25%, adding leverage to a market that was already forming a solid bullish structure.
🔸 ChainLink enters breakout
Since LINK open interest had already significantly recovered prior to the most recent price breakout, the derivatives data is especially significant. According to the given data, OI was roughly $650.7 million on September 24, while during most of the spring and early summer, levels were closer to $350–$450 million.
An additional 25% daily rise suggests that traders are actively creating new positions instead of just reducing their exposure. The direction of price movement is the same. LINK reached just above $14, its highest level on the displayed chart, and is currently trading at about $13.96.
The move comes after a significant August breakout above the 200-day moving average around $9.50, which was followed by a string of higher highs and higher lows. Since LINK has now surpassed the previous September high at roughly $13.70, the most recent acceleration is especially noteworthy.
As a result, the chart's most noticeable local resistance has been eliminated. While the major moving averages are increasingly in a favorable alignment, volume has also increased during the advance. The shortest average has risen to $12, with intermediate averages ranging from $11 to $11.30.
Near $10.30, the 200-day average is still significantly lower. The intensity of the momentum has increased, but it hasn't reached the extreme levels of some earlier LINK rallies. The fact that the RSI is still below the highly overbought area indicates that, should demand continue, there may be more room for market growth.
#LINK | #Chainlink | $LINK
{spot}(LINKUSDT)
🔵 Chainlink (LINK) Open Interest Hits 25% in Last 24 Hours: Breakout Is Happening
As LINK approaches $14, Chainlink is going through another increase in both market and derivatives activity. Over the course of the last day, open interest has increased by about 25%, adding leverage to a market that was already forming a solid bullish structure.
🔸 ChainLink enters breakout
Since LINK open interest had already significantly recovered prior to the most recent price breakout, the derivatives data is especially significant. According to the given data, OI was roughly $650.7 million on September 24, while during most of the spring and early summer, levels were closer to $350–$450 million.
An additional 25% daily rise suggests that traders are actively creating new positions instead of just reducing their exposure. The direction of price movement is the same. LINK reached just above $14, its highest level on the displayed chart, and is currently trading at about $13.96.
The move comes after a significant August breakout above the 200-day moving average around $9.50, which was followed by a string of higher highs and higher lows. Since LINK has now surpassed the previous September high at roughly $13.70, the most recent acceleration is especially noteworthy.
As a result, the chart's most noticeable local resistance has been eliminated. While the major moving averages are increasingly in a favorable alignment, volume has also increased during the advance. The shortest average has risen to $12, with intermediate averages ranging from $11 to $11.30.
Near $10.30, the 200-day average is still significantly lower. The intensity of the momentum has increased, but it hasn't reached the extreme levels of some earlier LINK rallies. The fact that the RSI is still below the highly overbought area indicates that, should demand continue, there may be more room for market growth.
#LINK | #Chainlink | $LINK
As LINK approaches $14, Chainlink is going through another increase in both market and derivatives activity. Over the course of the last day, open interest has increased by about 25%, adding leverage to a market that was already forming a solid bullish structure.
🔸 ChainLink enters breakout
Since LINK open interest had already significantly recovered prior to the most recent price breakout, the derivatives data is especially significant. According to the given data, OI was roughly $650.7 million on September 24, while during most of the spring and early summer, levels were closer to $350–$450 million.
An additional 25% daily rise suggests that traders are actively creating new positions instead of just reducing their exposure. The direction of price movement is the same. LINK reached just above $14, its highest level on the displayed chart, and is currently trading at about $13.96.
The move comes after a significant August breakout above the 200-day moving average around $9.50, which was followed by a string of higher highs and higher lows. Since LINK has now surpassed the previous September high at roughly $13.70, the most recent acceleration is especially noteworthy.
As a result, the chart's most noticeable local resistance has been eliminated. While the major moving averages are increasingly in a favorable alignment, volume has also increased during the advance. The shortest average has risen to $12, with intermediate averages ranging from $11 to $11.30.
Near $10.30, the 200-day average is still significantly lower. The intensity of the momentum has increased, but it hasn't reached the extreme levels of some earlier LINK rallies. The fact that the RSI is still below the highly overbought area indicates that, should demand continue, there may be more room for market growth.
#LINK | #Chainlink | $LINK

1
6
2.6k
🟠 $BTC managed to break through one of the key long-term resistance lines. What's important to see now is a successful sustained price above $86k.
🟢 The last time this line was broken, it was followed by a new all-time high (ATH).
🔴 If we fall below this level, there is a risk that the selling pressure will continue.
#BTC | #Bitcoin
🟠 $BTC managed to break through one of the key long-term resistance lines. What's important to see now is a successful sustained price above $86k.
🟢 The last time this line was broken, it was followed by a new all-time high (ATH).
🔴 If we fall below this level, there is a risk that the selling pressure will continue.
#BTC | #Bitcoin
🟢 The last time this line was broken, it was followed by a new all-time high (ATH).
🔴 If we fall below this level, there is a risk that the selling pressure will continue.
#BTC | #Bitcoin
1
7
2.2k
·
--
တက်ရိပ်ရှိသည်
တစ်စိတ်တစ်ပိုင်း မှန်ကန်
💧 SuiNetwork Highlights Shared Ledger Benefits as Cost
SuiNetwork has brought attention to the inefficiencies in current financial systems, emphasizing the need for a shared ledger to minimize transaction costs. The tweet highlights the burden of middlemen in money transfers. This concept could streamline processes and attract significant interest in blockchain solutions from various sectors. For more details, check the original tweet here.
🔸 The Key Development
The broader crypto market continues to exhibit mixed signals, with varying momentum across major assets. In this context, SuiNetwork’s focus on reducing transaction costs through a shared ledger concept is particularly timely. By proposing a solution to eliminate middlemen, SuiNetwork aims to enhance efficiency in financial transactions, a move that could resonate with both users and institutional investors. As the industry navigates evolving technologies, this insight could influence market sentiment towards blockchain solutions.
🔸 What the Data Shows
Currently, no trading volume is reported for SuiNetwork, reflecting a potential pause in market activity. However, the rising trend score of 65 indicates growing interest in the project, especially as discussions around transaction efficiency gain traction. The Twitter engagement also reflects a positive sentiment, with 145 likes and 19 retweets, showing that the community is responsive to innovative ideas in the blockchain space. This engagement could foreshadow future market movements as more users consider the implications of shared ledger technologies.
🔸 What Traders Are Watching Next
Traders should keep an eye on how SuiNetwork’s proposals may influence market dynamics, particularly as discussions about reducing transaction costs continue. There is potential for increased adoption of blockchain technologies, especially if shared ledger solutions gain traction among financial institutions.
#SuiNetwork | #SUI | $SUI
{spot}(SUIUSDT)
💧 SuiNetwork Highlights Shared Ledger Benefits as Cost
SuiNetwork has brought attention to the inefficiencies in current financial systems, emphasizing the need for a shared ledger to minimize transaction costs. The tweet highlights the burden of middlemen in money transfers. This concept could streamline processes and attract significant interest in blockchain solutions from various sectors. For more details, check the original tweet here.
🔸 The Key Development
The broader crypto market continues to exhibit mixed signals, with varying momentum across major assets. In this context, SuiNetwork’s focus on reducing transaction costs through a shared ledger concept is particularly timely. By proposing a solution to eliminate middlemen, SuiNetwork aims to enhance efficiency in financial transactions, a move that could resonate with both users and institutional investors. As the industry navigates evolving technologies, this insight could influence market sentiment towards blockchain solutions.
🔸 What the Data Shows
Currently, no trading volume is reported for SuiNetwork, reflecting a potential pause in market activity. However, the rising trend score of 65 indicates growing interest in the project, especially as discussions around transaction efficiency gain traction. The Twitter engagement also reflects a positive sentiment, with 145 likes and 19 retweets, showing that the community is responsive to innovative ideas in the blockchain space. This engagement could foreshadow future market movements as more users consider the implications of shared ledger technologies.
🔸 What Traders Are Watching Next
Traders should keep an eye on how SuiNetwork’s proposals may influence market dynamics, particularly as discussions about reducing transaction costs continue. There is potential for increased adoption of blockchain technologies, especially if shared ledger solutions gain traction among financial institutions.
#SuiNetwork | #SUI | $SUI
SuiNetwork has brought attention to the inefficiencies in current financial systems, emphasizing the need for a shared ledger to minimize transaction costs. The tweet highlights the burden of middlemen in money transfers. This concept could streamline processes and attract significant interest in blockchain solutions from various sectors. For more details, check the original tweet here.
🔸 The Key Development
The broader crypto market continues to exhibit mixed signals, with varying momentum across major assets. In this context, SuiNetwork’s focus on reducing transaction costs through a shared ledger concept is particularly timely. By proposing a solution to eliminate middlemen, SuiNetwork aims to enhance efficiency in financial transactions, a move that could resonate with both users and institutional investors. As the industry navigates evolving technologies, this insight could influence market sentiment towards blockchain solutions.
🔸 What the Data Shows
Currently, no trading volume is reported for SuiNetwork, reflecting a potential pause in market activity. However, the rising trend score of 65 indicates growing interest in the project, especially as discussions around transaction efficiency gain traction. The Twitter engagement also reflects a positive sentiment, with 145 likes and 19 retweets, showing that the community is responsive to innovative ideas in the blockchain space. This engagement could foreshadow future market movements as more users consider the implications of shared ledger technologies.
🔸 What Traders Are Watching Next
Traders should keep an eye on how SuiNetwork’s proposals may influence market dynamics, particularly as discussions about reducing transaction costs continue. There is potential for increased adoption of blockchain technologies, especially if shared ledger solutions gain traction among financial institutions.
#SuiNetwork | #SUI | $SUI

8
1.2k
🐂 Bitcoin’s bear markets are getting milder. Bull markets may be next
Bitcoin has long made investors pay for its bull markets with brutal crashes, but that trade-off may finally be changing.
The crypto asset fell roughly 55% from its October 2025 peak during its most recent bear cycle. That would qualify as a historic collapse in most markets, but for bitcoin, it was relatively tame compared to past collapses. In November 2021, for example, after reaching nearly $69,000, bitcoin plunged below $16,000 a year later as rising interest rates, a string of crypto bankruptcies and the collapse of FTX battered the market. The drop topped 75%. Earlier cycles produced drawdowns of 80% or more.
Past rebounds could be just as extreme. Bitcoin rose from less than $4,000 in early 2019 to almost $69,000 in 2021. It then climbed from its 2022 low to more than $100,000 after U.S. spot bitcoin exchange-traded funds (ETFs) opened the asset to a much larger pool of investors.
Before the ETFs, bitcoin ownership tilted more heavily toward retail investors, crypto-native funds and traders making tactical bets, Rasmussen said. ETFs gave financial advisers and other professional investors a familiar way to add bitcoin to traditional portfolios.
🔸 Those investors tend to approach bitcoin differently.
Rasmussen said a professional investor might allocate around 2% of a portfolio to bitcoin, while crypto-focused retail investors can have 20%, 30%, or more of their money tied to the asset.
“If it goes down 50%, my portfolio is only down 1%,” Rasmussen said in an interview, describing how an investor with a 2% allocation might view the decline.
There is also rebalancing. An adviser targeting a 2% bitcoin allocation may buy after a steep decline to bring the position back to its target weight. If bitcoin surges and reaches 5% of the portfolio, that same investor may sell some at the next rebalancing.
#BTC | #Bitcoin | #BullRun | $BTC
{spot}(BTCUSDT)
🐂 Bitcoin’s bear markets are getting milder. Bull markets may be next
Bitcoin has long made investors pay for its bull markets with brutal crashes, but that trade-off may finally be changing.
The crypto asset fell roughly 55% from its October 2025 peak during its most recent bear cycle. That would qualify as a historic collapse in most markets, but for bitcoin, it was relatively tame compared to past collapses. In November 2021, for example, after reaching nearly $69,000, bitcoin plunged below $16,000 a year later as rising interest rates, a string of crypto bankruptcies and the collapse of FTX battered the market. The drop topped 75%. Earlier cycles produced drawdowns of 80% or more.
Past rebounds could be just as extreme. Bitcoin rose from less than $4,000 in early 2019 to almost $69,000 in 2021. It then climbed from its 2022 low to more than $100,000 after U.S. spot bitcoin exchange-traded funds (ETFs) opened the asset to a much larger pool of investors.
Before the ETFs, bitcoin ownership tilted more heavily toward retail investors, crypto-native funds and traders making tactical bets, Rasmussen said. ETFs gave financial advisers and other professional investors a familiar way to add bitcoin to traditional portfolios.
🔸 Those investors tend to approach bitcoin differently.
Rasmussen said a professional investor might allocate around 2% of a portfolio to bitcoin, while crypto-focused retail investors can have 20%, 30%, or more of their money tied to the asset.
“If it goes down 50%, my portfolio is only down 1%,” Rasmussen said in an interview, describing how an investor with a 2% allocation might view the decline.
There is also rebalancing. An adviser targeting a 2% bitcoin allocation may buy after a steep decline to bring the position back to its target weight. If bitcoin surges and reaches 5% of the portfolio, that same investor may sell some at the next rebalancing.
#BTC | #Bitcoin | #BullRun | $BTC
Bitcoin has long made investors pay for its bull markets with brutal crashes, but that trade-off may finally be changing.
The crypto asset fell roughly 55% from its October 2025 peak during its most recent bear cycle. That would qualify as a historic collapse in most markets, but for bitcoin, it was relatively tame compared to past collapses. In November 2021, for example, after reaching nearly $69,000, bitcoin plunged below $16,000 a year later as rising interest rates, a string of crypto bankruptcies and the collapse of FTX battered the market. The drop topped 75%. Earlier cycles produced drawdowns of 80% or more.
Past rebounds could be just as extreme. Bitcoin rose from less than $4,000 in early 2019 to almost $69,000 in 2021. It then climbed from its 2022 low to more than $100,000 after U.S. spot bitcoin exchange-traded funds (ETFs) opened the asset to a much larger pool of investors.
Before the ETFs, bitcoin ownership tilted more heavily toward retail investors, crypto-native funds and traders making tactical bets, Rasmussen said. ETFs gave financial advisers and other professional investors a familiar way to add bitcoin to traditional portfolios.
🔸 Those investors tend to approach bitcoin differently.
Rasmussen said a professional investor might allocate around 2% of a portfolio to bitcoin, while crypto-focused retail investors can have 20%, 30%, or more of their money tied to the asset.
“If it goes down 50%, my portfolio is only down 1%,” Rasmussen said in an interview, describing how an investor with a 2% allocation might view the decline.
There is also rebalancing. An adviser targeting a 2% bitcoin allocation may buy after a steep decline to bring the position back to its target weight. If bitcoin surges and reaches 5% of the portfolio, that same investor may sell some at the next rebalancing.
#BTC | #Bitcoin | #BullRun | $BTC
1
12
4.1k
·
--
တက်ရိပ်ရှိသည်
🟣 Solana Shows Extreme Growth: Tokenized Shareholders Exceed 1 Million
Solana has reached a significant milestone by surpassing the 1 million mark in the number of tokenized stock holders. This achievement is considered a science fiction feat just two years ago. Solana holds approximately 95% market share in on-chain tokenized stock trading and continues to outperform its competitors in this area.
🔸 Solana’s Rise in Numbers
The supply of tokenized shares on Solana reached a record high of $684 million in mid-September, representing a 47% increase in just three weeks. During the same period, the 30-day real-world asset trading volume reached $3.3 billion. Among Solana’s tokenized shares, NVDAx, a tokenized representation of NVIDIA shares, leads in holder numbers. New listings like Nike have accelerated this trend, moving beyond technology-heavy portfolios.
🔸 The Meaning of Tokenized Shares
Tokenized shares, as blockchain-based tokens, represent ownership or exposure to traditional shares. These tokens are traded on-chain, exchanged almost instantly, and are accessible 24/7. On Solana, primary issuers like xStocks distribute them through networks like Backpack Securities.
🔸 Points to Consider
While the figure of 1 million seems impressive, this number measures wallet addresses, not verified unique individuals. A person may have multiple wallets, and incentive programs can inflate these numbers. As of the end of September, the verified number was recorded as 900,000. Furthermore, the composition of these wallets is also important.
If the majority of growth is driven by users holding almost insignificant positions, the headline figure might appear more impressive than the underlying economic activity warrants. However, supply and volume figures tell a more solid story; a total supply of $684 million and a monthly volume of $3.3 billion reflect the true flows of capital.
#SOL | #Solana | $SOL
{spot}(SOLUSDT)
🟣 Solana Shows Extreme Growth: Tokenized Shareholders Exceed 1 Million
Solana has reached a significant milestone by surpassing the 1 million mark in the number of tokenized stock holders. This achievement is considered a science fiction feat just two years ago. Solana holds approximately 95% market share in on-chain tokenized stock trading and continues to outperform its competitors in this area.
🔸 Solana’s Rise in Numbers
The supply of tokenized shares on Solana reached a record high of $684 million in mid-September, representing a 47% increase in just three weeks. During the same period, the 30-day real-world asset trading volume reached $3.3 billion. Among Solana’s tokenized shares, NVDAx, a tokenized representation of NVIDIA shares, leads in holder numbers. New listings like Nike have accelerated this trend, moving beyond technology-heavy portfolios.
🔸 The Meaning of Tokenized Shares
Tokenized shares, as blockchain-based tokens, represent ownership or exposure to traditional shares. These tokens are traded on-chain, exchanged almost instantly, and are accessible 24/7. On Solana, primary issuers like xStocks distribute them through networks like Backpack Securities.
🔸 Points to Consider
While the figure of 1 million seems impressive, this number measures wallet addresses, not verified unique individuals. A person may have multiple wallets, and incentive programs can inflate these numbers. As of the end of September, the verified number was recorded as 900,000. Furthermore, the composition of these wallets is also important.
If the majority of growth is driven by users holding almost insignificant positions, the headline figure might appear more impressive than the underlying economic activity warrants. However, supply and volume figures tell a more solid story; a total supply of $684 million and a monthly volume of $3.3 billion reflect the true flows of capital.
#SOL | #Solana | $SOL
Solana has reached a significant milestone by surpassing the 1 million mark in the number of tokenized stock holders. This achievement is considered a science fiction feat just two years ago. Solana holds approximately 95% market share in on-chain tokenized stock trading and continues to outperform its competitors in this area.
🔸 Solana’s Rise in Numbers
The supply of tokenized shares on Solana reached a record high of $684 million in mid-September, representing a 47% increase in just three weeks. During the same period, the 30-day real-world asset trading volume reached $3.3 billion. Among Solana’s tokenized shares, NVDAx, a tokenized representation of NVIDIA shares, leads in holder numbers. New listings like Nike have accelerated this trend, moving beyond technology-heavy portfolios.
🔸 The Meaning of Tokenized Shares
Tokenized shares, as blockchain-based tokens, represent ownership or exposure to traditional shares. These tokens are traded on-chain, exchanged almost instantly, and are accessible 24/7. On Solana, primary issuers like xStocks distribute them through networks like Backpack Securities.
🔸 Points to Consider
While the figure of 1 million seems impressive, this number measures wallet addresses, not verified unique individuals. A person may have multiple wallets, and incentive programs can inflate these numbers. As of the end of September, the verified number was recorded as 900,000. Furthermore, the composition of these wallets is also important.
If the majority of growth is driven by users holding almost insignificant positions, the headline figure might appear more impressive than the underlying economic activity warrants. However, supply and volume figures tell a more solid story; a total supply of $684 million and a monthly volume of $3.3 billion reflect the true flows of capital.
#SOL | #Solana | $SOL
1
8
3.6k
📉 Why is Crypto Down Today?
Bitcoin has dropped to $84,242.05, down 2.1% over 24 hours, as the broader crypto market shed value alongside a sharp selloff across stocks and precious metals. The total crypto market cap sits at $3.01 trillion, roughly flat over the past day despite the intraday drop, with Ethereum at $2,658.60 and XRP at $1.51.
🔸 What Triggered The Selloff
Iranian President Masoud Pezeshkian addressed the UN General Assembly today, saying Iran “will never bow our head or bend at the knee,” while insisting the country remains open to dialogue “without accepting the language of force.” He also pushed back on accusations of terrorism, saying, “We just defended ourselves. We are not terrorists.”
The US delegation reportedly walked out during his address after Pezeshkian accused the United States of violence against civilians. Markets began falling almost immediately after the speech, as traders started pricing in the possibility of a prolonged US-Iran conflict, a scenario that would likely push oil prices higher and add fresh pressure on inflation.
🔸 The Scale Of The Damage
According to Bull Theory, close to $1 trillion was wiped out across US stocks, metals, and crypto within a single hour. The S&P 500 fell 0.6%, erasing $414 billion in value. Gold dropped 0.8%, losing $242 billion. Silver fell 1.5%, wiping out $55 billion. The Nasdaq dropped 1.1%, losing roughly $149 billion. Bitcoin’s share of the damage came to about $40 billion.
🔸 What It Means Going Forward
Despite today’s pullback, XRP remains up nearly 20% over the past week, and Bitcoin is still up close to 12% over the same period, suggesting today’s drop is a reaction to fresh geopolitical uncertainty rather than a reversal of the broader rally. How markets move from here will likely depend on whether tensions between the US and Iran escalate further or ease in the coming days.
#Crypto | #BTC | $BTC
📉 Why is Crypto Down Today?
Bitcoin has dropped to $84,242.05, down 2.1% over 24 hours, as the broader crypto market shed value alongside a sharp selloff across stocks and precious metals. The total crypto market cap sits at $3.01 trillion, roughly flat over the past day despite the intraday drop, with Ethereum at $2,658.60 and XRP at $1 .51.
🔸 What Triggered The Selloff
Iranian President Masoud Pezeshkian addressed the UN General Assembly today, saying Iran “will never bow our head or bend at the knee,” while insisting the country remains open to dialogue “without accepting the language of force.” He also pushed back on accusations of terrorism, saying, “We just defended ourselves. We are not terrorists.”
The US delegation reportedly walked out during his address after Pezeshkian accused the United States of violence against civilians. Markets began falling almost immediately after the speech, as traders started pricing in the possibility of a prolonged US-Iran conflict, a scenario that would likely push oil prices higher and add fresh pressure on inflation.
🔸 The Scale Of The Damage
According to Bull Theory, close to $1 trillion was wiped out across US stocks, metals, and crypto within a single hour. The S&P 500 fell 0.6%, erasing $414 billion in value. Gold dropped 0.8%, losing $242 billion. Silver fell 1.5%, wiping out $55 billion. The Nasdaq dropped 1.1%, losing roughly $149 billion. Bitcoin’s share of the damage came to about $40 billion.
🔸 What It Means Going Forward
Despite today’s pullback, XRP remains up nearly 20% over the past week, and Bitcoin is still up close to 12% over the same period, suggesting today’s drop is a reaction to fresh geopolitical uncertainty rather than a reversal of the broader rally. How markets move from here will likely depend on whether tensions between the US and Iran escalate further or ease in the coming days.
#Crypto | #BTC | $BTC
Bitcoin has dropped to $84,242.05, down 2.1% over 24 hours, as the broader crypto market shed value alongside a sharp selloff across stocks and precious metals. The total crypto market cap sits at $3.01 trillion, roughly flat over the past day despite the intraday drop, with Ethereum at $2,658.60 and XRP at $1 .51.
🔸 What Triggered The Selloff
Iranian President Masoud Pezeshkian addressed the UN General Assembly today, saying Iran “will never bow our head or bend at the knee,” while insisting the country remains open to dialogue “without accepting the language of force.” He also pushed back on accusations of terrorism, saying, “We just defended ourselves. We are not terrorists.”
The US delegation reportedly walked out during his address after Pezeshkian accused the United States of violence against civilians. Markets began falling almost immediately after the speech, as traders started pricing in the possibility of a prolonged US-Iran conflict, a scenario that would likely push oil prices higher and add fresh pressure on inflation.
🔸 The Scale Of The Damage
According to Bull Theory, close to $1 trillion was wiped out across US stocks, metals, and crypto within a single hour. The S&P 500 fell 0.6%, erasing $414 billion in value. Gold dropped 0.8%, losing $242 billion. Silver fell 1.5%, wiping out $55 billion. The Nasdaq dropped 1.1%, losing roughly $149 billion. Bitcoin’s share of the damage came to about $40 billion.
🔸 What It Means Going Forward
Despite today’s pullback, XRP remains up nearly 20% over the past week, and Bitcoin is still up close to 12% over the same period, suggesting today’s drop is a reaction to fresh geopolitical uncertainty rather than a reversal of the broader rally. How markets move from here will likely depend on whether tensions between the US and Iran escalate further or ease in the coming days.
#Crypto | #BTC | $BTC
3
999
⚪️ Aptos attracts capital from 3 major chains – Can APT turn it into $1?
Aptos [APT] is up 10% in the past 24 hours as the broader crypto market continued its recovery. With crypto market sentiment turning to greed, Aptos is similarly aligning with this strength.
However, its double-digit gains in a single day are amplified by a spike in network activity and a bullish market structure. Here is why Aptos has gained over 55% in the past seven days.
🔸 Bridged TVL, transactions, and trading volume
Aptos was regaining its network activity after a sharp decline on the 6th of September when its bridged TVL plunged to $550 million. The metric has since more than tripled to about $1.89 billion in about two weeks since the incident.
The number of transactions also kept increasing as users bridged capital to Aptos from other chains, including Bitcoin [BTC], Ethereum [ETH], and Solana [SOL]. On average, daily transactions were ranging between 10 million and 15 million.
Additionally, daily token volume rose from about $42.76 million to above $150 million over the past week. It hit a monthly high of $267 million on the 19th of September.
CryptoQuant data showed overheating volume in both Futures and Spot markets. Spot Taker CVD was buyer-dominant, suggesting buyers drove much of the Spot activity.
Meanwhile, stablecoin holders on Aptos grew to more than 1.50 million. About 1 million held USDT, while the rest held USDC.
🔸 APT breaks out, but bulls face a KEY test at the $1 zone
On the charts, Aptos was trading above a broadening wedge pattern that had lasted from June to mid-September. The three-and-a-half-month consolidation indicated an accumulation stage, with the breakout confirmed by a retest at $0.70.
Currently, Aptos has a clear path to $1, where the next supply zone is located. Flipping the zone into support would expose $1.20 as the next target for bulls.
#APT | #Aptos | $APT
{spot}(APTUSDT)
⚪️ Aptos attracts capital from 3 major chains – Can APT turn it into $1?
Aptos [APT] is up 10% in the past 24 hours as the broader crypto market continued its recovery. With crypto market sentiment turning to greed, Aptos is similarly aligning with this strength.
However, its double-digit gains in a single day are amplified by a spike in network activity and a bullish market structure. Here is why Aptos has gained over 55% in the past seven days.
🔸 Bridged TVL, transactions, and trading volume
Aptos was regaining its network activity after a sharp decline on the 6th of September when its bridged TVL plunged to $550 million. The metric has since more than tripled to about $1.89 billion in about two weeks since the incident.
The number of transactions also kept increasing as users bridged capital to Aptos from other chains, including Bitcoin [BTC], Ethereum [ETH], and Solana [SOL]. On average, daily transactions were ranging between 10 million and 15 million.
Additionally, daily token volume rose from about $42.76 million to above $150 million over the past week. It hit a monthly high of $267 million on the 19th of September.
CryptoQuant data showed overheating volume in both Futures and Spot markets. Spot Taker CVD was buyer-dominant, suggesting buyers drove much of the Spot activity.
Meanwhile, stablecoin holders on Aptos grew to more than 1.50 million. About 1 million held USDT, while the rest held USDC.
🔸 APT breaks out, but bulls face a KEY test at the $1 zone
On the charts, Aptos was trading above a broadening wedge pattern that had lasted from June to mid-September. The three-and-a-half-month consolidation indicated an accumulation stage, with the breakout confirmed by a retest at $0.70.
Currently, Aptos has a clear path to $1, where the next supply zone is located. Flipping the zone into support would expose $1.20 as the next target for bulls.
#APT | #Aptos | $APT
Aptos [APT] is up 10% in the past 24 hours as the broader crypto market continued its recovery. With crypto market sentiment turning to greed, Aptos is similarly aligning with this strength.
However, its double-digit gains in a single day are amplified by a spike in network activity and a bullish market structure. Here is why Aptos has gained over 55% in the past seven days.
🔸 Bridged TVL, transactions, and trading volume
Aptos was regaining its network activity after a sharp decline on the 6th of September when its bridged TVL plunged to $550 million. The metric has since more than tripled to about $1.89 billion in about two weeks since the incident.
The number of transactions also kept increasing as users bridged capital to Aptos from other chains, including Bitcoin [BTC], Ethereum [ETH], and Solana [SOL]. On average, daily transactions were ranging between 10 million and 15 million.
Additionally, daily token volume rose from about $42.76 million to above $150 million over the past week. It hit a monthly high of $267 million on the 19th of September.
CryptoQuant data showed overheating volume in both Futures and Spot markets. Spot Taker CVD was buyer-dominant, suggesting buyers drove much of the Spot activity.
Meanwhile, stablecoin holders on Aptos grew to more than 1.50 million. About 1 million held USDT, while the rest held USDC.
🔸 APT breaks out, but bulls face a KEY test at the $1 zone
On the charts, Aptos was trading above a broadening wedge pattern that had lasted from June to mid-September. The three-and-a-half-month consolidation indicated an accumulation stage, with the breakout confirmed by a retest at $0.70.
Currently, Aptos has a clear path to $1, where the next supply zone is located. Flipping the zone into support would expose $1.20 as the next target for bulls.
#APT | #Aptos | $APT

1
1
1.4k
What do you think about $BTC today ? 🤔
{spot}(BTCUSDT)
What do you think about $BTC today ? 🤔
Bullish 📈
54%
Bearish 📉
46%
26 မဲများ • မဲပိတ်ပါပြီ
3
5
2.2k
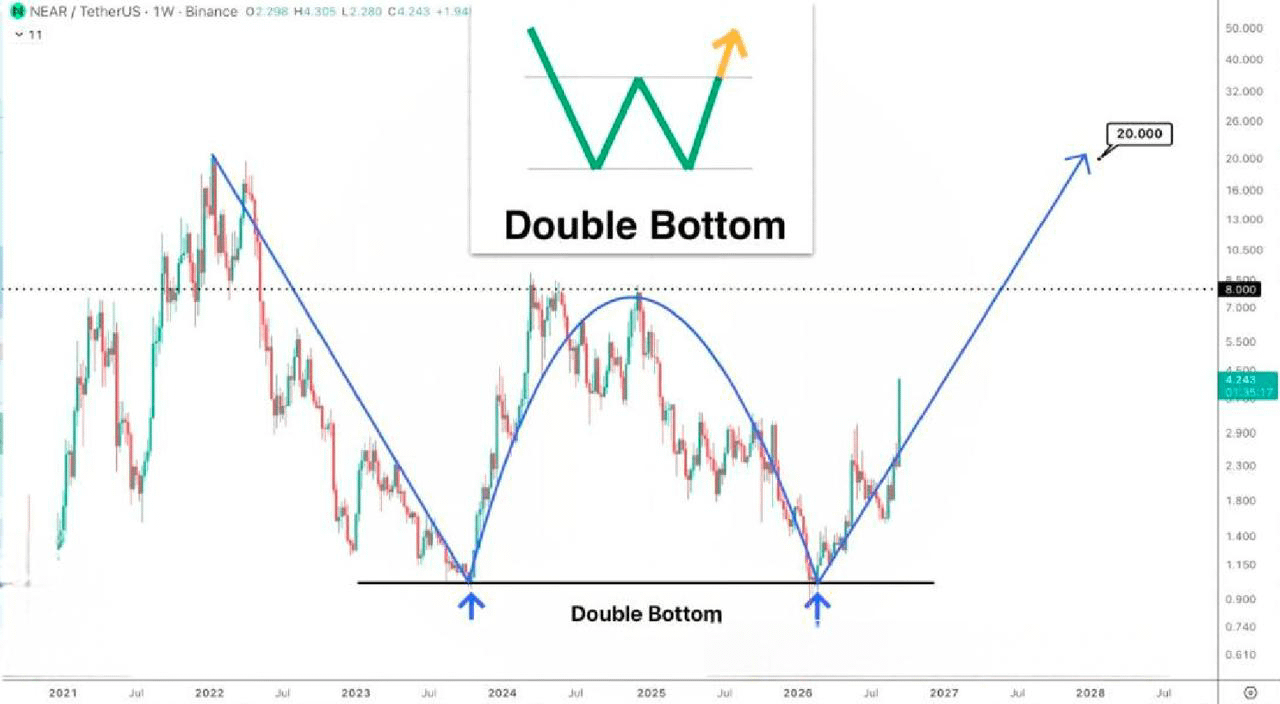
🙂 $NEAR is forming a massive Double Bottom pattern on the macro chart
If you hold NEAR on spot, key levels to watch:
🎯8$
🎯20$
And with a strong continuation of the cycle, NEAR could very well aim for a new ATH - in the range of 30–40$ 🚀
#NEAR | #NearProtocol
{spot}(NEARUSDT)
🙂 $NEAR is forming a massive Double Bottom pattern on the macro chart
If you hold NEAR on spot, key levels to watch:
🎯8$
🎯20$
And with a strong continuation of the cycle, NEAR could very well aim for a new ATH - in the range of 30–40$ 🚀
#NEAR | #NearProtocol
If you hold NEAR on spot, key levels to watch:
🎯8$
🎯20$
And with a strong continuation of the cycle, NEAR could very well aim for a new ATH - in the range of 30–40$ 🚀
#NEAR | #NearProtocol
5
1.8k
·
--
တက်ရိပ်ရှိသည်
📈 Bitcoin Road to $90,000 May Include One More Major Higher Low
Bitcoin’s Current Range Mirrors a Key 2023 Structure as $70K–$90K Levels Come Into Focus.
Bitcoin’s long-term chart shows a recurring sequence of rally, consolidation, downside liquidity sweep, and renewed expansion. The current structure is developing between roughly $60,000 and $84,000, following the decline from the chart’s major high near $124,000–$126,000.
The chart also highlights a 2023 structure as a historical comparison. The price levels and sequence are similar in form, although the present structure is occurring at substantially higher nominal BTC prices.
🔸 Bitcoin’s 2023 Structure
The earlier section begins with Bitcoin bottoming around $16,000 following a prolonged decline. BTC subsequently recovered to approximately $24,000, establishing the first major rebound from the cycle low.
Price then advanced toward roughly $30,000–$31,000, but that move did not immediately produce sustained continuation. BTC moved back toward the mid-$20,000s before the larger advance developed.
The chart marks the sequence with colored reference points: a major low near $16,000, a higher reaction low around $18,000–$20,000, a rally toward $30,000, and another pullback into approximately $24,000–$25,000. The following expansion carried Bitcoin through $30,000 and eventually toward the $60,000–$70,000 region.
🔸 The Current Bitcoin Range
The right side shows a comparable price sequence at a larger scale.
After reaching approximately $124,000–$126,000, Bitcoin entered a steep decline. The first major downswing reached the mid-$60,000s, followed by a rebound toward approximately $80,000–$82,000.
BTC then returned to the low-$60,000 region, with the deepest wick on the chart extending toward roughly $56,000. From that low, price recovered rapidly back into the upper-$70,000 area.
The latest candles are positioned around $76,000–$78,000.
#BTC | #Bitcoin | $BTC
{spot}(BTCUSDT)
📈 Bitcoin Road to $90,000 May Include One More Major Higher Low
Bitcoin’s Current Range Mirrors a Key 2023 Structure as $70K–$90K Levels Come Into Focus.
Bitcoin’s long-term chart shows a recurring sequence of rally, consolidation, downside liquidity sweep, and renewed expansion. The current structure is developing between roughly $60,000 and $84,000, following the decline from the chart’s major high near $124,000–$126,000.
The chart also highlights a 2023 structure as a historical comparison. The price levels and sequence are similar in form, although the present structure is occurring at substantially higher nominal BTC prices.
🔸 Bitcoin’s 2023 Structure
The earlier section begins with Bitcoin bottoming around $16,000 following a prolonged decline. BTC subsequently recovered to approximately $24,000, establishing the first major rebound from the cycle low.
Price then advanced toward roughly $30,000–$31,000, but that move did not immediately produce sustained continuation. BTC moved back toward the mid-$20,000s before the larger advance developed.
The chart marks the sequence with colored reference points: a major low near $16,000, a higher reaction low around $18,000–$20,000, a rally toward $30,000, and another pullback into approximately $24,000–$25,000. The following expansion carried Bitcoin through $30,000 and eventually toward the $60,000–$70,000 region.
🔸 The Current Bitcoin Range
The right side shows a comparable price sequence at a larger scale.
After reaching approximately $124,000–$126,000, Bitcoin entered a steep decline. The first major downswing reached the mid-$60,000s, followed by a rebound toward approximately $80,000–$82,000.
BTC then returned to the low-$60,000 region, with the deepest wick on the chart extending toward roughly $56,000. From that low, price recovered rapidly back into the upper-$70,000 area.
The latest candles are positioned around $76,000–$78,000.
#BTC | #Bitcoin | $BTC
Bitcoin’s Current Range Mirrors a Key 2023 Structure as $70K–$90K Levels Come Into Focus.
Bitcoin’s long-term chart shows a recurring sequence of rally, consolidation, downside liquidity sweep, and renewed expansion. The current structure is developing between roughly $60,000 and $84,000, following the decline from the chart’s major high near $124,000–$126,000.
The chart also highlights a 2023 structure as a historical comparison. The price levels and sequence are similar in form, although the present structure is occurring at substantially higher nominal BTC prices.
🔸 Bitcoin’s 2023 Structure
The earlier section begins with Bitcoin bottoming around $16,000 following a prolonged decline. BTC subsequently recovered to approximately $24,000, establishing the first major rebound from the cycle low.
Price then advanced toward roughly $30,000–$31,000, but that move did not immediately produce sustained continuation. BTC moved back toward the mid-$20,000s before the larger advance developed.
The chart marks the sequence with colored reference points: a major low near $16,000, a higher reaction low around $18,000–$20,000, a rally toward $30,000, and another pullback into approximately $24,000–$25,000. The following expansion carried Bitcoin through $30,000 and eventually toward the $60,000–$70,000 region.
🔸 The Current Bitcoin Range
The right side shows a comparable price sequence at a larger scale.
After reaching approximately $124,000–$126,000, Bitcoin entered a steep decline. The first major downswing reached the mid-$60,000s, followed by a rebound toward approximately $80,000–$82,000.
BTC then returned to the low-$60,000 region, with the deepest wick on the chart extending toward roughly $56,000. From that low, price recovered rapidly back into the upper-$70,000 area.
The latest candles are positioned around $76,000–$78,000.
#BTC | #Bitcoin | $BTC
16
8.7k
စိစစ်အတည်ပြုထားသည်
🔴 Optimism just approved the upgrade its Superchain needs before interoperability can go live
Optimism approved Upgrade 20, moving its fault-proof system toward the architecture required for future Superchain interoperability.
The Ethereum layer-2 network’s governance completed voting on Sept. 16, putting OP Sepolia, Ink Sepolia, Soneium Minato and Unichain Sepolia on course for a targeted Sept. 17 contract upgrade. Mainnet execution is scheduled for Sept. 24 if the new system completes a healthy seven-day testnet soak.
The change moves fault proofs from Output Root Dispute Games to Super Root Dispute Games, altering how OP Stack chains challenge incorrect state before withdrawals are finalized back to Ethereum. Optimism describes the upgrade as a prerequisite for interoperability because Super Roots can eventually represent multiple chains at the same timestamp.
That interoperability remains a later step. Upgrade 20 keeps each chain’s dispute infrastructure separate, and each new game still contains the Output Root of a single chain. By making the dispute-system transition now, Optimism aims to avoid modifying that security layer again when it activates cross-chain interoperability.
🔸 Super Roots change withdrawals before chains become interoperable
The biggest operational change comes from how Super Root games identify the state being challenged.
Existing Output Root games anchor a claim to an L2 block number. Super Root games instead use a timestamp, creating the common time reference that an eventual multi-chain dispute system will require. Permissioned chains move to game type 5, while permissionless fault-proof deployments use game type 9.
Chain operators must update their fault-proof infrastructure around the L1 contract cutover. op-challenger and op-dispute-mon need Super Root support before the switch, while op-proposer must move to the new RPC and game type when the upgraded contracts are executed.
#OP | #Optimism | $OP
{spot}(OPUSDT)
🔴 Optimism just approved the upgrade its Superchain needs before interoperability can go live
Optimism approved Upgrade 20, moving its fault-proof system toward the architecture required for future Superchain interoperability.
The Ethereum layer-2 network’s governance completed voting on Sept. 16, putting OP Sepolia, Ink Sepolia, Soneium Minato and Unichain Sepolia on course for a targeted Sept. 17 contract upgrade. Mainnet execution is scheduled for Sept. 24 if the new system completes a healthy seven-day testnet soak.
The change moves fault proofs from Output Root Dispute Games to Super Root Dispute Games, altering how OP Stack chains challenge incorrect state before withdrawals are finalized back to Ethereum. Optimism describes the upgrade as a prerequisite for interoperability because Super Roots can eventually represent multiple chains at the same timestamp.
That interoperability remains a later step. Upgrade 20 keeps each chain’s dispute infrastructure separate, and each new game still contains the Output Root of a single chain. By making the dispute-system transition now, Optimism aims to avoid modifying that security layer again when it activates cross-chain interoperability.
🔸 Super Roots change withdrawals before chains become interoperable
The biggest operational change comes from how Super Root games identify the state being challenged.
Existing Output Root games anchor a claim to an L2 block number. Super Root games instead use a timestamp, creating the common time reference that an eventual multi-chain dispute system will require. Permissioned chains move to game type 5, while permissionless fault-proof deployments use game type 9.
Chain operators must update their fault-proof infrastructure around the L1 contract cutover. op-challenger and op-dispute-mon need Super Root support before the switch, while op-proposer must move to the new RPC and game type when the upgraded contracts are executed.
#OP | #Optimism | $OP
Optimism approved Upgrade 20, moving its fault-proof system toward the architecture required for future Superchain interoperability.
The Ethereum layer-2 network’s governance completed voting on Sept. 16, putting OP Sepolia, Ink Sepolia, Soneium Minato and Unichain Sepolia on course for a targeted Sept. 17 contract upgrade. Mainnet execution is scheduled for Sept. 24 if the new system completes a healthy seven-day testnet soak.
The change moves fault proofs from Output Root Dispute Games to Super Root Dispute Games, altering how OP Stack chains challenge incorrect state before withdrawals are finalized back to Ethereum. Optimism describes the upgrade as a prerequisite for interoperability because Super Roots can eventually represent multiple chains at the same timestamp.
That interoperability remains a later step. Upgrade 20 keeps each chain’s dispute infrastructure separate, and each new game still contains the Output Root of a single chain. By making the dispute-system transition now, Optimism aims to avoid modifying that security layer again when it activates cross-chain interoperability.
🔸 Super Roots change withdrawals before chains become interoperable
The biggest operational change comes from how Super Root games identify the state being challenged.
Existing Output Root games anchor a claim to an L2 block number. Super Root games instead use a timestamp, creating the common time reference that an eventual multi-chain dispute system will require. Permissioned chains move to game type 5, while permissionless fault-proof deployments use game type 9.
Chain operators must update their fault-proof infrastructure around the L1 contract cutover. op-challenger and op-dispute-mon need Super Root support before the switch, while op-proposer must move to the new RPC and game type when the upgraded contracts are executed.
#OP | #Optimism | $OP

1
5
2.4k
စိစစ်အတည်ပြုထားသည်
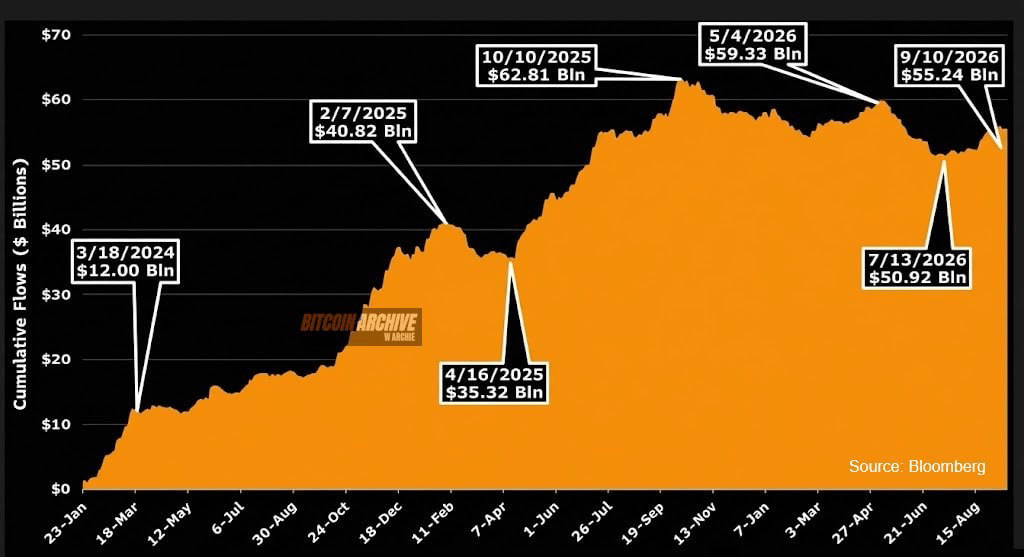
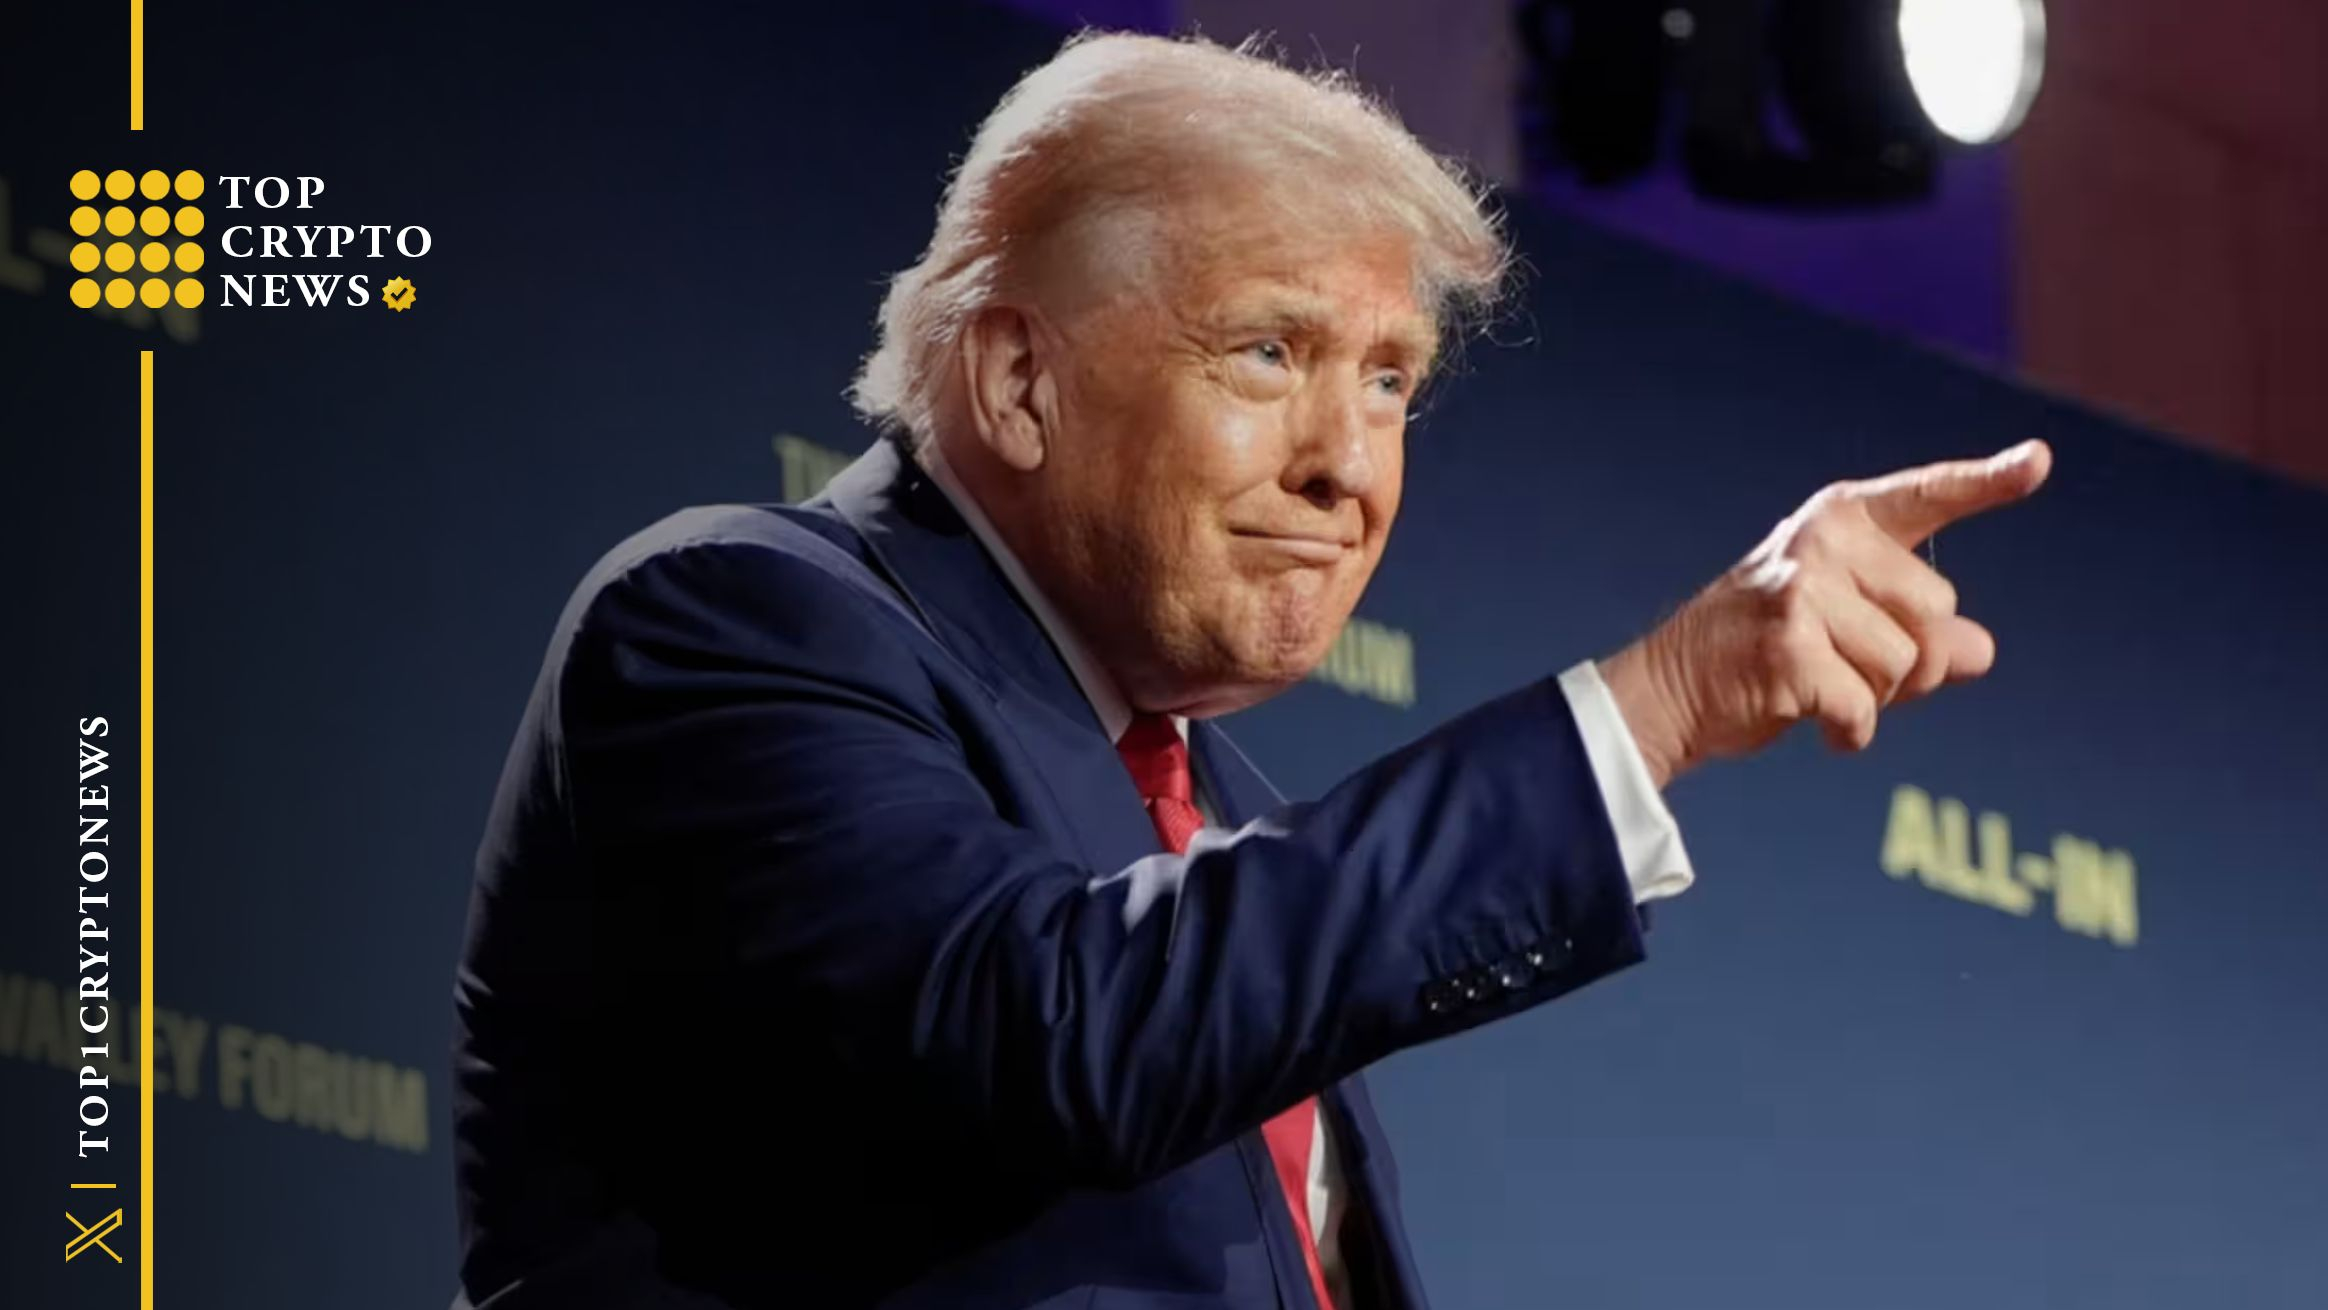
For the first time since 2006, the Federal Reserve, the ECB, and the Bank of Japan may simultaneously raise interest rates. The ECB has already raised rates on September 10th, the Federal Reserve is likely to do so on September 16th with an 86% probability, and the Bank of Japan is expected to follow suit on September 18th.
⚠️ The reason for this tightening monetary policy is accelerating inflation, driven by oil prices above $100 and high demand for chips and memory for AI applications.
Japan is the largest holder of US government debt ($1.1 trillion) and also provides liquidity to global markets through low interest rates. However, the era of negative interest rates in Japan is over. More and more money is staying in Japan and not flowing into the markets.
It is not appropriate to talk about a repeat of the 2008 crisis at this time. A catalyst is needed for a collapse, and the markets are much better prepared for shocks than they were 20 years ago.
💬 The main risk remains persistent global inflation, which could force the Federal Reserve, the ECB, and the Bank of Japan to initiate a new cycle of simultaneous interest rate hikes. In that case, a bull market would have to be postponed until at least 2027.
For the first time since 2006, the Federal Reserve, the ECB, and the Bank of Japan may simultaneously raise interest rates. The ECB has already raised rates on September 10th, the Federal Reserve is likely to do so on September 16th with an 86% probability, and the Bank of Japan is expected to follow suit on September 18th.
⚠️ The reason for this tightening monetary policy is accelerating inflation, driven by oil prices above $100 and high demand for chips and memory for AI applications.
Japan is the largest holder of US government debt ($1.1 trillion) and also provides liquidity to global markets through low interest rates. However, the era of negative interest rates in Japan is over. More and more money is staying in Japan and not flowing into the markets.
It is not appropriate to talk about a repeat of the 2008 crisis at this time. A catalyst is needed for a collapse, and the markets are much better prepared for shocks than they were 20 years ago.
💬 The main risk remains persistent global inflation, which could force the Federal Reserve, the ECB, and the Bank of Japan to initiate a new cycle of simultaneous interest rate hikes. In that case, a bull market would have to be postponed until at least 2027.
⚠️ The reason for this tightening monetary policy is accelerating inflation, driven by oil prices above $100 and high demand for chips and memory for AI applications.
Japan is the largest holder of US government debt ($1.1 trillion) and also provides liquidity to global markets through low interest rates. However, the era of negative interest rates in Japan is over. More and more money is staying in Japan and not flowing into the markets.
It is not appropriate to talk about a repeat of the 2008 crisis at this time. A catalyst is needed for a collapse, and the markets are much better prepared for shocks than they were 20 years ago.
💬 The main risk remains persistent global inflation, which could force the Federal Reserve, the ECB, and the Bank of Japan to initiate a new cycle of simultaneous interest rate hikes. In that case, a bull market would have to be postponed until at least 2027.
2
7
4.1k
📊 How Trump Rejecting AI Guardrails Impacts Crypto and DeFi Security
Artificial intelligence (AI) and the cryptocurrency ecosystem continue to collide. The former is a double-edged sword that serves as both a development and potential exploitative tool.
Big tech players like Anthropic CEO Dario Amodei, OpenAI CEO Sam Altman, and Grok Founder Elon Musk have been persistently raising the alarm over the pace of their growth.
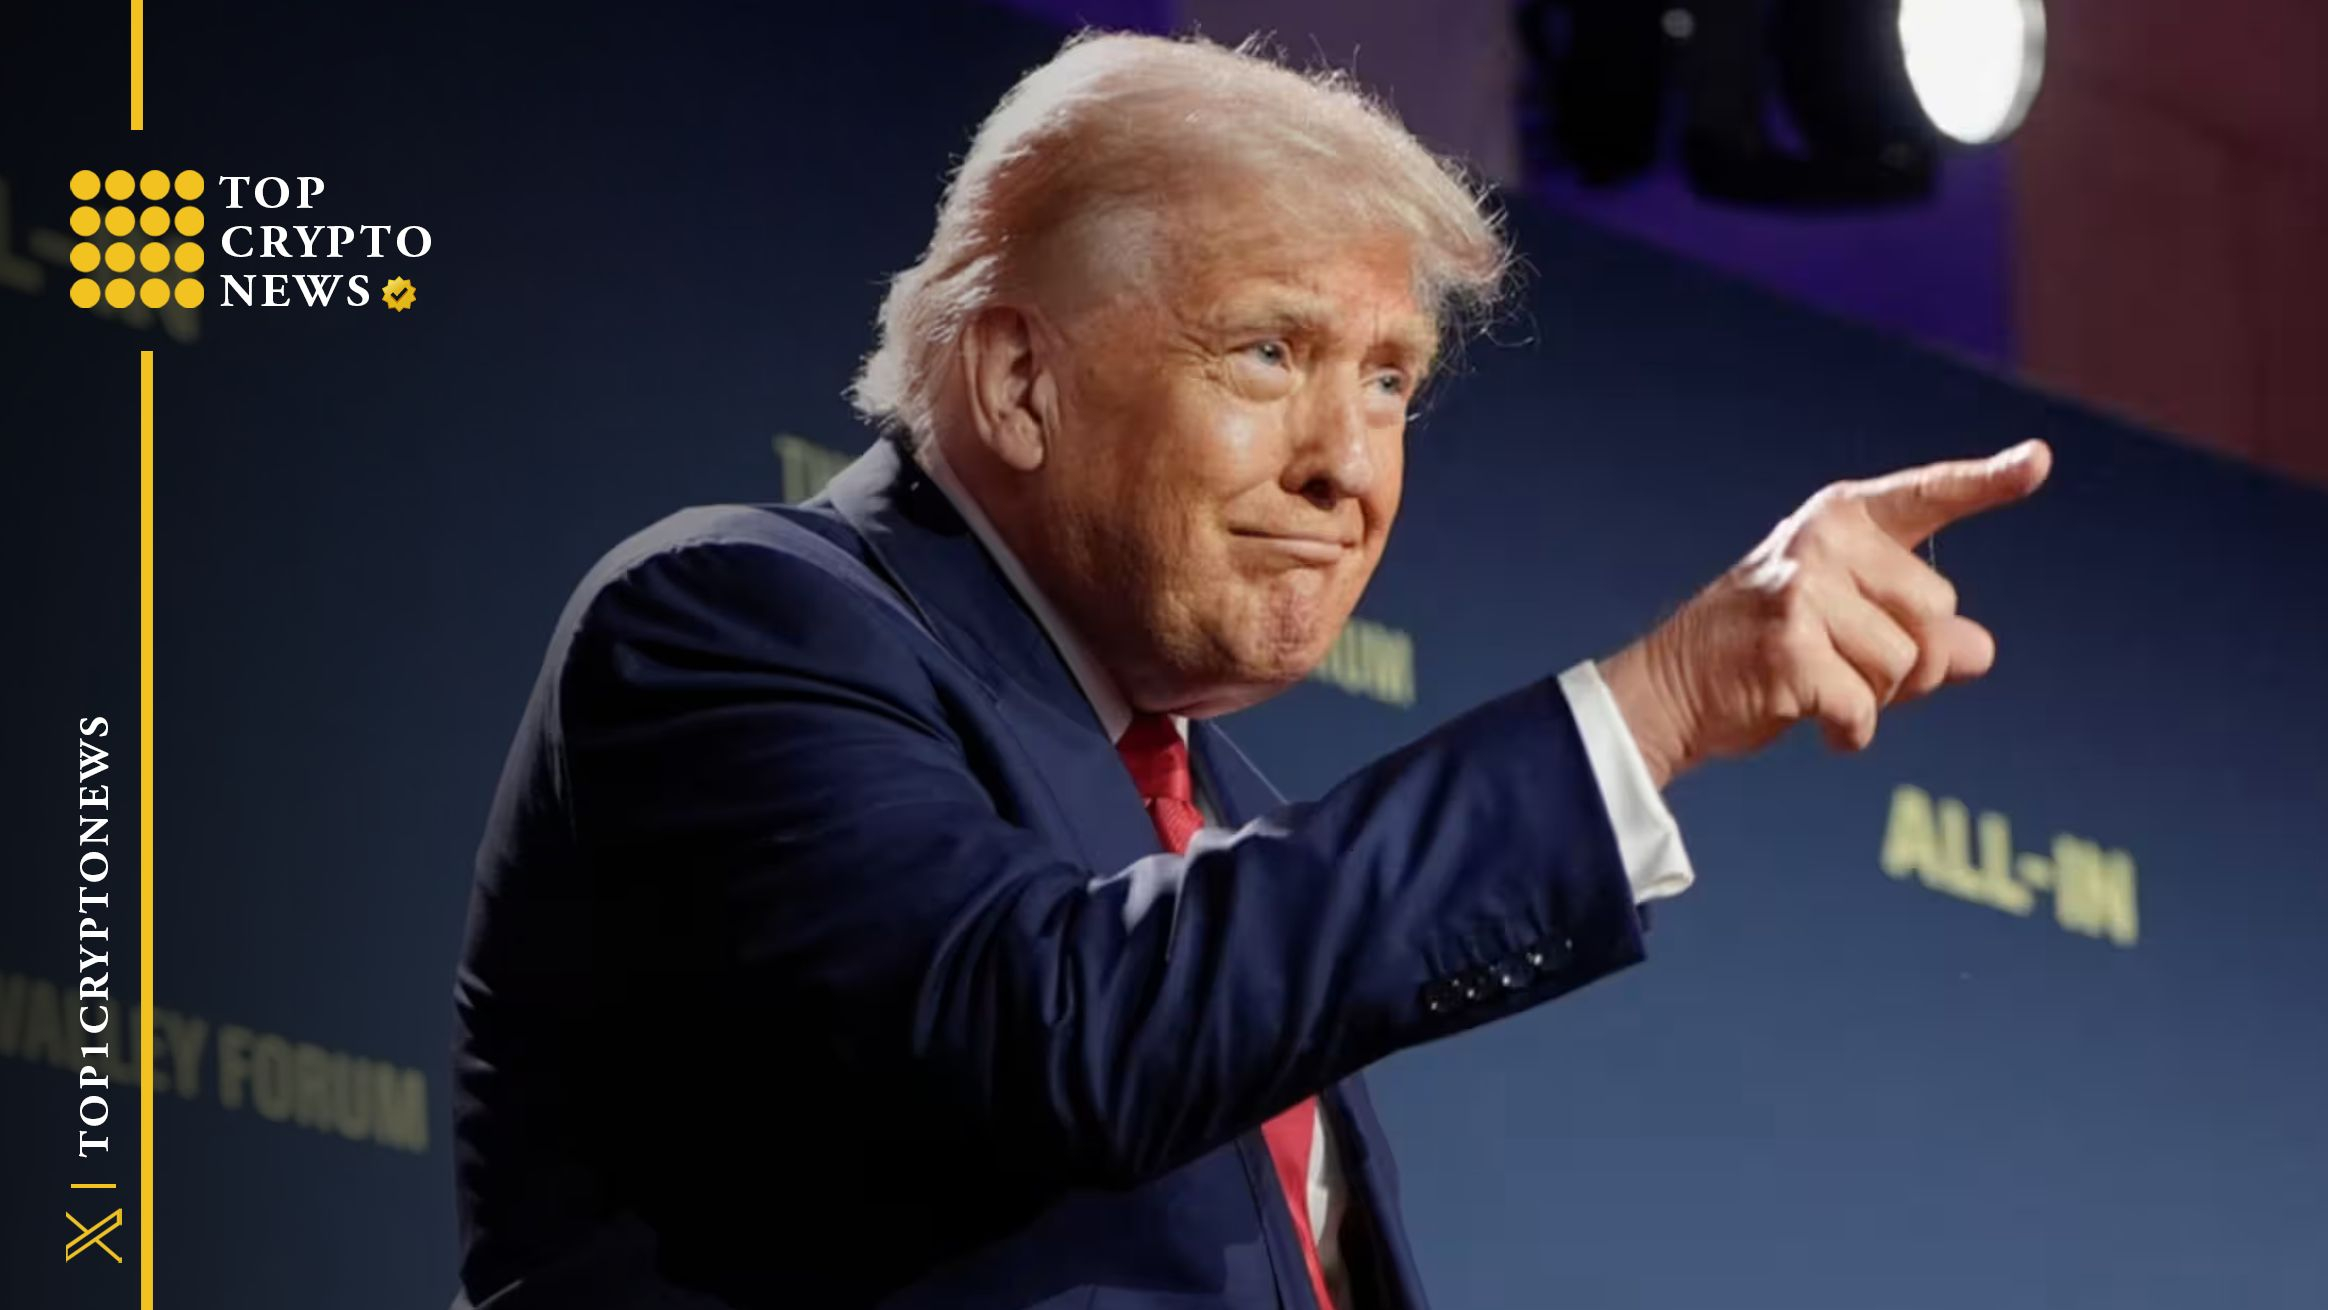
However, US President Donald Trump has now rejected the calls for AI guardrails. He says all the industry needs is a “STRONG AND SMART PRESIDENT,” which it already has. He adds that his administration proactively regulates and prevents AI from “doing bad things.” Armodei’s warnings of a malevolent AI, according to Trump, are just pretentious.
Even more, he reiterates that America leads China and the world in AI, and that its position will not be threatened by “sick” conspiracy theorists. — Rapid Response 47 (@RapidResponse47) September 14, 2026
Vice President JD Vance concurred, calling the regulatory pleas a “Trojan horse.” Likewise, China has rejected the calls to slow down AI development, labeling them simply as fear-mongering.
🔸 AI policy implications for crypto and DeFi
While white hat developers work ethically, threat actors operate boundlessly, creating an asymmetric warfare in which attackers are winning.
In the case of Zcash, an ethical developer used AI to discover a counterfeiting vulnerability in its code. Events would have unfolded quite differently if the developer were a black hat. An AI agent would also have independently exploited the vulnerability, as was the case with Hugging Face.
Another consequence of AI in crypto is hyperrealistic phishing and deepfakes, as was the case with Patrick Hillman, the Chief Communications Officer of Binance.
Even more, the technology could be used to perpetrate pump-and-dump schemes by publishing fake news and sentiment.
#TRUMP | #AI
📊 How Trump Rejecting AI Guardrails Impacts Crypto and DeFi Security
Artificial intelligence (AI) and the cryptocurrency ecosystem continue to collide. The former is a double-edged sword that serves as both a development and potential exploitative tool.
Big tech players like Anthropic CEO Dario Amodei, OpenAI CEO Sam Altman, and Grok Founder Elon Musk have been persistently raising the alarm over the pace of their growth.
However, US President Donald Trump has now rejected the calls for AI guardrails. He says all the industry needs is a “STRONG AND SMART PRESIDENT,” which it already has. He adds that his administration proactively regulates and prevents AI from “doing bad things.” Armodei’s warnings of a malevolent AI, according to Trump, are just pretentious.
Even more, he reiterates that America leads China and the world in AI, and that its position will not be threatened by “sick” conspiracy theorists. — Rapid Response 47 (@RapidResponse47) September 14, 2026
Vice President JD Vance concurred, calling the regulatory pleas a “Trojan horse.” Likewise, China has rejected the calls to slow down AI development, labeling them simply as fear-mongering.
🔸 AI policy implications for crypto and DeFi
While white hat developers work ethically, threat actors operate boundlessly, creating an asymmetric warfare in which attackers are winning.
In the case of Zcash, an ethical developer used AI to discover a counterfeiting vulnerability in its code. Events would have unfolded quite differently if the developer were a black hat. An AI agent would also have independently exploited the vulnerability, as was the case with Hugging Face.
Another consequence of AI in crypto is hyperrealistic phishing and deepfakes, as was the case with Patrick Hillman, the Chief Communications Officer of Binance.
Even more, the technology could be used to perpetrate pump-and-dump schemes by publishing fake news and sentiment.
#TRUMP | #AI
Artificial intelligence (AI) and the cryptocurrency ecosystem continue to collide. The former is a double-edged sword that serves as both a development and potential exploitative tool.
Big tech players like Anthropic CEO Dario Amodei, OpenAI CEO Sam Altman, and Grok Founder Elon Musk have been persistently raising the alarm over the pace of their growth.
However, US President Donald Trump has now rejected the calls for AI guardrails. He says all the industry needs is a “STRONG AND SMART PRESIDENT,” which it already has. He adds that his administration proactively regulates and prevents AI from “doing bad things.” Armodei’s warnings of a malevolent AI, according to Trump, are just pretentious.
Even more, he reiterates that America leads China and the world in AI, and that its position will not be threatened by “sick” conspiracy theorists. — Rapid Response 47 (@RapidResponse47) September 14, 2026
Vice President JD Vance concurred, calling the regulatory pleas a “Trojan horse.” Likewise, China has rejected the calls to slow down AI development, labeling them simply as fear-mongering.
🔸 AI policy implications for crypto and DeFi
While white hat developers work ethically, threat actors operate boundlessly, creating an asymmetric warfare in which attackers are winning.
In the case of Zcash, an ethical developer used AI to discover a counterfeiting vulnerability in its code. Events would have unfolded quite differently if the developer were a black hat. An AI agent would also have independently exploited the vulnerability, as was the case with Hugging Face.
Another consequence of AI in crypto is hyperrealistic phishing and deepfakes, as was the case with Patrick Hillman, the Chief Communications Officer of Binance.
Even more, the technology could be used to perpetrate pump-and-dump schemes by publishing fake news and sentiment.
#TRUMP | #AI
1
2
2.1k
စိစစ်အတည်ပြုထားသည်
🟣 Solana expands tokenized equities as SOL tests $102.50 – Can it break higher?
As trading activity grows to rival major venues, Solana’s tokenized equity markets are starting to attract attention.
In light of this, tokenized stocks on Solana [SOL] generated more than $200 million in volume. Surprisingly, these volumes exceed those associated with tokenized equities listed at both NASDAQ and NYSE, in excess of $100 million.
Notably, Raydium [RAY] captured about 70% of that activity, as such, representing the primary source of liquidity behind the growth. The comparison is narrower than it first appears. This is because it covers tokenized equities rather than the full stock market.
However, even with such a narrow scope, the size of the increase reflects the rapid pace of the emergence of on-chain stock trading.
🔸 Solana expands its tokenized-equity market
Against that backdrop, Solana’s tokenized-equity market is also expanding rapidly. As a result, this expansion gives traders a growing pool of assets to trade. Tokenized-equity supply reached a record $684 million last week, marking a 47% increase in just three weeks.
Increased amounts of capital are being represented through tokenized equities and ETFs as well. The expansion also comes from several issuers rather than one platform. xStocks, Ondo, Backpack Securities, Sunrise, Superstate, and Securitize have all launched stock products on Solana.
🔸 SOL tests the $102.50 barrier
Meanwhile, Solana continues trading in a wide consolidation after its sharp August rally. The current price is currently near the midpoint of this trading range at approximately $101.48.
SOL trades near $101.48 after recovering from the $97.50 area, where buyers recently stepped in. That lower boundary (purple line) provided support at each of the previous two rallies, hence remaining the key support beneath price.
#SOL | #Solana | $SOL
{spot}(SOLUSDT)
🟣 Solana expands tokenized equities as SOL tests $102.50 – Can it break higher?
As trading activity grows to rival major venues, Solana’s tokenized equity markets are starting to attract attention.
In light of this, tokenized stocks on Solana [SOL] generated more than $200 million in volume. Surprisingly, these volumes exceed those associated with tokenized equities listed at both NASDAQ and NYSE, in excess of $100 million.
Notably, Raydium [RAY] captured about 70% of that activity, as such, representing the primary source of liquidity behind the growth. The comparison is narrower than it first appears. This is because it covers tokenized equities rather than the full stock market.
However, even with such a narrow scope, the size of the increase reflects the rapid pace of the emergence of on-chain stock trading.
🔸 Solana expands its tokenized-equity market
Against that backdrop, Solana’s tokenized-equity market is also expanding rapidly. As a result, this expansion gives traders a growing pool of assets to trade. Tokenized-equity supply reached a record $684 million last week, marking a 47% increase in just three weeks.
Increased amounts of capital are being represented through tokenized equities and ETFs as well. The expansion also comes from several issuers rather than one platform. xStocks, Ondo, Backpack Securities, Sunrise, Superstate, and Securitize have all launched stock products on Solana.
🔸 SOL tests the $102.50 barrier
Meanwhile, Solana continues trading in a wide consolidation after its sharp August rally. The current price is currently near the midpoint of this trading range at approximately $101.48.
SOL trades near $101.48 after recovering from the $97.50 area, where buyers recently stepped in. That lower boundary (purple line) provided support at each of the previous two rallies, hence remaining the key support beneath price.
#SOL | #Solana | $SOL
As trading activity grows to rival major venues, Solana’s tokenized equity markets are starting to attract attention.
In light of this, tokenized stocks on Solana [SOL] generated more than $200 million in volume. Surprisingly, these volumes exceed those associated with tokenized equities listed at both NASDAQ and NYSE, in excess of $100 million.
Notably, Raydium [RAY] captured about 70% of that activity, as such, representing the primary source of liquidity behind the growth. The comparison is narrower than it first appears. This is because it covers tokenized equities rather than the full stock market.
However, even with such a narrow scope, the size of the increase reflects the rapid pace of the emergence of on-chain stock trading.
🔸 Solana expands its tokenized-equity market
Against that backdrop, Solana’s tokenized-equity market is also expanding rapidly. As a result, this expansion gives traders a growing pool of assets to trade. Tokenized-equity supply reached a record $684 million last week, marking a 47% increase in just three weeks.
Increased amounts of capital are being represented through tokenized equities and ETFs as well. The expansion also comes from several issuers rather than one platform. xStocks, Ondo, Backpack Securities, Sunrise, Superstate, and Securitize have all launched stock products on Solana.
🔸 SOL tests the $102.50 barrier
Meanwhile, Solana continues trading in a wide consolidation after its sharp August rally. The current price is currently near the midpoint of this trading range at approximately $101.48.
SOL trades near $101.48 after recovering from the $97.50 area, where buyers recently stepped in. That lower boundary (purple line) provided support at each of the previous two rallies, hence remaining the key support beneath price.
#SOL | #Solana | $SOL

7
4k
Log in to explore more content
Join global crypto users on Binance Square
⚡️ Get latest and useful information about crypto.
💬 Trusted by the world’s largest crypto exchange.
👍 Discover real insights from verified creators.
အီးမေးလ် / ဖုန်းနံပါတ်
ရေပန်းစားနေသော ခေါင်းစဉ်များ
BitwiseFilesFinalNEARSpotETFProspectus
18,753 views
573 Discussing
#bitwisefilesfinalnearspotetfprospectus 🚀
Can the NEAR token reach $562?$NEAR
Bitwise is preparing a spot NEAR ETF, listed under the ticker NRR on NYSE Arca. The manager was already discussing targets of $155, or even $562 by 2030.$RESOLV $DASH
Rajo C
·နှစ်သက်မှု 5 ခု
·3.3k views
BitgetHackerMoves$83MStolenXRP
16,493 views
104 Discussing
SOLSpotETFWeeklyInflow$188M
7,800 views
79 Discussing