
PlayerX80
182 ပို့စ်များ

PlayerX80
Dedicated to spot crypto analysis, chart breakdowns, market structure & key levels.
Frequent Trader
1.8 Months
3 ဖော်လိုလုပ်ထားသည်
8 ဖော်လိုလုပ်သူများ
175 လိုက်ခ်လုပ်ထားသည်
ပို့စ်များ
အားလုံး
Quotes
$COTI has been recovering strongly on the 4h chart and is now at $0.01825 after rising from the lower range.
The old high near $0.02100 is the main level overhead. If price can climb back up and hold above it, the recovery would gain more strength.
If it turns down from here and falls under $0.01650, a pullback toward $0.01450 becomes more likely.
Volume has stayed healthy during the climb.
The old high near $0.02100 is the main level overhead. If price can climb back up and hold above it, the recovery would gain more strength.
If it turns down from here and falls under $0.01650, a pullback toward $0.01450 becomes more likely.
Volume has stayed healthy during the climb.
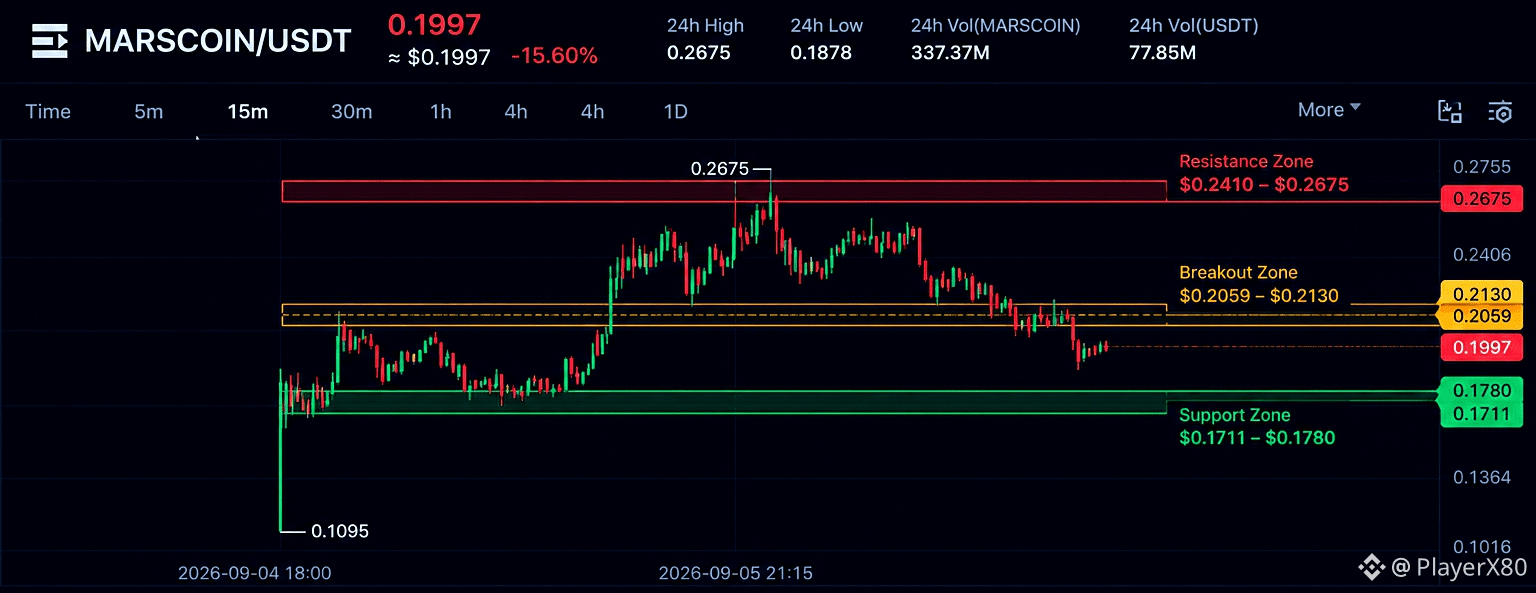
$MARSCOIN already pumped yesterday, from around $0.1095 all the way to $0.2675, and I'm not surprised it pulled back after a move like that, nothing goes straight up forever.
But this isn't a small pullback anymore, it's down 15.60% today alone and sitting at $0.1997, which means it's actually given back a real chunk of that whole move, not just a normal dip after a pump.
And that's what makes the $0.2059 level the thing I'm actually watching, because price just slipped below it, and that was roughly the middle of this whole run up, so losing it isn't nothing, it's a sign sellers have more control right now than buyers do.
So if I put that together, a coin that pumped fast then broke below the middle of its own move on a red day, I land on this looking weak short term, even though the bigger picture still shows a coin that moved a lot in a short window.
If it can reclaim $0.2059 and hold there I think it tries for the highs again, but if it keeps sliding toward $0.1711 that would tell me this pullback turned into something bigger than a normal cool-off.
Price: $0.1997
24h Change: -15.60%
Volume Traded: 77.85M USDT
Timeframe: 15m
Spot only. DYOR, not financial advice.
#mooncoin #gainers #trending
But this isn't a small pullback anymore, it's down 15.60% today alone and sitting at $0.1997, which means it's actually given back a real chunk of that whole move, not just a normal dip after a pump.
And that's what makes the $0.2059 level the thing I'm actually watching, because price just slipped below it, and that was roughly the middle of this whole run up, so losing it isn't nothing, it's a sign sellers have more control right now than buyers do.
So if I put that together, a coin that pumped fast then broke below the middle of its own move on a red day, I land on this looking weak short term, even though the bigger picture still shows a coin that moved a lot in a short window.
If it can reclaim $0.2059 and hold there I think it tries for the highs again, but if it keeps sliding toward $0.1711 that would tell me this pullback turned into something bigger than a normal cool-off.
Price: $0.1997
24h Change: -15.60%
Volume Traded: 77.85M USDT
Timeframe: 15m
Spot only. DYOR, not financial advice.
#mooncoin #gainers #trending
Okay so $ZEC just kept going, it broke $1000 not long ago and now it already hit $1220 before pulling back to where it is now, $1184.
That's not a small move, and I'm not calling it nothing just because it's fast, this run has real volume behind it the whole way up, not some quiet coin getting pushed by nobody.
But volume being real doesn't mean this pace continues, it just means the move so far was genuine, which is a different question from whether it holds from here.
And that's why the reaction around $1051 actually matters to me, that was the base right before this last leg higher, so if price comes back down and holds there, it tells me buyers are still in control even after a move this big.
So putting that together, a real move plus a price that's clearly stretched, I land on this being strong, but not somewhere I'd want to buy right into the excitement.
If it holds above $1051 I think it tries the highs again. If it loses that and drops toward $956 or lower, that would be the first real sign this run is actually done, not just pausing.
Price: $1,184.84
24h Change: +17.31%
Volume Traded: 254.82M USDT
Spot only. DYOR, not financial advice.
#zec #gainers #trending
That's not a small move, and I'm not calling it nothing just because it's fast, this run has real volume behind it the whole way up, not some quiet coin getting pushed by nobody.
But volume being real doesn't mean this pace continues, it just means the move so far was genuine, which is a different question from whether it holds from here.
And that's why the reaction around $1051 actually matters to me, that was the base right before this last leg higher, so if price comes back down and holds there, it tells me buyers are still in control even after a move this big.
So putting that together, a real move plus a price that's clearly stretched, I land on this being strong, but not somewhere I'd want to buy right into the excitement.
If it holds above $1051 I think it tries the highs again. If it loses that and drops toward $956 or lower, that would be the first real sign this run is actually done, not just pausing.
Price: $1,184.84
24h Change: +17.31%
Volume Traded: 254.82M USDT
Spot only. DYOR, not financial advice.
#zec #gainers #trending
$ARB finally reached $0.2 but now the question is can it hold that price?
it pushed all the way to $0.2066 and now it is at $0.1956, still close to the high and buyers have not given much back yet
if it hold above $0.1856 i think it can try $0.2066 again and maybe push higher from there
but if $0.1856 is lost then i will watch $0.1584 first and below that the $0.1313 area
it move very fast so i do not want to chase it here. nothing looks broken yet but i want to see if this current area can hold
#ARB #GAINERS #trending
it pushed all the way to $0.2066 and now it is at $0.1956, still close to the high and buyers have not given much back yet
if it hold above $0.1856 i think it can try $0.2066 again and maybe push higher from there
but if $0.1856 is lost then i will watch $0.1584 first and below that the $0.1313 area
it move very fast so i do not want to chase it here. nothing looks broken yet but i want to see if this current area can hold
#ARB #GAINERS #trending
$UNI been going up slow for weeks now, from $3.269 all the way to $7.483, now sitting at $6.968
not like the other coins that spike out of nowhere, this one just been going up little by little the whole time no crazy jumps
right now the only real level above is $7.483, that's the high it just got rejected from, so that's what it needs to clear again for this to keep going
$6.199 is the 24h low, way below where it's at now, so that's not really in play unless this turns into an actual bigger drop, not just a normal pullback
for now it's just sitting between those two points, nothing broken yet either way
not like the other coins that spike out of nowhere, this one just been going up little by little the whole time no crazy jumps
right now the only real level above is $7.483, that's the high it just got rejected from, so that's what it needs to clear again for this to keep going
$6.199 is the 24h low, way below where it's at now, so that's not really in play unless this turns into an actual bigger drop, not just a normal pullback
for now it's just sitting between those two points, nothing broken yet either way
$IOST did something nobody was expecting, sat around $0.00056 to $0.00063 for weeks doing nothing then jumped straight to $0.000820, now back at $0.000753
nothing about the last few weeks looked like this was coming, just flat then this
if it hold above $0.000701 i think it will try the highs again, that was the level right before it jumped
if it lose $0.000701 then next thing i watch is $0.000635, that's where it was stuck for a long time before going up
it is still down alot for the year overall so this one move dont flip the whole trend yet, just a strong bounce for now, watching to see if it hold or fade back into that old range
#iost #gainers #trending
nothing about the last few weeks looked like this was coming, just flat then this
if it hold above $0.000701 i think it will try the highs again, that was the level right before it jumped
if it lose $0.000701 then next thing i watch is $0.000635, that's where it was stuck for a long time before going up
it is still down alot for the year overall so this one move dont flip the whole trend yet, just a strong bounce for now, watching to see if it hold or fade back into that old range
#iost #gainers #trending
$ZEC broke past $1050 and just made new high at $1,195, now sitting at $1,165.81
went from $788 all the way here without really stopping, this is a huge move in just few days
if it hold above $1,036 i think it try the highs again, that area was where it consolidate before this last push
if it lose $1,036 then next i watch is $946, that is a bigger zone it built before going up
crazy move overall, up almost 2700% in a year still look strong right now but moving so fast these past days already so anything can happen from here
#zec #trending #gainers
went from $788 all the way here without really stopping, this is a huge move in just few days
if it hold above $1,036 i think it try the highs again, that area was where it consolidate before this last push
if it lose $1,036 then next i watch is $946, that is a bigger zone it built before going up
crazy move overall, up almost 2700% in a year still look strong right now but moving so fast these past days already so anything can happen from here
#zec #trending #gainers
$EPIC still going up and it just made new high at $0.4205, now it is at $0.4175
it went from $0.3320 all the way up here and never really fell back down, just keep going higher every time
if it hold above $0.4055 i think it can push for the highs again, that area has been holding it up last couple candles
if it lose $0.4055 then next thing i will watch is $0.386, that's where it build up alot before this last push
still look strong to me right now nothing broke yet, just watching how it act up here since it move so fast already
#epic #gainers #trendingcoin
it went from $0.3320 all the way up here and never really fell back down, just keep going higher every time
if it hold above $0.4055 i think it can push for the highs again, that area has been holding it up last couple candles
if it lose $0.4055 then next thing i will watch is $0.386, that's where it build up alot before this last push
still look strong to me right now nothing broke yet, just watching how it act up here since it move so fast already
#epic #gainers #trendingcoin
$1000CAT pump is over, from $0.00188 it went all the way to $0.002951 and now it is back down to $0.00236
no bounce on the way down at all just red red and red
this thing is already below where it broke out before the pump so that level means nothing now
if it go above $0.00253 again maybe it will try for the highs one more time but i dont see that happening right now
last thing left is $0.00188 which was the start point of the pump so if it lose that too then the whole pump basically never happened
not buying this one right now it is still falling and i dont know where it's fall stop
#1000cat #gainers #trending
no bounce on the way down at all just red red and red
this thing is already below where it broke out before the pump so that level means nothing now
if it go above $0.00253 again maybe it will try for the highs one more time but i dont see that happening right now
last thing left is $0.00188 which was the start point of the pump so if it lose that too then the whole pump basically never happened
not buying this one right now it is still falling and i dont know where it's fall stop
#1000cat #gainers #trending
i dont know if $MARSCOIN has more in it or if thats it for now
it went from $0.10 to $0.2675 basically overnight which is insane for something that just got listed on spot after already pumping on alpha
right now its back to $0.2265
if it holds $0.2059 i think it tries the highs again
if it loses that, $0.1711 is next and wouldnt surprise me at all
alpha holders are probably the ones dumping into this tbh
just watching $0.2059 for now not touching it yet
#marscoin #crypto #gainers #trending
it went from $0.10 to $0.2675 basically overnight which is insane for something that just got listed on spot after already pumping on alpha
right now its back to $0.2265
if it holds $0.2059 i think it tries the highs again
if it loses that, $0.1711 is next and wouldnt surprise me at all
alpha holders are probably the ones dumping into this tbh
just watching $0.2059 for now not touching it yet
#marscoin #crypto #gainers #trending
$RAY is around $1.06 now and after getting rejected near $1.14 I'm just watching to see if this pullback is done or if it still has more to go
Price is holding around $1.05 for now so if buyers can push it back above $1.14 I think $1.20 and then $1.27 can come back into play
But if $1.05 starts breaking then $0.97 is the first area I'd look at
I don't really have a strong guess here yet. On the daily I just want to see if buyers can hold this area and start pushing price back up again.
#trending #gainers #ray
Price is holding around $1.05 for now so if buyers can push it back above $1.14 I think $1.20 and then $1.27 can come back into play
But if $1.05 starts breaking then $0.97 is the first area I'd look at
I don't really have a strong guess here yet. On the daily I just want to see if buyers can hold this area and start pushing price back up again.
#trending #gainers #ray
$SUSHI is moving fast and now I'm starting to wonder if this still has more room or if it needs a break first
It went from around $0.14 to $0.28 already and now price is sitting around $0.257 so I don't really want to chase this move
If it gets back above $0.284 and holds there I think $0.30 could be the next area to watch
But if it keeps getting rejected around here I will watch $0.23 first and then $0.20
For now $0.28 is the level I'm most interested in. I just want to see what price does there before I make any guess on the next move
#sushi #gainer #trending
It went from around $0.14 to $0.28 already and now price is sitting around $0.257 so I don't really want to chase this move
If it gets back above $0.284 and holds there I think $0.30 could be the next area to watch
But if it keeps getting rejected around here I will watch $0.23 first and then $0.20
For now $0.28 is the level I'm most interested in. I just want to see what price does there before I make any guess on the next move
#sushi #gainer #trending
I don't know if $ARB is ready for another move up or if this is where it starts cooling down
It already moved from around $0.13 to $0.196 in a short time and now its very close to the $0.20 area
If it breaks $0.20 and hold there I think $0.22 to $0.25 can come next
But if $0.20 reject hard then I will watch $0.176 first and below that $0.15 area
For now I don't want to guess the top or chase it. I rather watch how price reacts around $0.20
#ARB #crypto #trending #Spot #gainer
It already moved from around $0.13 to $0.196 in a short time and now its very close to the $0.20 area
If it breaks $0.20 and hold there I think $0.22 to $0.25 can come next
But if $0.20 reject hard then I will watch $0.176 first and below that $0.15 area
For now I don't want to guess the top or chase it. I rather watch how price reacts around $0.20
#ARB #crypto #trending #Spot #gainer
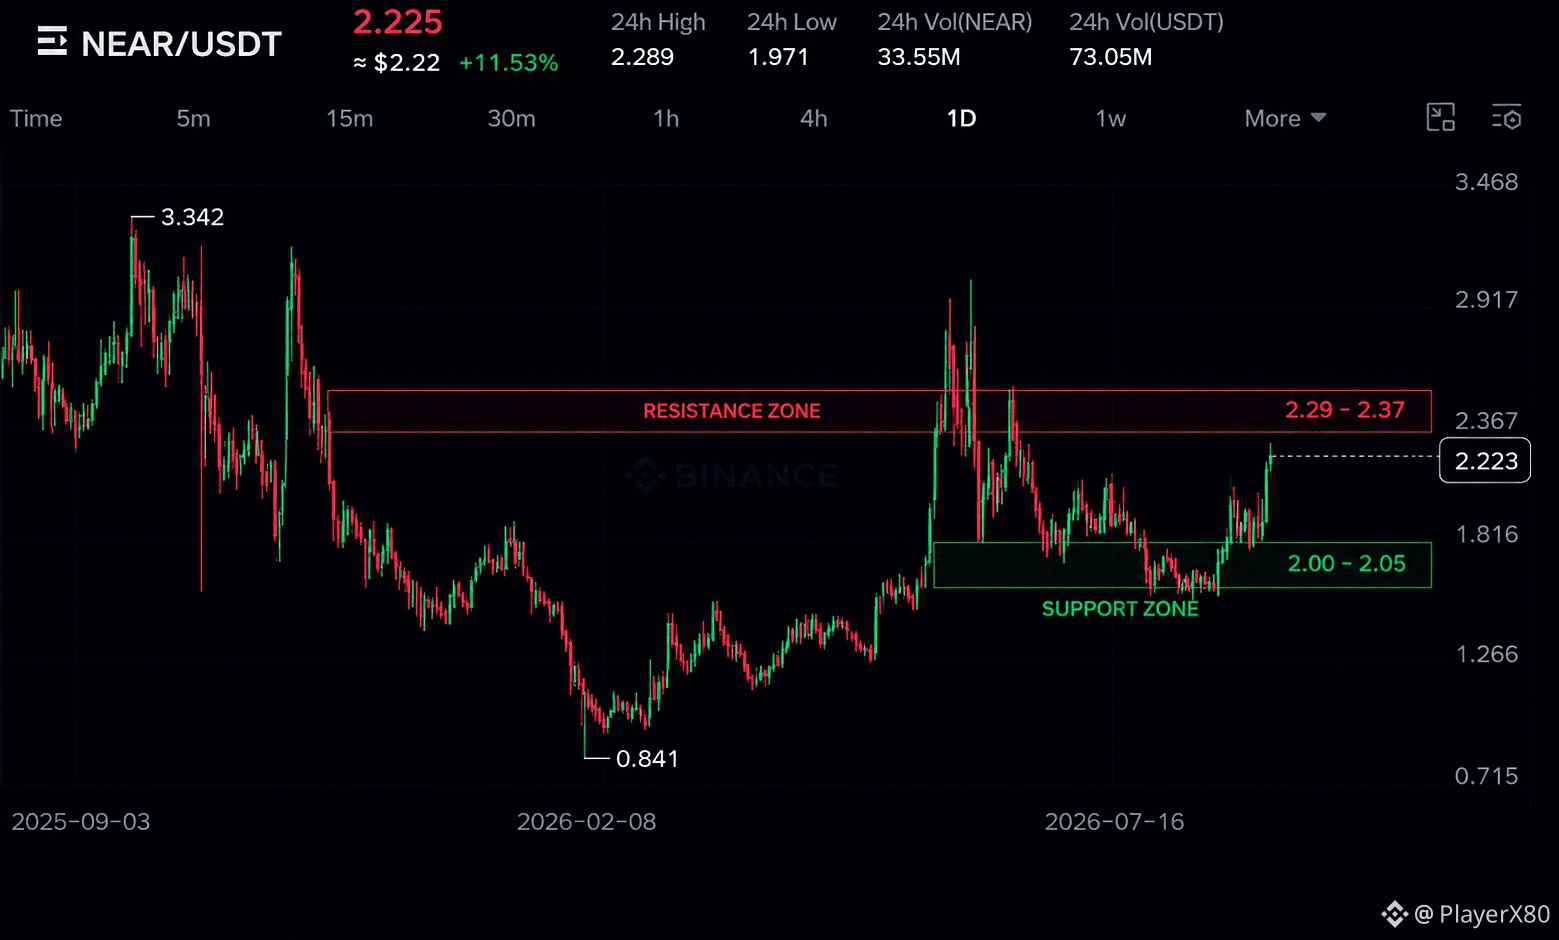
$NEAR — 1D Chart Analysis
NEAR is starting to look interesting again, because after months of weakness, the chart is finally showing a move that could change the short-term structure. Price is now back around $2.22 and is pushing toward the $2.29 area, which is where the current move really starts to get tested.
Looking at the bigger picture, NEAR fell from around $3.34 all the way down to $0.84 before spending months building a base and slowly recovering. What matters now is that the price has moved back above the $2.00 area and is making higher lows instead of continuing the old downtrend.
That brings $2.29–$2.37 into focus. The $2.29 level is the current high, while $2.37 lines up with the next important area on the chart. If NEAR can break through and actually hold above that region, the recovery could extend toward $2.60–$2.75 next. I’d want to see the breakout hold rather than just one strong candle pushing through it.
On the other hand, if price gets rejected here, I’d be watching $2.00–$2.05 first. That area is important because holding it would keep the recent recovery structure intact. If NEAR loses it, the next meaningful area I'd watch is around $1.80–$1.85.
Volume is also worth watching here. Around $73M in USDT has traded over the last 24 hours, while NEAR is up 11.53%. That gives the current move some real participation, but the important part is whether that volume stays strong if price attempts to break the $2.29–$2.37 area.
So right now, I’m interested but not chasing it. NEAR has definitely improved compared with the long decline, but the reaction around $2.29–$2.37 should tell us whether this is becoming a proper recovery or just another bounce.
Current Price: $2.225
24H Change: +11.53%
24H High: $2.289
24H Low: $1.971
24H Volume: $73.05M USDT
Timeframe: 1D
Spot only. DYOR, not financial advice.
#near #analysis #spot
NEAR is starting to look interesting again, because after months of weakness, the chart is finally showing a move that could change the short-term structure. Price is now back around $2.22 and is pushing toward the $2.29 area, which is where the current move really starts to get tested.
Looking at the bigger picture, NEAR fell from around $3.34 all the way down to $0.84 before spending months building a base and slowly recovering. What matters now is that the price has moved back above the $2.00 area and is making higher lows instead of continuing the old downtrend.
That brings $2.29–$2.37 into focus. The $2.29 level is the current high, while $2.37 lines up with the next important area on the chart. If NEAR can break through and actually hold above that region, the recovery could extend toward $2.60–$2.75 next. I’d want to see the breakout hold rather than just one strong candle pushing through it.
On the other hand, if price gets rejected here, I’d be watching $2.00–$2.05 first. That area is important because holding it would keep the recent recovery structure intact. If NEAR loses it, the next meaningful area I'd watch is around $1.80–$1.85.
Volume is also worth watching here. Around $73M in USDT has traded over the last 24 hours, while NEAR is up 11.53%. That gives the current move some real participation, but the important part is whether that volume stays strong if price attempts to break the $2.29–$2.37 area.
So right now, I’m interested but not chasing it. NEAR has definitely improved compared with the long decline, but the reaction around $2.29–$2.37 should tell us whether this is becoming a proper recovery or just another bounce.
Current Price: $2.225
24H Change: +11.53%
24H High: $2.289
24H Low: $1.971
24H Volume: $73.05M USDT
Timeframe: 1D
Spot only. DYOR, not financial advice.
#near #analysis #spot
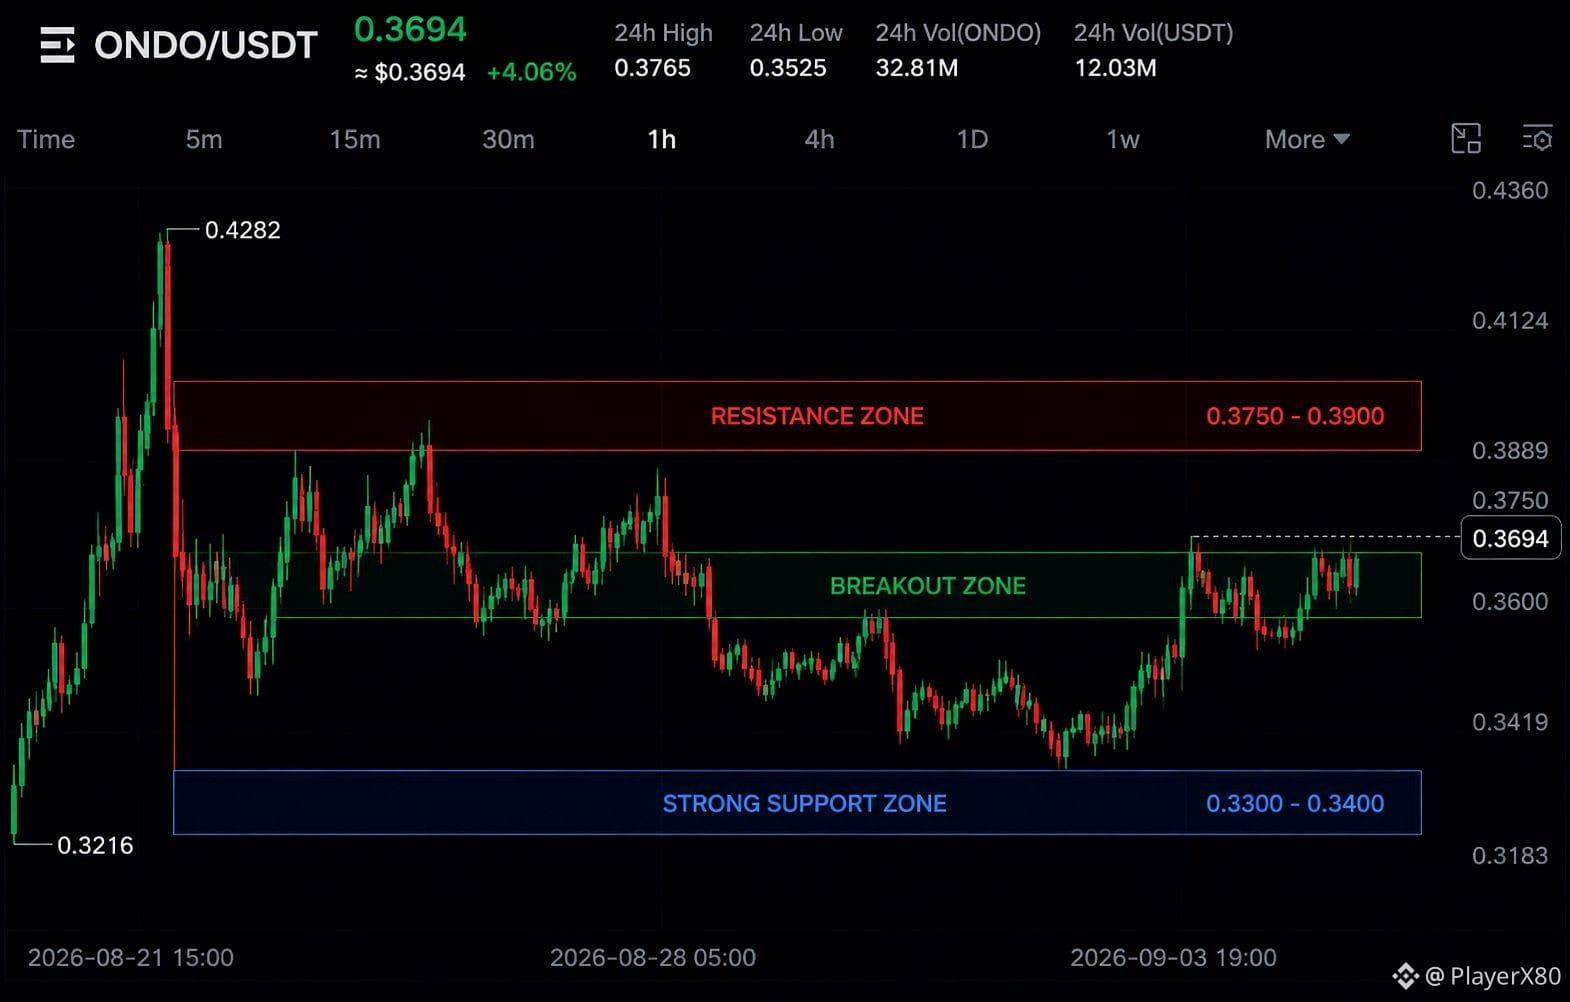
$ONDO is starting to look interesting again, but the important part isn’t the +4% today — it’s what price has been doing underneath it. After spending days stuck in a weak range and repeatedly failing to hold higher levels, ONDO has finally started climbing back toward the area where sellers have been showing up.
On the 1H chart, the bigger picture still shows the damage from the drop from $0.4282, but the recent structure is looking healthier. Price found buyers around the $0.33–$0.34 area, started making higher lows, and has now pushed back above $0.36. That matters because it shows buyers are slowly taking back ground instead of just producing another one-candle bounce.
Now that price is around $0.3694, I’m watching the $0.375–$0.390 area closely. The first test is around $0.3765, which is also the current 24H high. If ONDO can break through that area and actually hold above it, the next move toward $0.40–$0.41 becomes possible. That would put the old $0.4282 high back into focus.
But that only works if buyers keep building on this recovery. If price gets rejected around $0.375–$0.390, I’d expect the first pullback toward $0.35–$0.36. That area is important because holding it would keep the recent higher-low structure intact. Losing it would make me more cautious and could send ONDO back toward the $0.33–$0.34 demand area.
So for now, I’m not calling this a full reversal yet. I like the way the structure is improving, but I want to see how price reacts around $0.375–$0.390 first. A clean break and hold there would make this recovery much more convincing, while rejection would simply mean ONDO is still stuck inside the larger range.
Current Price: $0.3694
24H Change: +4.06%
24H High: $0.3765
24H Low: $0.3525
24H Volume: $12.03M USDT
Timeframe: 1H
Spot only. DYOR, not financial advice.
On the 1H chart, the bigger picture still shows the damage from the drop from $0.4282, but the recent structure is looking healthier. Price found buyers around the $0.33–$0.34 area, started making higher lows, and has now pushed back above $0.36. That matters because it shows buyers are slowly taking back ground instead of just producing another one-candle bounce.
Now that price is around $0.3694, I’m watching the $0.375–$0.390 area closely. The first test is around $0.3765, which is also the current 24H high. If ONDO can break through that area and actually hold above it, the next move toward $0.40–$0.41 becomes possible. That would put the old $0.4282 high back into focus.
But that only works if buyers keep building on this recovery. If price gets rejected around $0.375–$0.390, I’d expect the first pullback toward $0.35–$0.36. That area is important because holding it would keep the recent higher-low structure intact. Losing it would make me more cautious and could send ONDO back toward the $0.33–$0.34 demand area.
So for now, I’m not calling this a full reversal yet. I like the way the structure is improving, but I want to see how price reacts around $0.375–$0.390 first. A clean break and hold there would make this recovery much more convincing, while rejection would simply mean ONDO is still stuck inside the larger range.
Current Price: $0.3694
24H Change: +4.06%
24H High: $0.3765
24H Low: $0.3525
24H Volume: $12.03M USDT
Timeframe: 1H
Spot only. DYOR, not financial advice.
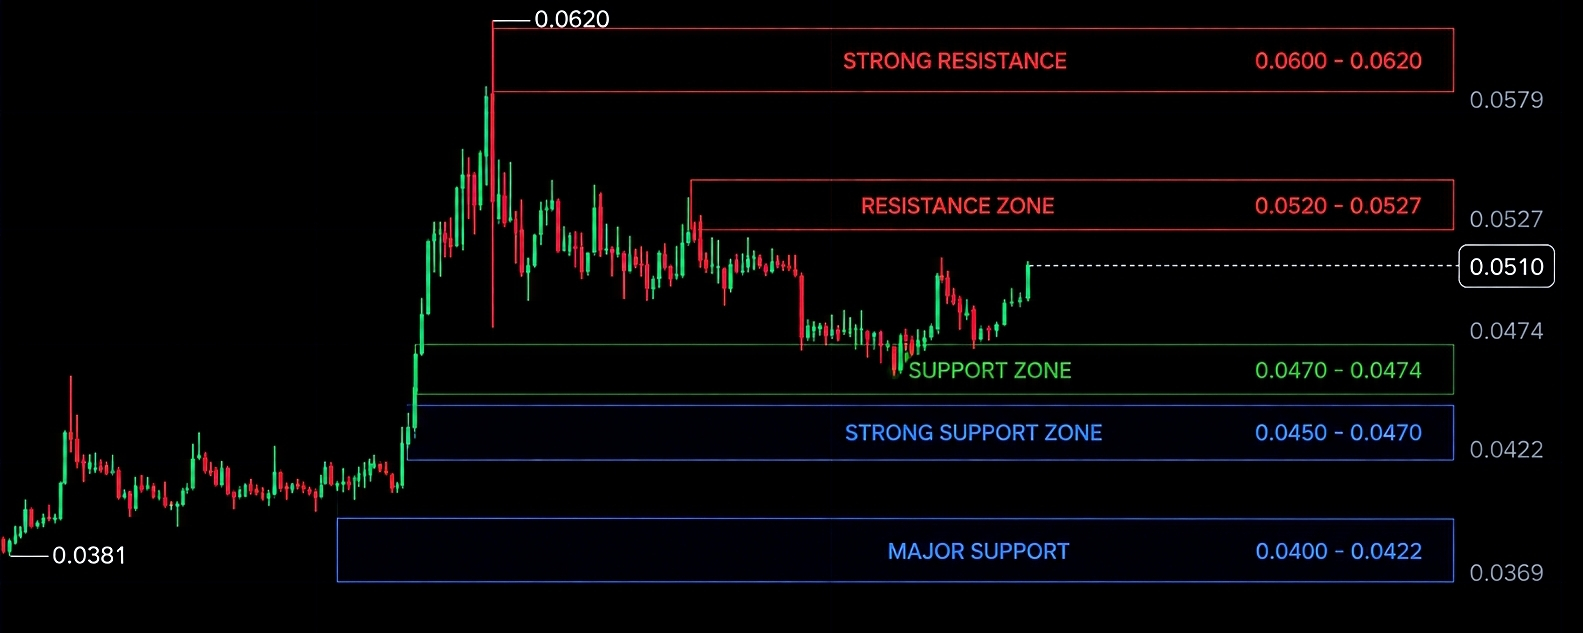
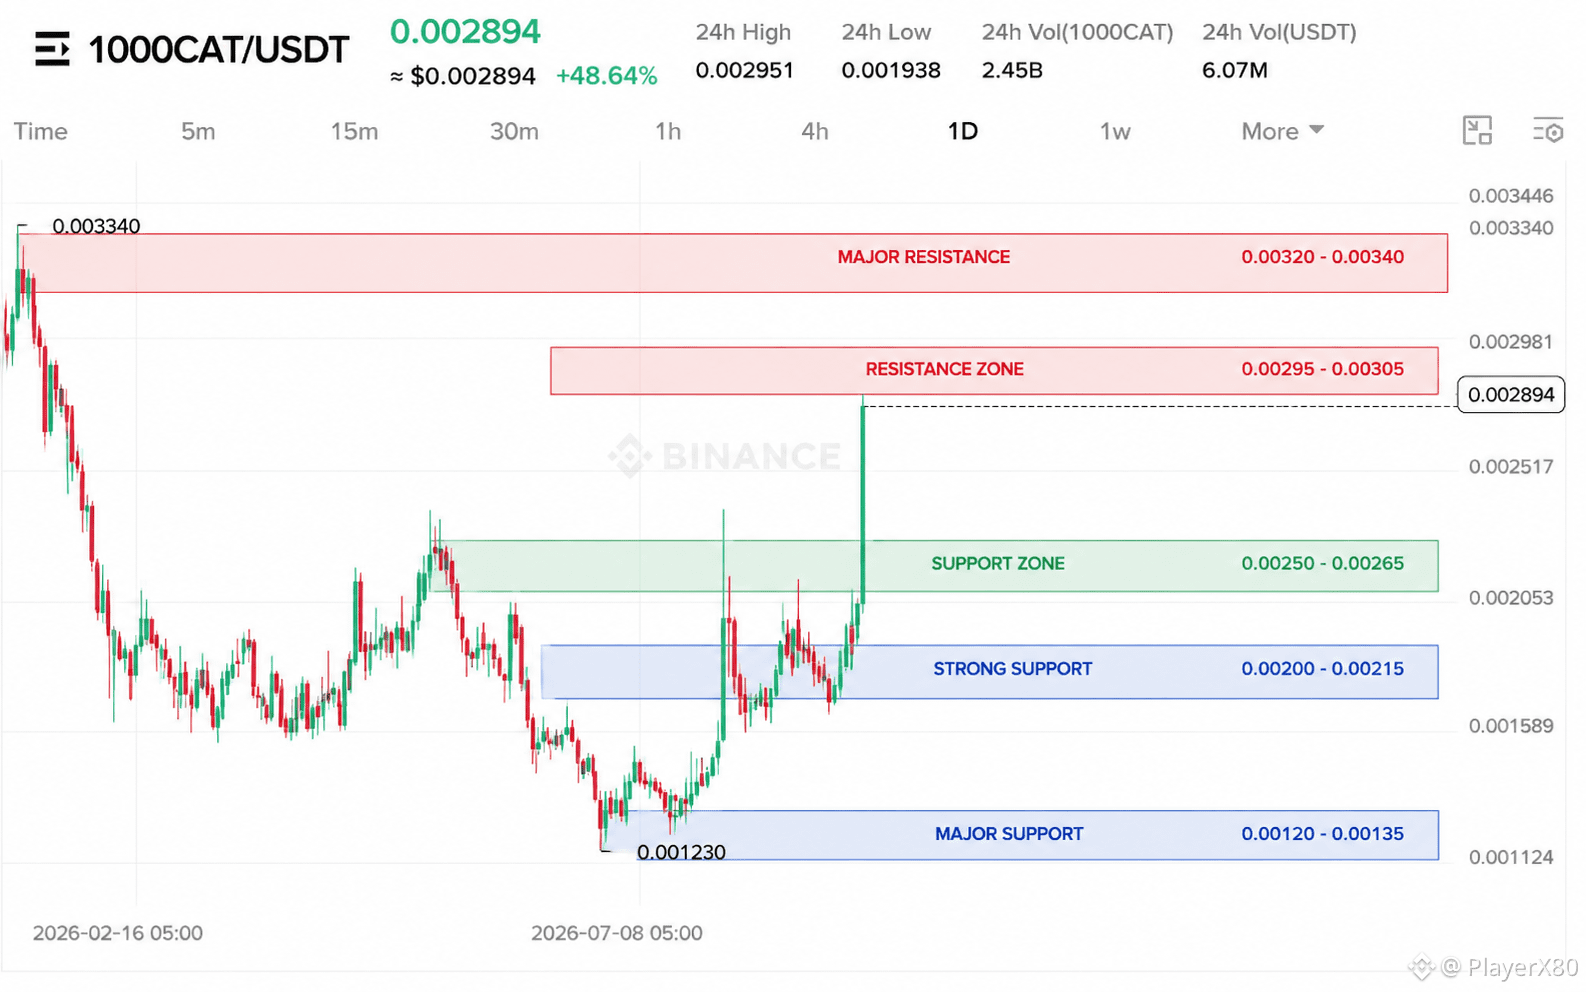
$1000CAT has spent almost a year recovering from that brutal collapse, and the chart is finally starting to look very different. After months of sitting near the lows, price has pushed back toward the old highs, so this is one of those moments where I really want to see what happens next.
On the 1D chart, the bigger picture is pretty clear. $1000CAT fell from around $0.00334 all the way down to $0.00123 and then spent months building a base. For a long time there wasn't much to get excited about, but this latest move has completely changed the chart.
Price is now around $0.00289 after reaching a 24H high of $0.00295. That puts it right at an important old resistance area around $0.00295–$0.00305. I wouldn't call this a confirmed breakout yet because the older $0.00334 high is still above it, but getting this close after such a long recovery is definitely interesting.
What I like here is that this isn't just a small bounce from the bottom. Price has been building higher from the long-term base, and this latest move has pushed it through the previous trading range. If buyers can clear $0.00305 and hold above it, the next major level I'd watch is around $0.00334.
At the same time, I don't want to ignore the possibility of a pullback after a move this large. If price gets rejected around $0.00295–$0.00305, I'd first watch $0.00250–$0.00265 for support. If that fails, the $0.00200–$0.00215 area becomes important.
For me, this is no longer the same chart that was sitting near the lows for months. The recovery is real, but the $0.00300 area is where things get interesting. If it breaks and holds, I want to see whether $0.00334 can finally be taken out. If it gets rejected, I'll be watching how well those lower support areas hold.
Current Price: $0.002894
24H Change: +48.64%
24H High: $0.002951
24H Low: $0.001938
24H Volume:$6.07M USDT
Timeframe: 1D
Spot only. DYOR, not financial advice.
On the 1D chart, the bigger picture is pretty clear. $1000CAT fell from around $0.00334 all the way down to $0.00123 and then spent months building a base. For a long time there wasn't much to get excited about, but this latest move has completely changed the chart.
Price is now around $0.00289 after reaching a 24H high of $0.00295. That puts it right at an important old resistance area around $0.00295–$0.00305. I wouldn't call this a confirmed breakout yet because the older $0.00334 high is still above it, but getting this close after such a long recovery is definitely interesting.
What I like here is that this isn't just a small bounce from the bottom. Price has been building higher from the long-term base, and this latest move has pushed it through the previous trading range. If buyers can clear $0.00305 and hold above it, the next major level I'd watch is around $0.00334.
At the same time, I don't want to ignore the possibility of a pullback after a move this large. If price gets rejected around $0.00295–$0.00305, I'd first watch $0.00250–$0.00265 for support. If that fails, the $0.00200–$0.00215 area becomes important.
For me, this is no longer the same chart that was sitting near the lows for months. The recovery is real, but the $0.00300 area is where things get interesting. If it breaks and holds, I want to see whether $0.00334 can finally be taken out. If it gets rejected, I'll be watching how well those lower support areas hold.
Current Price: $0.002894
24H Change: +48.64%
24H High: $0.002951
24H Low: $0.001938
24H Volume:$6.07M USDT
Timeframe: 1D
Spot only. DYOR, not financial advice.
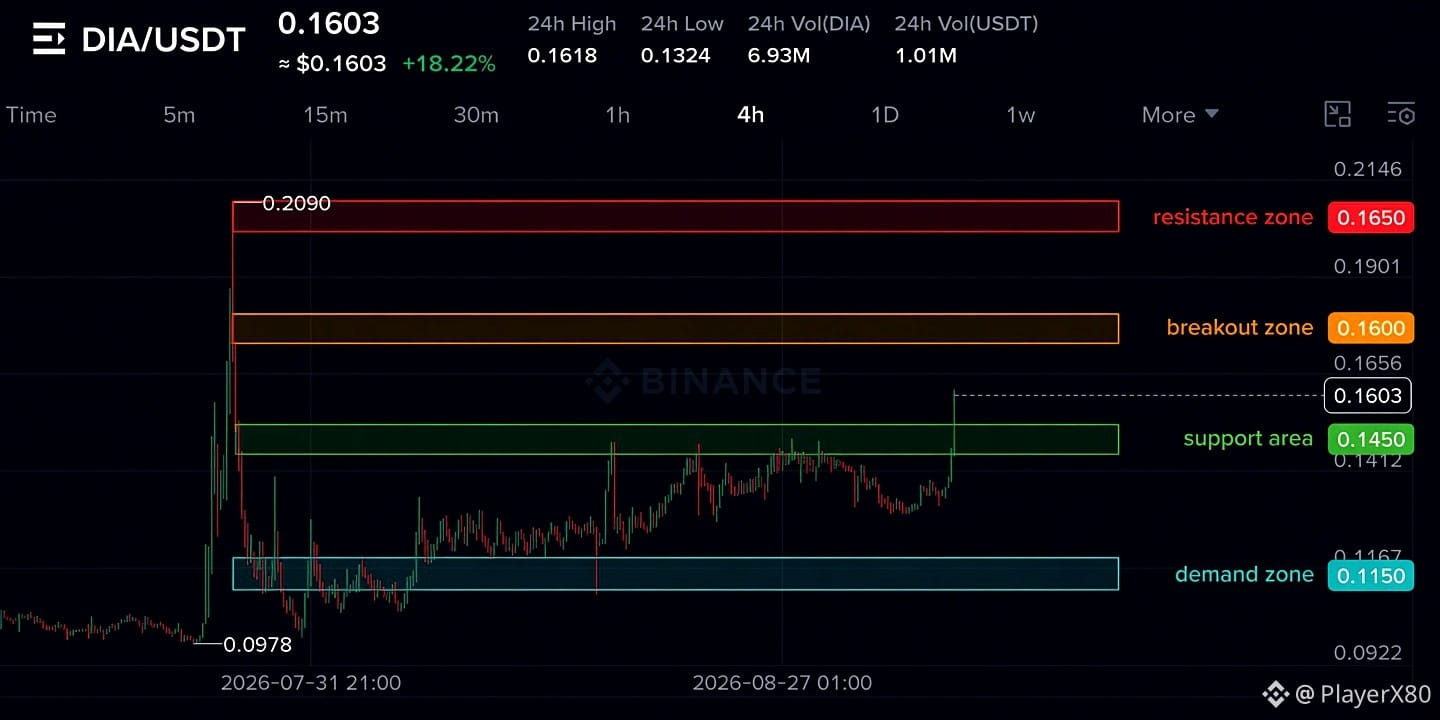
$DIA just printed its strongest 4h push in weeks and is now sitting right under $0.162.
Price is sitting at $0.1603 right now, just under the 24h high of $0.1618, after bouncing from the $0.1324 low. The move higher looks controlled rather than a sudden spike, and it’s the strongest push we’ve seen in a while on this timeframe.
That area around $0.1650–$0.1700 is the first real resistance I care about. If it can clear and hold above there, the next stretch toward $0.19 becomes more realistic. Getting rejected at this level would keep the recent range intact and put the $0.1450–$0.1500 zone back in play as support.
Below that, the $0.1320 area is where buyers stepped in earlier today. Losing it would open a deeper pullback toward the older demand near $0.1150–$0.1200.
Right now it’s just testing the upper end of this recovery, so the cleanest read is whether $0.1650 gets taken out or whether the move stalls and cools off from here.
Price: $0.1603
24h Change: +18.22%
Volume Traded: $1.01M USDT
Timeframe: 4h
Spot only. DYOR, not financial advice.
Price is sitting at $0.1603 right now, just under the 24h high of $0.1618, after bouncing from the $0.1324 low. The move higher looks controlled rather than a sudden spike, and it’s the strongest push we’ve seen in a while on this timeframe.
That area around $0.1650–$0.1700 is the first real resistance I care about. If it can clear and hold above there, the next stretch toward $0.19 becomes more realistic. Getting rejected at this level would keep the recent range intact and put the $0.1450–$0.1500 zone back in play as support.
Below that, the $0.1320 area is where buyers stepped in earlier today. Losing it would open a deeper pullback toward the older demand near $0.1150–$0.1200.
Right now it’s just testing the upper end of this recovery, so the cleanest read is whether $0.1650 gets taken out or whether the move stalls and cools off from here.
Price: $0.1603
24h Change: +18.22%
Volume Traded: $1.01M USDT
Timeframe: 4h
Spot only. DYOR, not financial advice.
Log in to explore more content