
CryptoGiude
221 ပို့စ်များ

CryptoGiude
CryptoGuide - your simple guide to crypto. Quick educational posts, clear coin analysis $BTC, $ETH, and practical tips for beginners and beyond.
3.9K+ ဖော်လိုလုပ်ထားသည်
825 ဖော်လိုလုပ်သူများ
518 လိုက်ခ်လုပ်ထားသည်
ပို့စ်များ
အားလုံး
Quotes
ပုံသေထားသည်
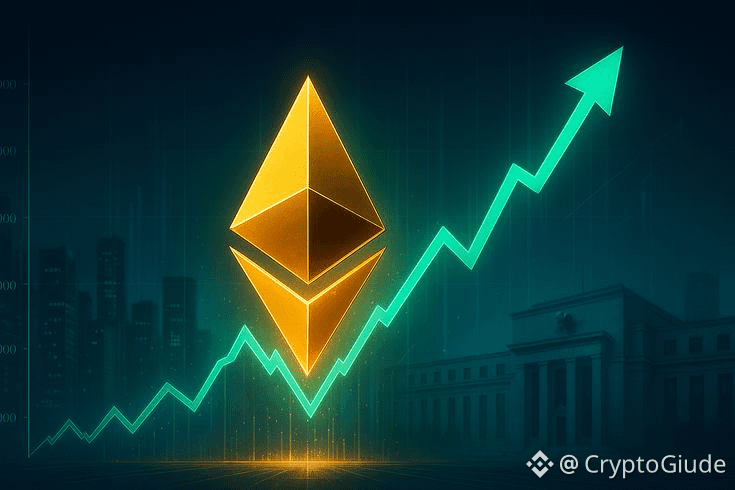
🚨 $ETH is moving hard.
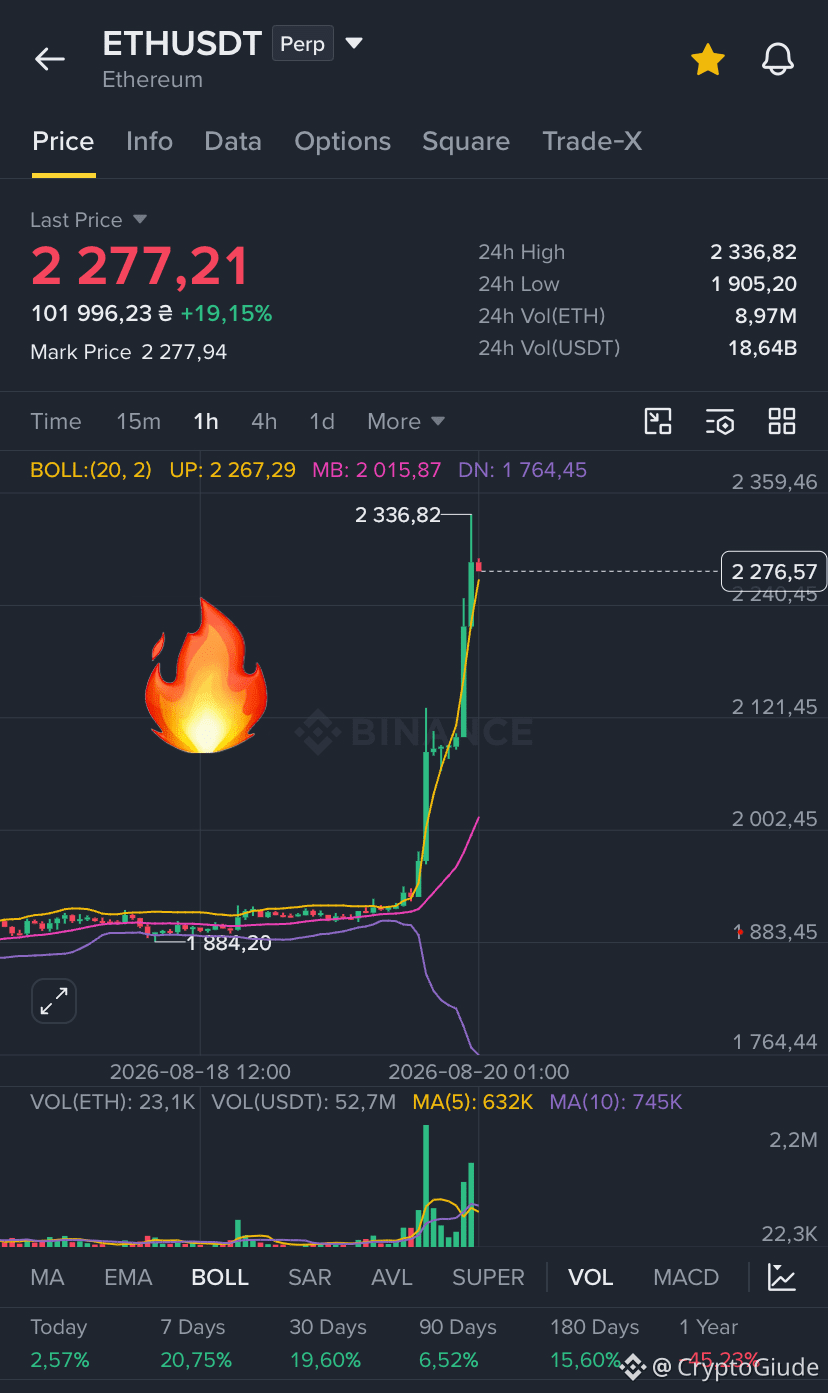
Ethereum is now around $2,277, up almost 19% in 24H, with a high of $2,336. After weeks of consolidation, ETH finally broke above the $2,000 area with strong volume.
The move is partly fueled by a massive wave of short liquidations, but there’s more behind it: institutional accumulation is growing, ETH staking has reached around 34% of supply, and spot ETF demand has been strengthening.
📊 My view:
The trend has clearly turned bullish, but buying after a +19% candle is risky.
🟢 Bullish: holding $2,200–2,150 could open the way toward $2,400–2,500.
🔴 Bearish: losing $2,150 could send ETH back toward $2,050–2,000.
💡 I wouldn’t FOMO here. I’d rather wait for a pullback and see whether buyers defend the breakout.
$2,000–2,200 is now the key zone. If ETH holds it, this could be the beginning of a much bigger recovery. 👀🔥
#ETH #Ethereum #Binance #crypto #Trading
Ethereum is now around $2,277, up almost 19% in 24H, with a high of $2,336. After weeks of consolidation, ETH finally broke above the $2,000 area with strong volume.
The move is partly fueled by a massive wave of short liquidations, but there’s more behind it: institutional accumulation is growing, ETH staking has reached around 34% of supply, and spot ETF demand has been strengthening.
📊 My view:
The trend has clearly turned bullish, but buying after a +19% candle is risky.
🟢 Bullish: holding $2,200–2,150 could open the way toward $2,400–2,500.
🔴 Bearish: losing $2,150 could send ETH back toward $2,050–2,000.
💡 I wouldn’t FOMO here. I’d rather wait for a pullback and see whether buyers defend the breakout.
$2,000–2,200 is now the key zone. If ETH holds it, this could be the beginning of a much bigger recovery. 👀🔥
#ETH #Ethereum #Binance #crypto #Trading
ပုံသေထားသည်

🚀 $DEXE spikes +19% in a sudden liquidity pump!
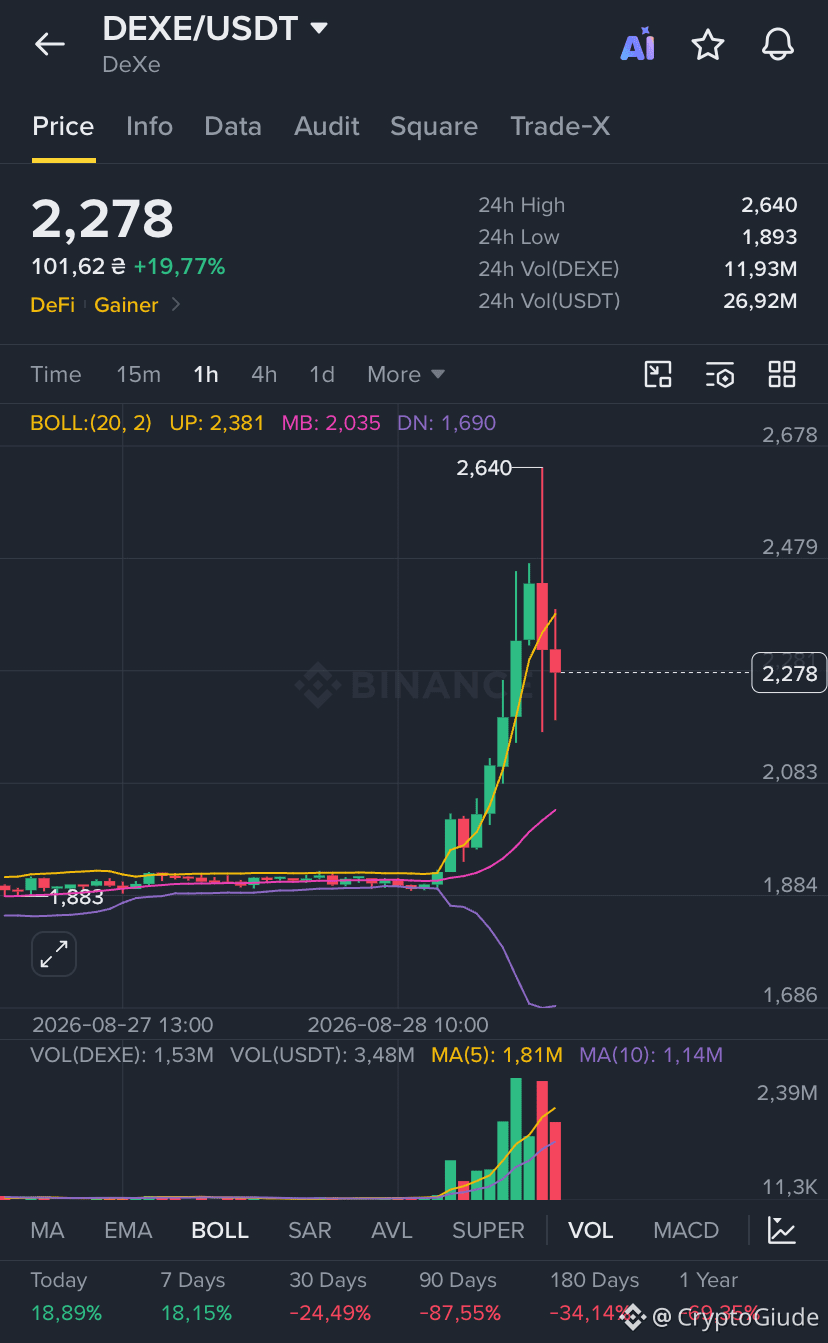
DeXe (DEXE) printed a sudden vertical green candle on the 1H chart, blasting from a flat base at $1.883 up to a local peak of $2.640 before pulling back to $2.278 (+19.77% daily). Volume expanded rapidly to $26.92M USDT (11.93M DEXE) as price pierced far above the upper Bollinger Band (UP: 2.381).
What is behind the surge?
* Low Float & Squeeze Dynamics: DEXE has extremely concentrated holder ownership and a lower circulating float. A sudden wave of spot buying combined with derivatives short-side liquidations triggered a violent vertical pump.
* DAO Studio & Upgrade Hype: Fundamental interest has been rebuilding around DeXe's ongoing protocol performance optimizations and the expansion of AI-driven DAO governance tools ("Dexelization").
📊 Technically:
DEXE already left behind a long upper rejection wick at $2.64. Buying right after a massive top-wick rejection carries significant pullback risk. A structural test of the middle Bollinger Band ($2.035) is expected before any sustainable leg up.
🟢 DEXE — LONG (only on pullback)
💰 Entry: 2.000 – 2.100
⚙️ Margin: Cross
🎯 TP1: 2.400
🎯 TP2: 2.640
🎯 TP3: 2.950
🚀 Leverage: 2x – 3x (High volatility asset, strictly low leverage!)
🛑 Stop Loss: 1.840
💡 Comment:
Do not chase green wicks into $2.64 resistance! Wait for price to settle near $2.00–$2.10 support. A confirmed 4H close above $2.65 opens the way to $3.00+. Losing $1.85 invalidates the setup. 👀📈
#dexe #Binance #futures #crypto #trading
DeXe (DEXE) printed a sudden vertical green candle on the 1H chart, blasting from a flat base at $1.883 up to a local peak of $2.640 before pulling back to $2.278 (+19.77% daily). Volume expanded rapidly to $26.92M USDT (11.93M DEXE) as price pierced far above the upper Bollinger Band (UP: 2.381).
What is behind the surge?
* Low Float & Squeeze Dynamics: DEXE has extremely concentrated holder ownership and a lower circulating float. A sudden wave of spot buying combined with derivatives short-side liquidations triggered a violent vertical pump.
* DAO Studio & Upgrade Hype: Fundamental interest has been rebuilding around DeXe's ongoing protocol performance optimizations and the expansion of AI-driven DAO governance tools ("Dexelization").
📊 Technically:
DEXE already left behind a long upper rejection wick at $2.64. Buying right after a massive top-wick rejection carries significant pullback risk. A structural test of the middle Bollinger Band ($2.035) is expected before any sustainable leg up.
🟢 DEXE — LONG (only on pullback)
💰 Entry: 2.000 – 2.100
⚙️ Margin: Cross
🎯 TP1: 2.400
🎯 TP2: 2.640
🎯 TP3: 2.950
🚀 Leverage: 2x – 3x (High volatility asset, strictly low leverage!)
🛑 Stop Loss: 1.840
💡 Comment:
Do not chase green wicks into $2.64 resistance! Wait for price to settle near $2.00–$2.10 support. A confirmed 4H close above $2.65 opens the way to $3.00+. Losing $1.85 invalidates the setup. 👀📈
#dexe #Binance #futures #crypto #trading
🚀 $EDEN surges +19% as RWA inflows accelerate!
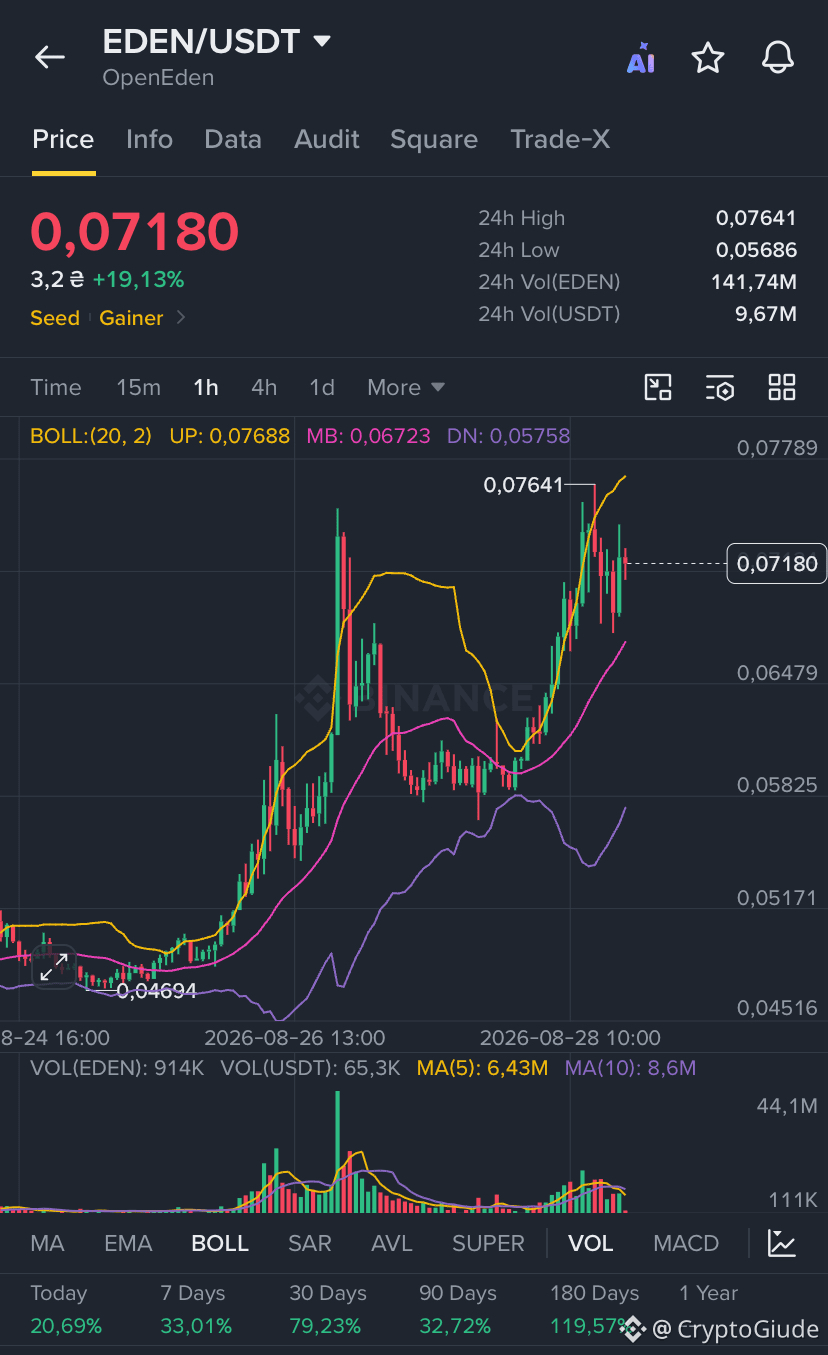
OpenEden (EDEN) is holding a strong bullish trend on the 1H chart, rising from $0.0568 to a high of $0.0764 before settling near $0.0718 (+19.13%). Volume remains healthy at $9.67M USDT as price holds above the 1H middle Bollinger Band (MB: 0.0672).
Key Drivers:
* Ongoing capital expansion in OpenEden's tokenized Treasury (TBILL) & USDO ecosystem following its recent Upbit listing.
* Strong institutional trust backed by ISO/IEC 27001 security compliance.
📊 Technically:
Consolidating below $0.0764 resistance. A pullback to the middle band zone ($0.067–$0.069) offers the cleanest entry setup.
🟢 EDEN — LONG (on pullback)
💰 Entry: 0.06700 – 0.06950
⚙️ Margin: Cross
🎯 TP1: 0.07640
🎯 TP2: 0.08200
🎯 TP3: 0.09000
🚀 Leverage: 2x – 4x
🛑 Stop Loss: 0.06300
💡 Comment:
Avoid buying the top wick near $0.076. Wait for a retest around $0.067–$0.069. A 4H breakout past $0.0765 triggers $0.082+. Below $0.0630 invalidates. 👀📈
#Eden #OpenEden #futures #crypto #trading
OpenEden (EDEN) is holding a strong bullish trend on the 1H chart, rising from $0.0568 to a high of $0.0764 before settling near $0.0718 (+19.13%). Volume remains healthy at $9.67M USDT as price holds above the 1H middle Bollinger Band (MB: 0.0672).
Key Drivers:
* Ongoing capital expansion in OpenEden's tokenized Treasury (TBILL) & USDO ecosystem following its recent Upbit listing.
* Strong institutional trust backed by ISO/IEC 27001 security compliance.
📊 Technically:
Consolidating below $0.0764 resistance. A pullback to the middle band zone ($0.067–$0.069) offers the cleanest entry setup.
🟢 EDEN — LONG (on pullback)
💰 Entry: 0.06700 – 0.06950
⚙️ Margin: Cross
🎯 TP1: 0.07640
🎯 TP2: 0.08200
🎯 TP3: 0.09000
🚀 Leverage: 2x – 4x
🛑 Stop Loss: 0.06300
💡 Comment:
Avoid buying the top wick near $0.076. Wait for a retest around $0.067–$0.069. A 4H breakout past $0.0765 triggers $0.082+. Below $0.0630 invalidates. 👀📈
#Eden #OpenEden #futures #crypto #trading
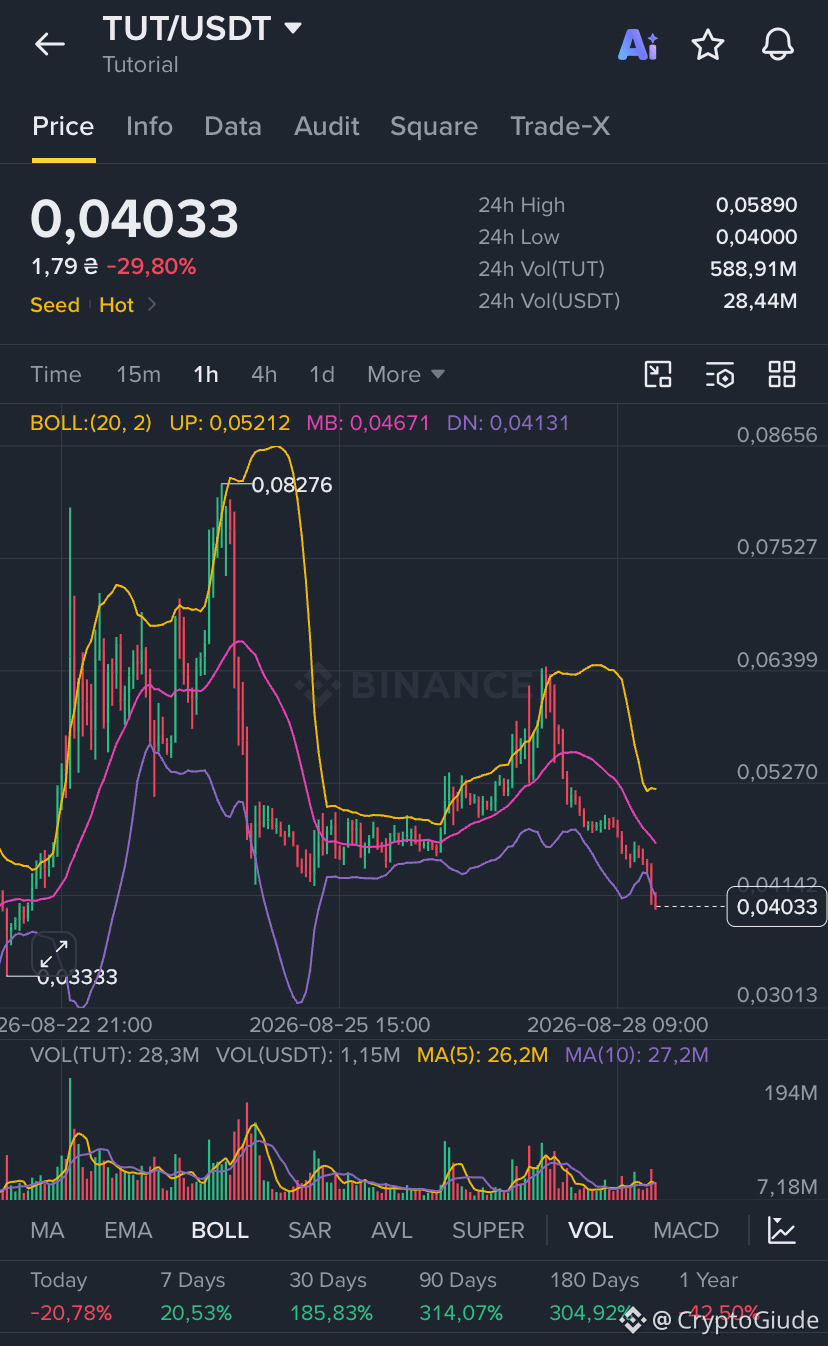
🚨 $TUT is getting hit hard again.
Tutorial (TUT) is now around $0.040, down almost 30% in 24H, after briefly reaching $0.0589. The move comes after a brutal reversal from the recent rally, with price now sitting near the 1H lower Bollinger Band at $0.0413.
The important part: TUT is a very speculative, low-cap token, and recent volatility has been extreme. CoinMarketCap recently reported a sharp 42% sell-off amid negative sentiment and thin liquidity.
📊 Technically:
The chart is bearish short-term. Price is below the 1H middle Bollinger Band ($0.0467) and is testing $0.040 support.
🔴 TUT — SHORT on bounce
💰 Entry: $0.044–0.047
🎯 TP1: $0.040
🎯 TP2: $0.035
🎯 TP3: $0.030
🛑 SL: $0.052
🚀 Leverage: 2–3x
If $0.040 breaks with volume, I would expect another leg lower toward $0.035–0.030.
But if buyers reclaim $0.047 and hold it, the short setup is invalidated and TUT could attempt $0.052–0.059 again.
After a move this violent, I wouldn’t try to catch the falling knife. Let TUT show the direction first. 👀📉
#TUT #Tutorial #futures #Trading #Binance
Tutorial (TUT) is now around $0.040, down almost 30% in 24H, after briefly reaching $0.0589. The move comes after a brutal reversal from the recent rally, with price now sitting near the 1H lower Bollinger Band at $0.0413.
The important part: TUT is a very speculative, low-cap token, and recent volatility has been extreme. CoinMarketCap recently reported a sharp 42% sell-off amid negative sentiment and thin liquidity.
📊 Technically:
The chart is bearish short-term. Price is below the 1H middle Bollinger Band ($0.0467) and is testing $0.040 support.
🔴 TUT — SHORT on bounce
💰 Entry: $0.044–0.047
🎯 TP1: $0.040
🎯 TP2: $0.035
🎯 TP3: $0.030
🛑 SL: $0.052
🚀 Leverage: 2–3x
If $0.040 breaks with volume, I would expect another leg lower toward $0.035–0.030.
But if buyers reclaim $0.047 and hold it, the short setup is invalidated and TUT could attempt $0.052–0.059 again.
After a move this violent, I wouldn’t try to catch the falling knife. Let TUT show the direction first. 👀📉
#TUT #Tutorial #futures #Trading #Binance
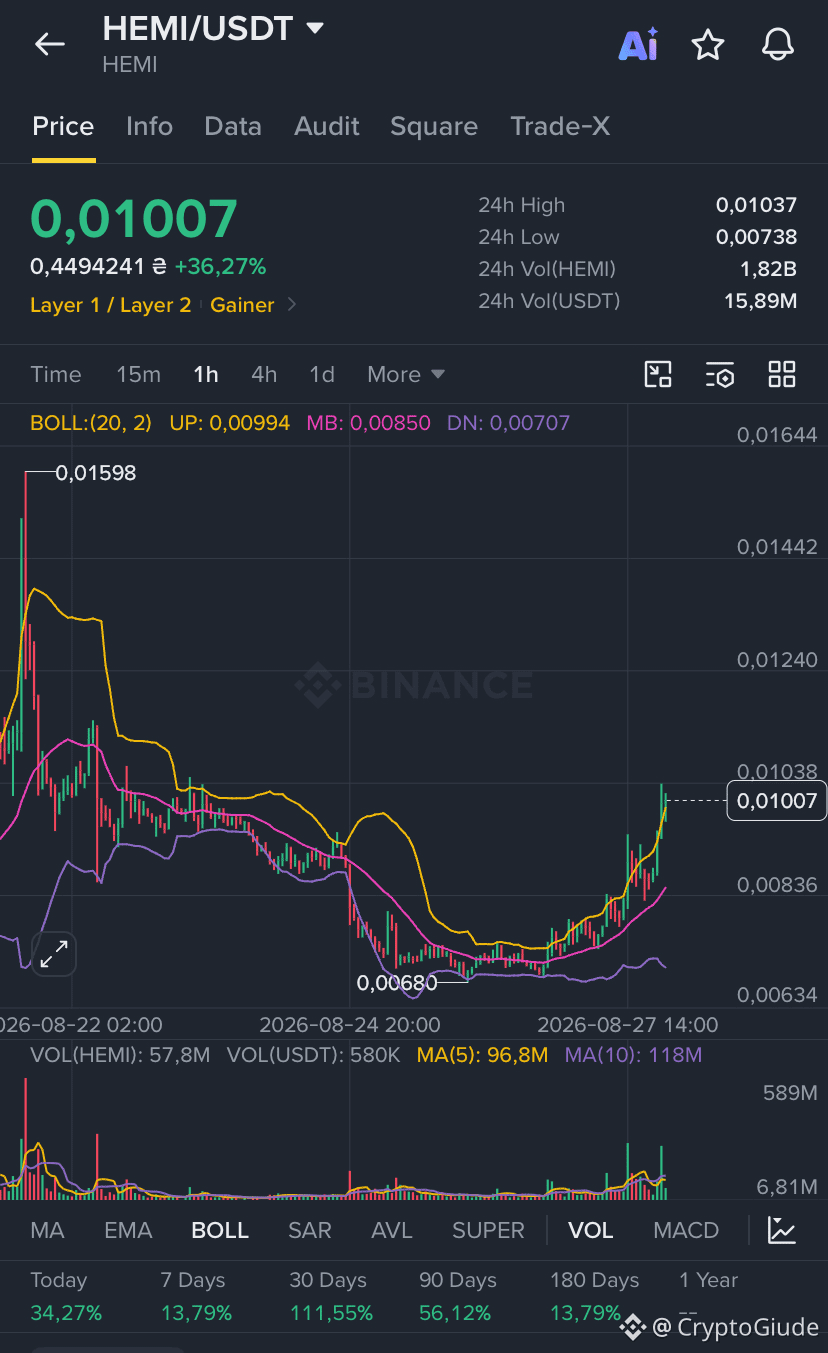
🚀 $HEMI rebounds +36% as modular Bitcoin-Ethereum Supernetwork gains steam!
HEMI (Hemi Network) is pulling off a strong bullish recovery on the 1H chart, breaking out from a low base at $0.00680 up to a local peak of $0.01038 before consolidating near $0.01007 (+36.27% daily, +111.55% 30-day). The price is riding above the upper Bollinger Band (UP: 0.00994) as 24h volume expands to $15.89M USDT (1.82B HEMI).
What is behind the rally?
* Modular L2 Ecosystem Growth: Hemi Network continues gaining traction as a modular Layer-2 "Supernetwork" powered by the Hemi Virtual Machine (hVM). By embedding a full Bitcoin node inside an EVM environment and securing state via Proof-of-Proof (PoP), institutional interest in its BTCFi yield ecosystem is driving fresh liquidity.
* Derivatives Volume Expansion: Trading volume on perpetuals has spiked significantly over recent sessions, indicating heavy short covering and aggressive speculative momentum as price cleared the $0.0085 resistance zone.
📊 Technically:
After bottoming out near $0.00680, HEMI has established a clear higher-high structure. While short-term conditions are stretched near resistance ($0.0103–$0.0105), a successful retest of the middle Bollinger Band ($0.00850) provides a favorable risk-reward entry zone.
🟢 HEMI — LONG (on pullback)
💰 Entry: 0.00850 – 0.00910
⚙️ Margin: Cross
🎯 TP1: 0.01030
🎯 TP2: 0.01240
🎯 TP3: 0.01590
🚀 Leverage: 2x – 4x (Low-cap token, strict risk management mandatory)
🛑 Stop Loss: 0.00760
💡 Comment:
Chasing high green wicks into $0.0104 resistance carries quick pullback risk. Wait for a healthy retest toward $0.0085–$0.0090 to build a structured long position.
A solid 1H/4H breakout and close above $0.0105 can spark a fast rally toward $0.0124–$0.0159. Losing $0.0076 invalidates the recovery setup, threatening a retest of the $0.0068 macro low. 👀📈
#HEMI #Binance #Futures #crypto #Trading
HEMI (Hemi Network) is pulling off a strong bullish recovery on the 1H chart, breaking out from a low base at $0.00680 up to a local peak of $0.01038 before consolidating near $0.01007 (+36.27% daily, +111.55% 30-day). The price is riding above the upper Bollinger Band (UP: 0.00994) as 24h volume expands to $15.89M USDT (1.82B HEMI).
What is behind the rally?
* Modular L2 Ecosystem Growth: Hemi Network continues gaining traction as a modular Layer-2 "Supernetwork" powered by the Hemi Virtual Machine (hVM). By embedding a full Bitcoin node inside an EVM environment and securing state via Proof-of-Proof (PoP), institutional interest in its BTCFi yield ecosystem is driving fresh liquidity.
* Derivatives Volume Expansion: Trading volume on perpetuals has spiked significantly over recent sessions, indicating heavy short covering and aggressive speculative momentum as price cleared the $0.0085 resistance zone.
📊 Technically:
After bottoming out near $0.00680, HEMI has established a clear higher-high structure. While short-term conditions are stretched near resistance ($0.0103–$0.0105), a successful retest of the middle Bollinger Band ($0.00850) provides a favorable risk-reward entry zone.
🟢 HEMI — LONG (on pullback)
💰 Entry: 0.00850 – 0.00910
⚙️ Margin: Cross
🎯 TP1: 0.01030
🎯 TP2: 0.01240
🎯 TP3: 0.01590
🚀 Leverage: 2x – 4x (Low-cap token, strict risk management mandatory)
🛑 Stop Loss: 0.00760
💡 Comment:
Chasing high green wicks into $0.0104 resistance carries quick pullback risk. Wait for a healthy retest toward $0.0085–$0.0090 to build a structured long position.
A solid 1H/4H breakout and close above $0.0105 can spark a fast rally toward $0.0124–$0.0159. Losing $0.0076 invalidates the recovery setup, threatening a retest of the $0.0068 macro low. 👀📈
#HEMI #Binance #Futures #crypto #Trading
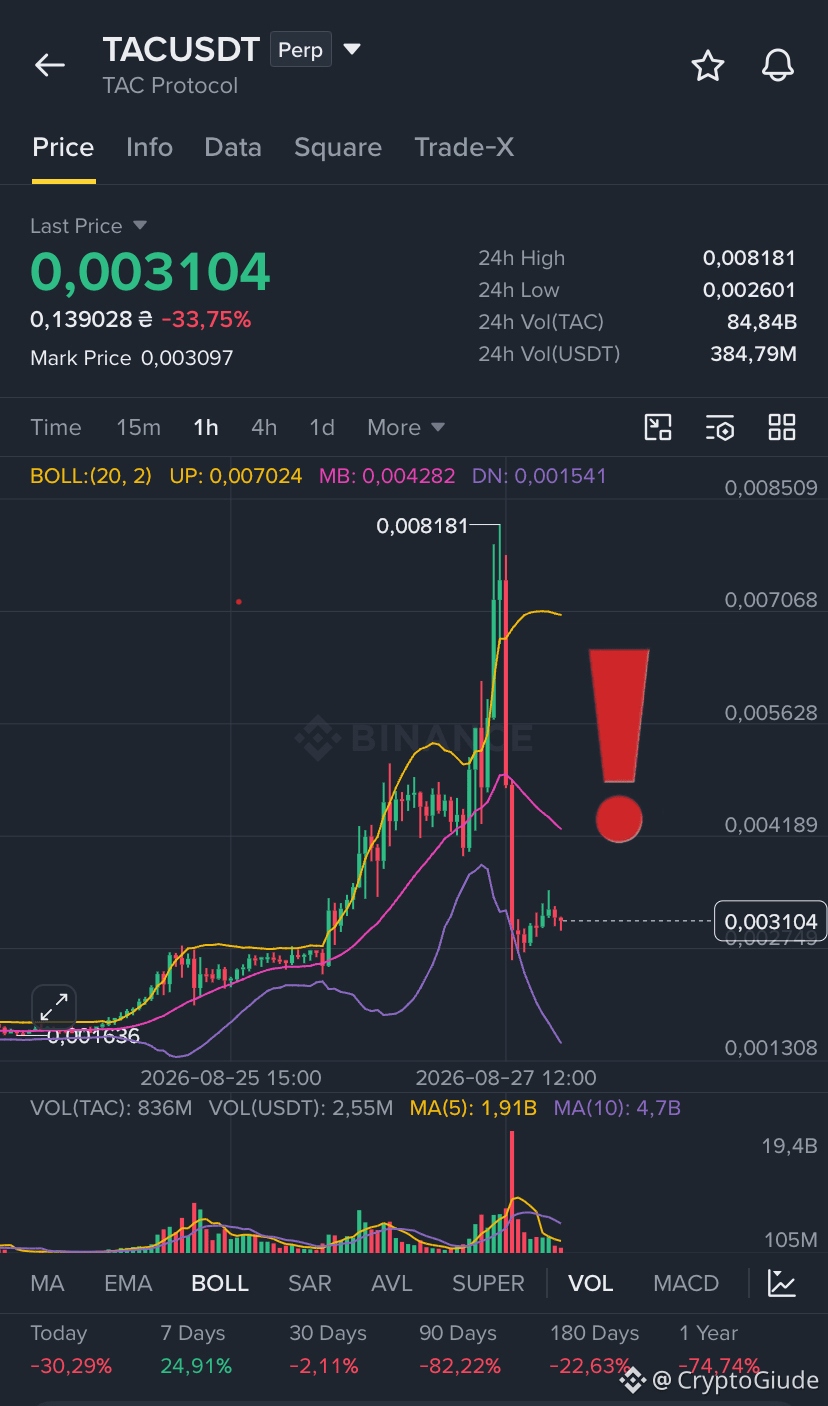
🚨 $TAC Protocol crashes -33.75% after a massive flash dump!
TAC (TAC Protocol) experienced an extreme pump-and-dump cycle on the 1H chart, shooting up to a high of $0.008181 before collapsing down to $0.003104 (-33.75% daily, after peaking at +150%+ gains). On the 1H timeframe, the price sliced straight down through the middle band (MB: 0.00428) on massive volume spike ($384.79M USDT / 84.84B TAC).
What is behind the crash?
1. Severe Security Exploits & Chain Halts: TAC’s volatility follows a major Cosmos EVM module vulnerability that forced validators to temporarily halt the blockchain after an exploit drained significant token supply, creating extreme panic and speculative swings.
2. Aggressive Profit-Taking: The vertical pump to $0.0081 was driven by speculative short-squeeze volume, which quickly inverted as early buyers and liquidators dumped into low order-book liquidity.
📊 Technically:
TAC is attempting to form a floor around $0.0026–$0.0030 after the massive red candle wick. Trading a low-cap high-volatility token right after a -60% crash from the peak is extremely dangerous due to wide spreads and slippage.
🔴 TAC — SHORT (on weak relief bounce)
💰 Entry: 0.00410 – 0.00460
⚙️ Margin: Cross
🎯 TP1: 0.00300
🎯 TP2: 0.00260
🎯 TP3: 0.00200
🚀 Leverage: 2x – 3x (Strict risk control required!)
🛑 Stop Loss: 0.00520
💡 Comment:
Do not long vertical selloffs on low-liquidity protocols. Any quick bounce toward the $0.0042–$0.0045 middle-band zone is likely a lower-high setup for another leg down.
If support at $0.0026 fails, price can quickly test the $0.0016 floor. Reclaiming $0.0052 on sustained volume invalidates the immediate bearish setup. Trade with minimal leverage! 👀📉
#TAC #Binance #futures #crypto #Trading
TAC (TAC Protocol) experienced an extreme pump-and-dump cycle on the 1H chart, shooting up to a high of $0.008181 before collapsing down to $0.003104 (-33.75% daily, after peaking at +150%+ gains). On the 1H timeframe, the price sliced straight down through the middle band (MB: 0.00428) on massive volume spike ($384.79M USDT / 84.84B TAC).
What is behind the crash?
1. Severe Security Exploits & Chain Halts: TAC’s volatility follows a major Cosmos EVM module vulnerability that forced validators to temporarily halt the blockchain after an exploit drained significant token supply, creating extreme panic and speculative swings.
2. Aggressive Profit-Taking: The vertical pump to $0.0081 was driven by speculative short-squeeze volume, which quickly inverted as early buyers and liquidators dumped into low order-book liquidity.
📊 Technically:
TAC is attempting to form a floor around $0.0026–$0.0030 after the massive red candle wick. Trading a low-cap high-volatility token right after a -60% crash from the peak is extremely dangerous due to wide spreads and slippage.
🔴 TAC — SHORT (on weak relief bounce)
💰 Entry: 0.00410 – 0.00460
⚙️ Margin: Cross
🎯 TP1: 0.00300
🎯 TP2: 0.00260
🎯 TP3: 0.00200
🚀 Leverage: 2x – 3x (Strict risk control required!)
🛑 Stop Loss: 0.00520
💡 Comment:
Do not long vertical selloffs on low-liquidity protocols. Any quick bounce toward the $0.0042–$0.0045 middle-band zone is likely a lower-high setup for another leg down.
If support at $0.0026 fails, price can quickly test the $0.0016 floor. Reclaiming $0.0052 on sustained volume invalidates the immediate bearish setup. Trade with minimal leverage! 👀📉
#TAC #Binance #futures #crypto #Trading
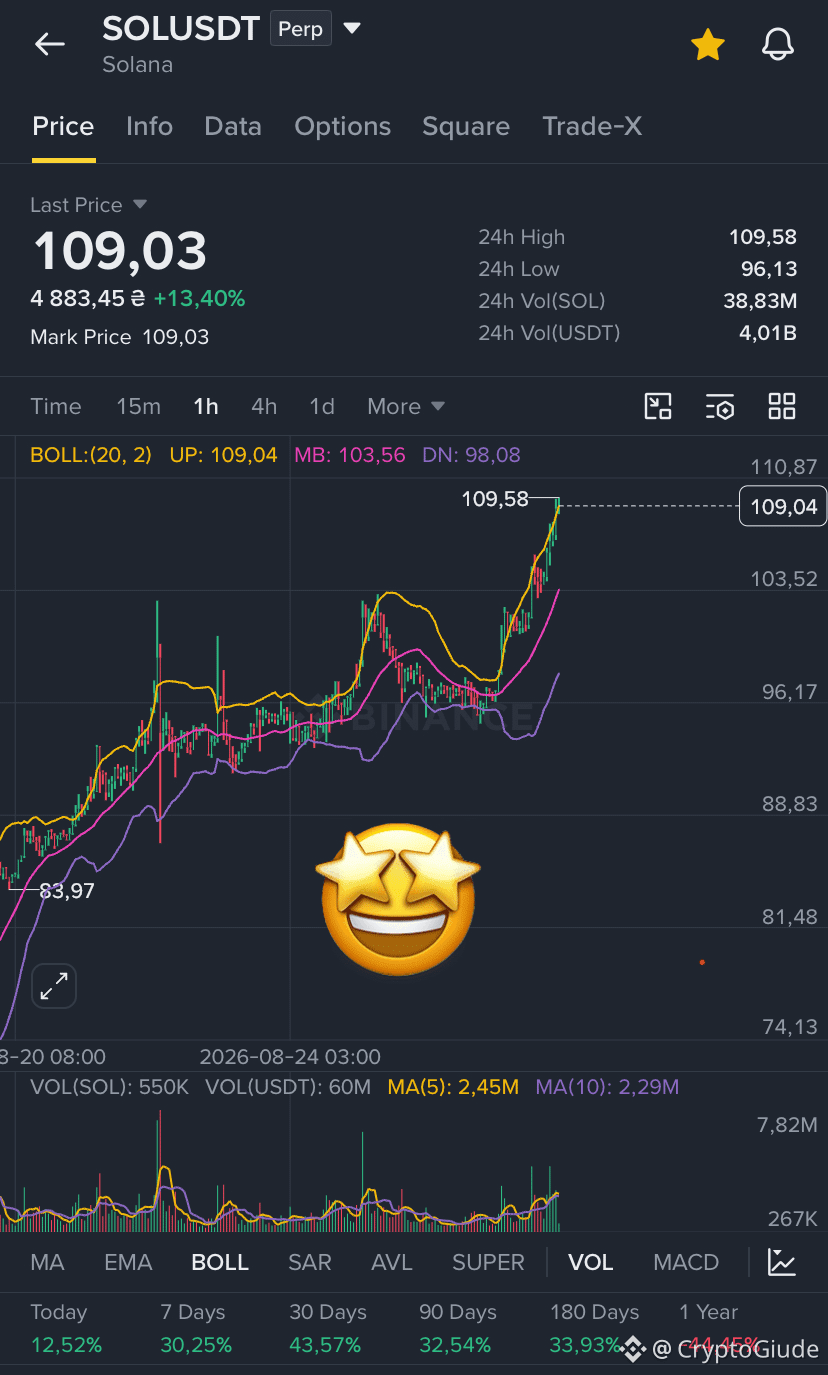
🚀 $SOL smashes past $109 in a high-volume parabolic surge!
Solana (SOL) is leading a massive market breakout, exploding from $83.97 up to a local high of $109.58 before consolidating around $109.03 (+13.40% daily, +30.25% weekly). On the 1H chart, price is riding directly along the upper Bollinger Band (UP: 109.04) on massive 24h volume exceeding $4.01B USDT (38.83M SOL).
What is behind the surge?
* Network Upgrade Momentum: Fundamental sentiment is supercharged following recent Agave network performance upgrades (reducing slot times to 200ms) and active community governance proposals (SIMD-0550/0553) aiming to cut inflation/issuance.
* Institutional & Ecosystem Inflows: Aggressive spot buying combined with heavy short-side liquidations as SOL pushed through the psychological $100 barrier, triggering fresh momentum capital.
📊 Technically:
SOL is heavily overextended on lower timeframes after a vertical run. Buying directly under upper Bollinger Band resistance ($109.50–$110.00) carries high short-term risk. A cool-off retest toward the 1H middle band ($103.50–$105.00) offers a much cleaner risk-reward setup.
🟢 SOL — LONG (on pullback)
💰 Entry: 102.50 – 105.20
⚙️ Margin: Cross
🎯 TP1: 109.50
🎯 TP2: 114.80
🎯 TP3: 122.00
🚀 Leverage: 3x – 5x (Strict risk management recommended)
🛑 Stop Loss: 97.80
💡 Comment:
A confirmed 1H/4H close above $110.00 can unlock a fast continuation leg toward $115–$120+. However, losing the $103.00 support invalidates immediate parabolic momentum, opening a temporary pullback toward the $96.00 zone. Avoid chasing green candles! 👀📈
#sol #solana #futures #crypto #trading
Solana (SOL) is leading a massive market breakout, exploding from $83.97 up to a local high of $109.58 before consolidating around $109.03 (+13.40% daily, +30.25% weekly). On the 1H chart, price is riding directly along the upper Bollinger Band (UP: 109.04) on massive 24h volume exceeding $4.01B USDT (38.83M SOL).
What is behind the surge?
* Network Upgrade Momentum: Fundamental sentiment is supercharged following recent Agave network performance upgrades (reducing slot times to 200ms) and active community governance proposals (SIMD-0550/0553) aiming to cut inflation/issuance.
* Institutional & Ecosystem Inflows: Aggressive spot buying combined with heavy short-side liquidations as SOL pushed through the psychological $100 barrier, triggering fresh momentum capital.
📊 Technically:
SOL is heavily overextended on lower timeframes after a vertical run. Buying directly under upper Bollinger Band resistance ($109.50–$110.00) carries high short-term risk. A cool-off retest toward the 1H middle band ($103.50–$105.00) offers a much cleaner risk-reward setup.
🟢 SOL — LONG (on pullback)
💰 Entry: 102.50 – 105.20
⚙️ Margin: Cross
🎯 TP1: 109.50
🎯 TP2: 114.80
🎯 TP3: 122.00
🚀 Leverage: 3x – 5x (Strict risk management recommended)
🛑 Stop Loss: 97.80
💡 Comment:
A confirmed 1H/4H close above $110.00 can unlock a fast continuation leg toward $115–$120+. However, losing the $103.00 support invalidates immediate parabolic momentum, opening a temporary pullback toward the $96.00 zone. Avoid chasing green candles! 👀📈
#sol #solana #futures #crypto #trading

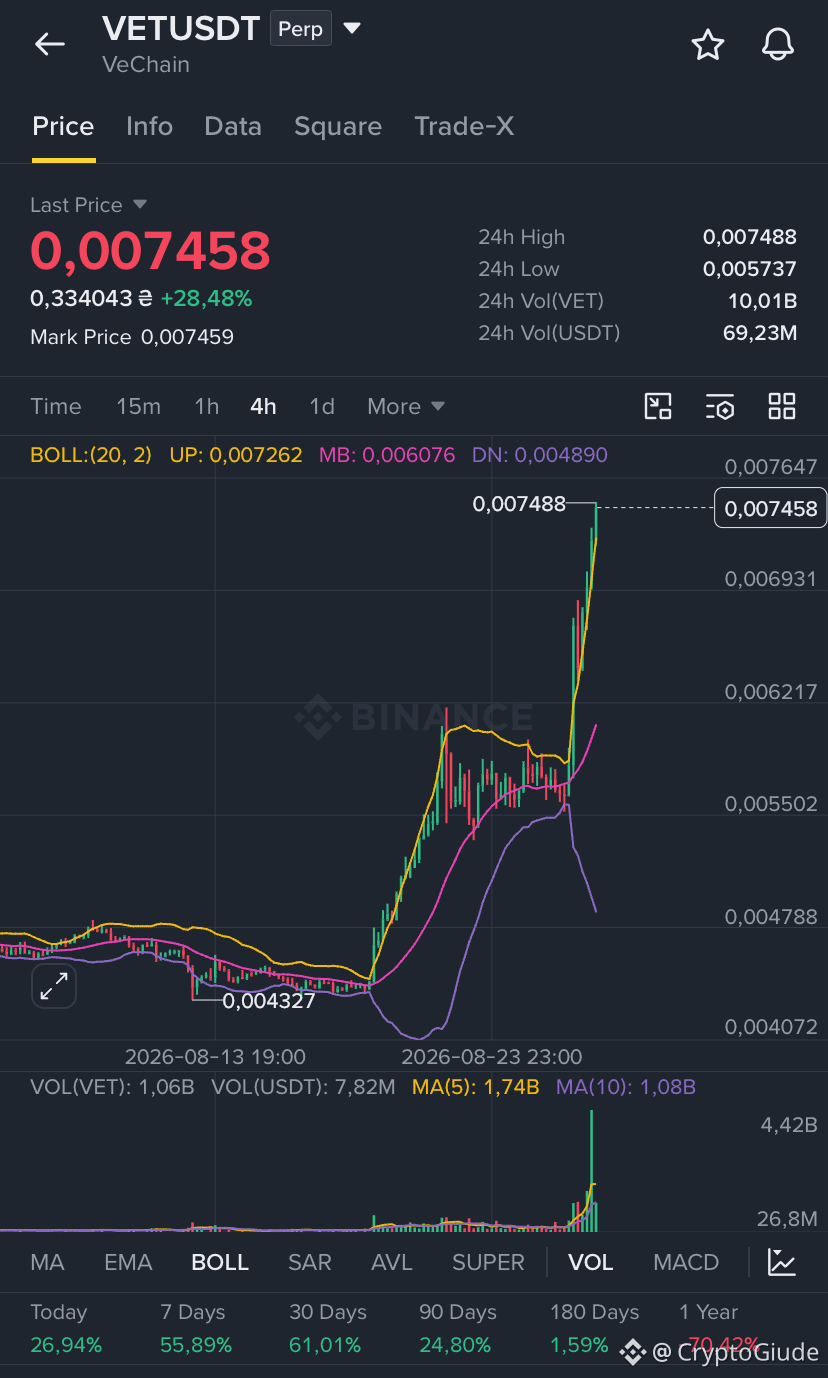
🚨 $VET is finally moving.
VeChain is around $0.007, up more than 28% in 24H. Binance data shows the move came with a huge increase in volume, while VET has now broken above the long downtrend and the previous $0.0062 breakout area.
And this time there is a real catalyst behind the attention. VeChain is preparing the Interstellar upgrade (VIP-255), which brings VeChainThor much closer to modern Ethereum EVM standards, including upgrades from Cancun, Prague and Osaka. The upgrade is currently targeted for September 16.
📊 Technically: momentum is strong, but after a 28% move I wouldn’t chase the candle.
🟢 VET — LONG on pullback
💰 Entry: $0.0065–0.0069
🎯 TP1: $0.0075
🎯 TP2: $0.0080
🎯 TP3: $0.0090–0.0100
🛑 SL: $0.0060
🚀 Leverage: 3–5x
The key now is $0.0062–0.0065. If VET holds above this zone, the breakout has a chance to develop into a larger trend. If it falls back below it, today’s pump could simply turn into another failed breakout.
One more interesting detail: VeChain says 13B+ VET is already staked through StarGate, up from 2.52B since the platform launched.
VET spent months bleeding — now the question is whether this is finally the beginning of the reversal, or just another relief pump. 👀
#VET #vechain #Futures #trading #Binance
VeChain is around $0.007, up more than 28% in 24H. Binance data shows the move came with a huge increase in volume, while VET has now broken above the long downtrend and the previous $0.0062 breakout area.
And this time there is a real catalyst behind the attention. VeChain is preparing the Interstellar upgrade (VIP-255), which brings VeChainThor much closer to modern Ethereum EVM standards, including upgrades from Cancun, Prague and Osaka. The upgrade is currently targeted for September 16.
📊 Technically: momentum is strong, but after a 28% move I wouldn’t chase the candle.
🟢 VET — LONG on pullback
💰 Entry: $0.0065–0.0069
🎯 TP1: $0.0075
🎯 TP2: $0.0080
🎯 TP3: $0.0090–0.0100
🛑 SL: $0.0060
🚀 Leverage: 3–5x
The key now is $0.0062–0.0065. If VET holds above this zone, the breakout has a chance to develop into a larger trend. If it falls back below it, today’s pump could simply turn into another failed breakout.
One more interesting detail: VeChain says 13B+ VET is already staked through StarGate, up from 2.52B since the platform launched.
VET spent months bleeding — now the question is whether this is finally the beginning of the reversal, or just another relief pump. 👀
#VET #vechain #Futures #trading #Binance
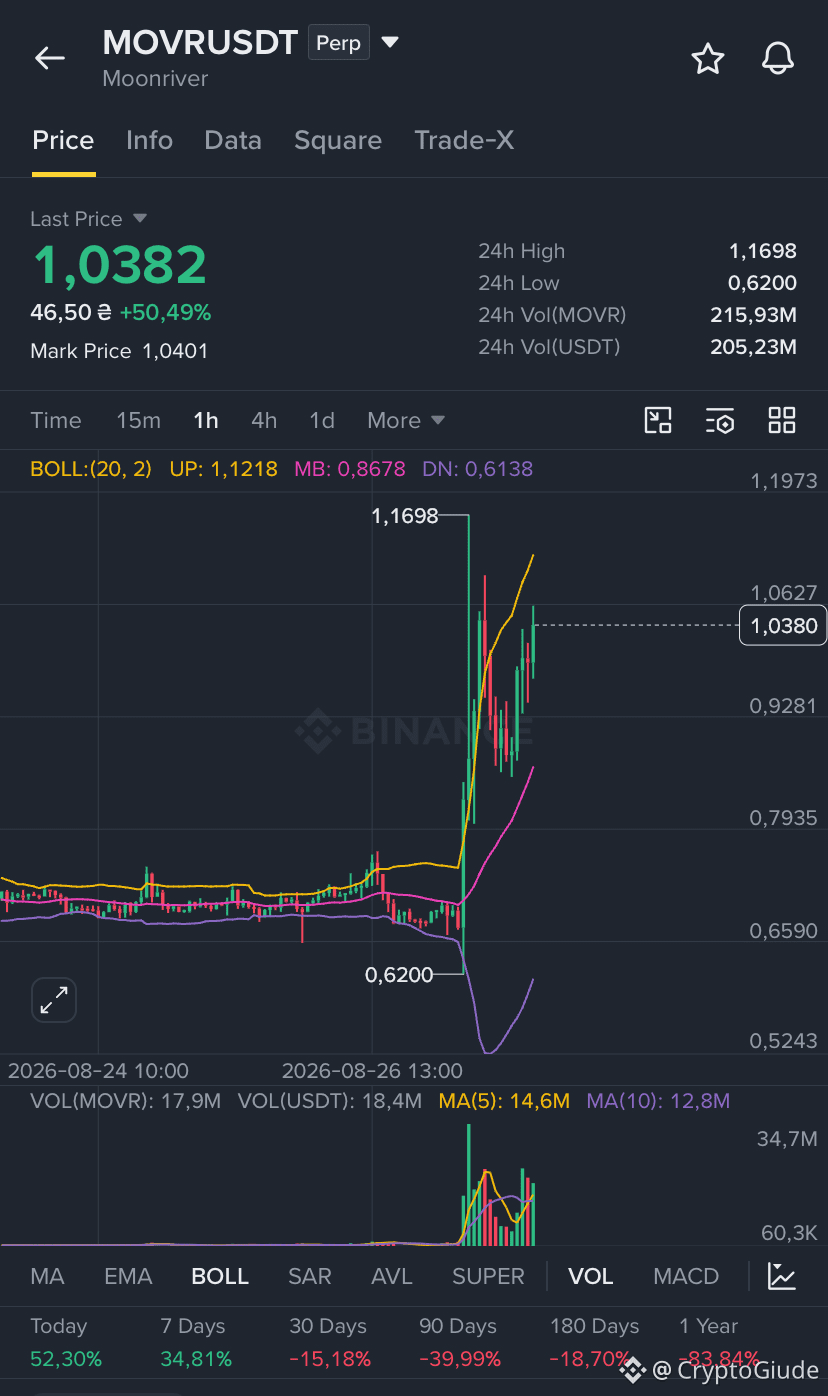
🚨 $MOVR is moving again.
Moonriver is around $1.03, up roughly 50% in 24H, with a spike to $1.17. Volume has exploded alongside the move — this is a real breakout, but it’s also extremely volatile.
The important part: I don’t see a fresh fundamental announcement today that justifies a 50% pump. The major recent development was MOVR’s migration to Base, completed earlier this month.
And there’s a serious risk that shouldn’t be ignored: Binance placed MOVR under its Monitoring Tag on August 11, meaning the token is under heightened review for listing/delisting criteria.
📊 Technically:
On the 1H chart, price is above the upper Bollinger Band ($1.12) after touching $1.17. That means momentum is strong, but chasing here is dangerous.
🟢 MOVR — LONG on pullback
💰 Entry: $0.95–1.02
🎯 TP1: $1.10
🎯 TP2: $1.17
🎯 TP3: $1.25–1.30
🛑 SL: $0.88
🚀 Leverage: 2–3x
If $0.95–1.00 holds, I’d expect another attempt at $1.17. A clean breakout above $1.17 with volume could open $1.25+.
But if MOVR loses $0.88, this pump can unwind very quickly.
My take: the move is real, but the catalyst is not clear enough to blindly chase it. Let the price come to you. 👀
#movr #moonriver #Futures #trading #Binance
Moonriver is around $1.03, up roughly 50% in 24H, with a spike to $1.17. Volume has exploded alongside the move — this is a real breakout, but it’s also extremely volatile.
The important part: I don’t see a fresh fundamental announcement today that justifies a 50% pump. The major recent development was MOVR’s migration to Base, completed earlier this month.
And there’s a serious risk that shouldn’t be ignored: Binance placed MOVR under its Monitoring Tag on August 11, meaning the token is under heightened review for listing/delisting criteria.
📊 Technically:
On the 1H chart, price is above the upper Bollinger Band ($1.12) after touching $1.17. That means momentum is strong, but chasing here is dangerous.
🟢 MOVR — LONG on pullback
💰 Entry: $0.95–1.02
🎯 TP1: $1.10
🎯 TP2: $1.17
🎯 TP3: $1.25–1.30
🛑 SL: $0.88
🚀 Leverage: 2–3x
If $0.95–1.00 holds, I’d expect another attempt at $1.17. A clean breakout above $1.17 with volume could open $1.25+.
But if MOVR loses $0.88, this pump can unwind very quickly.
My take: the move is real, but the catalyst is not clear enough to blindly chase it. Let the price come to you. 👀
#movr #moonriver #Futures #trading #Binance
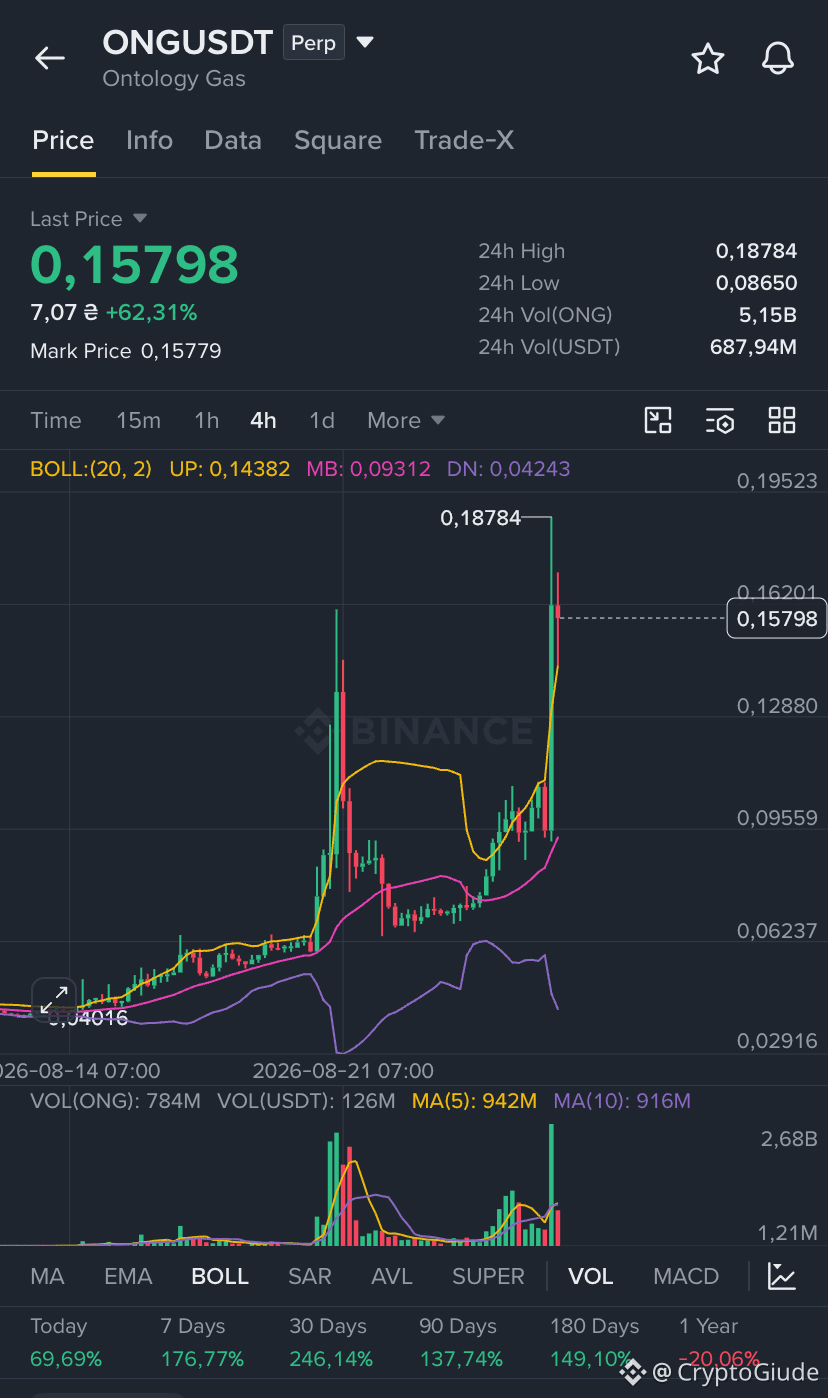
🚨 $ONG is going parabolic again.
Ontology Gas is now around $0.158, up 62% in 24H, after touching $0.188. Volume has exploded, but the important part is that there is no confirmed major new announcement today that alone explains this move. Recent coverage links the rally mainly to renewed market strength, speculation around Ontology’s tokenomics and its 2026 AI/data strategy.
The fundamentals are still interesting: ONG’s supply was permanently capped at 800M after a 200M burn, while 100M ONG-equivalent liquidity was permanently locked. Ontology also cut network gas fees by 80%.
📊 Technically: this is already an overheated move. On the 4H chart, ONG is trading above the upper Bollinger Band ($0.144) and just rejected from $0.188.
🟢 ONG — LONG only on pullback
💰 Entry: $0.135–0.150
🎯 TP1: $0.175
🎯 TP2: $0.188
🎯 TP3: $0.21–0.22
🛑 SL: $0.125
🚀 Leverage: 2–3x
I would NOT chase ONG at $0.158 after a 60%+ candle. If $0.135–0.145 holds, another attack on $0.188 becomes realistic. If that level breaks with volume, the next psychological zone is around $0.20+.
But if $0.135 fails, this can turn into a very fast retracement.
The question now isn’t whether ONG can pump — it already did. The question is whether buyers can hold the breakout. 👀
#Ong #Ontology #crypto #trading #Binance
Ontology Gas is now around $0.158, up 62% in 24H, after touching $0.188. Volume has exploded, but the important part is that there is no confirmed major new announcement today that alone explains this move. Recent coverage links the rally mainly to renewed market strength, speculation around Ontology’s tokenomics and its 2026 AI/data strategy.
The fundamentals are still interesting: ONG’s supply was permanently capped at 800M after a 200M burn, while 100M ONG-equivalent liquidity was permanently locked. Ontology also cut network gas fees by 80%.
📊 Technically: this is already an overheated move. On the 4H chart, ONG is trading above the upper Bollinger Band ($0.144) and just rejected from $0.188.
🟢 ONG — LONG only on pullback
💰 Entry: $0.135–0.150
🎯 TP1: $0.175
🎯 TP2: $0.188
🎯 TP3: $0.21–0.22
🛑 SL: $0.125
🚀 Leverage: 2–3x
I would NOT chase ONG at $0.158 after a 60%+ candle. If $0.135–0.145 holds, another attack on $0.188 becomes realistic. If that level breaks with volume, the next psychological zone is around $0.20+.
But if $0.135 fails, this can turn into a very fast retracement.
The question now isn’t whether ONG can pump — it already did. The question is whether buyers can hold the breakout. 👀
#Ong #Ontology #crypto #trading #Binance
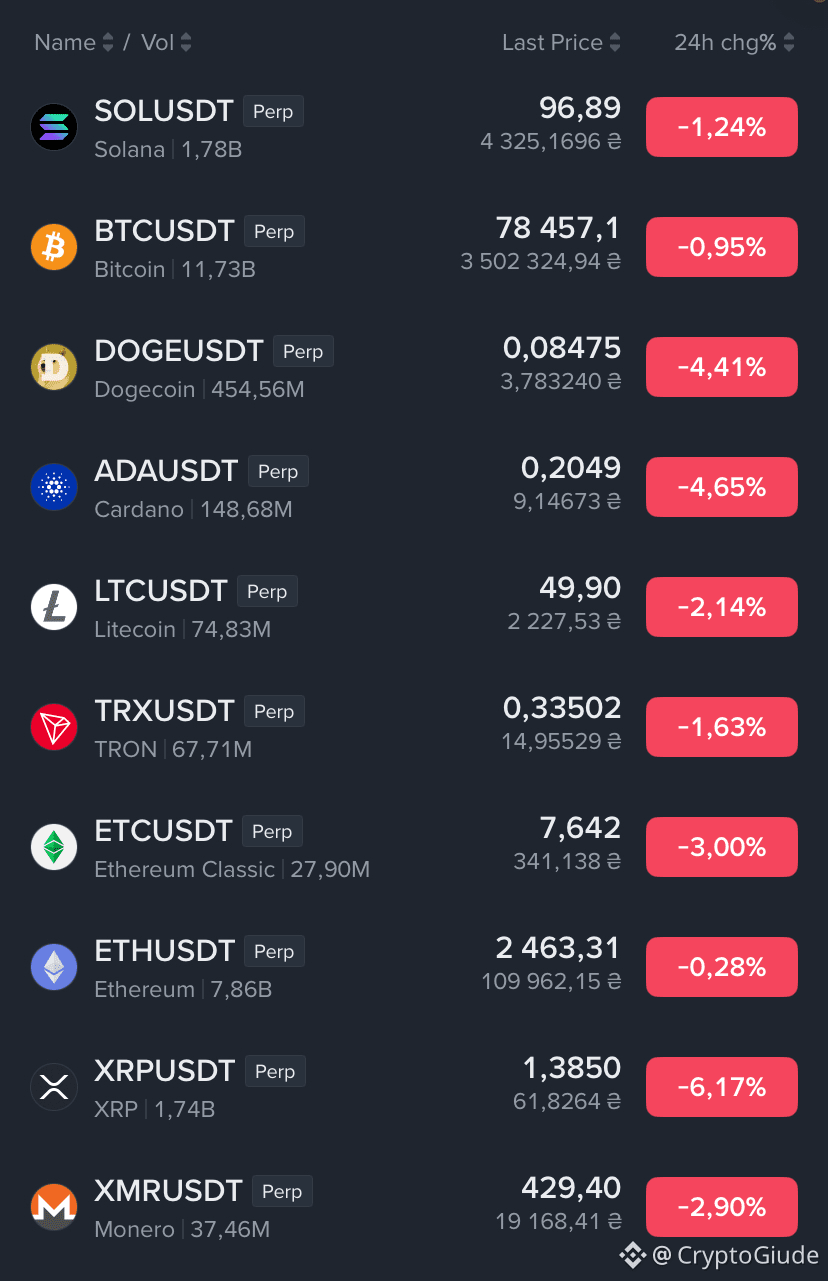
🚨 Why is the ENTIRE market in the red today?
Crypto is seeing a widespread pullback after failing to hold recent local highs. The primary driver is a macro cooling effect mixed with aggressive futures deleveraging. Tight central bank monetary policies and sticky interest rate expectations continue to limit fresh risk-on capital, while over-leveraged long positions were hit with a wave of forced liquidations as Bitcoin lost its $80K momentum.
📌 3 Key Tokens Most Impacted Today:
* $XRP (-6.17% | $1.3850): Hit hard by derivatives liquidations. Despite surging ETF inflow metrics, high leverage on XRP futures makes it heavily vulnerable to steep deleveraging wipes when BTC pulls back.
* $ADA (-4.65% | $0.2049): High-beta altcoins with thinner spot order books face immediate capital flight to stablecoins during market dips, breaking local support levels.
* $BTC (-0.95% | $78,457): The market anchor. Holding above the critical $77,000–$78,000 support zone is vital to prevent deeper altcoin downside.
📊 What’s next?
This is an unwinding of over-leveraged positions, not a structural collapse
* Bull Scenario: If BTC stabilizes above $78K, expect market consolidation and a gradual relief bounce.
* Bear Scenario: A breakdown below $77K opens the door for a deeper 5–10% altcoin sell-off.
💡 Trader Tip: Never catch falling knives on high leverage during red-market flushes. Wait for explicit volume exhaustion and base confirmation! 👀📉
#crypto #BTC #xrp #ADA #CryptoMarket
Crypto is seeing a widespread pullback after failing to hold recent local highs. The primary driver is a macro cooling effect mixed with aggressive futures deleveraging. Tight central bank monetary policies and sticky interest rate expectations continue to limit fresh risk-on capital, while over-leveraged long positions were hit with a wave of forced liquidations as Bitcoin lost its $80K momentum.
📌 3 Key Tokens Most Impacted Today:
* $XRP (-6.17% | $1.3850): Hit hard by derivatives liquidations. Despite surging ETF inflow metrics, high leverage on XRP futures makes it heavily vulnerable to steep deleveraging wipes when BTC pulls back.
* $ADA (-4.65% | $0.2049): High-beta altcoins with thinner spot order books face immediate capital flight to stablecoins during market dips, breaking local support levels.
* $BTC (-0.95% | $78,457): The market anchor. Holding above the critical $77,000–$78,000 support zone is vital to prevent deeper altcoin downside.
📊 What’s next?
This is an unwinding of over-leveraged positions, not a structural collapse
* Bull Scenario: If BTC stabilizes above $78K, expect market consolidation and a gradual relief bounce.
* Bear Scenario: A breakdown below $77K opens the door for a deeper 5–10% altcoin sell-off.
💡 Trader Tip: Never catch falling knives on high leverage during red-market flushes. Wait for explicit volume exhaustion and base confirmation! 👀📉
#crypto #BTC #xrp #ADA #CryptoMarket
🚨 $BTR just went absolutely vertical.
Bitlayer (BTR) is now around $0.14, up more than 300% in 24H. CoinMarketCap confirms the move, with roughly $250M+ in 24H volume — enormous for a token with a market cap still under $50M.
But here’s the important part: I can’t find a confirmed fundamental announcement today that explains a +300% move. Current reporting also points to speculation/liquidity rather than one clear catalyst.
And there’s a serious warning: a large BTR unlock is scheduled for August 27. Depending on the tracker, it’s around 19–39M BTR, potentially several percent of total supply.
📊 My view:
After a 300%+ pump, I would NOT chase BTR at $0.14.
🔴 BTR — SHORT on rejection
💰 Entry: $0.14–0.16
🎯 TP1: $0.115
🎯 TP2: $0.095
🎯 TP3: $0.075
🛑 SL: $0.17
🚀 Leverage: 2–3x
Alternatively, the safer play is simply to wait for a pullback and see whether $0.10–0.11 becomes support.
The crazy part? BTR is simultaneously pumping hundreds of percent right before a sizable unlock. That makes the next 24–48 hours extremely interesting.
Can this become another 500% move — or are late buyers about to become exit liquidity? 👀
#BTR #Bitlayer #Crypto #futures #Binance
Bitlayer (BTR) is now around $0.14, up more than 300% in 24H. CoinMarketCap confirms the move, with roughly $250M+ in 24H volume — enormous for a token with a market cap still under $50M.
But here’s the important part: I can’t find a confirmed fundamental announcement today that explains a +300% move. Current reporting also points to speculation/liquidity rather than one clear catalyst.
And there’s a serious warning: a large BTR unlock is scheduled for August 27. Depending on the tracker, it’s around 19–39M BTR, potentially several percent of total supply.
📊 My view:
After a 300%+ pump, I would NOT chase BTR at $0.14.
🔴 BTR — SHORT on rejection
💰 Entry: $0.14–0.16
🎯 TP1: $0.115
🎯 TP2: $0.095
🎯 TP3: $0.075
🛑 SL: $0.17
🚀 Leverage: 2–3x
Alternatively, the safer play is simply to wait for a pullback and see whether $0.10–0.11 becomes support.
The crazy part? BTR is simultaneously pumping hundreds of percent right before a sizable unlock. That makes the next 24–48 hours extremely interesting.
Can this become another 500% move — or are late buyers about to become exit liquidity? 👀
#BTR #Bitlayer #Crypto #futures #Binance
🚨 $ONG is back on the radar.
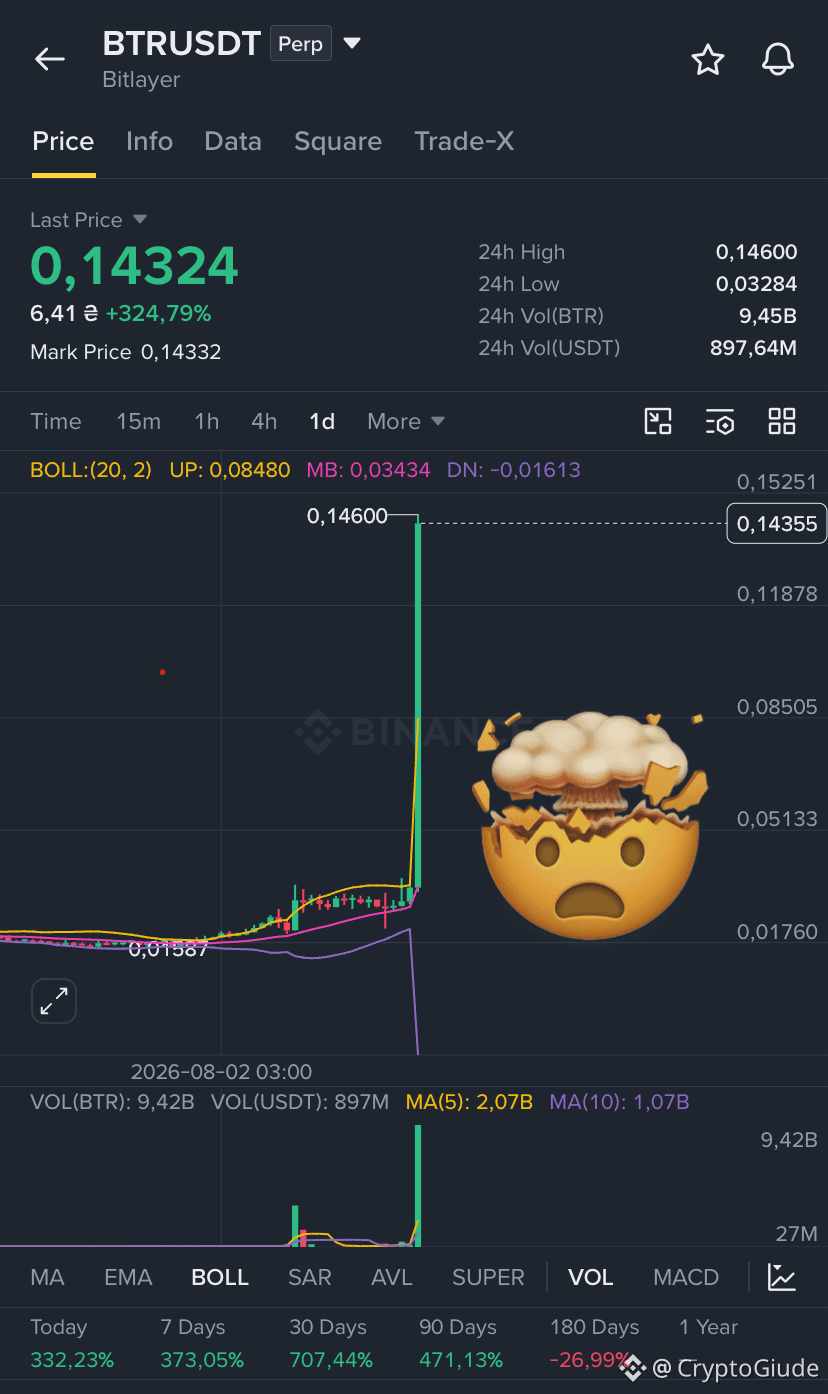
Ontology Gas has exploded from around $0.04 to above $0.16, then went through a brutal correction. Now ONG is back near $0.096 — and the move is still extremely volatile.
The main catalyst was the Ontology MainNet v3.1.2 upgrade, completed around August 21. It added Ethereum-compatible opcodes to the Ontology EVM, making it easier for Ethereum developers to build on the network.
There is also a real tokenomics change behind ONG: 200M ONG were burned, permanently capping supply at 800M, with additional liquidity-lock mechanisms.
📊 Technically: after the parabolic move, ONG is now trying to build a new base around $0.08–0.09. Above $0.10, momentum could return toward $0.12–0.15. Losing $0.08 would make another move toward $0.07 much more likely.
🟢 ONG — LONG on pullback
💰 Entry: $0.088–0.096
🎯 TP1: $0.105
🎯 TP2: $0.12
🎯 TP3: $0.145–0.15
🛑 SL: $0.078
🚀 Leverage: 3–5x
One thing to watch: Upbit is scheduled to suspend ONG deposits/withdrawals on August 26 for a wallet upgrade. Trading remains active, so this is not a fundamental bearish signal, but it can temporarily affect liquidity.
My view: ONG has a legitimate catalyst behind it, but after a ~100%+ rally, chasing candles is dangerous. I’d rather see it hold $0.09 and then attack $0.10 with volume.
Can ONG turn this crazy pump into a real trend — or was the hard fork already priced in? 👀
#Ong #Ontology #crypto #trading #Binance
Ontology Gas has exploded from around $0.04 to above $0.16, then went through a brutal correction. Now ONG is back near $0.096 — and the move is still extremely volatile.
The main catalyst was the Ontology MainNet v3.1.2 upgrade, completed around August 21. It added Ethereum-compatible opcodes to the Ontology EVM, making it easier for Ethereum developers to build on the network.
There is also a real tokenomics change behind ONG: 200M ONG were burned, permanently capping supply at 800M, with additional liquidity-lock mechanisms.
📊 Technically: after the parabolic move, ONG is now trying to build a new base around $0.08–0.09. Above $0.10, momentum could return toward $0.12–0.15. Losing $0.08 would make another move toward $0.07 much more likely.
🟢 ONG — LONG on pullback
💰 Entry: $0.088–0.096
🎯 TP1: $0.105
🎯 TP2: $0.12
🎯 TP3: $0.145–0.15
🛑 SL: $0.078
🚀 Leverage: 3–5x
One thing to watch: Upbit is scheduled to suspend ONG deposits/withdrawals on August 26 for a wallet upgrade. Trading remains active, so this is not a fundamental bearish signal, but it can temporarily affect liquidity.
My view: ONG has a legitimate catalyst behind it, but after a ~100%+ rally, chasing candles is dangerous. I’d rather see it hold $0.09 and then attack $0.10 with volume.
Can ONG turn this crazy pump into a real trend — or was the hard fork already priced in? 👀
#Ong #Ontology #crypto #trading #Binance
🚨 $INJ is waking up.
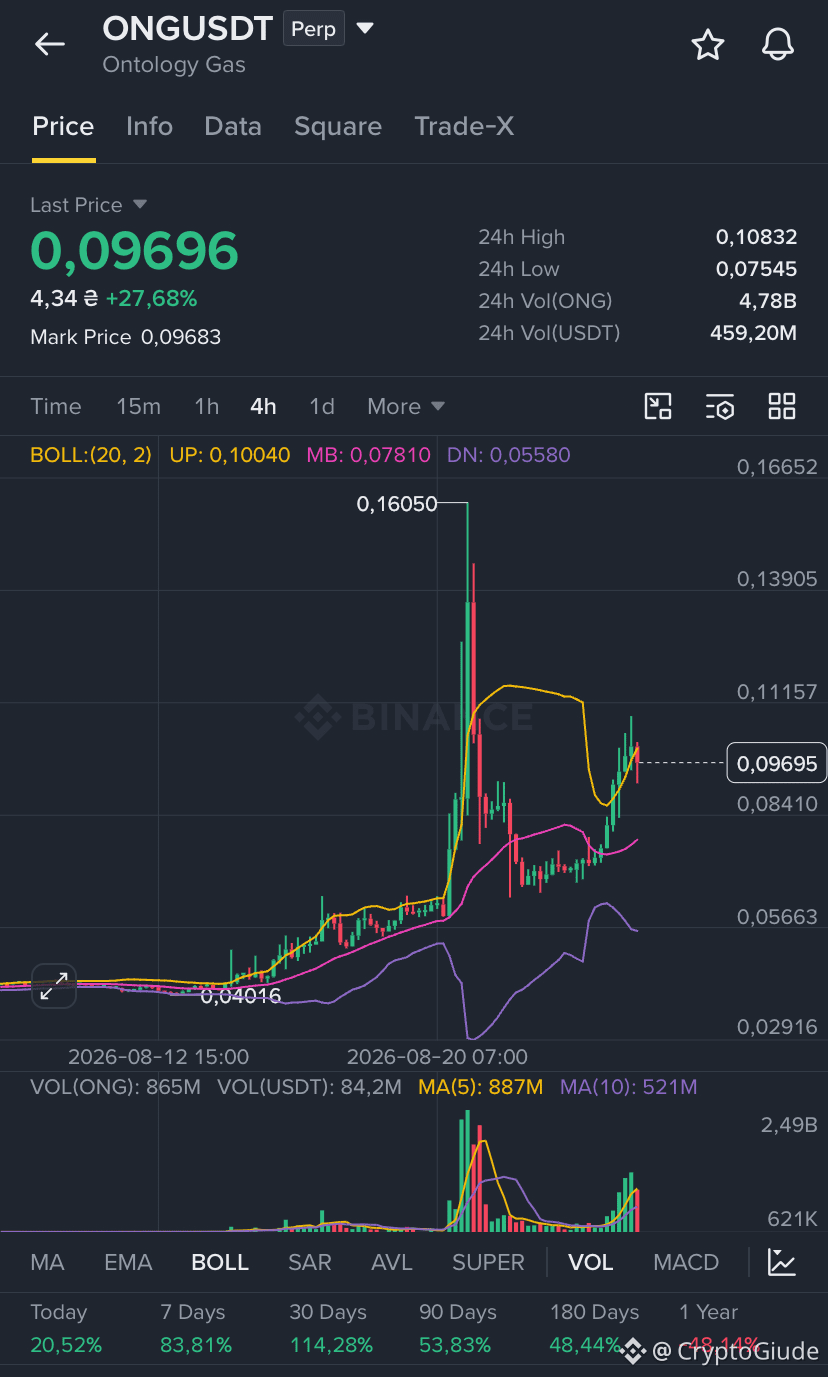
Injective is back around $5.69, after a strong recovery from the ~$4 area. The move is not coming out of nowhere.
The biggest recent catalyst is Injective’s SEC-registered transfer agent status, strengthening its push into regulated tokenized assets and RWAs. INJ also has 100% of its supply unlocked, with no future vesting unlocks, while monthly buybacks permanently burn tokens.
📊 Technically:
INJ has broken out of its recent range and is now approaching the $6 resistance. This is the key level.
🟢 INJ — LONG on pullback
💰 Entry: $5.35–5.70
🎯 TP1: $6.00
🎯 TP2: $6.50
🎯 TP3: $7.00–7.50
🛑 SL: $5.05
🚀 Leverage: 3–5x
The important part: don’t chase the green candle. If INJ holds above $5.30–5.40 and breaks $6 with volume, the recovery can continue. If $6 rejects hard, a pullback toward $5.0–5.3 would be completely normal.
Fundamentally, the story is getting stronger — regulated access, RWA/tokenization infrastructure and deflationary tokenomics are real developments, not just Twitter hype.
Now the question is simple: can INJ finally reclaim $6 and turn this recovery into a real trend? 👀
#INJ #injective #crypto #trading #Binance
Injective is back around $5.69, after a strong recovery from the ~$4 area. The move is not coming out of nowhere.
The biggest recent catalyst is Injective’s SEC-registered transfer agent status, strengthening its push into regulated tokenized assets and RWAs. INJ also has 100% of its supply unlocked, with no future vesting unlocks, while monthly buybacks permanently burn tokens.
📊 Technically:
INJ has broken out of its recent range and is now approaching the $6 resistance. This is the key level.
🟢 INJ — LONG on pullback
💰 Entry: $5.35–5.70
🎯 TP1: $6.00
🎯 TP2: $6.50
🎯 TP3: $7.00–7.50
🛑 SL: $5.05
🚀 Leverage: 3–5x
The important part: don’t chase the green candle. If INJ holds above $5.30–5.40 and breaks $6 with volume, the recovery can continue. If $6 rejects hard, a pullback toward $5.0–5.3 would be completely normal.
Fundamentally, the story is getting stronger — regulated access, RWA/tokenization infrastructure and deflationary tokenomics are real developments, not just Twitter hype.
Now the question is simple: can INJ finally reclaim $6 and turn this recovery into a real trend? 👀
#INJ #injective #crypto #trading #Binance
🚨 $PEOPLE breaks down -17% as speculative rally unwinds.
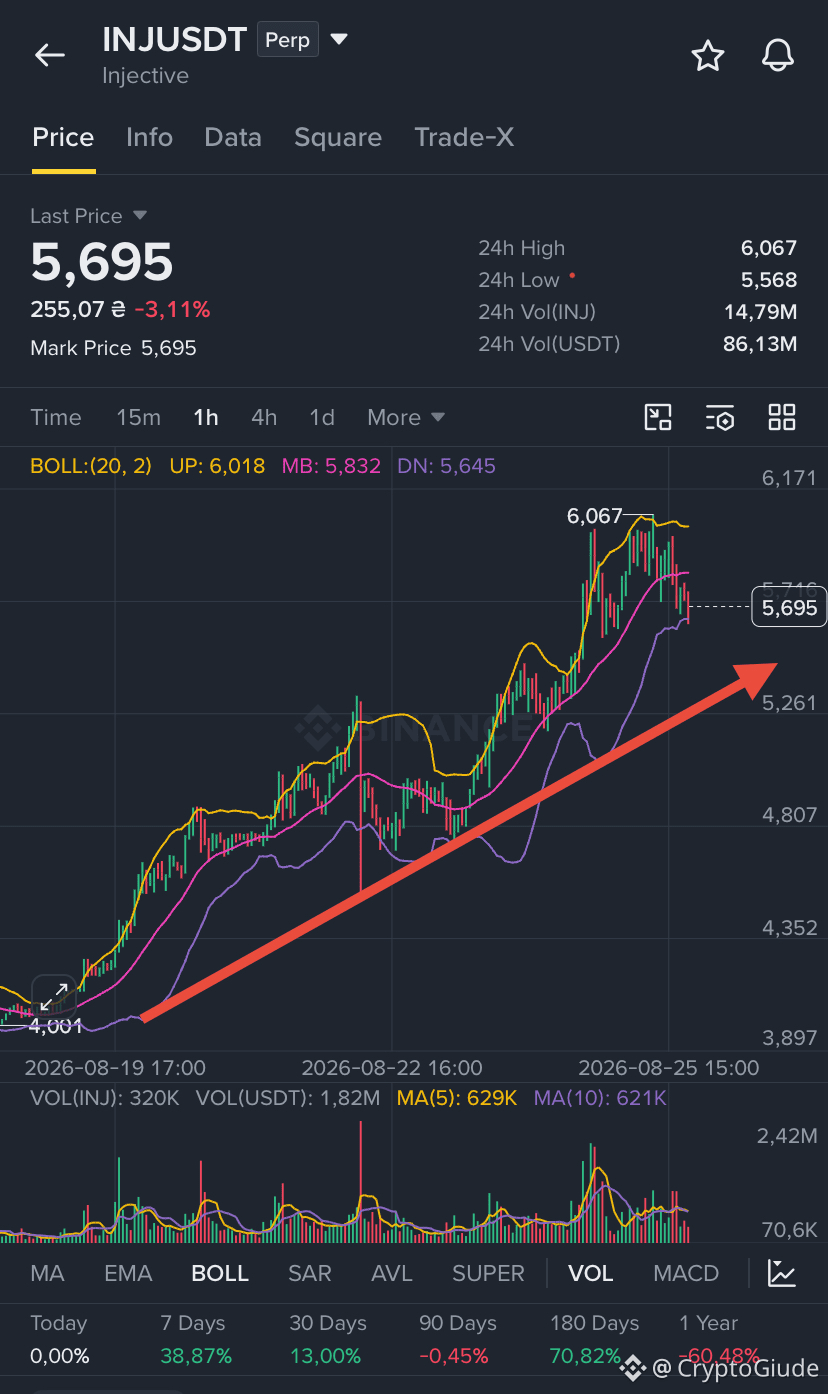
PEOPLE (ConstitutionDAO) is under heavy selling pressure on the 4H chart, falling from a local peak of $0.01314 down to $0.00811 (-17.60% daily). The drop has pushed the price directly against the lower 4H Bollinger Band (DN: 0.00819), breaking cleanly below the middle band (MB: 0.00991) on elevated volume ($26.16M USDT / 3.00B PEOPLE).
What is behind the drop?
1. Unwinding of Speculative Rally: After a rapid short squeeze and speculative pump above $0.013, overbought technical conditions triggered heavy profit-taking across spot and derivatives markets.
2. Lack of Fundamental Anchors: With ConstitutionDAO officially dissolved and operating purely as a historical meme asset, the token relies entirely on momentum. Recent venue adjustments (like Coinbase Futures delisting contracts) have reduced leverage avenues, leaving price action vulnerable when speculative interest cools.
📊 Technically:
PEOPLE is oversold on lower timeframes after testing the local low at $0.00800. While a temporary relief bounce back toward the 4H middle band ($0.0095–$0.0100) is plausible, catching falling wicks carries significant risk until support solidifies.
🔴 PEOPLE — SHORT (on relief rally)
💰 Entry: 0.00920 – 0.00980
⚙️ Margin: Cross
🎯 TP1: 0.00800
🎯 TP2: 0.00720
🎯 TP3: 0.00680
🚀 Leverage: 3x – 5x
🛑 Stop Loss: 0.01040
💡 Comment:
Catching a long knife after a -17% single-session drop is risky. The cleaner structural play is waiting for a weak relief bounce into resistance ($0.0092–$0.0098) to position with the prevailing trend.
If $0.0080 fails to hold, expect an immediate breakdown toward the $0.0068 support zone.
Conversely, a strong 4H reclamation back above $0.0102 invalidates the immediate bearish momentum. Keep tight risk control! 👀📉
#PEOPLE #Binance #futures #crypto #Trading
PEOPLE (ConstitutionDAO) is under heavy selling pressure on the 4H chart, falling from a local peak of $0.01314 down to $0.00811 (-17.60% daily). The drop has pushed the price directly against the lower 4H Bollinger Band (DN: 0.00819), breaking cleanly below the middle band (MB: 0.00991) on elevated volume ($26.16M USDT / 3.00B PEOPLE).
What is behind the drop?
1. Unwinding of Speculative Rally: After a rapid short squeeze and speculative pump above $0.013, overbought technical conditions triggered heavy profit-taking across spot and derivatives markets.
2. Lack of Fundamental Anchors: With ConstitutionDAO officially dissolved and operating purely as a historical meme asset, the token relies entirely on momentum. Recent venue adjustments (like Coinbase Futures delisting contracts) have reduced leverage avenues, leaving price action vulnerable when speculative interest cools.
📊 Technically:
PEOPLE is oversold on lower timeframes after testing the local low at $0.00800. While a temporary relief bounce back toward the 4H middle band ($0.0095–$0.0100) is plausible, catching falling wicks carries significant risk until support solidifies.
🔴 PEOPLE — SHORT (on relief rally)
💰 Entry: 0.00920 – 0.00980
⚙️ Margin: Cross
🎯 TP1: 0.00800
🎯 TP2: 0.00720
🎯 TP3: 0.00680
🚀 Leverage: 3x – 5x
🛑 Stop Loss: 0.01040
💡 Comment:
Catching a long knife after a -17% single-session drop is risky. The cleaner structural play is waiting for a weak relief bounce into resistance ($0.0092–$0.0098) to position with the prevailing trend.
If $0.0080 fails to hold, expect an immediate breakdown toward the $0.0068 support zone.
Conversely, a strong 4H reclamation back above $0.0102 invalidates the immediate bearish momentum. Keep tight risk control! 👀📉
#PEOPLE #Binance #futures #crypto #Trading
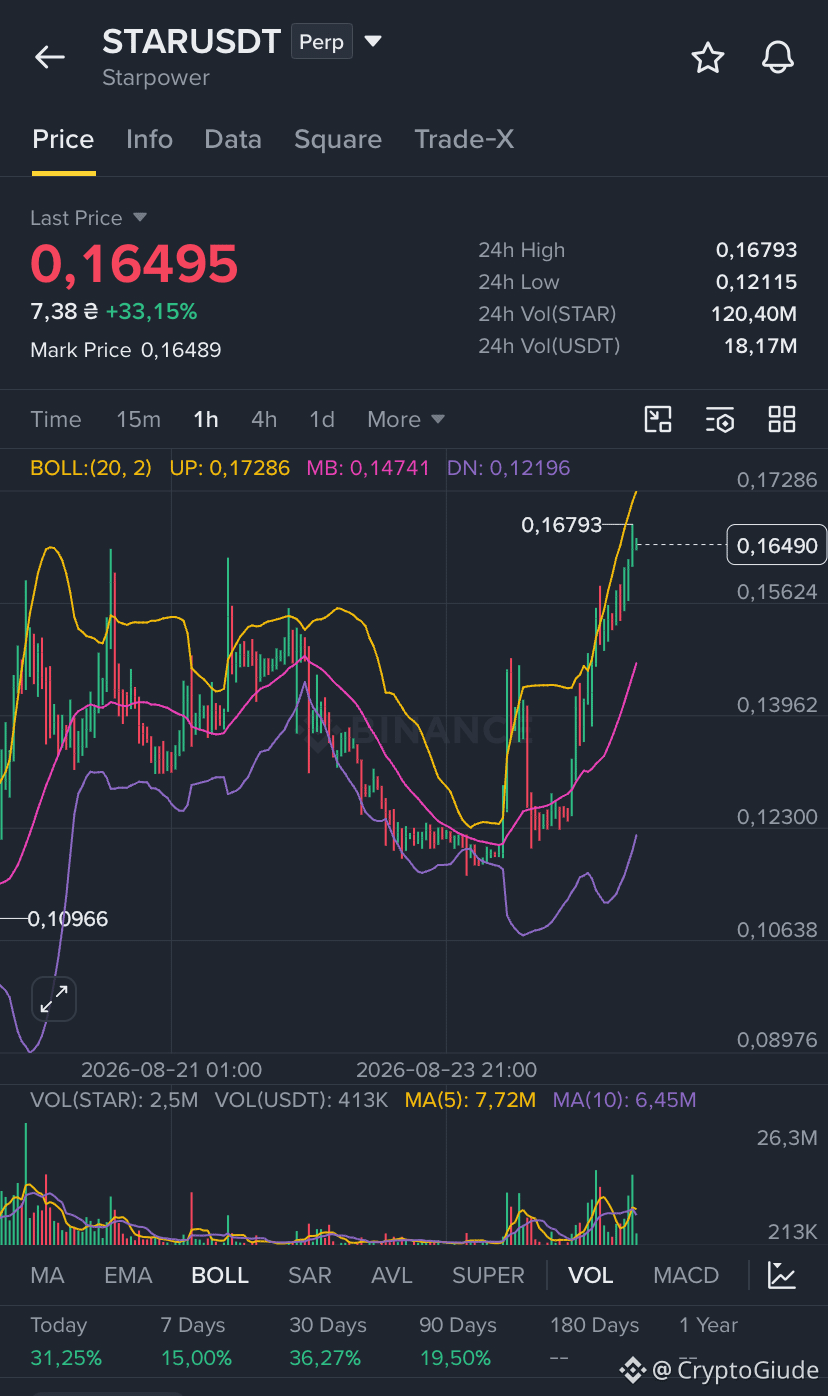
🚨 $STAR breaks out +33% as DePIN energy hype revives!
STAR (Starpower) is printing a vertical impulsive wave on the 1H chart, rallying from $0.1211 to a high of $0.1679 before consolidating around $0.1649 (+33.15% daily). The price expanded aggressively along the upper Bollinger Band (UP: 0.1728) backed by $18.17M USDT volume (120.4M STAR), pushing past previous local consolidation blocks.
What is behind the surge?
* DePIN & AI Energy Narrative: Starpower has been gaining traction in the Decentralized Physical Infrastructure (DePIN) sector, focusing on connecting real-world distributed energy hardware (smart plugs, solar, home batteries) to power AI-driven virtual power plants.
* Technical Breakout & Squeeze: After consolidating around $0.12–$0.13, a sudden influx of buying volume triggered short liquidations on derivatives markets, driving price straight toward $0.168.
📊 Technically:
STAR has stretched far above its 1H Bollinger Middle Band (MB: 0.1474). While the higher timeframe structure looks bullish, buying into a near-vertical candle right near upper resistance ($0.168–$0.172) carries elevated short-term risk.
🟢 STAR — LONG (on pullback)
💰 Entry: 0.1420 – 0.1490
⚙️ Margin: Cross
🎯 TP1: 0.1680
🎯 TP2: 0.1850
🎯 TP3: 0.2100
🚀 Leverage: 3x – 5x (Low leverage strictly recommended)
🛑 Stop Loss: 0.1310
💡 Comment:
I wouldn't chase $0.165 after this steep move. The cleaner setup is a retest of the $0.142–$0.149 zone to confirm buyers hold the middle band as new support.
If $0.168 breaks with sustained 1H volume, STAR could push into another expansion leg toward $0.185+.
However, if $0.139 fails to hold, expect a deeper correction back down toward $0.122–$0.125. Strictly manage your risk! 👀📈
#star #Starpower #futures #crypto #Trading
STAR (Starpower) is printing a vertical impulsive wave on the 1H chart, rallying from $0.1211 to a high of $0.1679 before consolidating around $0.1649 (+33.15% daily). The price expanded aggressively along the upper Bollinger Band (UP: 0.1728) backed by $18.17M USDT volume (120.4M STAR), pushing past previous local consolidation blocks.
What is behind the surge?
* DePIN & AI Energy Narrative: Starpower has been gaining traction in the Decentralized Physical Infrastructure (DePIN) sector, focusing on connecting real-world distributed energy hardware (smart plugs, solar, home batteries) to power AI-driven virtual power plants.
* Technical Breakout & Squeeze: After consolidating around $0.12–$0.13, a sudden influx of buying volume triggered short liquidations on derivatives markets, driving price straight toward $0.168.
📊 Technically:
STAR has stretched far above its 1H Bollinger Middle Band (MB: 0.1474). While the higher timeframe structure looks bullish, buying into a near-vertical candle right near upper resistance ($0.168–$0.172) carries elevated short-term risk.
🟢 STAR — LONG (on pullback)
💰 Entry: 0.1420 – 0.1490
⚙️ Margin: Cross
🎯 TP1: 0.1680
🎯 TP2: 0.1850
🎯 TP3: 0.2100
🚀 Leverage: 3x – 5x (Low leverage strictly recommended)
🛑 Stop Loss: 0.1310
💡 Comment:
I wouldn't chase $0.165 after this steep move. The cleaner setup is a retest of the $0.142–$0.149 zone to confirm buyers hold the middle band as new support.
If $0.168 breaks with sustained 1H volume, STAR could push into another expansion leg toward $0.185+.
However, if $0.139 fails to hold, expect a deeper correction back down toward $0.122–$0.125. Strictly manage your risk! 👀📈
#star #Starpower #futures #crypto #Trading
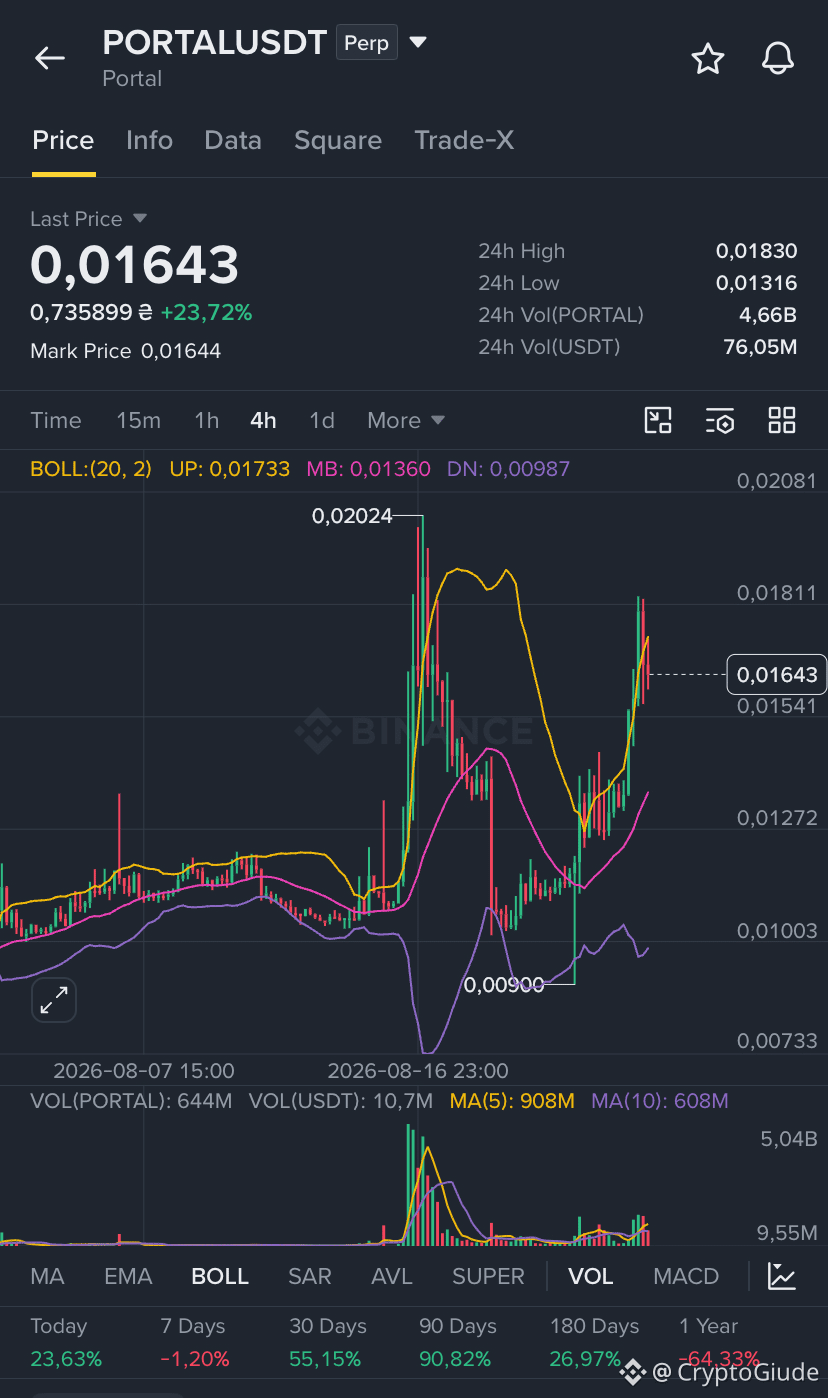
🚨 $PORTAL surges +23% after test of local bottom!
PORTAL (Portal) is printing strong bullish momentum on the 4H chart, bouncing hard from the local low of $0.00900 to reach $0.01643 (+23.72% daily). The move triggered a test of the 4H upper Bollinger Band at $0.01733, with recent price wicks hitting $0.01830 on massive volume ($76M+ USDT / 4.66B PORTAL).
What is behind the surge?
* Portal 2.0 & AI Gaming Catalyst: Fundamental momentum has built up following the rollout of the Portal 2.0 upgrade, bringing AI-powered gaming creation tools and the integration of the Portal Shop. This ecosystem pivot aims to drive platform transaction fee burns.
* Derivatives Expansion & Short Squeeze: After consolidating around micro-cap levels, a sudden influx of derivatives volume pushed liquidity straight through local resistances, accelerating short-side liquidations.
📊 Technically:
PORTAL reached a high of $0.02024 during its previous spike before entering a broad pullback down to $0.0090. While the recent expansion past the middle band (MB: 0.01360) is strongly bullish, buying directly under the $0.0173–$0.0183 upper resistance carries elevated short-term risk.
🟢 PORTAL — LONG (on pullback)
💰 Entry: 0.0138 – 0.0148
⚙️ Margin: Cross
🎯 TP1: 0.0175
🎯 TP2: 0.0202
🎯 TP3: 0.0235
🚀 Leverage: 3x – 5x
🛑 Stop Loss: 0.0125
💡 Comment:
I wouldn't chase $0.0164 after this vertical move. The cleaner setup is a retest of the $0.0138–$0.0148 zone to confirm buyers defend the middle band area.
If $0.0183 breaks with strong 4H volume, PORTAL can enter another expansion leg toward $0.0202+.
However, if $0.0130 fails to hold, expect a deeper correction back down toward $0.0105–$0.0110. Manage risk strictly! 👀📈
#Portal #Binance #signal #crypto #Trading
PORTAL (Portal) is printing strong bullish momentum on the 4H chart, bouncing hard from the local low of $0.00900 to reach $0.01643 (+23.72% daily). The move triggered a test of the 4H upper Bollinger Band at $0.01733, with recent price wicks hitting $0.01830 on massive volume ($76M+ USDT / 4.66B PORTAL).
What is behind the surge?
* Portal 2.0 & AI Gaming Catalyst: Fundamental momentum has built up following the rollout of the Portal 2.0 upgrade, bringing AI-powered gaming creation tools and the integration of the Portal Shop. This ecosystem pivot aims to drive platform transaction fee burns.
* Derivatives Expansion & Short Squeeze: After consolidating around micro-cap levels, a sudden influx of derivatives volume pushed liquidity straight through local resistances, accelerating short-side liquidations.
📊 Technically:
PORTAL reached a high of $0.02024 during its previous spike before entering a broad pullback down to $0.0090. While the recent expansion past the middle band (MB: 0.01360) is strongly bullish, buying directly under the $0.0173–$0.0183 upper resistance carries elevated short-term risk.
🟢 PORTAL — LONG (on pullback)
💰 Entry: 0.0138 – 0.0148
⚙️ Margin: Cross
🎯 TP1: 0.0175
🎯 TP2: 0.0202
🎯 TP3: 0.0235
🚀 Leverage: 3x – 5x
🛑 Stop Loss: 0.0125
💡 Comment:
I wouldn't chase $0.0164 after this vertical move. The cleaner setup is a retest of the $0.0138–$0.0148 zone to confirm buyers defend the middle band area.
If $0.0183 breaks with strong 4H volume, PORTAL can enter another expansion leg toward $0.0202+.
However, if $0.0130 fails to hold, expect a deeper correction back down toward $0.0105–$0.0110. Manage risk strictly! 👀📈
#Portal #Binance #signal #crypto #Trading
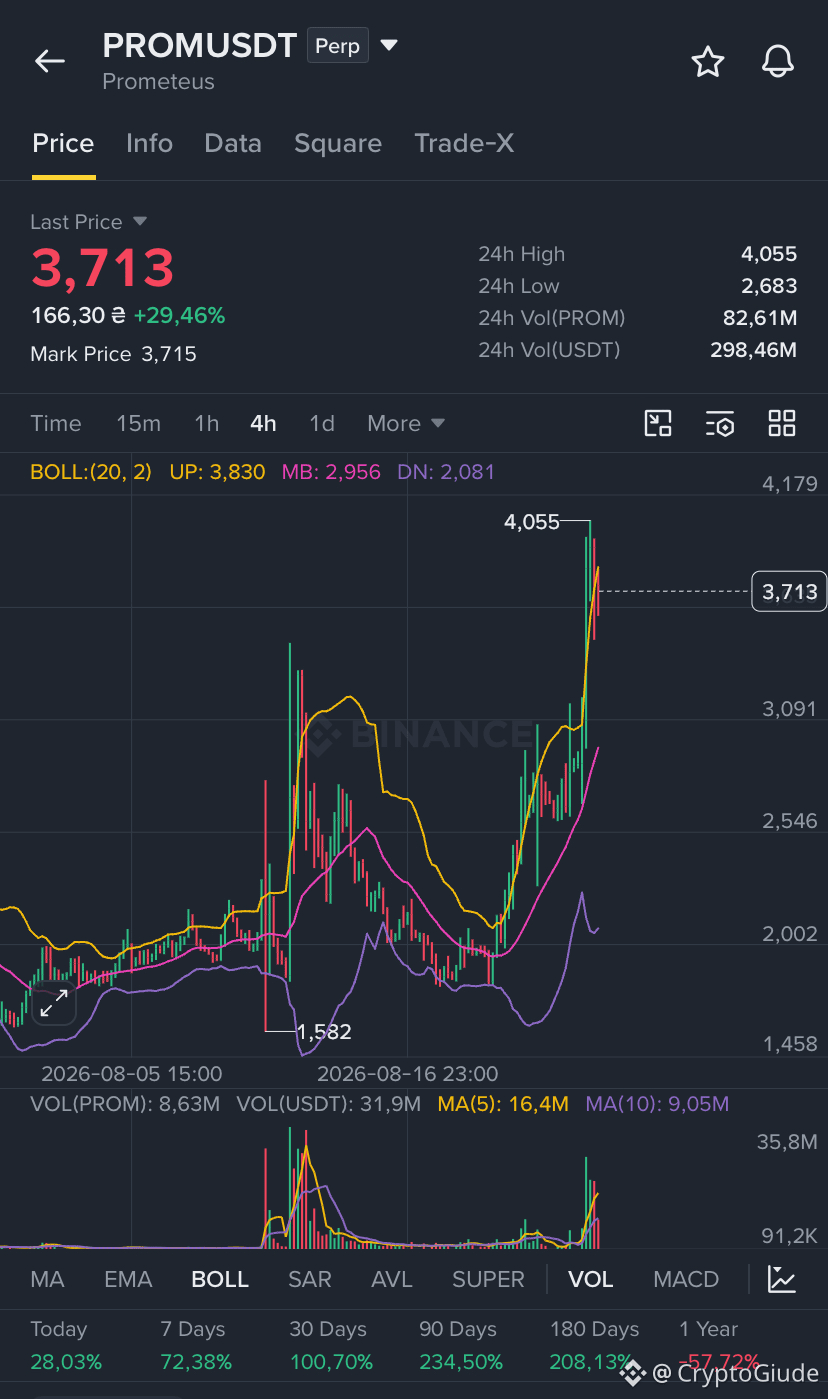
🚨 $PROM is breaking out hard.
Prom (PROM) is now around $3.71, up almost 30% in 24H, after a massive move from ~$1.90 just a few days ago. The rally has come with a huge expansion in trading activity.
There is a fundamental catalyst behind the recent move: Prom announced a partnership with PoPP, focused on connecting on-chain reputation with Prom’s infrastructure. But the latest price action is also clearly being amplified by derivatives and speculative momentum — there’s no single new announcement explaining today’s entire +30% move.
📊 Technically:
PROM is now above the 4H Bollinger upper band at $3.83, with the recent high at $4.055. That’s bullish — but also seriously overheated.
🟢 PROM — LONG on pullback
💰 Entry: 3.20–3.40
🎯 TP1: 3.80
🎯 TP2: 4.05
🎯 TP3: 4.50
🛑 SL: 2.90
🚀 Leverage: 2–3x
I wouldn’t chase $3.70 after this move. The cleaner setup is a retest of $3.20–3.40 and confirmation that buyers defend it.
If $4.05 breaks with volume, PROM could enter another momentum leg toward $4.50+.
But if $3.20 fails, I’d expect a deeper correction toward $2.90–3.00.
PROM is clearly one of the strongest movers right now — but after a move of this magnitude, protecting capital matters more than catching the exact top. 👀📈
#prom #Binance #futures #crypto #Trading
Prom (PROM) is now around $3.71, up almost 30% in 24H, after a massive move from ~$1.90 just a few days ago. The rally has come with a huge expansion in trading activity.
There is a fundamental catalyst behind the recent move: Prom announced a partnership with PoPP, focused on connecting on-chain reputation with Prom’s infrastructure. But the latest price action is also clearly being amplified by derivatives and speculative momentum — there’s no single new announcement explaining today’s entire +30% move.
📊 Technically:
PROM is now above the 4H Bollinger upper band at $3.83, with the recent high at $4.055. That’s bullish — but also seriously overheated.
🟢 PROM — LONG on pullback
💰 Entry: 3.20–3.40
🎯 TP1: 3.80
🎯 TP2: 4.05
🎯 TP3: 4.50
🛑 SL: 2.90
🚀 Leverage: 2–3x
I wouldn’t chase $3.70 after this move. The cleaner setup is a retest of $3.20–3.40 and confirmation that buyers defend it.
If $4.05 breaks with volume, PROM could enter another momentum leg toward $4.50+.
But if $3.20 fails, I’d expect a deeper correction toward $2.90–3.00.
PROM is clearly one of the strongest movers right now — but after a move of this magnitude, protecting capital matters more than catching the exact top. 👀📈
#prom #Binance #futures #crypto #Trading
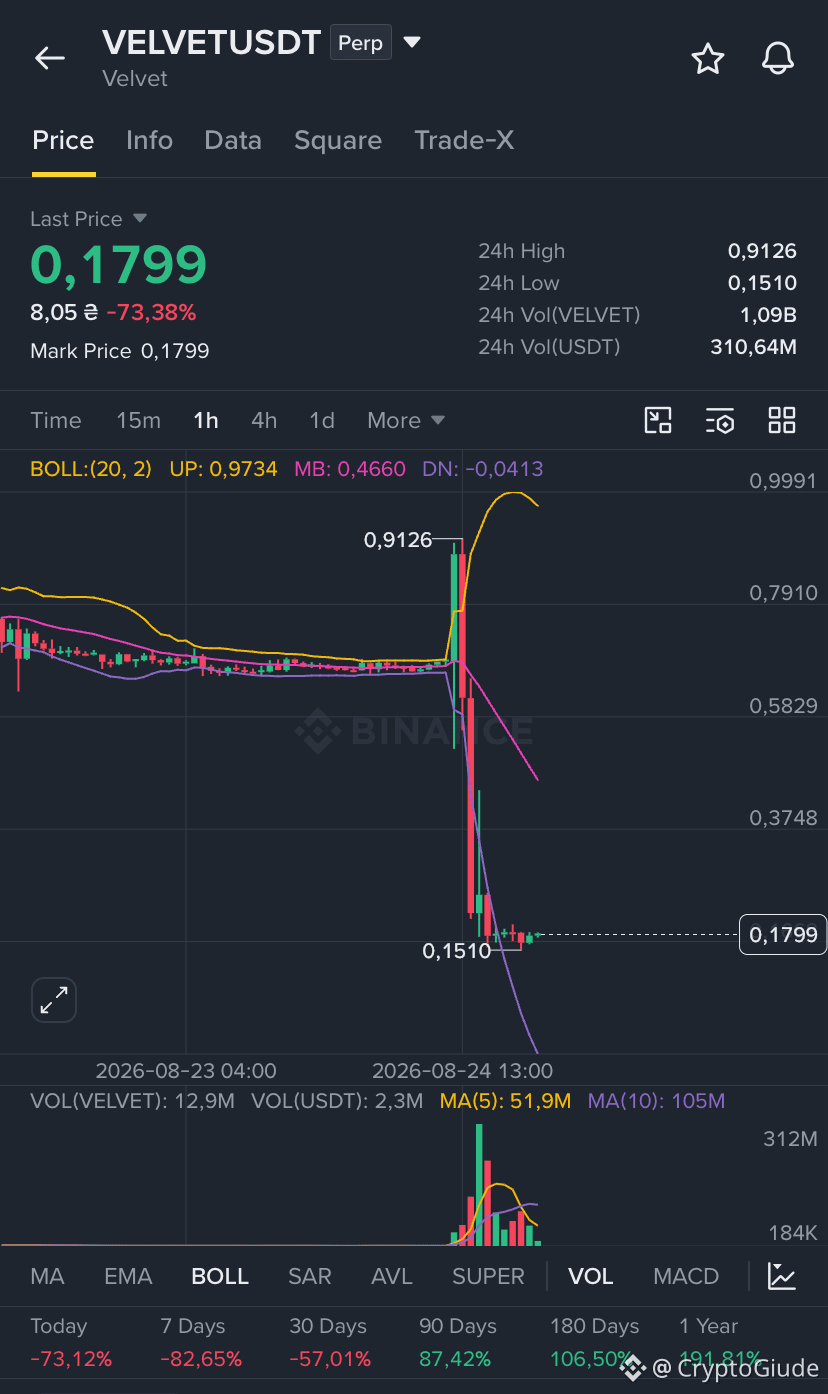
🚨 VELVET just got absolutely destroyed.
$VELVET collapsed from $0.91 to $0.15 in a matter of hours and is now around $0.18, down more than 73% in 24H. Volume exploded during the move — this looks like a massive liquidation/forced-selling event rather than a normal correction. Market data from other venues also confirms the extreme intraday collapse.
The important part: I can’t find evidence of a new hack or fundamental exploit behind today’s move. Recent coverage instead points to how extremely overextended VELVET had become after a huge rally, with thin liquidity making the reversal much more violent.
📊 Technically:
Price is far below the 1H Bollinger middle band at $0.466. The low at $0.151 is now the key support.
🔴 VELVET — SHORT on bounce
💰 Entry: 0.25–0.32
🎯 TP1: 0.18
🎯 TP2: 0.15
🎯 TP3: 0.12
🛑 SL: 0.37
🚀 Leverage: 2–3x
⚠️ Do NOT chase the dump. After a -73% candle, another violent short squeeze is absolutely possible.
If VELVET can reclaim $0.32–0.37, I would cancel the short idea and wait. If it stays below that zone, the market is still showing no real recovery.
And there is another problem: 58.7% of the total VELVET supply remains locked, with the next scheduled unlock on September 10 releasing ~19.6M tokens.
VELVET already went from one of the hottest AI/DeFAI narratives to a 73% single-day collapse.
Now the question isn’t “where is the bottom?”
It’s whether buyers can actually defend $0.15 — or whether this was only the first liquidation wave. 👀📉
#Velvet #Binance #futures #crypto #Trading
$VELVET collapsed from $0.91 to $0.15 in a matter of hours and is now around $0.18, down more than 73% in 24H. Volume exploded during the move — this looks like a massive liquidation/forced-selling event rather than a normal correction. Market data from other venues also confirms the extreme intraday collapse.
The important part: I can’t find evidence of a new hack or fundamental exploit behind today’s move. Recent coverage instead points to how extremely overextended VELVET had become after a huge rally, with thin liquidity making the reversal much more violent.
📊 Technically:
Price is far below the 1H Bollinger middle band at $0.466. The low at $0.151 is now the key support.
🔴 VELVET — SHORT on bounce
💰 Entry: 0.25–0.32
🎯 TP1: 0.18
🎯 TP2: 0.15
🎯 TP3: 0.12
🛑 SL: 0.37
🚀 Leverage: 2–3x
⚠️ Do NOT chase the dump. After a -73% candle, another violent short squeeze is absolutely possible.
If VELVET can reclaim $0.32–0.37, I would cancel the short idea and wait. If it stays below that zone, the market is still showing no real recovery.
And there is another problem: 58.7% of the total VELVET supply remains locked, with the next scheduled unlock on September 10 releasing ~19.6M tokens.
VELVET already went from one of the hottest AI/DeFAI narratives to a 73% single-day collapse.
Now the question isn’t “where is the bottom?”
It’s whether buyers can actually defend $0.15 — or whether this was only the first liquidation wave. 👀📉
#Velvet #Binance #futures #crypto #Trading
Log in to explore more content