
Professor_BlockBrain_Academy
227 ပို့စ်များ

Professor_BlockBrain_Academy
Decoding crypto markets through data, narratives, and clear risk-focused analysis
Open Trade

BNB Holder
Frequent Trader
3.8 Years
7 ဖော်လိုလုပ်ထားသည်
304 ဖော်လိုလုပ်သူများ
331 လိုက်ခ်လုပ်ထားသည်
ပို့စ်များ
ပိုင်ဆိုင်မှုစာရင်း
အားလုံး
Quotes
"Connecticut's new lawsuit against Kalshi piles on to prediction market legal fight"
Here's what that actually means for price.
$SOL : 109.5 (+9.40%), RSI 86, trending up
Headlines move sentiment. Levels move stops. Only one of those shows up on your chart.
Here's what that actually means for price.
$SOL : 109.5 (+9.40%), RSI 86, trending up
Headlines move sentiment. Levels move stops. Only one of those shows up on your chart.
Start with small fish than we can catch bigger one
Everyone's watching the price on $SOL . I'm watching the range position.
96% of the 30-day range, at 101.5.
That single number tells you more about where you are than +7.83% on the day does. Near the top, you're paying up. Near the bottom, you're catching something.
RSI 88, trending up. Guys my advice is if you already hold a postion in profit just take it and leave , don’t enter now and chase the run otherwise you have to wait till next year to recover you capital
96% of the 30-day range, at 101.5.
That single number tells you more about where you are than +7.83% on the day does. Near the top, you're paying up. Near the bottom, you're catching something.
RSI 88, trending up. Guys my advice is if you already hold a postion in profit just take it and leave , don’t enter now and chase the run otherwise you have to wait till next year to recover you capital
$ZEC is 0.18% from 836.0.
That's the P level, and it's the only number I care about today.
Current: 834.5 (+6.63%)
RSI: 84
Structure: trending up
24h range: 766.0 to 888.0
Everytime i use to say don’t chase the hype just wait for the momentum.
That's the P level, and it's the only number I care about today.
Current: 834.5 (+6.63%)
RSI: 84
Structure: trending up
24h range: 766.0 to 888.0
Everytime i use to say don’t chase the hype just wait for the momentum.
Are you ready for the A B C????
Quick one on $ZEC before the US session gets going.
794.9, +21.62%, 85% into the 30-day range.
Three podsible scenarios from here:
Holds 681.4 → the range stays intact and this was noise
Loses 618.8 → sellers get the next move
Clears 796.8 → the ceiling becomes the floor
Which one are you positioned for?
Quick one on $ZEC before the US session gets going.
794.9, +21.62%, 85% into the 30-day range.
Three podsible scenarios from here:
Holds 681.4 → the range stays intact and this was noise
Loses 618.8 → sellers get the next move
Clears 796.8 → the ceiling becomes the floor
Which one are you positioned for?
Biggg Dump is loading!
$ZEC overnight — 815.2, +42.35%
RSI is 87 (overbought) and price is trending up. We're sitting 90% of the way into the 30-day range.
The three levels that matter today:
Resistance 796.8
Pivot 681.4
Support 618.8
It can’t keep the price in top because its in the over bought region!!
$ZEC overnight — 815.2, +42.35%
RSI is 87 (overbought) and price is trending up. We're sitting 90% of the way into the 30-day range.
The three levels that matter today:
Resistance 796.8
Pivot 681.4
Support 618.8
It can’t keep the price in top because its in the over bought region!!
$ZEC : the thesis, the evidence, and the thing that kills it. Letssss dive.
Too many posts give you a call with no exit. Here's all three parts.
THE SETUP
641.7, +13.76% on the day. RSI 77. Structure is trending up. Price is 97% into the 30-day range (451.8 to 647.5), and the 24h range was 554.0 to 647.5.
THE INVALIDATION
This is the part most people skip. If price loses 547.2 and holds below it, the thesis above is wrong and I'd rather know early than be right late.
Too many posts give you a call with no exit. Here's all three parts.
THE SETUP
641.7, +13.76% on the day. RSI 77. Structure is trending up. Price is 97% into the 30-day range (451.8 to 647.5), and the 24h range was 554.0 to 647.5.
THE INVALIDATION
This is the part most people skip. If price loses 547.2 and holds below it, the thesis above is wrong and I'd rather know early than be right late.
Three things about $ETH that actually matter right now
Price is 2,271, +18.56% on the day. Most posts will stop there. Here's what's underneath it.
1. Structure
$ETH is trending up with RSI at 83, which reads as overbought. Price is 88% into its 30-day range, between 1,822 and 2,334.
2. The levels
Resistance sits at 2,422, with a second layer at 2,592. The pivot is 2,164 — this is the line that decides who's in control.
Support is 1,995, then 1,736 below it.
3. The cross-check
$SOL is at 87.10 (+13.06%), recovering. When these two disagree, one of them is early.
Price is 2,271, +18.56% on the day. Most posts will stop there. Here's what's underneath it.
1. Structure
$ETH is trending up with RSI at 83, which reads as overbought. Price is 88% into its 30-day range, between 1,822 and 2,334.
2. The levels
Resistance sits at 2,422, with a second layer at 2,592. The pivot is 2,164 — this is the line that decides who's in control.
Support is 1,995, then 1,736 below it.
3. The cross-check
$SOL is at 87.10 (+13.06%), recovering. When these two disagree, one of them is early.
If you only read one thing on $ETH today, make it this.
Price: 2,255 (+17.82%)
Above 2,164, the pivot, buyers still have control.
Below it, 1,995 is where the argument gets settled.
Reclaim 2,422 and the whole picture changes.
RSI at 82 says overbought.
So its time to exit…
Price: 2,255 (+17.82%)
Above 2,164, the pivot, buyers still have control.
Below it, 1,995 is where the argument gets settled.
Reclaim 2,422 and the whole picture changes.
RSI at 82 says overbought.
So its time to exit…
#CryptoRally I have mentioned in my previous post $SOL will rock so wait for retest. Its happened guys!!!!
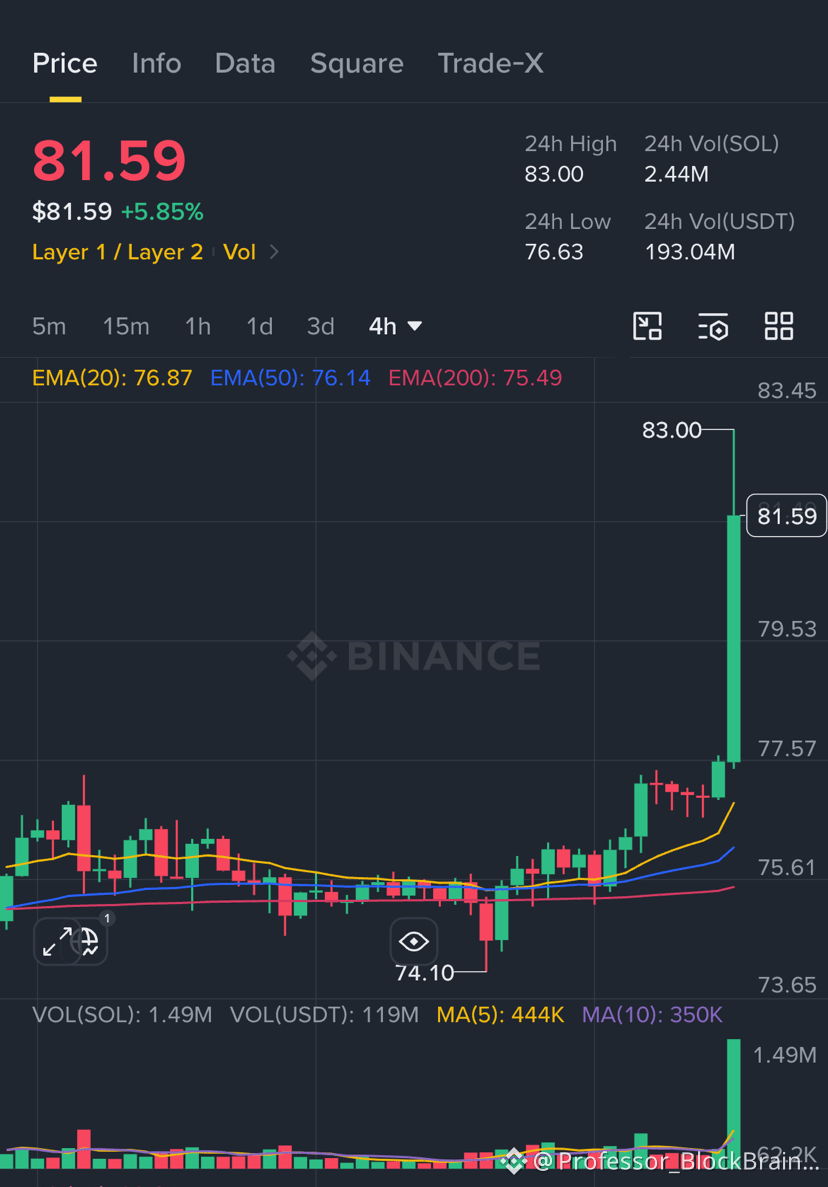
The market moved today. $SOL didn't. That's the story 🫠🫠🫠. SOL lovers its for you.
Top movers: $ACE +10.7% $LINK +3.3% $SOL +1.5%
Meanwhile $SOL sits at 77.09, +1.57%, RSI 57, recovering.
WHY BORING IS INFORMATION
When everything around an asset moves and it doesn't, that's not nothing. Either the money hasn't rotated in yet, or it's already left. Those two look identical on the day and opposite a month later.
So i would TELL,
Range position is 78% of the last 30 days. 70.58 to 78.88.
Levels: 75.70 support, 77.91 resistance.
Wait for the retest no urge.
Top movers: $ACE +10.7% $LINK +3.3% $SOL +1.5%
Meanwhile $SOL sits at 77.09, +1.57%, RSI 57, recovering.
WHY BORING IS INFORMATION
When everything around an asset moves and it doesn't, that's not nothing. Either the money hasn't rotated in yet, or it's already left. Those two look identical on the day and opposite a month later.
So i would TELL,
Range position is 78% of the last 30 days. 70.58 to 78.88.
Levels: 75.70 support, 77.91 resistance.
Wait for the retest no urge.
Everyone's watching the price on $SOL. I'm watching the range position.
79% of the 30-day range, at 77.13.
That single number tells you more about where you are than +1.97% on the day does. Near the top, you're paying up. Near the bottom, you're catching something.
RSI 58, recovering.
But i don’t think it will go far 79!!
79% of the 30-day range, at 77.13.
That single number tells you more about where you are than +1.97% on the day does. Near the top, you're paying up. Near the bottom, you're catching something.
RSI 58, recovering.
But i don’t think it will go far 79!!
Bullishh or bearishh’!!!
Keep eyes on $ZEC if 4H closes above 509 you can take a entry. TP 514->522.
Keep watching i will update.
Keep eyes on $ZEC if 4H closes above 509 you can take a entry. TP 514->522.
Keep watching i will update.
BOOOOOOMMMMM 🚀🚀🚀
$GPS just did +25.2% while most people were looking elsewhere.
For context, $SOL is +1.09% on the same day at 76.13.
The uncomfortable question with any move like this: are you early, or are you the exit liquidity for someone who was?
$GPS just did +25.2% while most people were looking elsewhere.
For context, $SOL is +1.09% on the same day at 76.13.
The uncomfortable question with any move like this: are you early, or are you the exit liquidity for someone who was?
How to read a pivot level, using $ZEC as today's example
If you're newer to this, save the post. If you're not, skip to the levels.
WHAT A PIVOT ACTUALLY IS
It's the average of yesterday's high, low and close. That's it — no magic. It works because enough people watch it that it becomes self-fulfilling, not because the number is special.
TODAY'S NUMBERS ON $ZEC
Pivot: 507.1
R1 529.1 · R2 544.1
S1 492.1 · S2 470.1
Price is 504.6, which puts it 0.49% from P.
HOW TO USE IT
Above the pivot, you look for longs into R1. Below it, you look for shorts into S1. The pivot itself is the least interesting number — it's the line you measure from, not a level you trade.
If you're newer to this, save the post. If you're not, skip to the levels.
WHAT A PIVOT ACTUALLY IS
It's the average of yesterday's high, low and close. That's it — no magic. It works because enough people watch it that it becomes self-fulfilling, not because the number is special.
TODAY'S NUMBERS ON $ZEC
Pivot: 507.1
R1 529.1 · R2 544.1
S1 492.1 · S2 470.1
Price is 504.6, which puts it 0.49% from P.
HOW TO USE IT
Above the pivot, you look for longs into R1. Below it, you look for shorts into S1. The pivot itself is the least interesting number — it's the line you measure from, not a level you trade.
$ZEC is 0.57% from 507.1.
That's the P level, and it's the only number I care about today.
Current: 510.0 (+3.61%)
RSI: 55
Structure: recovering
24h range: 491.5 to 522.1
#zecusdt #DollarFallsTo10WeekLow
That's the P level, and it's the only number I care about today.
Current: 510.0 (+3.61%)
RSI: 55
Structure: recovering
24h range: 491.5 to 522.1
#zecusdt #DollarFallsTo10WeekLow
Trading is not about correct entry
Its about correct exit!
Its about correct exit!
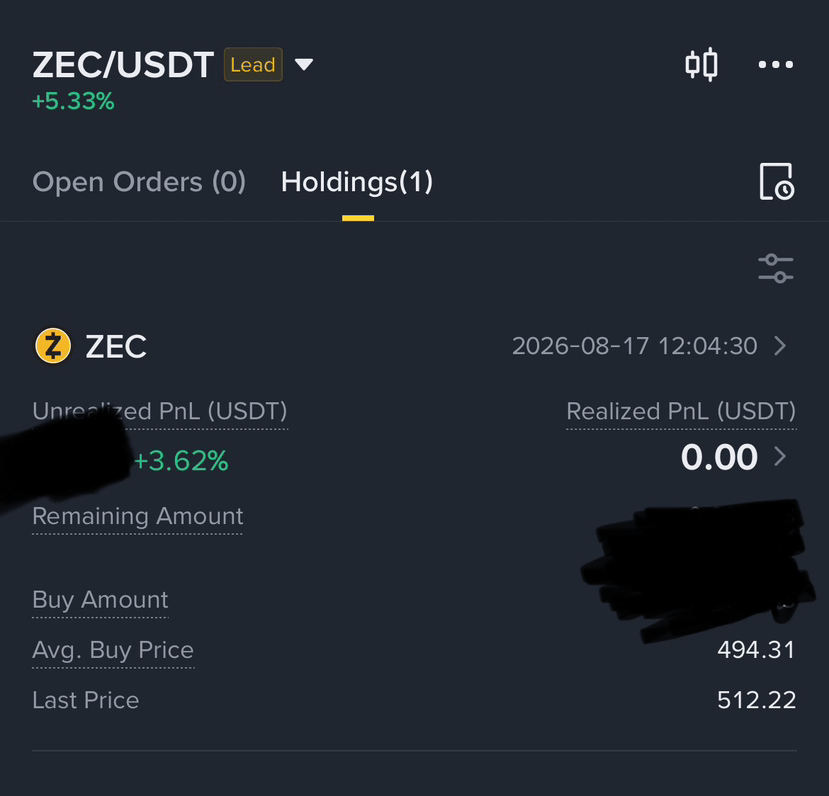
What the news is missing about $ZEC
The headline everyone is reacting to: "September Fed interest-rate increase is 'very unlikely,' Goldman Sachs says"
Here's what the chart says, which is a different story.
Price: 509.4 (+4.35%)
RSI: 55 — neutral
Structure: recovering
Range position: 49% of the last 30 days
NEWS VS PRICE
Price usually moves before the story explains it. The question is never "is this news good" — it's "was this already in the price".
MY READ
Almost got decent 4% return. Will share the trade ince completed fully.
THE LEVELS THAT SETTLE IT
Above 493.4, the bulls were right.
Below 481.8, they weren't.
The headline everyone is reacting to: "September Fed interest-rate increase is 'very unlikely,' Goldman Sachs says"
Here's what the chart says, which is a different story.
Price: 509.4 (+4.35%)
RSI: 55 — neutral
Structure: recovering
Range position: 49% of the last 30 days
NEWS VS PRICE
Price usually moves before the story explains it. The question is never "is this news good" — it's "was this already in the price".
MY READ
Almost got decent 4% return. Will share the trade ince completed fully.
THE LEVELS THAT SETTLE IT
Above 493.4, the bulls were right.
Below 481.8, they weren't.
Log in to explore more content