
AlphaAnalitics
319 ပို့စ်များ

AlphaAnalitics
တိုင်ကြားမည်
သုံးစွဲသူကို ဘလော့မည်
📊 Análisis de Datos & Trading de Futuros Cazando tendencias en tiempo real con números y métricas claras. Datos institucionales, Funding Rates!
High-Frequency Trader
8.6 နှစ်
2 ဖော်လိုလုပ်ထားသည်
95 ဖော်လိုလုပ်သူများ
191 လိုက်ခ်လုပ်ထားသည်
ပို့စ်များ
ဘာသာပြန်ဆိုချက် ကြည့်မည်
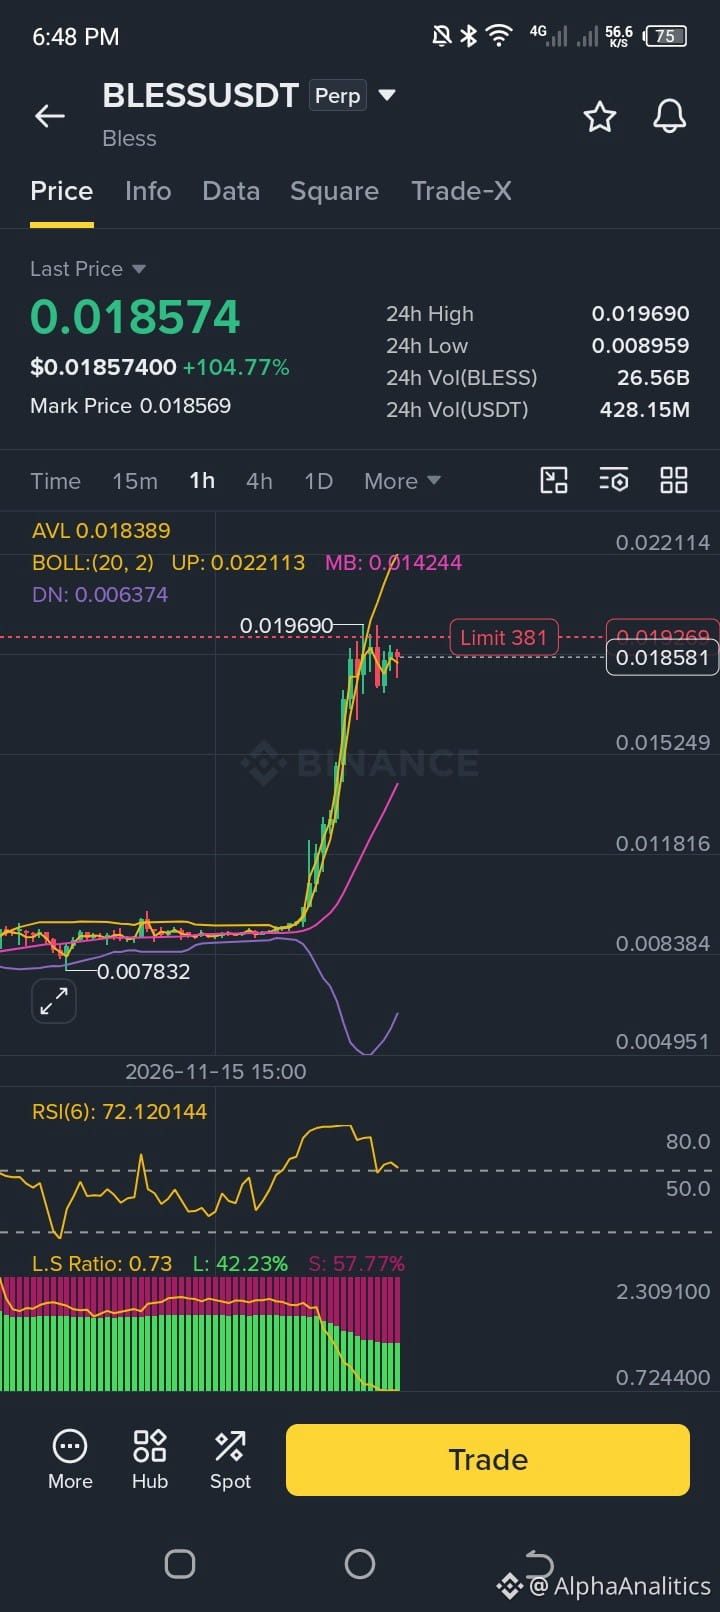
🚨 BLESS DOUBLES WITH A +104% SURGE: IS THE PARABOLIC TOP IN?
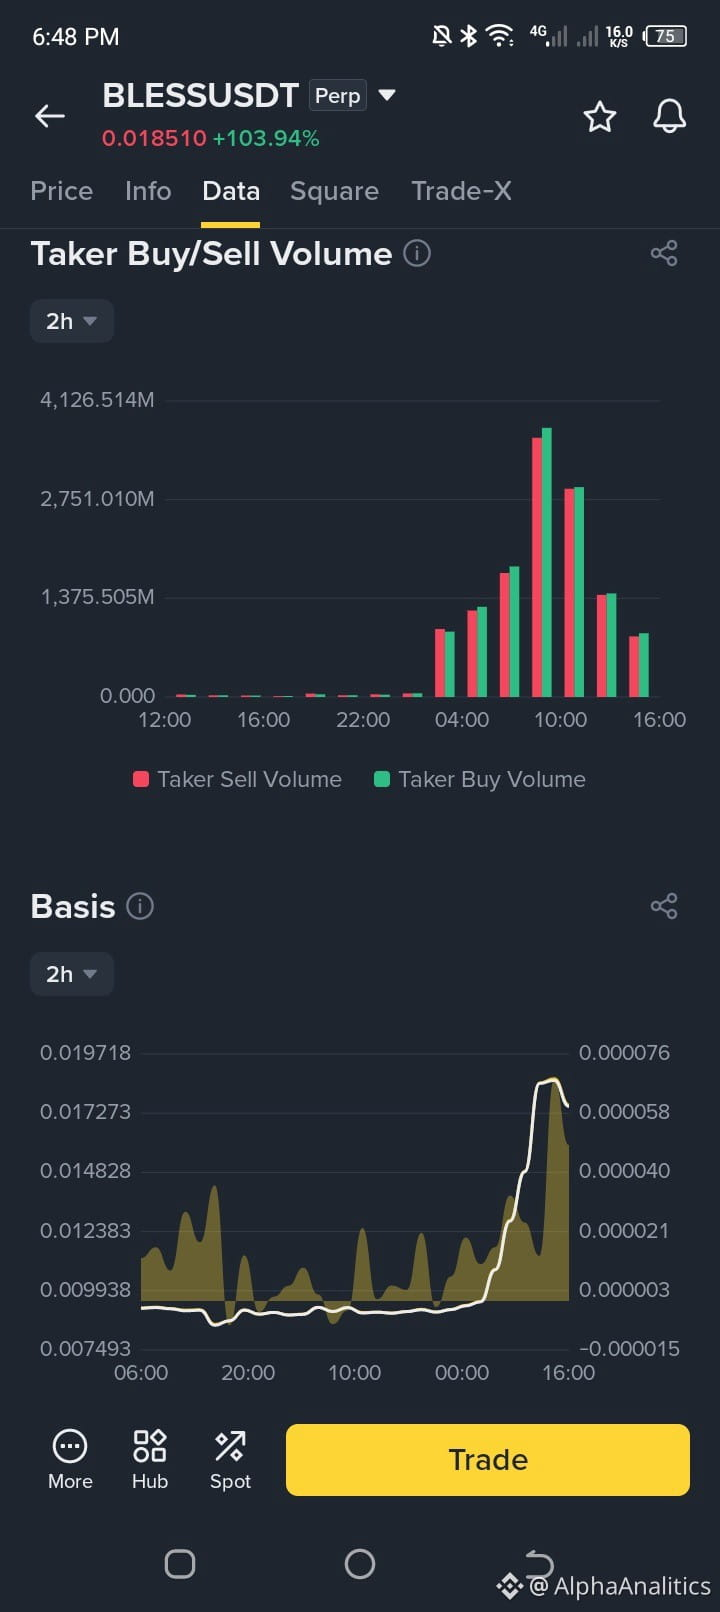
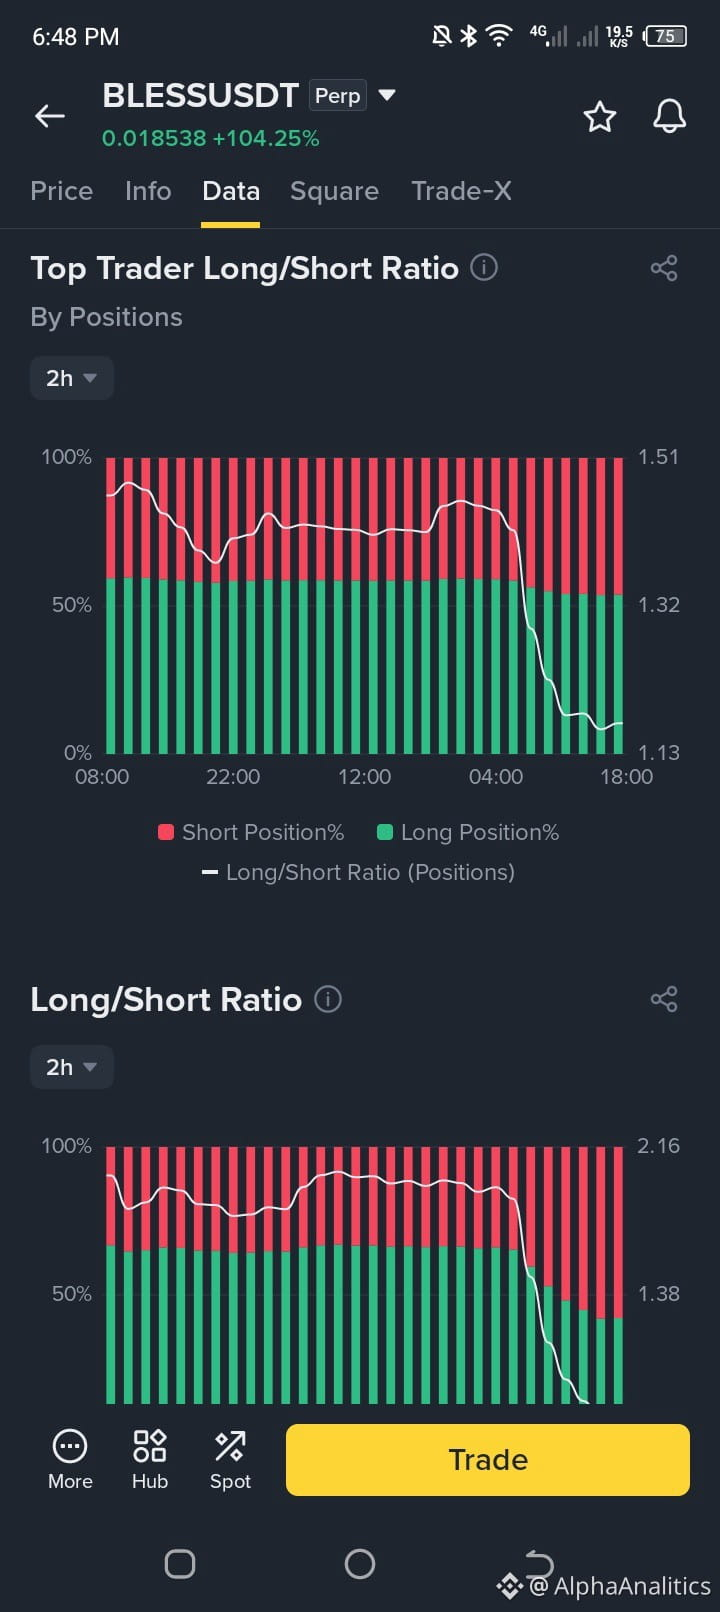
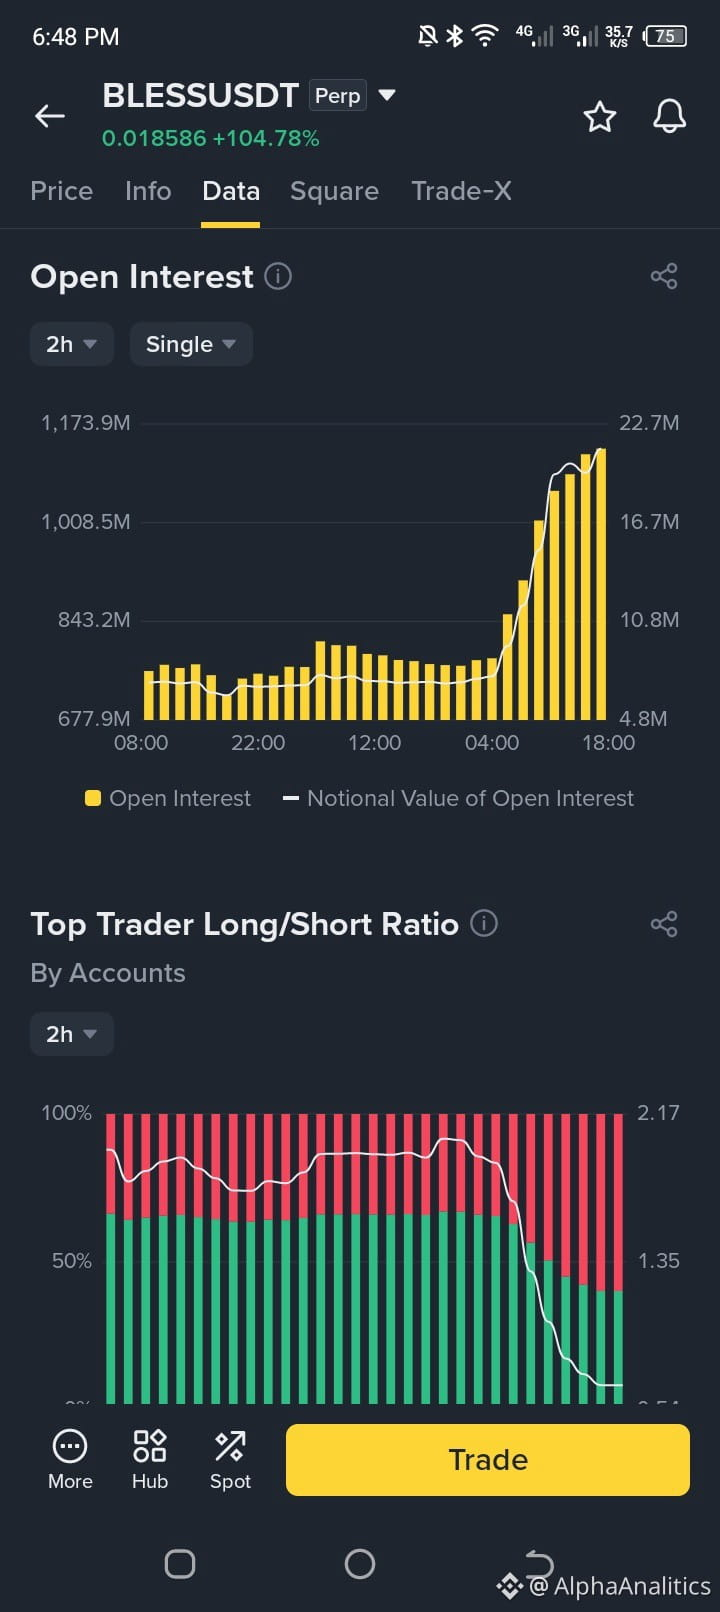
Bless ($BLESS ) has delivered a massive +104% vertical rally, touching highs near $0.01969 alongside an explosive spike in Open Interest to 22.7M. But when metrics overheat this fast, the risk-to-reward ratio shifts heavily in favor of disciplined short-sellers.
Here is what the derivatives data is signaling:
📈 Funding Rate Spike: The funding rate has surged to +0.08821%, showing that aggressive retail longs are heavily over-leveraged and paying steep fees to maintain positions.
📊 Overbought RSI Conditions: On hourly charts, the RSI(6) has pushed past 72, signaling severe exhaustion after a parabolic run.
🎯 The Short Playbook: Chasing a 100% pump blindly is dangerous. Professional traders are waiting for a final exhaustion wick into the $0.01969 – $0.02100 resistance zone to scale into shorts, backed by a strict stop loss above $0.02300.
Patience and strict risk management win markets. Never short without a safety net during high-volatility expansions.
Are you fading the pump or riding the continuation? Let's discuss below! 👇
#BLESS #CryptoTrading #BinanceSquare #TechnicalAnalysis
🚨 BLESS DOUBLES WITH A +104% SURGE: IS THE PARABOLIC TOP IN?
Bless ($BLESS ) has delivered a massive +104% vertical rally, touching highs near $0.01969 alongside an explosive spike in Open Interest to 22.7M. But when metrics overheat this fast, the risk-to-reward ratio shifts heavily in favor of disciplined short-sellers.
Here is what the derivatives data is signaling:
📈 Funding Rate Spike: The funding rate has surged to +0.08821%, showing that aggressive retail longs are heavily over-leveraged and paying steep fees to maintain positions.
📊 Overbought RSI Conditions: On hourly charts, the RSI(6) has pushed past 72, signaling severe exhaustion after a parabolic run.
🎯 The Short Playbook: Chasing a 100% pump blindly is dangerous. Professional traders are waiting for a final exhaustion wick into the $0.01969 – $0.02100 resistance zone to scale into shorts, backed by a strict stop loss above $0.02300.
Patience and strict risk management win markets. Never short without a safety net during high-volatility expansions.
Are you fading the pump or riding the continuation? Let's discuss below! 👇
#BLESS #CryptoTrading #BinanceSquare #TechnicalAnalysis
Bless ($BLESS ) has delivered a massive +104% vertical rally, touching highs near $0.01969 alongside an explosive spike in Open Interest to 22.7M. But when metrics overheat this fast, the risk-to-reward ratio shifts heavily in favor of disciplined short-sellers.
Here is what the derivatives data is signaling:
📈 Funding Rate Spike: The funding rate has surged to +0.08821%, showing that aggressive retail longs are heavily over-leveraged and paying steep fees to maintain positions.
📊 Overbought RSI Conditions: On hourly charts, the RSI(6) has pushed past 72, signaling severe exhaustion after a parabolic run.
🎯 The Short Playbook: Chasing a 100% pump blindly is dangerous. Professional traders are waiting for a final exhaustion wick into the $0.01969 – $0.02100 resistance zone to scale into shorts, backed by a strict stop loss above $0.02300.
Patience and strict risk management win markets. Never short without a safety net during high-volatility expansions.
Are you fading the pump or riding the continuation? Let's discuss below! 👇
#BLESS #CryptoTrading #BinanceSquare #TechnicalAnalysis
245
စိစစ်အတည်ပြုထားသည်
ဘာသာပြန်ဆိုချက် ကြည့်မည်
🚨 THE ANTHROPIC IPO TRAP: WHEN THE SHOVEL SELLERS BUY THEIR OWN PICKS!
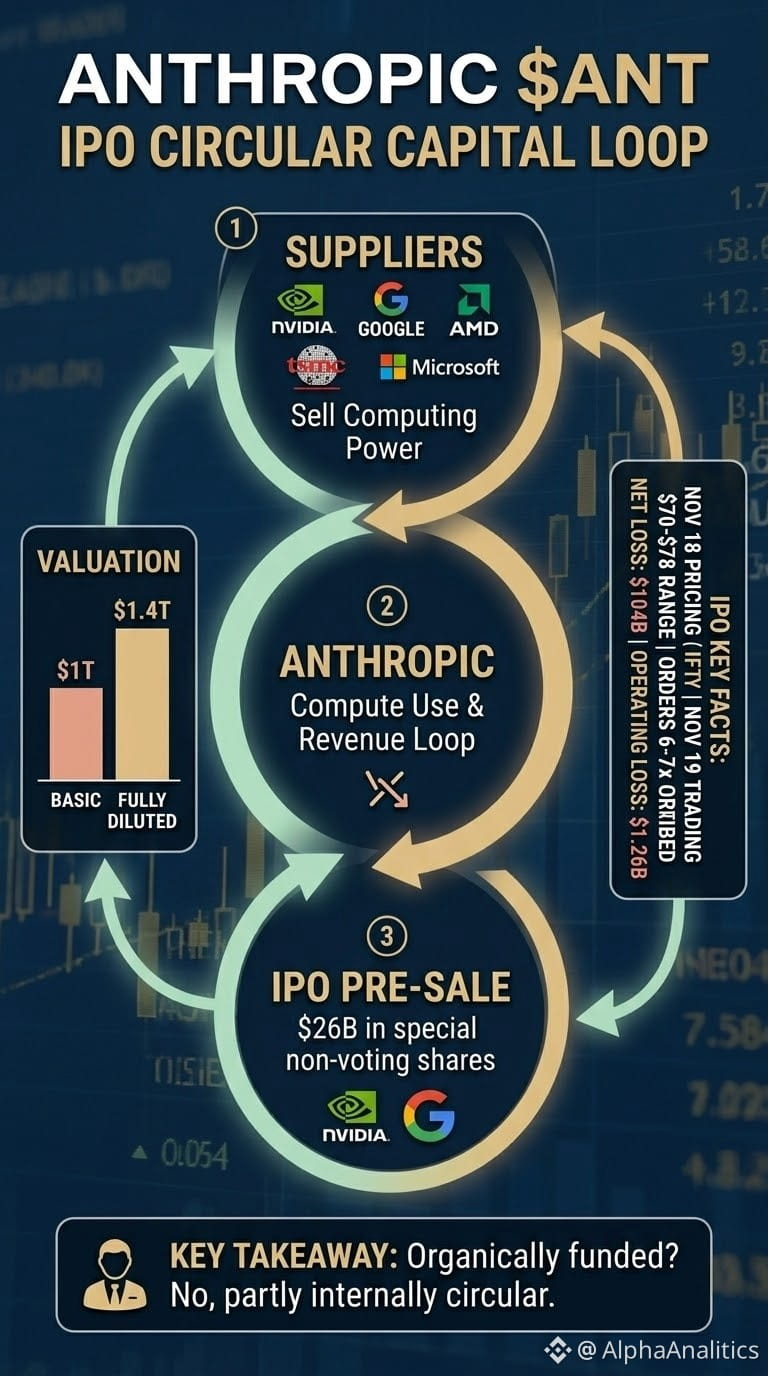
The upcoming Nasdaq debut of Anthropic under $ANTHROPIC (pricing November 18, trading November 19) is being hailed as the ultimate test of investor appetite for AI. But if you look past the headline hype of a $1T to $1.4T valuation and heavy oversubscription, a fascinating circular loop emerges.
Let's break down what the filing actually reveals:
🔄 The Circular Capital Loop: Out of the massive capital structure, $26 billion is pre-sold directly to Anthropic’s hardware and cloud suppliers—with Nvidia and Google taking about $10 billion each, alongside Microsoft, AMD, Broadcom, Micron, and TSMC. They sell compute to Anthropic; Anthropic uses the proceeds to buy more compute.
📊 The Financial Reality: While 9-month revenue hit an impressive $33.2 billion, the net loss sits at $104 billion (though largely non-cash accounting charges, with an operating loss of $1.26 billion).
⚖️ Valuation Split: Basic shares price in around a $1T valuation ($70–$78 range), but fully diluted counts push it toward $1.4 trillion.
The Bottom Line: A packed order book proves massive demand for the IPO, but a supplier-funded ecosystem raises questions about organic market validation versus internal liquidity recycling.
Are you bidding on the $ANT debut, or staying on the sidelines? Let's discuss below! 👇
#Anthropic #IPO #ArtificialIntelligence #BinanceSquare
🚨 THE ANTHROPIC IPO TRAP: WHEN THE SHOVEL SELLERS BUY THEIR OWN PICKS!
The upcoming Nasdaq debut of Anthropic under $ANTHROPIC (pricing November 18, trading November 19) is being hailed as the ultimate test of investor appetite for AI. But if you look past the headline hype of a $1T to $1.4T valuation and heavy oversubscription, a fascinating circular loop emerges.
Let's break down what the filing actually reveals:
🔄 The Circular Capital Loop: Out of the massive capital structure, $26 billion is pre-sold directly to Anthropic’s hardware and cloud suppliers—with Nvidia and Google taking about $10 billion each, alongside Microsoft, AMD, Broadcom, Micron, and TSMC. They sell compute to Anthropic; Anthropic uses the proceeds to buy more compute.
📊 The Financial Reality: While 9-month revenue hit an impressive $33.2 billion, the net loss sits at $104 billion (though largely non-cash accounting charges, with an operating loss of $1.26 billion).
⚖️ Valuation Split: Basic shares price in around a $1T valuation ($70–$78 range), but fully diluted counts push it toward $1.4 trillion.
The Bottom Line: A packed order book proves massive demand for the IPO, but a supplier-funded ecosystem raises questions about organic market validation versus internal liquidity recycling.
Are you bidding on the $ANT debut, or staying on the sidelines? Let's discuss below! 👇
#Anthropic #IPO #ArtificialIntelligence #BinanceSquare
The upcoming Nasdaq debut of Anthropic under $ANTHROPIC (pricing November 18, trading November 19) is being hailed as the ultimate test of investor appetite for AI. But if you look past the headline hype of a $1T to $1.4T valuation and heavy oversubscription, a fascinating circular loop emerges.
Let's break down what the filing actually reveals:
🔄 The Circular Capital Loop: Out of the massive capital structure, $26 billion is pre-sold directly to Anthropic’s hardware and cloud suppliers—with Nvidia and Google taking about $10 billion each, alongside Microsoft, AMD, Broadcom, Micron, and TSMC. They sell compute to Anthropic; Anthropic uses the proceeds to buy more compute.
📊 The Financial Reality: While 9-month revenue hit an impressive $33.2 billion, the net loss sits at $104 billion (though largely non-cash accounting charges, with an operating loss of $1.26 billion).
⚖️ Valuation Split: Basic shares price in around a $1T valuation ($70–$78 range), but fully diluted counts push it toward $1.4 trillion.
The Bottom Line: A packed order book proves massive demand for the IPO, but a supplier-funded ecosystem raises questions about organic market validation versus internal liquidity recycling.
Are you bidding on the $ANT debut, or staying on the sidelines? Let's discuss below! 👇
#Anthropic #IPO #ArtificialIntelligence #BinanceSquare
696
ဘာသာပြန်ဆိုချက် ကြည့်မည်
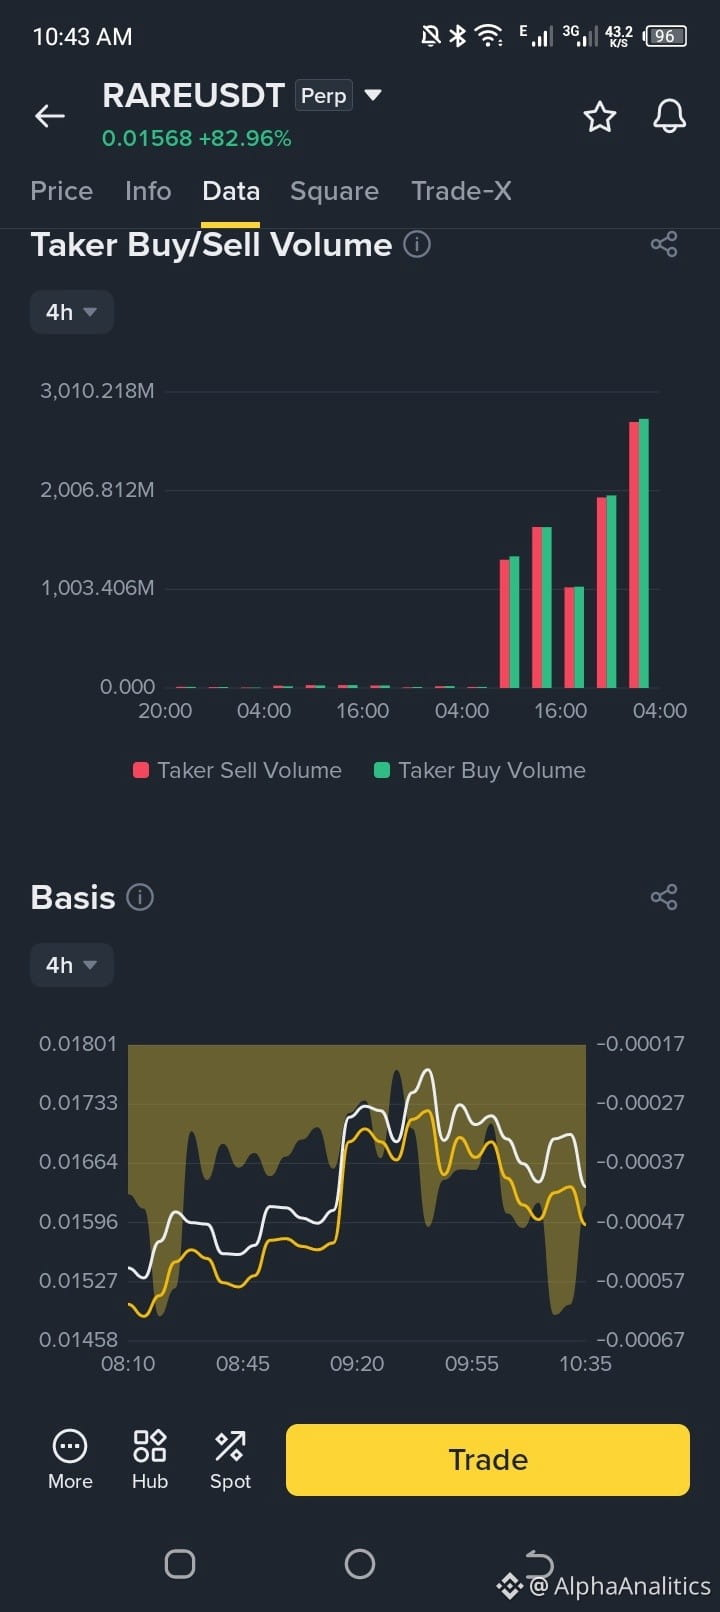
🚨 RARE SURGES +82%: IS A MASSIVE SHORT SQUEEZE WARNING IN PLAY?
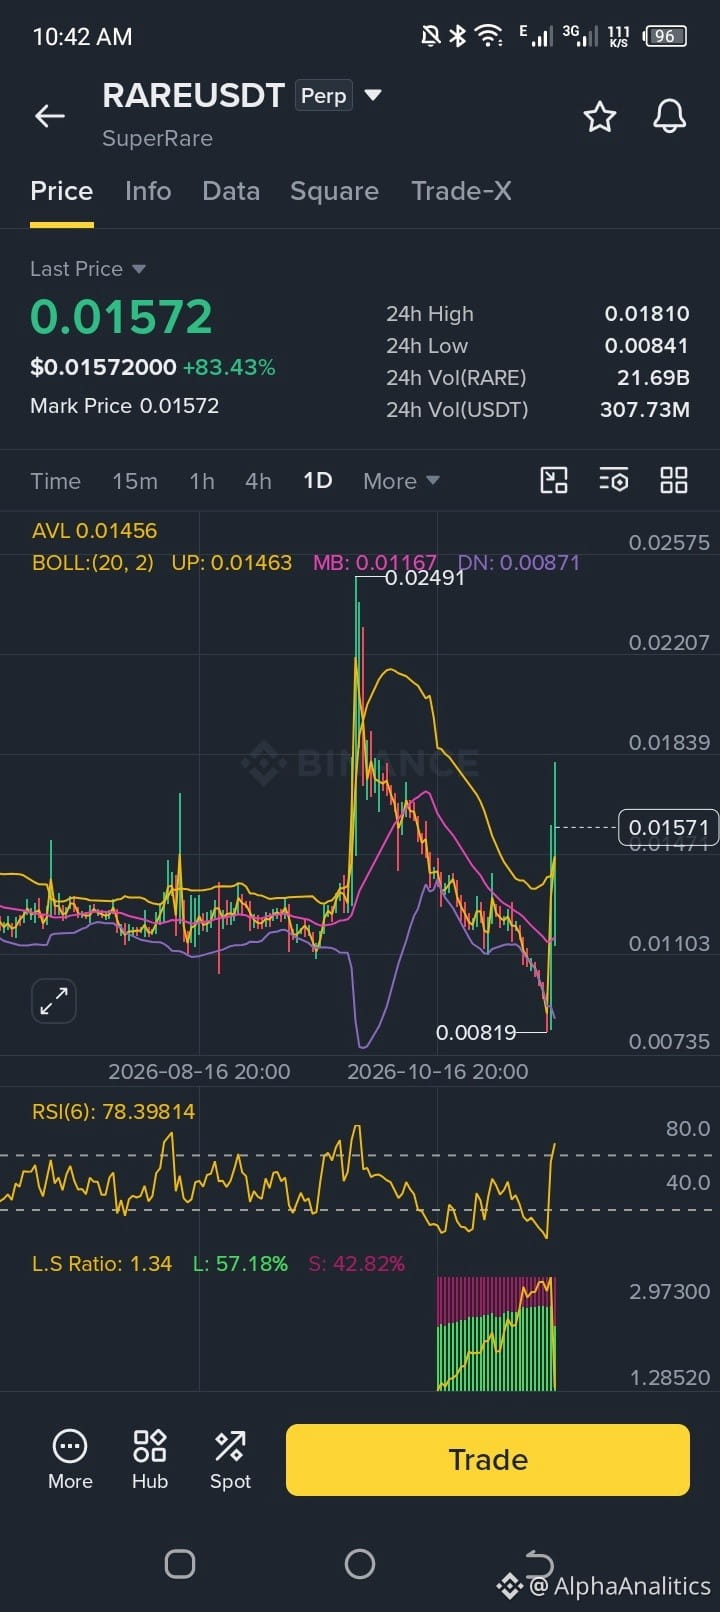
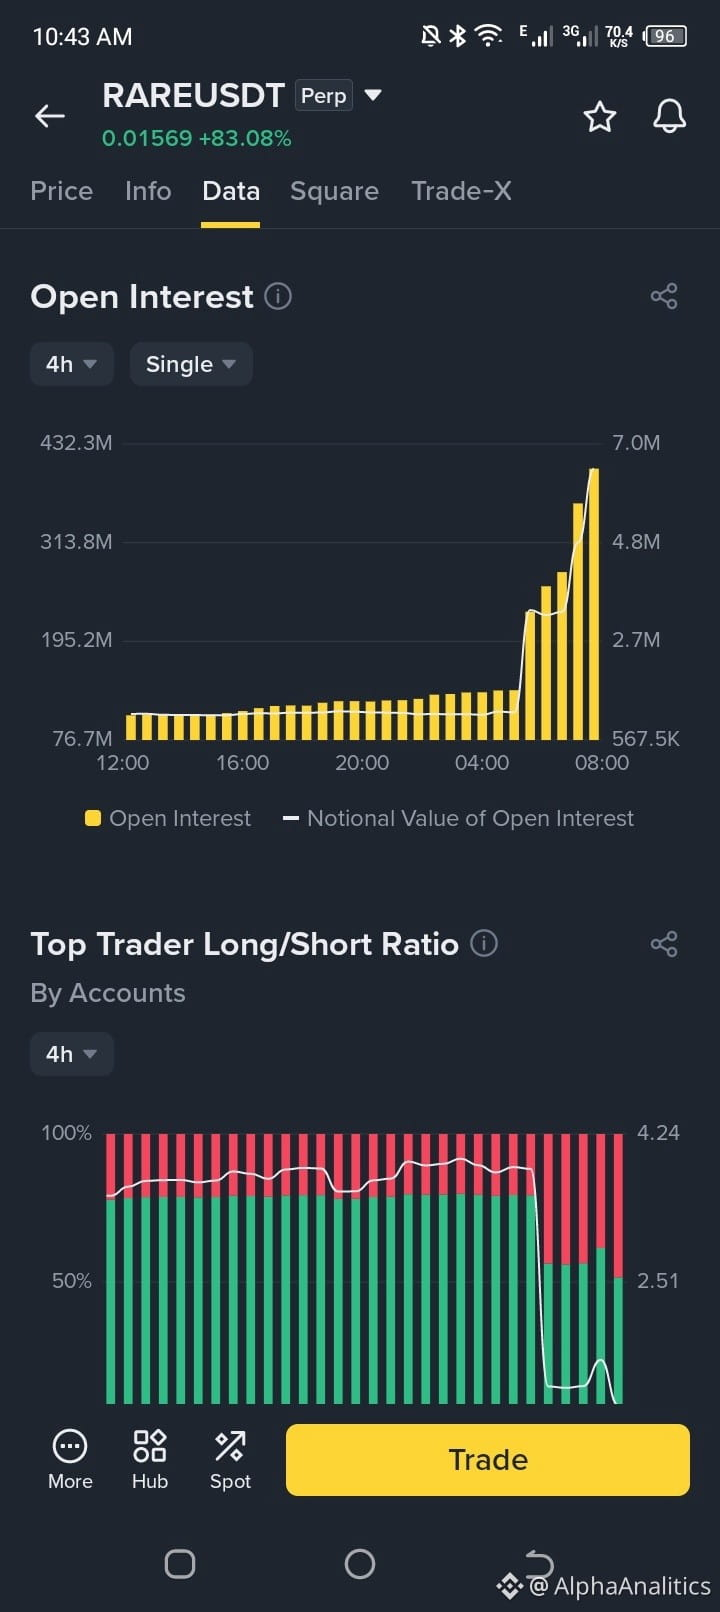
SuperRare ($RARE ) has exploded with an aggressive parabolic move, pumping over +82% in 24 hours and driving the Open Interest to vertical highs. But behind the green candles, extreme market metrics are flashing warning signs for late traders.
Here is what the derivatives data is telling us:
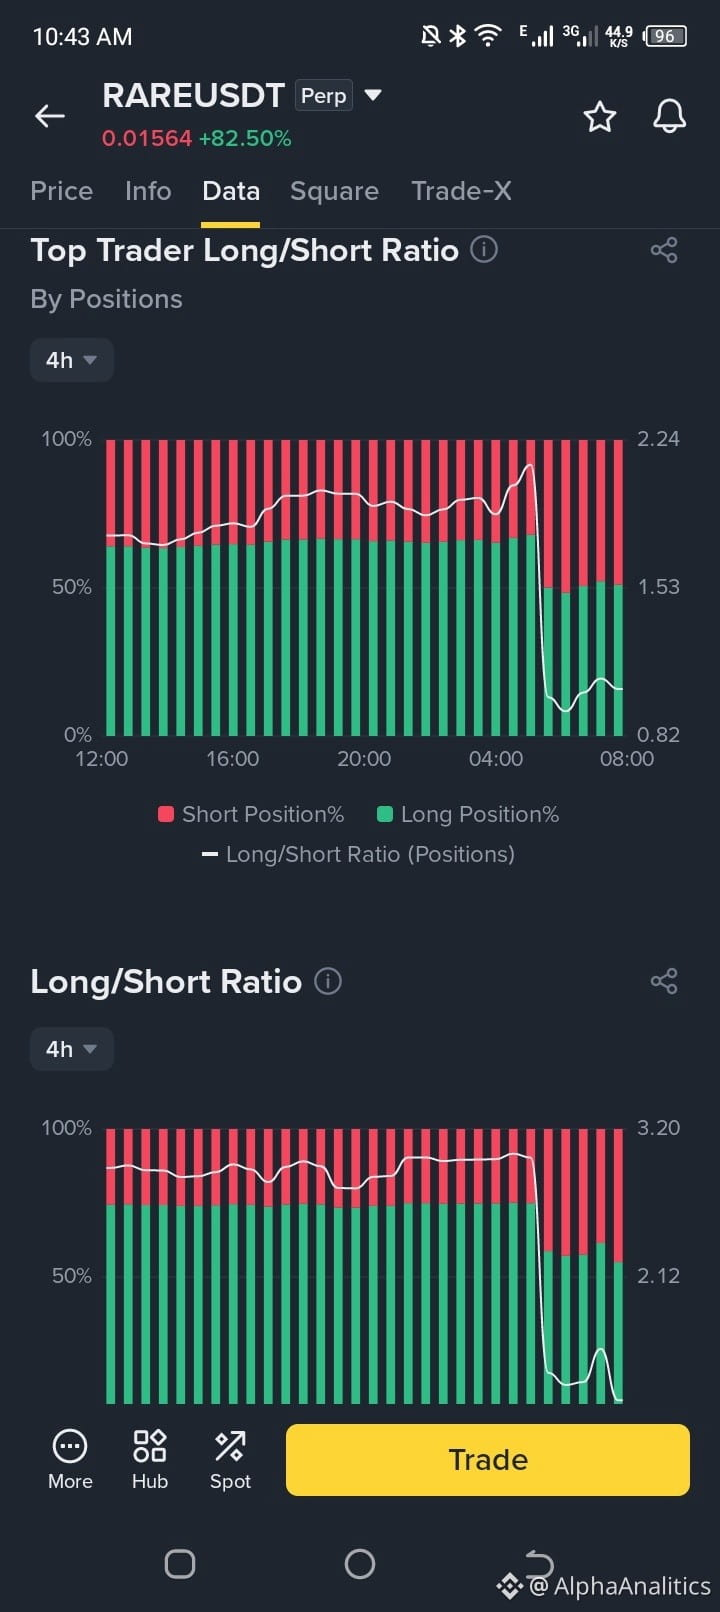
📉 Negative Funding Rate Alarm: The funding rate has plunged to -1.31%, showing that shorts are heavily overcrowded and paying massive fees to longs. This is prime fuel for a ruthless short squeeze if momentum extends.
📊 Overbought RSI Conditions: On the daily timeframe, the RSI(6) has pushed deep into overbought territory above 78, indicating that a cooling-off period is overdue.
🎯 The Short Strategy & Key Levels: Catching a falling knife in a parabolic pump is suicide. Professional shorts are waiting for exhaustion around the $0.018 – $0.021 resistance zone, scaling in carefully with a strict stop loss above $0.0225.
Never trade purely on emotion when Open Interest spikes like this. Let the order flow show signs of exhaustion before pulling the trigger.
Are you shorting the top or waiting for the pullback? Let's discuss below! 👇
#RARE #CryptoTrading #BinanceSquare #TechnicalAnalysis
🚨 RARE SURGES +82%: IS A MASSIVE SHORT SQUEEZE WARNING IN PLAY?
SuperRare ($RARE ) has exploded with an aggressive parabolic move, pumping over +82% in 24 hours and driving the Open Interest to vertical highs. But behind the green candles, extreme market metrics are flashing warning signs for late traders.
Here is what the derivatives data is telling us:
📉 Negative Funding Rate Alarm: The funding rate has plunged to -1.31%, showing that shorts are heavily overcrowded and paying massive fees to longs. This is prime fuel for a ruthless short squeeze if momentum extends.
📊 Overbought RSI Conditions: On the daily timeframe, the RSI(6) has pushed deep into overbought territory above 78, indicating that a cooling-off period is overdue.
🎯 The Short Strategy & Key Levels: Catching a falling knife in a parabolic pump is suicide. Professional shorts are waiting for exhaustion around the $0.018 – $0.021 resistance zone, scaling in carefully with a strict stop loss above $0.0225.
Never trade purely on emotion when Open Interest spikes like this. Let the order flow show signs of exhaustion before pulling the trigger.
Are you shorting the top or waiting for the pullback? Let's discuss below! 👇
#RARE #CryptoTrading #BinanceSquare #TechnicalAnalysis
SuperRare ($RARE ) has exploded with an aggressive parabolic move, pumping over +82% in 24 hours and driving the Open Interest to vertical highs. But behind the green candles, extreme market metrics are flashing warning signs for late traders.
Here is what the derivatives data is telling us:
📉 Negative Funding Rate Alarm: The funding rate has plunged to -1.31%, showing that shorts are heavily overcrowded and paying massive fees to longs. This is prime fuel for a ruthless short squeeze if momentum extends.
📊 Overbought RSI Conditions: On the daily timeframe, the RSI(6) has pushed deep into overbought territory above 78, indicating that a cooling-off period is overdue.
🎯 The Short Strategy & Key Levels: Catching a falling knife in a parabolic pump is suicide. Professional shorts are waiting for exhaustion around the $0.018 – $0.021 resistance zone, scaling in carefully with a strict stop loss above $0.0225.
Never trade purely on emotion when Open Interest spikes like this. Let the order flow show signs of exhaustion before pulling the trigger.
Are you shorting the top or waiting for the pullback? Let's discuss below! 👇
#RARE #CryptoTrading #BinanceSquare #TechnicalAnalysis
147
ဘာသာပြန်ဆိုချက် ကြည့်မည်
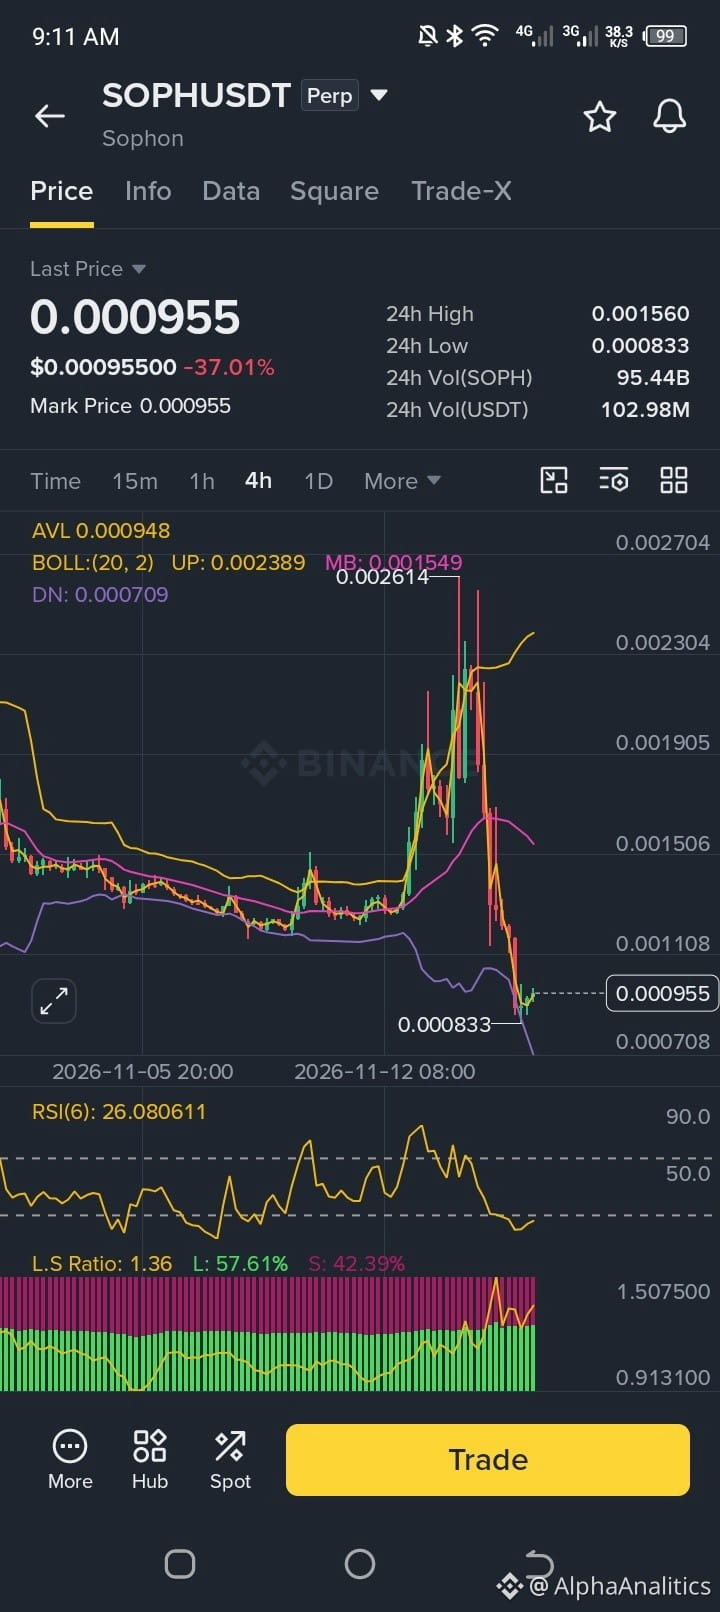
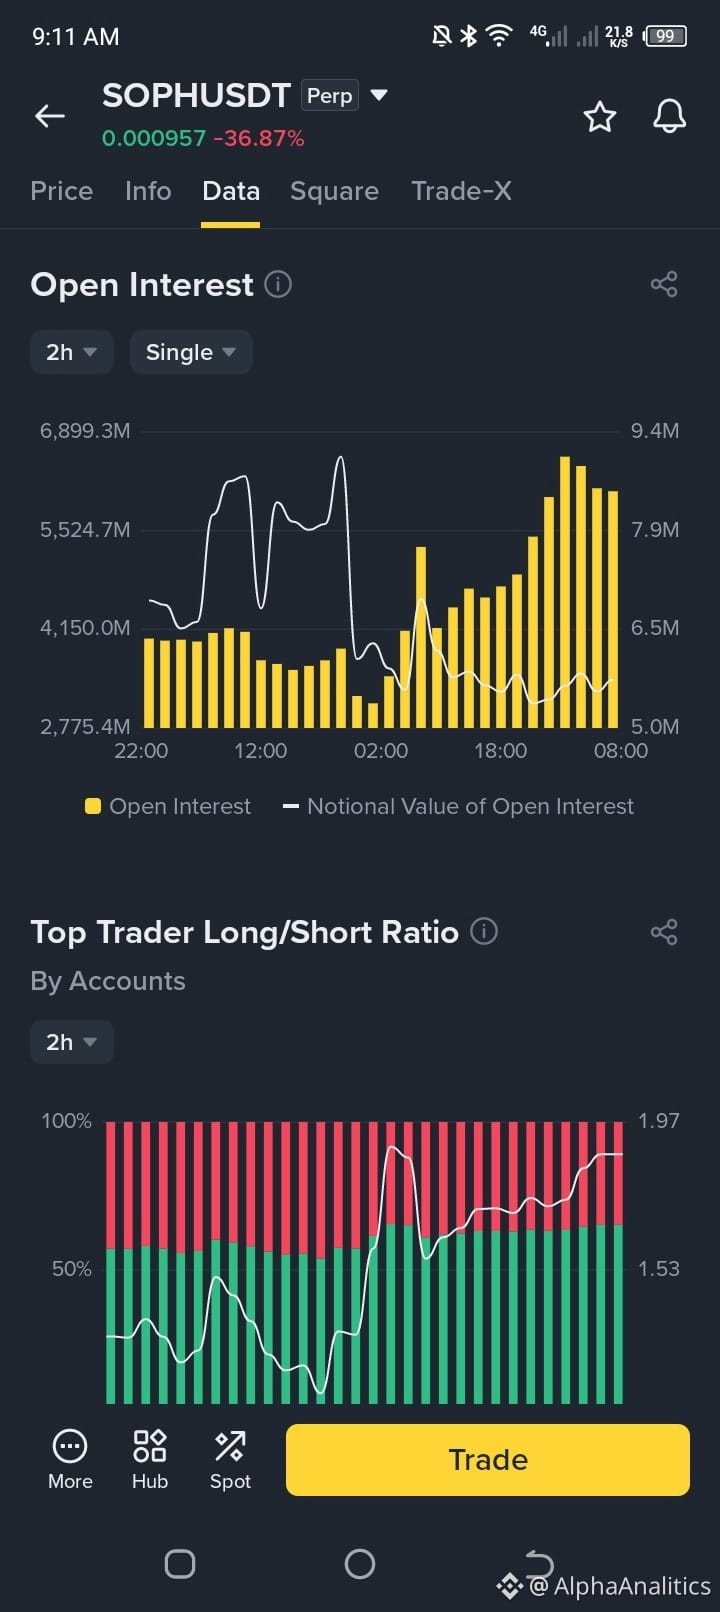
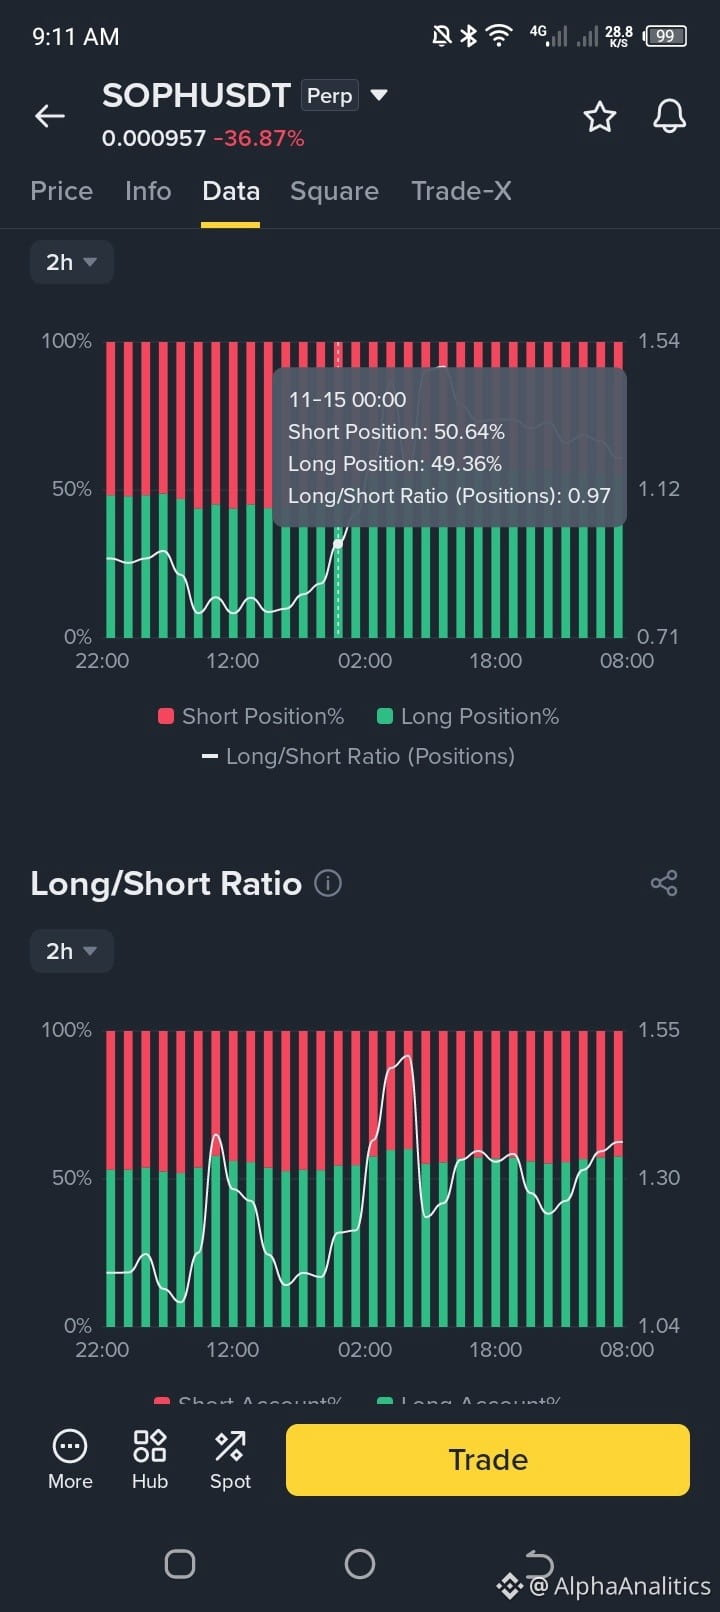
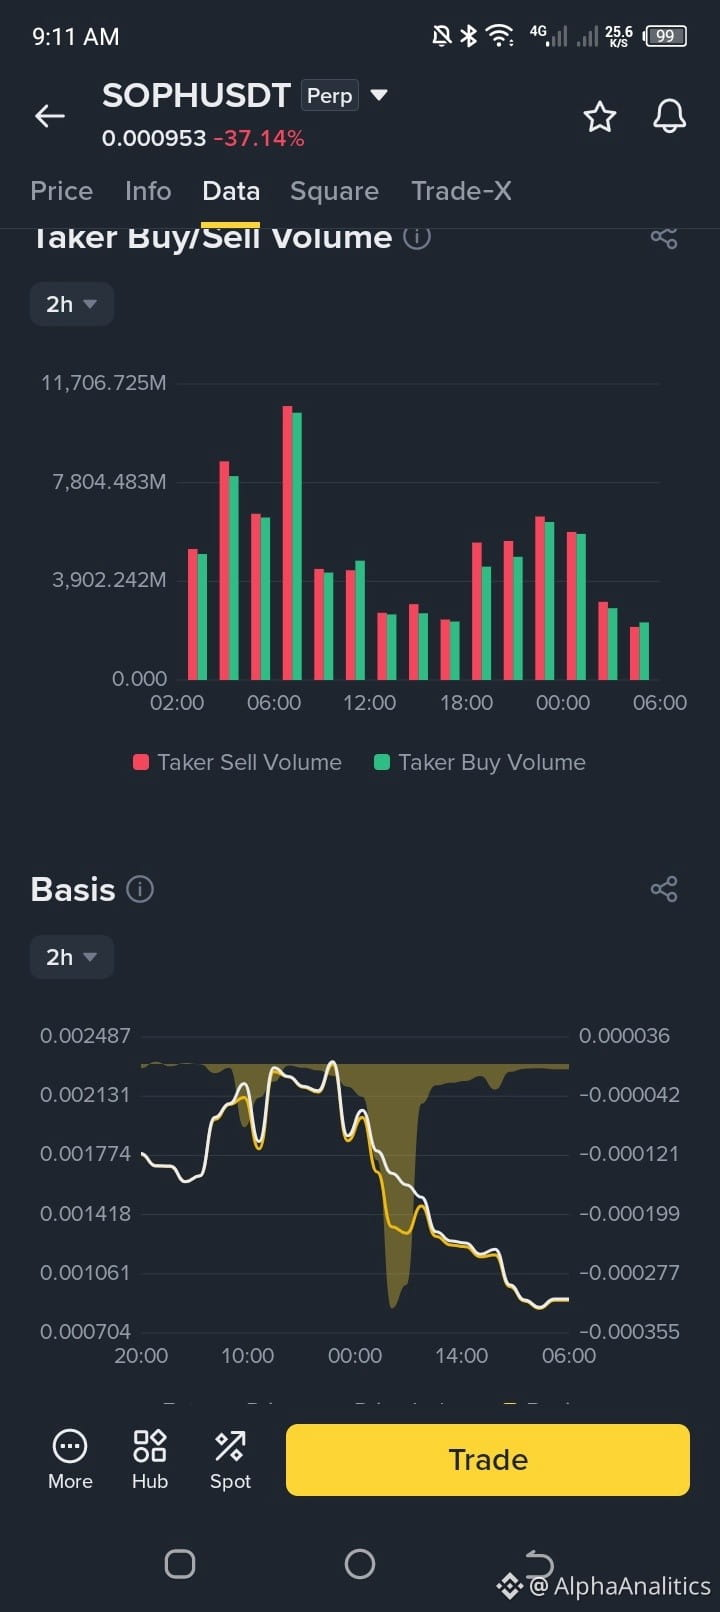
🚨 THE BREAKOUT SETUP: WHY $SOPH IS PRIMED FOR A MASSIVE TECHNICAL BOUNCE
When extreme sell-offs hit speculative altcoins, weak hands panic—but professional scalpers look for high-probability reversal zones. If you are tracking the charts on SOPH/USDT, the current setup on lower timeframes is flashing classic reversal signals.
Here is why this trade setup is catching the attention of aggressive swing traders:
📊 Extreme RSI Oversold Reset: On shorter timeframes following the heavy flush, the RSI plunged deep into oversold territory before forming higher lows and curling back up toward neutral levels.
📉 Funding Rate & Short Squeeze Potential: Negative funding rates combined with a stabilization of Open Interest mean that late shorts are heavily crowded. A sudden push past local resistance could trigger an aggressive short squeeze.
🎯 Defined Entry & Risk Ratios:
Accumulation / Entry Zone: $0.000910 – $0.000950
Target 1: $0.00105
Target 2: $0.00118
Stop Loss: Strict risk management below $0.000825 to protect capital against sudden volatility.
The Pro Play: High-volatility scalp setups demand strict discipline. Never trade without a defined stop loss, and always lock in profits on the way up.
Are you taking a scalp on $SOPH today, or sitting this one out? Let's discuss in the comments below! 👇
#BinanceSquare #CryptoTrading #Altcoins #TechnicalAnalysis #TradingStrategy
🚨 THE BREAKOUT SETUP: WHY $SOPH IS PRIMED FOR A MASSIVE TECHNICAL BOUNCE
When extreme sell-offs hit speculative altcoins, weak hands panic—but professional scalpers look for high-probability reversal zones. If you are tracking the charts on SOPH/USDT, the current setup on lower timeframes is flashing classic reversal signals.
Here is why this trade setup is catching the attention of aggressive swing traders:
📊 Extreme RSI Oversold Reset: On shorter timeframes following the heavy flush, the RSI plunged deep into oversold territory before forming higher lows and curling back up toward neutral levels.
📉 Funding Rate & Short Squeeze Potential: Negative funding rates combined with a stabilization of Open Interest mean that late shorts are heavily crowded. A sudden push past local resistance could trigger an aggressive short squeeze.
🎯 Defined Entry & Risk Ratios:
Accumulation / Entry Zone: $0.000910 – $0.000950
Target 1: $0.00105
Target 2: $0.00118
Stop Loss: Strict risk management below $0.000825 to protect capital against sudden volatility.
The Pro Play: High-volatility scalp setups demand strict discipline. Never trade without a defined stop loss, and always lock in profits on the way up.
Are you taking a scalp on $SOPH today, or sitting this one out? Let's discuss in the comments below! 👇
#BinanceSquare #CryptoTrading #Altcoins #TechnicalAnalysis #TradingStrategy
When extreme sell-offs hit speculative altcoins, weak hands panic—but professional scalpers look for high-probability reversal zones. If you are tracking the charts on SOPH/USDT, the current setup on lower timeframes is flashing classic reversal signals.
Here is why this trade setup is catching the attention of aggressive swing traders:
📊 Extreme RSI Oversold Reset: On shorter timeframes following the heavy flush, the RSI plunged deep into oversold territory before forming higher lows and curling back up toward neutral levels.
📉 Funding Rate & Short Squeeze Potential: Negative funding rates combined with a stabilization of Open Interest mean that late shorts are heavily crowded. A sudden push past local resistance could trigger an aggressive short squeeze.
🎯 Defined Entry & Risk Ratios:
Accumulation / Entry Zone: $0.000910 – $0.000950
Target 1: $0.00105
Target 2: $0.00118
Stop Loss: Strict risk management below $0.000825 to protect capital against sudden volatility.
The Pro Play: High-volatility scalp setups demand strict discipline. Never trade without a defined stop loss, and always lock in profits on the way up.
Are you taking a scalp on $SOPH today, or sitting this one out? Let's discuss in the comments below! 👇
#BinanceSquare #CryptoTrading #Altcoins #TechnicalAnalysis #TradingStrategy
428
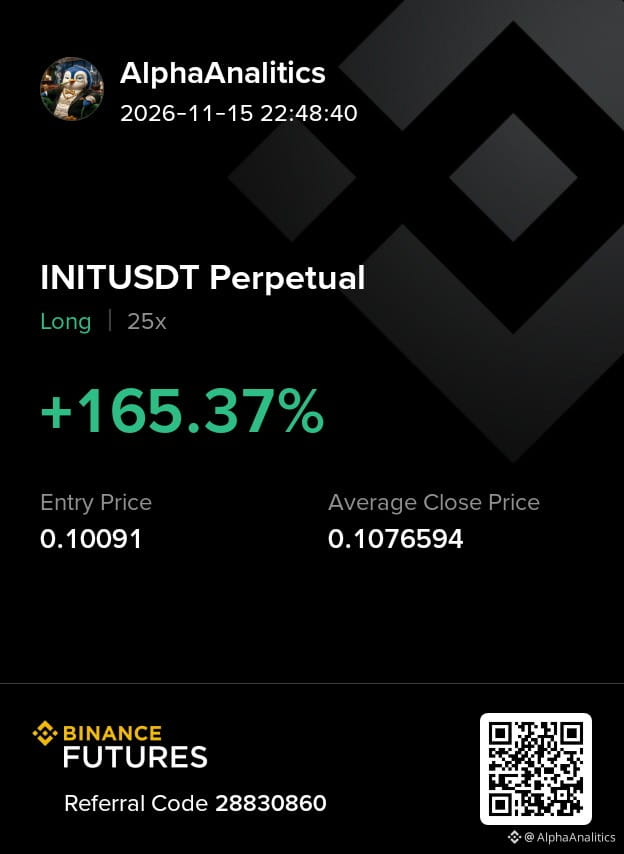
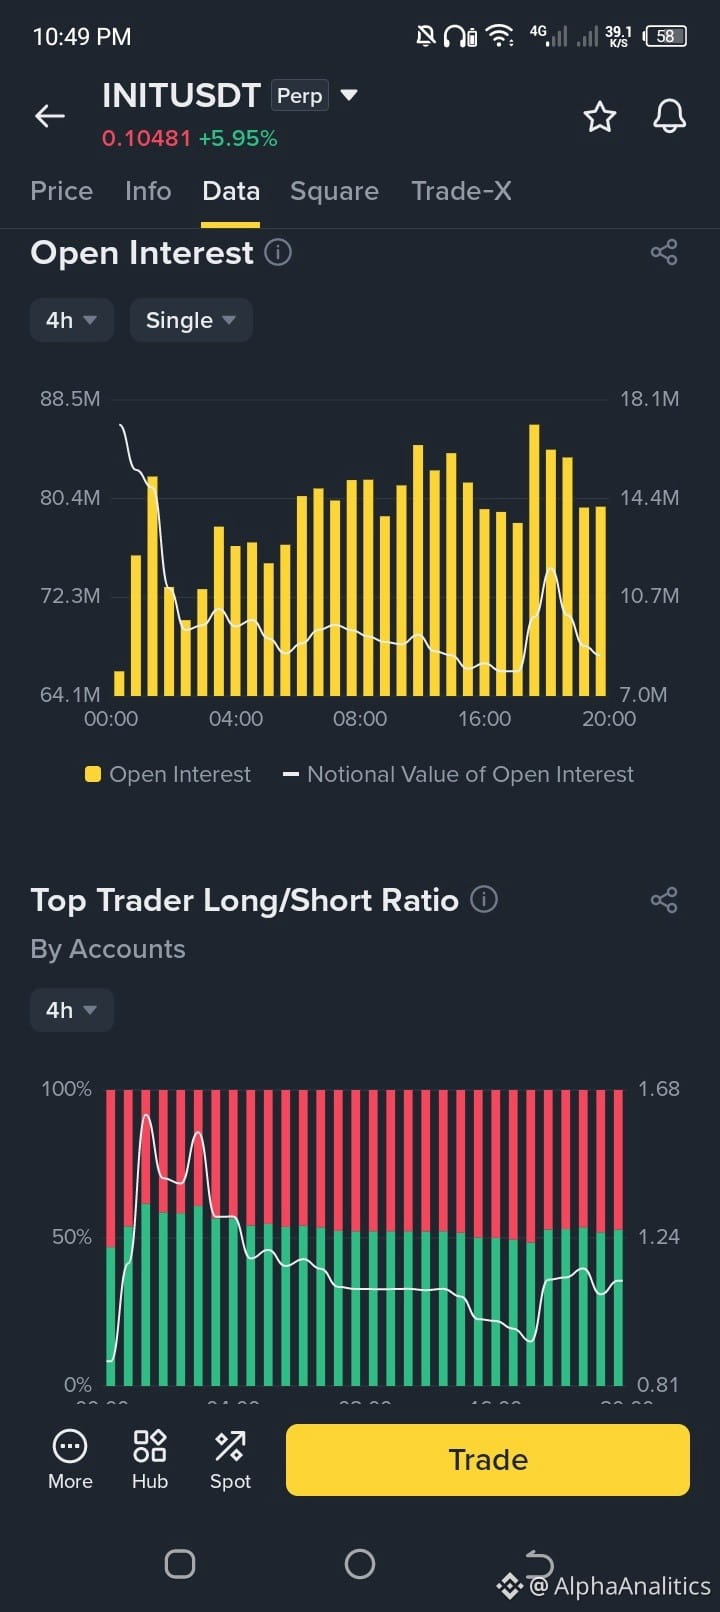
🚨 INITIA ($INIT) အသေးစိတ်လေ့လာချက်: ဈေးနှုန်းအပိုင်းအခြားများ၊ မျှော်မှန်းချက်များနှင့် ဆင်းသက်လာကုန်သွယ်မှုဒေတာ
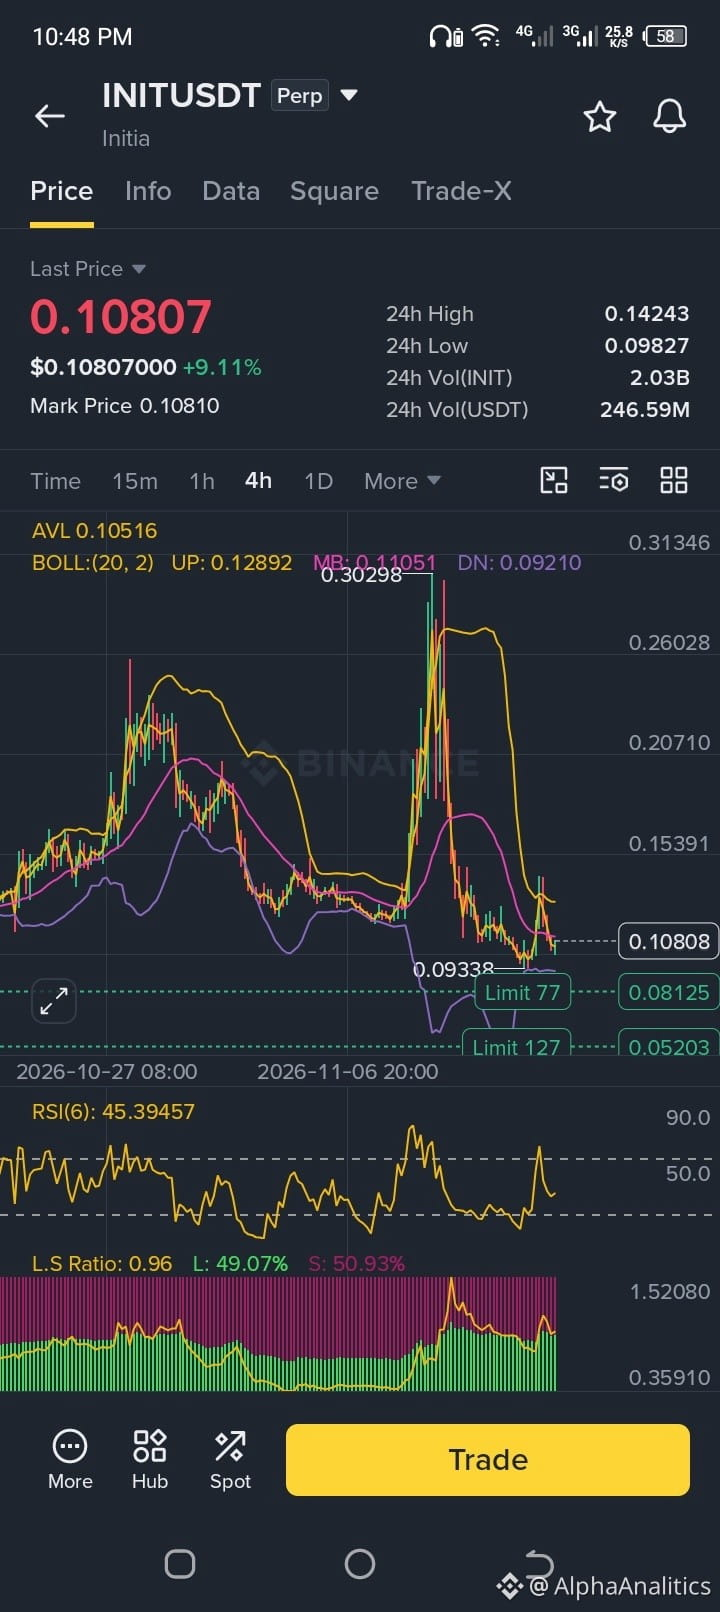
Initia ($INIT) သည် လက်ရှိတွင် $0.108 ဝန်းကျင် (+9.11%) ဖြင့် အရောင်းအဝယ်ဖြစ်နေပြီး၊ အရေးကြီးသော နည်းပညာဆိုင်ရာအဆင့်များတစ်လျှောက် ကုန်သည်များ အပြိုင်အဆိုင် အရောင်းအဝယ်လုပ်နေသဖြင့် သိသာထင်ရှားသော ဈေးနှုန်းအတက်အကျများကို ပြသနေသည်။ Binance ဆင်းသက်လာကုန်သွယ်မှုနှင့် အွန်ချိန်းဒေတာများကို အသေးစိတ်စစ်ဆေးကြည့်ရာ ဈေးနှုန်းနောက်တစ်ဆင့် ဘယ်ကိုဦးတည်မည်ဆိုသည့်အကြောင်း အရေးကြီးသော သဲလွန်စများကို တွေ့ရသည်:
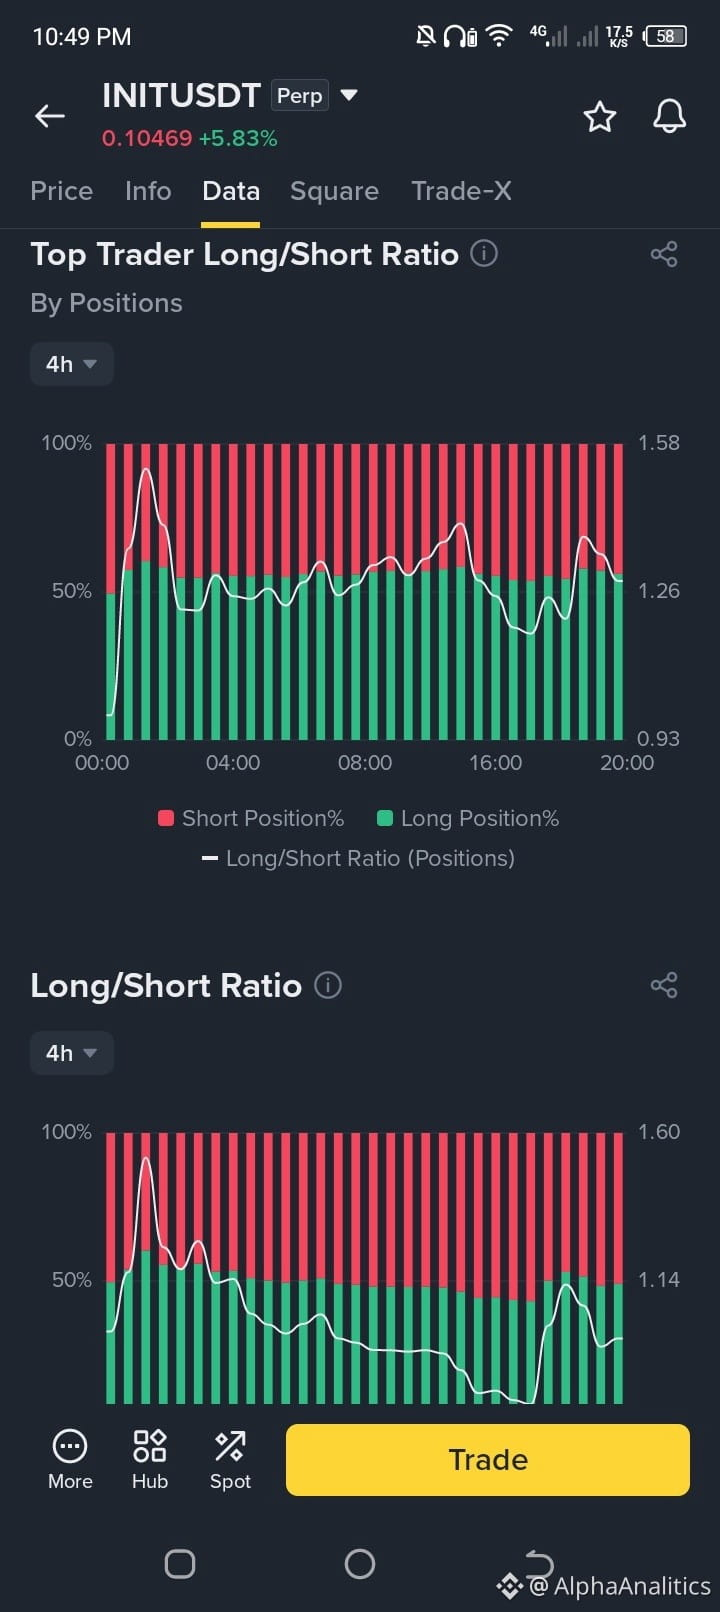
📊 ဖွင့်ထားသော စာချုပ်ပမာဏ (OI) နှင့် အနေအထားချထားမှု: မကြာသေးမီက ဈေးနှုန်းအတက်အကျများနောက်တွင် ဖွင့်ထားသော စာချုပ်ပမာဏသည် တည်ငြိမ်လာပြီး၊ ဈေးတက်မည်ဟု မျှော်လင့်သူများနှင့် ဈေးကျမည်ဟု မျှော်လင့်သူများကြား တင်းမာသော မျှခြေကို ပြသနေသည်။ တစ်ချိန်တည်းတွင် ထိပ်တန်းကုန်သည်များ၏ Long/Short အချိုးသည် 1.26 ဝန်းကျင်တွင် ရှိနေပြီး၊ စျေးကွက်တစ်ခုလုံး မသေချာမရေရာဖြစ်နေသော်လည်း ထိပ်တန်းအကောင့်များအကြား ဈေးတက်မည်ဟူသော ယုံကြည်ချက် အနည်းငယ်ရှိနေကြောင်း ပြသသည်။
📉 ရန်ပုံငွေထည့်ဝင်နှုန်းများနှင့် စိတ်ဓာတ်: ရန်ပုံငွေထည့်ဝင်နှုန်းသည် အနည်းငယ်အနုတ်လက္ခဏာဘက်တွင် (-0.0658%) ရှိနေသည်။ ဆိုလိုသည်မှာ Short အနေအထားဖွင့်ထားသူများသည် ၎င်းတို့၏ အနေအထားများကို ဆက်ထိန်းထားရန် အခကြေးငွေအနည်းငယ် ပေးနေရပြီး၊ အရှိန်အဟုန်တက်လာပါက Short squeeze ဖြစ်နိုင်ခြေရှိကြောင်း ပြသသည်။
📈 နည်းပညာဆိုင်ရာ အပိုင်းအခြားနှင့် အညွှန်းကိန်းများ: ၄ နာရီဇယားတွင် $INIT သည် Bollinger Band အလယ်မျဉ်း ($0.110) အနီးတွင် ဖိအားပေးနေပြီး၊ RSI(6) သည် 45.39 ဝန်းကျင်ဖြင့် ကြားနေအနေအထားတွင် ရှိနေသည်။
🎯 စောင့်ကြည့်ရမည့် အရေးကြီးသော အရောင်းအဝယ်အပိုင်းအခြားများ:
ထောက်ပံ့မှုအပိုင်းအခြား: လက်ရှိအနီးဆုံး ဒေသတွင်းထောက်ပံ့မှုသည် $0.092 မှ $0.093 ကြားတွင် ရှိသည် (အောက်ပိုင်း Bollinger Band နှင့် ကိုက်ညီသည်)။ ပိုမိုနက်ရှိုင်းသော ဖွဲ့စည်းပုံဆိုင်ရာ အောက်ခြေတစ်ခုမှာ $0.081 ဝန်းကျင်တွင် ရှိသည်။
ခုခံမှုအပိုင်းအခြား: ယခင်ဈေးတက်ခဲ့သည့် အမြင့်ဆုံးအဆင့်များဆီသို့ ပိုမိုကြီးမားသော ပြန်လည်နာလန်ထူမှု ဖြစ်ပေါ်စေရန် ဈေးတက်မည်ဟု မျှော်လင့်သူများသည် $0.128 - $0.130 ခုခံမှုဇုန်ကို ကျော်ဖြတ်ပြီး အထက်တွင် ဆက်လက်ထိန်းထားနိုင်ရန် လိုအပ်သည်။
အလားအလာ: $INIT သည် ၎င်း၏ အောက်ပိုင်း Band ထောက်ပံ့မှုအထက်တွင် ရှိနေသရွေ့ လက်ရှိအပိုင်းအခြားအတွင်း စုဆောင်းဝယ်ယူခြင်းသည် စိတ်ရှည်သော Spot ကုန်သည်များအတွက် အကျိုးရှိနိုင်သည်။ နောက်တစ်ကြိမ် ဈေးကွဲထွက်မည့် ဦးတည်ချက်ကို အတည်ပြုရန် ကုန်သွယ်မှုပမာဏ ရုတ်တရက်မြင့်တက်လာမှုများကို စောင့်ကြည့်ပါ။
ဒီအချိန်မှာ $INIT နဲ့ပတ်သက်ပြီး သင်ဘယ်လိုလုပ်ဆောင်မလဲ—လက်ရှိအပိုင်းအခြားအတွင်း စုဆောင်းဝယ်ယူမလား၊ ဒါမှမဟုတ် ဈေးကွဲထွက်မှုကို အတည်ပြုပြီးမှ စောင့်မလား။ အောက်မှာ ပြောပြခဲ့ပါ! 👇
#Initia #INIT #CryptoTrading #BinanceSquare
🚨 INITIA ($INIT) အသေးစိတ်လေ့လာချက်: ဈေးနှုန်းအပိုင်းအခြားများ၊ မျှော်မှန်းချက်များနှင့် ဆင်းသက်လာကုန်သွယ်မှုဒေတာ
Initia ($INIT) သည် လက်ရှိတွင် $0.108 ဝန်းကျင် (+9.11%) ဖြင့် အရောင်းအဝယ်ဖြစ်နေပြီး၊ အရေးကြီးသော နည်းပညာဆိုင်ရာအဆင့်များတစ်လျှောက် ကုန်သည်များ အပြိုင်အဆိုင် အရောင်းအဝယ်လုပ်နေသဖြင့် သိသာထင်ရှားသော ဈေးနှုန်းအတက်အကျများကို ပြသနေသည်။ Binance ဆင်းသက်လာကုန်သွယ်မှုနှင့် အွန်ချိန်းဒေတာများကို အသေးစိတ်စစ်ဆေးကြည့်ရာ ဈေးနှုန်းနောက်တစ်ဆင့် ဘယ်ကိုဦးတည်မည်ဆိုသည့်အကြောင်း အရေးကြီးသော သဲလွန်စများကို တွေ့ရသည်:
📊 ဖွင့်ထားသော စာချုပ်ပမာဏ (OI) နှင့် အနေအထားချထားမှု: မကြာသေးမီက ဈေးနှုန်းအတက်အကျများနောက်တွင် ဖွင့်ထားသော စာချုပ်ပမာဏသည် တည်ငြိမ်လာပြီး၊ ဈေးတက်မည်ဟု မျှော်လင့်သူများနှင့် ဈေးကျမည်ဟု မျှော်လင့်သူများကြား တင်းမာသော မျှခြေကို ပြသနေသည်။ တစ်ချိန်တည်းတွင် ထိပ်တန်းကုန်သည်များ၏ Long/Short အချိုးသည် 1.26 ဝန်းကျင်တွင် ရှိနေပြီး၊ စျေးကွက်တစ်ခုလုံး မသေချာမရေရာဖြစ်နေသော်လည်း ထိပ်တန်းအကောင့်များအကြား ဈေးတက်မည်ဟူသော ယုံကြည်ချက် အနည်းငယ်ရှိနေကြောင်း ပြသသည်။
📉 ရန်ပုံငွေထည့်ဝင်နှုန်းများနှင့် စိတ်ဓာတ်: ရန်ပုံငွေထည့်ဝင်နှုန်းသည် အနည်းငယ်အနုတ်လက္ခဏာဘက်တွင် (-0.0658%) ရှိနေသည်။ ဆိုလိုသည်မှာ Short အနေအထားဖွင့်ထားသူများသည် ၎င်းတို့၏ အနေအထားများကို ဆက်ထိန်းထားရန် အခကြေးငွေအနည်းငယ် ပေးနေရပြီး၊ အရှိန်အဟုန်တက်လာပါက Short squeeze ဖြစ်နိုင်ခြေရှိကြောင်း ပြသသည်။
📈 နည်းပညာဆိုင်ရာ အပိုင်းအခြားနှင့် အညွှန်းကိန်းများ: ၄ နာရီဇယားတွင် $INIT သည် Bollinger Band အလယ်မျဉ်း ($0.110) အနီးတွင် ဖိအားပေးနေပြီး၊ RSI(6) သည် 45.39 ဝန်းကျင်ဖြင့် ကြားနေအနေအထားတွင် ရှိနေသည်။
🎯 စောင့်ကြည့်ရမည့် အရေးကြီးသော အရောင်းအဝယ်အပိုင်းအခြားများ:
ထောက်ပံ့မှုအပိုင်းအခြား: လက်ရှိအနီးဆုံး ဒေသတွင်းထောက်ပံ့မှုသည် $0.092 မှ $0.093 ကြားတွင် ရှိသည် (အောက်ပိုင်း Bollinger Band နှင့် ကိုက်ညီသည်)။ ပိုမိုနက်ရှိုင်းသော ဖွဲ့စည်းပုံဆိုင်ရာ အောက်ခြေတစ်ခုမှာ $0.081 ဝန်းကျင်တွင် ရှိသည်။
ခုခံမှုအပိုင်းအခြား: ယခင်ဈေးတက်ခဲ့သည့် အမြင့်ဆုံးအဆင့်များဆီသို့ ပိုမိုကြီးမားသော ပြန်လည်နာလန်ထူမှု ဖြစ်ပေါ်စေရန် ဈေးတက်မည်ဟု မျှော်လင့်သူများသည် $0.128 - $0.130 ခုခံမှုဇုန်ကို ကျော်ဖြတ်ပြီး အထက်တွင် ဆက်လက်ထိန်းထားနိုင်ရန် လိုအပ်သည်။
အလားအလာ: $INIT သည် ၎င်း၏ အောက်ပိုင်း Band ထောက်ပံ့မှုအထက်တွင် ရှိနေသရွေ့ လက်ရှိအပိုင်းအခြားအတွင်း စုဆောင်းဝယ်ယူခြင်းသည် စိတ်ရှည်သော Spot ကုန်သည်များအတွက် အကျိုးရှိနိုင်သည်။ နောက်တစ်ကြိမ် ဈေးကွဲထွက်မည့် ဦးတည်ချက်ကို အတည်ပြုရန် ကုန်သွယ်မှုပမာဏ ရုတ်တရက်မြင့်တက်လာမှုများကို စောင့်ကြည့်ပါ။
ဒီအချိန်မှာ $INIT နဲ့ပတ်သက်ပြီး သင်ဘယ်လိုလုပ်ဆောင်မလဲ—လက်ရှိအပိုင်းအခြားအတွင်း စုဆောင်းဝယ်ယူမလား၊ ဒါမှမဟုတ် ဈေးကွဲထွက်မှုကို အတည်ပြုပြီးမှ စောင့်မလား။ အောက်မှာ ပြောပြခဲ့ပါ! 👇
#Initia #INIT #CryptoTrading #BinanceSquare
Initia ($INIT) သည် လက်ရှိတွင် $0.108 ဝန်းကျင် (+9.11%) ဖြင့် အရောင်းအဝယ်ဖြစ်နေပြီး၊ အရေးကြီးသော နည်းပညာဆိုင်ရာအဆင့်များတစ်လျှောက် ကုန်သည်များ အပြိုင်အဆိုင် အရောင်းအဝယ်လုပ်နေသဖြင့် သိသာထင်ရှားသော ဈေးနှုန်းအတက်အကျများကို ပြသနေသည်။ Binance ဆင်းသက်လာကုန်သွယ်မှုနှင့် အွန်ချိန်းဒေတာများကို အသေးစိတ်စစ်ဆေးကြည့်ရာ ဈေးနှုန်းနောက်တစ်ဆင့် ဘယ်ကိုဦးတည်မည်ဆိုသည့်အကြောင်း အရေးကြီးသော သဲလွန်စများကို တွေ့ရသည်:
📊 ဖွင့်ထားသော စာချုပ်ပမာဏ (OI) နှင့် အနေအထားချထားမှု: မကြာသေးမီက ဈေးနှုန်းအတက်အကျများနောက်တွင် ဖွင့်ထားသော စာချုပ်ပမာဏသည် တည်ငြိမ်လာပြီး၊ ဈေးတက်မည်ဟု မျှော်လင့်သူများနှင့် ဈေးကျမည်ဟု မျှော်လင့်သူများကြား တင်းမာသော မျှခြေကို ပြသနေသည်။ တစ်ချိန်တည်းတွင် ထိပ်တန်းကုန်သည်များ၏ Long/Short အချိုးသည် 1.26 ဝန်းကျင်တွင် ရှိနေပြီး၊ စျေးကွက်တစ်ခုလုံး မသေချာမရေရာဖြစ်နေသော်လည်း ထိပ်တန်းအကောင့်များအကြား ဈေးတက်မည်ဟူသော ယုံကြည်ချက် အနည်းငယ်ရှိနေကြောင်း ပြသသည်။
📉 ရန်ပုံငွေထည့်ဝင်နှုန်းများနှင့် စိတ်ဓာတ်: ရန်ပုံငွေထည့်ဝင်နှုန်းသည် အနည်းငယ်အနုတ်လက္ခဏာဘက်တွင် (-0.0658%) ရှိနေသည်။ ဆိုလိုသည်မှာ Short အနေအထားဖွင့်ထားသူများသည် ၎င်းတို့၏ အနေအထားများကို ဆက်ထိန်းထားရန် အခကြေးငွေအနည်းငယ် ပေးနေရပြီး၊ အရှိန်အဟုန်တက်လာပါက Short squeeze ဖြစ်နိုင်ခြေရှိကြောင်း ပြသသည်။
📈 နည်းပညာဆိုင်ရာ အပိုင်းအခြားနှင့် အညွှန်းကိန်းများ: ၄ နာရီဇယားတွင် $INIT သည် Bollinger Band အလယ်မျဉ်း ($0.110) အနီးတွင် ဖိအားပေးနေပြီး၊ RSI(6) သည် 45.39 ဝန်းကျင်ဖြင့် ကြားနေအနေအထားတွင် ရှိနေသည်။
🎯 စောင့်ကြည့်ရမည့် အရေးကြီးသော အရောင်းအဝယ်အပိုင်းအခြားများ:
ထောက်ပံ့မှုအပိုင်းအခြား: လက်ရှိအနီးဆုံး ဒေသတွင်းထောက်ပံ့မှုသည် $0.092 မှ $0.093 ကြားတွင် ရှိသည် (အောက်ပိုင်း Bollinger Band နှင့် ကိုက်ညီသည်)။ ပိုမိုနက်ရှိုင်းသော ဖွဲ့စည်းပုံဆိုင်ရာ အောက်ခြေတစ်ခုမှာ $0.081 ဝန်းကျင်တွင် ရှိသည်။
ခုခံမှုအပိုင်းအခြား: ယခင်ဈေးတက်ခဲ့သည့် အမြင့်ဆုံးအဆင့်များဆီသို့ ပိုမိုကြီးမားသော ပြန်လည်နာလန်ထူမှု ဖြစ်ပေါ်စေရန် ဈေးတက်မည်ဟု မျှော်လင့်သူများသည် $0.128 - $0.130 ခုခံမှုဇုန်ကို ကျော်ဖြတ်ပြီး အထက်တွင် ဆက်လက်ထိန်းထားနိုင်ရန် လိုအပ်သည်။
အလားအလာ: $INIT သည် ၎င်း၏ အောက်ပိုင်း Band ထောက်ပံ့မှုအထက်တွင် ရှိနေသရွေ့ လက်ရှိအပိုင်းအခြားအတွင်း စုဆောင်းဝယ်ယူခြင်းသည် စိတ်ရှည်သော Spot ကုန်သည်များအတွက် အကျိုးရှိနိုင်သည်။ နောက်တစ်ကြိမ် ဈေးကွဲထွက်မည့် ဦးတည်ချက်ကို အတည်ပြုရန် ကုန်သွယ်မှုပမာဏ ရုတ်တရက်မြင့်တက်လာမှုများကို စောင့်ကြည့်ပါ။
ဒီအချိန်မှာ $INIT နဲ့ပတ်သက်ပြီး သင်ဘယ်လိုလုပ်ဆောင်မလဲ—လက်ရှိအပိုင်းအခြားအတွင်း စုဆောင်းဝယ်ယူမလား၊ ဒါမှမဟုတ် ဈေးကွဲထွက်မှုကို အတည်ပြုပြီးမှ စောင့်မလား။ အောက်မှာ ပြောပြခဲ့ပါ! 👇
#Initia #INIT #CryptoTrading #BinanceSquare
840
ဘာသာပြန်ဆိုချက် ကြည့်မည်
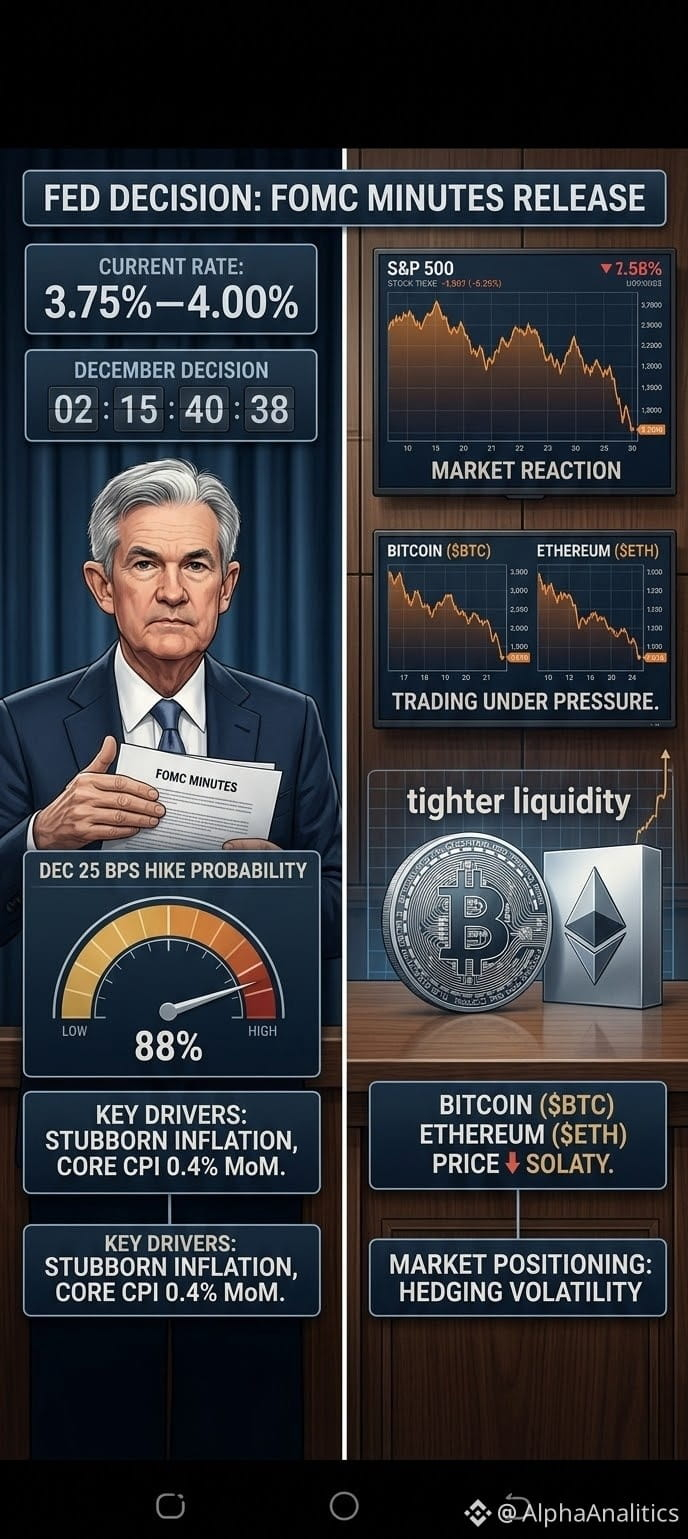
🚨 FOMC MINUTES INCOMING: IS A 25 BPS DECEMBER HIKE ALREADY A DONE DEAL?
All eyes on Wall Street and across the crypto market are locked onto the upcoming FOMC Minutes from the October 27–28 meeting. With the Federal Reserve holding rates at 3.75%–4.00% after September's hike, traders are dissecting every word for confirmation of what comes next on December 8–9.
Here is what is driving the macro tension right now:
📈 Stubborn Inflation Pressure: With October Core CPI ticking up 0.4% MoM and producer prices surging to multi-year highs alongside elevated energy costs, the 2% inflation target remains out of reach.
🦅 Hawkish Signals from the Fed: Policymakers including Christopher Waller and John Williams have already signaled that more tightening is likely on the table to defend price stability.
🎯 Market Pricing: Futures and prediction markets are currently pricing in roughly an 88% to 93% probability of another 25 bps rate hike in December—and the real wildcard is whether the minutes reveal active debate around an even more aggressive move.
What this means for BTC andETH:
If a 25 bps hike is largely priced in, the immediate volatility won't come from the headline itself—it will come from how hawkish the Fed's tone is heading into 2027. Tighter liquidity conditions mean leveraged positions on both sides are walking a tightrope.
How are you positioning ahead of the FOMC Minutes release—hedging spot, scalping the volatility, or sitting in stables? Drop your game plan below! 👇
#WillFOMCMinutesReinforceRateHikeExpectations #FOMC #Bitcoin #BinanceSquare
🚨 FOMC MINUTES INCOMING: IS A 25 BPS DECEMBER HIKE ALREADY A DONE DEAL?
All eyes on Wall Street and across the crypto market are locked onto the upcoming FOMC Minutes from the October 27–28 meeting. With the Federal Reserve holding rates at 3.75%–4.00% after September's hike, traders are dissecting every word for confirmation of what comes next on December 8–9.
Here is what is driving the macro tension right now:
📈 Stubborn Inflation Pressure: With October Core CPI ticking up 0.4% MoM and producer prices surging to multi-year highs alongside elevated energy costs, the 2% inflation target remains out of reach.
🦅 Hawkish Signals from the Fed: Policymakers including Christopher Waller and John Williams have already signaled that more tightening is likely on the table to defend price stability.
🎯 Market Pricing: Futures and prediction markets are currently pricing in roughly an 88% to 93% probability of another 25 bps rate hike in December—and the real wildcard is whether the minutes reveal active debate around an even more aggressive move.
What this means for BTC andETH:
If a 25 bps hike is largely priced in, the immediate volatility won't come from the headline itself—it will come from how hawkish the Fed's tone is heading into 2027. Tighter liquidity conditions mean leveraged positions on both sides are walking a tightrope.
How are you positioning ahead of the FOMC Minutes release—hedging spot, scalping the volatility, or sitting in stables? Drop your game plan below! 👇
#WillFOMCMinutesReinforceRateHikeExpectations #FOMC #Bitcoin #BinanceSquare
All eyes on Wall Street and across the crypto market are locked onto the upcoming FOMC Minutes from the October 27–28 meeting. With the Federal Reserve holding rates at 3.75%–4.00% after September's hike, traders are dissecting every word for confirmation of what comes next on December 8–9.
Here is what is driving the macro tension right now:
📈 Stubborn Inflation Pressure: With October Core CPI ticking up 0.4% MoM and producer prices surging to multi-year highs alongside elevated energy costs, the 2% inflation target remains out of reach.
🦅 Hawkish Signals from the Fed: Policymakers including Christopher Waller and John Williams have already signaled that more tightening is likely on the table to defend price stability.
🎯 Market Pricing: Futures and prediction markets are currently pricing in roughly an 88% to 93% probability of another 25 bps rate hike in December—and the real wildcard is whether the minutes reveal active debate around an even more aggressive move.
What this means for BTC andETH:
If a 25 bps hike is largely priced in, the immediate volatility won't come from the headline itself—it will come from how hawkish the Fed's tone is heading into 2027. Tighter liquidity conditions mean leveraged positions on both sides are walking a tightrope.
How are you positioning ahead of the FOMC Minutes release—hedging spot, scalping the volatility, or sitting in stables? Drop your game plan below! 👇
#WillFOMCMinutesReinforceRateHikeExpectations #FOMC #Bitcoin #BinanceSquare
65
ဘာသာပြန်ဆိုချက် ကြည့်မည်
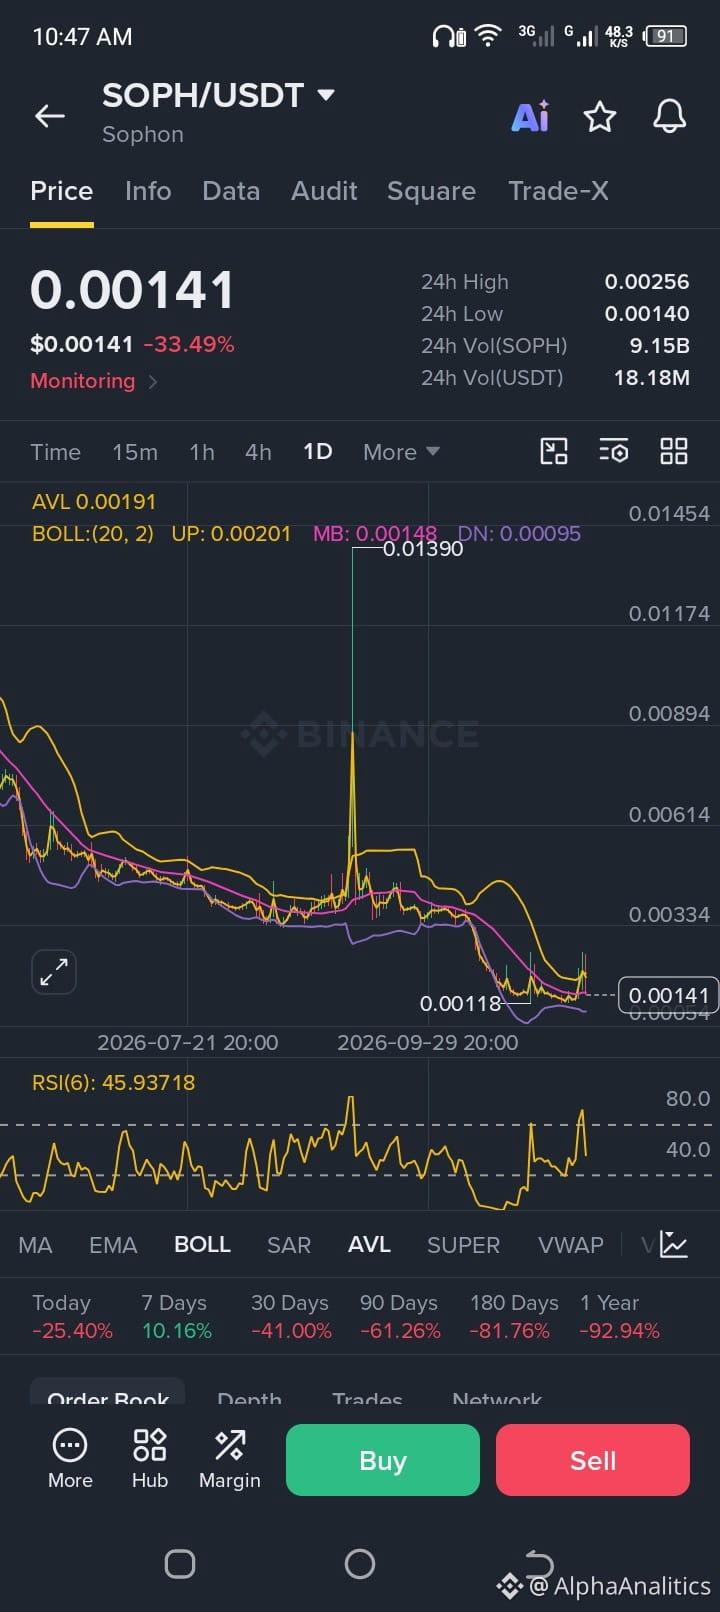
🚨 WHY IS $SOPH CRASHING SO HARD? THE TRUTH BEHIND THE PLUNGE
If you are looking at the charts and wondering why Sophon ($SOPH) has experienced such a brutal correction, dropping past major support and plunging over 30% in a single session, you aren't alone.
Here is what is driving the massive sell-off:
⚠️ Project Operations & Network Restructuring: Rumors and updates regarding structural shifts and operational challenges within the ecosystem have heavily damaged investor confidence, raising serious concerns about long-term utility.
📉 Exchange Scrutiny & Monitoring: Being placed under strict monitoring tags on major platforms has triggered automatic risk-off behaviors, leading to a wave of liquidity drain.
🌊 Capitulation & Panic Selling: Once key technical support levels broke, algorithmic stop-losses and panicked retail holders rushed for the exits, accelerating the downward spiral.
What should traders know right now?
In high-risk assets facing fundamental headwinds, sudden dead-cat bounces can be traps. Always prioritize risk management over emotional "dip buying."
Are you holding SOPH, or staying far away from this chart? Let’s discuss below! 👇
#Sophon #SOPH #CryptoTrading #BinanceSquare
🚨 WHY IS $SOPH CRASHING SO HARD? THE TRUTH BEHIND THE PLUNGE
If you are looking at the charts and wondering why Sophon ($SOPH ) has experienced such a brutal correction, dropping past major support and plunging over 30% in a single session, you aren't alone.
Here is what is driving the massive sell-off:
⚠️ Project Operations & Network Restructuring: Rumors and updates regarding structural shifts and operational challenges within the ecosystem have heavily damaged investor confidence, raising serious concerns about long-term utility.
📉 Exchange Scrutiny & Monitoring: Being placed under strict monitoring tags on major platforms has triggered automatic risk-off behaviors, leading to a wave of liquidity drain.
🌊 Capitulation & Panic Selling: Once key technical support levels broke, algorithmic stop-losses and panicked retail holders rushed for the exits, accelerating the downward spiral.
What should traders know right now?
In high-risk assets facing fundamental headwinds, sudden dead-cat bounces can be traps. Always prioritize risk management over emotional "dip buying."
Are you holding SOPH, or staying far away from this chart? Let’s discuss below! 👇
#Sophon #SOPH #CryptoTrading #BinanceSquare
If you are looking at the charts and wondering why Sophon ($SOPH ) has experienced such a brutal correction, dropping past major support and plunging over 30% in a single session, you aren't alone.
Here is what is driving the massive sell-off:
⚠️ Project Operations & Network Restructuring: Rumors and updates regarding structural shifts and operational challenges within the ecosystem have heavily damaged investor confidence, raising serious concerns about long-term utility.
📉 Exchange Scrutiny & Monitoring: Being placed under strict monitoring tags on major platforms has triggered automatic risk-off behaviors, leading to a wave of liquidity drain.
🌊 Capitulation & Panic Selling: Once key technical support levels broke, algorithmic stop-losses and panicked retail holders rushed for the exits, accelerating the downward spiral.
What should traders know right now?
In high-risk assets facing fundamental headwinds, sudden dead-cat bounces can be traps. Always prioritize risk management over emotional "dip buying."
Are you holding SOPH, or staying far away from this chart? Let’s discuss below! 👇
#Sophon #SOPH #CryptoTrading #BinanceSquare
308
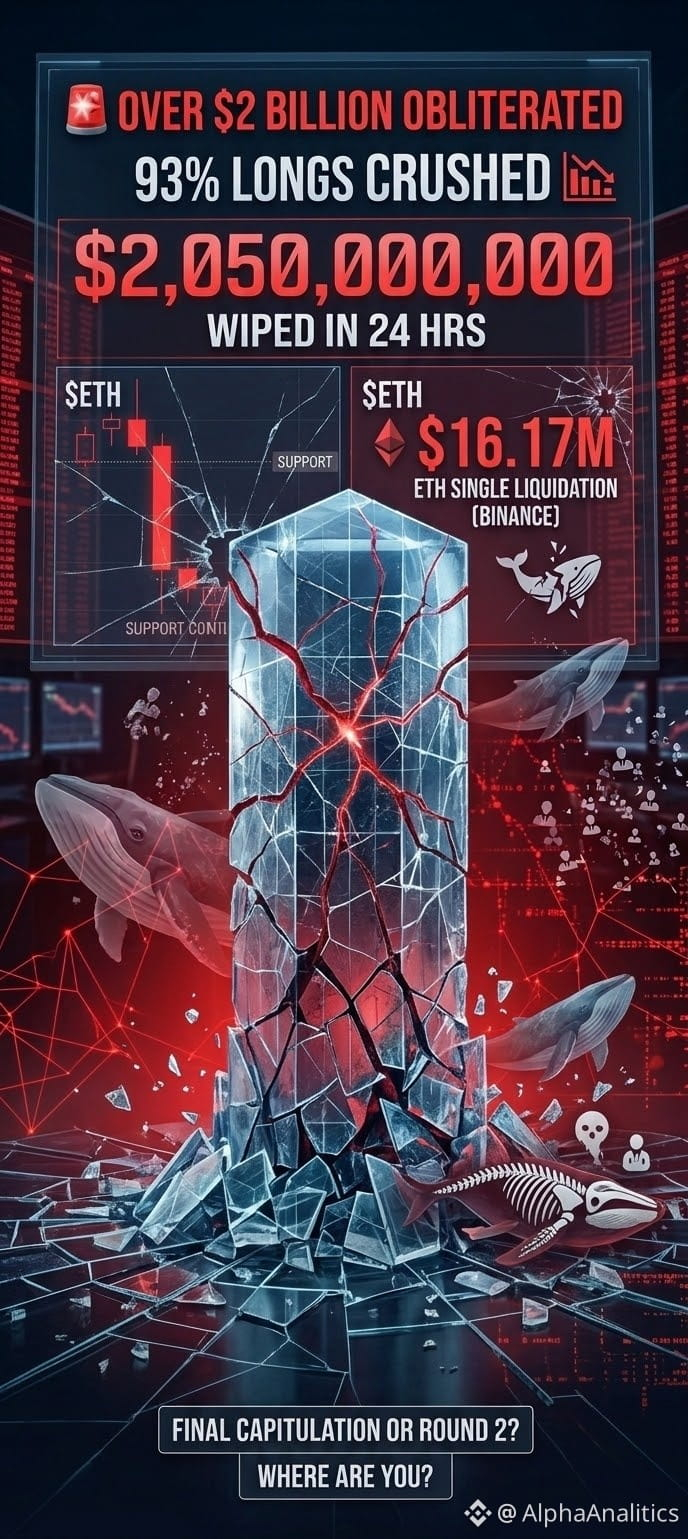
🚨 ဒေါ်လာ ၂ ဘီလီယံကျော် ပျောက်ကွယ်သွားပြီ — ဝေလငါးတွေ ပြုတ်ကျတဲ့အခါ ဘယ်သူက တကယ်လုံခြုံမှာလဲ?
အခုလေးတင် crypto ဈေးကွက်မှာ မြင်တွေ့ခဲ့ရတဲ့ အကြီးအကျယ် ဈေးကျမှုဟာ သာမန်ဈေးကွက်ပြင်ဆင်မှုတစ်ခု မဟုတ်ပါဘူး — leverage သုံးထားတဲ့ အတက်ဘက်လောင်းသူတွေကို အပြတ်အသတ် ချေမှုန်းလိုက်တာပါ။ ၂၄ နာရီအတွင်း ဒေါ်လာ ၂.၀၅ ဘီလီယံကျော် လေထဲပျောက်သွားခဲ့ပြီး ကုန်သွယ်သူ ၃၂၉,၃၃၉ ဦးကိုပါ ဖယ်ရှားပစ်ခဲ့ပါတယ်!
ရက်စက်လွန်းတဲ့ အခြေအနေကို ကြည့်လိုက်ရအောင်:
📉 ဒေါ်လာ ၁.၉၂၂ ဘီလီယံဟာ LONG အနေအထားတွေကနေ သီးသန့် ဖြစ်ပေါ်ခဲ့တာပါ (ဖျက်သိမ်းမှုအားလုံးရဲ့ ၉၃% ရှိပါတယ်)။
🐋 ဝေလငါးတွေတောင် သွေးထွက်ခဲ့ပါတယ်။ တစ်ကြိမ်တည်းအတွင်း အကြီးဆုံး ဖျက်သိမ်းမှုက Binance မှာပဲ $ETH ရဲ့ ဒေါ်လာ ၁၆.၁၇ သန်းဖိုး ဖြစ်ပါတယ်။
ဒေါ်လာသန်းပေါင်းများစွာတန်တဲ့ ဝေလငါးတွေရဲ့ အနေအထားတွေဟာ လက်လီကုန်သွယ်သူ သိန်းပေါင်းများစွာရဲ့ အကောင့်တွေနဲ့အတူ တစ်ခါတည်း မျိုချခံလိုက်ရတဲ့အခါ၊ ခက်ထန်တဲ့ အမှန်တရားတစ်ခုကို သက်သေပြနေပါတယ် — leverage အလွန်အကျွံသုံးတာကို ဈေးကွက်က လုံးဝ ညှာတာမှာ မဟုတ်ပါဘူး။
အခု လူတိုင်းသိချင်နေတဲ့ မေးခွန်းကတော့ — ဒီလို အကြီးအကျယ် ရှင်းထုတ်မှုဟာ ကွင်းပြင်ကို ရှင်းလင်းဖို့ လိုအပ်တဲ့ နောက်ဆုံးလက်လျှော့မှုလား၊ ဒါမှမဟုတ် အကျဘက်သမားတွေက ဒုတိယအချီအတွက် ပြင်ဆင်နေကြတာလား?
သင့်ရဲ့ မဟာဗျူဟာကို အောက်မှာ ပြောပြပါ: ပျက်စီးမှုတွေကြားက ဈေးသက်သာတာတွေကို လိုက်ရှာနေသလား၊ ဒါမှမဟုတ် ဘေးကင်းရာမှာပဲ နေနေသလား? 👇
#CryptoSelloffTriggersMultipleWhaleLiquidations #BinanceSquare #CryptoTrading
🚨 ဒေါ်လာ ၂ ဘီလီယံကျော် ပျောက်ကွယ်သွားပြီ — ဝေလငါးတွေ ပြုတ်ကျတဲ့အခါ ဘယ်သူက တကယ်လုံခြုံမှာလဲ?
အခုလေးတင် crypto ဈေးကွက်မှာ မြင်တွေ့ခဲ့ရတဲ့ အကြီးအကျယ် ဈေးကျမှုဟာ သာမန်ဈေးကွက်ပြင်ဆင်မှုတစ်ခု မဟုတ်ပါဘူး — leverage သုံးထားတဲ့ အတက်ဘက်လောင်းသူတွေကို အပြတ်အသတ် ချေမှုန်းလိုက်တာပါ။ ၂၄ နာရီအတွင်း ဒေါ်လာ ၂.၀၅ ဘီလီယံကျော် လေထဲပျောက်သွားခဲ့ပြီး ကုန်သွယ်သူ ၃၂၉,၃၃၉ ဦးကိုပါ ဖယ်ရှားပစ်ခဲ့ပါတယ်!
ရက်စက်လွန်းတဲ့ အခြေအနေကို ကြည့်လိုက်ရအောင်:
📉 ဒေါ်လာ ၁.၉၂၂ ဘီလီယံဟာ LONG အနေအထားတွေကနေ သီးသန့် ဖြစ်ပေါ်ခဲ့တာပါ (ဖျက်သိမ်းမှုအားလုံးရဲ့ ၉၃% ရှိပါတယ်)။
🐋 ဝေလငါးတွေတောင် သွေးထွက်ခဲ့ပါတယ်။ တစ်ကြိမ်တည်းအတွင်း အကြီးဆုံး ဖျက်သိမ်းမှုက Binance မှာပဲ $ETH ရဲ့ ဒေါ်လာ ၁၆.၁၇ သန်းဖိုး ဖြစ်ပါတယ်။
ဒေါ်လာသန်းပေါင်းများစွာတန်တဲ့ ဝေလငါးတွေရဲ့ အနေအထားတွေဟာ လက်လီကုန်သွယ်သူ သိန်းပေါင်းများစွာရဲ့ အကောင့်တွေနဲ့အတူ တစ်ခါတည်း မျိုချခံလိုက်ရတဲ့အခါ၊ ခက်ထန်တဲ့ အမှန်တရားတစ်ခုကို သက်သေပြနေပါတယ် — leverage အလွန်အကျွံသုံးတာကို ဈေးကွက်က လုံးဝ ညှာတာမှာ မဟုတ်ပါဘူး။
အခု လူတိုင်းသိချင်နေတဲ့ မေးခွန်းကတော့ — ဒီလို အကြီးအကျယ် ရှင်းထုတ်မှုဟာ ကွင်းပြင်ကို ရှင်းလင်းဖို့ လိုအပ်တဲ့ နောက်ဆုံးလက်လျှော့မှုလား၊ ဒါမှမဟုတ် အကျဘက်သမားတွေက ဒုတိယအချီအတွက် ပြင်ဆင်နေကြတာလား?
သင့်ရဲ့ မဟာဗျူဟာကို အောက်မှာ ပြောပြပါ: ပျက်စီးမှုတွေကြားက ဈေးသက်သာတာတွေကို လိုက်ရှာနေသလား၊ ဒါမှမဟုတ် ဘေးကင်းရာမှာပဲ နေနေသလား? 👇
#CryptoSelloffTriggersMultipleWhaleLiquidations #BinanceSquare #CryptoTrading
အခုလေးတင် crypto ဈေးကွက်မှာ မြင်တွေ့ခဲ့ရတဲ့ အကြီးအကျယ် ဈေးကျမှုဟာ သာမန်ဈေးကွက်ပြင်ဆင်မှုတစ်ခု မဟုတ်ပါဘူး — leverage သုံးထားတဲ့ အတက်ဘက်လောင်းသူတွေကို အပြတ်အသတ် ချေမှုန်းလိုက်တာပါ။ ၂၄ နာရီအတွင်း ဒေါ်လာ ၂.၀၅ ဘီလီယံကျော် လေထဲပျောက်သွားခဲ့ပြီး ကုန်သွယ်သူ ၃၂၉,၃၃၉ ဦးကိုပါ ဖယ်ရှားပစ်ခဲ့ပါတယ်!
ရက်စက်လွန်းတဲ့ အခြေအနေကို ကြည့်လိုက်ရအောင်:
📉 ဒေါ်လာ ၁.၉၂၂ ဘီလီယံဟာ LONG အနေအထားတွေကနေ သီးသန့် ဖြစ်ပေါ်ခဲ့တာပါ (ဖျက်သိမ်းမှုအားလုံးရဲ့ ၉၃% ရှိပါတယ်)။
🐋 ဝေလငါးတွေတောင် သွေးထွက်ခဲ့ပါတယ်။ တစ်ကြိမ်တည်းအတွင်း အကြီးဆုံး ဖျက်သိမ်းမှုက Binance မှာပဲ $ETH ရဲ့ ဒေါ်လာ ၁၆.၁၇ သန်းဖိုး ဖြစ်ပါတယ်။
ဒေါ်လာသန်းပေါင်းများစွာတန်တဲ့ ဝေလငါးတွေရဲ့ အနေအထားတွေဟာ လက်လီကုန်သွယ်သူ သိန်းပေါင်းများစွာရဲ့ အကောင့်တွေနဲ့အတူ တစ်ခါတည်း မျိုချခံလိုက်ရတဲ့အခါ၊ ခက်ထန်တဲ့ အမှန်တရားတစ်ခုကို သက်သေပြနေပါတယ် — leverage အလွန်အကျွံသုံးတာကို ဈေးကွက်က လုံးဝ ညှာတာမှာ မဟုတ်ပါဘူး။
အခု လူတိုင်းသိချင်နေတဲ့ မေးခွန်းကတော့ — ဒီလို အကြီးအကျယ် ရှင်းထုတ်မှုဟာ ကွင်းပြင်ကို ရှင်းလင်းဖို့ လိုအပ်တဲ့ နောက်ဆုံးလက်လျှော့မှုလား၊ ဒါမှမဟုတ် အကျဘက်သမားတွေက ဒုတိယအချီအတွက် ပြင်ဆင်နေကြတာလား?
သင့်ရဲ့ မဟာဗျူဟာကို အောက်မှာ ပြောပြပါ: ပျက်စီးမှုတွေကြားက ဈေးသက်သာတာတွေကို လိုက်ရှာနေသလား၊ ဒါမှမဟုတ် ဘေးကင်းရာမှာပဲ နေနေသလား? 👇
#CryptoSelloffTriggersMultipleWhaleLiquidations #BinanceSquare #CryptoTrading
1
2
636
ဘာသာပြန်ဆိုချက် ကြည့်မည်
🚨 ETH UNDER PRESSURE: Massive Outflows and Extreme Oversold Levels — Are We Near the Bottom?
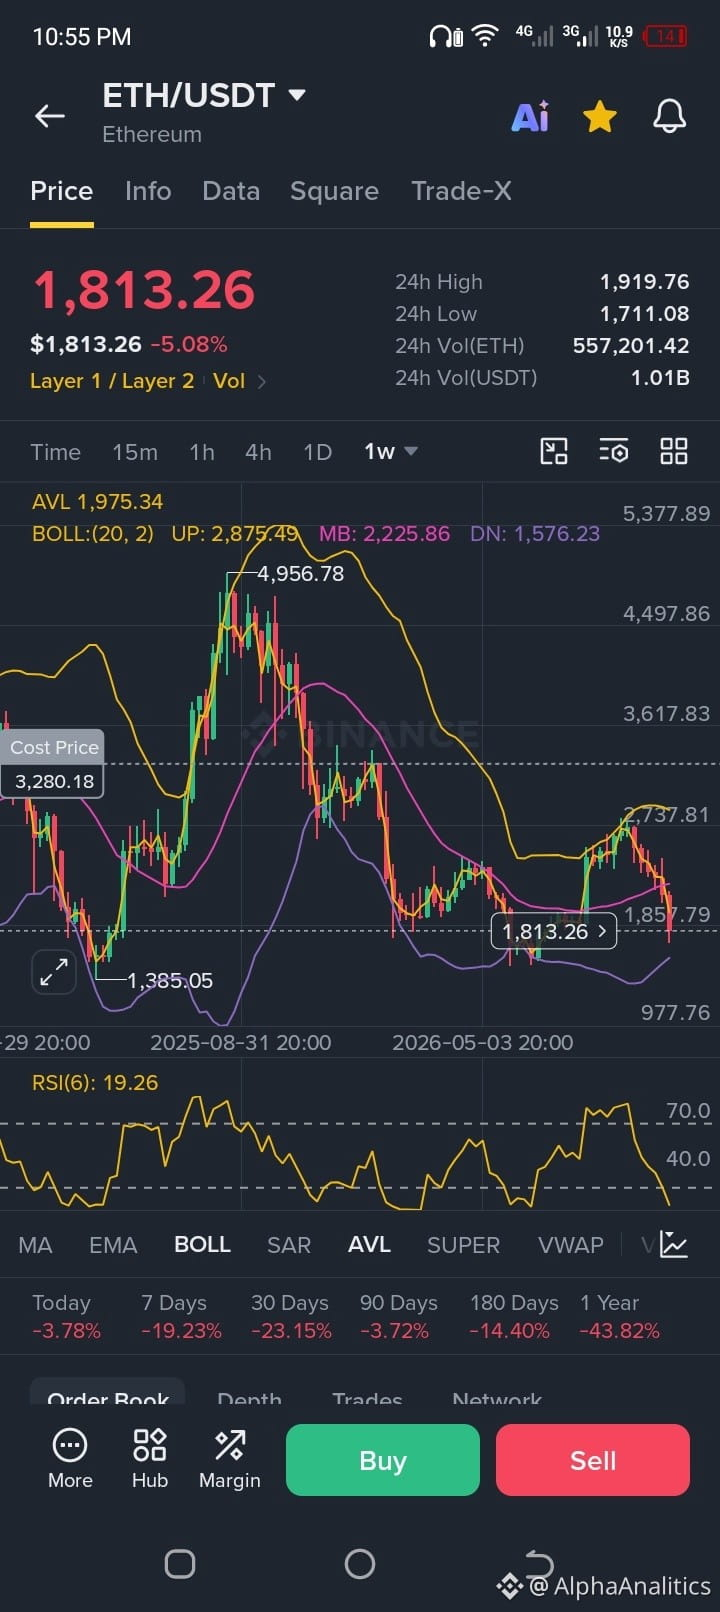
Ethereum ($ETH) is taking a heavy hit, trading down around $1,812 (-5.03%), reflecting a wave of intense market pressure. Looking under the hood at the latest Binance data and on-chain metrics reveals a fascinating story:
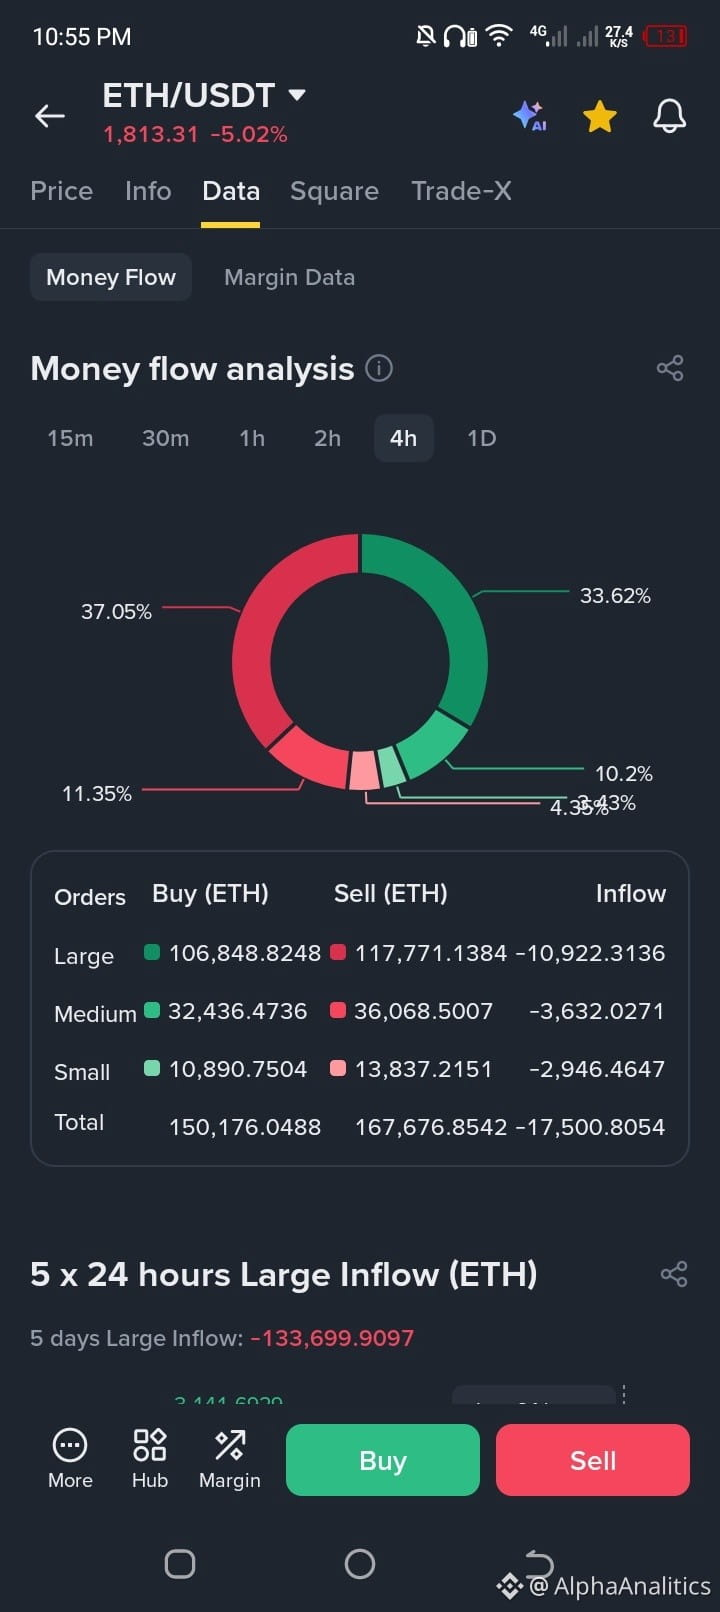
📉 Money Flow & Outflows: The 5-day large inflow shows a heavy negative balance of over -133,699 ETH, backed by massive net outflows in large orders over the last 24 hours. Panic selling is clearly active.
📊 Extreme Weekly RSI: On the 1-week chart, the RSI(6) has plunged to an ice-cold 19.26, entering deep oversold territory reminiscent of major macro bottoms.
⚖️ Margin & Sentiment: While margin long-short ratios have shifted, the sheer speed of the flush indicates a classic capitulation phase where weak hands are getting shaken out.
📍 Buy Zones & DCA Strategy:
Support & Re-accumulation Range: The lower Bollinger band and key historical structure point to a strong accumulation zone between $1,550 and $1,750, with absolute capitulation floors closer to the $1,385 major swing low if volatility expands.
Action Plan: Smart money doesn't catch falling knives all at once. Tiered scaling (DCA) within this lower band is where long-term players start building positions.
Are you accumulating ETH at these levels or waiting for further confirmation? Drop your strategy below! 👇
#Ethereum #ETH #CryptoTrading #BinanceSquare #TechnicalAnalysis #DCA
🚨 ETH UNDER PRESSURE: Massive Outflows and Extreme Oversold Levels — Are We Near the Bottom?
Ethereum ($ETH) is taking a heavy hit, trading down around $1,812 (-5.03%), reflecting a wave of intense market pressure. Looking under the hood at the latest Binance data and on-chain metrics reveals a fascinating story:
📉 Money Flow & Outflows: The 5-day large inflow shows a heavy negative balance of over -133,699 ETH, backed by massive net outflows in large orders over the last 24 hours. Panic selling is clearly active.
📊 Extreme Weekly RSI: On the 1-week chart, the RSI(6) has plunged to an ice-cold 19.26, entering deep oversold territory reminiscent of major macro bottoms.
⚖️ Margin & Sentiment: While margin long-short ratios have shifted, the sheer speed of the flush indicates a classic capitulation phase where weak hands are getting shaken out.
📍 Buy Zones & DCA Strategy:
Support & Re-accumulation Range: The lower Bollinger band and key historical structure point to a strong accumulation zone between $1,550 and $1,750, with absolute capitulation floors closer to the $1,385 major swing low if volatility expands.
Action Plan: Smart money doesn't catch falling knives all at once. Tiered scaling (DCA) within this lower band is where long-term players start building positions.
Are you accumulating ETH at these levels or waiting for further confirmation? Drop your strategy below! 👇
#Ethereum #ETH #CryptoTrading #BinanceSquare #TechnicalAnalysis #DCA
Ethereum ($ETH) is taking a heavy hit, trading down around $1,812 (-5.03%), reflecting a wave of intense market pressure. Looking under the hood at the latest Binance data and on-chain metrics reveals a fascinating story:
📉 Money Flow & Outflows: The 5-day large inflow shows a heavy negative balance of over -133,699 ETH, backed by massive net outflows in large orders over the last 24 hours. Panic selling is clearly active.
📊 Extreme Weekly RSI: On the 1-week chart, the RSI(6) has plunged to an ice-cold 19.26, entering deep oversold territory reminiscent of major macro bottoms.
⚖️ Margin & Sentiment: While margin long-short ratios have shifted, the sheer speed of the flush indicates a classic capitulation phase where weak hands are getting shaken out.
📍 Buy Zones & DCA Strategy:
Support & Re-accumulation Range: The lower Bollinger band and key historical structure point to a strong accumulation zone between $1,550 and $1,750, with absolute capitulation floors closer to the $1,385 major swing low if volatility expands.
Action Plan: Smart money doesn't catch falling knives all at once. Tiered scaling (DCA) within this lower band is where long-term players start building positions.
Are you accumulating ETH at these levels or waiting for further confirmation? Drop your strategy below! 👇
#Ethereum #ETH #CryptoTrading #BinanceSquare #TechnicalAnalysis #DCA

548
တစ်စိတ်တစ်ပိုင်း မှန်ကန်
🚨 အီလွန်မတ်စ်၏ အံ့အားသင့်ဖွယ် ဖွင့်ဟချက် — “NVIDIA ရဲ့ လျှို့ဝှက်သဘောတူညီချက်တွေက လက်ဆွဲနှုတ်ဆက်ရုံပဲ!” — AI coin တွေ ဈေးကျမလား၊ တဟုန်ထိုးတက်မလား?
ကမ္ဘာ့အကြီးဆုံး AI ချစ်ပ်ကုမ္ပဏီအတွင်း ပြဿနာကြီးတစ်ခု ဖြစ်ပွားလာတော့မယ့်ပုံပါပဲ။ CEO Jensen Huang ရာထူးမှ ရုတ်တရက်နုတ်ထွက်ပြီးနောက် ဈေးကွက်တစ်ခုလုံး အကြီးအကျယ် တုန်လှုပ်နေပါတယ်။
🚨 NVIDIA ဝန်ထမ်း 4,075 ဦးနဲ့ ရှယ်ယာရှင် 36,640 ဦး အပါအဝင် လူပေါင်း 67,000 ကျော်က Huang ကို ချက်ချင်းပြန်လည်ခန့်အပ်ပေးဖို့ NVIDIA ဘုတ်အဖွဲ့ထံ အရေးပေါ် အသနားခံစာတင်ခဲ့ကြပါတယ်!
AI ဂေဟစနစ်တစ်ခုလုံးကို စွမ်းအားပေးနေတဲ့ ကုမ္ပဏီနဲ့ပတ်သက်ပြီး ဘုတ်အဖွဲ့ရဲ့ ဆုံးဖြတ်ချက်တွေကို ပြင်းပြင်းထန်ထန် ဝေဖန်ဖို့ အီလွန်မတ်စ်က X မှာ ရေးသားခဲ့ပါတယ်။
📉 နည်းပညာပိုင်းဆိုင်ရာ အပ်ဒိတ်နှင့် ဝယ်ယူရန်ဇုန် (NVDA အပတ်စဉ်ဇယား):
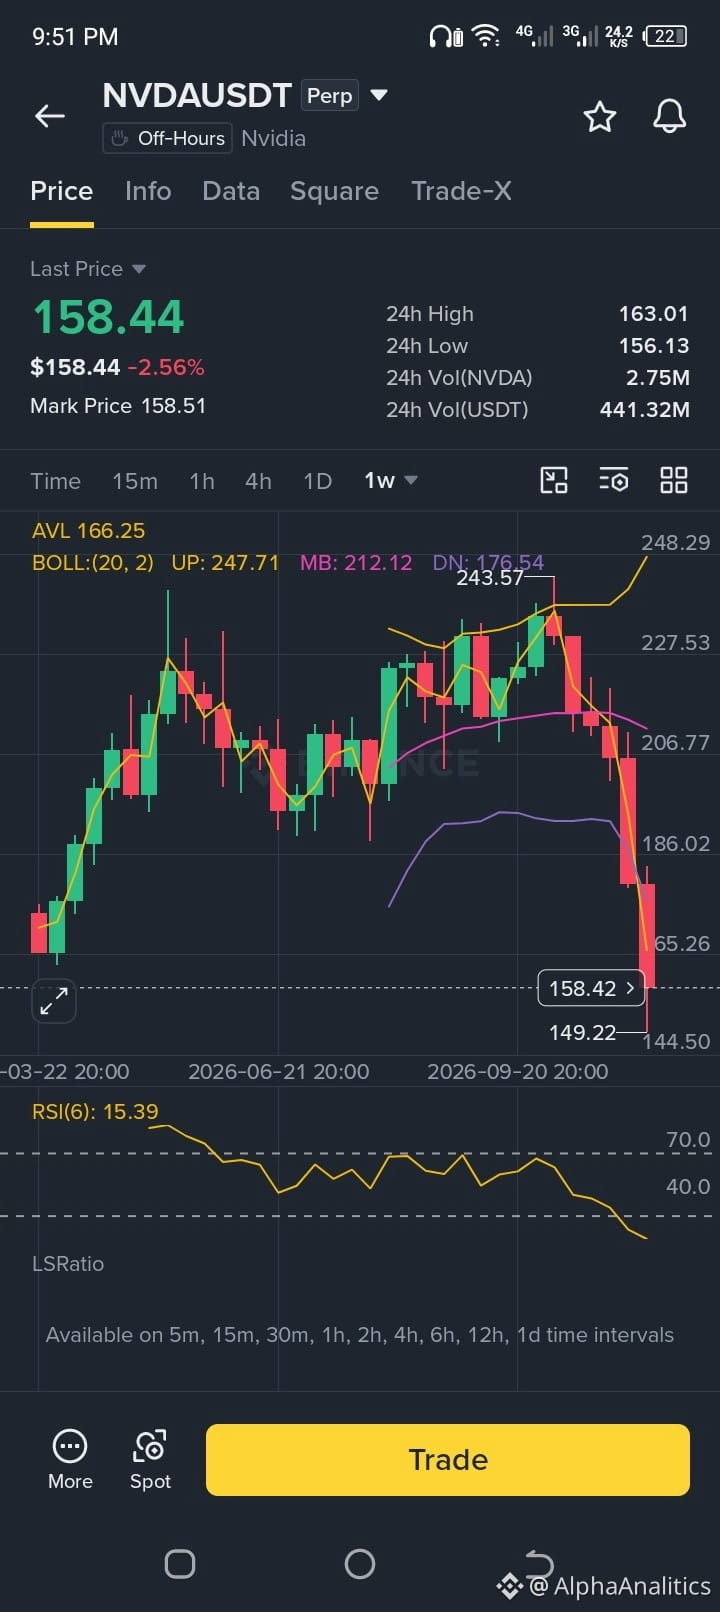
ကုမ္ပဏီတွင်း အငြင်းပွားမှုတွေ ဖြစ်ပွားနေချိန်မှာ အပတ်စဉ်ဇယားက အလွန်အမင်း အရှုံးလျှော့ရောင်းချမှု ဖြစ်နေကြောင်း ပြသနေပါတယ်။ RSI(6) က မကြုံစဖူး 15.33 အထိ ကျဆင်းပြီး အောက်ဘက် Bollinger Band ကိုလည်း သိသိသာသာ ချိုးဖောက်ကျော်လွန်သွားတာကြောင့် ဒီပိုင်ဆိုင်မှုဟာ အလွန်အမင်း ရောင်းလွန်နေပါတယ်။
အဆင့်လိုက် ဝယ်ယူရန်ဇုန် (DCA): ကျွမ်းကျင်တဲ့ ရင်းနှီးမြှုပ်နှံသူတွေဟာ ကျဆင်းနေတဲ့ဈေးကွက်ထဲကို တစ်ကြိမ်တည်း အကုန်ဝင်မဝယ်ကြပါဘူး။ ပြန်လည်စုဆောင်းဝယ်ယူဖို့ အကောင်းဆုံးဈေးနှုန်းအပိုင်းအခြားက $140.00 နဲ့ $155.00 ကြားဖြစ်ပြီး၊ နည်းပညာပိုင်းဆိုင်ရာ ခိုင်မာတဲ့ အောက်ခံဈေးတန်းကတော့ $145.00 – $150.00 ဝန်းကျင်မှာ ရှိပါတယ်။
DCA နည်းဗျူဟာနဲ့ AI ဈေးကျမှုကို အဆင့်လိုက် ဝယ်ယူနေသလား၊ ဒါမှမဟုတ် အတည်ပြုချက်ရဖို့ စောင့်နေသလား။ သင့်အစီအစဉ်တွေကို အောက်မှာ ပြောပြခဲ့ပါ! 👇
#JensenHuangနေရာကိုဘယ်သူဆက်ခံမလဲ #BinanceSquare #AI #CryptoTrading #NVIDIA #DCA
🚨 အီလွန်မတ်စ်၏ အံ့အားသင့်ဖွယ် ဖွင့်ဟချက် — “NVIDIA ရဲ့ လျှို့ဝှက်သဘောတူညီချက်တွေက လက်ဆွဲနှုတ်ဆက်ရုံပဲ!” — AI coin တွေ ဈေးကျမလား၊ တဟုန်ထိုးတက်မလား?
ကမ္ဘာ့အကြီးဆုံး AI ချစ်ပ်ကုမ္ပဏီအတွင်း ပြဿနာကြီးတစ်ခု ဖြစ်ပွားလာတော့မယ့်ပုံပါပဲ။ CEO Jensen Huang ရာထူးမှ ရုတ်တရက်နုတ်ထွက်ပြီးနောက် ဈေးကွက်တစ်ခုလုံး အကြီးအကျယ် တုန်လှုပ်နေပါတယ်။
🚨 NVIDIA ဝန်ထမ်း 4,075 ဦးနဲ့ ရှယ်ယာရှင် 36,640 ဦး အပါအဝင် လူပေါင်း 67,000 ကျော်က Huang ကို ချက်ချင်းပြန်လည်ခန့်အပ်ပေးဖို့ NVIDIA ဘုတ်အဖွဲ့ထံ အရေးပေါ် အသနားခံစာတင်ခဲ့ကြပါတယ်!
AI ဂေဟစနစ်တစ်ခုလုံးကို စွမ်းအားပေးနေတဲ့ ကုမ္ပဏီနဲ့ပတ်သက်ပြီး ဘုတ်အဖွဲ့ရဲ့ ဆုံးဖြတ်ချက်တွေကို ပြင်းပြင်းထန်ထန် ဝေဖန်ဖို့ အီလွန်မတ်စ်က X မှာ ရေးသားခဲ့ပါတယ်။
📉 နည်းပညာပိုင်းဆိုင်ရာ အပ်ဒိတ်နှင့် ဝယ်ယူရန်ဇုန် (NVDA အပတ်စဉ်ဇယား):
ကုမ္ပဏီတွင်း အငြင်းပွားမှုတွေ ဖြစ်ပွားနေချိန်မှာ အပတ်စဉ်ဇယားက အလွန်အမင်း အရှုံးလျှော့ရောင်းချမှု ဖြစ်နေကြောင်း ပြသနေပါတယ်။ RSI(6) က မကြုံစဖူး 15.33 အထိ ကျဆင်းပြီး အောက်ဘက် Bollinger Band ကိုလည်း သိသိသာသာ ချိုးဖောက်ကျော်လွန်သွားတာကြောင့် ဒီပိုင်ဆိုင်မှုဟာ အလွန်အမင်း ရောင်းလွန်နေပါတယ်။
အဆင့်လိုက် ဝယ်ယူရန်ဇုန် (DCA): ကျွမ်းကျင်တဲ့ ရင်းနှီးမြှုပ်နှံသူတွေဟာ ကျဆင်းနေတဲ့ဈေးကွက်ထဲကို တစ်ကြိမ်တည်း အကုန်ဝင်မဝယ်ကြပါဘူး။ ပြန်လည်စုဆောင်းဝယ်ယူဖို့ အကောင်းဆုံးဈေးနှုန်းအပိုင်းအခြားက $140.00 နဲ့ $155.00 ကြားဖြစ်ပြီး၊ နည်းပညာပိုင်းဆိုင်ရာ ခိုင်မာတဲ့ အောက်ခံဈေးတန်းကတော့ $145.00 – $150.00 ဝန်းကျင်မှာ ရှိပါတယ်။
DCA နည်းဗျူဟာနဲ့ AI ဈေးကျမှုကို အဆင့်လိုက် ဝယ်ယူနေသလား၊ ဒါမှမဟုတ် အတည်ပြုချက်ရဖို့ စောင့်နေသလား။ သင့်အစီအစဉ်တွေကို အောက်မှာ ပြောပြခဲ့ပါ! 👇
#JensenHuangနေရာကိုဘယ်သူဆက်ခံမလဲ #BinanceSquare #AI #CryptoTrading #NVIDIA #DCA
ကမ္ဘာ့အကြီးဆုံး AI ချစ်ပ်ကုမ္ပဏီအတွင်း ပြဿနာကြီးတစ်ခု ဖြစ်ပွားလာတော့မယ့်ပုံပါပဲ။ CEO Jensen Huang ရာထူးမှ ရုတ်တရက်နုတ်ထွက်ပြီးနောက် ဈေးကွက်တစ်ခုလုံး အကြီးအကျယ် တုန်လှုပ်နေပါတယ်။
🚨 NVIDIA ဝန်ထမ်း 4,075 ဦးနဲ့ ရှယ်ယာရှင် 36,640 ဦး အပါအဝင် လူပေါင်း 67,000 ကျော်က Huang ကို ချက်ချင်းပြန်လည်ခန့်အပ်ပေးဖို့ NVIDIA ဘုတ်အဖွဲ့ထံ အရေးပေါ် အသနားခံစာတင်ခဲ့ကြပါတယ်!
AI ဂေဟစနစ်တစ်ခုလုံးကို စွမ်းအားပေးနေတဲ့ ကုမ္ပဏီနဲ့ပတ်သက်ပြီး ဘုတ်အဖွဲ့ရဲ့ ဆုံးဖြတ်ချက်တွေကို ပြင်းပြင်းထန်ထန် ဝေဖန်ဖို့ အီလွန်မတ်စ်က X မှာ ရေးသားခဲ့ပါတယ်။
📉 နည်းပညာပိုင်းဆိုင်ရာ အပ်ဒိတ်နှင့် ဝယ်ယူရန်ဇုန် (NVDA အပတ်စဉ်ဇယား):
ကုမ္ပဏီတွင်း အငြင်းပွားမှုတွေ ဖြစ်ပွားနေချိန်မှာ အပတ်စဉ်ဇယားက အလွန်အမင်း အရှုံးလျှော့ရောင်းချမှု ဖြစ်နေကြောင်း ပြသနေပါတယ်။ RSI(6) က မကြုံစဖူး 15.33 အထိ ကျဆင်းပြီး အောက်ဘက် Bollinger Band ကိုလည်း သိသိသာသာ ချိုးဖောက်ကျော်လွန်သွားတာကြောင့် ဒီပိုင်ဆိုင်မှုဟာ အလွန်အမင်း ရောင်းလွန်နေပါတယ်။
အဆင့်လိုက် ဝယ်ယူရန်ဇုန် (DCA): ကျွမ်းကျင်တဲ့ ရင်းနှီးမြှုပ်နှံသူတွေဟာ ကျဆင်းနေတဲ့ဈေးကွက်ထဲကို တစ်ကြိမ်တည်း အကုန်ဝင်မဝယ်ကြပါဘူး။ ပြန်လည်စုဆောင်းဝယ်ယူဖို့ အကောင်းဆုံးဈေးနှုန်းအပိုင်းအခြားက $140.00 နဲ့ $155.00 ကြားဖြစ်ပြီး၊ နည်းပညာပိုင်းဆိုင်ရာ ခိုင်မာတဲ့ အောက်ခံဈေးတန်းကတော့ $145.00 – $150.00 ဝန်းကျင်မှာ ရှိပါတယ်။
DCA နည်းဗျူဟာနဲ့ AI ဈေးကျမှုကို အဆင့်လိုက် ဝယ်ယူနေသလား၊ ဒါမှမဟုတ် အတည်ပြုချက်ရဖို့ စောင့်နေသလား။ သင့်အစီအစဉ်တွေကို အောက်မှာ ပြောပြခဲ့ပါ! 👇
#JensenHuangနေရာကိုဘယ်သူဆက်ခံမလဲ #BinanceSquare #AI #CryptoTrading #NVIDIA #DCA

3
1.9k
ဘာသာပြန်ဆိုချက် ကြည့်မည်
🚨 Are they crazy, or do they see something we don't? Look at this...
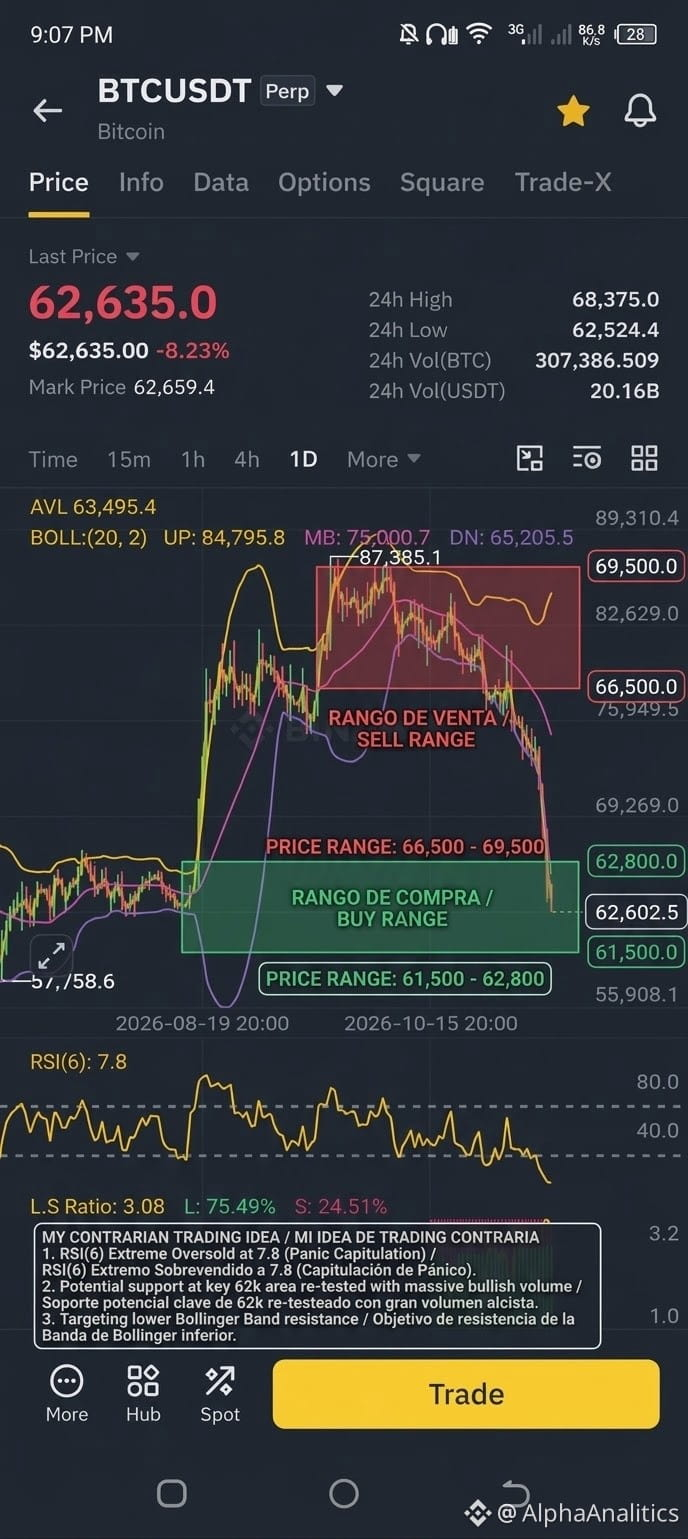
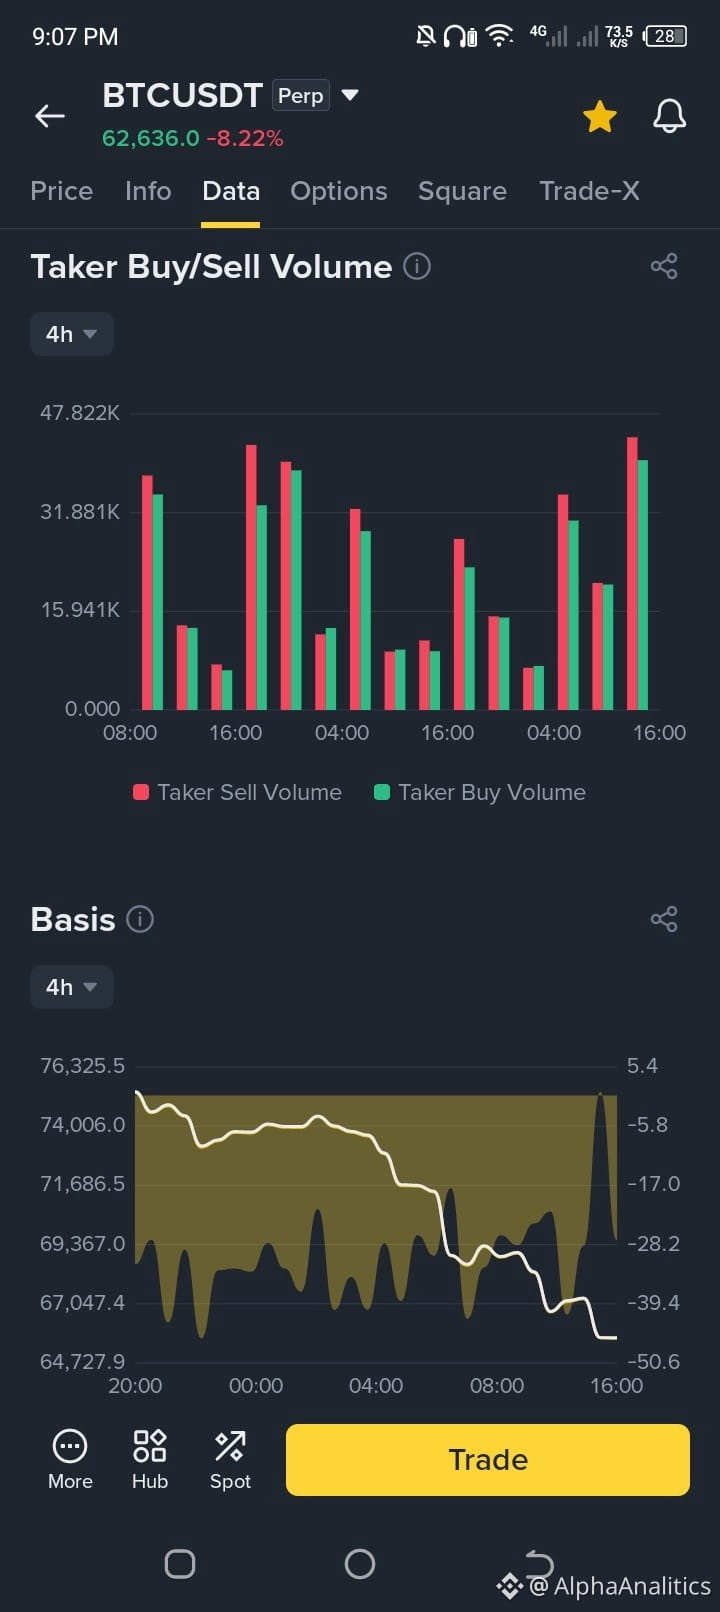
With Bitcoin suffering a brutal crash down to $62,600 (-8.2%) and an RSI hitting a historic total panic of ~7.8, the market is bleeding.
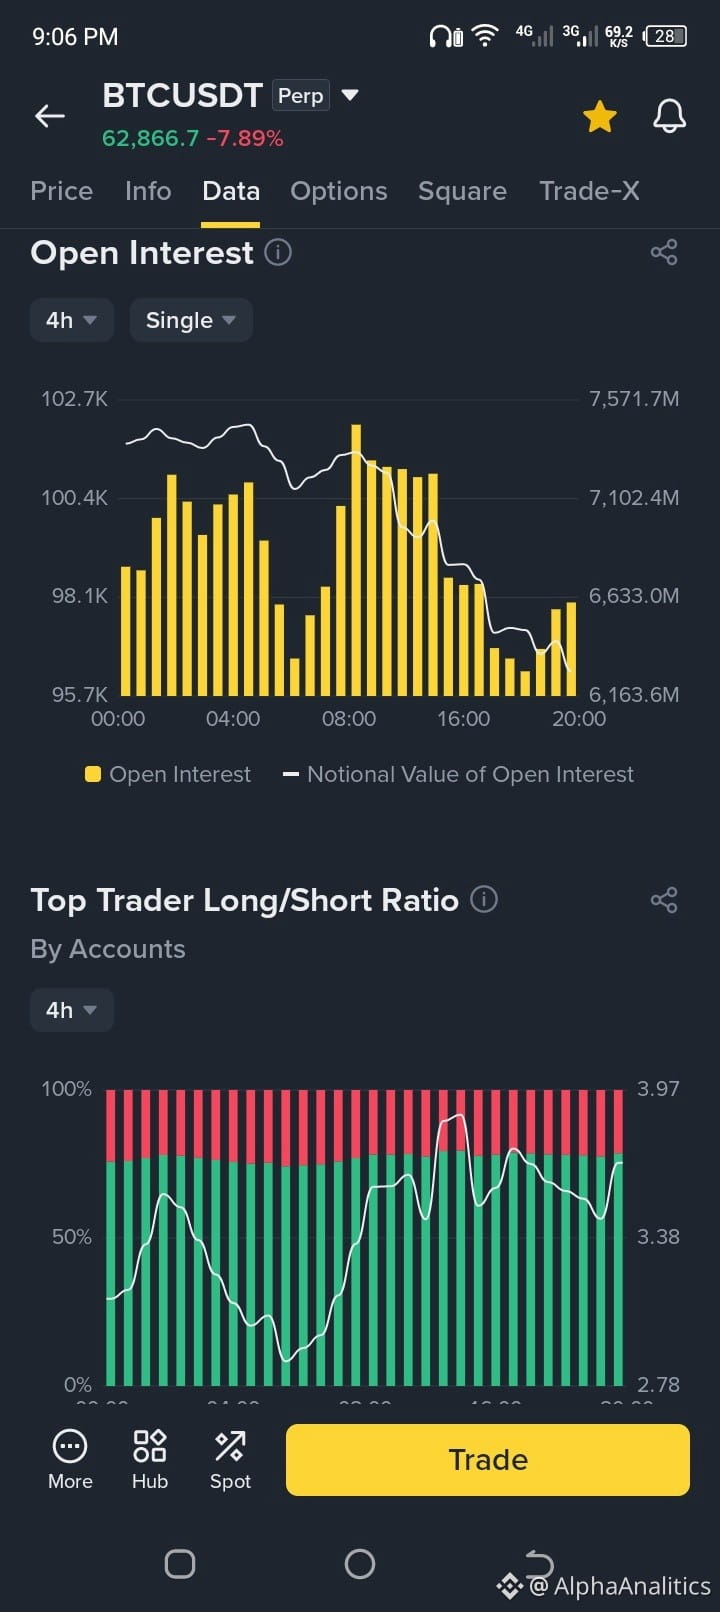
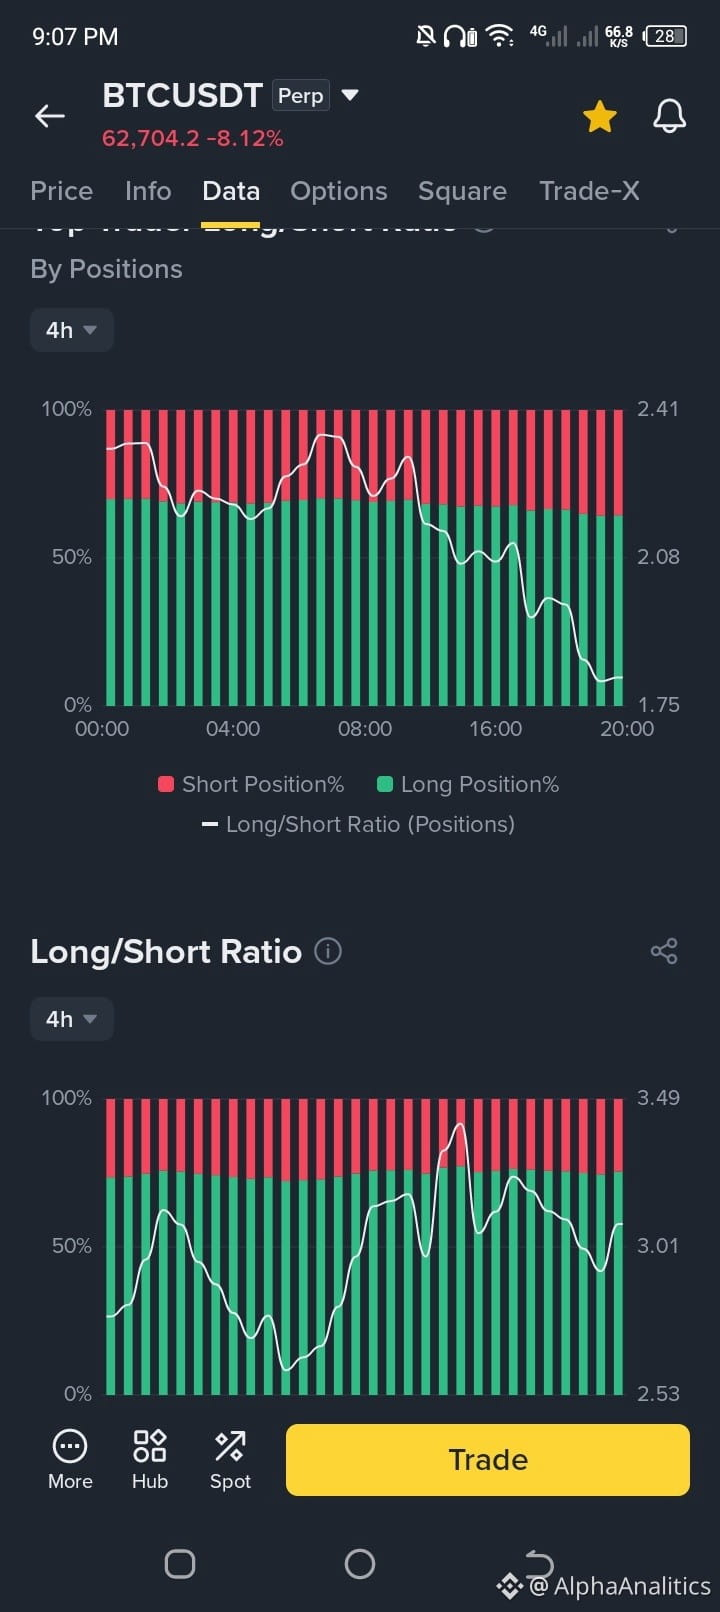
The craziest part about current Binance data: 75% of top trading accounts are still piled into LONGS!
There are two types of traders right now:
The Risk-Takers: Those getting their accounts rekt trying to catch a falling knife with zero safety net.
The Patient Ones: Those waiting with surgical patience for the massacre to stop.
What are you doing right now? Are you DCAing (buying the dip) or sitting on the sidelines with USDT in hand? 👇 Let me know in the comments!
#Bitcoin #BinanceSquare #CryptoTrading #TechnicalAnalysis #MarketCrash
🚨 Are they crazy, or do they see something we don't? Look at this...
With Bitcoin suffering a brutal crash down to $62,600 (-8.2%) and an RSI hitting a historic total panic of ~7.8, the market is bleeding.
The craziest part about current Binance data: 75% of top trading accounts are still piled into LONGS!
There are two types of traders right now:
The Risk-Takers: Those getting their accounts rekt trying to catch a falling knife with zero safety net.
The Patient Ones: Those waiting with surgical patience for the massacre to stop.
What are you doing right now? Are you DCAing (buying the dip) or sitting on the sidelines with USDT in hand? 👇 Let me know in the comments!
#Bitcoin #BinanceSquare #CryptoTrading #TechnicalAnalysis #MarketCrash
With Bitcoin suffering a brutal crash down to $62,600 (-8.2%) and an RSI hitting a historic total panic of ~7.8, the market is bleeding.
The craziest part about current Binance data: 75% of top trading accounts are still piled into LONGS!
There are two types of traders right now:
The Risk-Takers: Those getting their accounts rekt trying to catch a falling knife with zero safety net.
The Patient Ones: Those waiting with surgical patience for the massacre to stop.
What are you doing right now? Are you DCAing (buying the dip) or sitting on the sidelines with USDT in hand? 👇 Let me know in the comments!
#Bitcoin #BinanceSquare #CryptoTrading #TechnicalAnalysis #MarketCrash
3
1
447
ဘာသာပြန်ဆိုချက် ကြည့်မည်
📉 ¿Por qué cayó el mercado cripto esta semana?
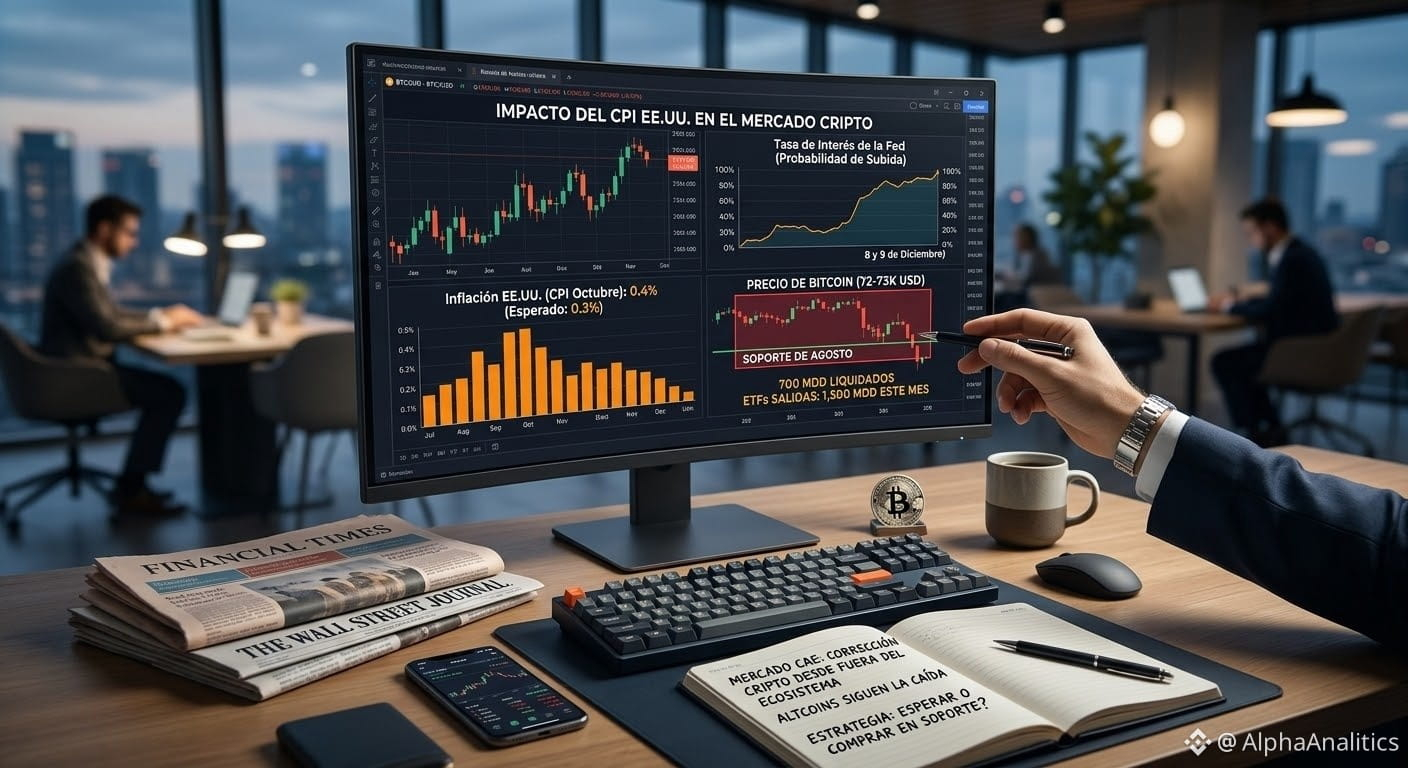
Si has revisado tus gráficos, habrás notado que el mercado ha tenido correcciones importantes: Bitcoin retrocedió a la zona de los $72,000–$73,000 (mínimos desde agosto) y Ethereum opera cerca de los $2,050, arrastrando a las principales altcoins. Además, se han liquidado unos 700 millones de dólares en posiciones apalancadas y los ETFs de Bitcoin suman salidas notables este mes.
¿El culpable? Viene de fuera del universo cripto:
El Índice de Precios al Consumidor (CPI) de EE. UU. salió por encima de lo esperado (0.4% en octubre frente al 0.3% previsto).
¿Qué significa esto? Una inflación más alta se traduce en tasas de interés altas por más tiempo, y las tasas altas suelen drenar liquidez de los activos de riesgo como las criptomonedas. El mercado ya descuenta una alta probabilidad de movimientos duros por parte de la Fed.
¿Cómo estás gestionando tu cartera en esta zona? ¿Ves oportunidad de compra o prefieres esperar? ¡Te leo en los comentarios! 👇
#Binance #Bitcoin #AnalisisDeMercado #crypto
📉 ¿Por qué cayó el mercado cripto esta semana?
Si has revisado tus gráficos, habrás notado que el mercado ha tenido correcciones importantes: Bitcoin retrocedió a la zona de los $72,000–$73,000 (mínimos desde agosto) y Ethereum opera cerca de los $2,050, arrastrando a las principales altcoins. Además, se han liquidado unos 700 millones de dólares en posiciones apalancadas y los ETFs de Bitcoin suman salidas notables este mes.
¿El culpable? Viene de fuera del universo cripto:
El Índice de Precios al Consumidor (CPI) de EE. UU. salió por encima de lo esperado (0.4% en octubre frente al 0.3% previsto).
¿Qué significa esto? Una inflación más alta se traduce en tasas de interés altas por más tiempo, y las tasas altas suelen drenar liquidez de los activos de riesgo como las criptomonedas. El mercado ya descuenta una alta probabilidad de movimientos duros por parte de la Fed.
¿Cómo estás gestionando tu cartera en esta zona? ¿Ves oportunidad de compra o prefieres esperar? ¡Te leo en los comentarios! 👇
#Binance #Bitcoin #AnalisisDeMercado #crypto
Si has revisado tus gráficos, habrás notado que el mercado ha tenido correcciones importantes: Bitcoin retrocedió a la zona de los $72,000–$73,000 (mínimos desde agosto) y Ethereum opera cerca de los $2,050, arrastrando a las principales altcoins. Además, se han liquidado unos 700 millones de dólares en posiciones apalancadas y los ETFs de Bitcoin suman salidas notables este mes.
¿El culpable? Viene de fuera del universo cripto:
El Índice de Precios al Consumidor (CPI) de EE. UU. salió por encima de lo esperado (0.4% en octubre frente al 0.3% previsto).
¿Qué significa esto? Una inflación más alta se traduce en tasas de interés altas por más tiempo, y las tasas altas suelen drenar liquidez de los activos de riesgo como las criptomonedas. El mercado ya descuenta una alta probabilidad de movimientos duros por parte de la Fed.
¿Cómo estás gestionando tu cartera en esta zona? ¿Ves oportunidad de compra o prefieres esperar? ¡Te leo en los comentarios! 👇
#Binance #Bitcoin #AnalisisDeMercado #crypto
1
360
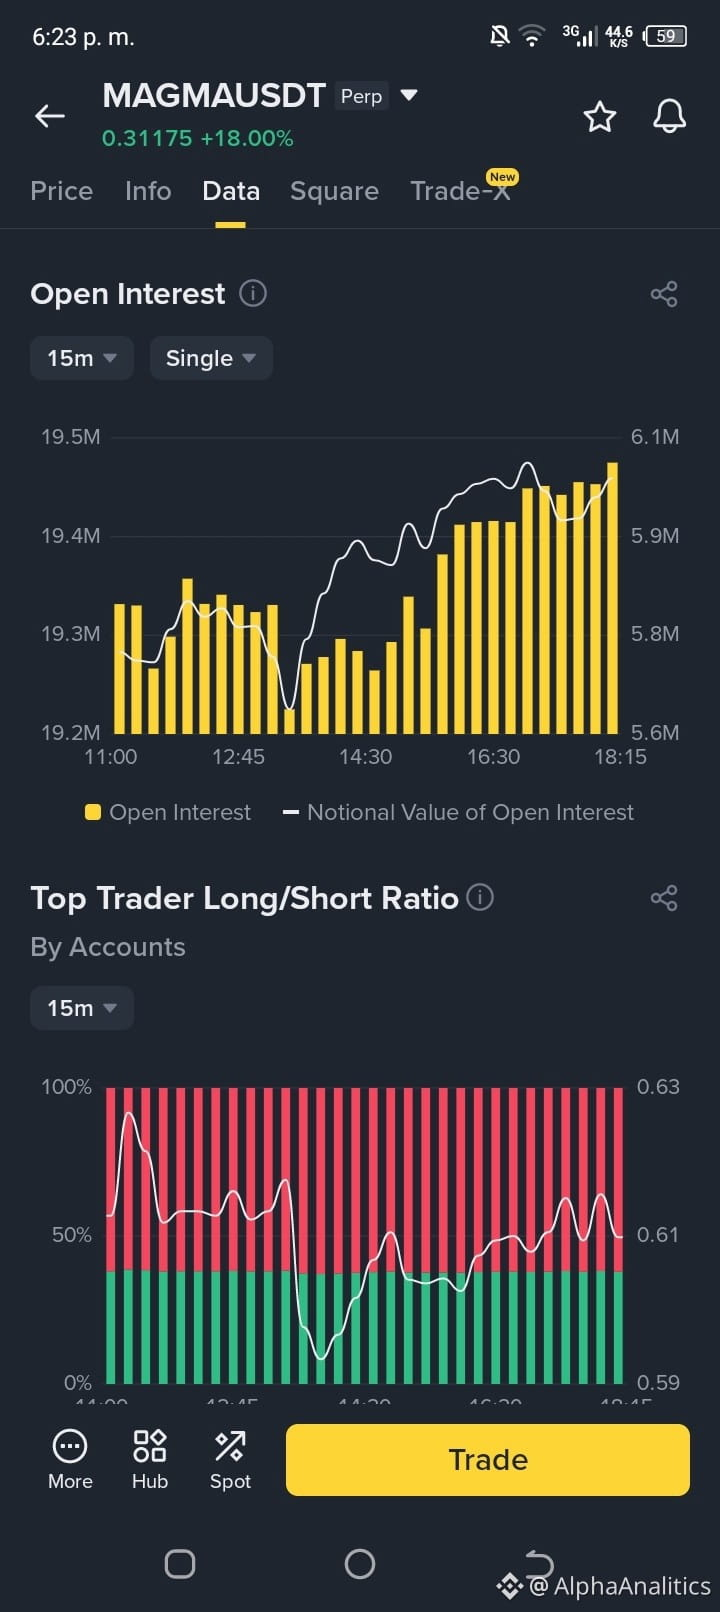
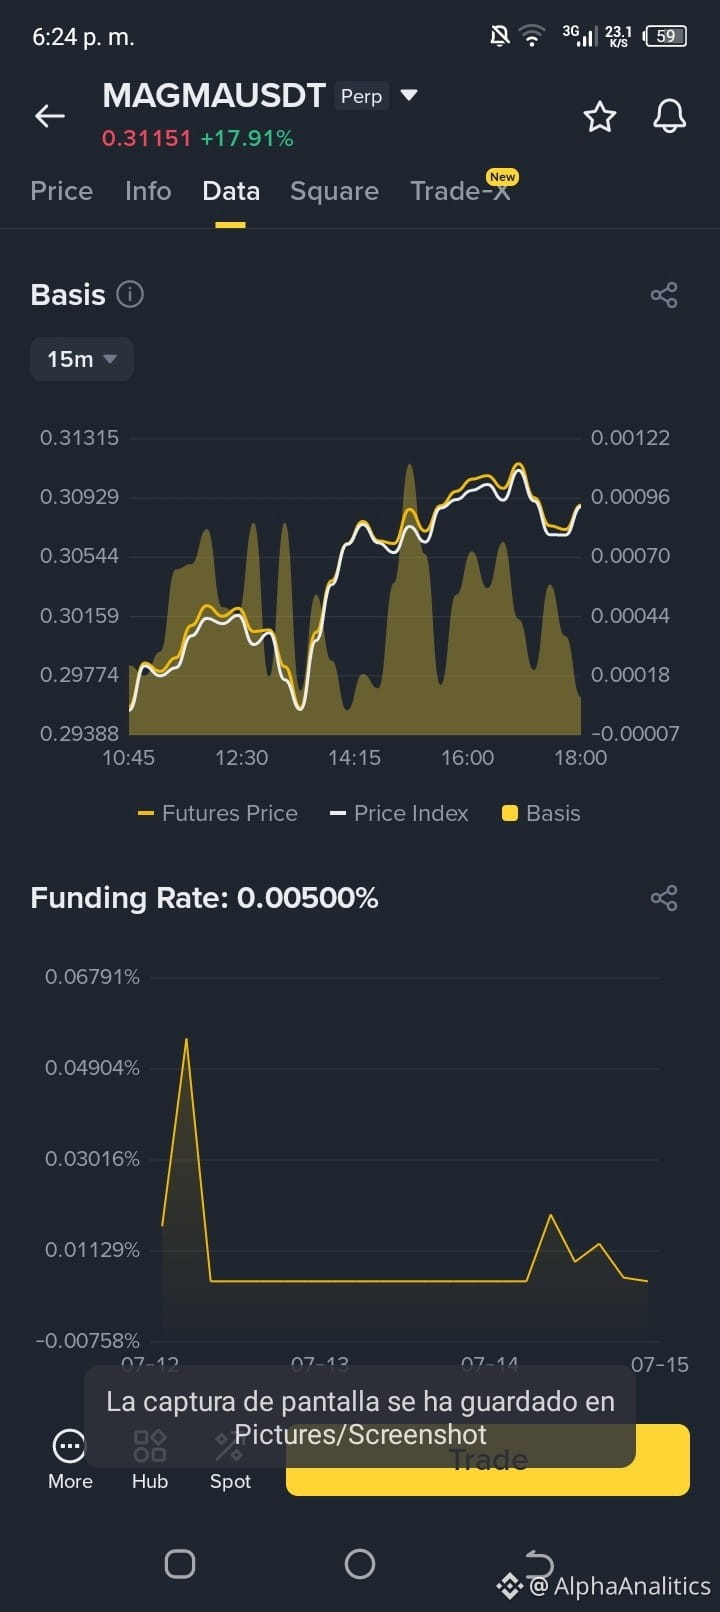
🚀 MAGMAUSDT Análisis: Scalp İçin Bir Fırsat mı?
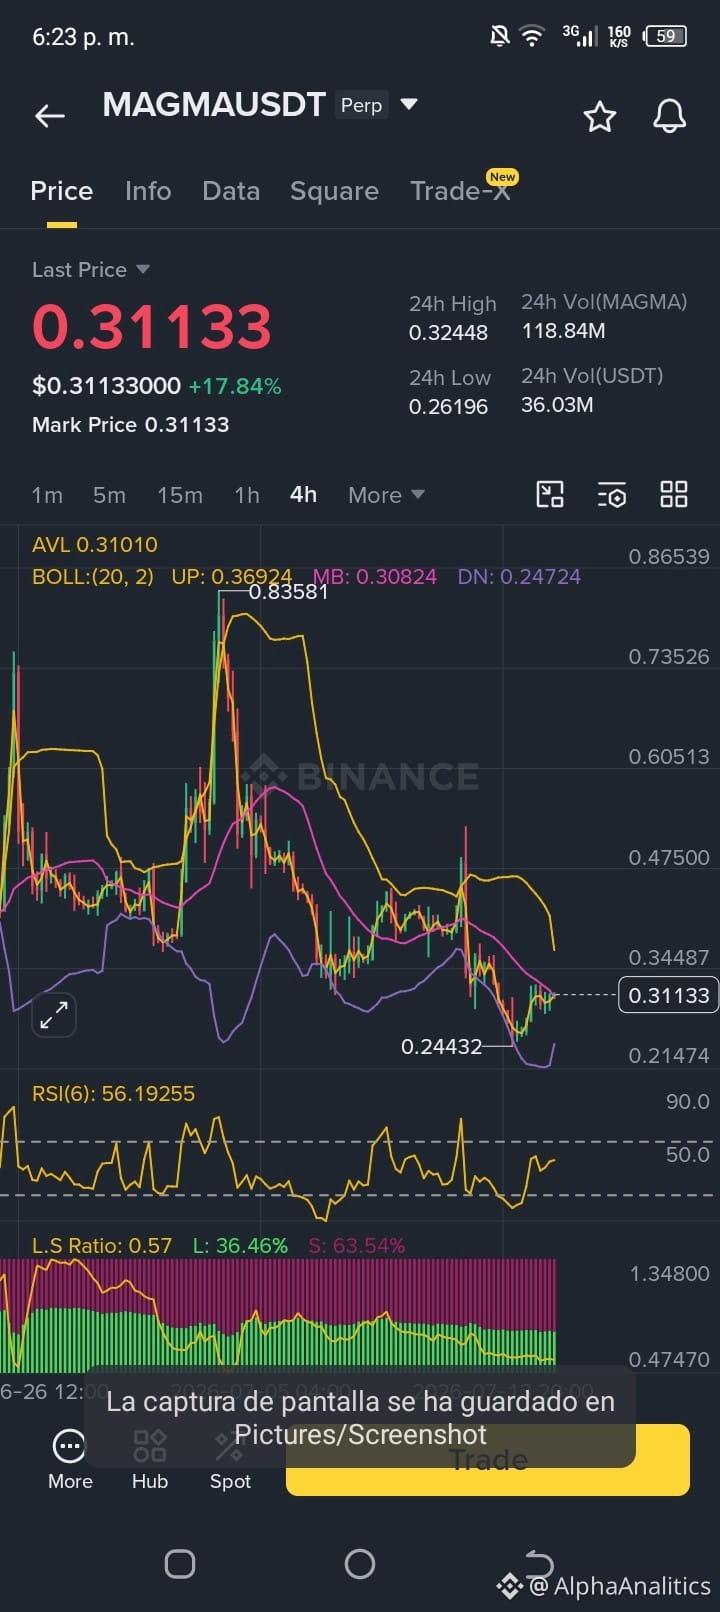
+18% yükseliş hareketinden sonra, $MAGMA USDT piyasası 5 ve 15 dakikalık zaman dilimlerinde oldukça ilgi çekici bir yapı gösteriyor.
📊 Veriler Ne Diyor?
Artan Açık Pozisyon (Open Interest): Piyasaya taze sermaye girişi devam ediyor; bu da mevcut ivmenin gücünü destekliyor.
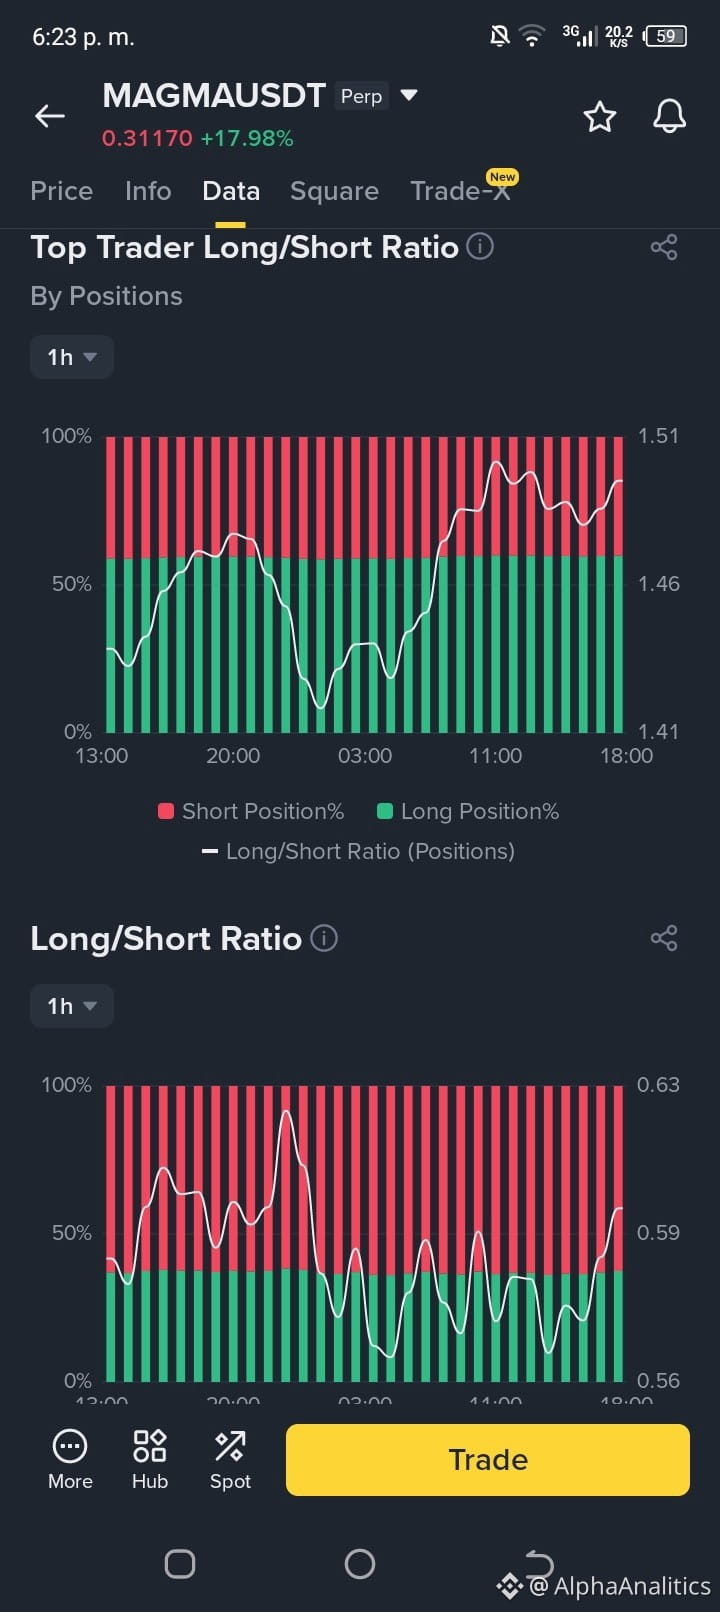
Piyasa Duyarlılığı: Net bir uyumsuzluk var; fiyat yükselirken çoğu perakende trader (L/S Oranı ~0.60) hâlâ short’a oynuyor. Olası bir short squeeze’e dikkat!
Göstergeler: Fiyat, Bollinger Bantları’nın ortalamasına yakın bir konsolidasyon içinde; alım hacmi baskıyı sürdürürse devam etmek için alan var.
🎯 Önerilen Strateji (AFK Operasyon):
Ekrana yapışmadan volatiliteden faydalanmak isteyenler için:
Giriş Bölgesi: 0.30950 - 0.31000 (Ortalama/mean üzerinden destek arayarak).
Stop Loss (SL): 0.30600 (Alt bantın altına teknik koruma).
Take Profit (TP): 0.31600 (Daha önceki dirence, ardından zirvelere doğru bakarak).
⚠️ Önemli Hatırlatma:
Risk yönetimi kritik. Bu bir AFK işlemi olduğundan, ani volatilite nedeniyle likidasyon yaşamamak için Ayrı Marjin (Margen Aislado) ve orta düzey bir kaldıraç kullanmayı unutma. Piyasa fazla kaldıraç kullananları affetmez! 📉💰
Yasal Uyarı (Disclaimer): Bu, eğitim amaçlı teknik bir analizdir; finansal tavsiye değildir. Her zaman kendi analizini yap.
#MAGMA #MAGMAUSDT #CryptoTrading #Scalping #TradingSignals #CryptoAnalysis #BinanceFutures #TradingTips #ShortSqueeze
🚀 MAGMAUSDT Análisis: Scalp İçin Bir Fırsat mı?
+18% yükseliş hareketinden sonra, $MAGMA USDT piyasası 5 ve 15 dakikalık zaman dilimlerinde oldukça ilgi çekici bir yapı gösteriyor.
📊 Veriler Ne Diyor?
Artan Açık Pozisyon (Open Interest): Piyasaya taze sermaye girişi devam ediyor; bu da mevcut ivmenin gücünü destekliyor.
Piyasa Duyarlılığı: Net bir uyumsuzluk var; fiyat yükselirken çoğu perakende trader (L/S Oranı ~0.60) hâlâ short’a oynuyor. Olası bir short squeeze’e dikkat!
Göstergeler: Fiyat, Bollinger Bantları’nın ortalamasına yakın bir konsolidasyon içinde; alım hacmi baskıyı sürdürürse devam etmek için alan var.
🎯 Önerilen Strateji (AFK Operasyon):
Ekrana yapışmadan volatiliteden faydalanmak isteyenler için:
Giriş Bölgesi: 0.30950 - 0.31000 (Ortalama/mean üzerinden destek arayarak).
Stop Loss (SL): 0.30600 (Alt bantın altına teknik koruma).
Take Profit (TP): 0.31600 (Daha önceki dirence, ardından zirvelere doğru bakarak).
⚠️ Önemli Hatırlatma:
Risk yönetimi kritik. Bu bir AFK işlemi olduğundan, ani volatilite nedeniyle likidasyon yaşamamak için Ayrı Marjin (Margen Aislado) ve orta düzey bir kaldıraç kullanmayı unutma. Piyasa fazla kaldıraç kullananları affetmez! 📉💰
Yasal Uyarı (Disclaimer): Bu, eğitim amaçlı teknik bir analizdir; finansal tavsiye değildir. Her zaman kendi analizini yap.
#MAGMA #MAGMAUSDT #CryptoTrading #Scalping #TradingSignals #CryptoAnalysis #BinanceFutures #TradingTips #ShortSqueeze
+18% yükseliş hareketinden sonra, $MAGMA USDT piyasası 5 ve 15 dakikalık zaman dilimlerinde oldukça ilgi çekici bir yapı gösteriyor.
📊 Veriler Ne Diyor?
Artan Açık Pozisyon (Open Interest): Piyasaya taze sermaye girişi devam ediyor; bu da mevcut ivmenin gücünü destekliyor.
Piyasa Duyarlılığı: Net bir uyumsuzluk var; fiyat yükselirken çoğu perakende trader (L/S Oranı ~0.60) hâlâ short’a oynuyor. Olası bir short squeeze’e dikkat!
Göstergeler: Fiyat, Bollinger Bantları’nın ortalamasına yakın bir konsolidasyon içinde; alım hacmi baskıyı sürdürürse devam etmek için alan var.
🎯 Önerilen Strateji (AFK Operasyon):
Ekrana yapışmadan volatiliteden faydalanmak isteyenler için:
Giriş Bölgesi: 0.30950 - 0.31000 (Ortalama/mean üzerinden destek arayarak).
Stop Loss (SL): 0.30600 (Alt bantın altına teknik koruma).
Take Profit (TP): 0.31600 (Daha önceki dirence, ardından zirvelere doğru bakarak).
⚠️ Önemli Hatırlatma:
Risk yönetimi kritik. Bu bir AFK işlemi olduğundan, ani volatilite nedeniyle likidasyon yaşamamak için Ayrı Marjin (Margen Aislado) ve orta düzey bir kaldıraç kullanmayı unutma. Piyasa fazla kaldıraç kullananları affetmez! 📉💰
Yasal Uyarı (Disclaimer): Bu, eğitim amaçlı teknik bir analizdir; finansal tavsiye değildir. Her zaman kendi analizini yap.
#MAGMA #MAGMAUSDT #CryptoTrading #Scalping #TradingSignals #CryptoAnalysis #BinanceFutures #TradingTips #ShortSqueeze
156
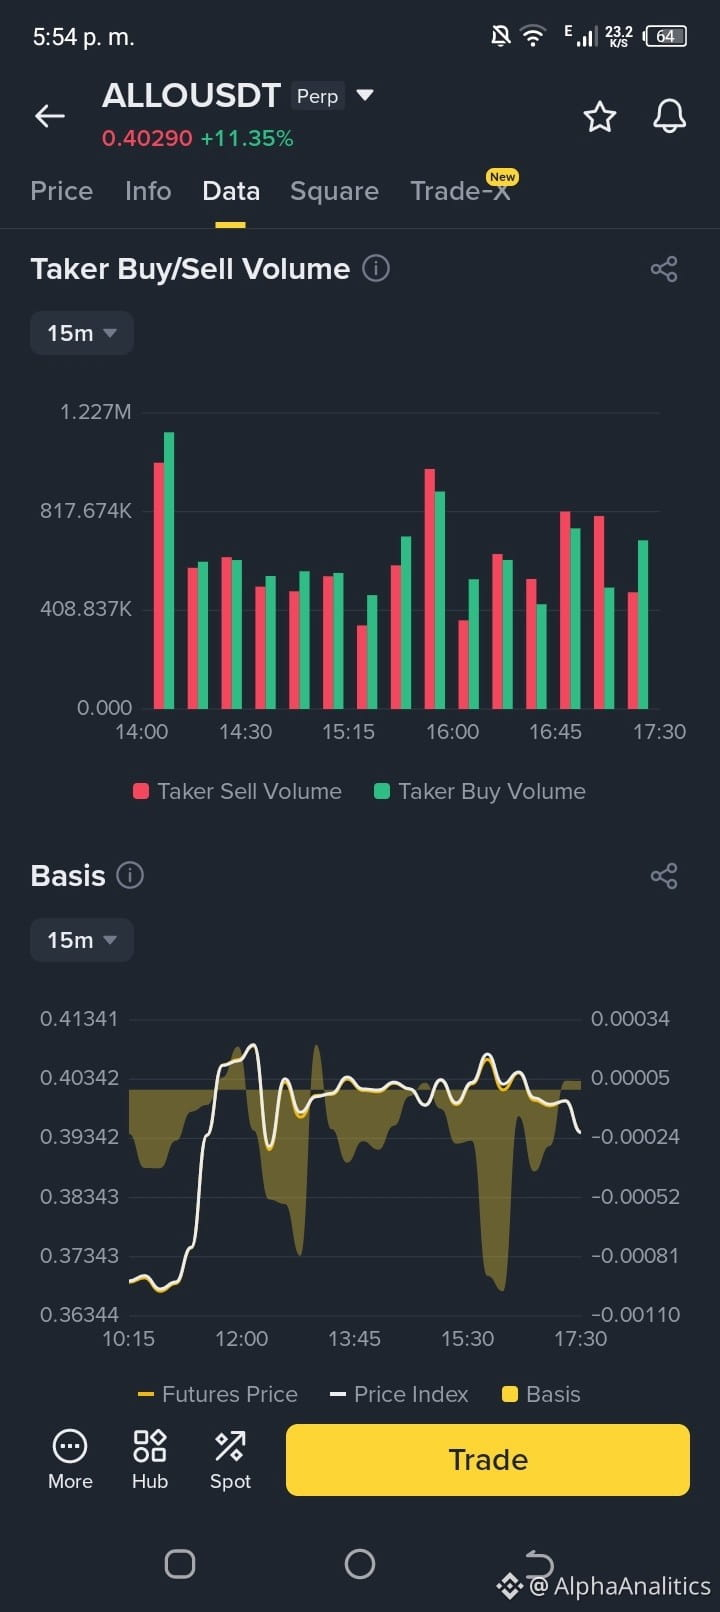
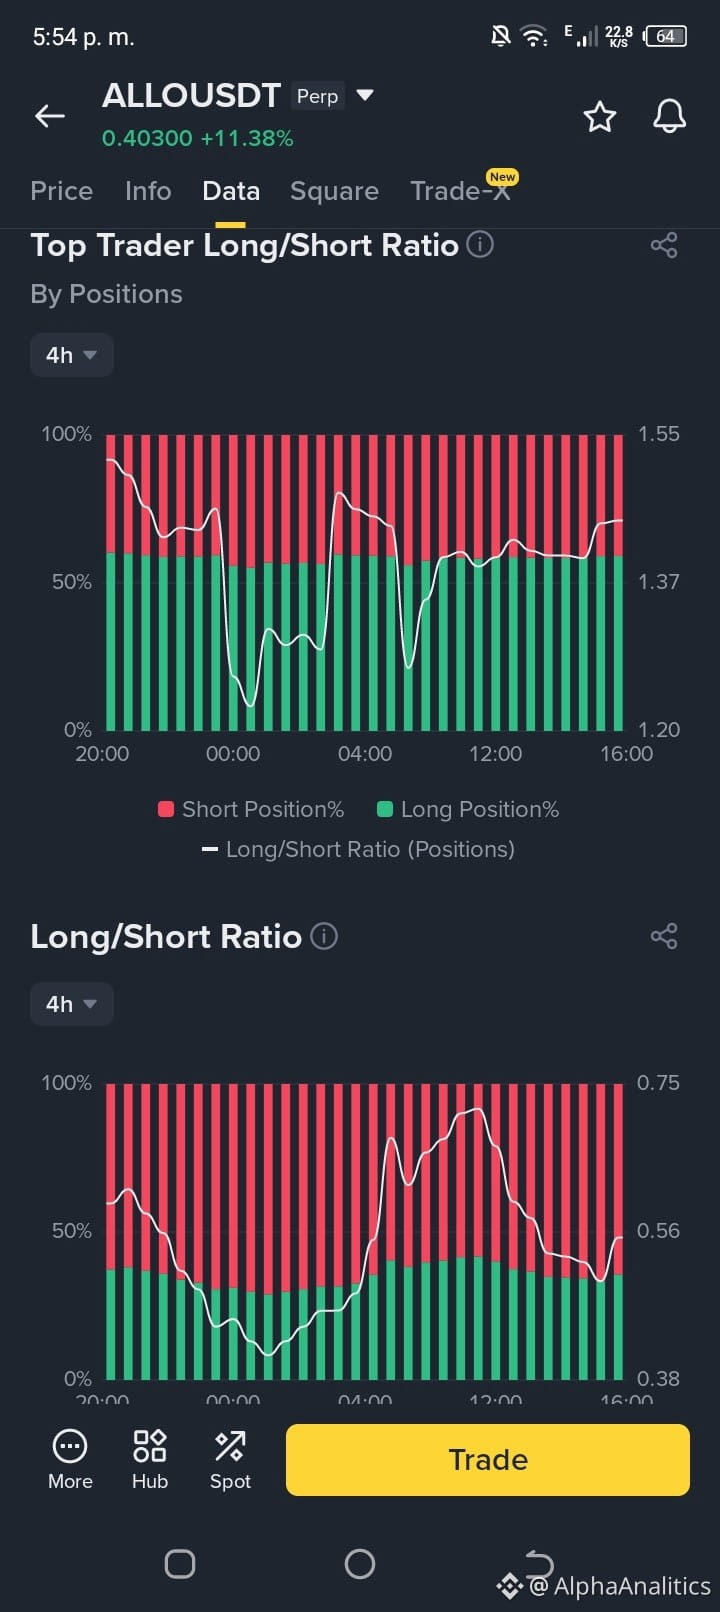
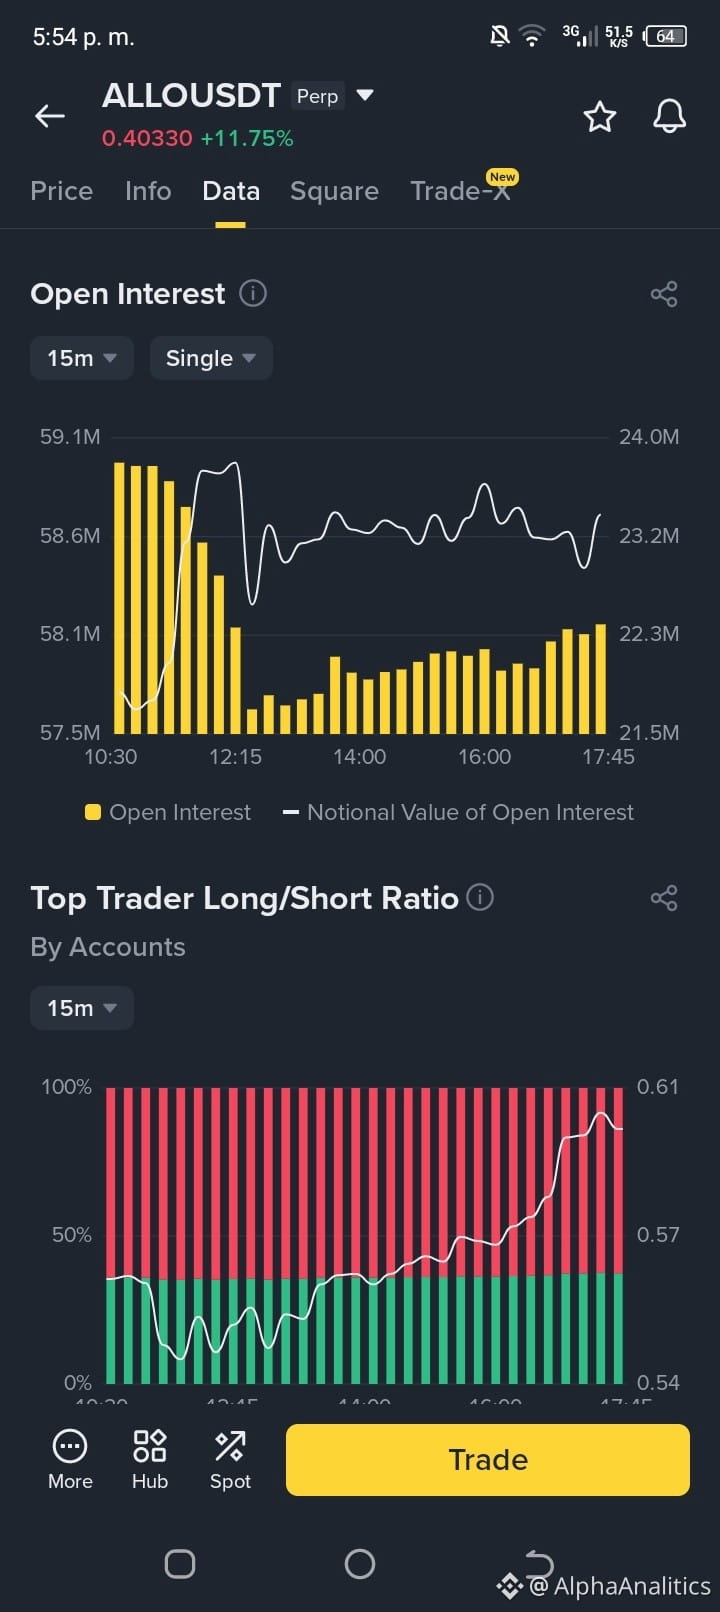
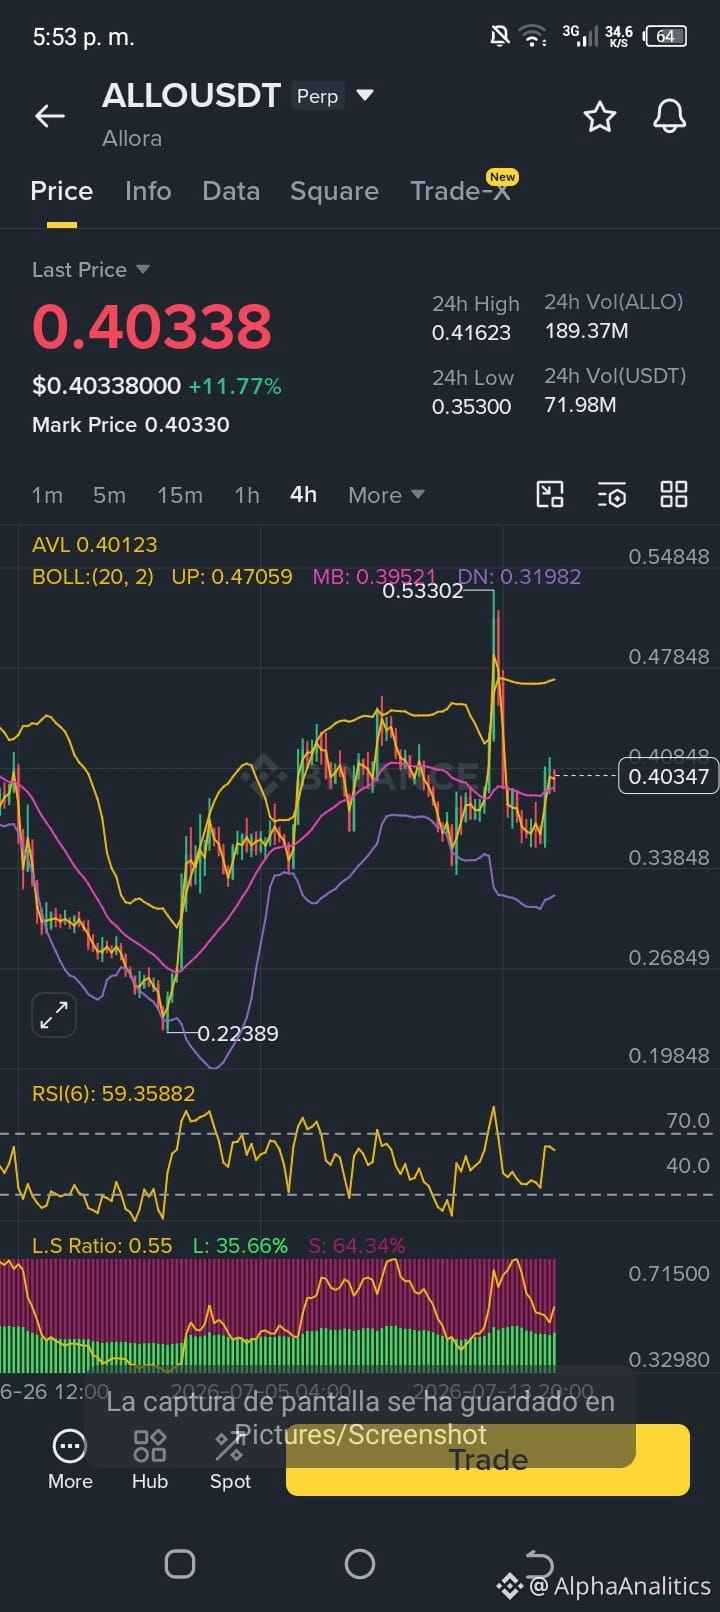
Analiz giriş: Niye biz $ALLO/USDT ile operatörlük yapıyoruz 🚀
Piyasa, nereye bakacağımızı bilirsek bize net sinyaller veriyor. Bugün $ALLO üzerinde bir pozisyon açmaya karar verdim ve bu kararın arkasındaki teknik temeli sizlere şöyle açıklıyorum:
📊 Ne görüyoruz?
İvme ve Konsolidasyon: Güçlü bir hareketin ardından, varlık Bollinger ortalamasının üzerinde sağlıklı bir konsolidasyon fazına girdi. Bu da yükseliş trendinin devam etmek için güce sahip olduğunu gösteriyor.
Hacim Girişi (OI): Açık Faiz (OI) tarafında bir artış tespit ettik; bu da yükseliş yapısını desteklemek için piyasaya yeni paranın girdiğini doğruluyor.
Short Squeeze Potansiyeli: Long/Short Oranı şu anda kısa pozisyonların baskın olduğunu gösteriyor (saticilar %63). Bu bize stratejik bir avantaj sağlıyor: fiyat yukarı kırarsa, bu satıcılar pozisyonlarını kapatmaya zorlanacak ve piyasaya daha fazla alım baskısı enjekte edecektir.
Sağlıklı RSI: RSI, aşırı alım (overbought) bölgesinde olmadan alıcı ivmeyi gösteren seviyelerde kalıyor; bu da kâr aramak için operasyonel alan bırakıyor.
🎯 Planımız:
Giriş: 0.4060 seviyesindeki direncin üstünde kırılımın teyidini bekliyoruz; Long için.
Risk Yönetimi: Tezi başarısız kılacak bir durum olursa geçersiz saymak için Stop Loss'u 0.3920'ye ayarlıyoruz.
Hedef (TP): 0.4162’deki son zirveyi tekrar hedef alıyoruz.
Hatırlatma: Trading’de sabır, aceleden daha çok kazandırır. Risk yönetimi, uzun vadede oyunda kalmamızı sağlayan şeydir.
Siz ne düşünüyorsunuz? Satıcılar bu seviyede tutunur mu yoksa o squeeze’i mi göreceğiz? Yorumlarda okuyorum 👇
#AnalizTecnicoCrypto #TradingDeFuturos #AlloraProtocol #EstructuraDeMercado #SmartMoneyConcept #GestionDeRiesgo #DayTradingPro #CryptoSetup #AnalisisDeDatos
Analiz giriş: Niye biz $ALLO /USDT ile operatörlük yapıyoruz 🚀
Piyasa, nereye bakacağımızı bilirsek bize net sinyaller veriyor. Bugün $ALLO üzerinde bir pozisyon açmaya karar verdim ve bu kararın arkasındaki teknik temeli sizlere şöyle açıklıyorum:
📊 Ne görüyoruz?
İvme ve Konsolidasyon: Güçlü bir hareketin ardından, varlık Bollinger ortalamasının üzerinde sağlıklı bir konsolidasyon fazına girdi. Bu da yükseliş trendinin devam etmek için güce sahip olduğunu gösteriyor.
Hacim Girişi (OI): Açık Faiz (OI) tarafında bir artış tespit ettik; bu da yükseliş yapısını desteklemek için piyasaya yeni paranın girdiğini doğruluyor.
Short Squeeze Potansiyeli: Long/Short Oranı şu anda kısa pozisyonların baskın olduğunu gösteriyor (saticilar %63). Bu bize stratejik bir avantaj sağlıyor: fiyat yukarı kırarsa, bu satıcılar pozisyonlarını kapatmaya zorlanacak ve piyasaya daha fazla alım baskısı enjekte edecektir.
Sağlıklı RSI: RSI, aşırı alım (overbought) bölgesinde olmadan alıcı ivmeyi gösteren seviyelerde kalıyor; bu da kâr aramak için operasyonel alan bırakıyor.
🎯 Planımız:
Giriş: 0.4060 seviyesindeki direncin üstünde kırılımın teyidini bekliyoruz; Long için.
Risk Yönetimi: Tezi başarısız kılacak bir durum olursa geçersiz saymak için Stop Loss'u 0.3920'ye ayarlıyoruz.
Hedef (TP): 0.4162’deki son zirveyi tekrar hedef alıyoruz.
Hatırlatma: Trading’de sabır, aceleden daha çok kazandırır. Risk yönetimi, uzun vadede oyunda kalmamızı sağlayan şeydir.
Siz ne düşünüyorsunuz? Satıcılar bu seviyede tutunur mu yoksa o squeeze’i mi göreceğiz? Yorumlarda okuyorum 👇
#AnalizTecnicoCrypto #TradingDeFuturos #AlloraProtocol #EstructuraDeMercado #SmartMoneyConcept #GestionDeRiesgo #DayTradingPro #CryptoSetup #AnalisisDeDatos
Piyasa, nereye bakacağımızı bilirsek bize net sinyaller veriyor. Bugün $ALLO üzerinde bir pozisyon açmaya karar verdim ve bu kararın arkasındaki teknik temeli sizlere şöyle açıklıyorum:
📊 Ne görüyoruz?
İvme ve Konsolidasyon: Güçlü bir hareketin ardından, varlık Bollinger ortalamasının üzerinde sağlıklı bir konsolidasyon fazına girdi. Bu da yükseliş trendinin devam etmek için güce sahip olduğunu gösteriyor.
Hacim Girişi (OI): Açık Faiz (OI) tarafında bir artış tespit ettik; bu da yükseliş yapısını desteklemek için piyasaya yeni paranın girdiğini doğruluyor.
Short Squeeze Potansiyeli: Long/Short Oranı şu anda kısa pozisyonların baskın olduğunu gösteriyor (saticilar %63). Bu bize stratejik bir avantaj sağlıyor: fiyat yukarı kırarsa, bu satıcılar pozisyonlarını kapatmaya zorlanacak ve piyasaya daha fazla alım baskısı enjekte edecektir.
Sağlıklı RSI: RSI, aşırı alım (overbought) bölgesinde olmadan alıcı ivmeyi gösteren seviyelerde kalıyor; bu da kâr aramak için operasyonel alan bırakıyor.
🎯 Planımız:
Giriş: 0.4060 seviyesindeki direncin üstünde kırılımın teyidini bekliyoruz; Long için.
Risk Yönetimi: Tezi başarısız kılacak bir durum olursa geçersiz saymak için Stop Loss'u 0.3920'ye ayarlıyoruz.
Hedef (TP): 0.4162’deki son zirveyi tekrar hedef alıyoruz.
Hatırlatma: Trading’de sabır, aceleden daha çok kazandırır. Risk yönetimi, uzun vadede oyunda kalmamızı sağlayan şeydir.
Siz ne düşünüyorsunuz? Satıcılar bu seviyede tutunur mu yoksa o squeeze’i mi göreceğiz? Yorumlarda okuyorum 👇
#AnalizTecnicoCrypto #TradingDeFuturos #AlloraProtocol #EstructuraDeMercado #SmartMoneyConcept #GestionDeRiesgo #DayTradingPro #CryptoSetup #AnalisisDeDatos
225
🚀 Rezultados del día: Kapitálizing movimientos con precisión
Ayer fue una jornada sumamente productiva en el mercado de futuros. La disciplina operativa y el análisis técnico de alta precisión nos permitieron capturar movimientos significativos en activos clave.
Aquí los resultados destacados de la sesión:
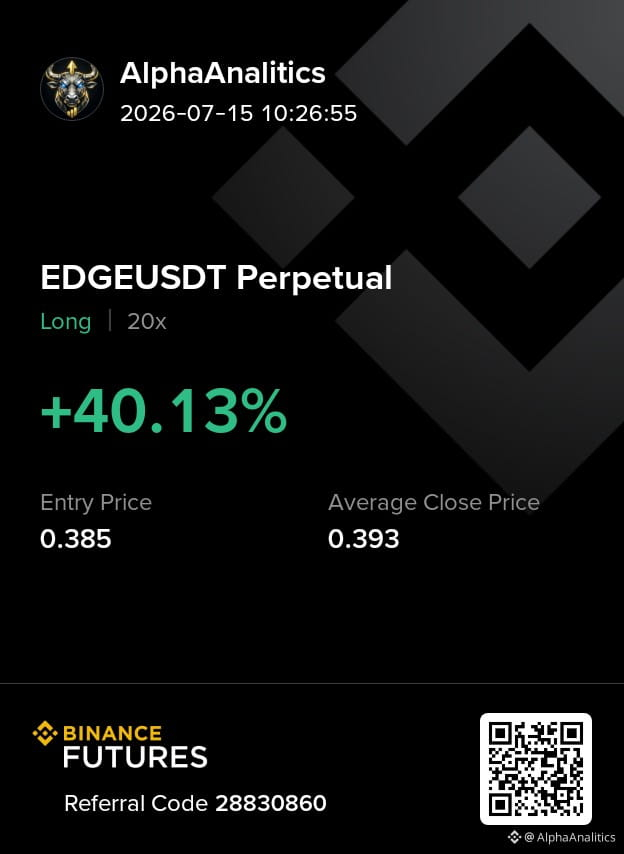
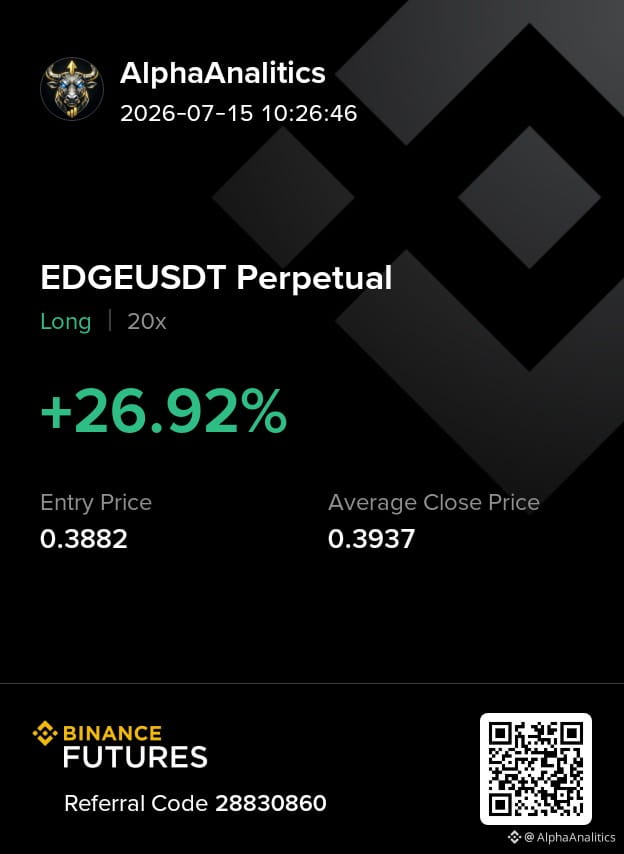
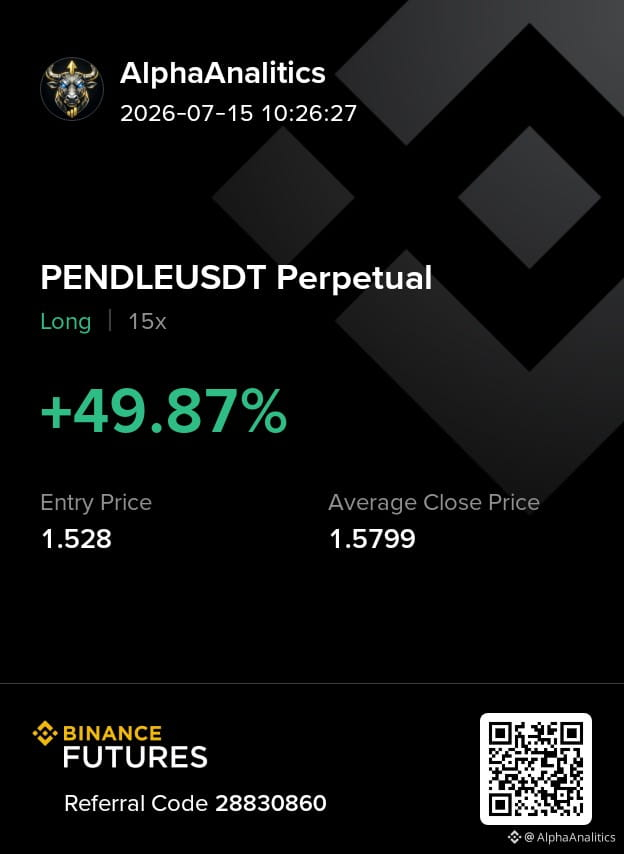
$PENDLE /USDT (Long 15x): Rentabilidad del +49.87%.
$EDGE /USDT (Long 20x): Operación 1 con un +26.92% de beneficio.
EDGE/USDT (Long 20x): Operación 2 con un +40.13% de beneficio.
La clave no es solo entrar, sino saber ejecutar en las zonas de valor. Seguimos trabajando bajo nuestra estrategia de gestión de riesgo, buscando siempre la consistencia por encima de la suerte.
¿Cómo te fue a ti en el mercado ayer? ¿Lograste capturar alguno de estos movimientos? ¡Los leo en los comentarios! 👇
#TradingReal #BinanceFutures #CryptoProfit #EstrategiaTrading #AnalisisTecnico #CryptoSuccess
🚀 Rezultados del día: Kapitálizing movimientos con precisión
Ayer fue una jornada sumamente productiva en el mercado de futuros. La disciplina operativa y el análisis técnico de alta precisión nos permitieron capturar movimientos significativos en activos clave.
Aquí los resultados destacados de la sesión:
$PENDLE /USDT (Long 15x): Rentabilidad del +49.87%.
$EDGE /USDT (Long 20x): Operación 1 con un +26.92% de beneficio.
EDGE/USDT (Long 20x): Operación 2 con un +40.13% de beneficio.
La clave no es solo entrar, sino saber ejecutar en las zonas de valor. Seguimos trabajando bajo nuestra estrategia de gestión de riesgo, buscando siempre la consistencia por encima de la suerte.
¿Cómo te fue a ti en el mercado ayer? ¿Lograste capturar alguno de estos movimientos? ¡Los leo en los comentarios! 👇
#TradingReal #BinanceFutures #CryptoProfit #EstrategiaTrading #AnalisisTecnico #CryptoSuccess
Ayer fue una jornada sumamente productiva en el mercado de futuros. La disciplina operativa y el análisis técnico de alta precisión nos permitieron capturar movimientos significativos en activos clave.
Aquí los resultados destacados de la sesión:
$PENDLE /USDT (Long 15x): Rentabilidad del +49.87%.
$EDGE /USDT (Long 20x): Operación 1 con un +26.92% de beneficio.
EDGE/USDT (Long 20x): Operación 2 con un +40.13% de beneficio.
La clave no es solo entrar, sino saber ejecutar en las zonas de valor. Seguimos trabajando bajo nuestra estrategia de gestión de riesgo, buscando siempre la consistencia por encima de la suerte.
¿Cómo te fue a ti en el mercado ayer? ¿Lograste capturar alguno de estos movimientos? ¡Los leo en los comentarios! 👇
#TradingReal #BinanceFutures #CryptoProfit #EstrategiaTrading #AnalisisTecnico #CryptoSuccess
213
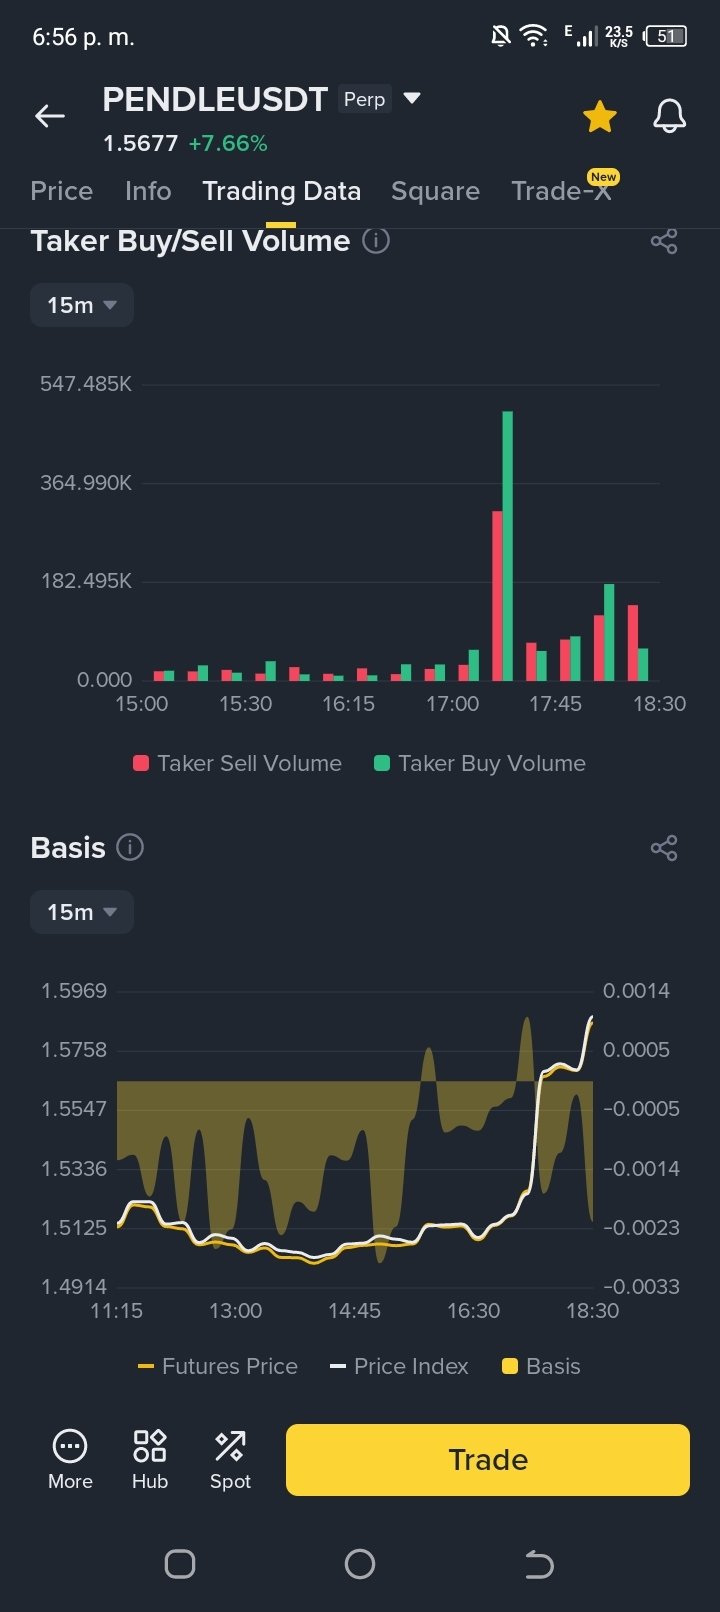
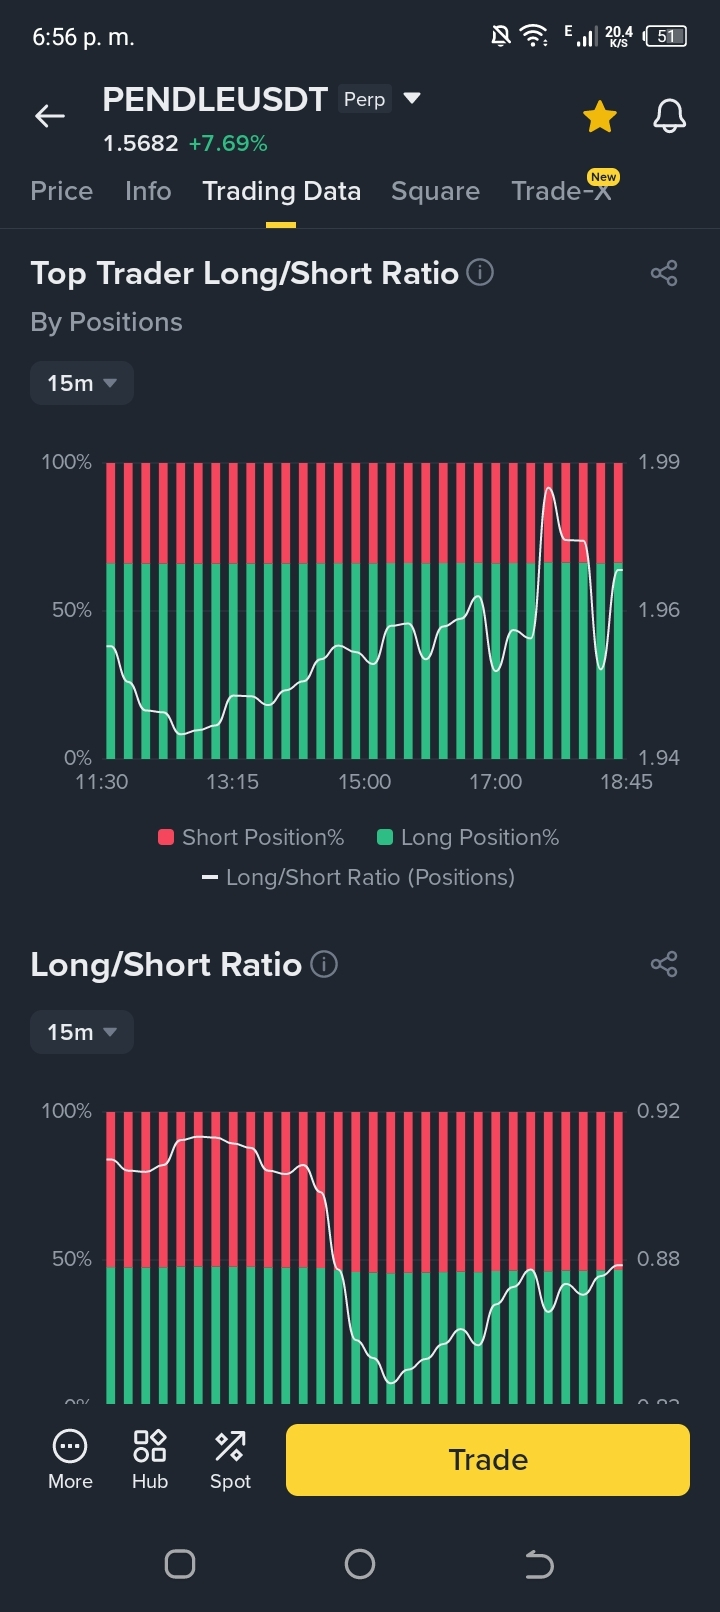
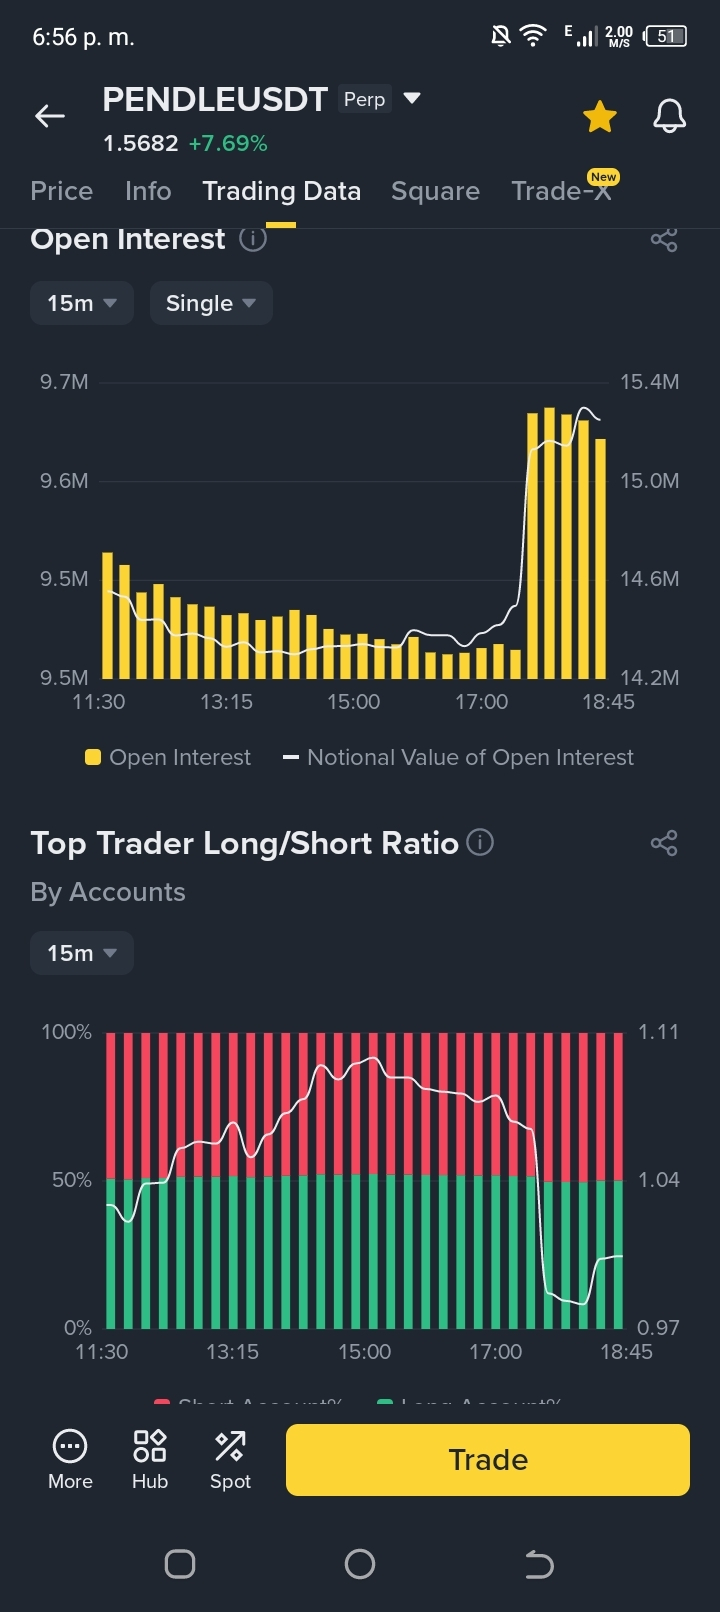
📊 Strategic Analysis: $PENDLE /USDT
Status: Monitoring entry opportunity. Patience is our greatest operational advantage.
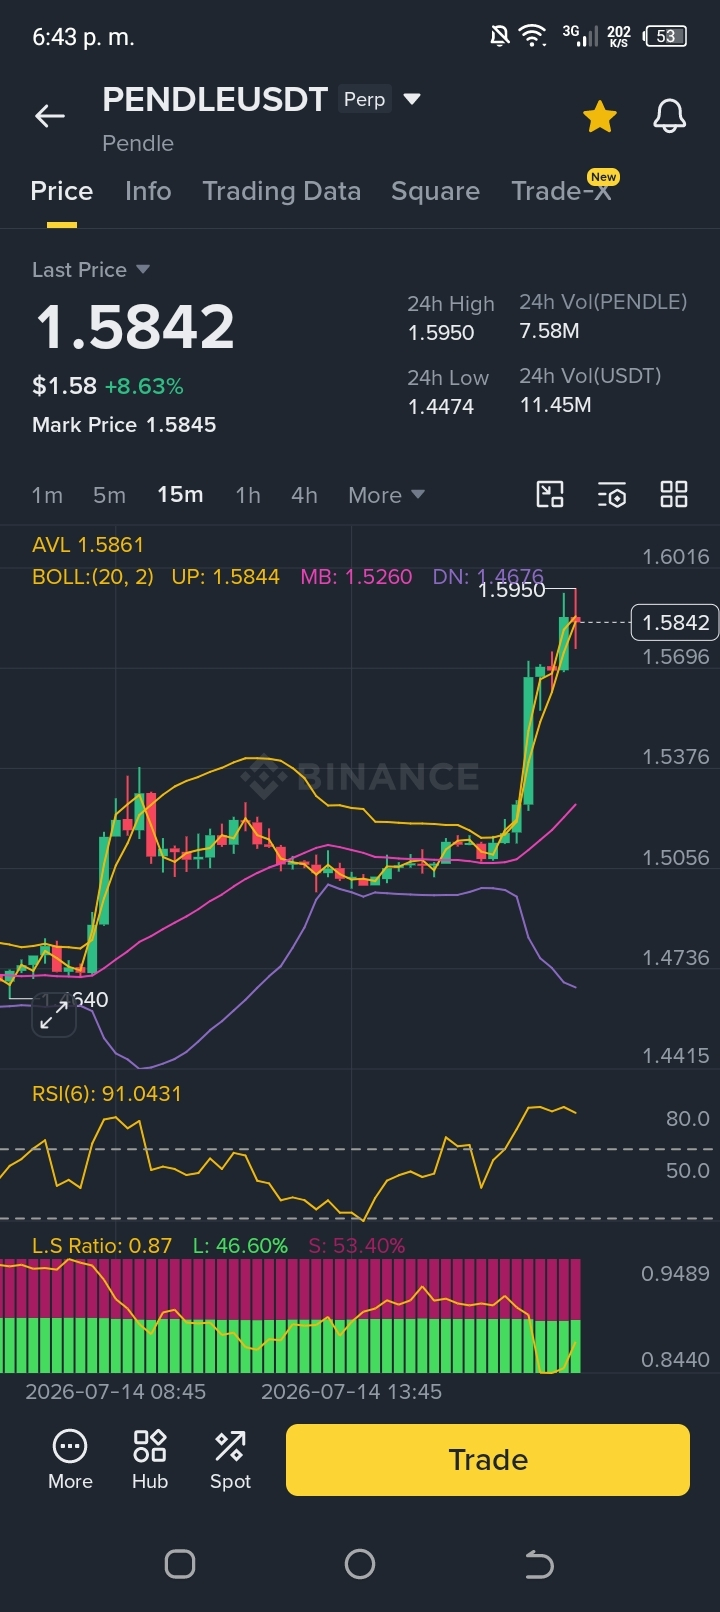
Market Outlook: After a marked bullish impulse, the asset is in a zone of significant overbought conditions (RSI at extreme levels), suggesting a high probability of a technical correction in the short term.
Trading Strategy: Instead of entering in the euphoria of the current move, we seek a high-precision entry after the correction.
Entry Zone (Buy Limit): Range 1.5280 - 1.5320. We want the asset to test key support levels (Bollinger band midline) before resuming the trend.
Risk Management:
Stop Loss: 1.4950. Critical level to invalidate the bullish thesis and protect capital against any structural change.
Take Profit: 1.5800 (First target) and 1.6200 (Secondary target).
Note: Trading with discipline means waiting for the market to reach our defined levels. We do not chase moves; we wait for setups that offer a favorable risk/reward ratio.
#Trading #Crypto #Pendle #DeFi #Investments #CryptoAnalysis #TechnicalAnalysis #SmartTrading #BinanceFutures
📊 Strategic Analysis: $PENDLE /USDT
Status: Monitoring entry opportunity. Patience is our greatest operational advantage.
Market Outlook: After a marked bullish impulse, the asset is in a zone of significant overbought conditions (RSI at extreme levels), suggesting a high probability of a technical correction in the short term.
Trading Strategy: Instead of entering in the euphoria of the current move, we seek a high-precision entry after the correction.
Entry Zone (Buy Limit): Range 1.5280 - 1.5320. We want the asset to test key support levels (Bollinger band midline) before resuming the trend.
Risk Management:
Stop Loss: 1.4950. Critical level to invalidate the bullish thesis and protect capital against any structural change.
Take Profit: 1.5800 (First target) and 1.6200 (Secondary target).
Note: Trading with discipline means waiting for the market to reach our defined levels. We do not chase moves; we wait for setups that offer a favorable risk/reward ratio.
#Trading #Crypto #Pendle #DeFi #Investments #CryptoAnalysis #TechnicalAnalysis #SmartTrading #BinanceFutures
Status: Monitoring entry opportunity. Patience is our greatest operational advantage.
Market Outlook: After a marked bullish impulse, the asset is in a zone of significant overbought conditions (RSI at extreme levels), suggesting a high probability of a technical correction in the short term.
Trading Strategy: Instead of entering in the euphoria of the current move, we seek a high-precision entry after the correction.
Entry Zone (Buy Limit): Range 1.5280 - 1.5320. We want the asset to test key support levels (Bollinger band midline) before resuming the trend.
Risk Management:
Stop Loss: 1.4950. Critical level to invalidate the bullish thesis and protect capital against any structural change.
Take Profit: 1.5800 (First target) and 1.6200 (Secondary target).
Note: Trading with discipline means waiting for the market to reach our defined levels. We do not chase moves; we wait for setups that offer a favorable risk/reward ratio.
#Trading #Crypto #Pendle #DeFi #Investments #CryptoAnalysis #TechnicalAnalysis #SmartTrading #BinanceFutures
83
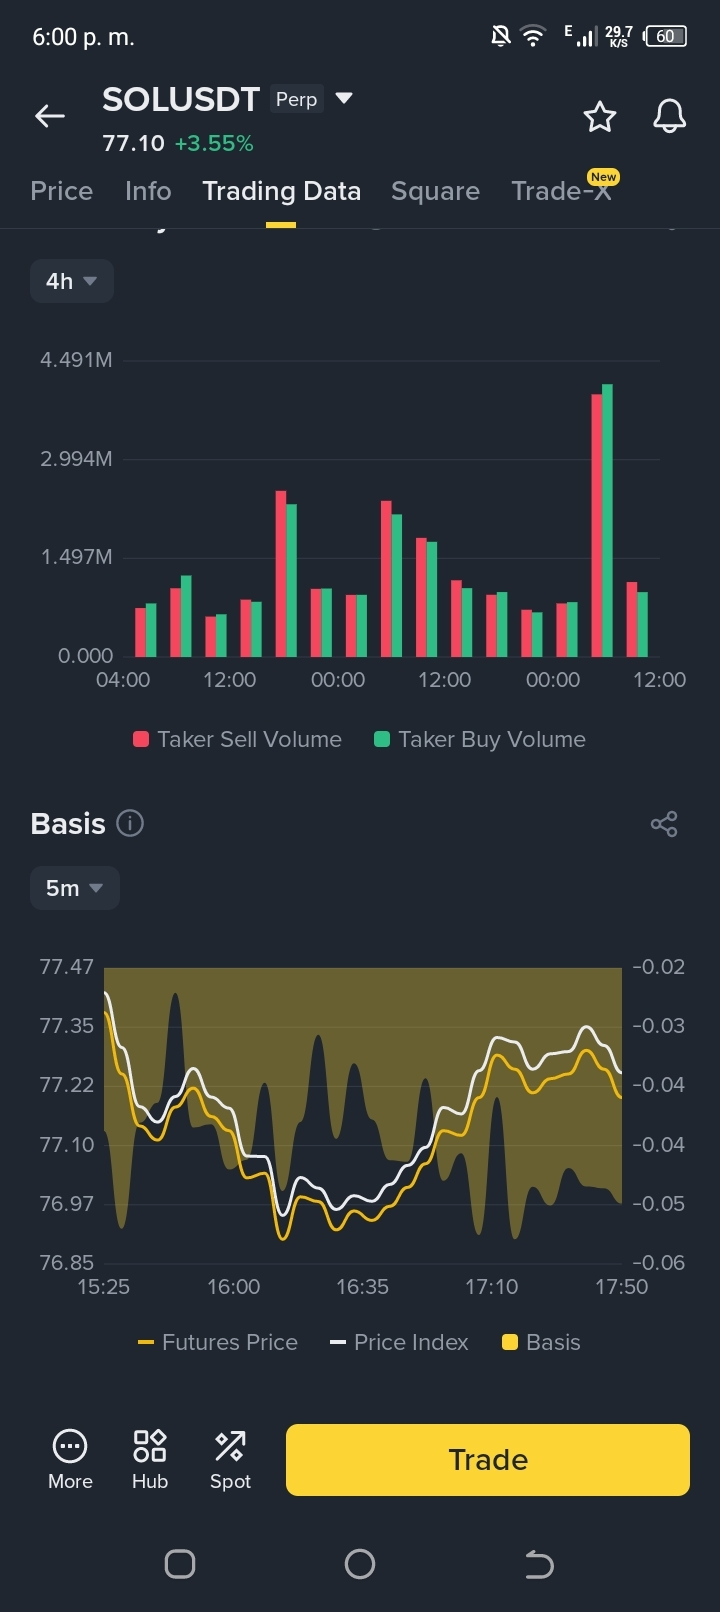
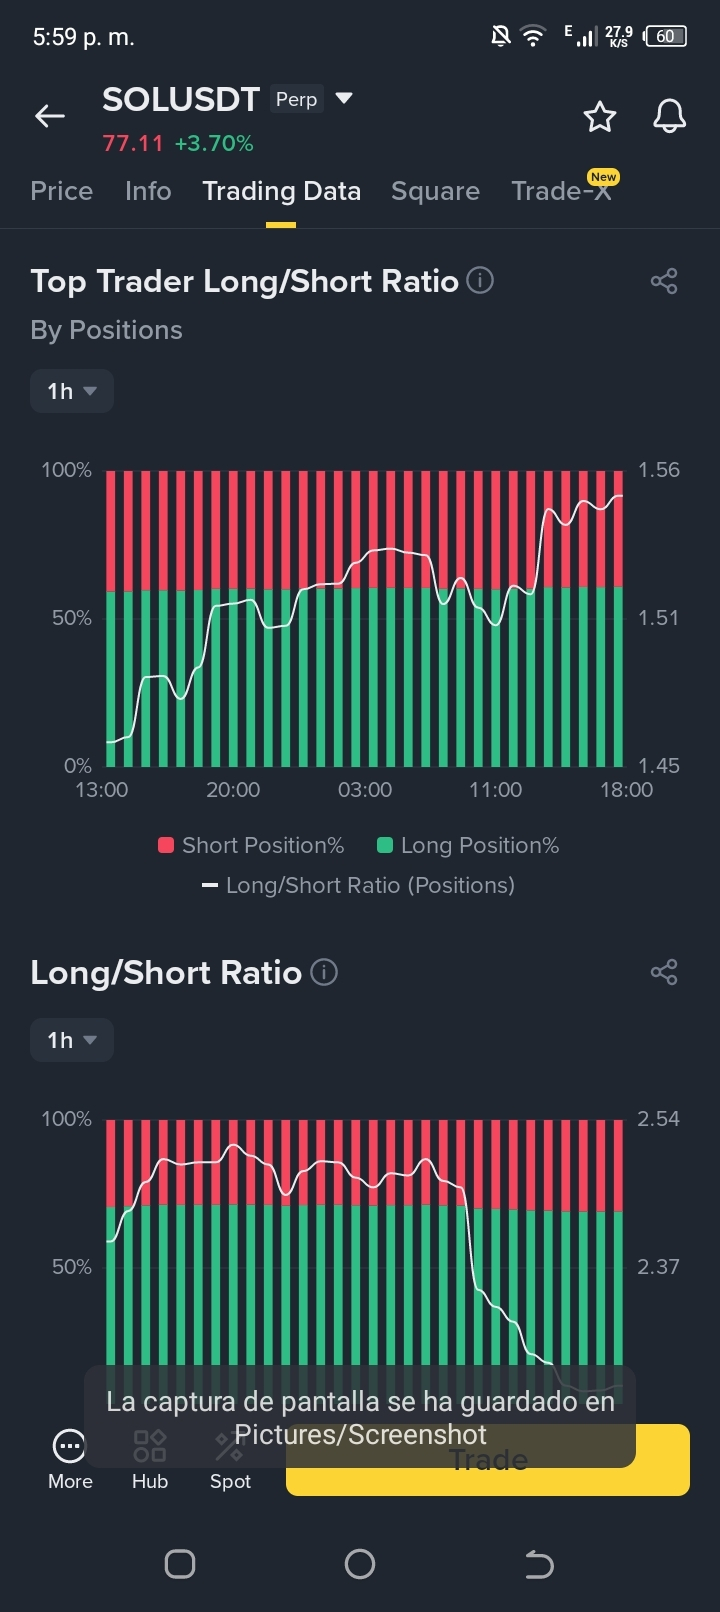
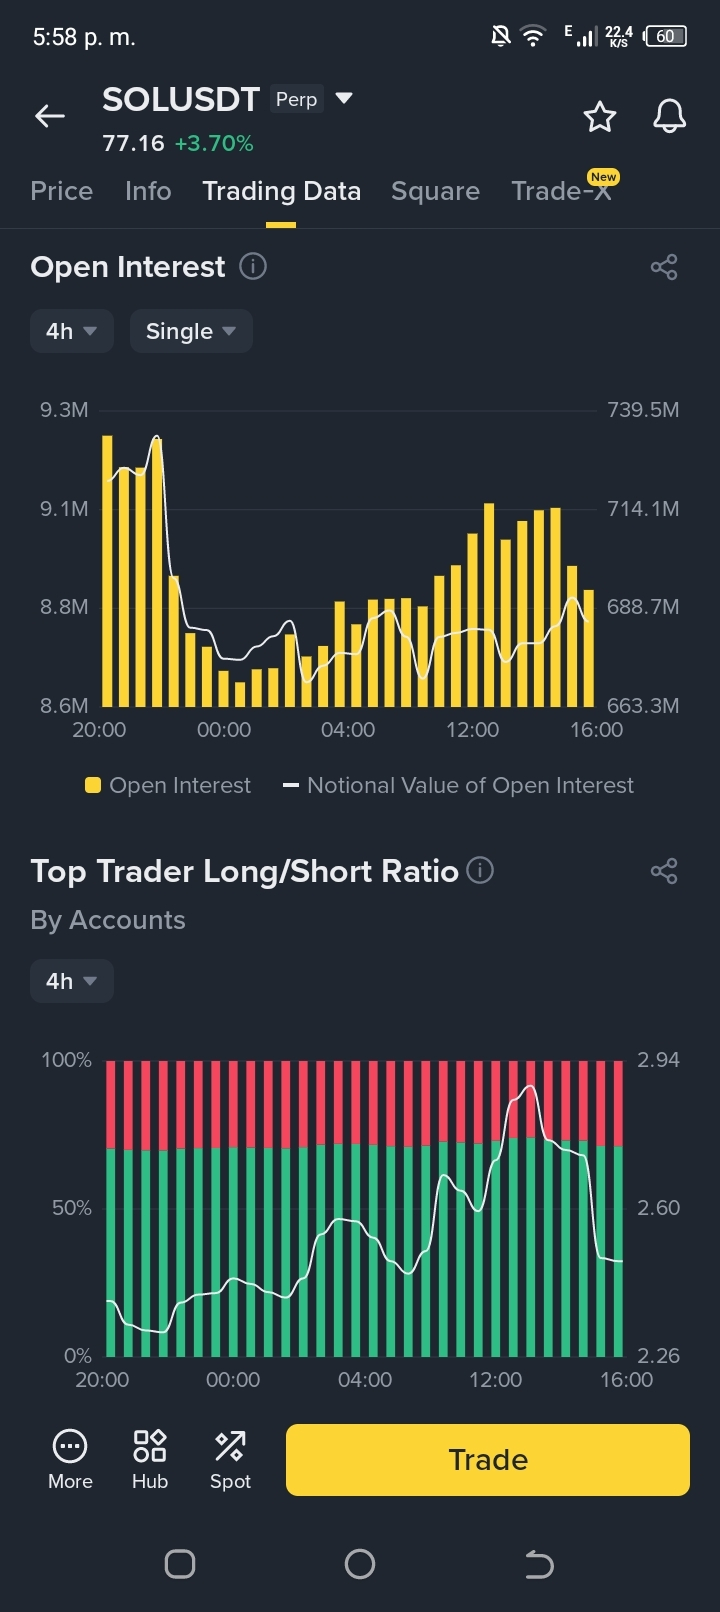
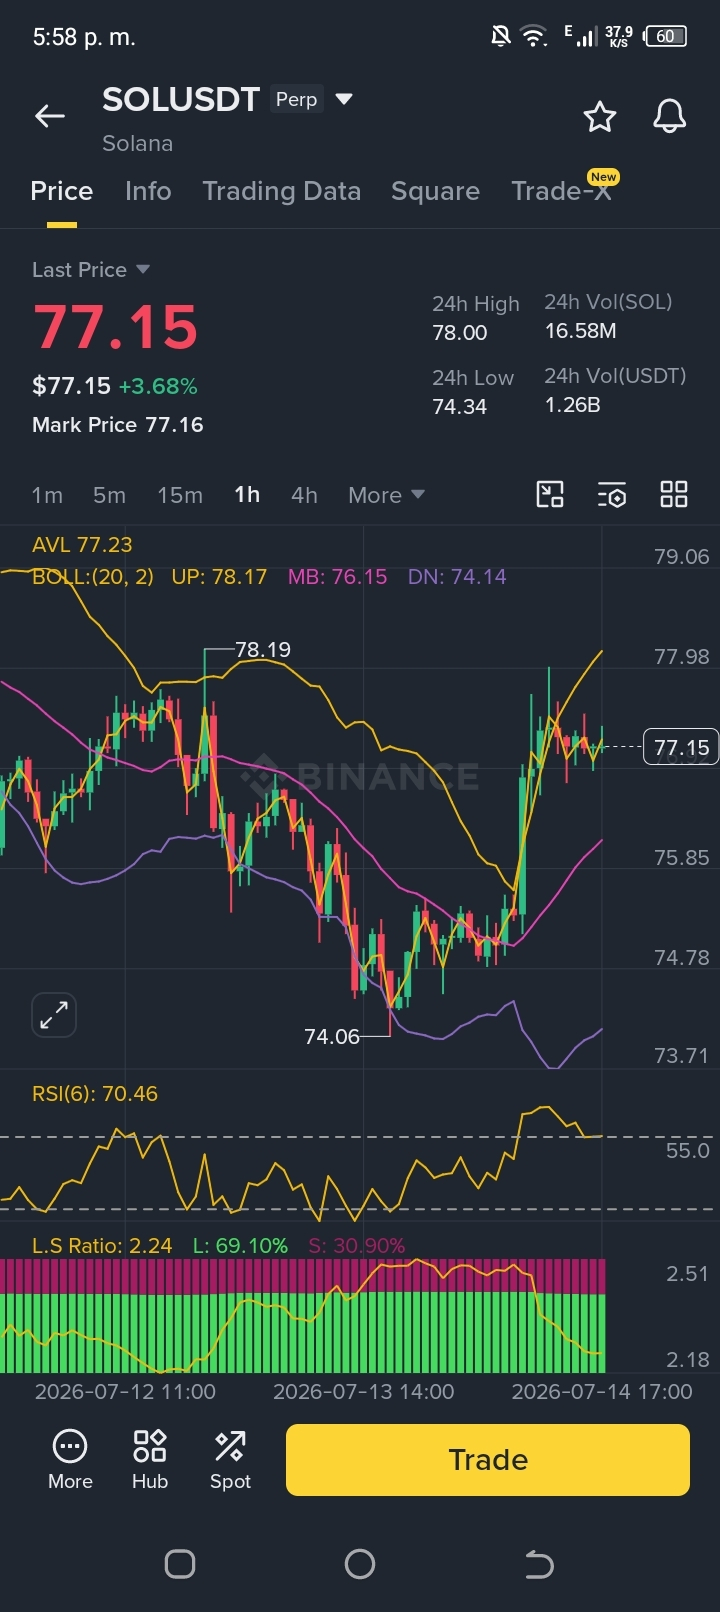
🩺 Trading Setup: $SOL /USDT (Plan Quirúrgico)
Estado: Në espera de retroceso técnico. No perseguimos el precio, dejamos que el mercado llegue a nosotros.
Tesis: El activo presenta sobrecompra (RSI > 70) y una alta concentración de posiciones largas minoristas, lo que aumenta el riesgo de una corrección técnica antes de continuar el impulso alcista.
Zona de Entrada (Buy Limit): 76.15. Esperamos el testeo de la zona media para mejorar nuestro ratio riesgo/beneficio.
Stop Loss (Protección): 75.40. Si el precio perfora este nivel, invalidamos la tesis alcista y salimos para preservar capital.
Take Profit (Objetivo): 78.00 (Primer objetivo) y 79.50 (Objetivo extendido).
⚠️ Nota de Gestión:
Estamos operando contra la sobrecompra inmediata. La paciencia en la entrada es lo que define a un cirujano de mercado.
Si el precio no llega a nuestro nivel y despega sin nosotros, no perseguimos. La disciplina evita las pérdidas innecesarias.
#sol #solana
🩺 Trading Setup: $SOL /USDT (Plan Quirúrgico)
Estado: Në espera de retroceso técnico. No perseguimos el precio, dejamos que el mercado llegue a nosotros.
Tesis: El activo presenta sobrecompra (RSI > 70) y una alta concentración de posiciones largas minoristas, lo que aumenta el riesgo de una corrección técnica antes de continuar el impulso alcista.
Zona de Entrada (Buy Limit): 76.15. Esperamos el testeo de la zona media para mejorar nuestro ratio riesgo/beneficio.
Stop Loss (Protección): 75.40. Si el precio perfora este nivel, invalidamos la tesis alcista y salimos para preservar capital.
Take Profit (Objetivo): 78.00 (Primer objetivo) y 79.50 (Objetivo extendido).
⚠️ Nota de Gestión:
Estamos operando contra la sobrecompra inmediata. La paciencia en la entrada es lo que define a un cirujano de mercado.
Si el precio no llega a nuestro nivel y despega sin nosotros, no perseguimos. La disciplina evita las pérdidas innecesarias.
#sol #solana
Estado: Në espera de retroceso técnico. No perseguimos el precio, dejamos que el mercado llegue a nosotros.
Tesis: El activo presenta sobrecompra (RSI > 70) y una alta concentración de posiciones largas minoristas, lo que aumenta el riesgo de una corrección técnica antes de continuar el impulso alcista.
Zona de Entrada (Buy Limit): 76.15. Esperamos el testeo de la zona media para mejorar nuestro ratio riesgo/beneficio.
Stop Loss (Protección): 75.40. Si el precio perfora este nivel, invalidamos la tesis alcista y salimos para preservar capital.
Take Profit (Objetivo): 78.00 (Primer objetivo) y 79.50 (Objetivo extendido).
⚠️ Nota de Gestión:
Estamos operando contra la sobrecompra inmediata. La paciencia en la entrada es lo que define a un cirujano de mercado.
Si el precio no llega a nuestro nivel y despega sin nosotros, no perseguimos. La disciplina evita las pérdidas innecesarias.
#sol #solana
184
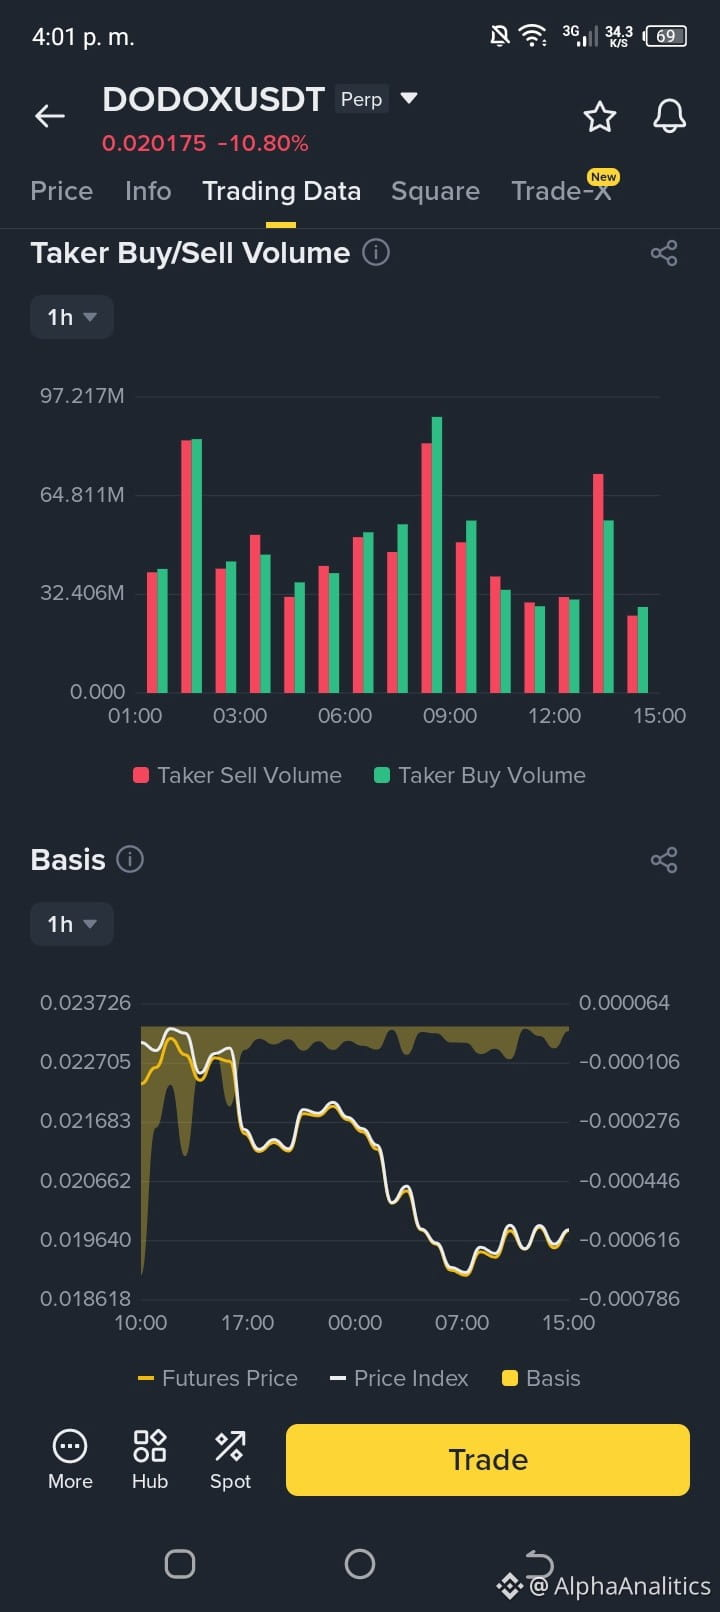
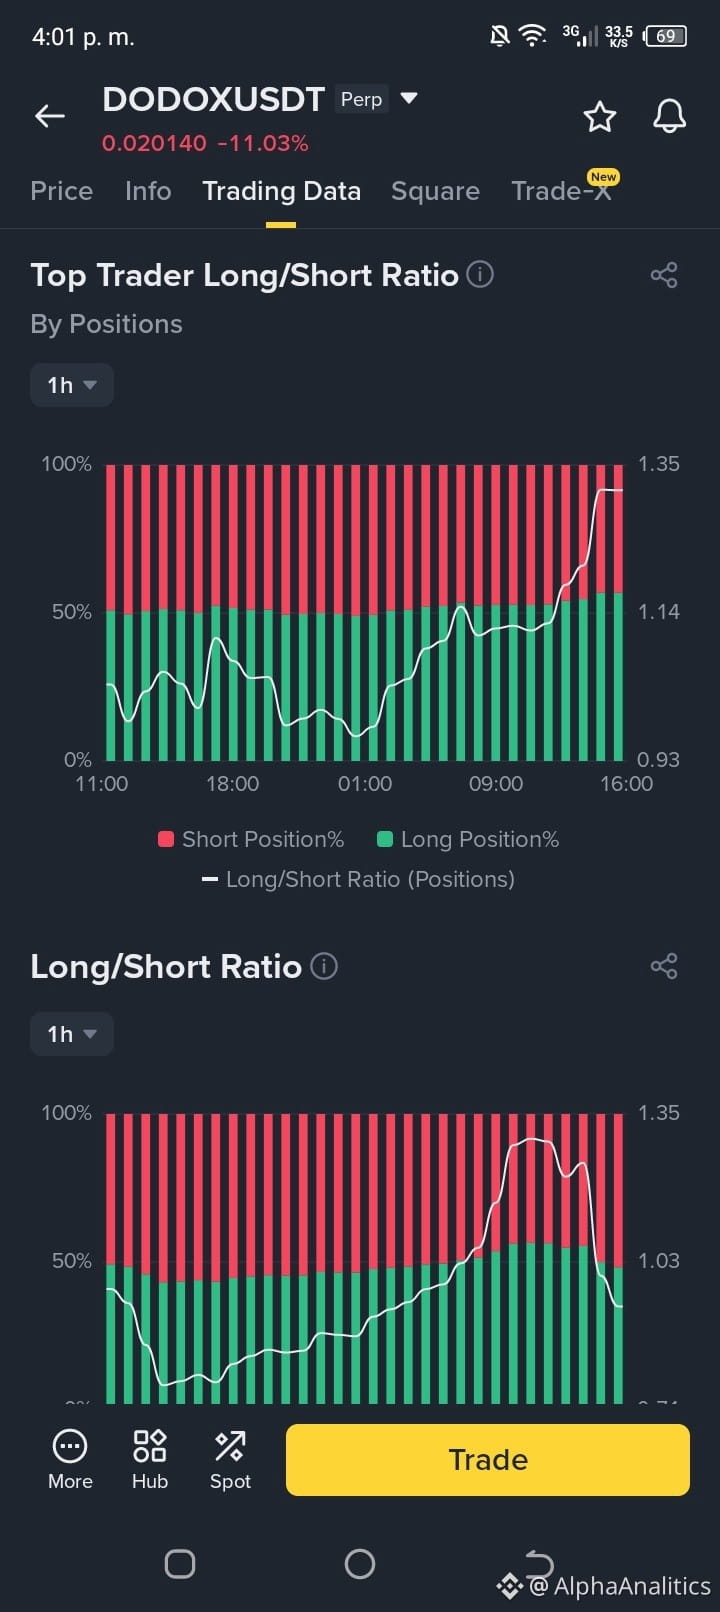
⚠️ ¿Rebote en $DODOX ? El mercado muestra señales de estabilización.
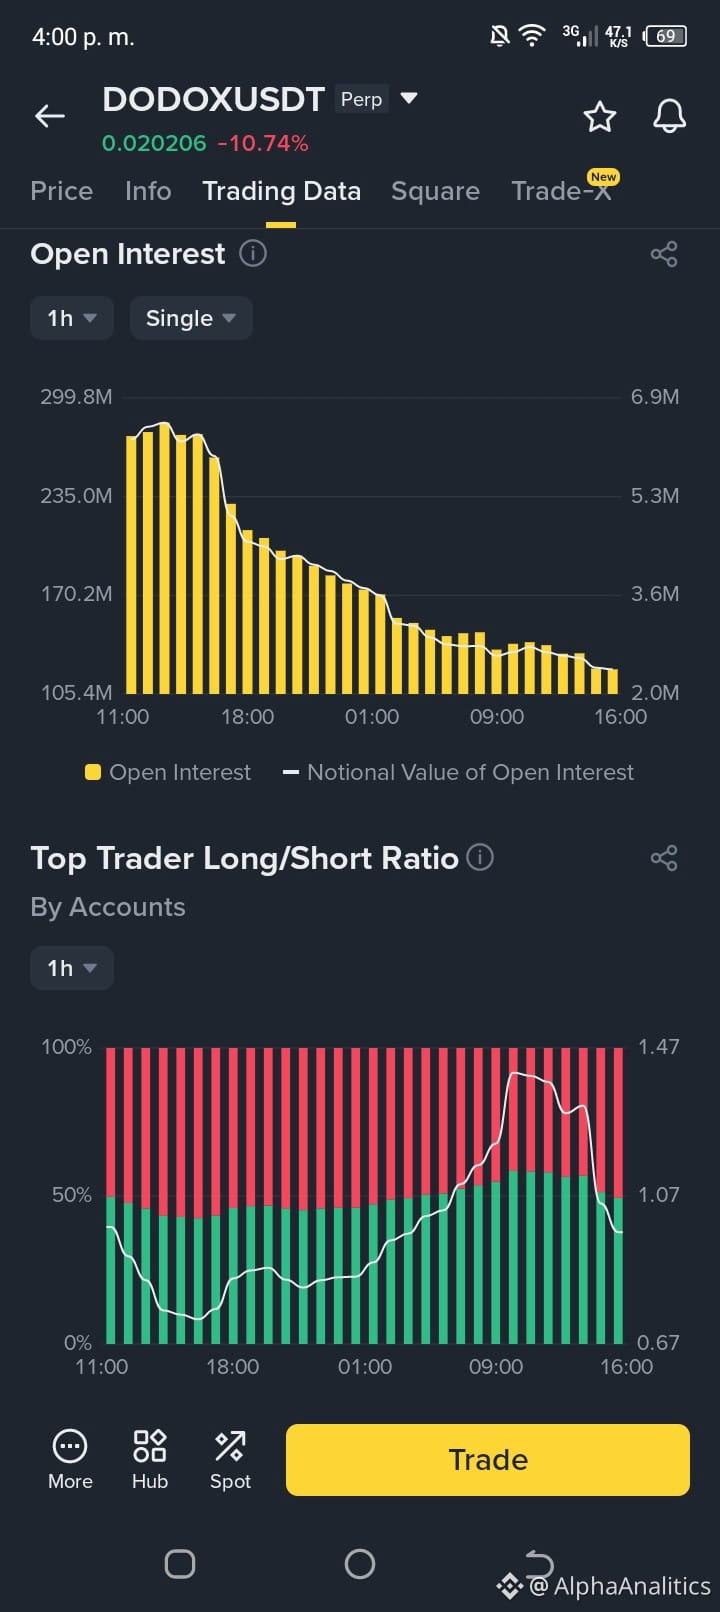
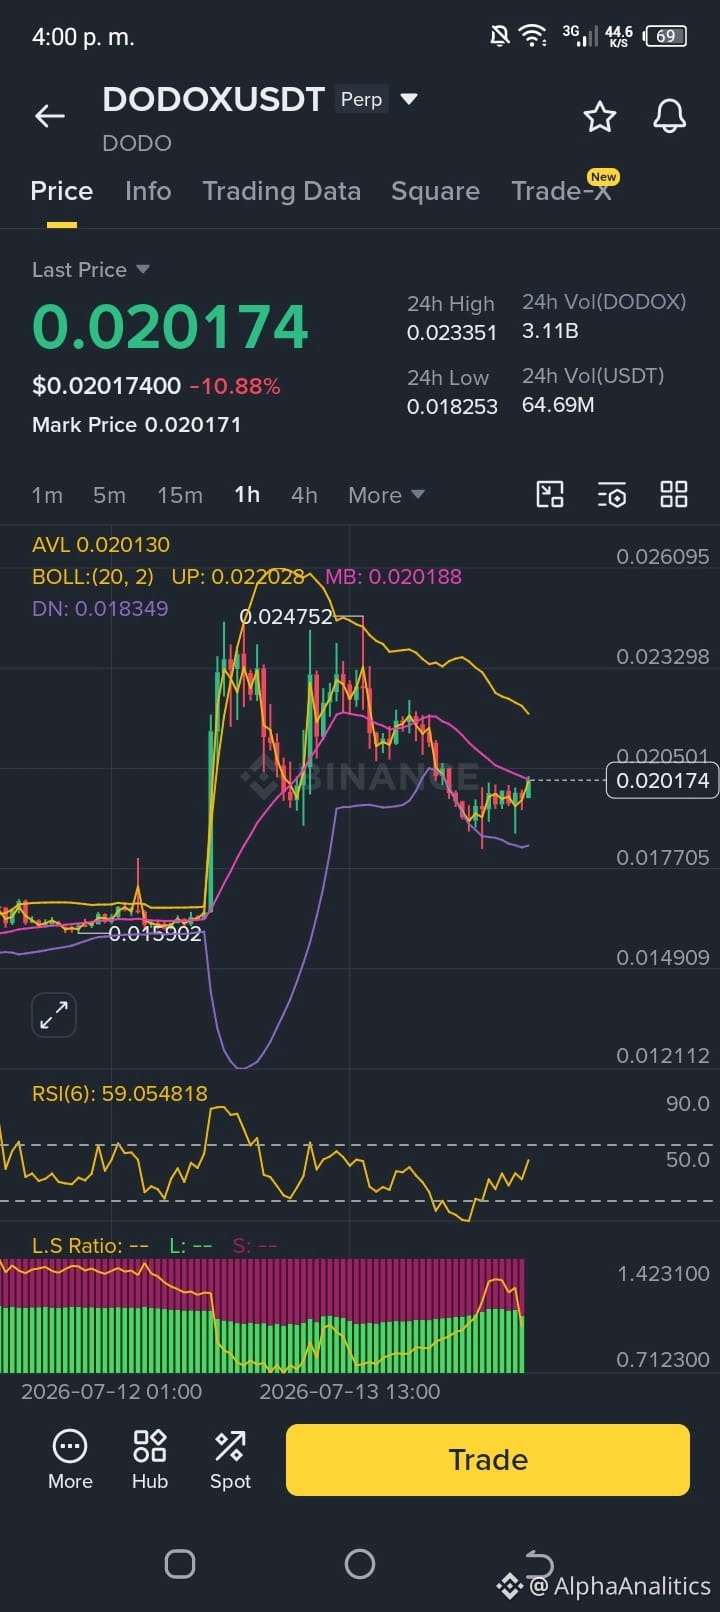
Tras la fuerte caída del -11%, $DODO USDT comienza a mostrar signos de capitulación en los datos de Open Interest, lo que sugiere que la presión vendedora está perdiendo fuerza.
🔍 Análisis técnico:
El Open Interest ha caído constantemente, indicando una limpieza de posiciones apalancadas.
El RSI(6) en 15m está regresando de niveles de sobrecompra, buscando un apoyo técnico en la zona de la media móvil.
La relación Long/Short se encuentra en un punto de equilibrio saludable, reduciendo el riesgo de una liquidación masiva inmediata.
🎯 Estrategia de Trading:
Vamos a operar buscando el rebote técnico con este plan estructurado:
Entrada: Buscamos posicionarnos en los 0.019650 para aprovechar el retroceso hacia la zona de soporte.
Stop Loss: Ajustado en los 0.018200, protegiendo la operación por debajo del mínimo reciente de capitulación.
Take Profit: Objetivo de salida en 0.021000, coincidiendo con la resistencia previa donde el precio mostró agotamiento.
La clave aquí es la paciencia. No buscamos adivinar el suelo, sino operar el momento en que el precio estabiliza y el volumen de compra vuelve a ganar tracción.
💬 ¿Creen que DODO tiene fuerza para recuperar el 0.021 o veremos una continuación de la tendencia bajista? ¡Los leo en los comentarios!
#Trading #crypto #dodo #Scalping #DeFi #AnalisisTecnico #CryptoTrading
⚠️ ¿Rebote en $DODOX ? El mercado muestra señales de estabilización.
Tras la fuerte caída del -11%, $DODO USDT comienza a mostrar signos de capitulación en los datos de Open Interest, lo que sugiere que la presión vendedora está perdiendo fuerza.
🔍 Análisis técnico:
El Open Interest ha caído constantemente, indicando una limpieza de posiciones apalancadas.
El RSI(6) en 15m está regresando de niveles de sobrecompra, buscando un apoyo técnico en la zona de la media móvil.
La relación Long/Short se encuentra en un punto de equilibrio saludable, reduciendo el riesgo de una liquidación masiva inmediata.
🎯 Estrategia de Trading:
Vamos a operar buscando el rebote técnico con este plan estructurado:
Entrada: Buscamos posicionarnos en los 0.019650 para aprovechar el retroceso hacia la zona de soporte.
Stop Loss: Ajustado en los 0.018200, protegiendo la operación por debajo del mínimo reciente de capitulación.
Take Profit: Objetivo de salida en 0.021000, coincidiendo con la resistencia previa donde el precio mostró agotamiento.
La clave aquí es la paciencia. No buscamos adivinar el suelo, sino operar el momento en que el precio estabiliza y el volumen de compra vuelve a ganar tracción.
💬 ¿Creen que DODO tiene fuerza para recuperar el 0.021 o veremos una continuación de la tendencia bajista? ¡Los leo en los comentarios!
#Trading #crypto #dodo #Scalping #DeFi #AnalisisTecnico #CryptoTrading
Tras la fuerte caída del -11%, $DODO USDT comienza a mostrar signos de capitulación en los datos de Open Interest, lo que sugiere que la presión vendedora está perdiendo fuerza.
🔍 Análisis técnico:
El Open Interest ha caído constantemente, indicando una limpieza de posiciones apalancadas.
El RSI(6) en 15m está regresando de niveles de sobrecompra, buscando un apoyo técnico en la zona de la media móvil.
La relación Long/Short se encuentra en un punto de equilibrio saludable, reduciendo el riesgo de una liquidación masiva inmediata.
🎯 Estrategia de Trading:
Vamos a operar buscando el rebote técnico con este plan estructurado:
Entrada: Buscamos posicionarnos en los 0.019650 para aprovechar el retroceso hacia la zona de soporte.
Stop Loss: Ajustado en los 0.018200, protegiendo la operación por debajo del mínimo reciente de capitulación.
Take Profit: Objetivo de salida en 0.021000, coincidiendo con la resistencia previa donde el precio mostró agotamiento.
La clave aquí es la paciencia. No buscamos adivinar el suelo, sino operar el momento en que el precio estabiliza y el volumen de compra vuelve a ganar tracción.
💬 ¿Creen que DODO tiene fuerza para recuperar el 0.021 o veremos una continuación de la tendencia bajista? ¡Los leo en los comentarios!
#Trading #crypto #dodo #Scalping #DeFi #AnalisisTecnico #CryptoTrading
147
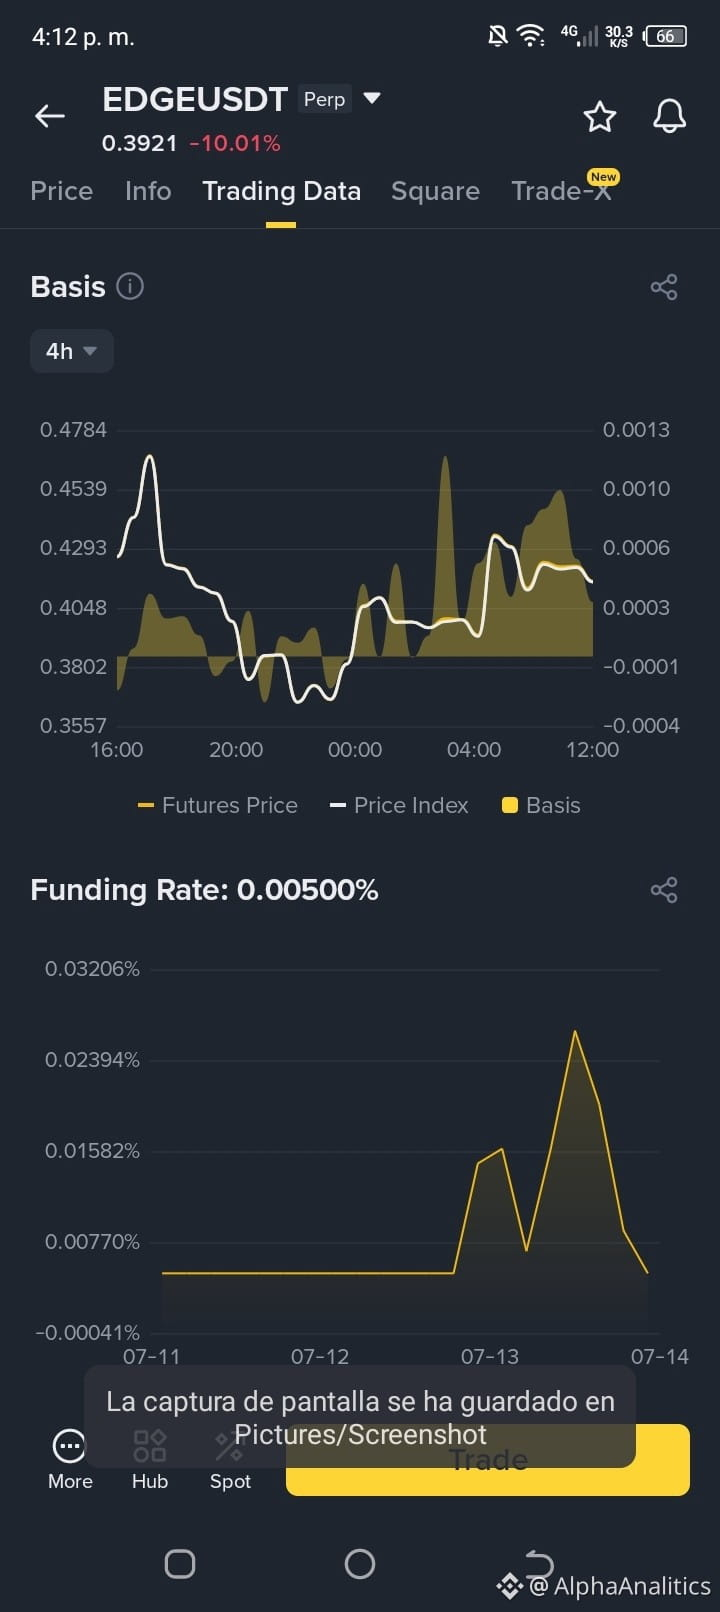
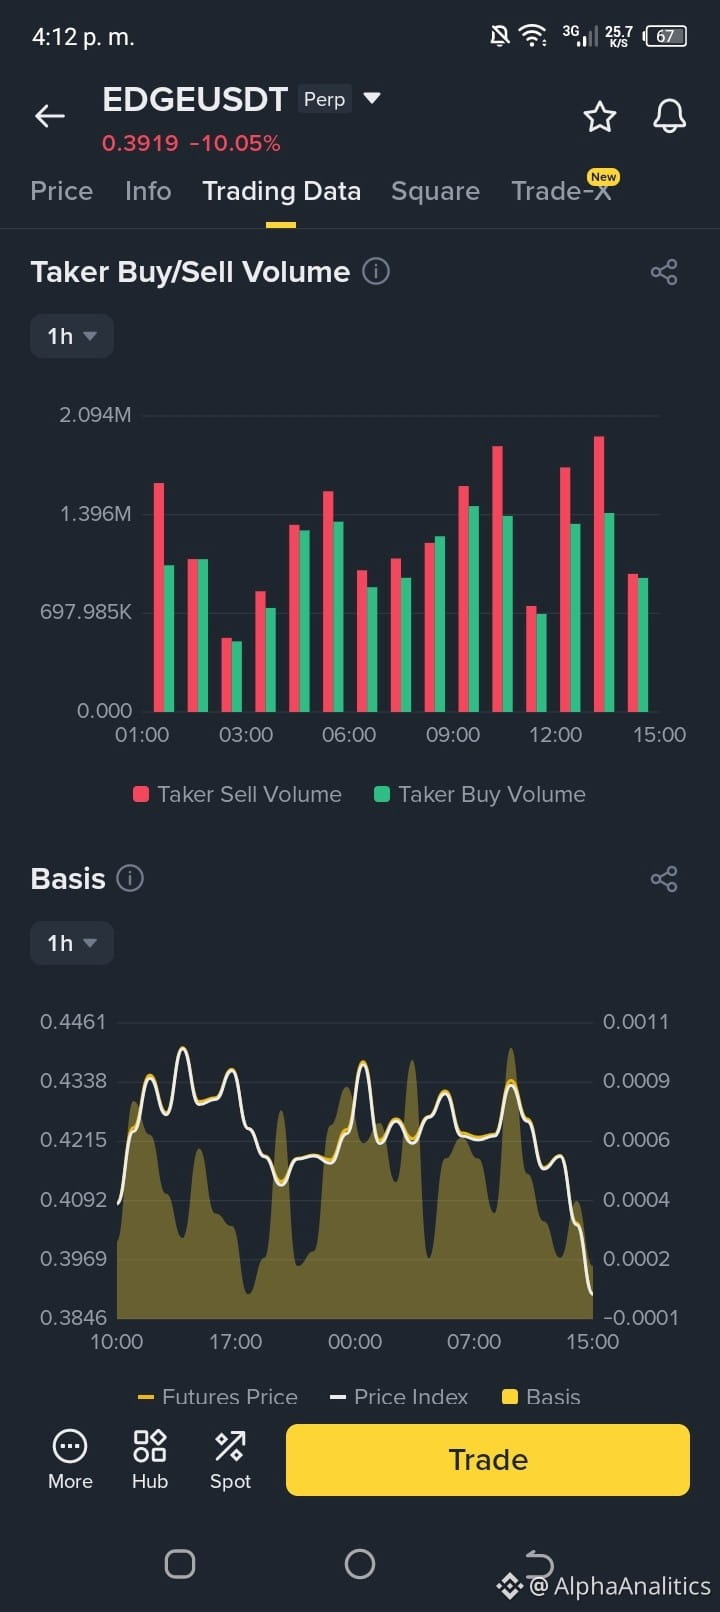
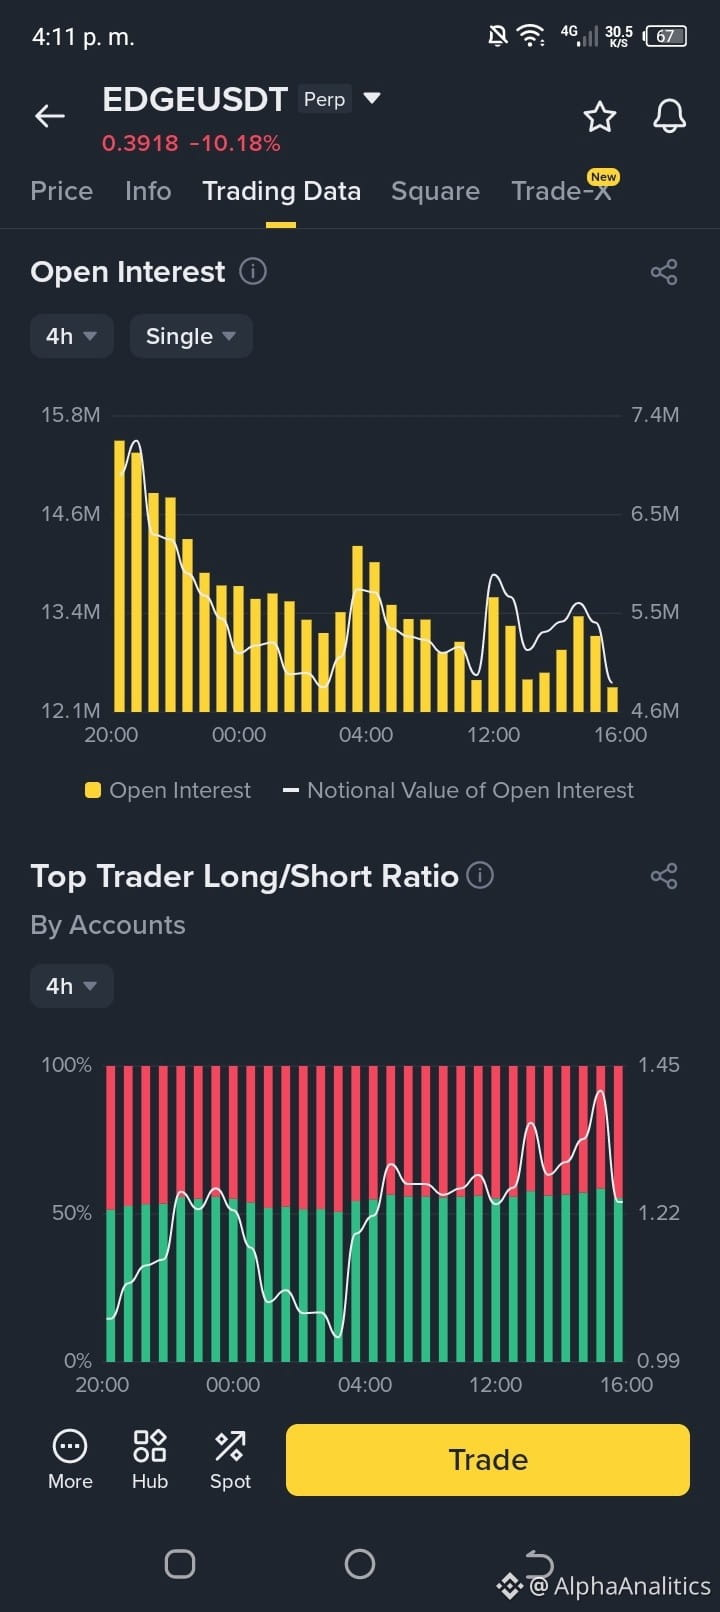
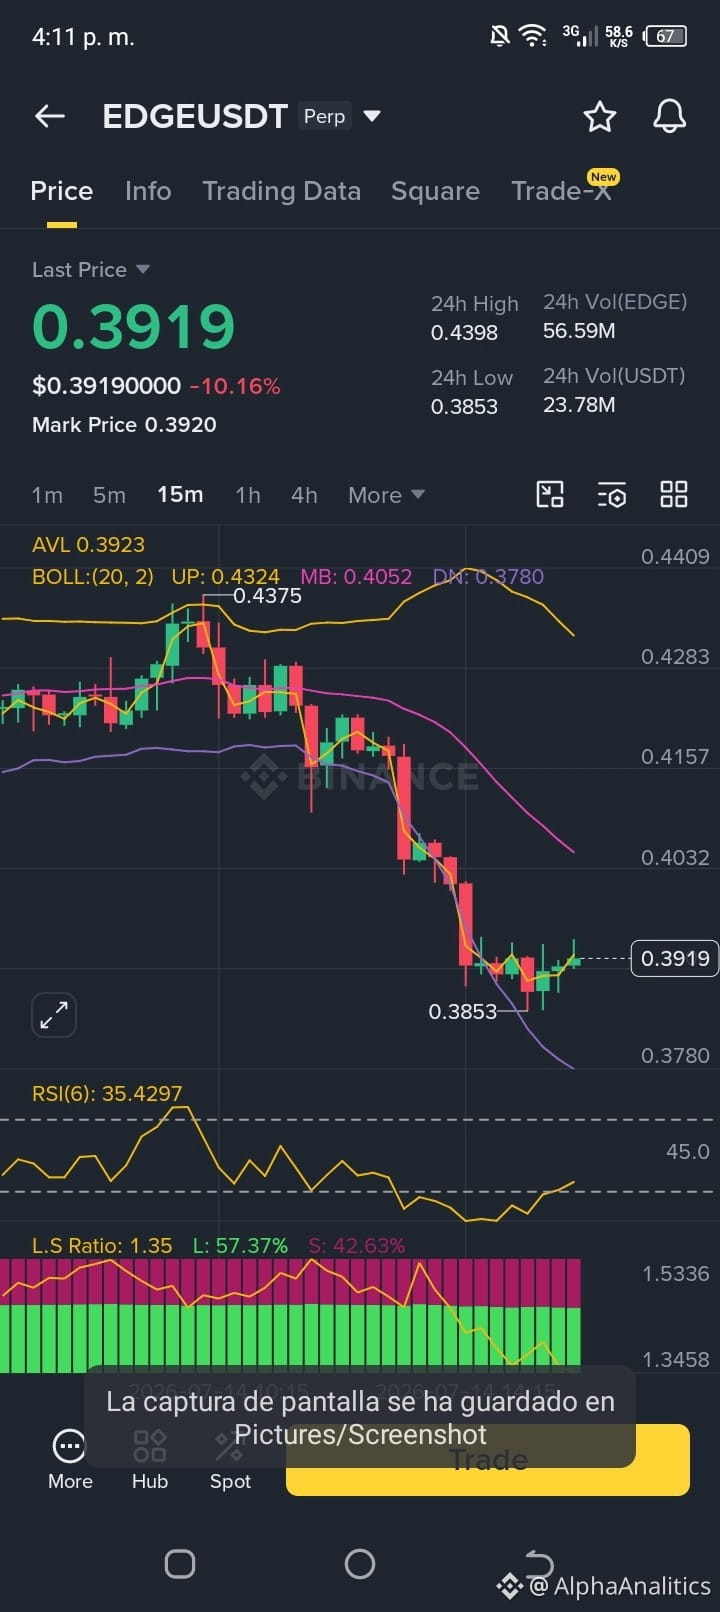
⚠️ ¿Capitulación en EDGE? Análisis de liquidez.
$EDGE acaba de sufrir un ajuste del -10%, pero los datos técnicos cuentan una historia interesante:
🔍 ¿Qué está pasando?
Limpieza de OI: El Open Interest ha caído drásticamente, lo que indica que el mercado está eliminando el exceso de apalancamiento.
Sobreventa extrema: Con un RSI(6) tocando los 24.8, el activo se encuentra en una zona técnica donde históricamente suele buscar rebotes para aliviar la presión vendedora.
🎯 Estrategia en curso:
Estamos buscando un soporte en la zona de los 0.3850 para intentar capturar el rebote hacia los 0.4200, manteniendo un SL bajo los 0.3600 para proteger la capital ante la volatilidad.
💬 ¿Crees que EDGE ha encontrado un suelo sólido o prefieres esperar una confirmación de volumen comprador antes de entrar? ¡Te leo!
#Trading #Crypto #EDGEUSDT #AnálisisTécnico #Scalping #Criptomonedas
⚠️ ¿Capitulación en EDGE? Análisis de liquidez.
$EDGE acaba de sufrir un ajuste del -10%, pero los datos técnicos cuentan una historia interesante:
🔍 ¿Qué está pasando?
Limpieza de OI: El Open Interest ha caído drásticamente, lo que indica que el mercado está eliminando el exceso de apalancamiento.
Sobreventa extrema: Con un RSI(6) tocando los 24.8, el activo se encuentra en una zona técnica donde históricamente suele buscar rebotes para aliviar la presión vendedora.
🎯 Estrategia en curso:
Estamos buscando un soporte en la zona de los 0.3850 para intentar capturar el rebote hacia los 0.4200, manteniendo un SL bajo los 0.3600 para proteger la capital ante la volatilidad.
💬 ¿Crees que EDGE ha encontrado un suelo sólido o prefieres esperar una confirmación de volumen comprador antes de entrar? ¡Te leo!
#Trading #Crypto #EDGEUSDT #AnálisisTécnico #Scalping #Criptomonedas
$EDGE acaba de sufrir un ajuste del -10%, pero los datos técnicos cuentan una historia interesante:
🔍 ¿Qué está pasando?
Limpieza de OI: El Open Interest ha caído drásticamente, lo que indica que el mercado está eliminando el exceso de apalancamiento.
Sobreventa extrema: Con un RSI(6) tocando los 24.8, el activo se encuentra en una zona técnica donde históricamente suele buscar rebotes para aliviar la presión vendedora.
🎯 Estrategia en curso:
Estamos buscando un soporte en la zona de los 0.3850 para intentar capturar el rebote hacia los 0.4200, manteniendo un SL bajo los 0.3600 para proteger la capital ante la volatilidad.
💬 ¿Crees que EDGE ha encontrado un suelo sólido o prefieres esperar una confirmación de volumen comprador antes de entrar? ¡Te leo!
#Trading #Crypto #EDGEUSDT #AnálisisTécnico #Scalping #Criptomonedas
140
⚠️ ስልታዊ መልካም ማታለያ በ SIRENUSDT? ውሂቡን ችላ ማለት ያስከትላል አደጋ።
ገበያው ሐሳብ በማይገባ ተስፋ አይቅበልም። በአሁኑ ጊዜ፣ $SIREN USDT የሚያሳይ ቴክኒካል ሁኔታ አለ፤ ሁሉም ትሬደር የማይናቅ ነገር ነው ከማንኛውም ትዕዛዝ በፊት።
📉 አስፈላጊ የሚዛመድ አለመመጣጠን፦ የ Long/Short Ratio 4.95 አካባቢ እየተጠጋ ነው። ይህ ማለት በአንድ ክፍል አስተዋጽኦ እንዲሁም በሌላኛው ላይ፣ ሌሎች በግምት 5 ትሬደሮች ከአንድ አጭር ቦታ ለማስቆጠር ረጅም (long) ላይ እየተወራ ነው። ገበያው ድክመት እያሳየ ቢሆን፣ ይህ የእምነት ምልክት አይደለም—የ“liquidity trap” ምልክት ነው።
🔍 መዋቅሩ ምን ይልናል፦
ዋጋው የ Bollinger ባንዱን ታችኛውን ጠርዝ ከዚህ በላይ ለመቆየት እየተጋደለ ነው፤ ይህም እውነተኛ የገዢ ኃይል እጥረት እያሳየ ነው።
Open Interest በ 4h ዝቅ ማለቱ ይህ ንብረት የተቋማት ካፒታል እየደገፈ እንዳልሆነ ይጠቁማል—ወይ እየተቀነሰ ይወጣል ወይም እየተፈሰሰ ነው።
RSI(6) በ neutral-baja ዞን ውስጥ ይቀመጣል፣ ጠንካራ የተቋማት መመለሻ ግልጽ ምልክት አያሳይም።
Mi consejo:
ትዕግስት በንግድ ውስጥ ርካሹ መሳሪያ ነው። እንዲህ ያለ የማይመጣጠን ratio ሲኖር፣ “የ liquidations መዝለል/ጅምር” (ረጅም ቦታዎች ውስጥ የተገደቡ ቦታዎችን ለማጽዳት ወደታች የሚሄድ አስቀድሞ የሚነሳ እንቅስቃሴ) አደጋ በጣም ከፍ ነው።
መውሰድ/መከተል ብቻ አትቸኩል። ገበያው ከተስፋ መጠን የበዛ ነገርን እንዲያጸዳ እና እውነተኛ የ“floor” መዋቅር እንዲያሳይ ጠብቅ።
💬 እርስዎ ምን ይላሉ? የ 0.02511 ደረጃ ግፊቱን ይቆማል ወይስ የበለጠ ውድቀት እናያለን? በኮመንቶች ውስጥ እነብባለሁ።
#Trading #Criptomonedas #SIRENUSDT
⚠️ ስልታዊ መልካም ማታለያ በ SIRENUSDT? ውሂቡን ችላ ማለት ያስከትላል አደጋ።
ገበያው ሐሳብ በማይገባ ተስፋ አይቅበልም። በአሁኑ ጊዜ፣ $SIREN USDT የሚያሳይ ቴክኒካል ሁኔታ አለ፤ ሁሉም ትሬደር የማይናቅ ነገር ነው ከማንኛውም ትዕዛዝ በፊት።
📉 አስፈላጊ የሚዛመድ አለመመጣጠን፦ የ Long/Short Ratio 4.95 አካባቢ እየተጠጋ ነው። ይህ ማለት በአንድ ክፍል አስተዋጽኦ እንዲሁም በሌላኛው ላይ፣ ሌሎች በግምት 5 ትሬደሮች ከአንድ አጭር ቦታ ለማስቆጠር ረጅም (long) ላይ እየተወራ ነው። ገበያው ድክመት እያሳየ ቢሆን፣ ይህ የእምነት ምልክት አይደለም—የ“liquidity trap” ምልክት ነው።
🔍 መዋቅሩ ምን ይልናል፦
ዋጋው የ Bollinger ባንዱን ታችኛውን ጠርዝ ከዚህ በላይ ለመቆየት እየተጋደለ ነው፤ ይህም እውነተኛ የገዢ ኃይል እጥረት እያሳየ ነው።
Open Interest በ 4h ዝቅ ማለቱ ይህ ንብረት የተቋማት ካፒታል እየደገፈ እንዳልሆነ ይጠቁማል—ወይ እየተቀነሰ ይወጣል ወይም እየተፈሰሰ ነው።
RSI(6) በ neutral-baja ዞን ውስጥ ይቀመጣል፣ ጠንካራ የተቋማት መመለሻ ግልጽ ምልክት አያሳይም።
Mi consejo:
ትዕግስት በንግድ ውስጥ ርካሹ መሳሪያ ነው። እንዲህ ያለ የማይመጣጠን ratio ሲኖር፣ “የ liquidations መዝለል/ጅምር” (ረጅም ቦታዎች ውስጥ የተገደቡ ቦታዎችን ለማጽዳት ወደታች የሚሄድ አስቀድሞ የሚነሳ እንቅስቃሴ) አደጋ በጣም ከፍ ነው።
መውሰድ/መከተል ብቻ አትቸኩል። ገበያው ከተስፋ መጠን የበዛ ነገርን እንዲያጸዳ እና እውነተኛ የ“floor” መዋቅር እንዲያሳይ ጠብቅ።
💬 እርስዎ ምን ይላሉ? የ 0.02511 ደረጃ ግፊቱን ይቆማል ወይስ የበለጠ ውድቀት እናያለን? በኮመንቶች ውስጥ እነብባለሁ።
#Trading #Criptomonedas #SIRENUSDT
ገበያው ሐሳብ በማይገባ ተስፋ አይቅበልም። በአሁኑ ጊዜ፣ $SIREN USDT የሚያሳይ ቴክኒካል ሁኔታ አለ፤ ሁሉም ትሬደር የማይናቅ ነገር ነው ከማንኛውም ትዕዛዝ በፊት።
📉 አስፈላጊ የሚዛመድ አለመመጣጠን፦ የ Long/Short Ratio 4.95 አካባቢ እየተጠጋ ነው። ይህ ማለት በአንድ ክፍል አስተዋጽኦ እንዲሁም በሌላኛው ላይ፣ ሌሎች በግምት 5 ትሬደሮች ከአንድ አጭር ቦታ ለማስቆጠር ረጅም (long) ላይ እየተወራ ነው። ገበያው ድክመት እያሳየ ቢሆን፣ ይህ የእምነት ምልክት አይደለም—የ“liquidity trap” ምልክት ነው።
🔍 መዋቅሩ ምን ይልናል፦
ዋጋው የ Bollinger ባንዱን ታችኛውን ጠርዝ ከዚህ በላይ ለመቆየት እየተጋደለ ነው፤ ይህም እውነተኛ የገዢ ኃይል እጥረት እያሳየ ነው።
Open Interest በ 4h ዝቅ ማለቱ ይህ ንብረት የተቋማት ካፒታል እየደገፈ እንዳልሆነ ይጠቁማል—ወይ እየተቀነሰ ይወጣል ወይም እየተፈሰሰ ነው።
RSI(6) በ neutral-baja ዞን ውስጥ ይቀመጣል፣ ጠንካራ የተቋማት መመለሻ ግልጽ ምልክት አያሳይም።
Mi consejo:
ትዕግስት በንግድ ውስጥ ርካሹ መሳሪያ ነው። እንዲህ ያለ የማይመጣጠን ratio ሲኖር፣ “የ liquidations መዝለል/ጅምር” (ረጅም ቦታዎች ውስጥ የተገደቡ ቦታዎችን ለማጽዳት ወደታች የሚሄድ አስቀድሞ የሚነሳ እንቅስቃሴ) አደጋ በጣም ከፍ ነው።
መውሰድ/መከተል ብቻ አትቸኩል። ገበያው ከተስፋ መጠን የበዛ ነገርን እንዲያጸዳ እና እውነተኛ የ“floor” መዋቅር እንዲያሳይ ጠብቅ።
💬 እርስዎ ምን ይላሉ? የ 0.02511 ደረጃ ግፊቱን ይቆማል ወይስ የበለጠ ውድቀት እናያለን? በኮመንቶች ውስጥ እነብባለሁ።
#Trading #Criptomonedas #SIRENUSDT
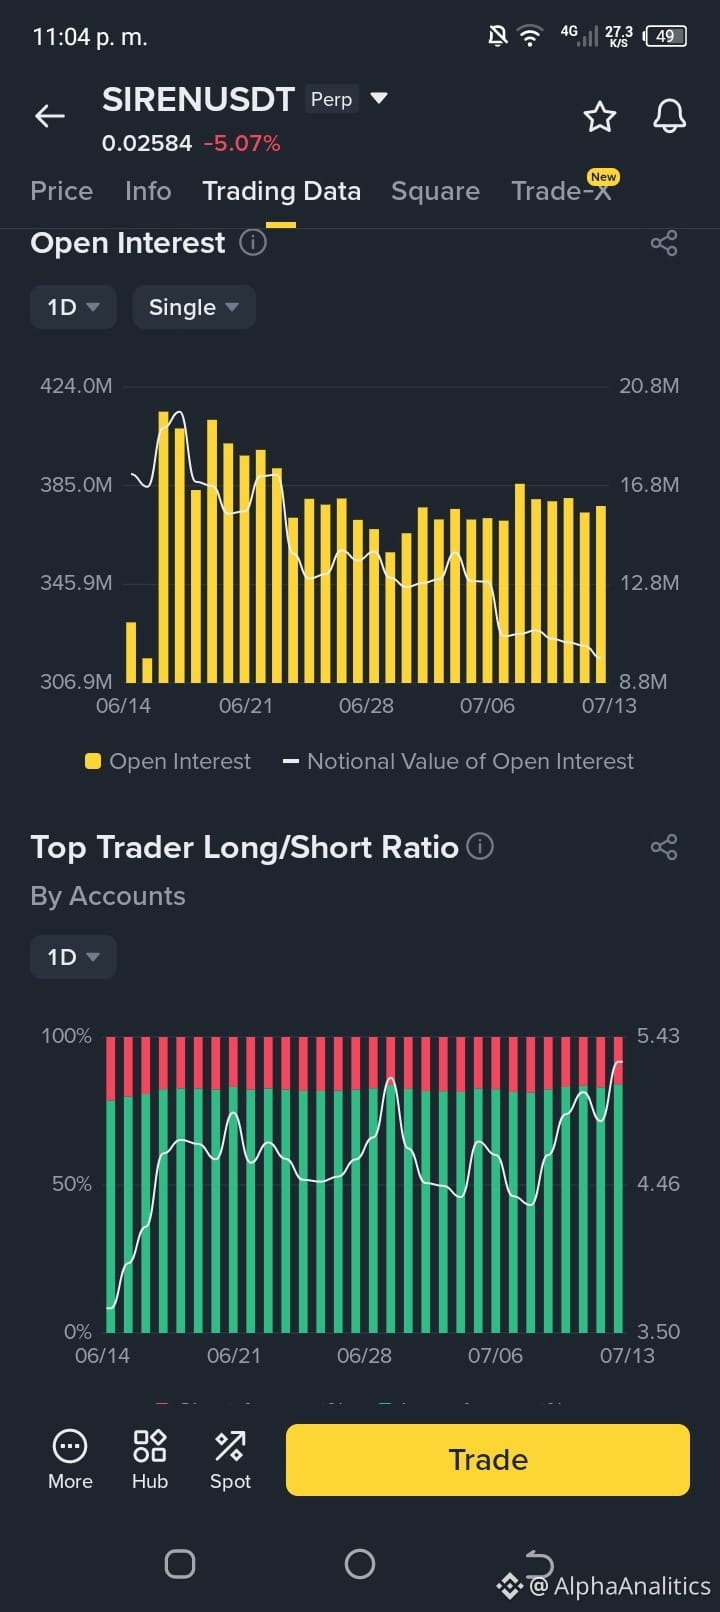
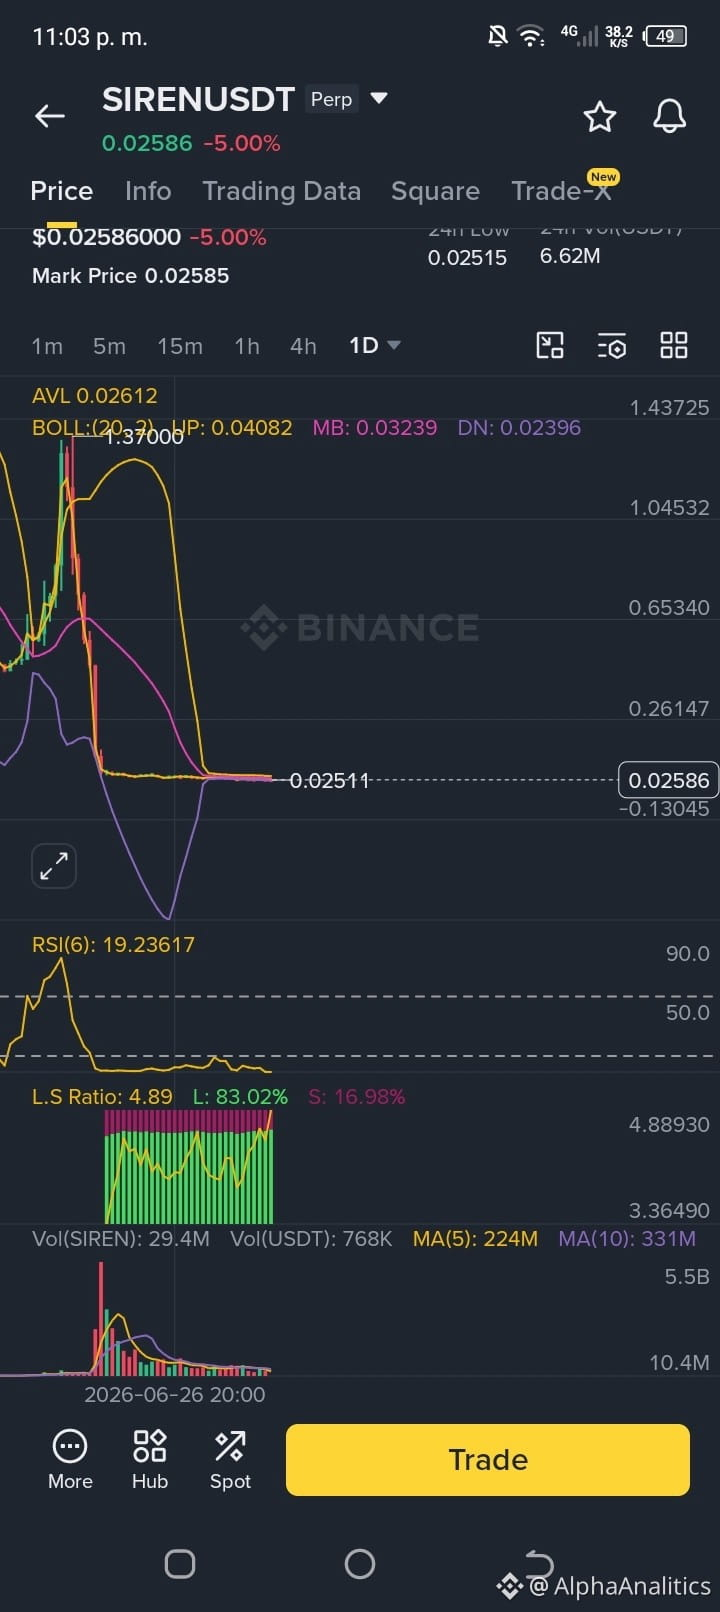
355
Log in to explore more content
Join global crypto users on Binance Square
⚡️ Get latest and useful information about crypto.
💬 Trusted by the world’s largest crypto exchange.
👍 Discover real insights from verified creators.
အီးမေးလ် / ဖုန်းနံပါတ်
ရေပန်းစားနေသော ခေါင်းစဉ်များ
A Packed Week of Earnings and Data Tests Markets
ကြည့်ရှုမှု 58,504 ကြိမ်
381 ဦး ဆွေးနွေးနေသည်
Nvidia၊ Anthropic နဲ့ Fed။ သီတင်းပတ်တစ်ပတ်အတွင်း စမ်းသပ်မှု သုံးခု
Nick_Invest
·နှစ်သက်မှု 3 ခု
·ကြည့်ရှုမှု 1.3k ကြိမ်
AnthropicIPOTestsInvestorAppetiteForAI
ကြည့်ရှုမှု 106,268 ကြိမ်
1,305 ဦး ဆွေးနွေးနေသည်
BitcoinExtendsLosingStreakToSixWeeks
ကြည့်ရှုမှု 76,897 ကြိမ်
673 ဦး ဆွေးနွေးနေသည်