

Joao Wedson
94 ပို့စ်များ

Joao Wedson
တိုင်ကြားမည်
သုံးစွဲသူကို ဘလော့မည်
💎Founder & CEO of @Alphractal
🏅Verified Author at CoinMarketCap & CryptoQuant
⚙ MSc in Data Science & AI
🦾Engineer in Robotics & Automation
₿itcoin OG
0 ဖော်လိုလုပ်ထားသည်
4 ဖော်လိုလုပ်သူများ
11 လိုက်ခ်လုပ်ထားသည်
ပို့စ်များ
·
--
ဘာသာပြန်ဆိုချက် ကြည့်မည်
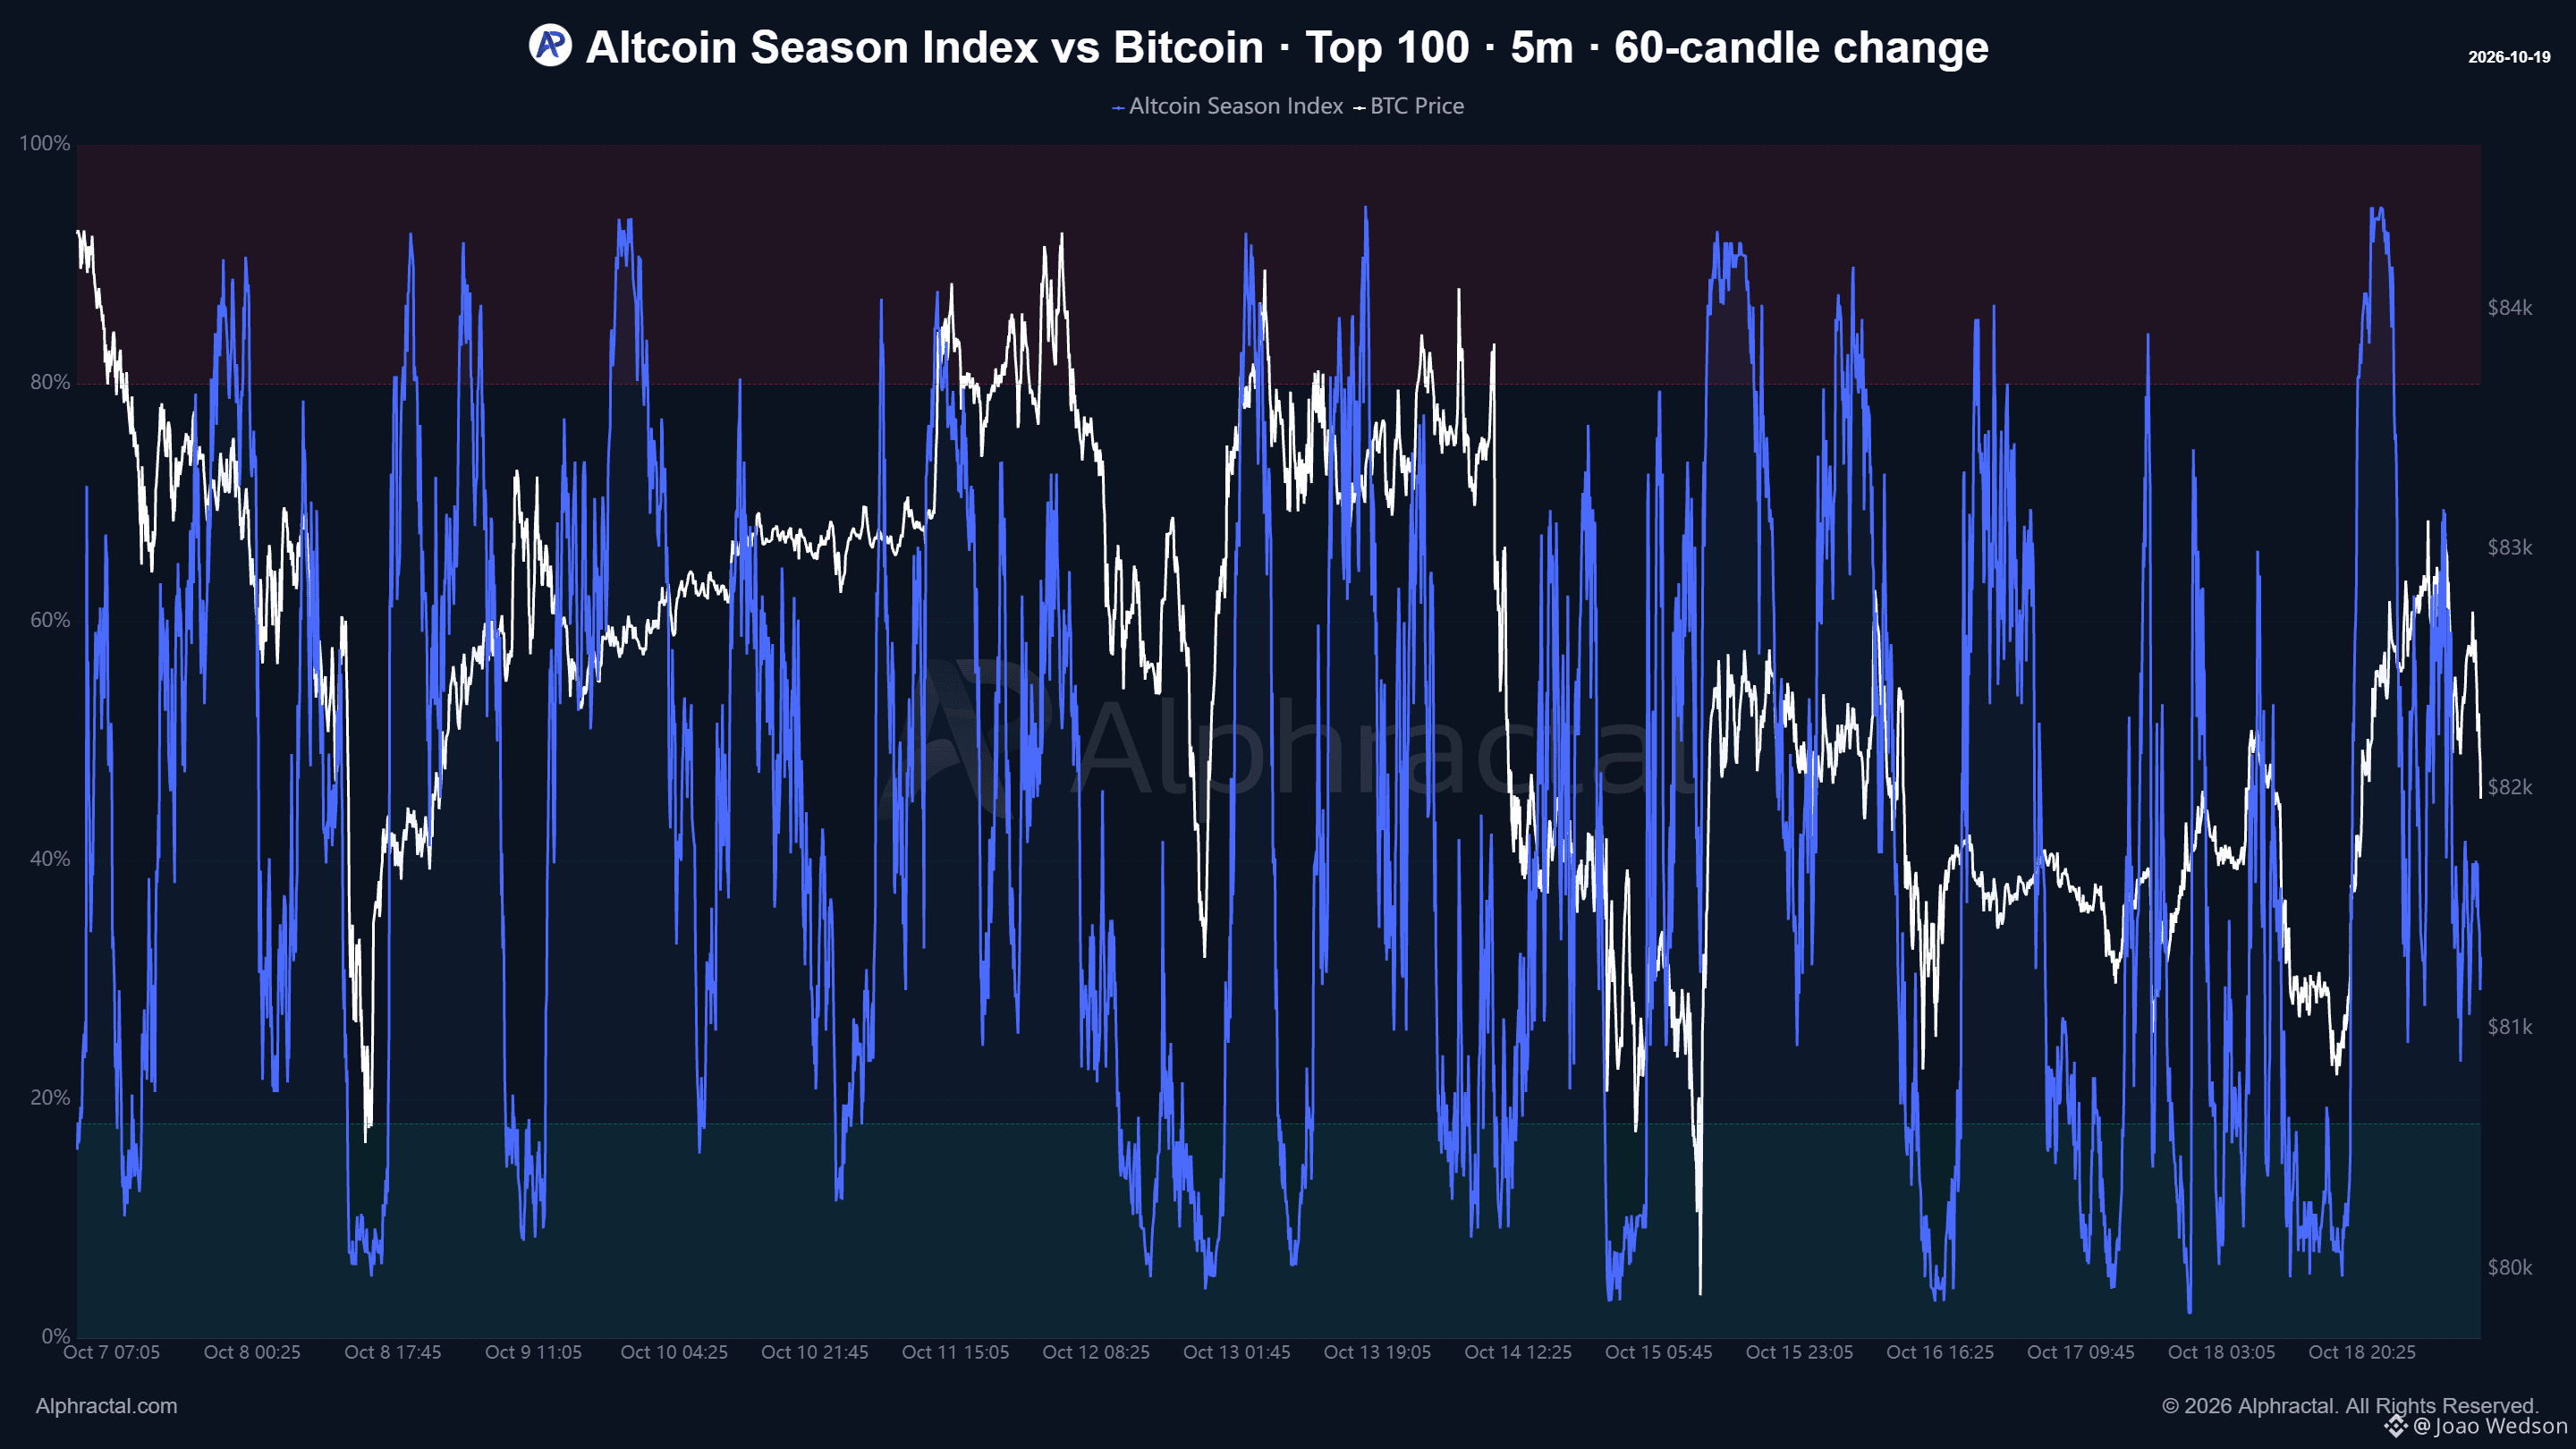
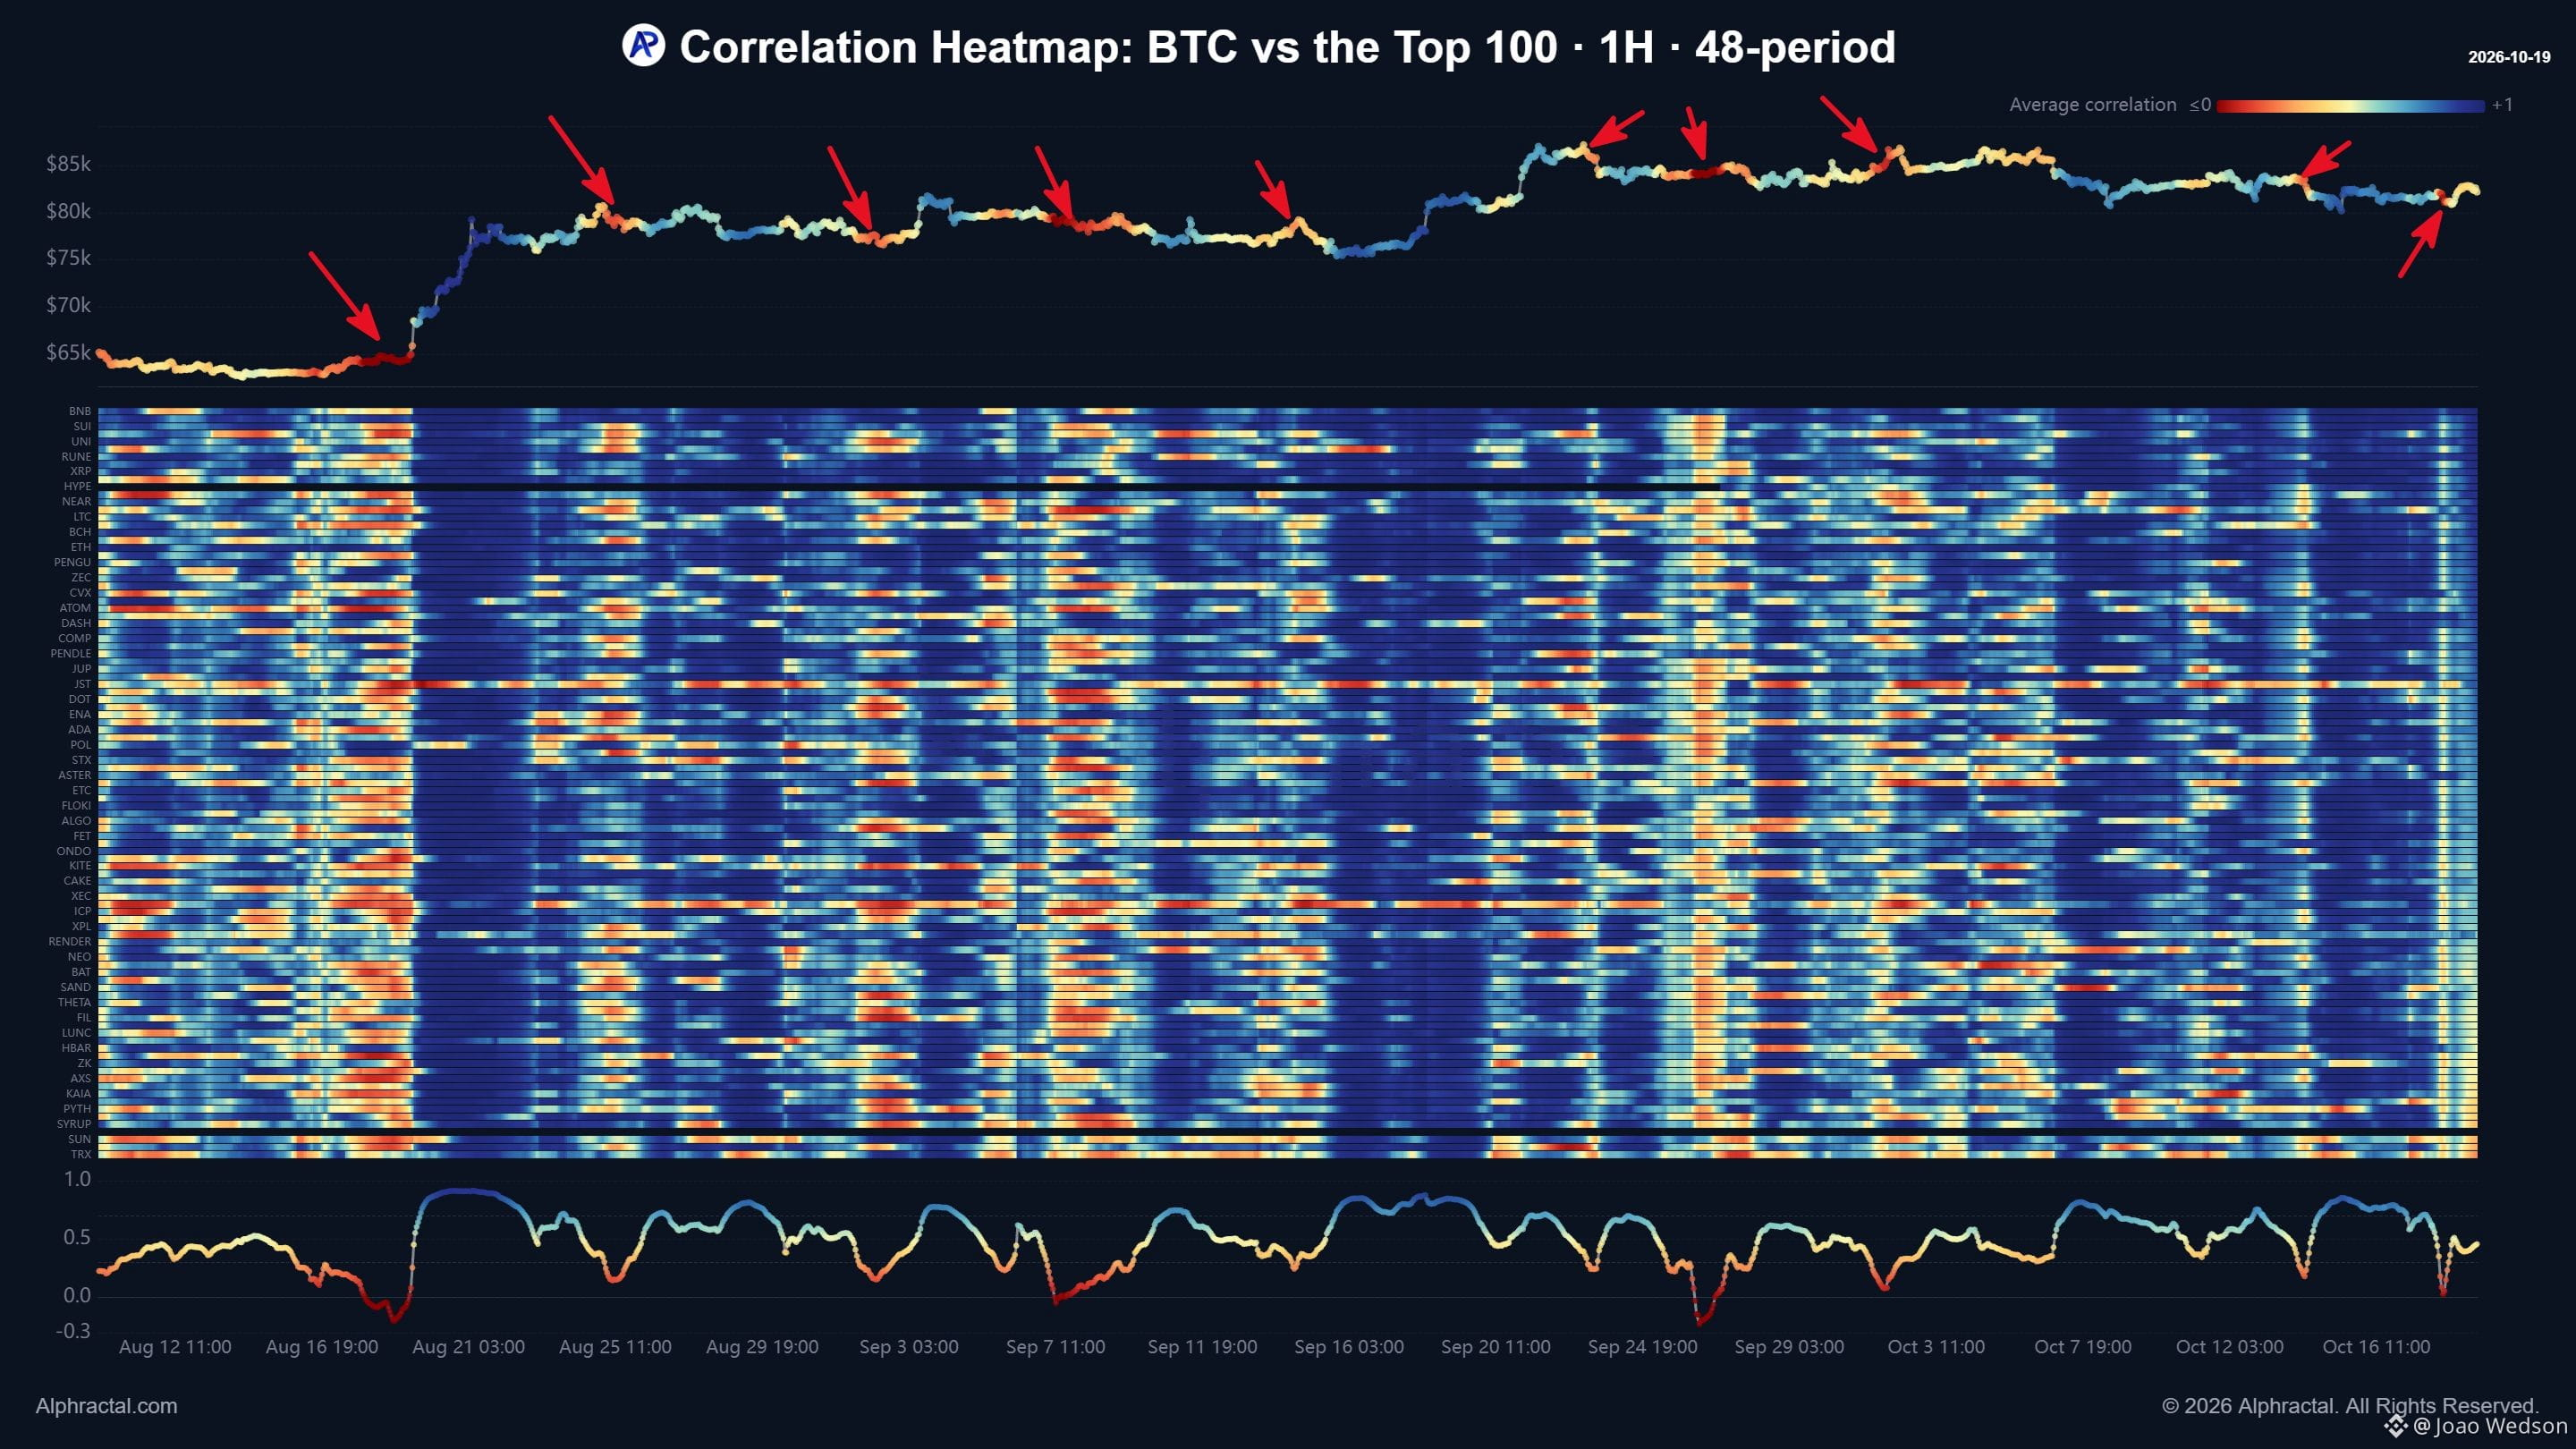
One way to anticipate major volatility in the crypto market is by analyzing Bitcoin's correlation with the top altcoins. Watch what happens when altcoins stop following Bitcoin's price movements and how the market reacts shortly afterward! These moments are relatively rare. In this case, I used the 1-hour timeframe with a 48-hour rolling correlation window, measuring the relationship over the past two days. Typically, this happens when altcoins are falling while Bitcoin is rising, or when altcoins are rising while Bitcoin is falling. These divergences are often a warning sign of major liquidation events! Alphractal is now one of the few platforms where you can explore charts like these across all timeframes, starting from just 1 minute, along with indicators such as the Altcoin Season Index! #Bitcoin $BTC
One way to anticipate major volatility in the crypto market is by analyzing Bitcoin's correlation with the top altcoins. Watch what happens when altcoins stop following Bitcoin's price movements and how the market reacts shortly afterward! These moments are relatively rare. In this case, I used the 1-hour timeframe with a 48-hour rolling correlation window, measuring the relationship over the past two days. Typically, this happens when altcoins are falling while Bitcoin is rising, or when altcoins are rising while Bitcoin is falling. These divergences are often a warning sign of major liquidation events! Alphractal is now one of the few platforms where you can explore charts like these across all timeframes, starting from just 1 minute, along with indicators such as the Altcoin Season Index! #Bitcoin $BTC
73
·
--
ဘာသာပြန်ဆိုချက် ကြည့်မည်
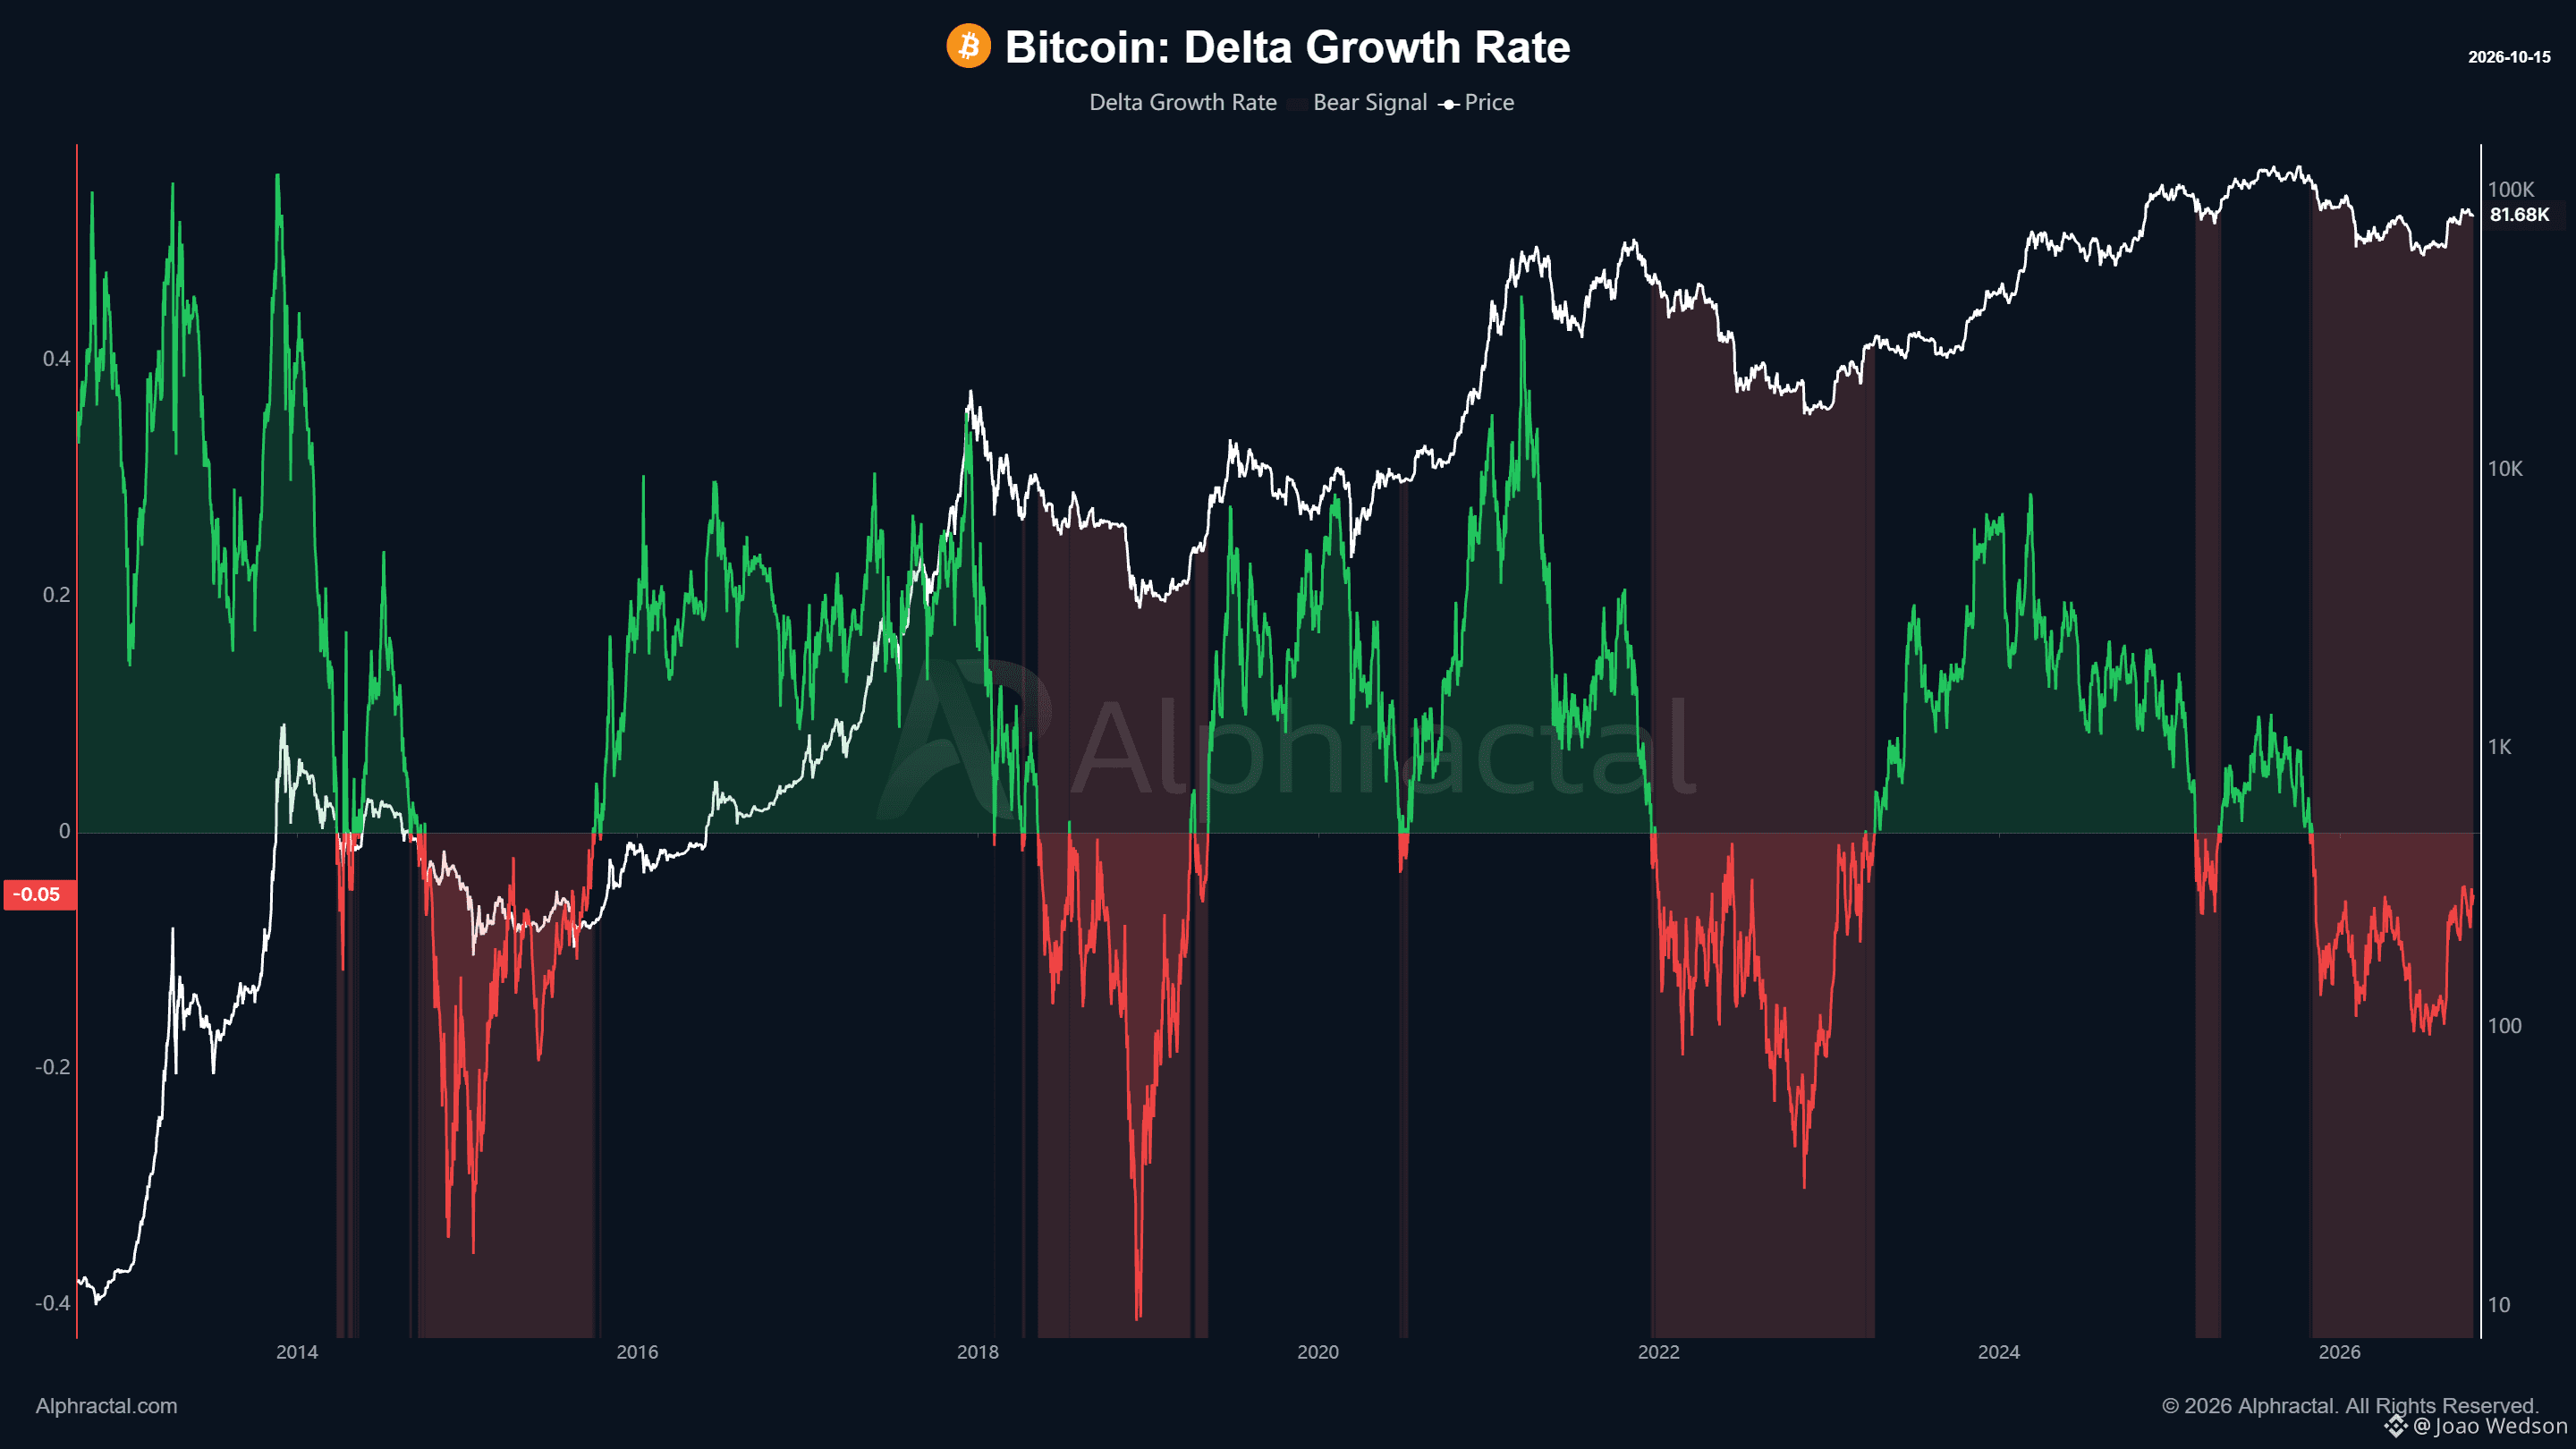
Bitcoin: Delta Growth Rate Shows Signs of Recovery! The Delta Growth Rate is a metric that combines the growth of Market Cap and Realized Cap, helping identify divergences between Bitcoin's price appreciation and the accumulation of on-chain value. Historically, negative values have been associated with periods of weaker speculative activity, accumulation, and potential undervaluation. **Currently, the indicator remains in negative territory, but it has been recovering since July 2026!** This movement suggests a gradual improvement in market dynamics, although it is still not enough to confirm a structural trend reversal. The big question now is: Will this recovery be strong enough to push the Delta Growth Rate back into positive territory? Explore this and other metrics at Alphractal $BTC #Bitcoin
Bitcoin: Delta Growth Rate Shows Signs of Recovery! The Delta Growth Rate is a metric that combines the growth of Market Cap and Realized Cap, helping identify divergences between Bitcoin's price appreciation and the accumulation of on-chain value. Historically, negative values have been associated with periods of weaker speculative activity, accumulation, and potential undervaluation. **Currently, the indicator remains in negative territory, but it has been recovering since July 2026!** This movement suggests a gradual improvement in market dynamics, although it is still not enough to confirm a structural trend reversal. The big question now is: Will this recovery be strong enough to push the Delta Growth Rate back into positive territory? Explore this and other metrics at Alphractal $BTC #Bitcoin
70
·
--
ဘာသာပြန်ဆိုချက် ကြည့်မည်
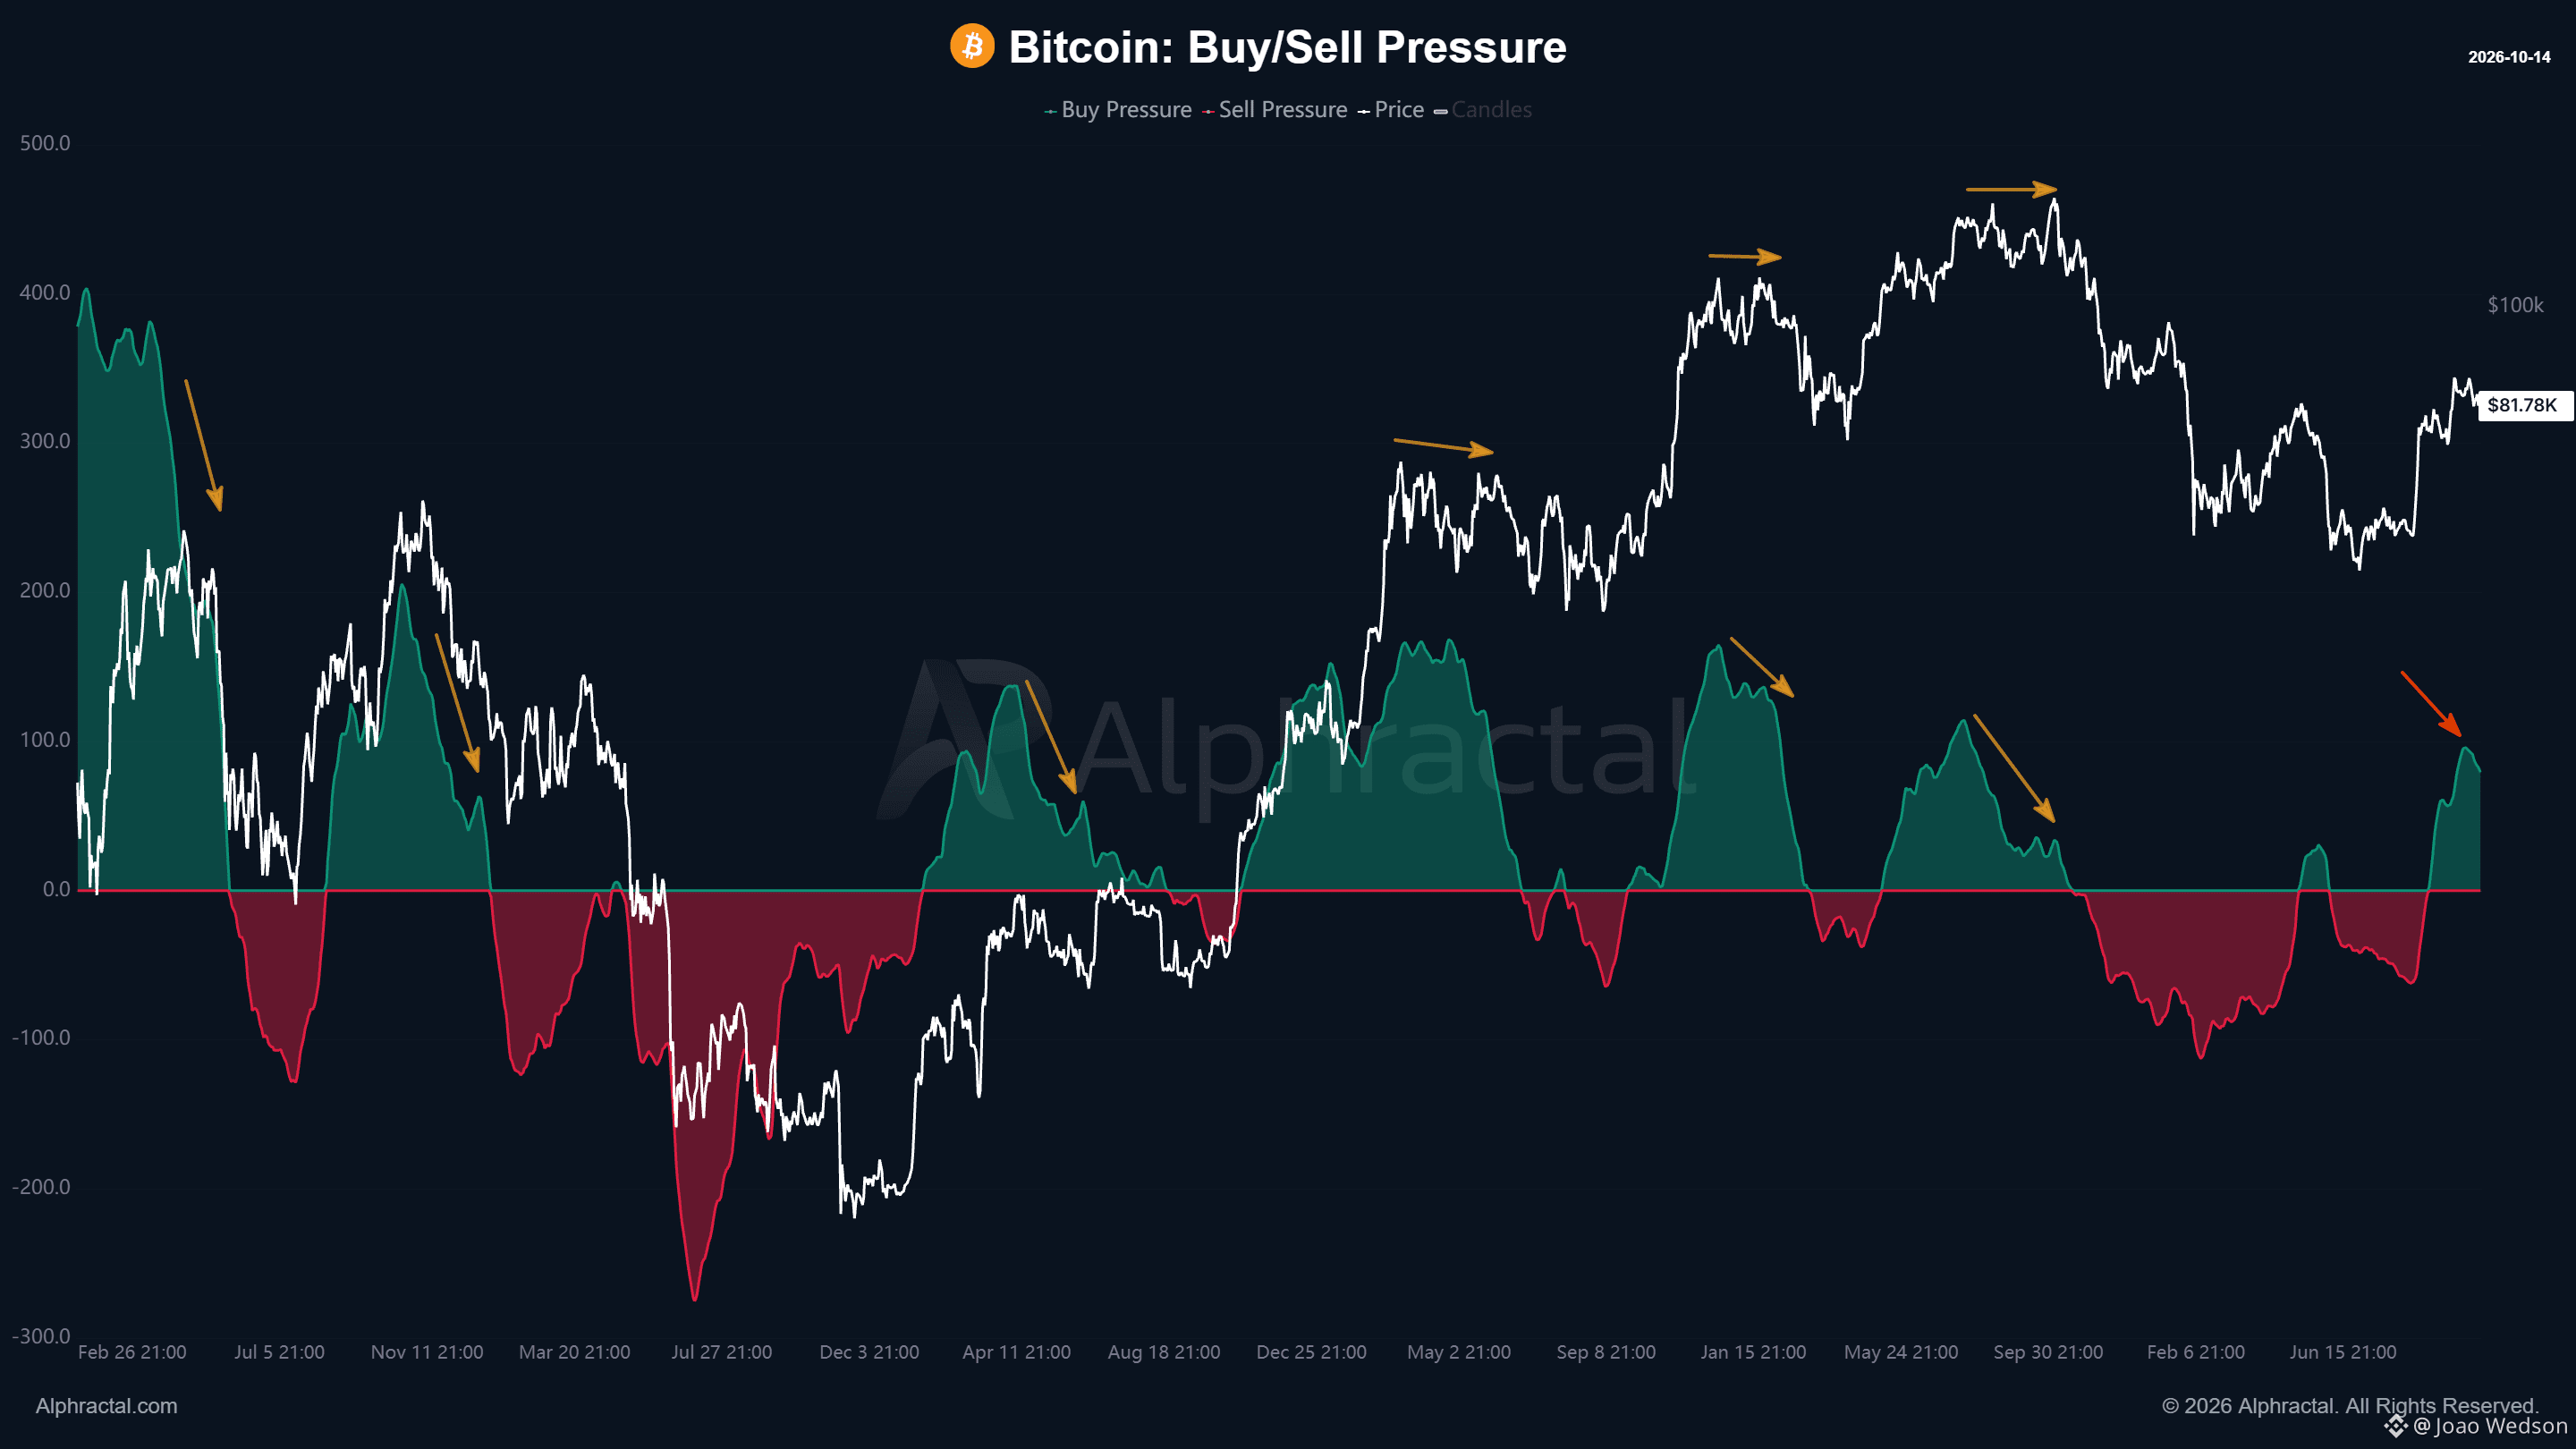
Bitcoin’s Buy/Sell Pressure Delta Shows a Slight Decline in Buying Pressure! In a bearish scenario, this metric typically continues declining for several days, eventually moving into negative territory. Interestingly, historical data reveals two recurring patterns when the Buy/Sell Pressure Delta stops rising: 1. Bitcoin's price starts to decline. 2. Bitcoin enters a consolidation phase, building a cause-and-effect structure that can eventually lead to a larger price decline. This makes the Buy/Sell Pressure Delta an excellent indicator for monitoring bullish buying momentum and identifying when bears begin taking control of the market. At the moment, the slight reduction in buying pressure is not necessarily a reason for concern. However, it is extremely important to monitor this metric closely, especially if selling pressure begins to intensify. The key question is: Are bulls simply losing momentum, or are bears preparing to take control? Don't wait until the market makes its next move! Access the Alphractal platform now and set up an alert to notify you when selling pressure increases. You can even use ChatGPT or Claude through our MCP integration to schedule automated monitoring and receive notifications when these conditions emerge. Stay ahead of the market. Let the data speak. Alphractal $BTC
Bitcoin’s Buy/Sell Pressure Delta Shows a Slight Decline in Buying Pressure! In a bearish scenario, this metric typically continues declining for several days, eventually moving into negative territory. Interestingly, historical data reveals two recurring patterns when the Buy/Sell Pressure Delta stops rising: 1. Bitcoin's price starts to decline. 2. Bitcoin enters a consolidation phase, building a cause-and-effect structure that can eventually lead to a larger price decline. This makes the Buy/Sell Pressure Delta an excellent indicator for monitoring bullish buying momentum and identifying when bears begin taking control of the market. At the moment, the slight reduction in buying pressure is not necessarily a reason for concern. However, it is extremely important to monitor this metric closely, especially if selling pressure begins to intensify. The key question is: Are bulls simply losing momentum, or are bears preparing to take control? Don't wait until the market makes its next move! Access the Alphractal platform now and set up an alert to notify you when selling pressure increases. You can even use ChatGPT or Claude through our MCP integration to schedule automated monitoring and receive notifications when these conditions emerge. Stay ahead of the market. Let the data speak. Alphractal $BTC
71
·
--
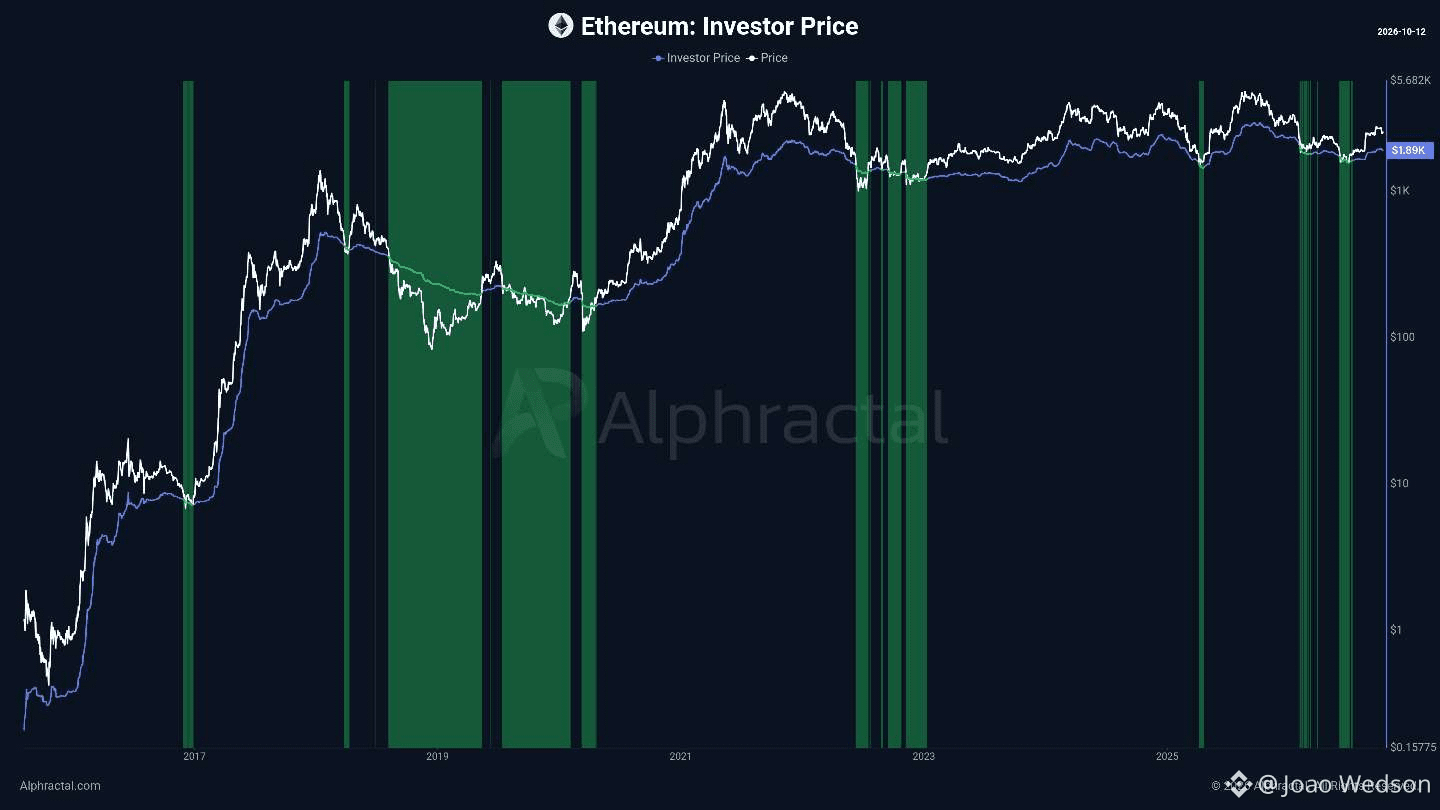
Ethereum (ETH): စောင့်ကြည့်သင့်သော အရေးကြီး On-Chain အဆင့်တစ်ခု!
Ethereum ကို မဝယ်ရသေးသူများအတွက်၊ Investor Price ကဲ့သို့သော on-chain မက်ထရစ်များကို နီးကပ်စွာ စောင့်ကြည့်ပါ။
ETH သည် နောက်ထပ် correction တစ်ကြိမ် ကြုံတွေ့ပါက၊ ဤမက်ထရစ်သည် ဖြစ်နိုင်ခြေရှိသော accumulation zone နှင့် အရေးကြီးသော ရေရှည် support level တစ်ခုကို ခွဲခြားသိမြင်ရန် ကူညီနိုင်ပါသည်။
Investor Price ဆိုတာ ဘာလဲ?
၎င်းသည် အမြဲတမ်း ပျောက်ဆုံးသွားသည်ဟု သတ်မှတ်ထားသော coin များကို ဖယ်ထုတ်ပြီး၊ စီးဆင်းနေသော economically circulating $ETH ၏ ပျမ်းမျှ ဝယ်ယူစျေးနှုန်းကို ကိုယ်စားပြုသည်။
Investor Cap ကို Adjusted Supply ဖြင့် ভাগခြင်းအားဖြင့်၊ ဤမက်ထရစ်သည် စျေးကွက်၏ aggregate cost basis ကို ပိုမိုတိကျစွာ မြင်နိုင်စေပြီး၊ ရိုးရာ Realized Price မော်ဒယ်များတွင် တွေ့ရသော distortions များကို လျှော့ချပေးသည်။
မည်သည့် မက်ထရစ်မျှ စျေးကွက်အောက်ခြေကို အာမမခံနိုင်သော်လည်း၊ Investor Price သည် ဝယ်ယူရန် အခွင့်အလမ်းများကို အကဲဖြတ်ရာတွင် တန်ဖိုးရှိသော အခြေအနေအကြောင်းအရာကို ပေးစွမ်းနိုင်သည်။
သင့် price alerts များကို သတ်မှတ်ပြီး ဒေတာများက သင့်ဆုံးဖြတ်ချက်များကို လမ်းညွှန်စေပါ။
Alphractal. com တွင် ပိုမိုလေ့လာပါ
73
·
--
ဘာသာပြန်ဆိုချက် ကြည့်မည်
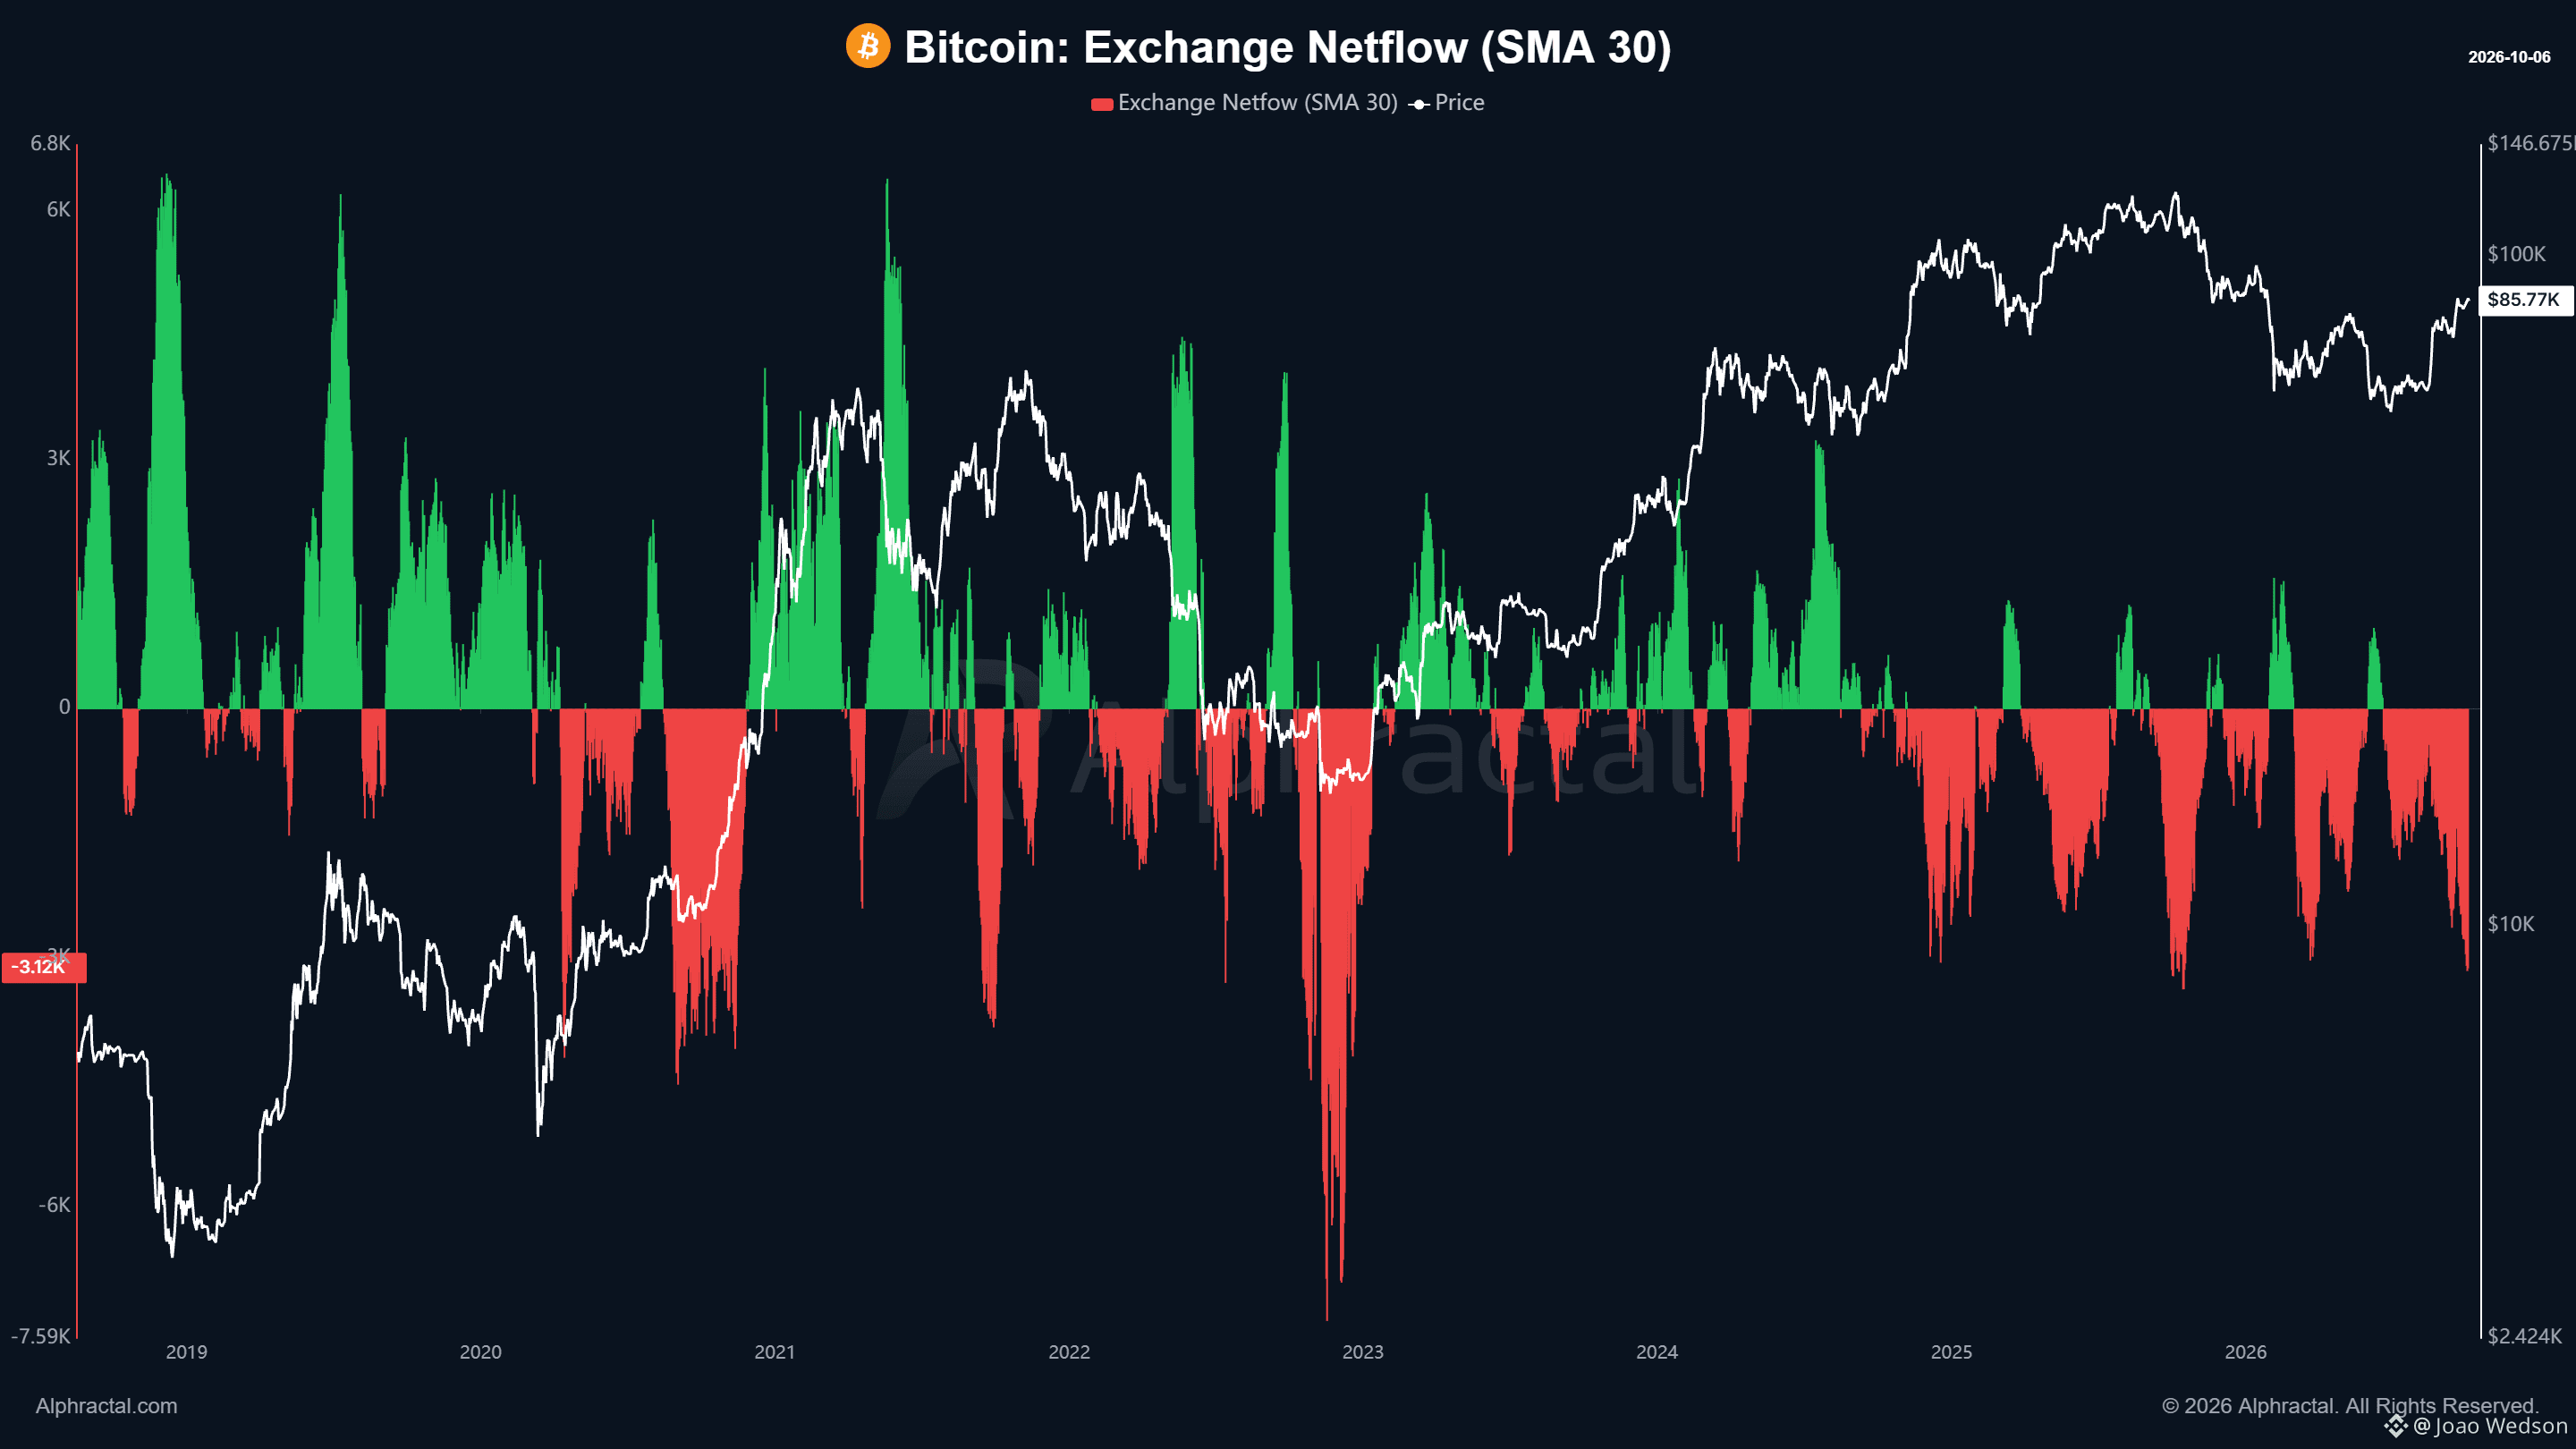
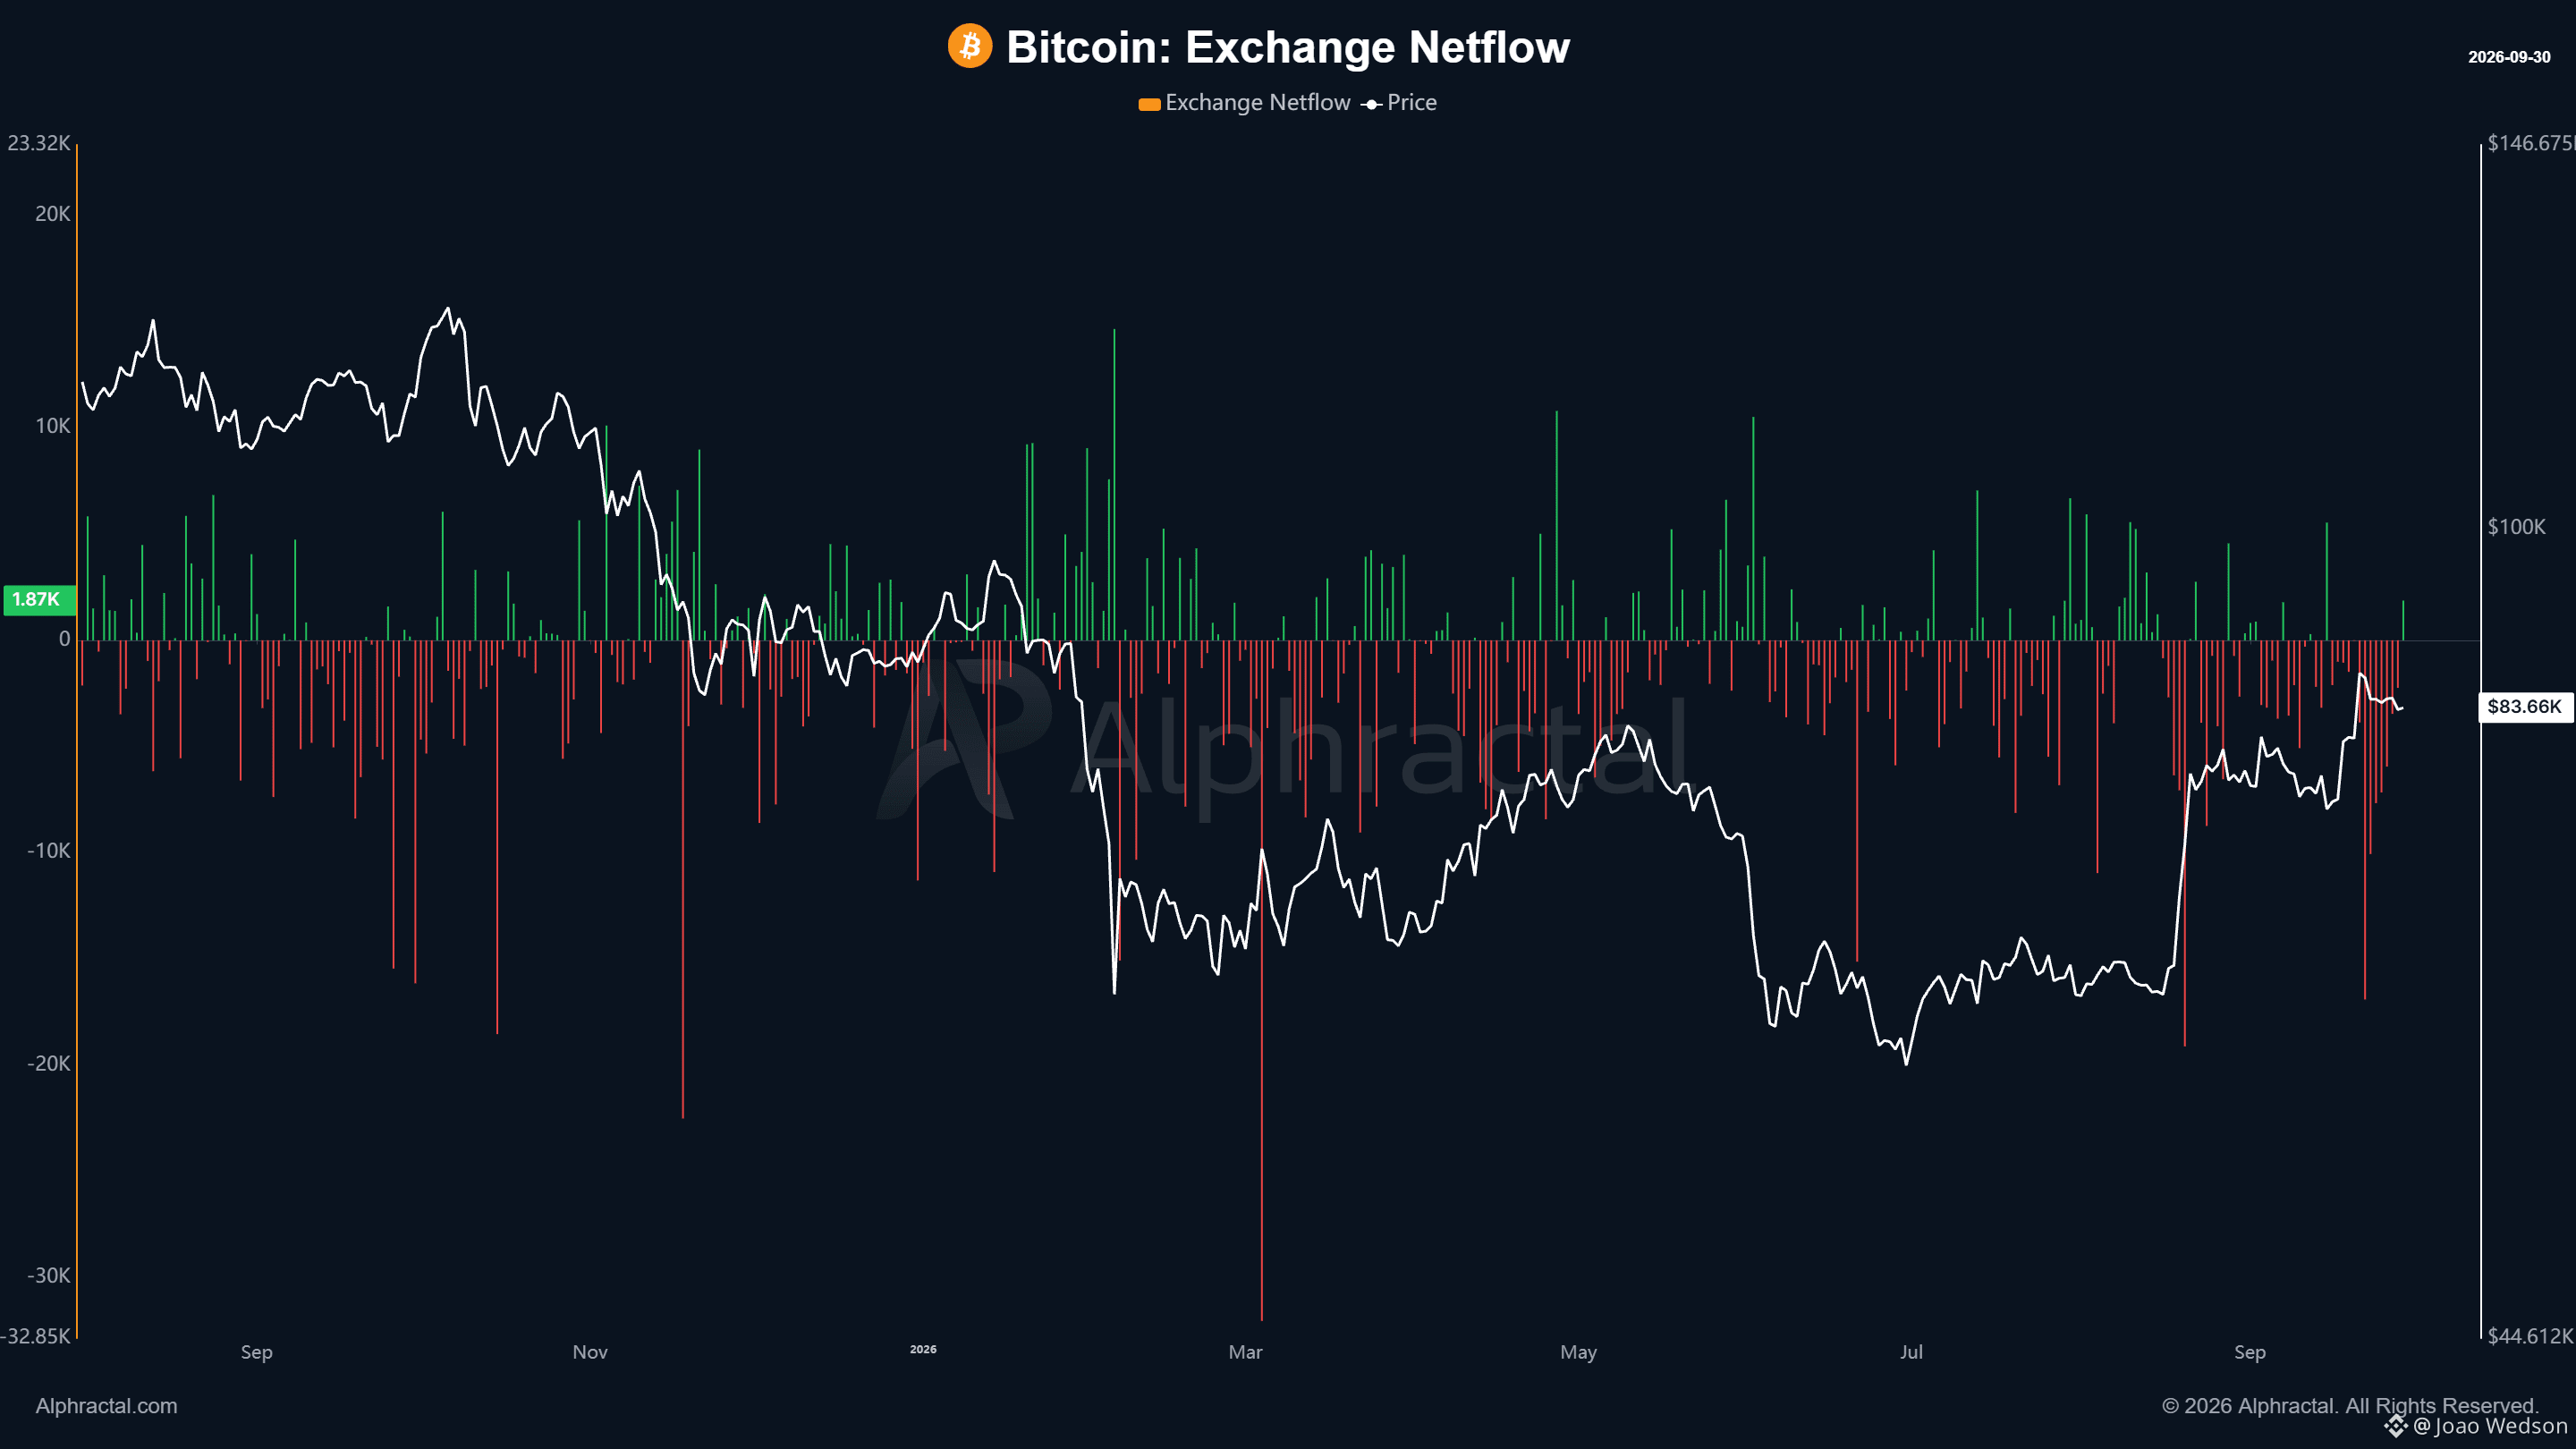
Bitcoin Exchange Netflow, based on the 30 day moving average, remains deeply negative, indicating that more BTC has been leaving exchanges than entering them recently. Negative netflows should not be interpreted as a direct signal for price appreciation. However, persistent exchange outflows are an important fundamental metric. They suggest that a significant amount of Bitcoin is being moved away from exchanges, potentially into self custody or longer term holdings, reducing the amount of BTC readily available for trading. Even after significant market volatility, investors continue to withdraw Bitcoin from exchanges. This does not define short term price direction, but it remains an important sign of long term conviction in Bitcoin. $BTC
Bitcoin Exchange Netflow, based on the 30 day moving average, remains deeply negative, indicating that more BTC has been leaving exchanges than entering them recently. Negative netflows should not be interpreted as a direct signal for price appreciation. However, persistent exchange outflows are an important fundamental metric. They suggest that a significant amount of Bitcoin is being moved away from exchanges, potentially into self custody or longer term holdings, reducing the amount of BTC readily available for trading. Even after significant market volatility, investors continue to withdraw Bitcoin from exchanges. This does not define short term price direction, but it remains an important sign of long term conviction in Bitcoin. $BTC
68
·
--
ဘာသာပြန်ဆိုချက် ကြည့်မည်
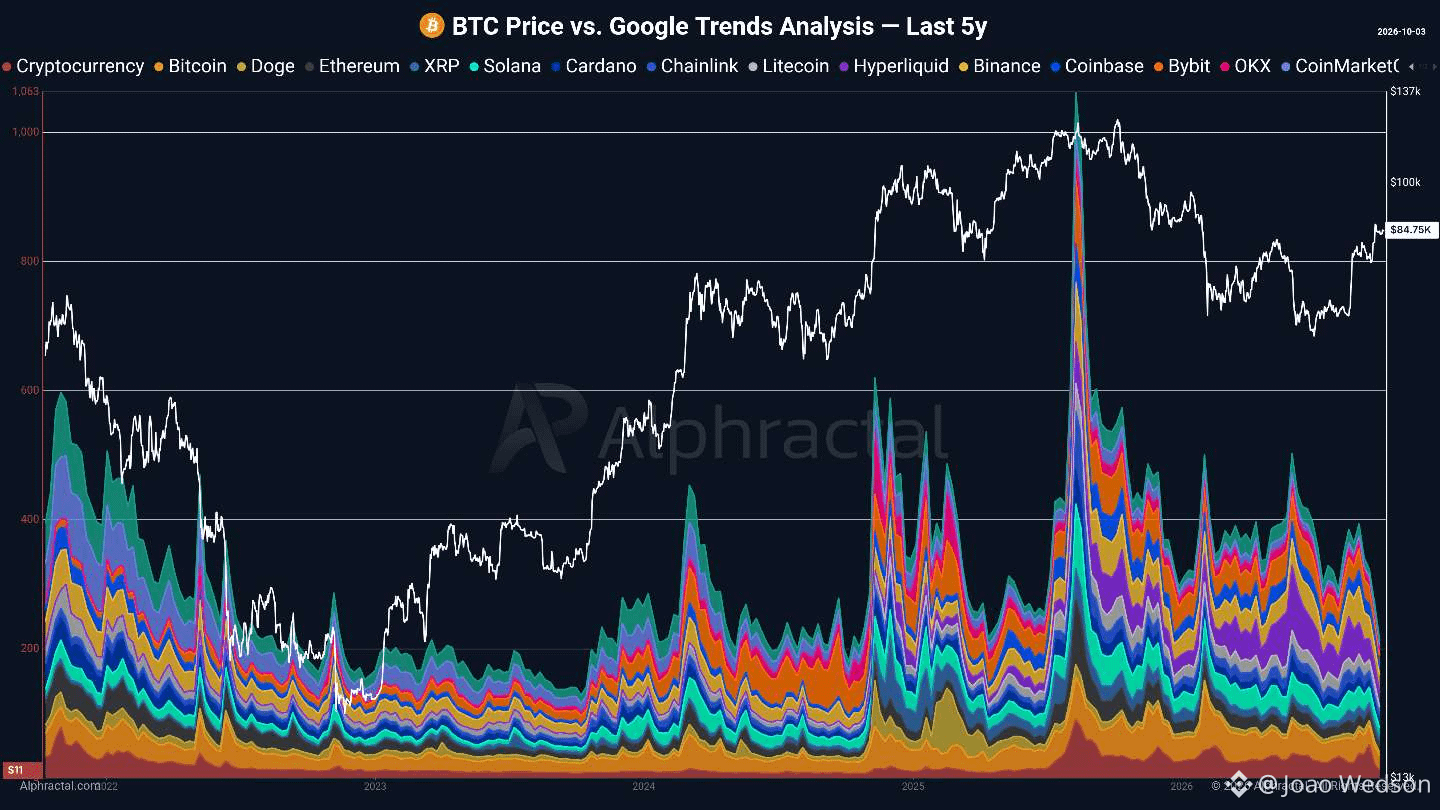
⚠️Google search interest in crypto has fallen to its lowest level since 2024.
This reflects a broader decline in retail attention across the market. Lower interest is also visible across YouTube, X, crypto news, exchanges, aggregators such as CoinMarketCap and CoinGecko, and analysis platforms such as TradingView.
For content creators, this environment usually means lower reach and weaker engagement. For platforms and exchanges, it means fewer users actively searching, trading, and exploring the market.
These periods are a real test of retail resilience.
When global attention fades, staying active becomes harder. But historically, the market does not remain interesting only when prices are rising and engagement is high.
Sometimes, the most important periods are exactly those when fewer people are paying attention.
Take advantage of Alphractal’s 50% OFF coupon
Source: Alphractal
$BTC $ETH $XRP $SOL $HYPE
75
·
--
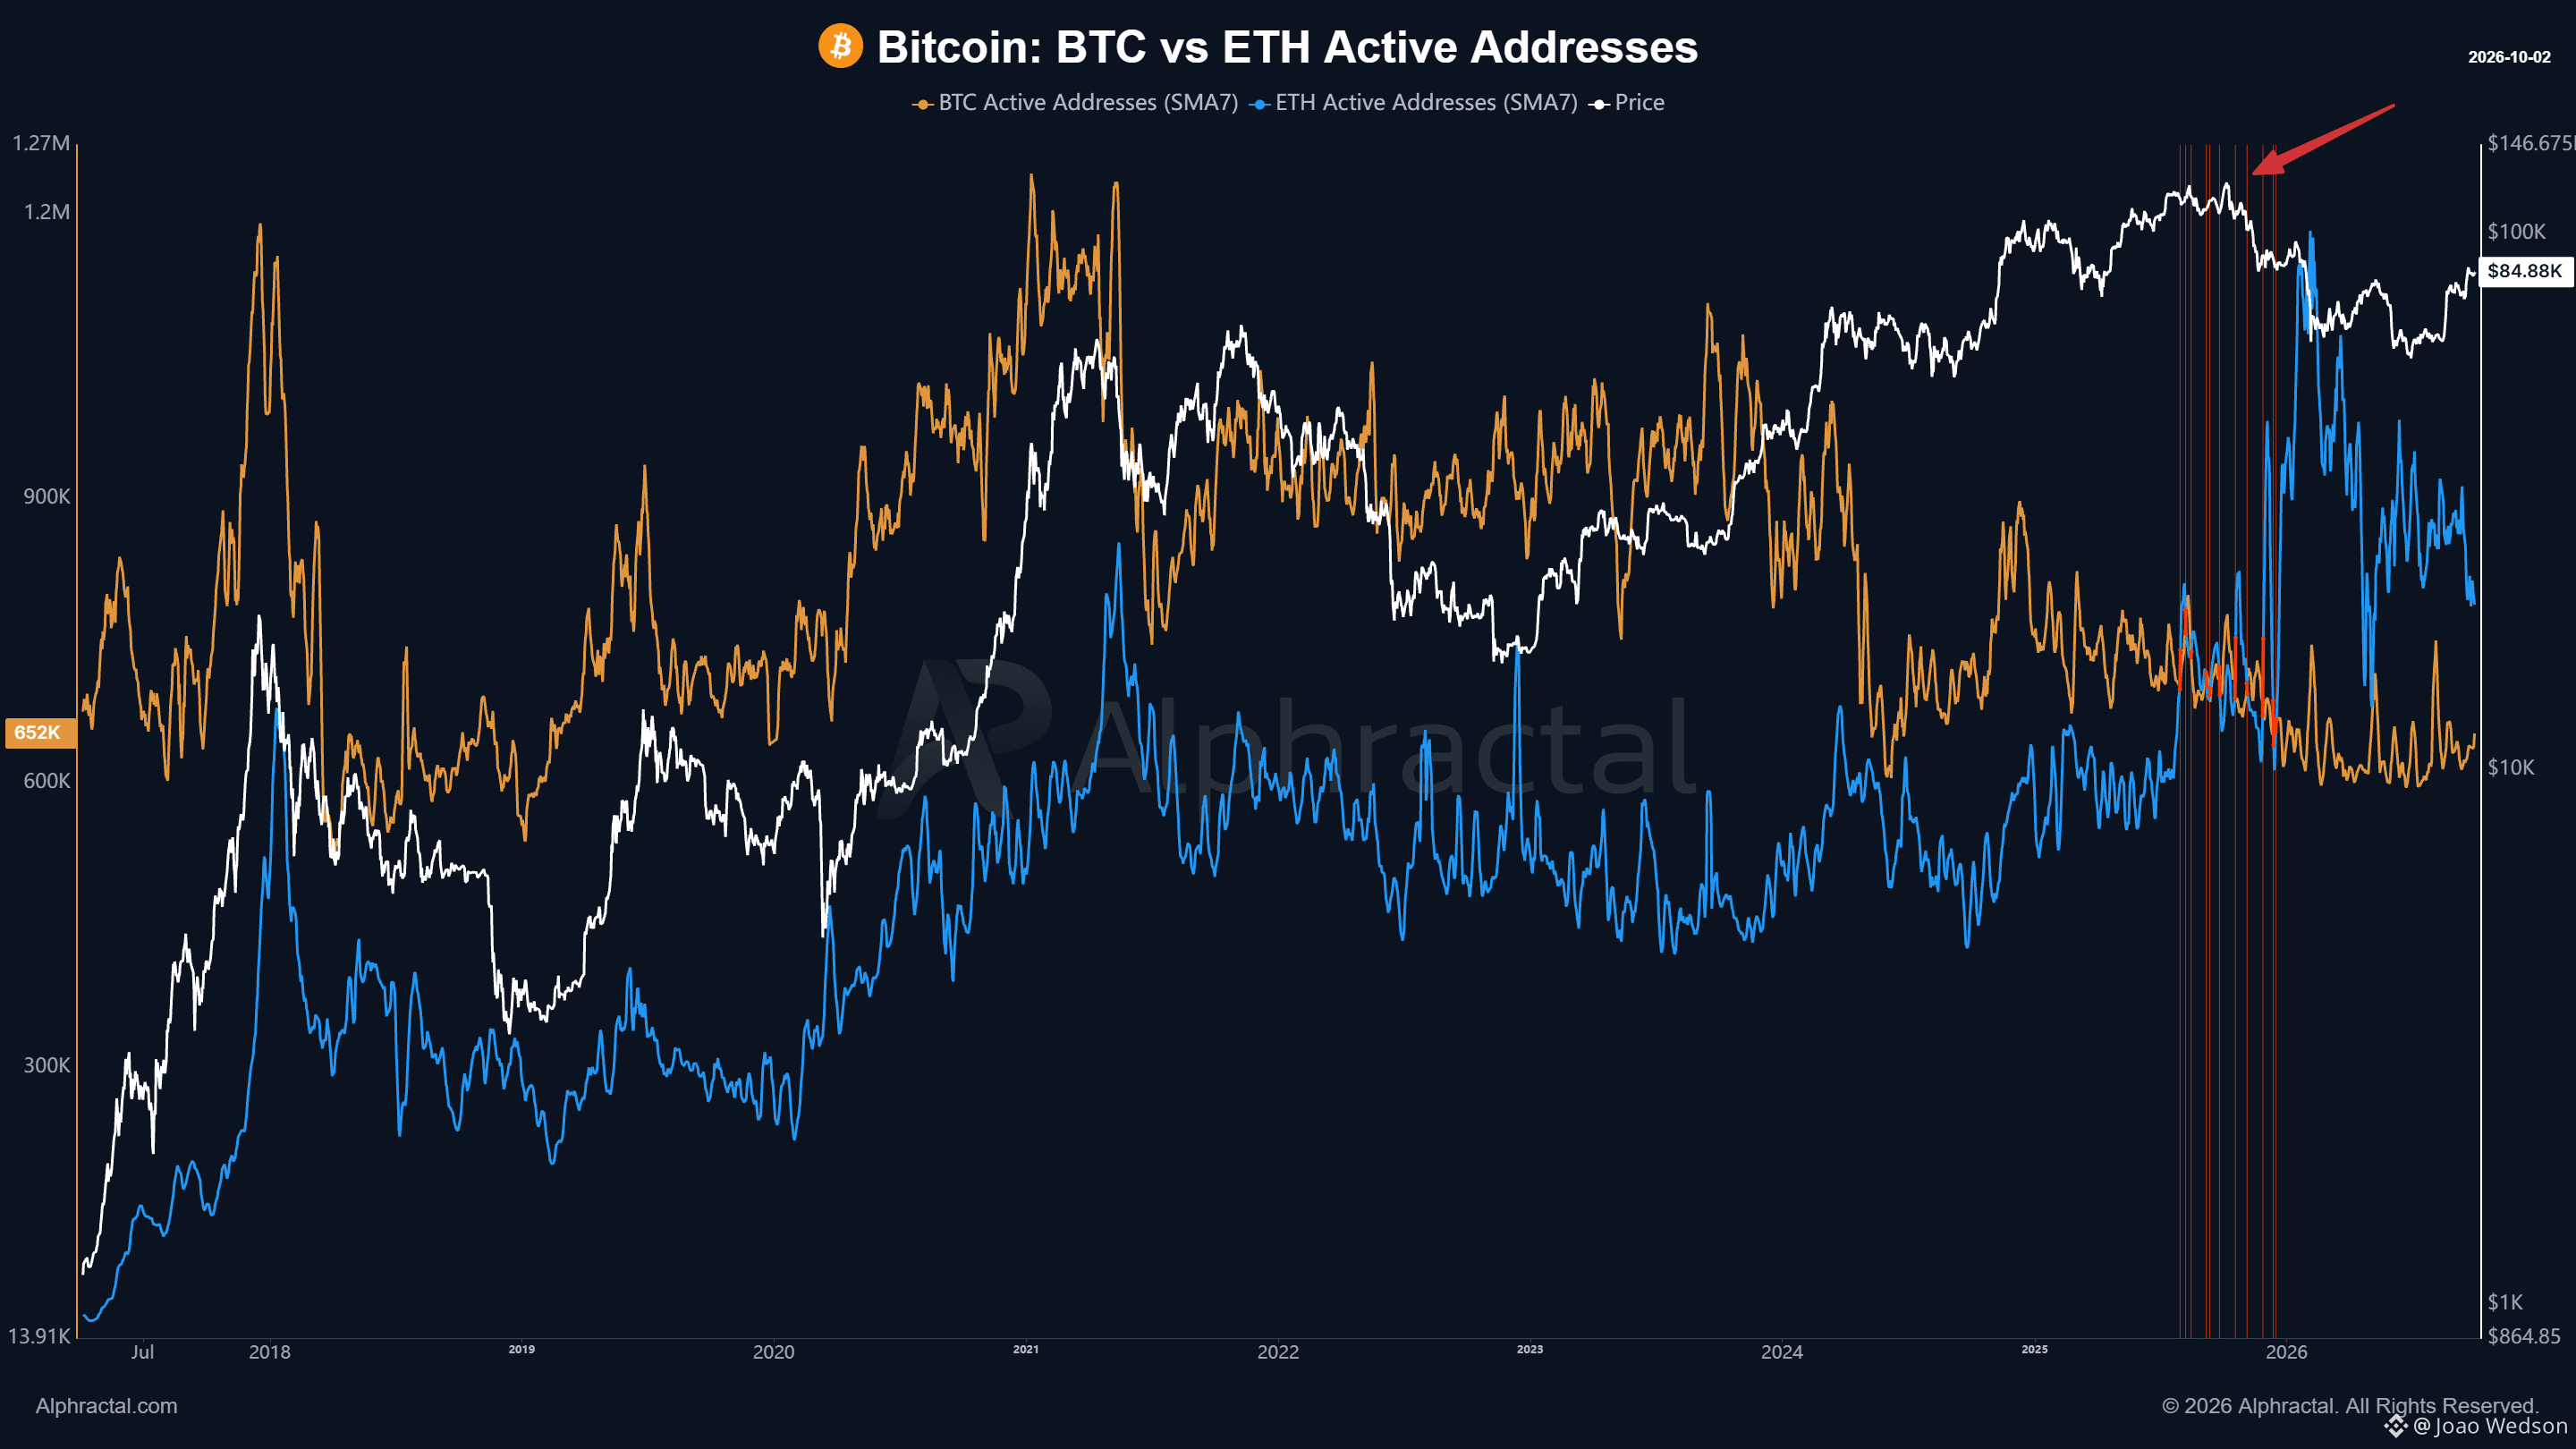
Ethereum ၏ တက်ကြွလိပ်စာအရေအတွက်သည် crypto ဈေးကွက်၏ နောက်ဆုံးအကြိမ် အမြင့်ဆုံးစံချိန်တင်ခဲ့သည့် ကာလဝန်းကျင်တွင် Bitcoin ကို ပထမဆုံးအကြိမ် ကျော်တက်ခဲ့ပြီး၊ ထိုအချိန်မှစ၍ ETH သည် BTC ထက် အမြဲမြင့်နေခဲ့သည်။ ယင်းသည် အရေးကြီးသည်၊ အကြောင်းမှာ တက်ကြွလိပ်စာအရေအတွက်သည် ကွန်ရက်တစ်ခုအတွင်း အမှန်တကယ် မည်မျှလှုပ်ရှားမှုရှိနေသည်ကို ခန့်မှန်းရန် အသုံးဝင်သော အညွှန်းတစ်ခုဖြစ်သောကြောင့် ဖြစ်သည်။ ၎င်းတို့သည် ထူးခြားသောအသုံးပြုသူများကို တိတိကျကျ ကိုယ်စားမပြုနိုင်သော်လည်း ဂေဟစနစ်များအကြား ပါဝင်မှု၊ ငွေလွှဲပြောင်းမှုဆိုင်ရာ လှုပ်ရှားမှုနှင့် စိတ်ဝင်စားမှုတို့ ပြောင်းလဲပုံကို ဖော်ထုတ်ရာတွင် အထောက်အကူပြုသည်။ ထို့ကြောင့် အပြန်အလှန်ကျော်တက်မှုသည် အရေးပါသော အပြောင်းအလဲတစ်ခုကို ပြသခဲ့သည်။ Bitcoin သည် စံချိန်တင်ဈေးနှုန်းများအနီးတွင် အရောင်းအဝယ်ဖြစ်နေစဉ် Ethereum ၏ ကွင်းဆက်ပေါ် လှုပ်ရှားမှုသည် သိသိသာသာ တိုးချဲ့လာခဲ့သည်။ ယခုအခါ အခြေအနေသည် တစ်ဖန် ပြောင်းလဲလာနေသည်။ Bitcoin ၏ တက်ကြွလိပ်စာအရေအတွက်သည် လတ်တလောအပိုင်းအခြားအတွင်း အတော်အတန် တည်ငြိမ်နေသော်လည်း၊ ETH ကို $BTC ထက် ကျော်တက်စေခဲ့သည့် အားကောင်းသော တိုးချဲ့မှုနောက်ပိုင်း Ethereum ၏ တက်ကြွလိပ်စာအရေအတွက်မှာ ကျဆင်းလာသည်။ Ethereum သည် ရှေ့တွင်ရှိနေဆဲဖြစ်သော်လည်း၊ ထိုလှုပ်ရှားမှုနောက်ကွယ်မှ အရှိန်အဟုန်မှာ သိသိသာသာ အားလျော့လာနေသည်။ အဓိကမေးခွန်းမှာ $ETH တွင် BTC ထက် တက်ကြွလိပ်စာ ပိုများသလားဆိုသည်သာ မဟုတ်ပါ။ Bitcoin တည်ငြိမ်နေစဉ် Ethereum သည် ဤမြင့်မားနေသော ကွန်ရက်လှုပ်ရှားမှုအဆင့်ကို ဆက်လက်ထိန်းထားနိုင်မလားဆိုသည်က အဓိကဖြစ်သည်။ ပထမဆုံး အပြန်အလှန်ကျော်တက်မှုသည် ဈေးကွက်အမြင့်ဆုံးအဆင့်များအနီးတွင် ဖြစ်ပွားခဲ့သည်။ ယခုအခါ ETH ၏ လှုပ်ရှားမှုအရှိန်အဟုန်မှာ အားလျော့လာနေသည်။ ဤကွာဟချက်ကို အနီးကပ် စောင့်ကြည့်သင့်သည်။
Ethereum ၏ တက်ကြွလိပ်စာအရေအတွက်သည် crypto ဈေးကွက်၏ နောက်ဆုံးအကြိမ် အမြင့်ဆုံးစံချိန်တင်ခဲ့သည့် ကာလဝန်းကျင်တွင် Bitcoin ကို ပထမဆုံးအကြိမ် ကျော်တက်ခဲ့ပြီး၊ ထိုအချိန်မှစ၍ ETH သည် BTC ထက် အမြဲမြင့်နေခဲ့သည်။ ယင်းသည် အရေးကြီးသည်၊ အကြောင်းမှာ တက်ကြွလိပ်စာအရေအတွက်သည် ကွန်ရက်တစ်ခုအတွင်း အမှန်တကယ် မည်မျှလှုပ်ရှားမှုရှိနေသည်ကို ခန့်မှန်းရန် အသုံးဝင်သော အညွှန်းတစ်ခုဖြစ်သောကြောင့် ဖြစ်သည်။ ၎င်းတို့သည် ထူးခြားသောအသုံးပြုသူများကို တိတိကျကျ ကိုယ်စားမပြုနိုင်သော်လည်း ဂေဟစနစ်များအကြား ပါဝင်မှု၊ ငွေလွှဲပြောင်းမှုဆိုင်ရာ လှုပ်ရှားမှုနှင့် စိတ်ဝင်စားမှုတို့ ပြောင်းလဲပုံကို ဖော်ထုတ်ရာတွင် အထောက်အကူပြုသည်။ ထို့ကြောင့် အပြန်အလှန်ကျော်တက်မှုသည် အရေးပါသော အပြောင်းအလဲတစ်ခုကို ပြသခဲ့သည်။ Bitcoin သည် စံချိန်တင်ဈေးနှုန်းများအနီးတွင် အရောင်းအဝယ်ဖြစ်နေစဉ် Ethereum ၏ ကွင်းဆက်ပေါ် လှုပ်ရှားမှုသည် သိသိသာသာ တိုးချဲ့လာခဲ့သည်။ ယခုအခါ အခြေအနေသည် တစ်ဖန် ပြောင်းလဲလာနေသည်။ Bitcoin ၏ တက်ကြွလိပ်စာအရေအတွက်သည် လတ်တလောအပိုင်းအခြားအတွင်း အတော်အတန် တည်ငြိမ်နေသော်လည်း၊ ETH ကို $BTC ထက် ကျော်တက်စေခဲ့သည့် အားကောင်းသော တိုးချဲ့မှုနောက်ပိုင်း Ethereum ၏ တက်ကြွလိပ်စာအရေအတွက်မှာ ကျဆင်းလာသည်။ Ethereum သည် ရှေ့တွင်ရှိနေဆဲဖြစ်သော်လည်း၊ ထိုလှုပ်ရှားမှုနောက်ကွယ်မှ အရှိန်အဟုန်မှာ သိသိသာသာ အားလျော့လာနေသည်။ အဓိကမေးခွန်းမှာ $ETH တွင် BTC ထက် တက်ကြွလိပ်စာ ပိုများသလားဆိုသည်သာ မဟုတ်ပါ။ Bitcoin တည်ငြိမ်နေစဉ် Ethereum သည် ဤမြင့်မားနေသော ကွန်ရက်လှုပ်ရှားမှုအဆင့်ကို ဆက်လက်ထိန်းထားနိုင်မလားဆိုသည်က အဓိကဖြစ်သည်။ ပထမဆုံး အပြန်အလှန်ကျော်တက်မှုသည် ဈေးကွက်အမြင့်ဆုံးအဆင့်များအနီးတွင် ဖြစ်ပွားခဲ့သည်။ ယခုအခါ ETH ၏ လှုပ်ရှားမှုအရှိန်အဟုန်မှာ အားလျော့လာနေသည်။ ဤကွာဟချက်ကို အနီးကပ် စောင့်ကြည့်သင့်သည်။
66
·
--
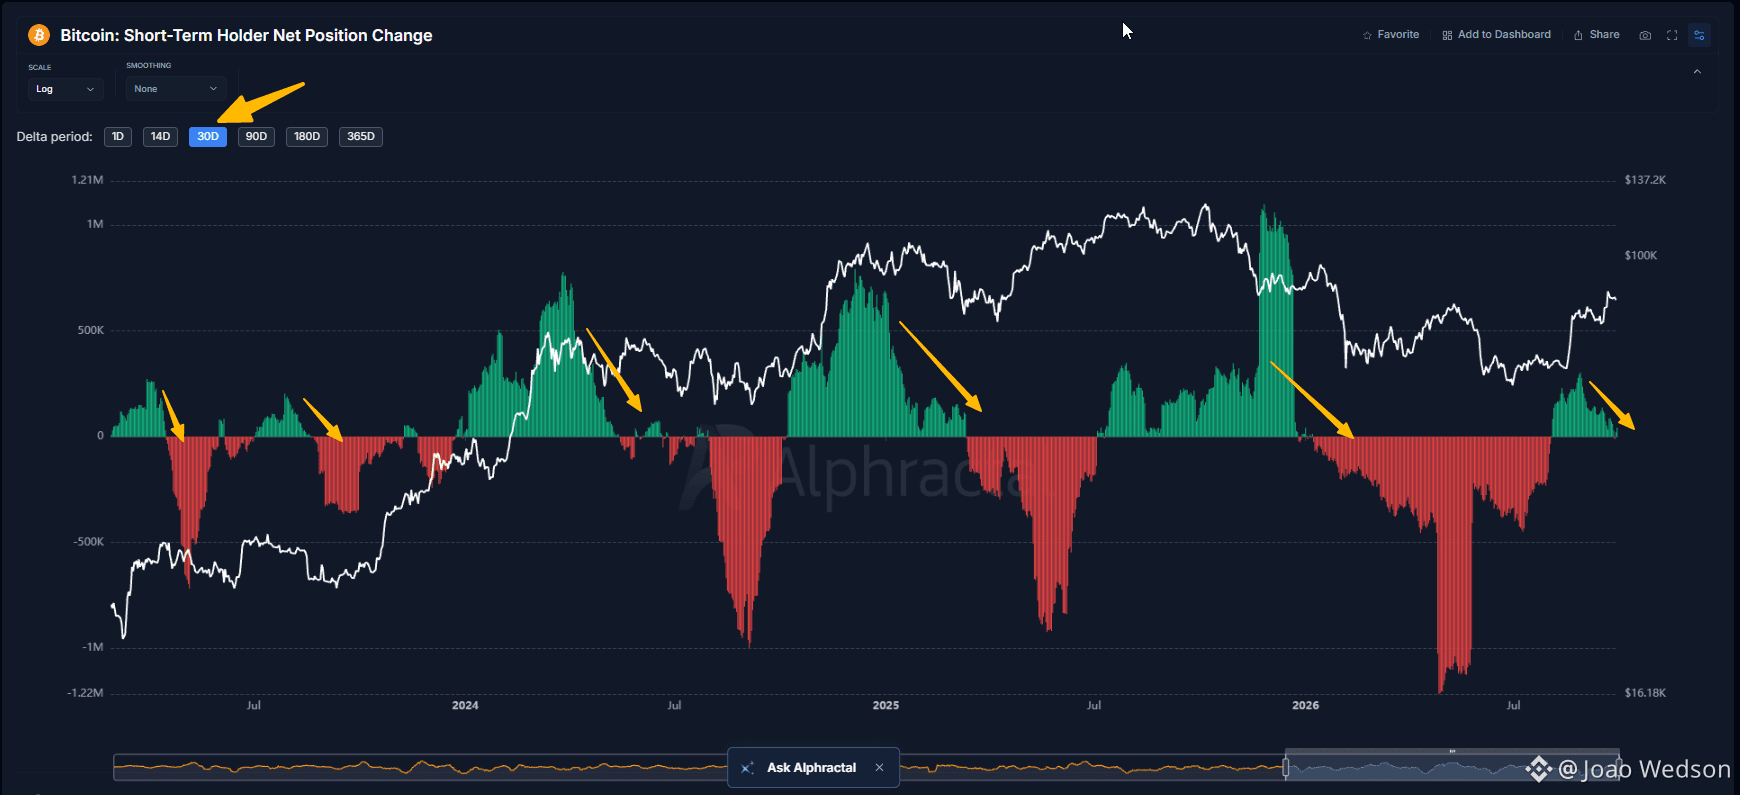
ကာလတိုကိုင်ဆောင်သူများ၏ အရှိန်အဟုန်သည် ထပ်မံအားပျော့လာနေသည်။ ရက် ၃၀ ကာလတိုကိုင်ဆောင်သူများ၏ အသားတင်ပိုင်ဆိုင်မှုပြောင်းလဲမှုသည် ယခုအခါ အနုတ်လက္ခဏာနယ်မြေနှင့် အလွန်နီးကပ်နေပြီဖြစ်သည်။ ဆိုလိုသည်မှာ လွန်ခဲ့သော ရက် ၃၀ ကကဲ့သို့ STH များသည် တူညီသောနှုန်းဖြင့် စုဆောင်းဝယ်ယူနေခြင်း မရှိတော့ပါ။ ယင်းက ဝယ်လိုအားဖိအား အားနည်းလာခြင်း သို့မဟုတ် စုစည်းတည်ငြိမ်သည့်ကာလ ပိုမိုရှည်ကြာလာခြင်းကို ညွှန်ပြနိုင်သည်။ ဤညွှန်းကိန်းသည် အနုတ်လက္ခဏာဘက်သို့ နက်ရှိုင်းစွာ ပြောင်းလဲသွားပါက ဈေးနှုန်းအကျဘက်သို့ ပိုမိုမြန်ဆန်သော ရွေ့လျားမှုများ မဖြစ်မီတွင်လည်း ဖြစ်ပေါ်တတ်သောကြောင့် Exchange Netflow သည် ဤနေရာတွင် အရေးကြီးလာသည်။ လောလောဆယ်တွင် BTC သည် အိတ်ချိန်းများသို့ သိသာထင်ရှားစွာ ဝင်ရောက်လာခြင်းကို မတွေ့ရသေးသဖြင့် အချက်ပြမှုသည် အတော်အတန် ကြားနေအနေအထားတွင် ရှိနေသည်။ Onchain အချက်အလက်များသည် ဈေးကွက်အကြောင်းအရာနှင့် သုံးသပ်ချက်များ လိုက်မီမလာမီ ဤပြောင်းလဲမှုများကို အများအားဖြင့် စတင်ပြသတတ်သည်။ အတက်ဘက် သို့မဟုတ် အကျဘက်ဟု စောစီးစွာ မဆုံးဖြတ်ဘဲ ဒေတာကို လိုက်လံစောင့်ကြည့်ခြင်းက ပိုကောင်းသည်။ $BTC
ကာလတိုကိုင်ဆောင်သူများ၏ အရှိန်အဟုန်သည် ထပ်မံအားပျော့လာနေသည်။ ရက် ၃၀ ကာလတိုကိုင်ဆောင်သူများ၏ အသားတင်ပိုင်ဆိုင်မှုပြောင်းလဲမှုသည် ယခုအခါ အနုတ်လက္ခဏာနယ်မြေနှင့် အလွန်နီးကပ်နေပြီဖြစ်သည်။ ဆိုလိုသည်မှာ လွန်ခဲ့သော ရက် ၃၀ ကကဲ့သို့ STH များသည် တူညီသောနှုန်းဖြင့် စုဆောင်းဝယ်ယူနေခြင်း မရှိတော့ပါ။ ယင်းက ဝယ်လိုအားဖိအား အားနည်းလာခြင်း သို့မဟုတ် စုစည်းတည်ငြိမ်သည့်ကာလ ပိုမိုရှည်ကြာလာခြင်းကို ညွှန်ပြနိုင်သည်။ ဤညွှန်းကိန်းသည် အနုတ်လက္ခဏာဘက်သို့ နက်ရှိုင်းစွာ ပြောင်းလဲသွားပါက ဈေးနှုန်းအကျဘက်သို့ ပိုမိုမြန်ဆန်သော ရွေ့လျားမှုများ မဖြစ်မီတွင်လည်း ဖြစ်ပေါ်တတ်သောကြောင့် Exchange Netflow သည် ဤနေရာတွင် အရေးကြီးလာသည်။ လောလောဆယ်တွင် BTC သည် အိတ်ချိန်းများသို့ သိသာထင်ရှားစွာ ဝင်ရောက်လာခြင်းကို မတွေ့ရသေးသဖြင့် အချက်ပြမှုသည် အတော်အတန် ကြားနေအနေအထားတွင် ရှိနေသည်။ Onchain အချက်အလက်များသည် ဈေးကွက်အကြောင်းအရာနှင့် သုံးသပ်ချက်များ လိုက်မီမလာမီ ဤပြောင်းလဲမှုများကို အများအားဖြင့် စတင်ပြသတတ်သည်။ အတက်ဘက် သို့မဟုတ် အကျဘက်ဟု စောစီးစွာ မဆုံးဖြတ်ဘဲ ဒေတာကို လိုက်လံစောင့်ကြည့်ခြင်းက ပိုကောင်းသည်။ $BTC
65
·
--
ဘာသာပြန်ဆိုချက် ကြည့်မည်
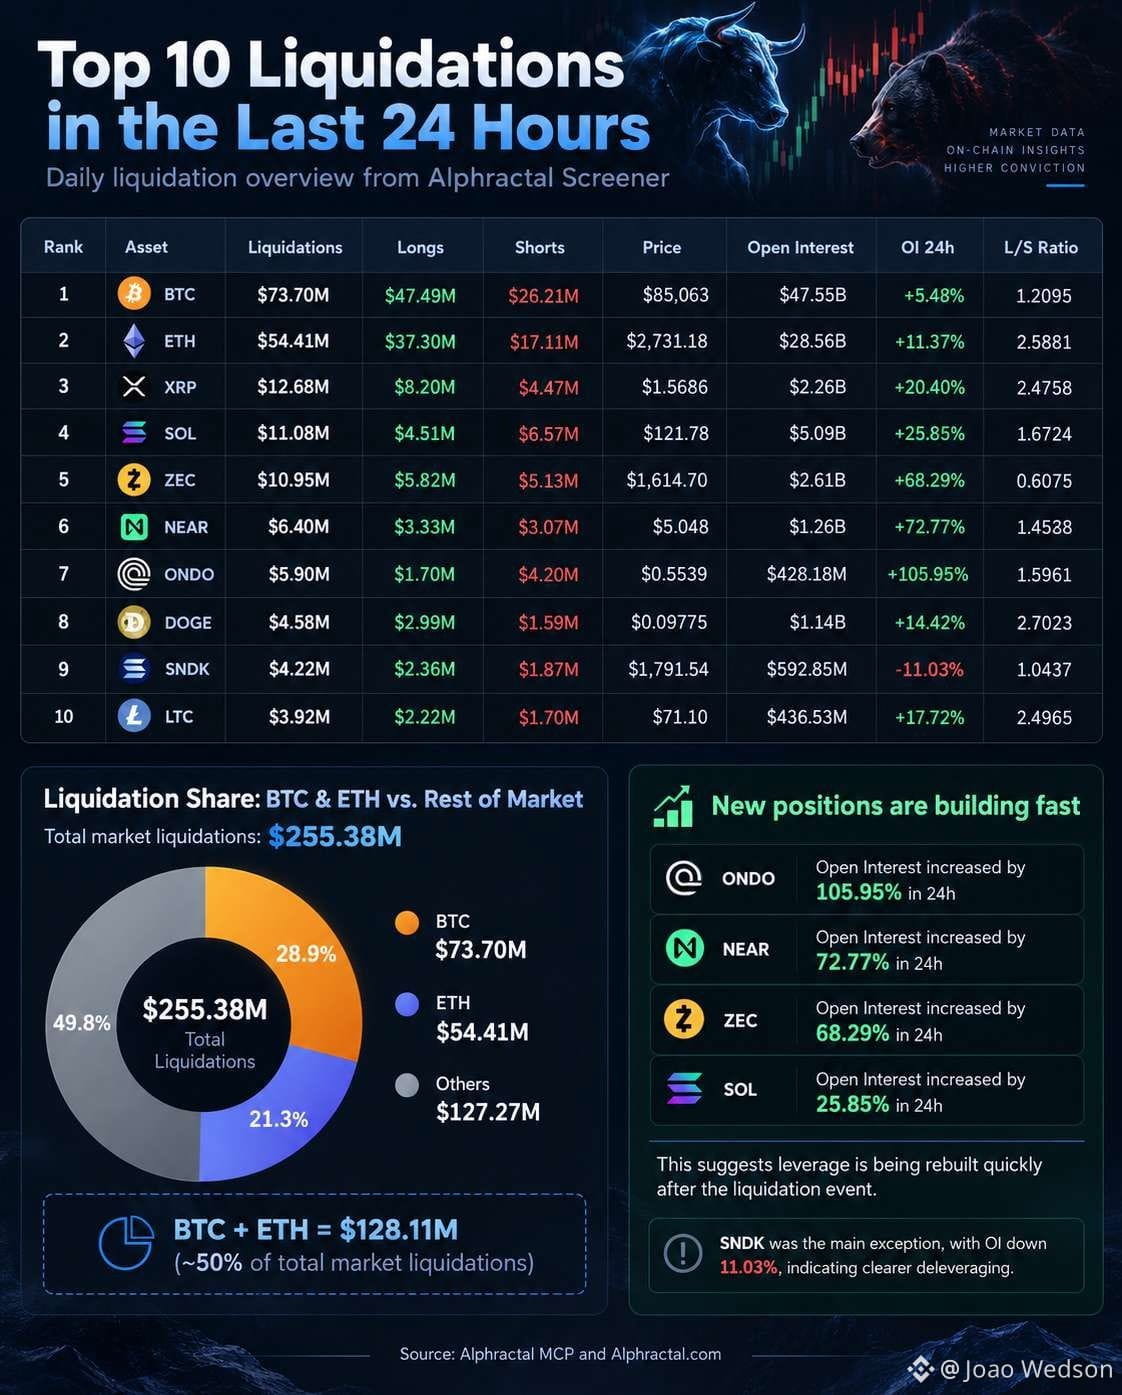
A practical example of using the Alphractal MCP with the ChatGPT scheduler.
This can be configured to run daily, every hour, or at any frequency you need.
In this example, the system automatically pulled data from the Alphractal Screener, organized the Top 10 liquidations, generated the analysis, and turned everything into an image ready to publish.
Over the last 24 hours, the market recorded $255.38M in liquidations.
$BTC alone accounted for $73.70M, while $ETH accounted for $54.41M, totaling $128.11M, around 50% of all market liquidations.
This shows how BTC and ETH continue to concentrate a significant share of market leverage and liquidation activity.
At the same time, one of the most interesting signals came from the sharp increase in Open Interest across several altcoins:
$ONDO: +105.95%
$NEAR: +72.77%
$ZEC: +68.29%
$SOL: +25.85%
All within the last 24 hours.
Even after significant liquidation events, new positions are being opened aggressively across several assets, suggesting that leverage is being rebuilt very quickly.
And here is the interesting part:
Both the image and this analysis were generated using the Alphractal MCP through the ChatGPT scheduler.
A practical use case for frequent market updates, automated analysis, content generation, and market monitoring using structured Alphractal data.
🔥 Only 4 days left to get 50% OFF all Alphractal plans!
Get access now!
59
·
--
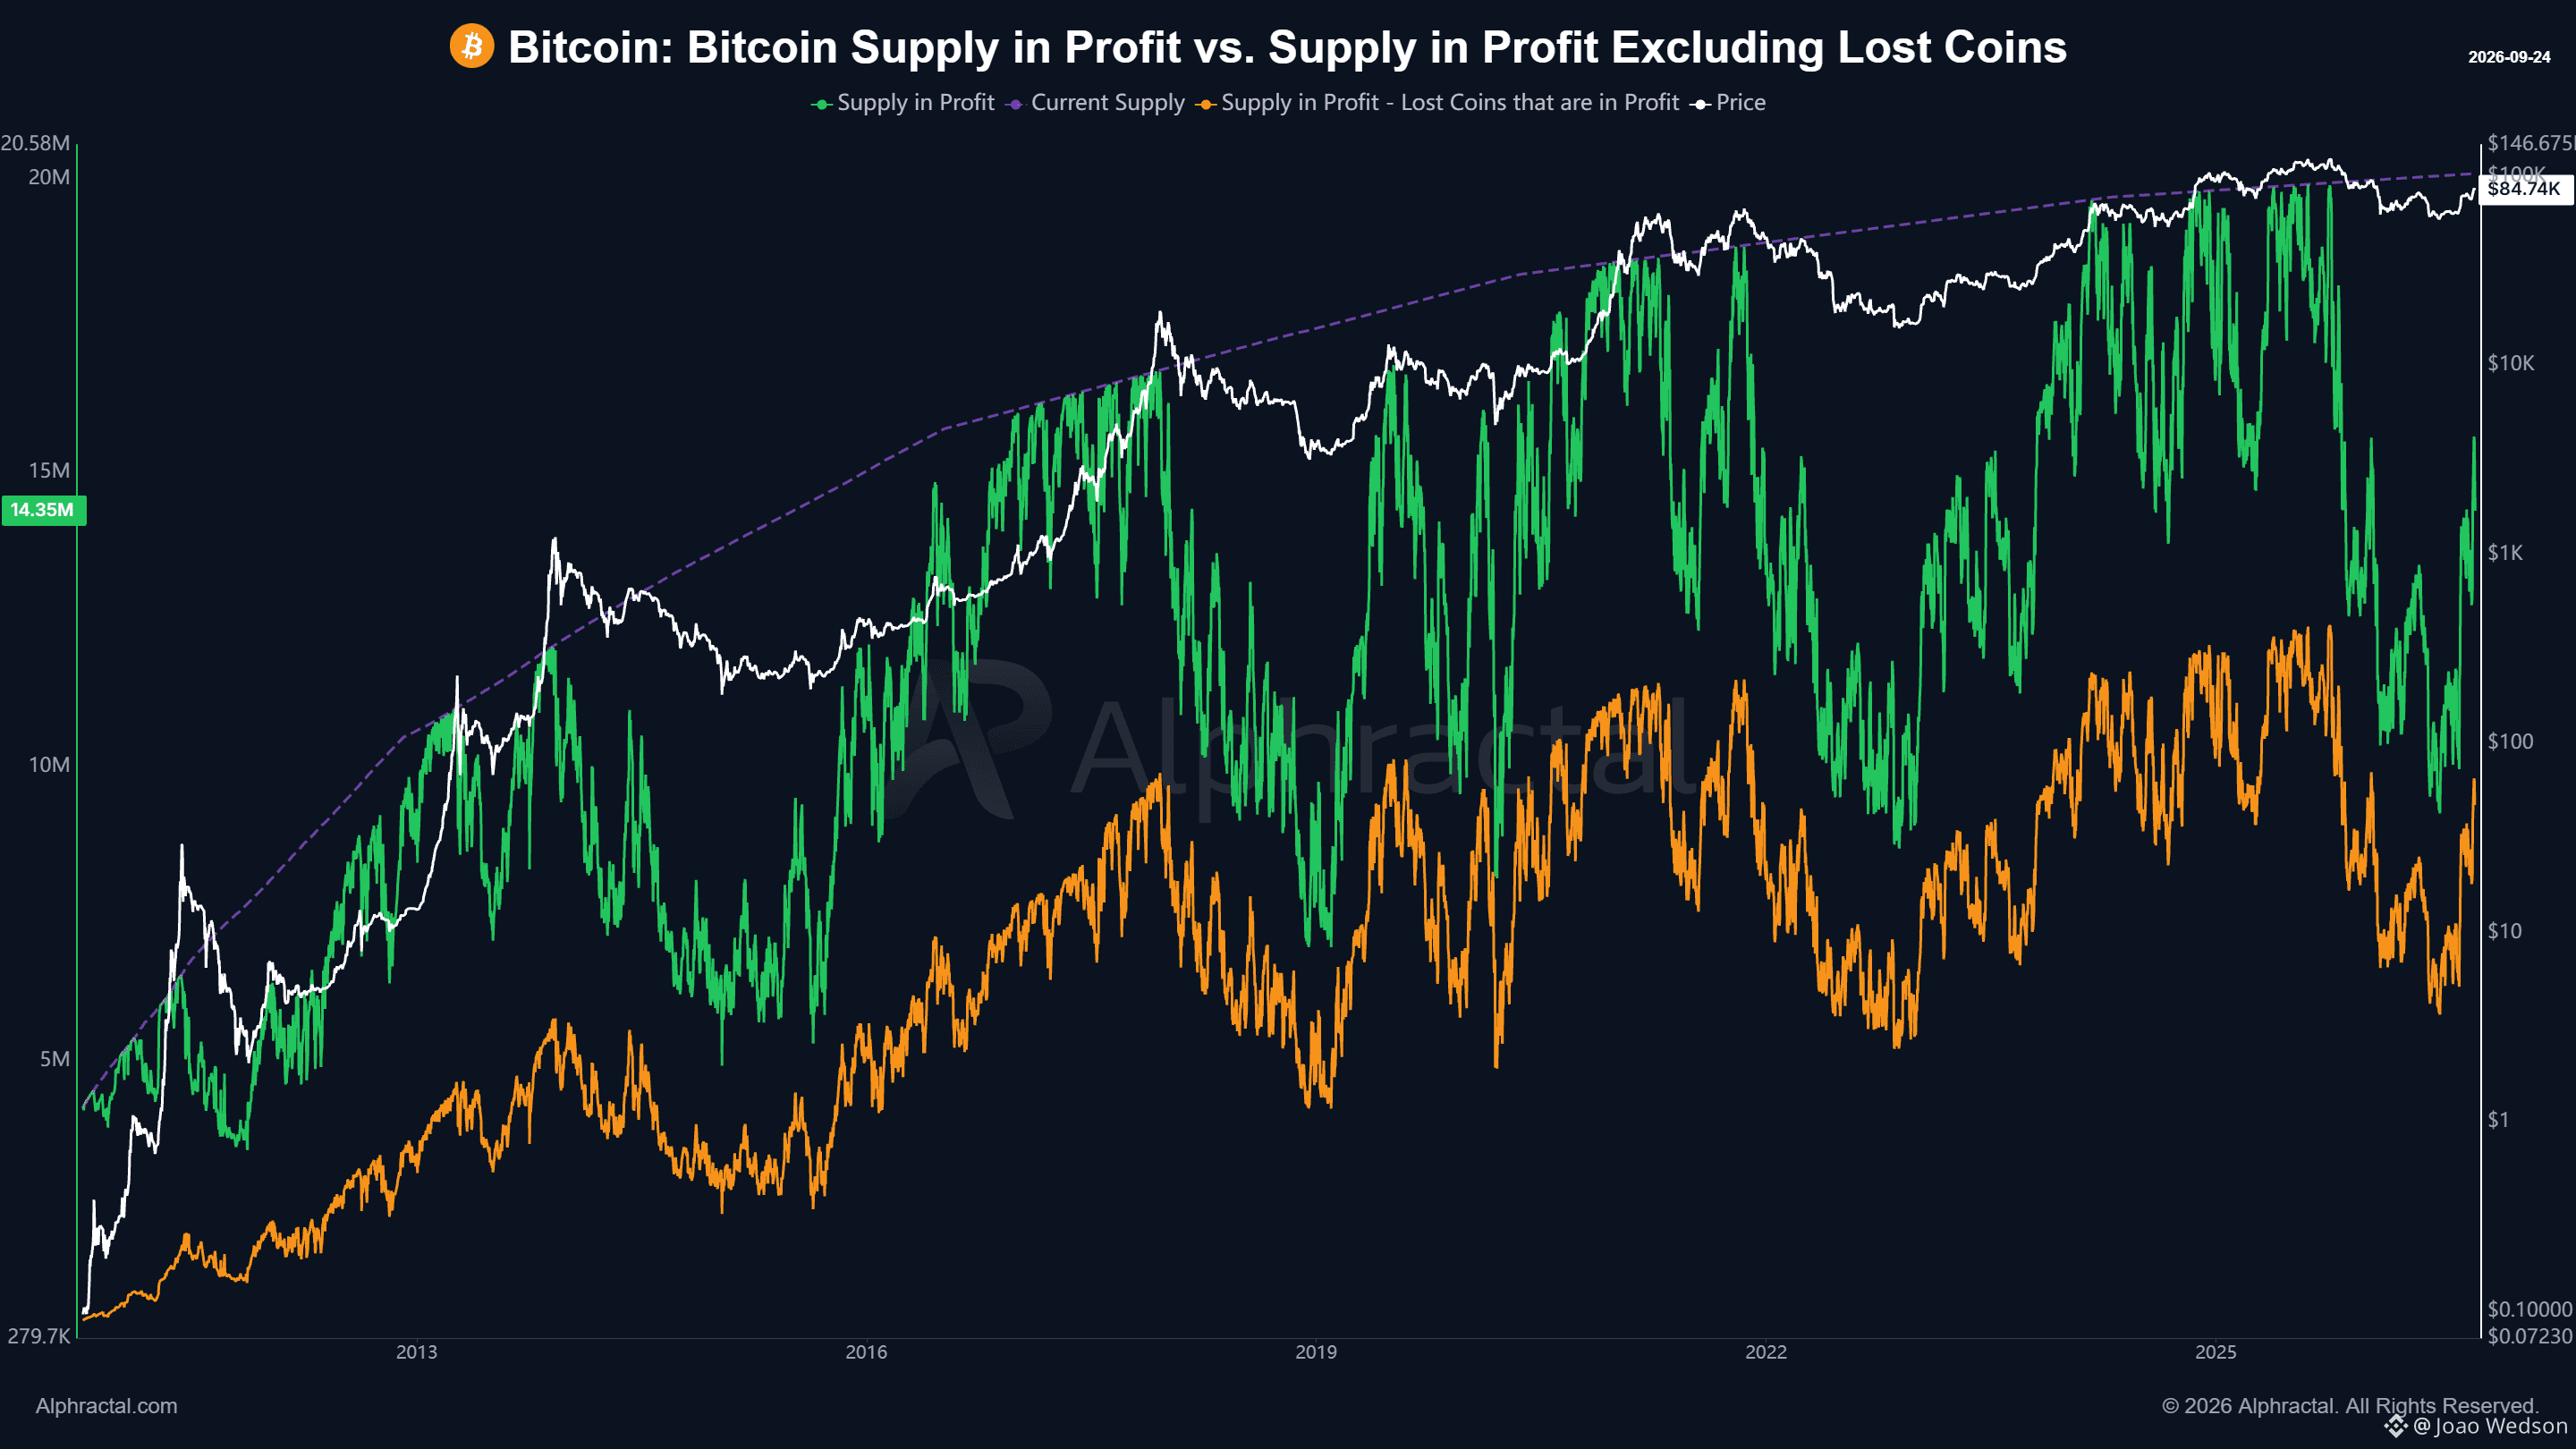
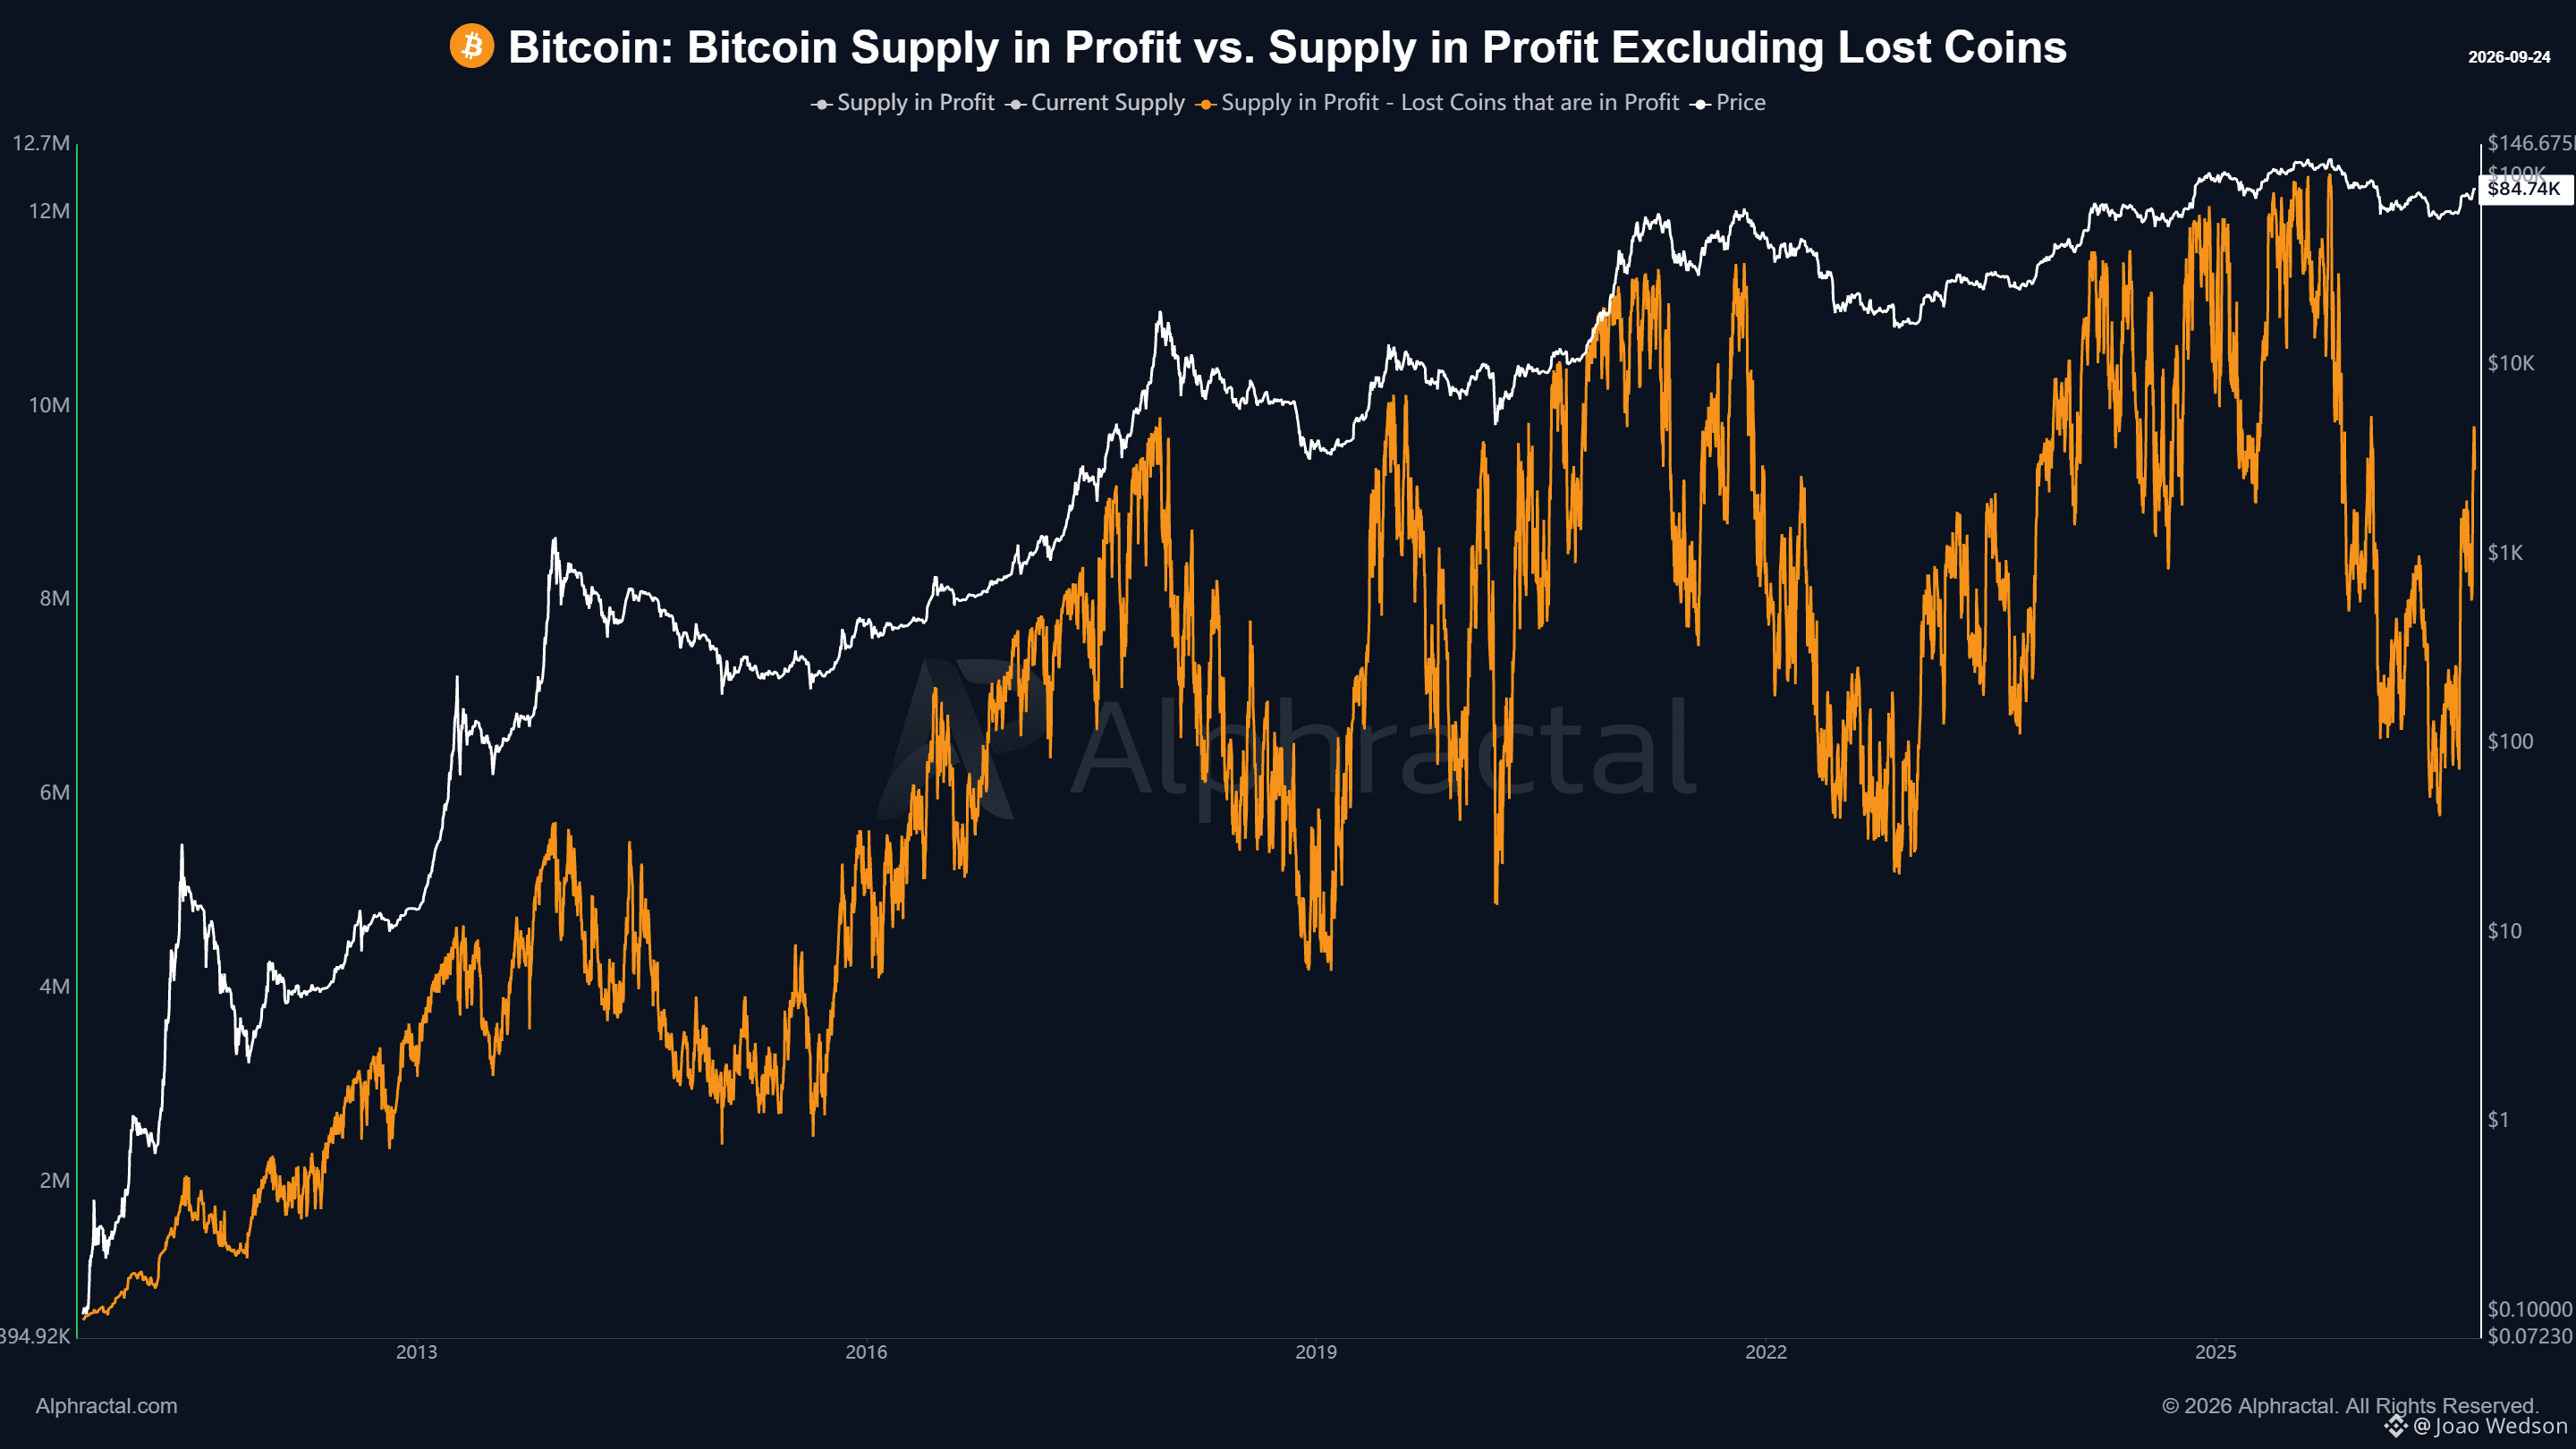
Bitcoin တွင် အဟောင်းဖြစ်ပြီး ပျောက်ဆုံးသွားနိုင်ခြေရှိသော coin အမြောက်အမြား ရှိသည်။ ၎င်းတို့တွင် Satoshi Nakamoto နှင့် ဆက်စပ်သော coin များ၊ အစောပိုင်း mining လုပ်သူများ၏ coin များ၊ wallet များကို ဝင်ရောက်အသုံးပြုခွင့် ဆုံးရှုံးသွားသူများ၏ coin များနှင့် နှစ်ပေါင်းများစွာ လှုပ်ရှားမှုမရှိဘဲ ရှိနေသော $BTC တို့ ပါဝင်သည်။ လက်ရှိဒေတာကို ကြည့်လျှင် - လက်ရှိ Supply: 20.1M BTC - အမြတ်ရှိနေသော Supply: 14.8M BTC၊ စုစုပေါင်း Supply ၏ 73.6% - အမြတ်ရှိနေသော ပျောက်ဆုံး coin များ: 5.5M BTC၊ စုစုပေါင်း Supply ၏ 27.4% - ပျောက်ဆုံး coin များကို ဖယ်ထုတ်ပြီးနောက် အမြတ်ရှိနေသော Supply: 9.35M BTC၊ စုစုပေါင်း Supply ၏ 46.5% ၎င်းက လက်ရှိ အမြတ်ရှိနေသည်ဟု သတ်မှတ်ထားသော BTC အားလုံး၏ 37% ခန့်သည် ပျောက်ဆုံးသွားသည်ဟု သတ်မှတ်ထားသော သို့မဟုတ် စီးပွားရေးအရ လှုပ်ရှားမှုမရှိသော coin များမှ ဖြစ်နိုင်ကြောင်း ဆိုလိုသည်။ ၎င်းတို့ကို ဖယ်ထုတ်လိုက်သည်နှင့် အခြေအနေကို မြင်ရပုံမှာ သိသိသာသာ ပြောင်းလဲသွားသည်။ ရိုးရိုး Supply in Profit အရ Bitcoin supply ၏ 74% နီးပါးသည် အမြတ်ရှိနေသည်ဟု ဆိုနိုင်သည်။ သို့သော် ပျောက်ဆုံး coin များကို ဖယ်ထုတ်ပြီးနောက် စုစုပေါင်း Supply ၏ 46.5% ခန့်သာ အမြတ်ရှိနေသော Supply ဖြစ်သည်။ ယင်းက ဈေးကွက်အတွက် အမှန်တကယ် စီးပွားရေးအရ သက်ဆိုင်သော Supply ကို အလွန်ကွဲပြားသည့် ရှုထောင့်မှ မြင်နိုင်စေနိုင်သည်။
Bitcoin တွင် အဟောင်းဖြစ်ပြီး ပျောက်ဆုံးသွားနိုင်ခြေရှိသော coin အမြောက်အမြား ရှိသည်။ ၎င်းတို့တွင် Satoshi Nakamoto နှင့် ဆက်စပ်သော coin များ၊ အစောပိုင်း mining လုပ်သူများ၏ coin များ၊ wallet များကို ဝင်ရောက်အသုံးပြုခွင့် ဆုံးရှုံးသွားသူများ၏ coin များနှင့် နှစ်ပေါင်းများစွာ လှုပ်ရှားမှုမရှိဘဲ ရှိနေသော $BTC တို့ ပါဝင်သည်။ လက်ရှိဒေတာကို ကြည့်လျှင် - လက်ရှိ Supply: 20.1M BTC - အမြတ်ရှိနေသော Supply: 14.8M BTC၊ စုစုပေါင်း Supply ၏ 73.6% - အမြတ်ရှိနေသော ပျောက်ဆုံး coin များ: 5.5M BTC၊ စုစုပေါင်း Supply ၏ 27.4% - ပျောက်ဆုံး coin များကို ဖယ်ထုတ်ပြီးနောက် အမြတ်ရှိနေသော Supply: 9.35M BTC၊ စုစုပေါင်း Supply ၏ 46.5% ၎င်းက လက်ရှိ အမြတ်ရှိနေသည်ဟု သတ်မှတ်ထားသော BTC အားလုံး၏ 37% ခန့်သည် ပျောက်ဆုံးသွားသည်ဟု သတ်မှတ်ထားသော သို့မဟုတ် စီးပွားရေးအရ လှုပ်ရှားမှုမရှိသော coin များမှ ဖြစ်နိုင်ကြောင်း ဆိုလိုသည်။ ၎င်းတို့ကို ဖယ်ထုတ်လိုက်သည်နှင့် အခြေအနေကို မြင်ရပုံမှာ သိသိသာသာ ပြောင်းလဲသွားသည်။ ရိုးရိုး Supply in Profit အရ Bitcoin supply ၏ 74% နီးပါးသည် အမြတ်ရှိနေသည်ဟု ဆိုနိုင်သည်။ သို့သော် ပျောက်ဆုံး coin များကို ဖယ်ထုတ်ပြီးနောက် စုစုပေါင်း Supply ၏ 46.5% ခန့်သာ အမြတ်ရှိနေသော Supply ဖြစ်သည်။ ယင်းက ဈေးကွက်အတွက် အမှန်တကယ် စီးပွားရေးအရ သက်ဆိုင်သော Supply ကို အလွန်ကွဲပြားသည့် ရှုထောင့်မှ မြင်နိုင်စေနိုင်သည်။
61
·
--
ဘာသာပြန်ဆိုချက် ကြည့်မည်
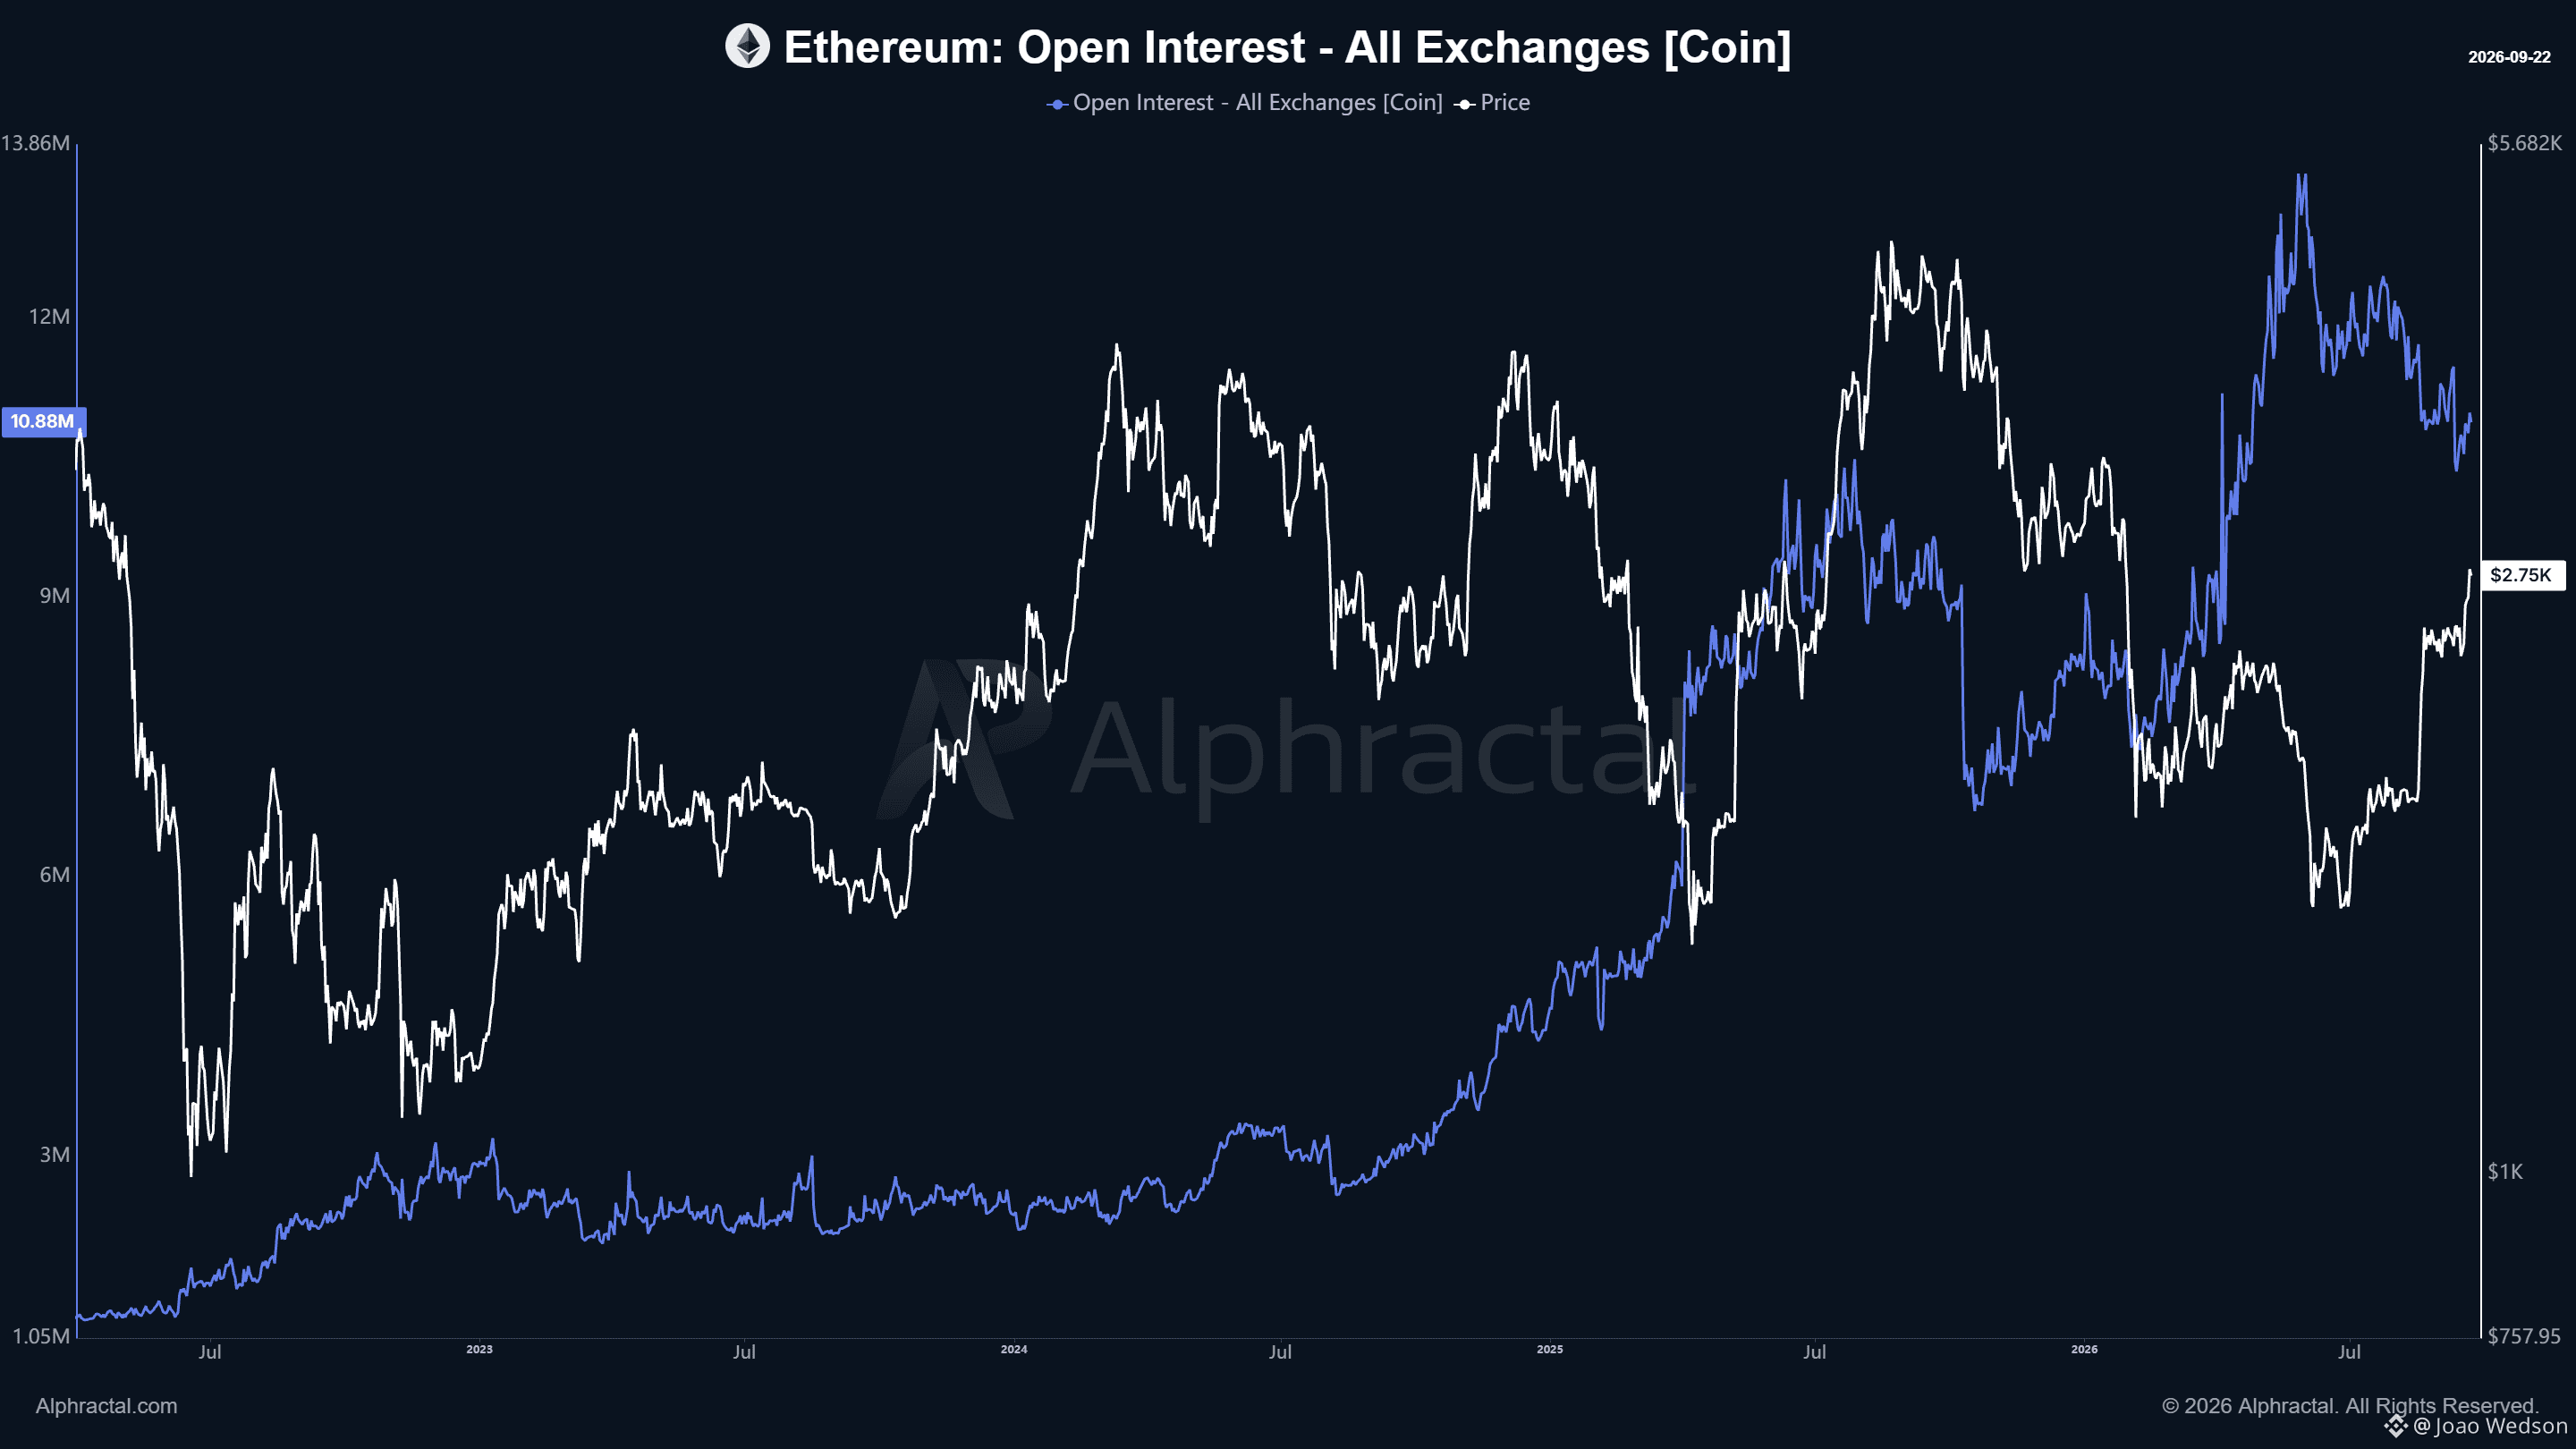
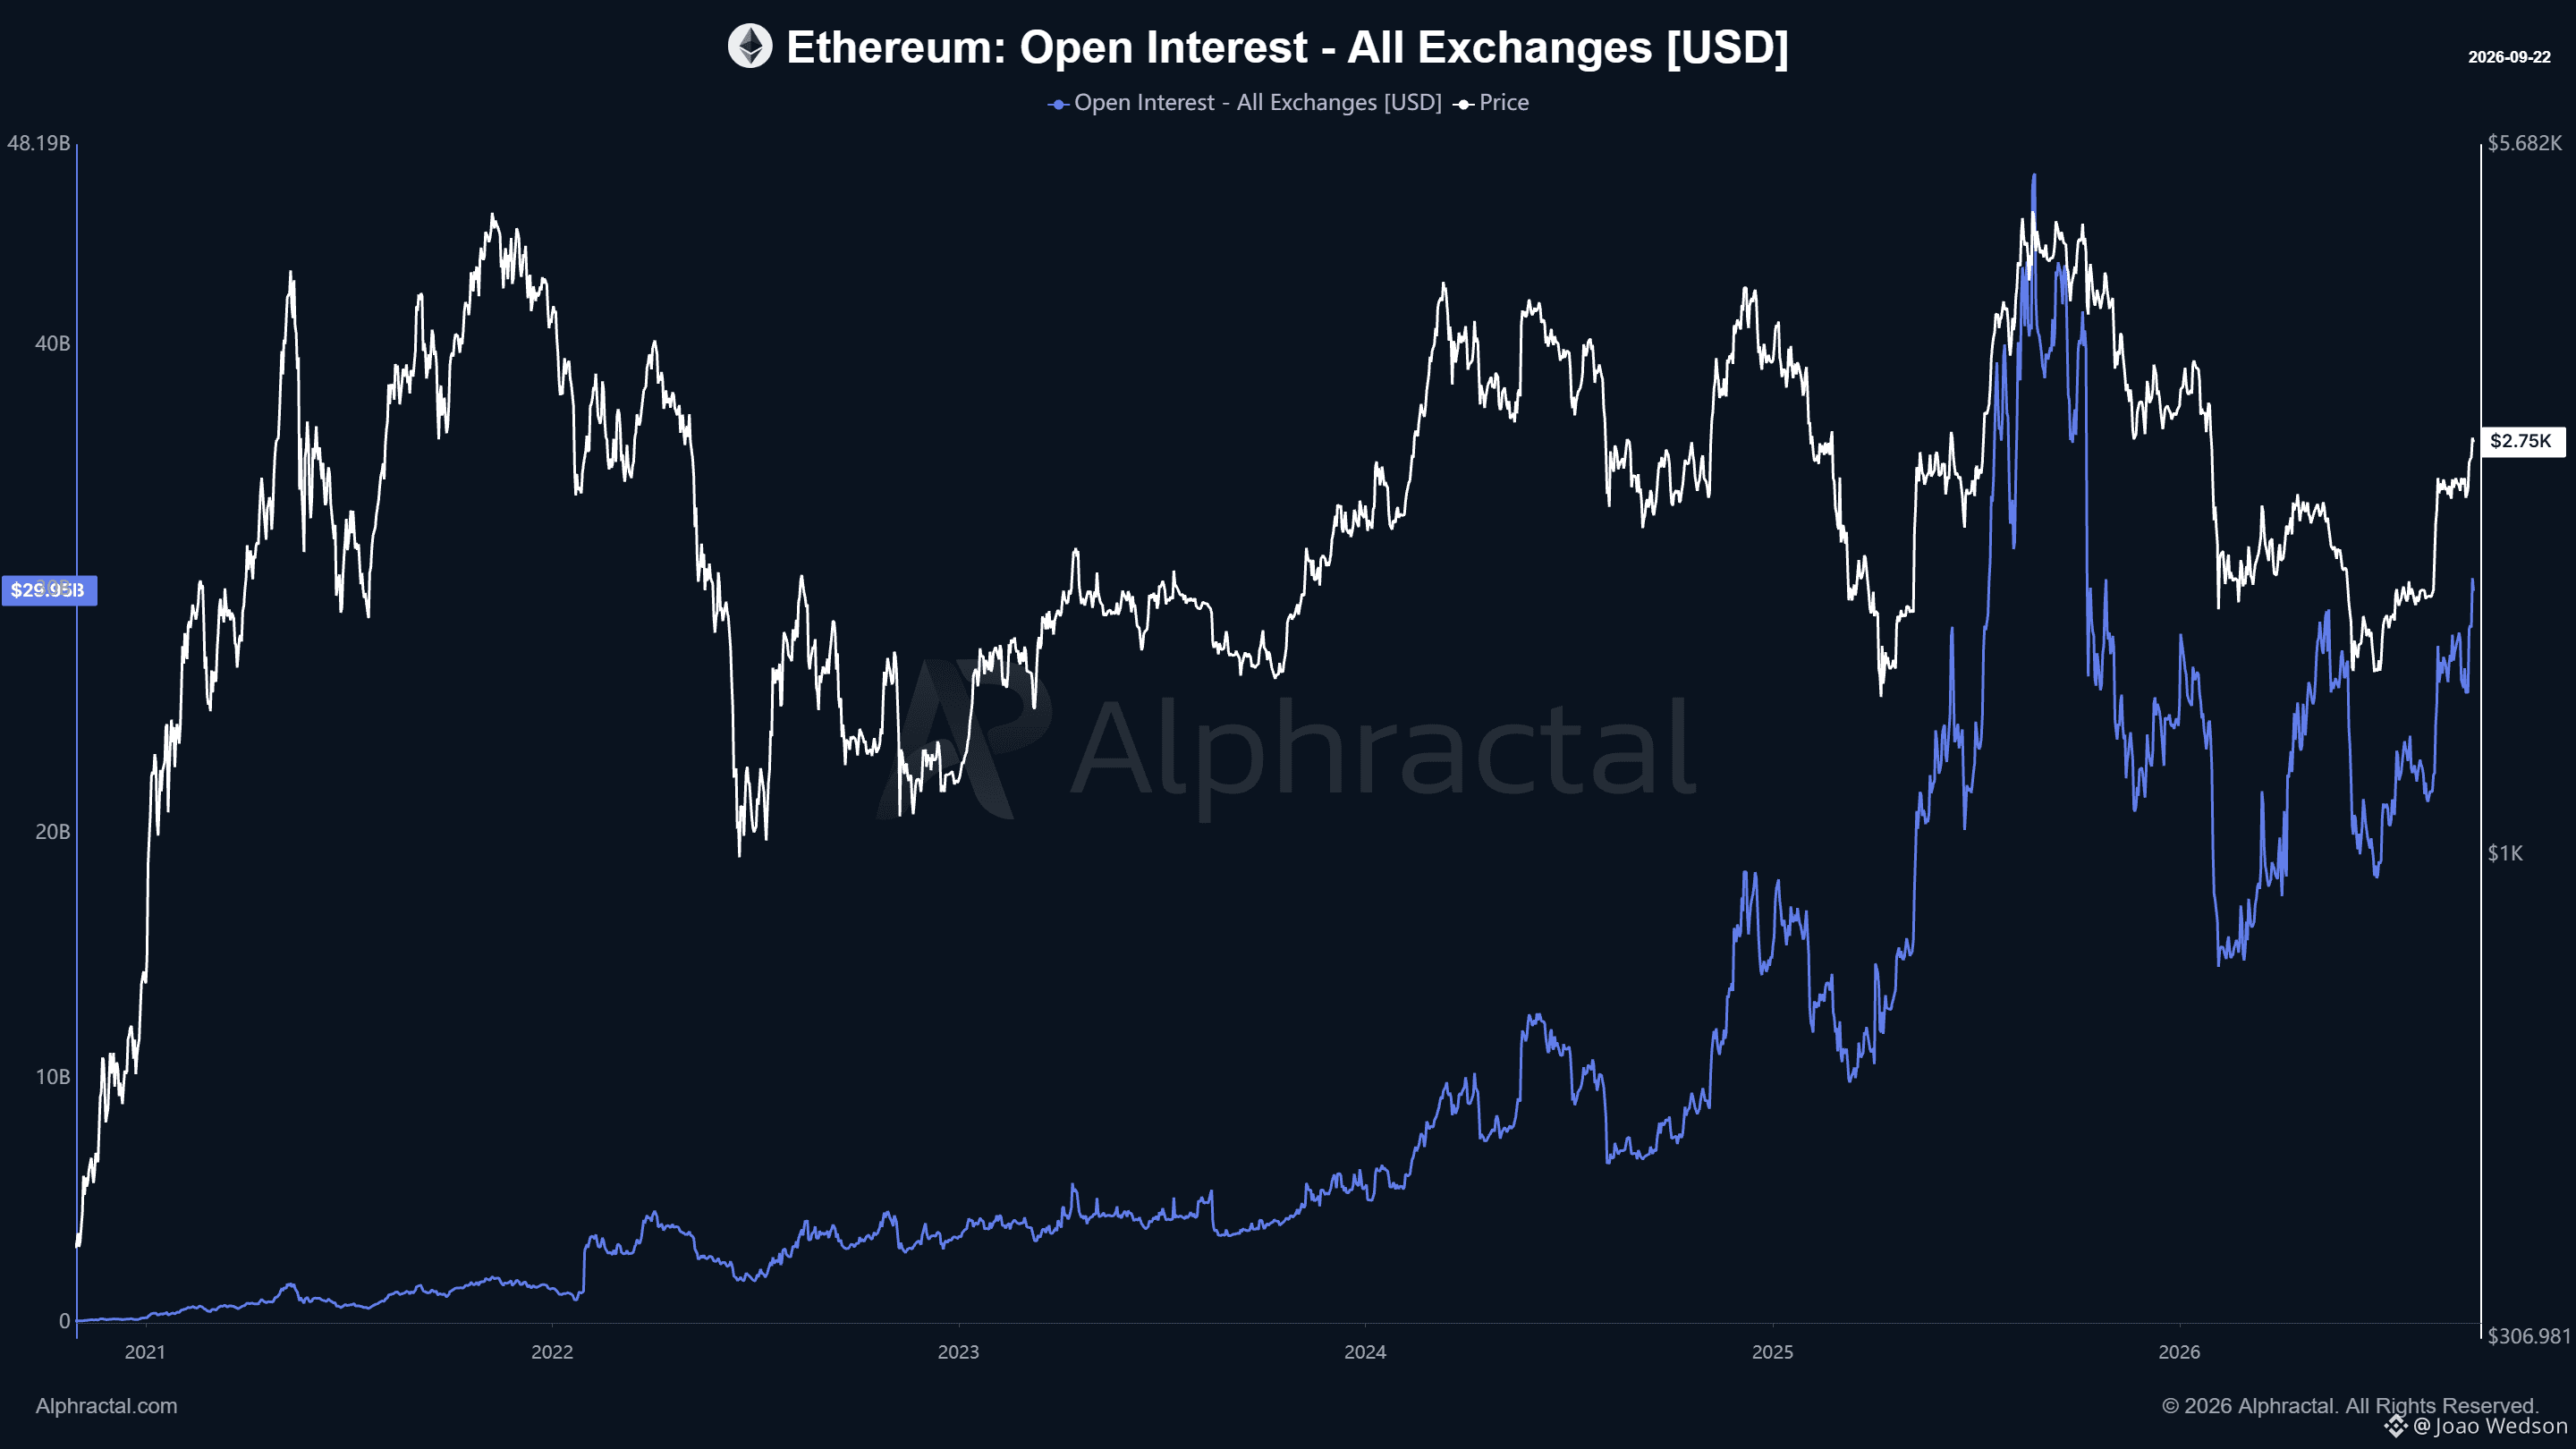
Ethereum Open Interest has now reached $30B for the first time since October 2025 showing a significant increase in derivatives market exposure.
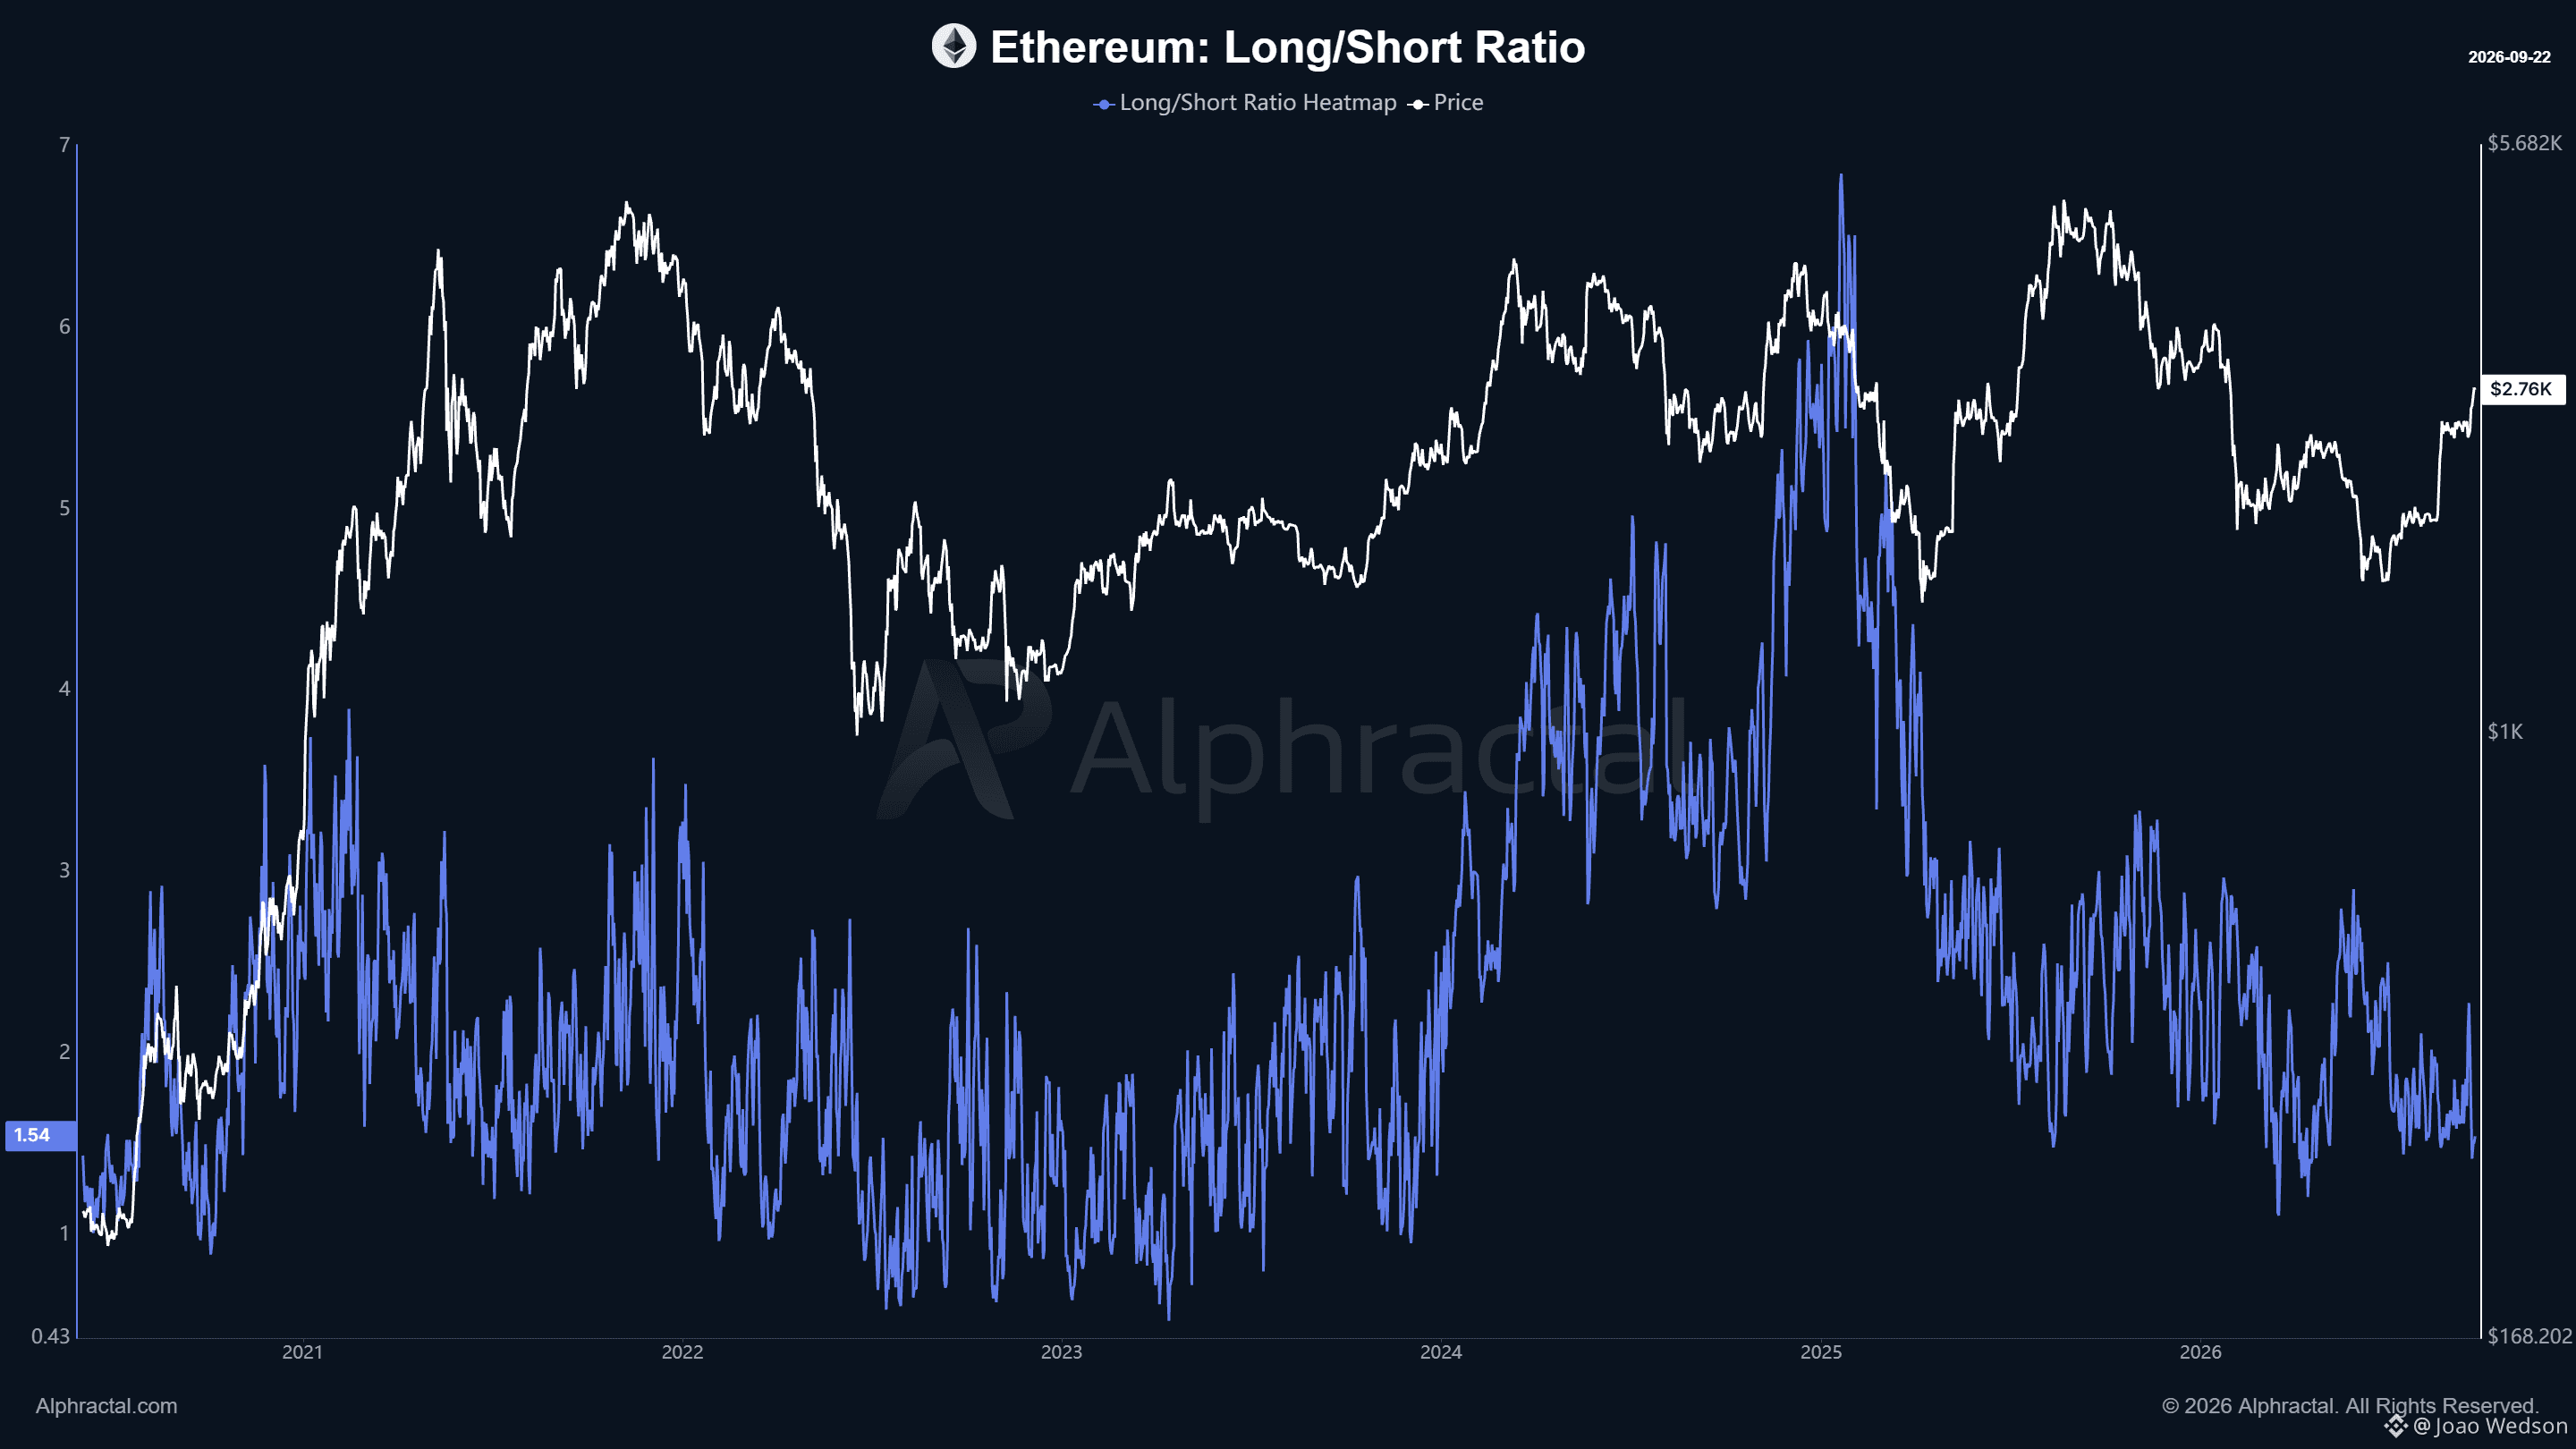
In ETH terms, this represents nearly **12 million $ETH in open positions** across exchanges. At the same time, the average Long/Short Ratio across Binance, Bybit, Bitget, HTX, and Gate currently stands at **1.54**, indicating a clear predominance of Long positioning.
This creates an important imbalance to watch. If ETH continues moving higher, fewer positions are exposed to liquidation. But if price moves sharply lower, the market has a much larger concentration of leveraged Longs that could be forced to close.
More leverage means more potential volatility.
47
·
--
ဘာသာပြန်ဆိုချက် ကြည့်မည်
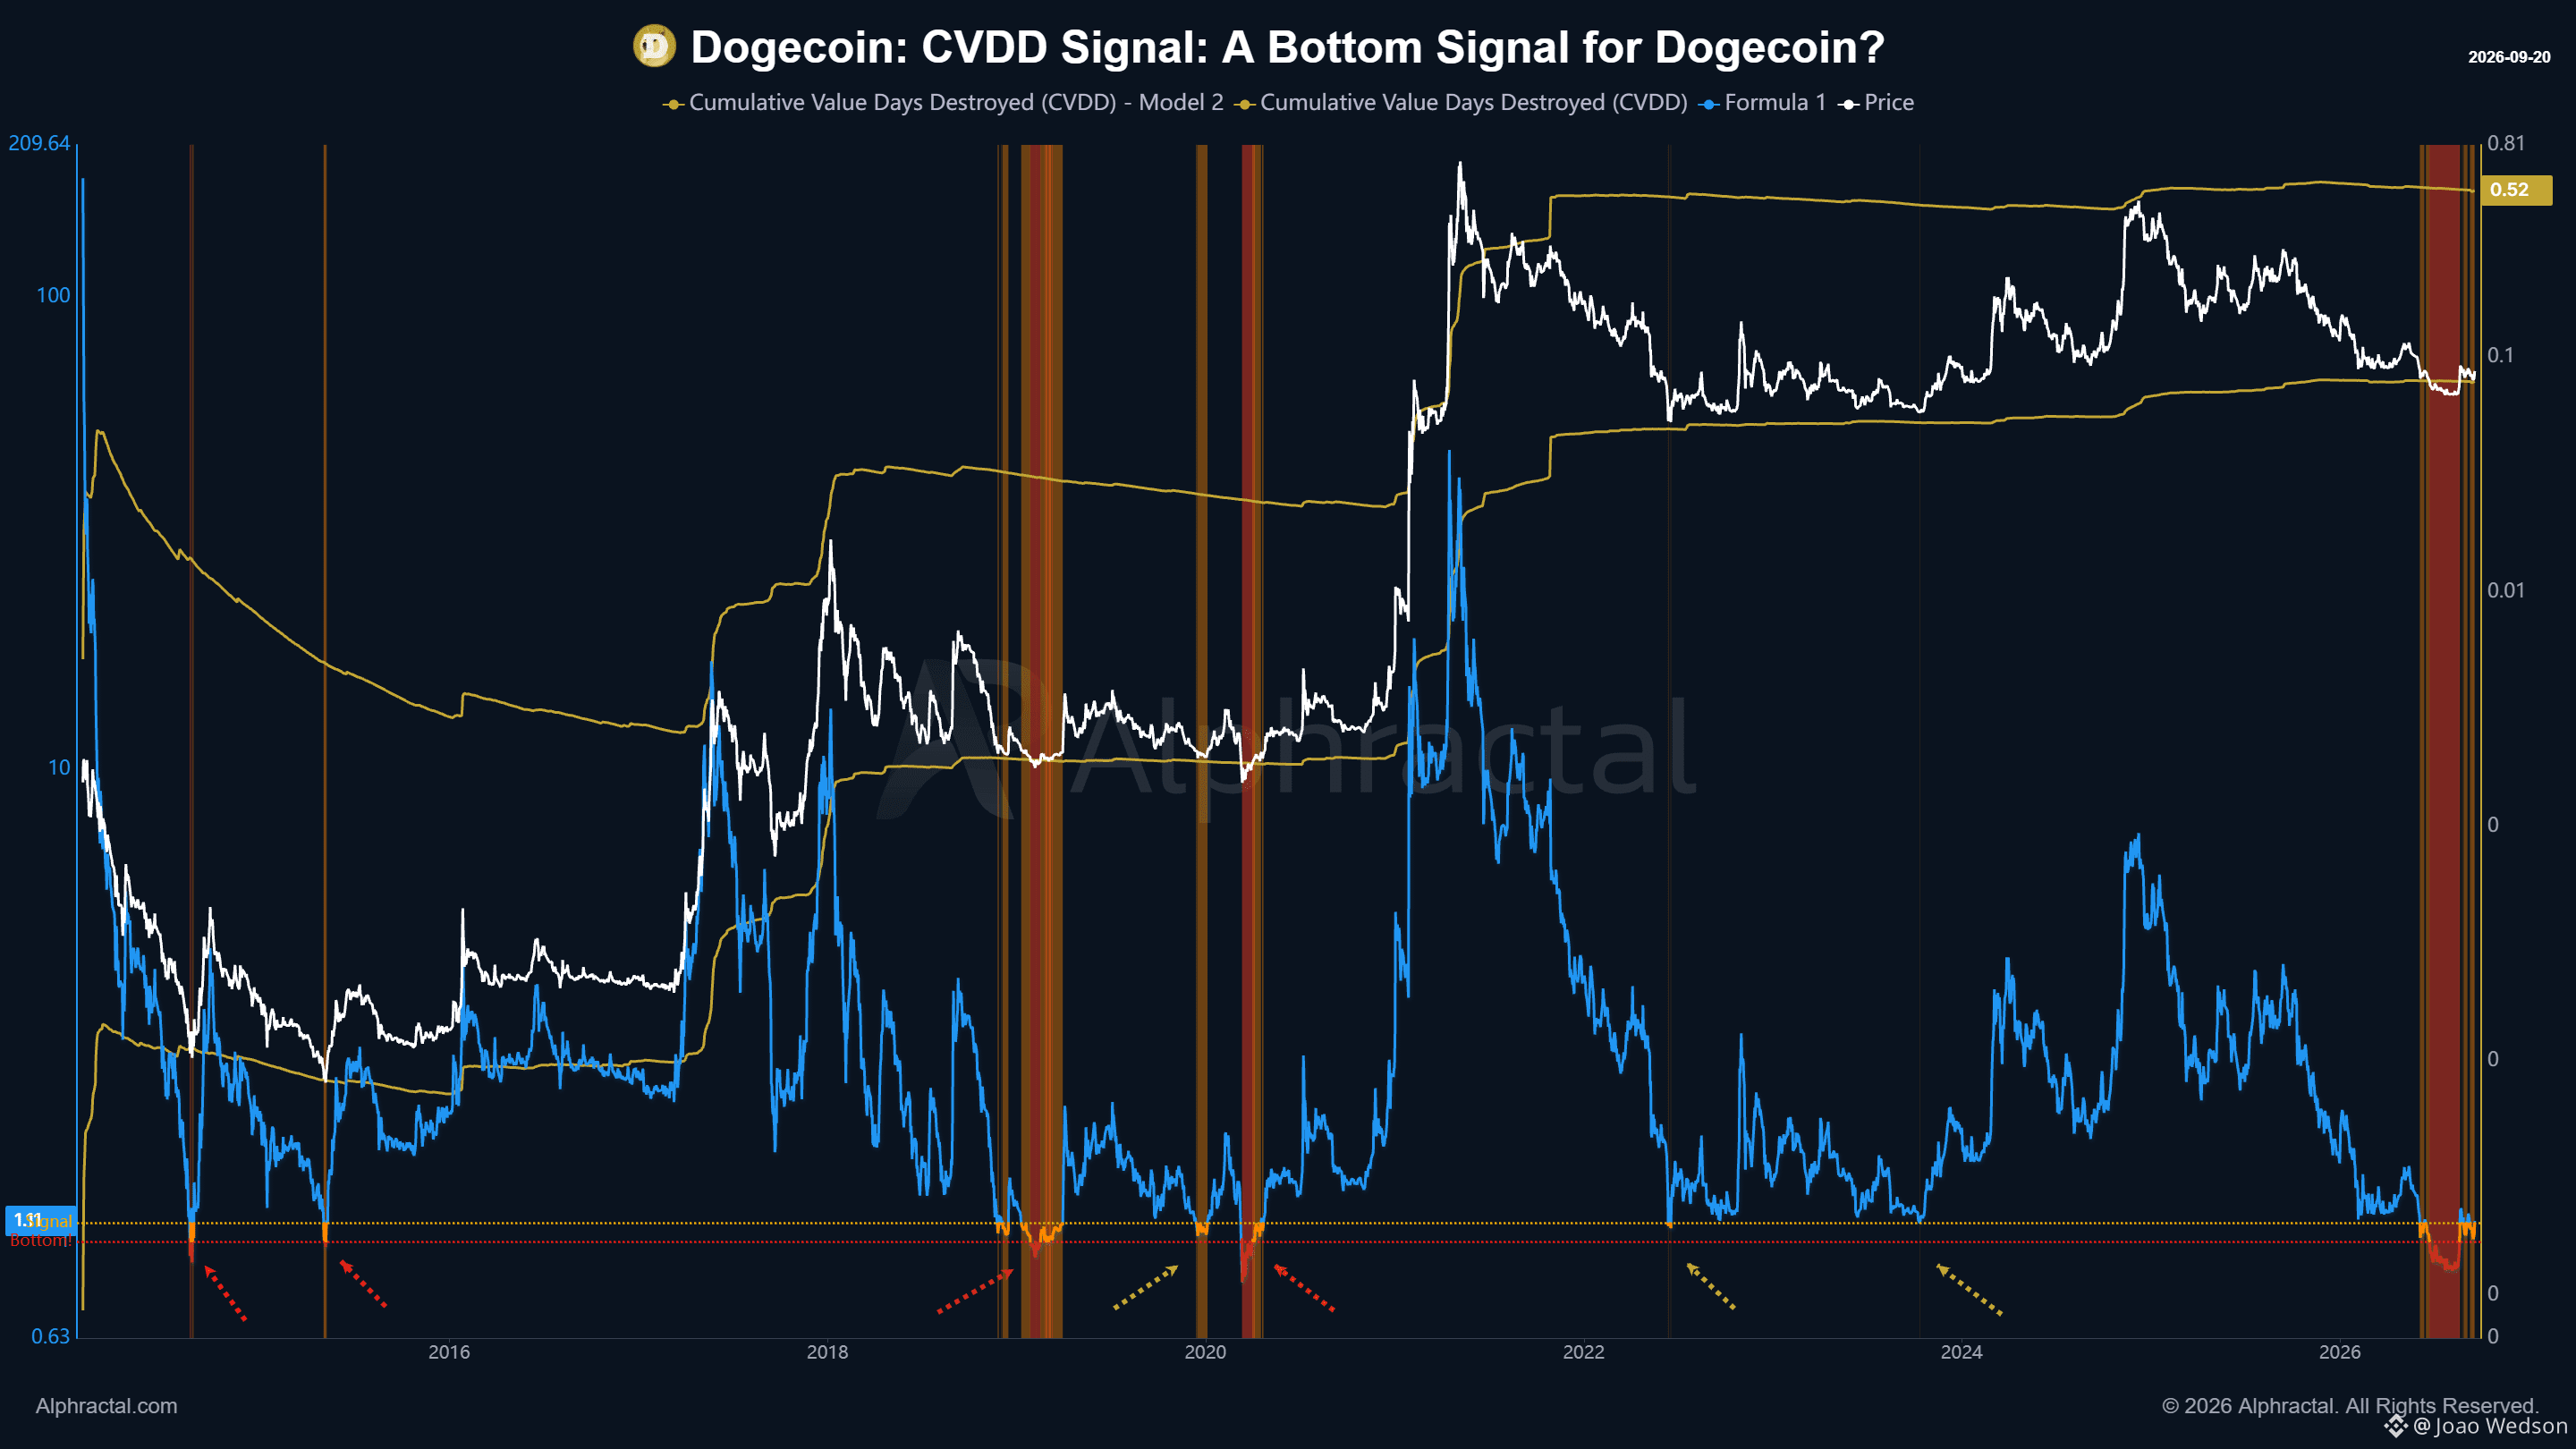
In June, I shared this Dogecoin onchain signal highlighting a region historically associated with major market bottoms. Not long after, $DOGE found its bottom. Today, we have the updated chart showing, once again, the value of this type of analysis. This is where onchain data takes crypto asset analysis to another level. In stocks, indices, and many other markets, much of what happens beneath the price remains invisible. On public blockchains, we have transparency into coin movements, holder behavior, profit and loss realization, coin age, flows, network activity, and many other variables. Price shows the outcome. Onchain data helps us understand what is happening underneath it. And when this information is transformed into metrics, models, and signals, we can identify structures that simply do not exist with the same level of transparency in traditional markets. This is one of the greatest sources of Alpha that blockchain has brought to asset analysis. And Alphractal is packed with metrics like these.
In June, I shared this Dogecoin onchain signal highlighting a region historically associated with major market bottoms. Not long after, $DOGE found its bottom. Today, we have the updated chart showing, once again, the value of this type of analysis. This is where onchain data takes crypto asset analysis to another level. In stocks, indices, and many other markets, much of what happens beneath the price remains invisible. On public blockchains, we have transparency into coin movements, holder behavior, profit and loss realization, coin age, flows, network activity, and many other variables. Price shows the outcome. Onchain data helps us understand what is happening underneath it. And when this information is transformed into metrics, models, and signals, we can identify structures that simply do not exist with the same level of transparency in traditional markets. This is one of the greatest sources of Alpha that blockchain has brought to asset analysis. And Alphractal is packed with metrics like these.
66
·
--
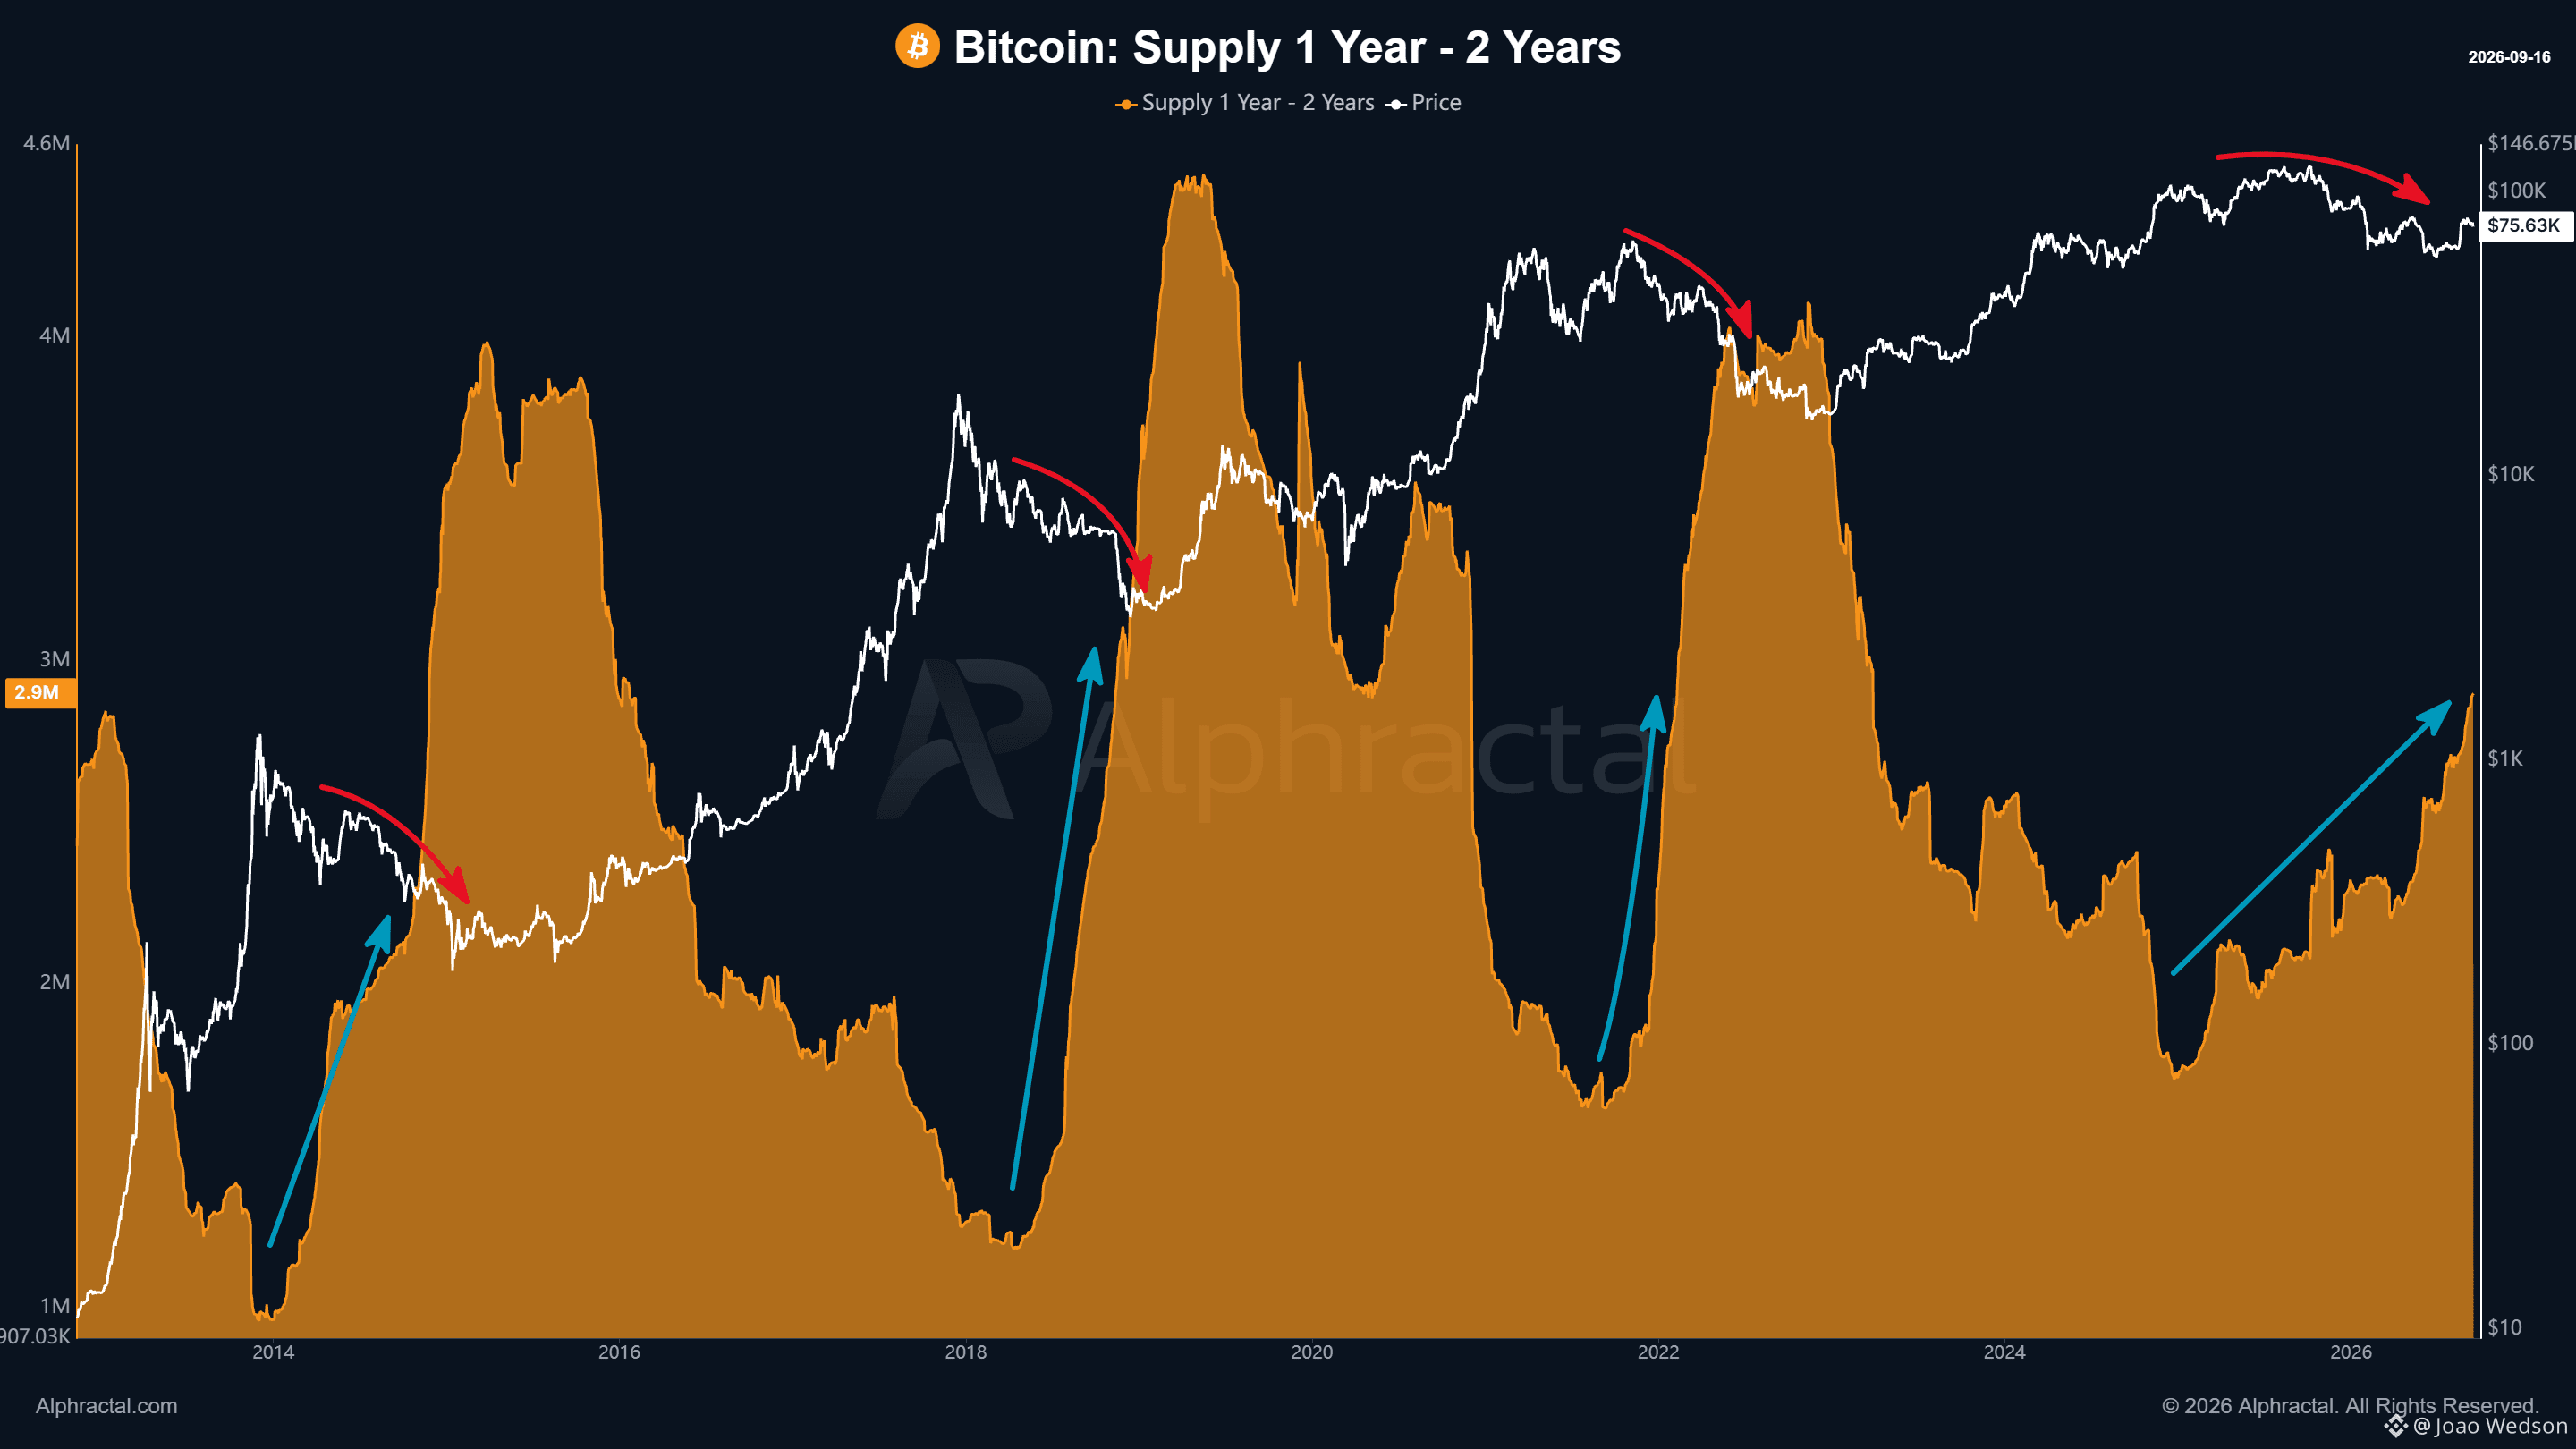
⚠️Bitcoin ၏ ၁ နှစ်မှ ၂ နှစ် ထောက်ပံ့မှု မြင့်တက်လာသည့်အခါတိုင်း၊ စျေးနှုန်းသည် အောက်ဘက်သို့ ရွေ့လျားတတ်သည်။ ၎င်းသည် on-chain analysis ထဲတွင် ရိုးရာလက်ရာမြောက်ပြီး စိတ်ဝင်စားဖွယ်ကောင်းသော ပုံစံတစ်ခု ဖြစ်သည်။ သမိုင်းအရ၊ ဤတူညီသော metric စတင်ကျဆင်းလာချိန်မှသာ Bitcoin သည် ပိုမိုအားကောင်းသော အတက်အရှိန်ကို ပြန်လည်ရရှိခဲ့သည်။ BTC ကို ၃ နှစ်အထိ ကိုင်ထားတတ်သော အလယ်အလတ်ကာလ ကိုင်ဆောင်သူဖြစ်ခြင်းသည် မကြာခဏ ခက်ခဲခဲ့သည်။ အခိုင်မာဆုံး ယုံကြည်ချက်သည် ၄ နှစ်ထက်ပို၍ ကိုင်ဆောင်နေသူများထံမှ လာပုံရသည်။ ၎င်းတို့သည် ရောင်းမချဘဲ စျေးကွက်စက်ဝန်းများစွာကို ကျော်လွှားနိုင်သော အစစ်အမှန် ရေရှည်ကိုင်ဆောင်သူများ ဖြစ်သည်။ $BTC
⚠️Bitcoin ၏ ၁ နှစ်မှ ၂ နှစ် ထောက်ပံ့မှု မြင့်တက်လာသည့်အခါတိုင်း၊ စျေးနှုန်းသည် အောက်ဘက်သို့ ရွေ့လျားတတ်သည်။ ၎င်းသည် on-chain analysis ထဲတွင် ရိုးရာလက်ရာမြောက်ပြီး စိတ်ဝင်စားဖွယ်ကောင်းသော ပုံစံတစ်ခု ဖြစ်သည်။ သမိုင်းအရ၊ ဤတူညီသော metric စတင်ကျဆင်းလာချိန်မှသာ Bitcoin သည် ပိုမိုအားကောင်းသော အတက်အရှိန်ကို ပြန်လည်ရရှိခဲ့သည်။ BTC ကို ၃ နှစ်အထိ ကိုင်ထားတတ်သော အလယ်အလတ်ကာလ ကိုင်ဆောင်သူဖြစ်ခြင်းသည် မကြာခဏ ခက်ခဲခဲ့သည်။ အခိုင်မာဆုံး ယုံကြည်ချက်သည် ၄ နှစ်ထက်ပို၍ ကိုင်ဆောင်နေသူများထံမှ လာပုံရသည်။ ၎င်းတို့သည် ရောင်းမချဘဲ စျေးကွက်စက်ဝန်းများစွာကို ကျော်လွှားနိုင်သော အစစ်အမှန် ရေရှည်ကိုင်ဆောင်သူများ ဖြစ်သည်။ $BTC
64
·
--
ဘာသာပြန်ဆိုချက် ကြည့်မည်
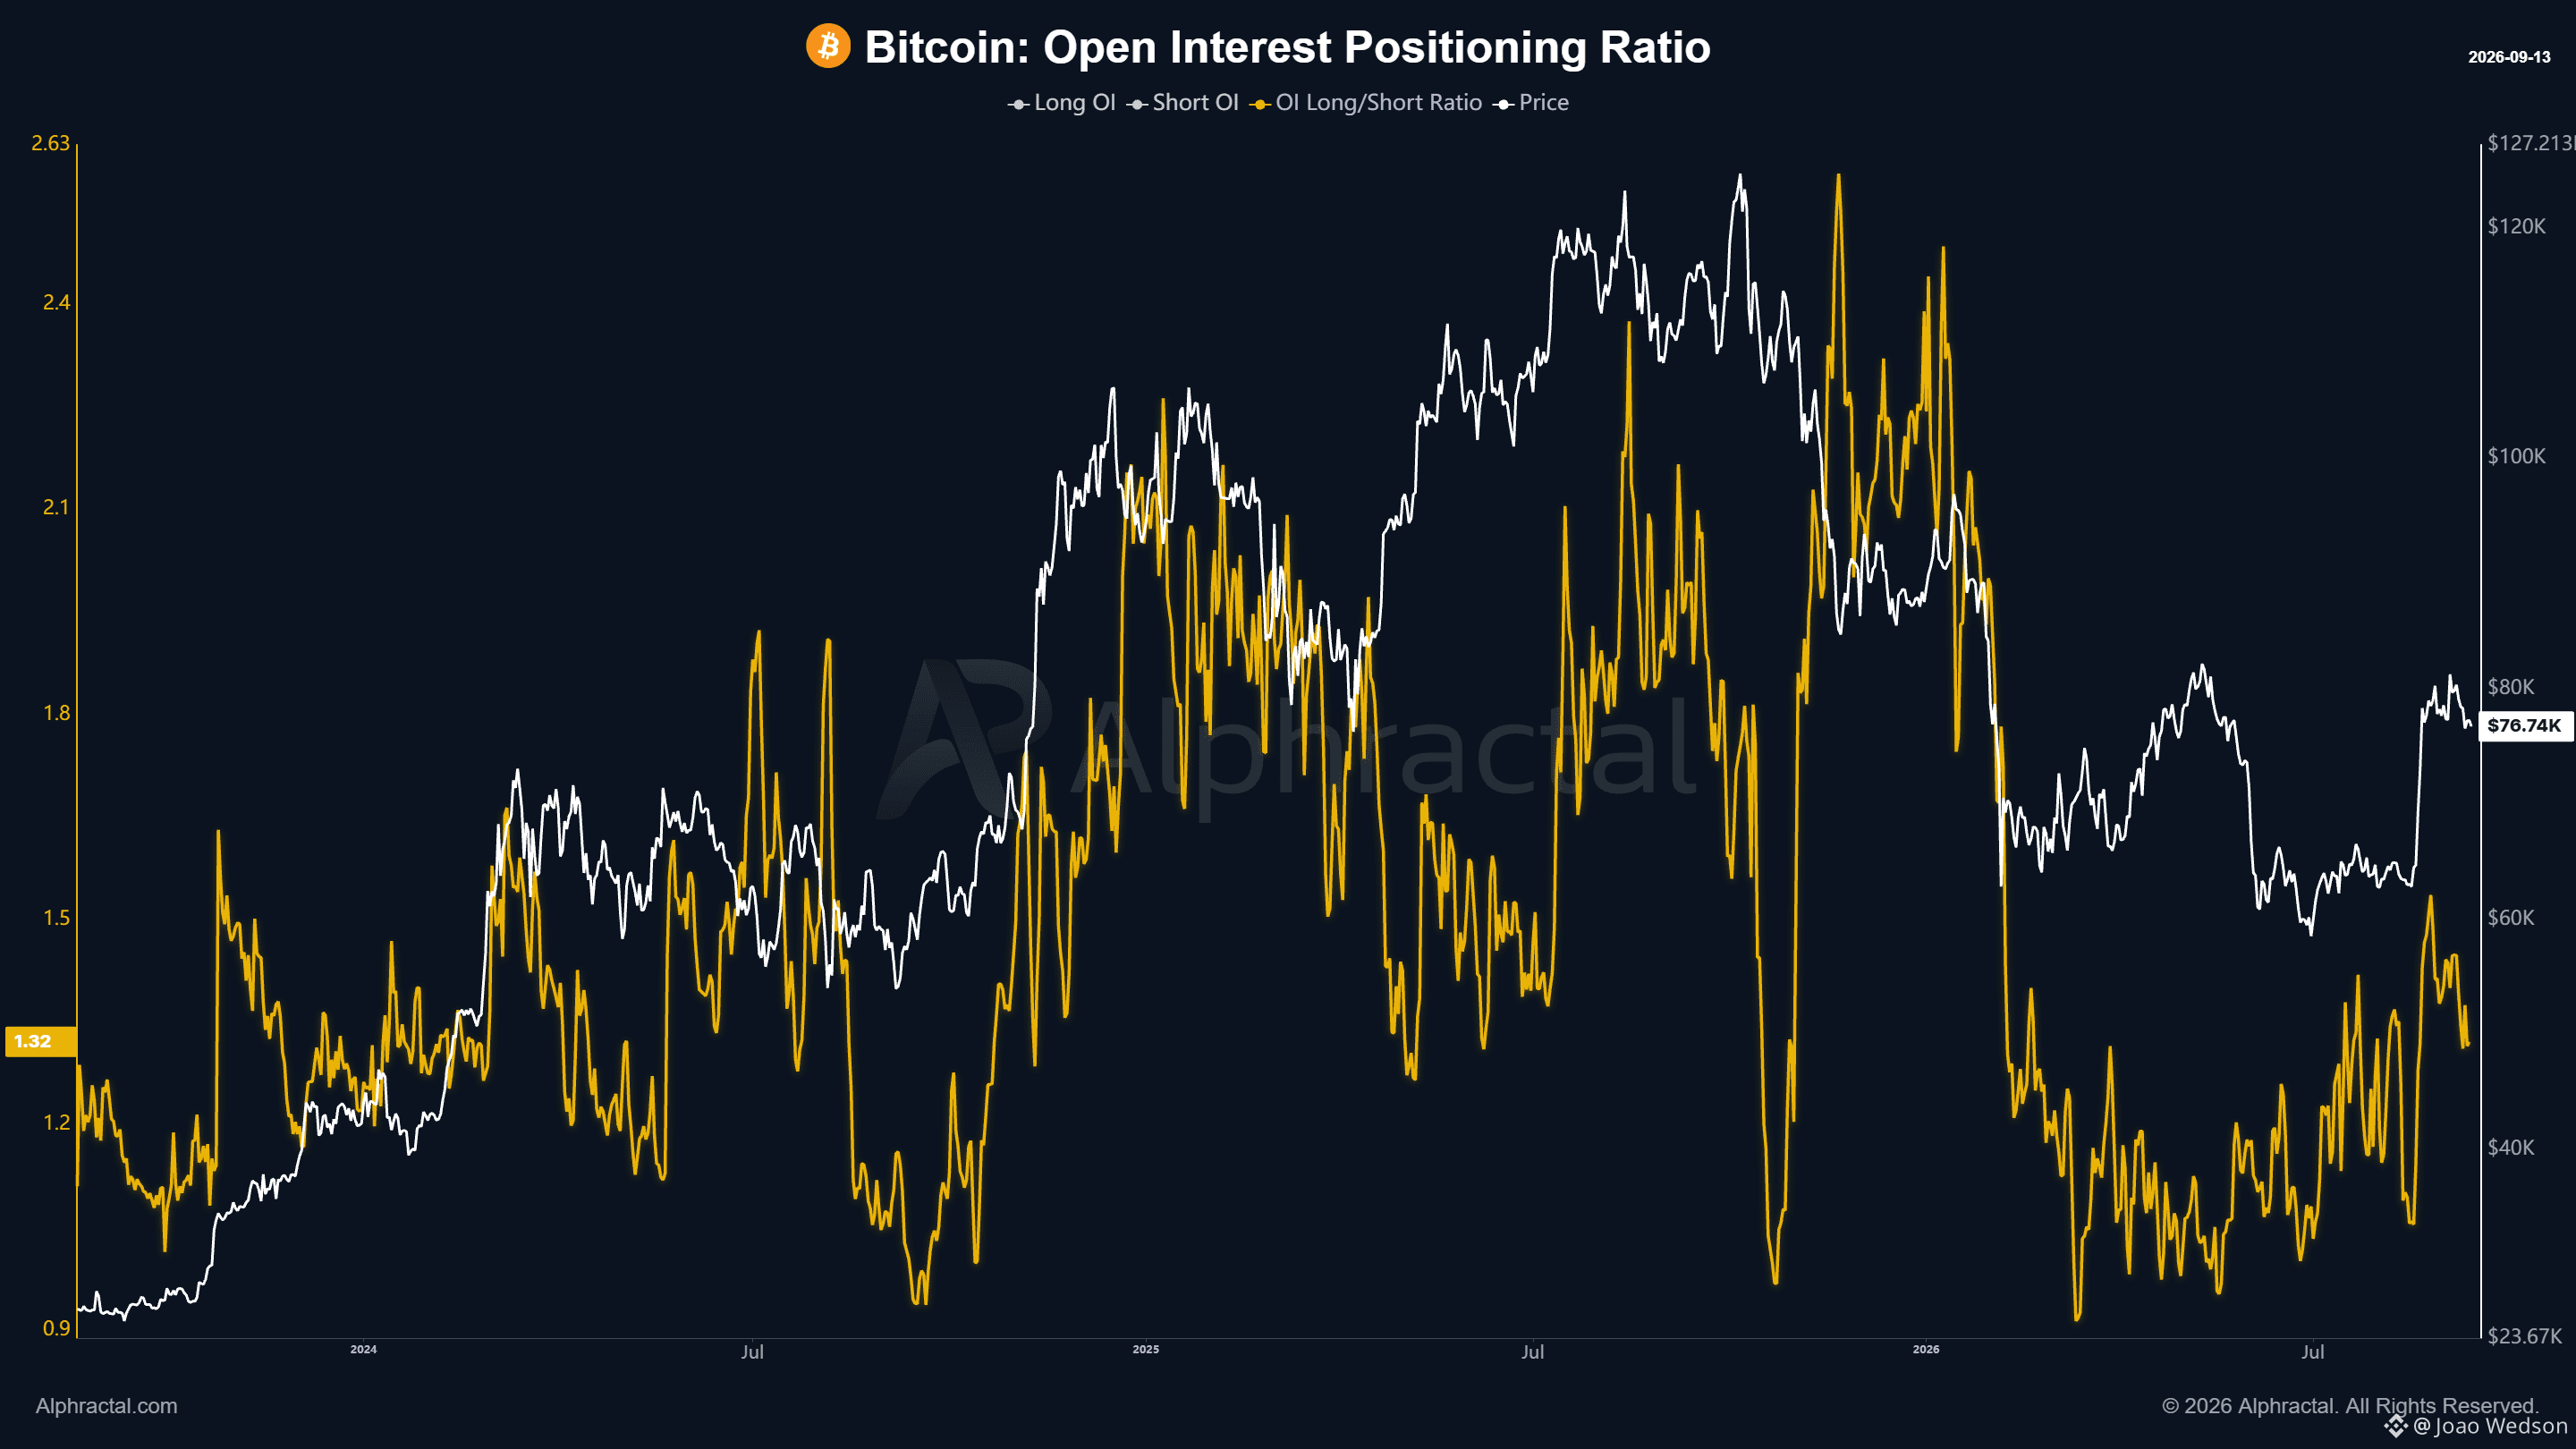
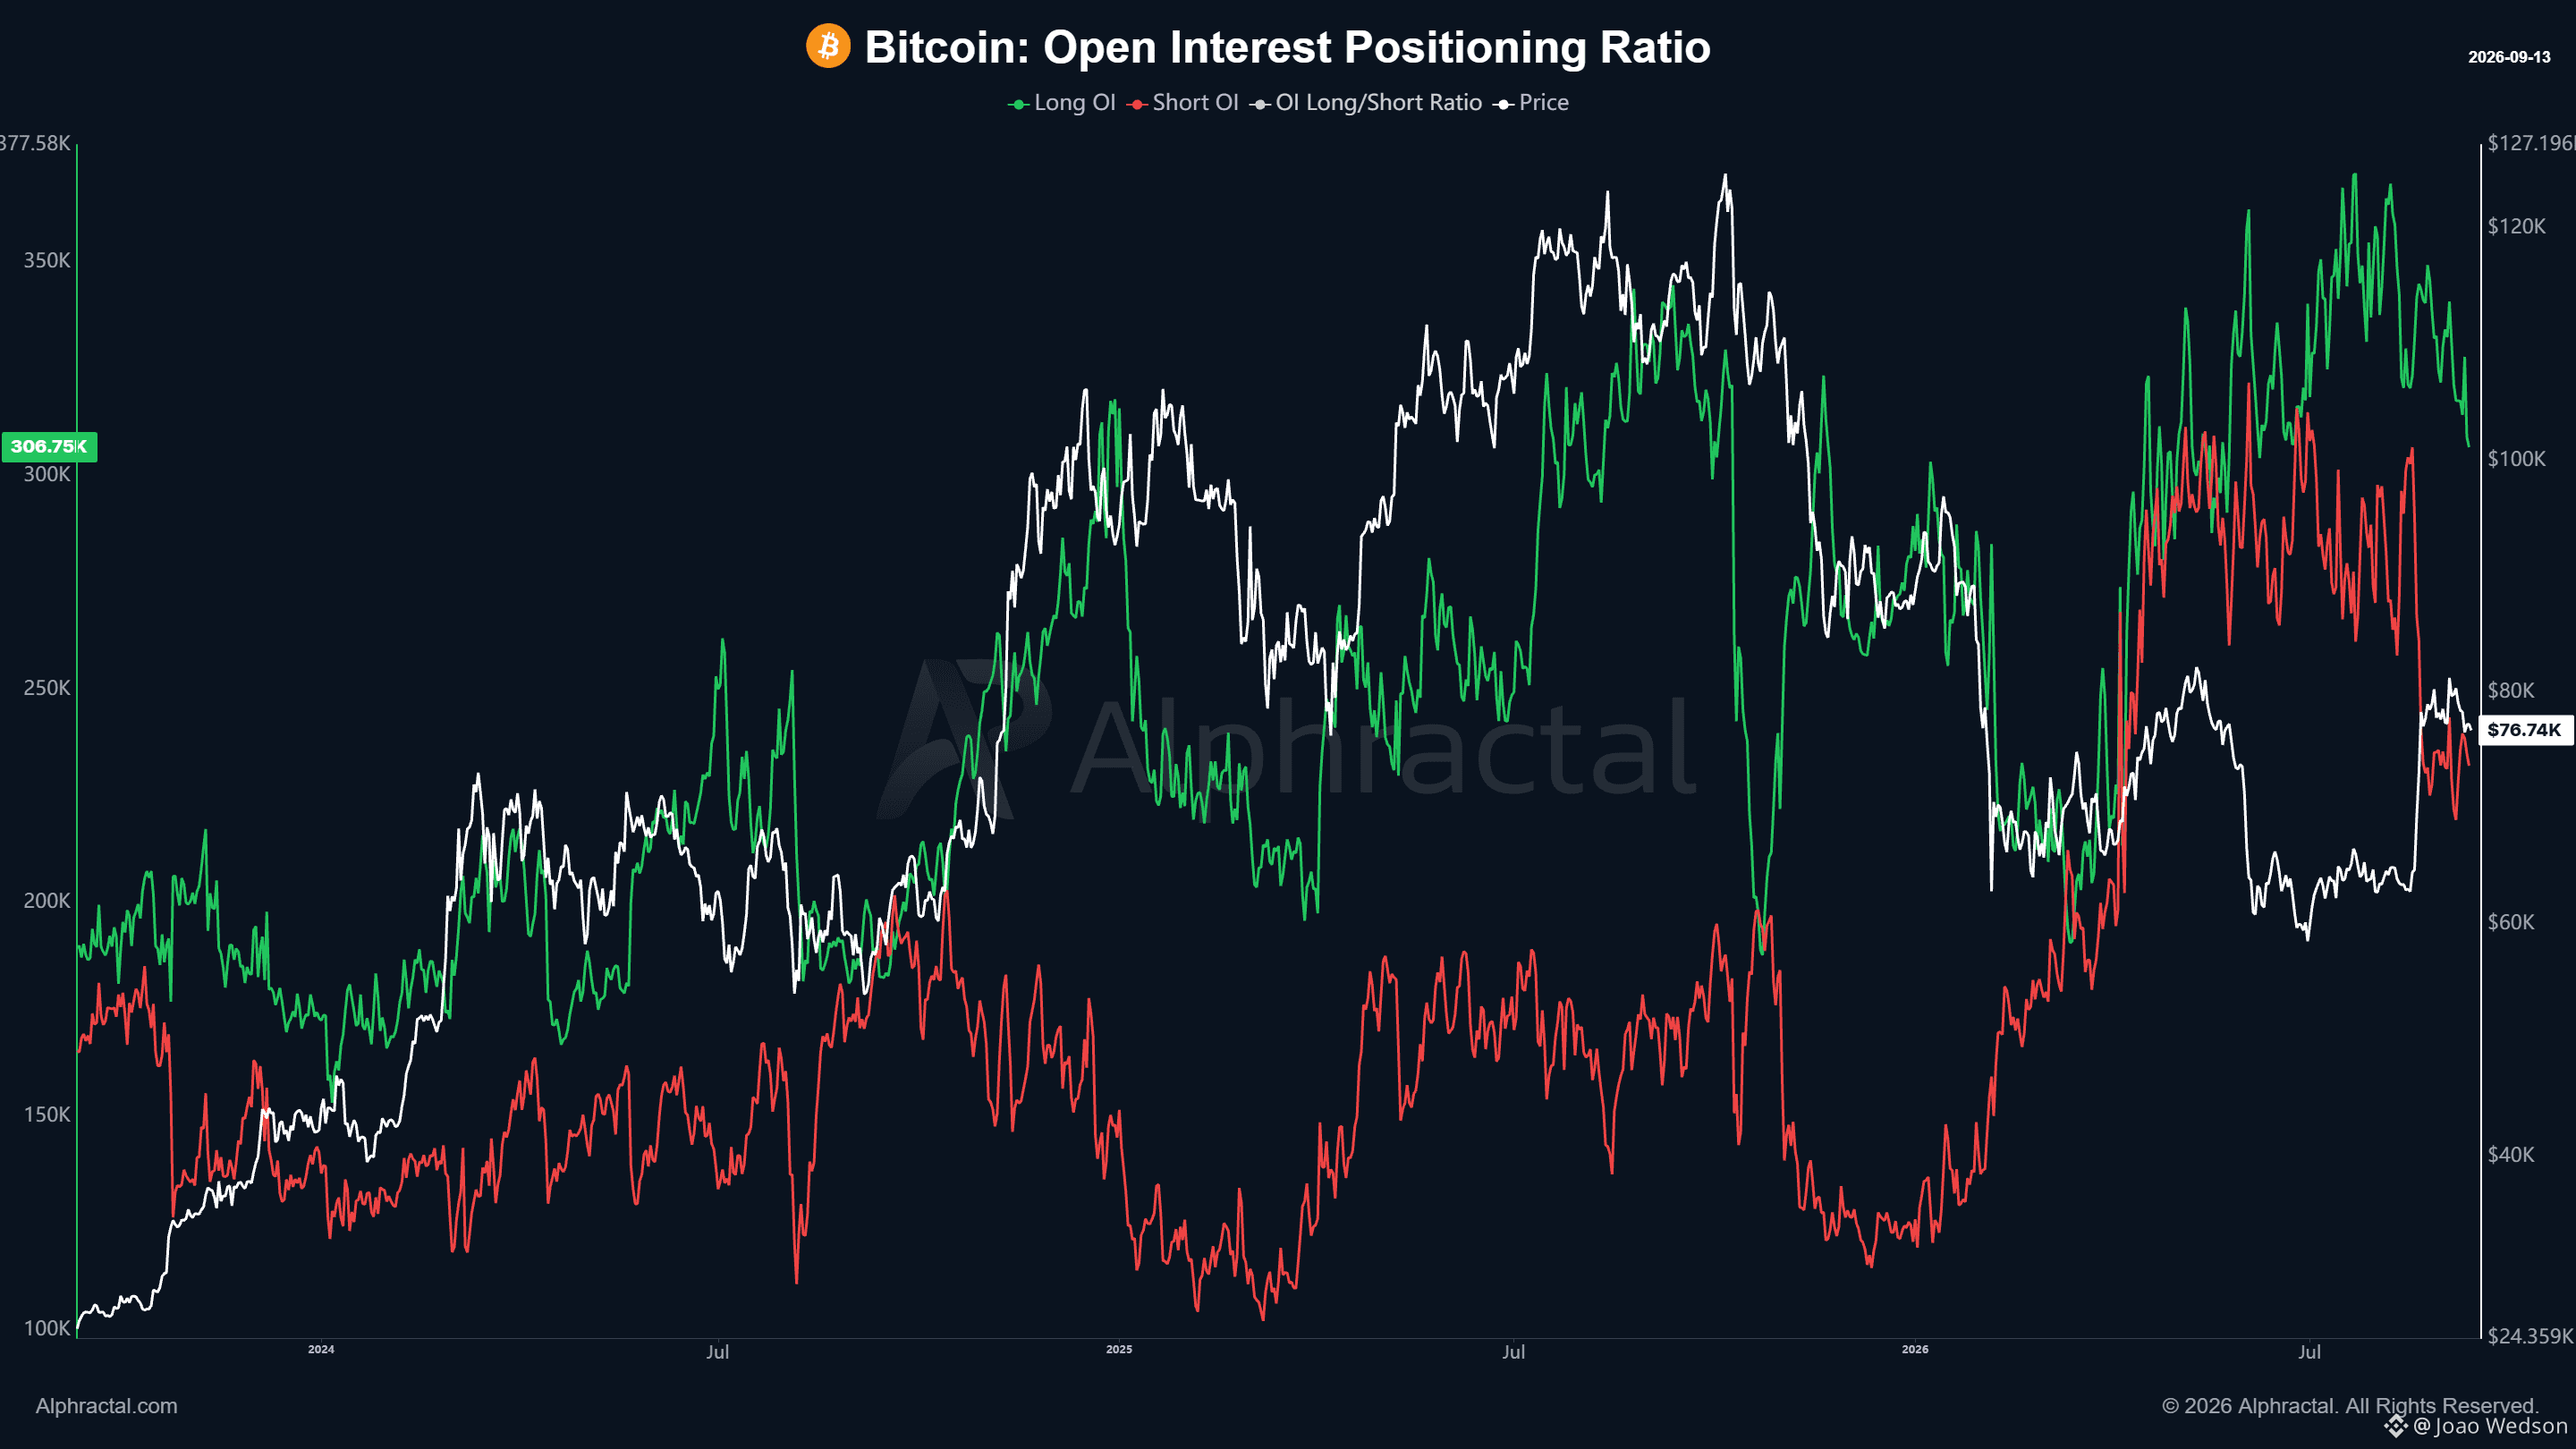
Bitcoin Long and Short positions are declining again across the market. Around 50K $BTC BTC in Long positions have been closed recently, showing that part of the leverage built up by bullish traders is being reduced. Short positions are also moving lower, suggesting a broader reduction in exposure. Even so, the OI Long/Short Ratio remains positive at 1.32, which means Long positions still have a clear advantage across many exchanges. The market is becoming less leveraged, but positioning remains tilted to the Long side.
Bitcoin Long and Short positions are declining again across the market. Around 50K $BTC BTC in Long positions have been closed recently, showing that part of the leverage built up by bullish traders is being reduced. Short positions are also moving lower, suggesting a broader reduction in exposure. Even so, the OI Long/Short Ratio remains positive at 1.32, which means Long positions still have a clear advantage across many exchanges. The market is becoming less leveraged, but positioning remains tilted to the Long side.
59
·
--
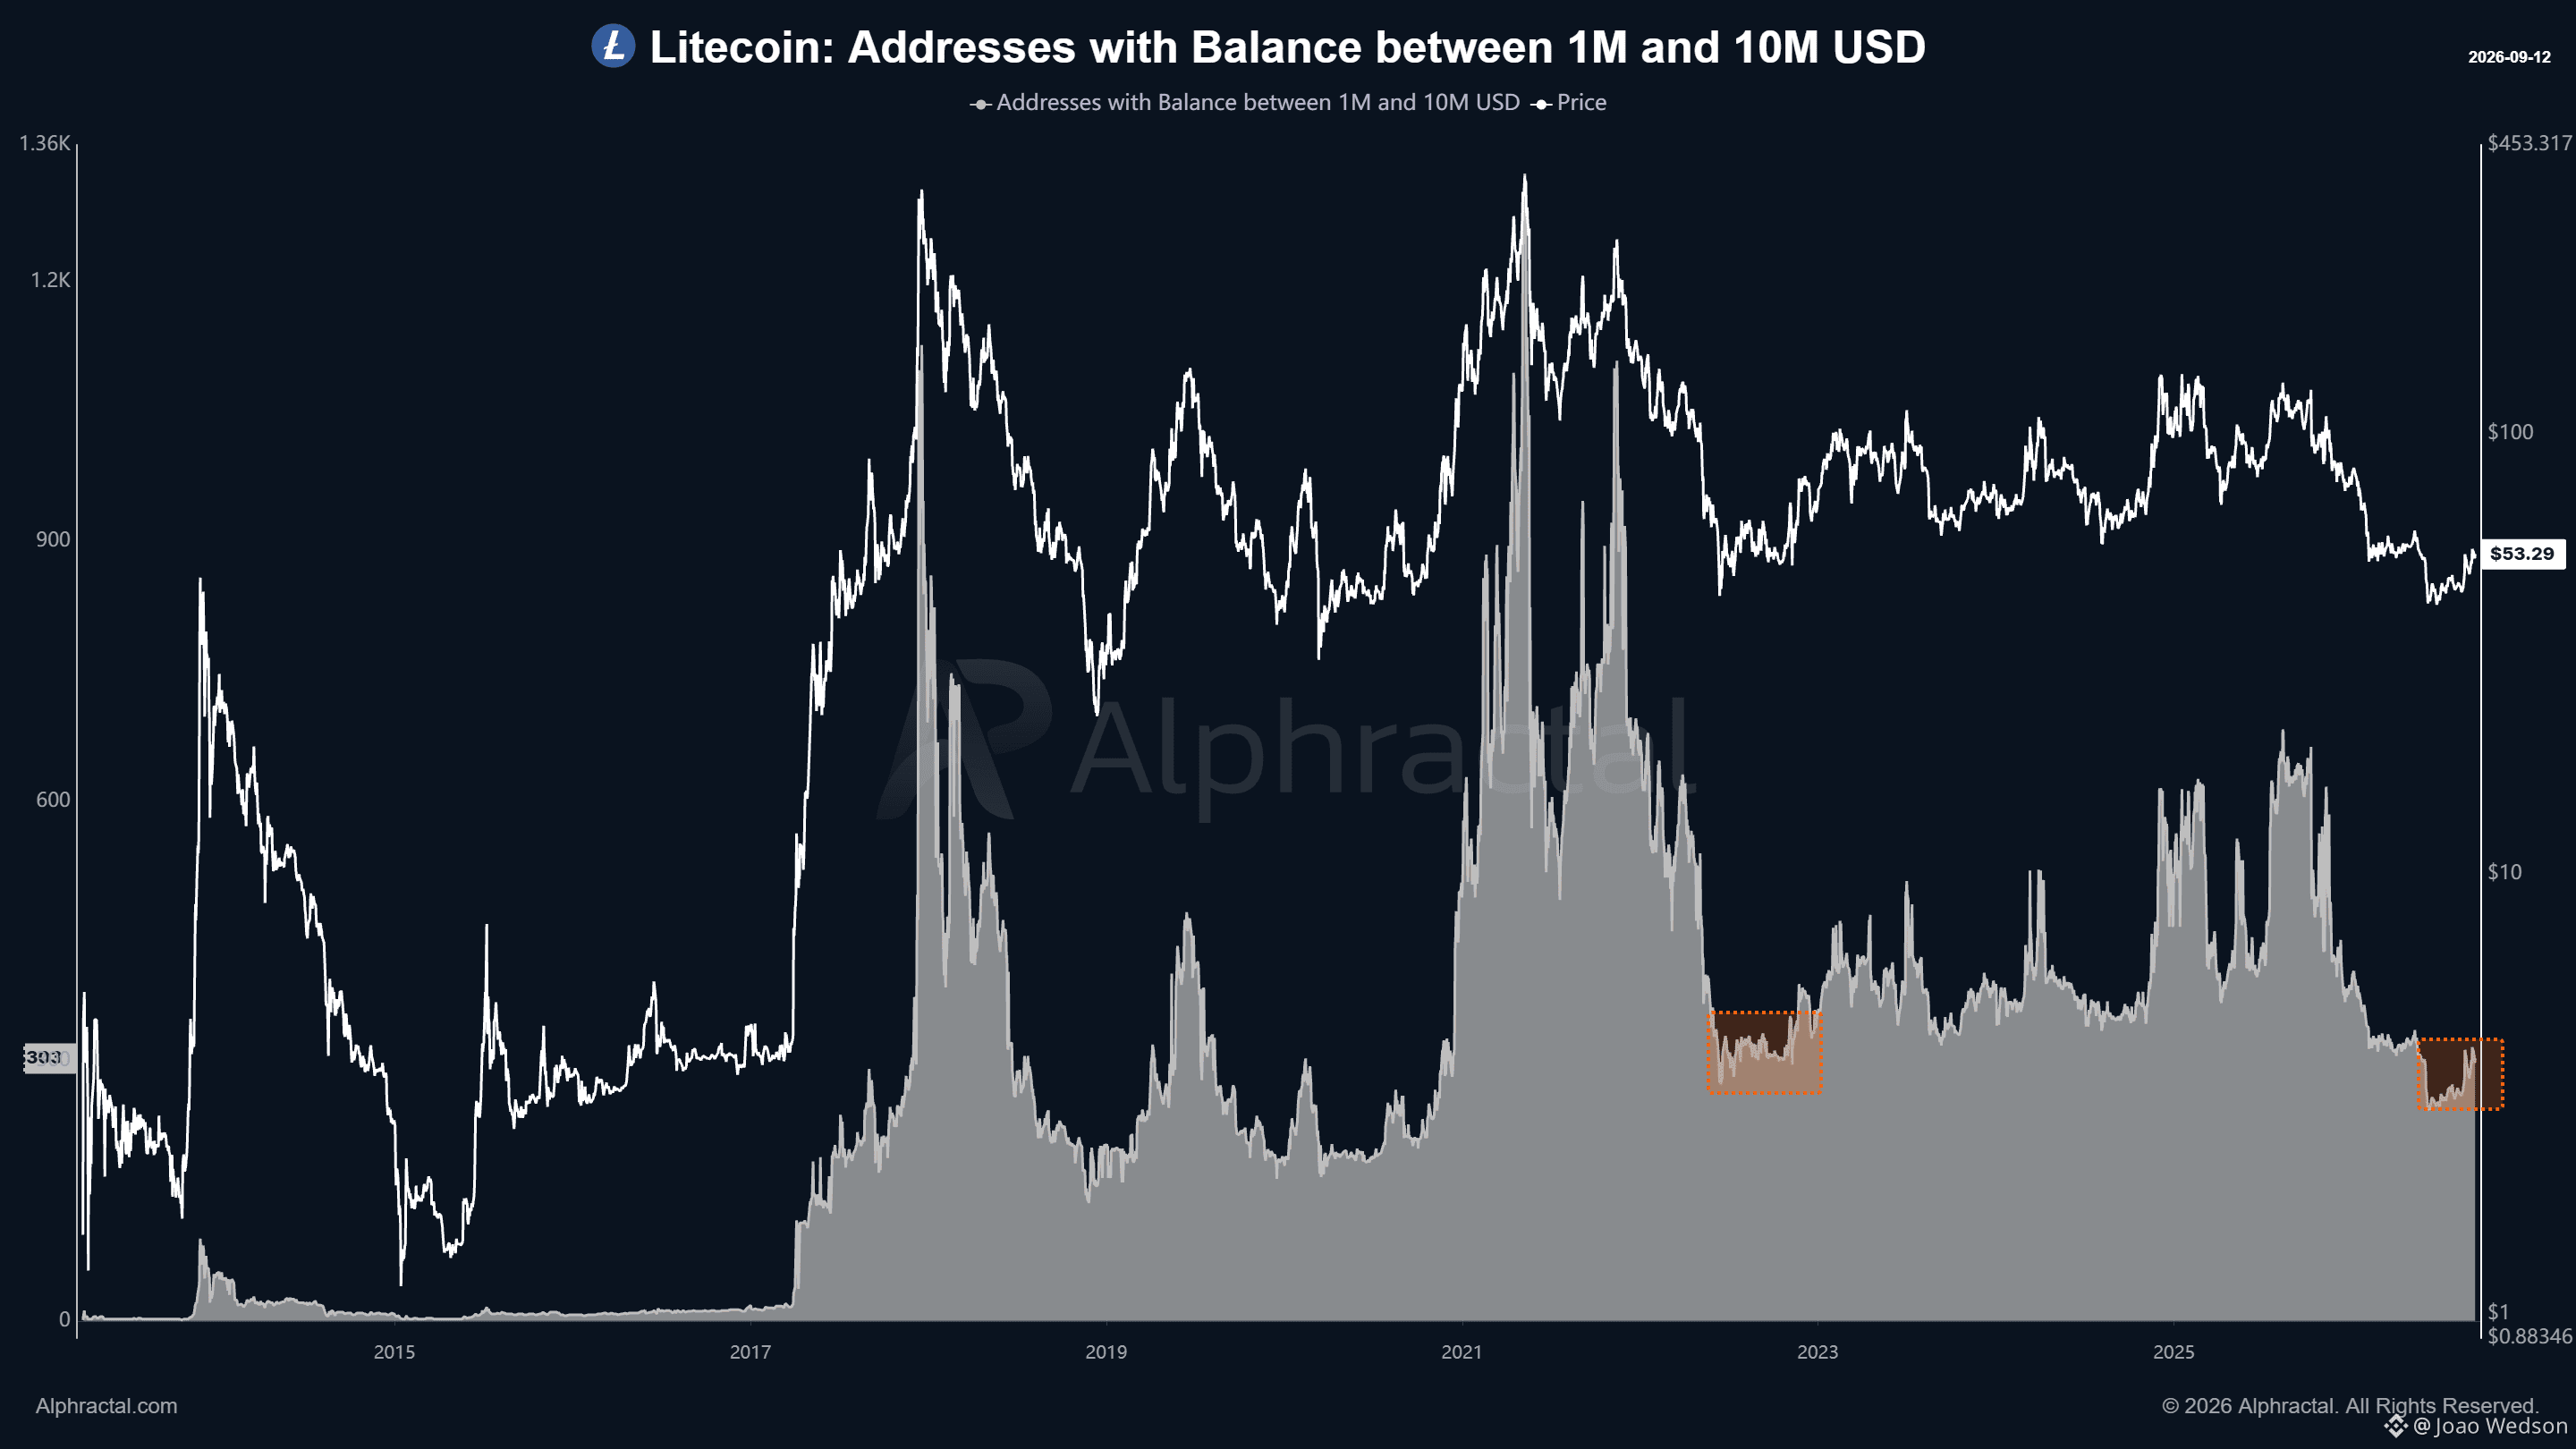
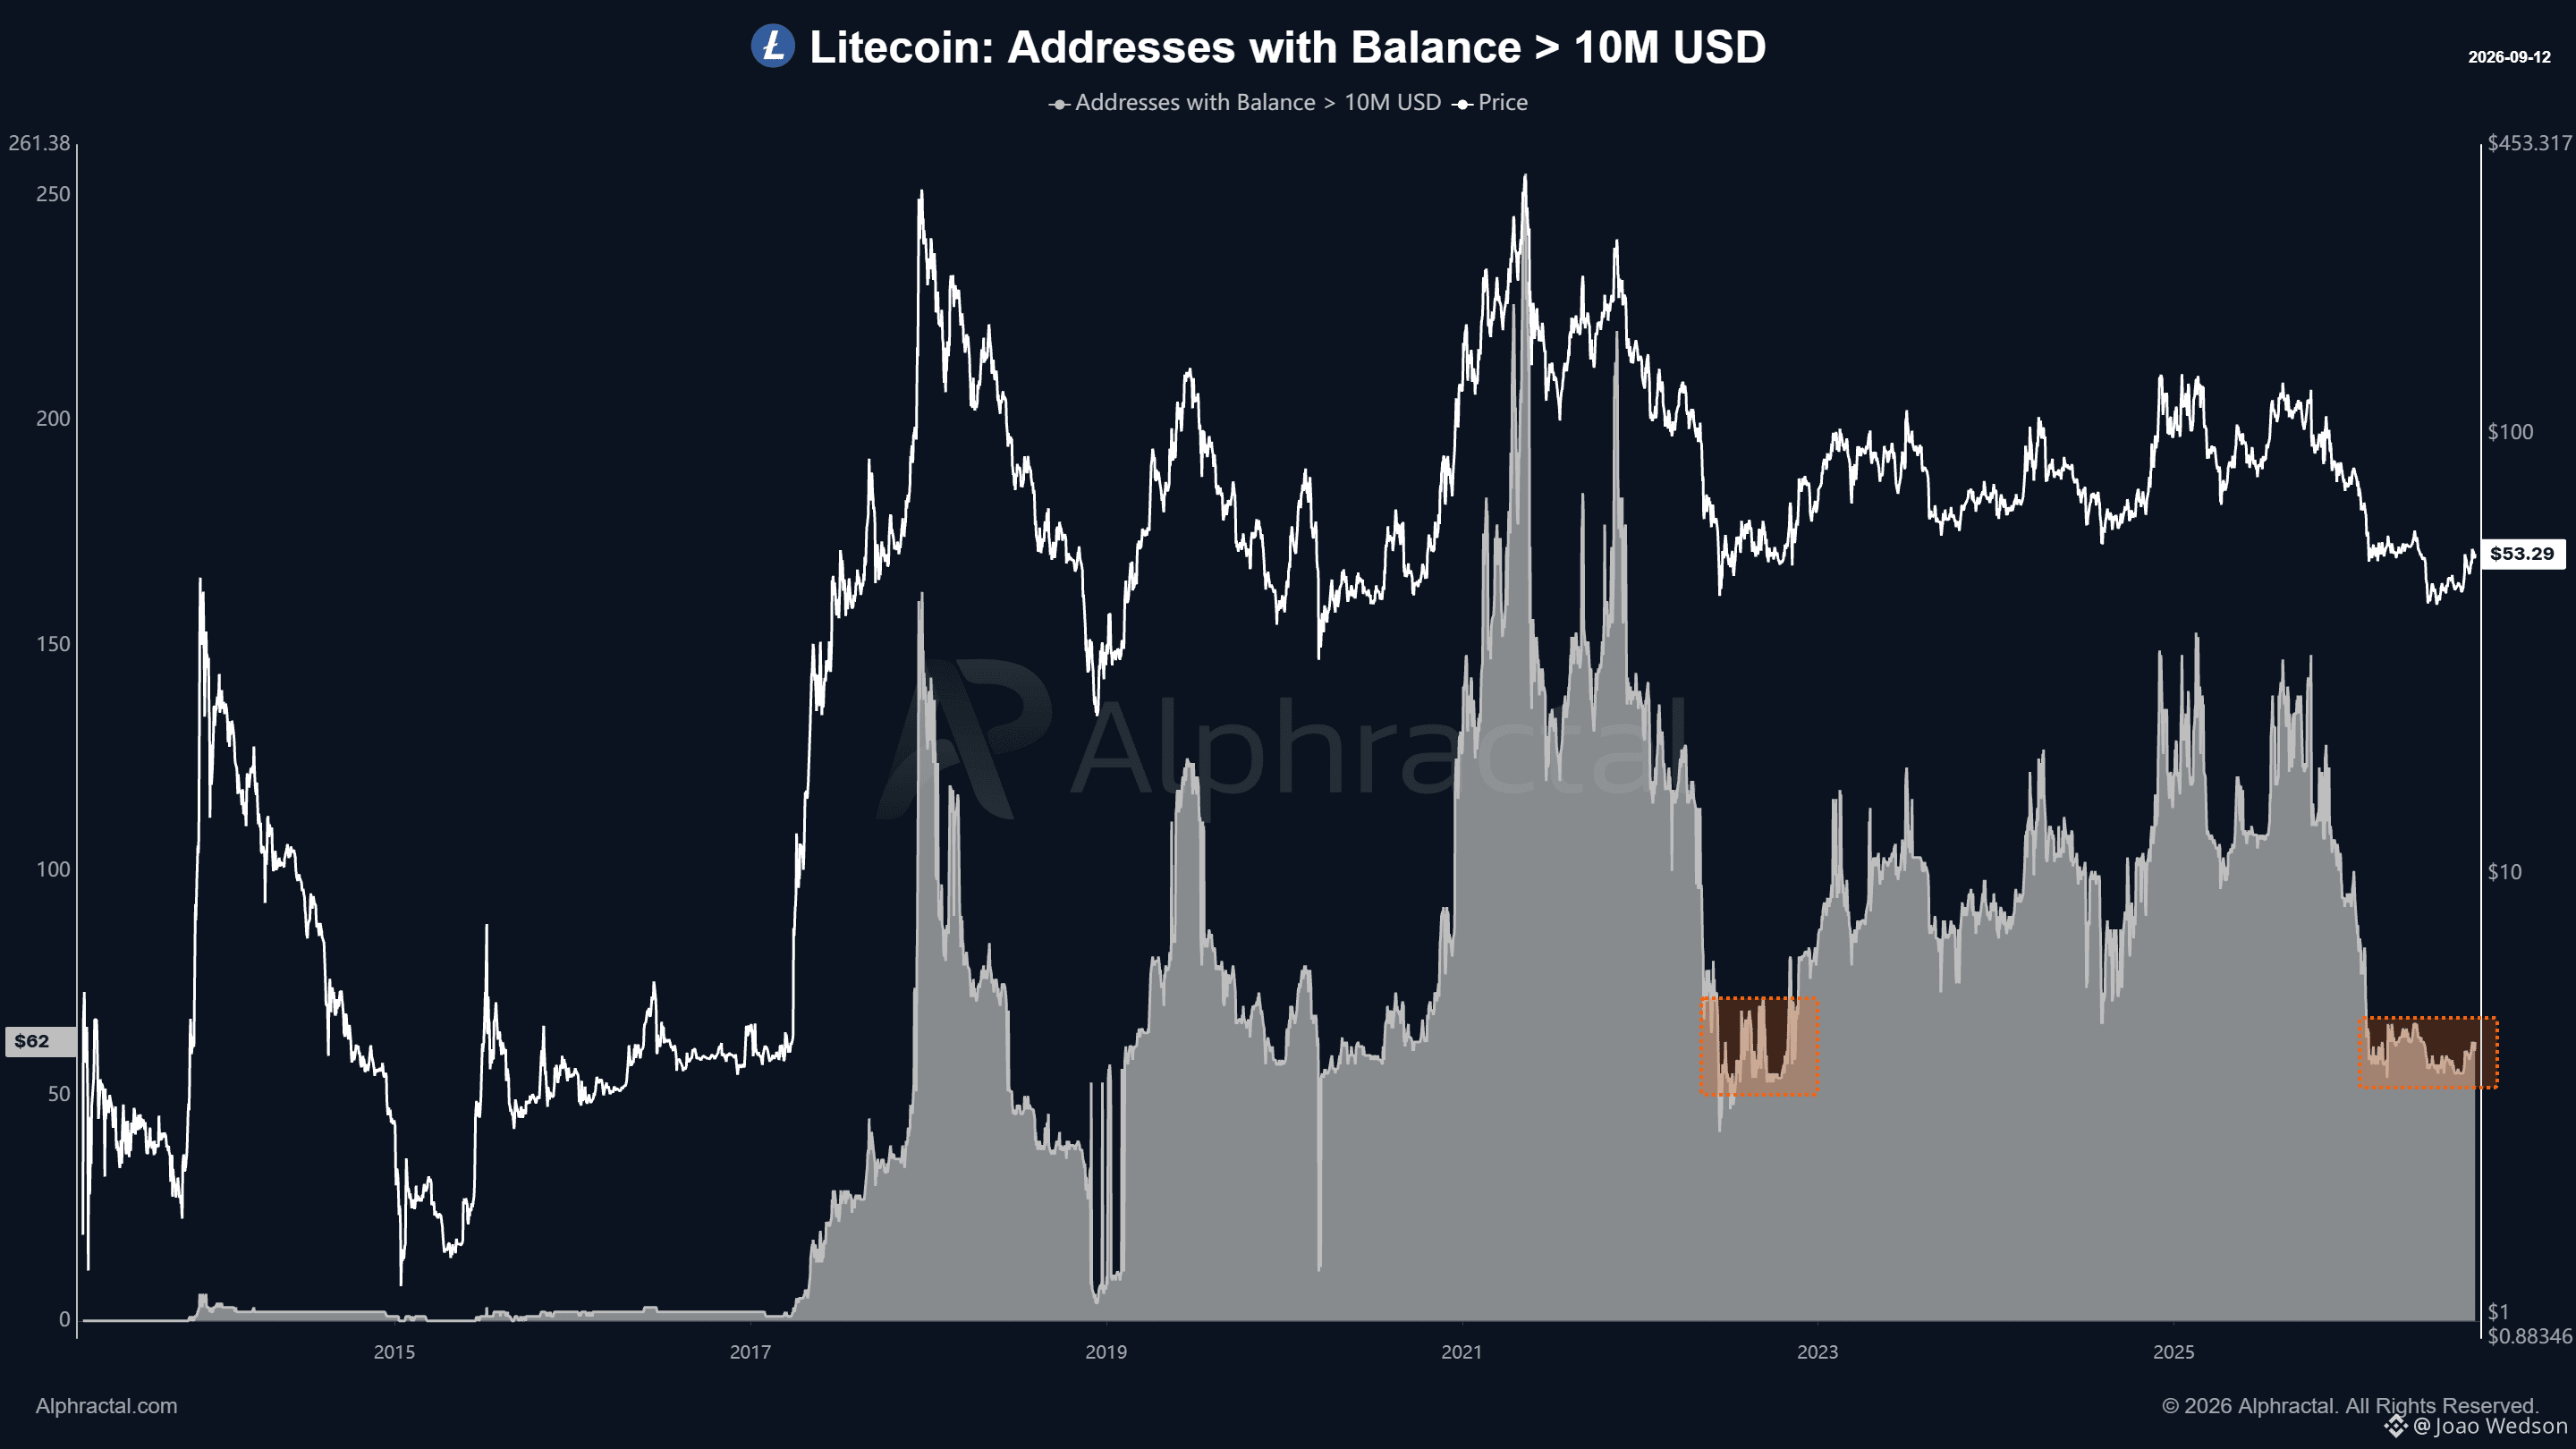
ဒေါ်လာ ၁ သန်းမှ ၁၀ သန်းကြား ကိုင်ဆောင်ထားသည့် Litecoin (LTC) လိပ်စာများနှင့် ဒေါ်လာ ၁၀ သန်းထက်ပို ကိုင်ဆောင်ထားသည့် လိပ်စာများ၏ အရေအတွက်သည် ၂၀၂၂ ဈေးကွက်စက်ဝန်း၏ အောက်ဆုံးကာလဝန်းကျင်တွင် နောက်ဆုံးတွေ့ခဲ့ရသည့် အဆင့်များသို့ ပြန်လည်ကျဆင်းသွားသည်။
၎င်းသည် ဝေလငါးကြီးများ ပါဝင်လှုပ်ရှားမှုအတွက် အရေးပါသော ပြောင်းလဲမှုတစ်ခုဖြစ်သည်။ ဈေးကွက်စက်ဝန်း၏ အားကောင်းသည့်ကာလများနှင့် နှိုင်းယှဉ်ပါက ပမာဏများစွာ ကိုင်ဆောင်သူများ၏ ပါဝင်မှုမှာ သိသိသာသာ လျော့နည်းနေသည်။
သမိုင်းကြောင်းအရ အလားတူ ကျုံ့ကျဆင်းမှုများသည် ဈေးကွက်ဖိအားများပြီး ပြန်လည်ချိန်ညှိမှု ပြင်းထန်သည့်ကာလများတွင် ဖြစ်ပေါ်လေ့ရှိသည်။ ၎င်းက LTC သည် အောက်ဆုံးအဆင့်သို့ ရောက်ရှိနေပြီဟု အာမမခံသော်လည်း ဝေလငါးများ၏ လှုပ်ရှားမှုသည် သမိုင်းကြောင်းအရ အလွန်နိမ့်ကျသည့် အဆင့်များအနီးတွင် ရှိနေကြောင်း ပြသနေသည်။
$LTC #Litecoin
46
·
--
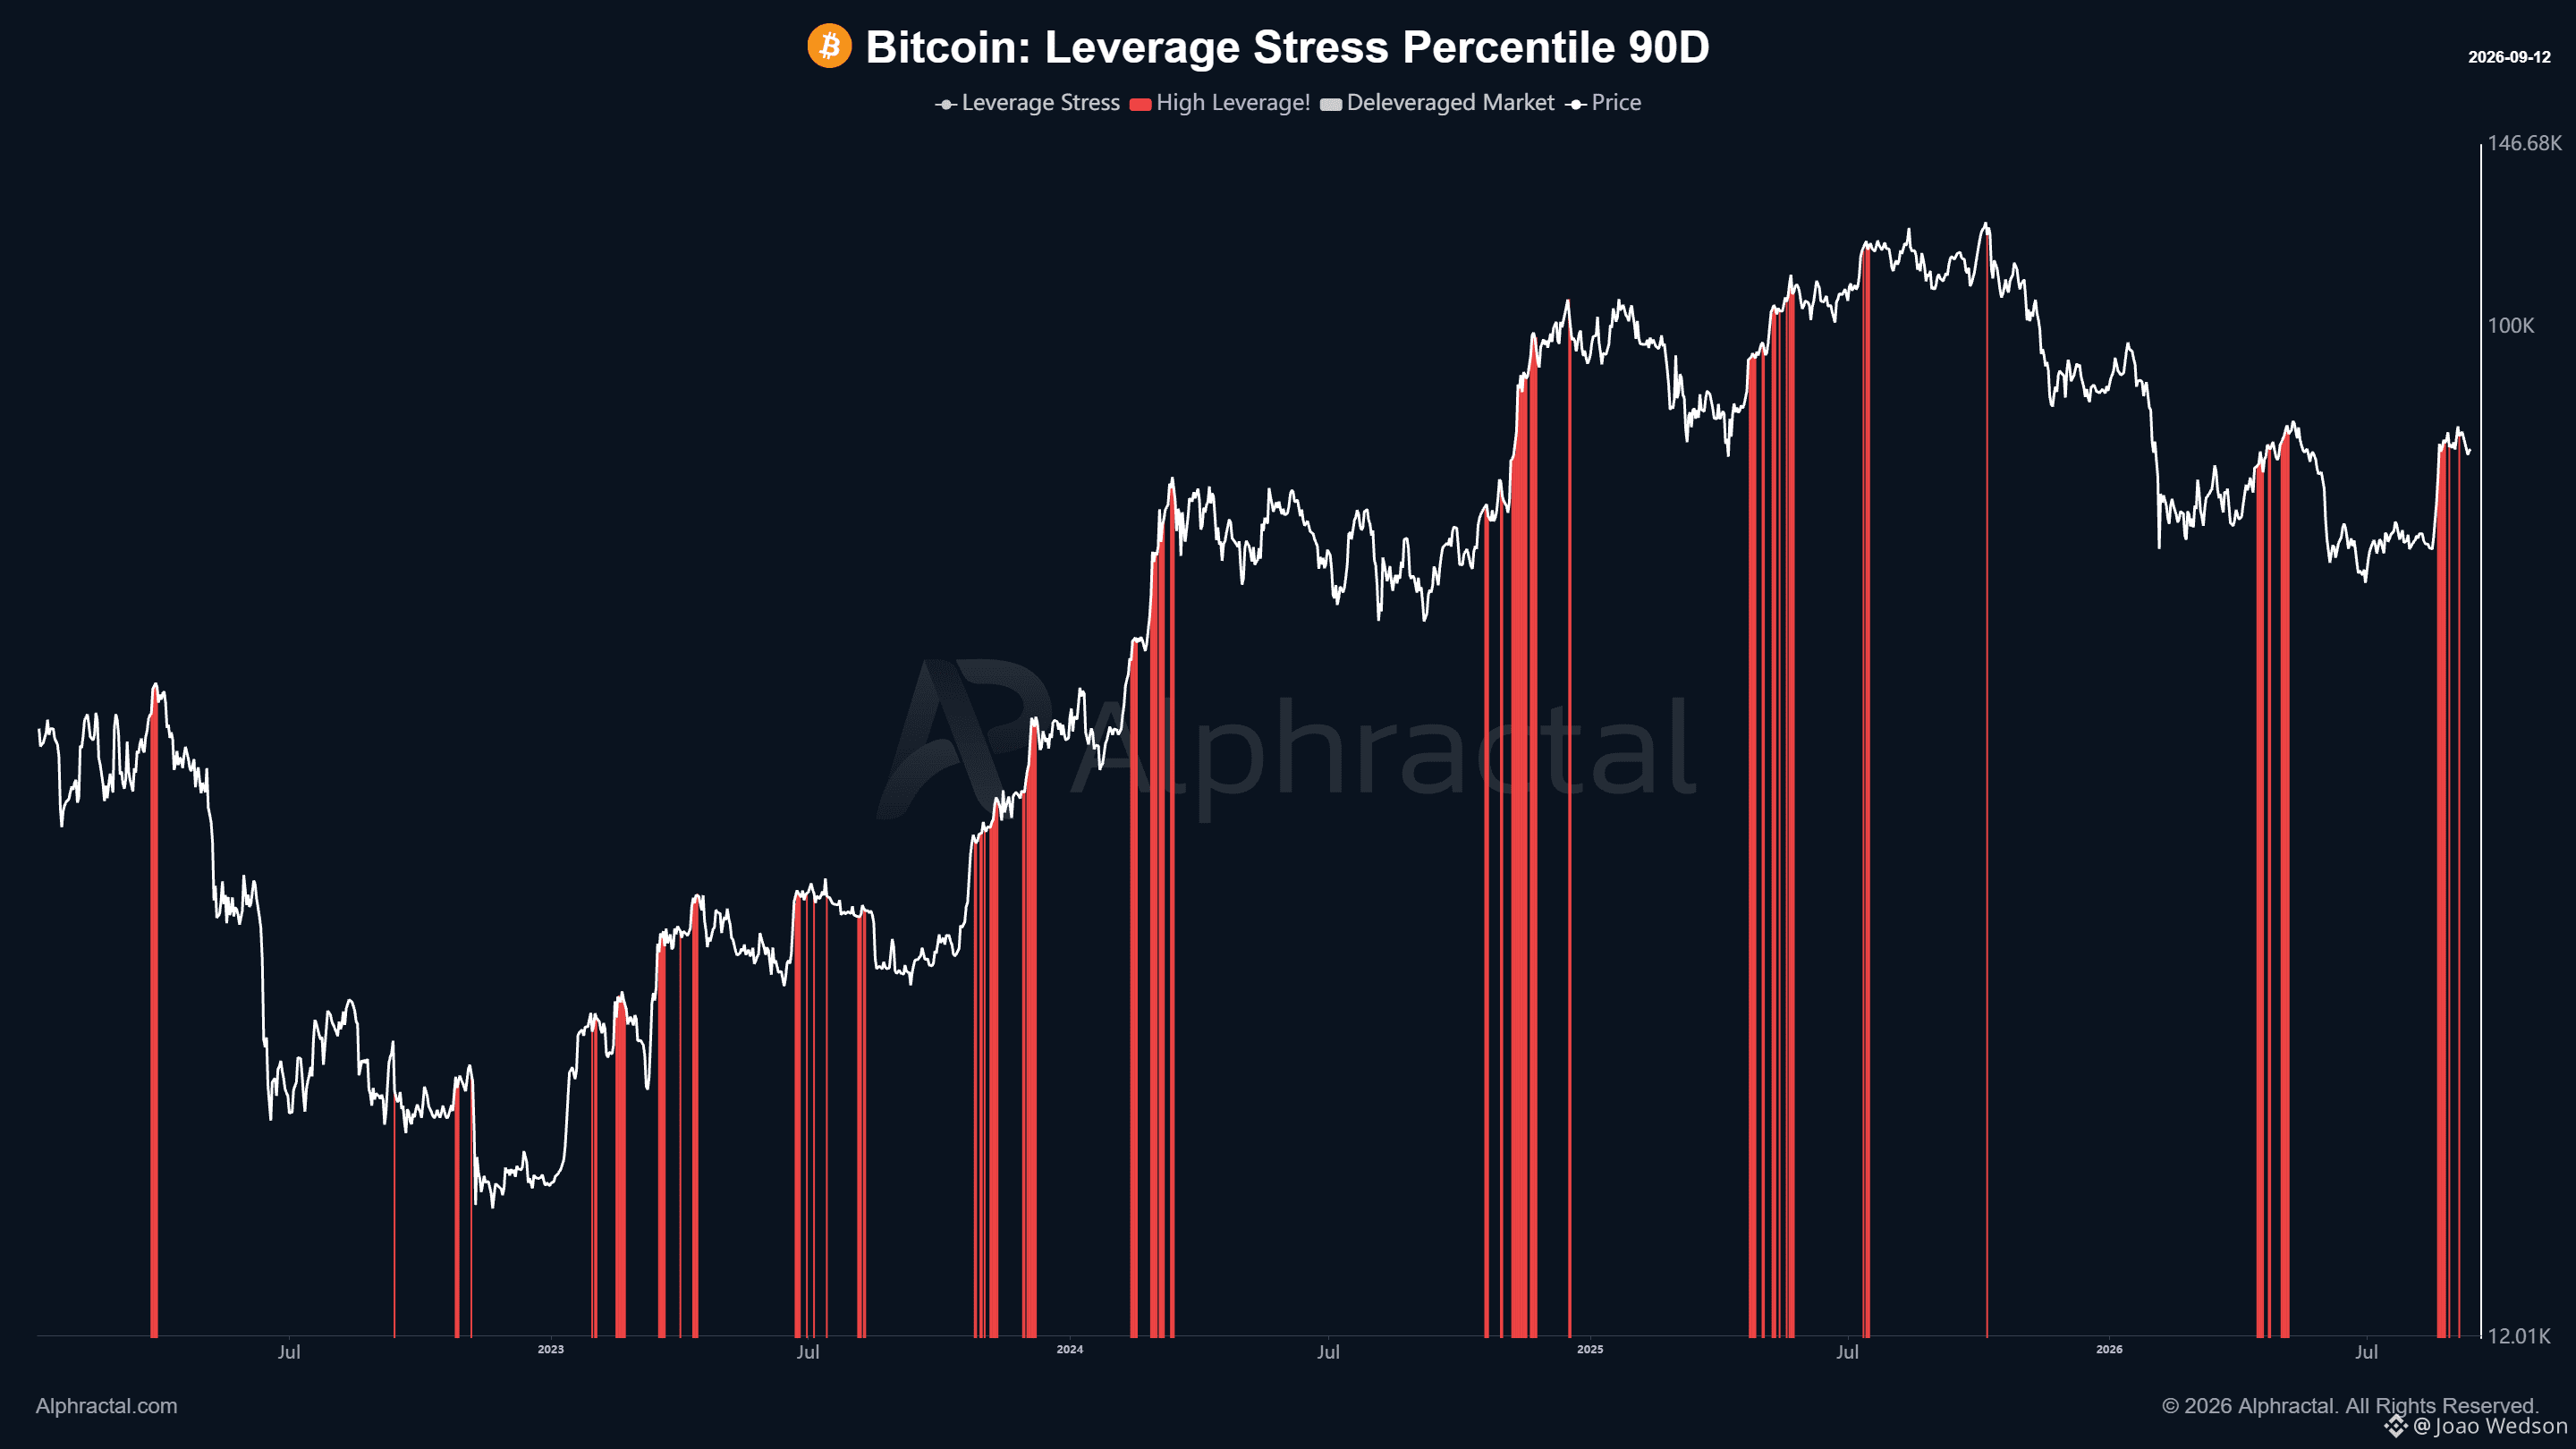
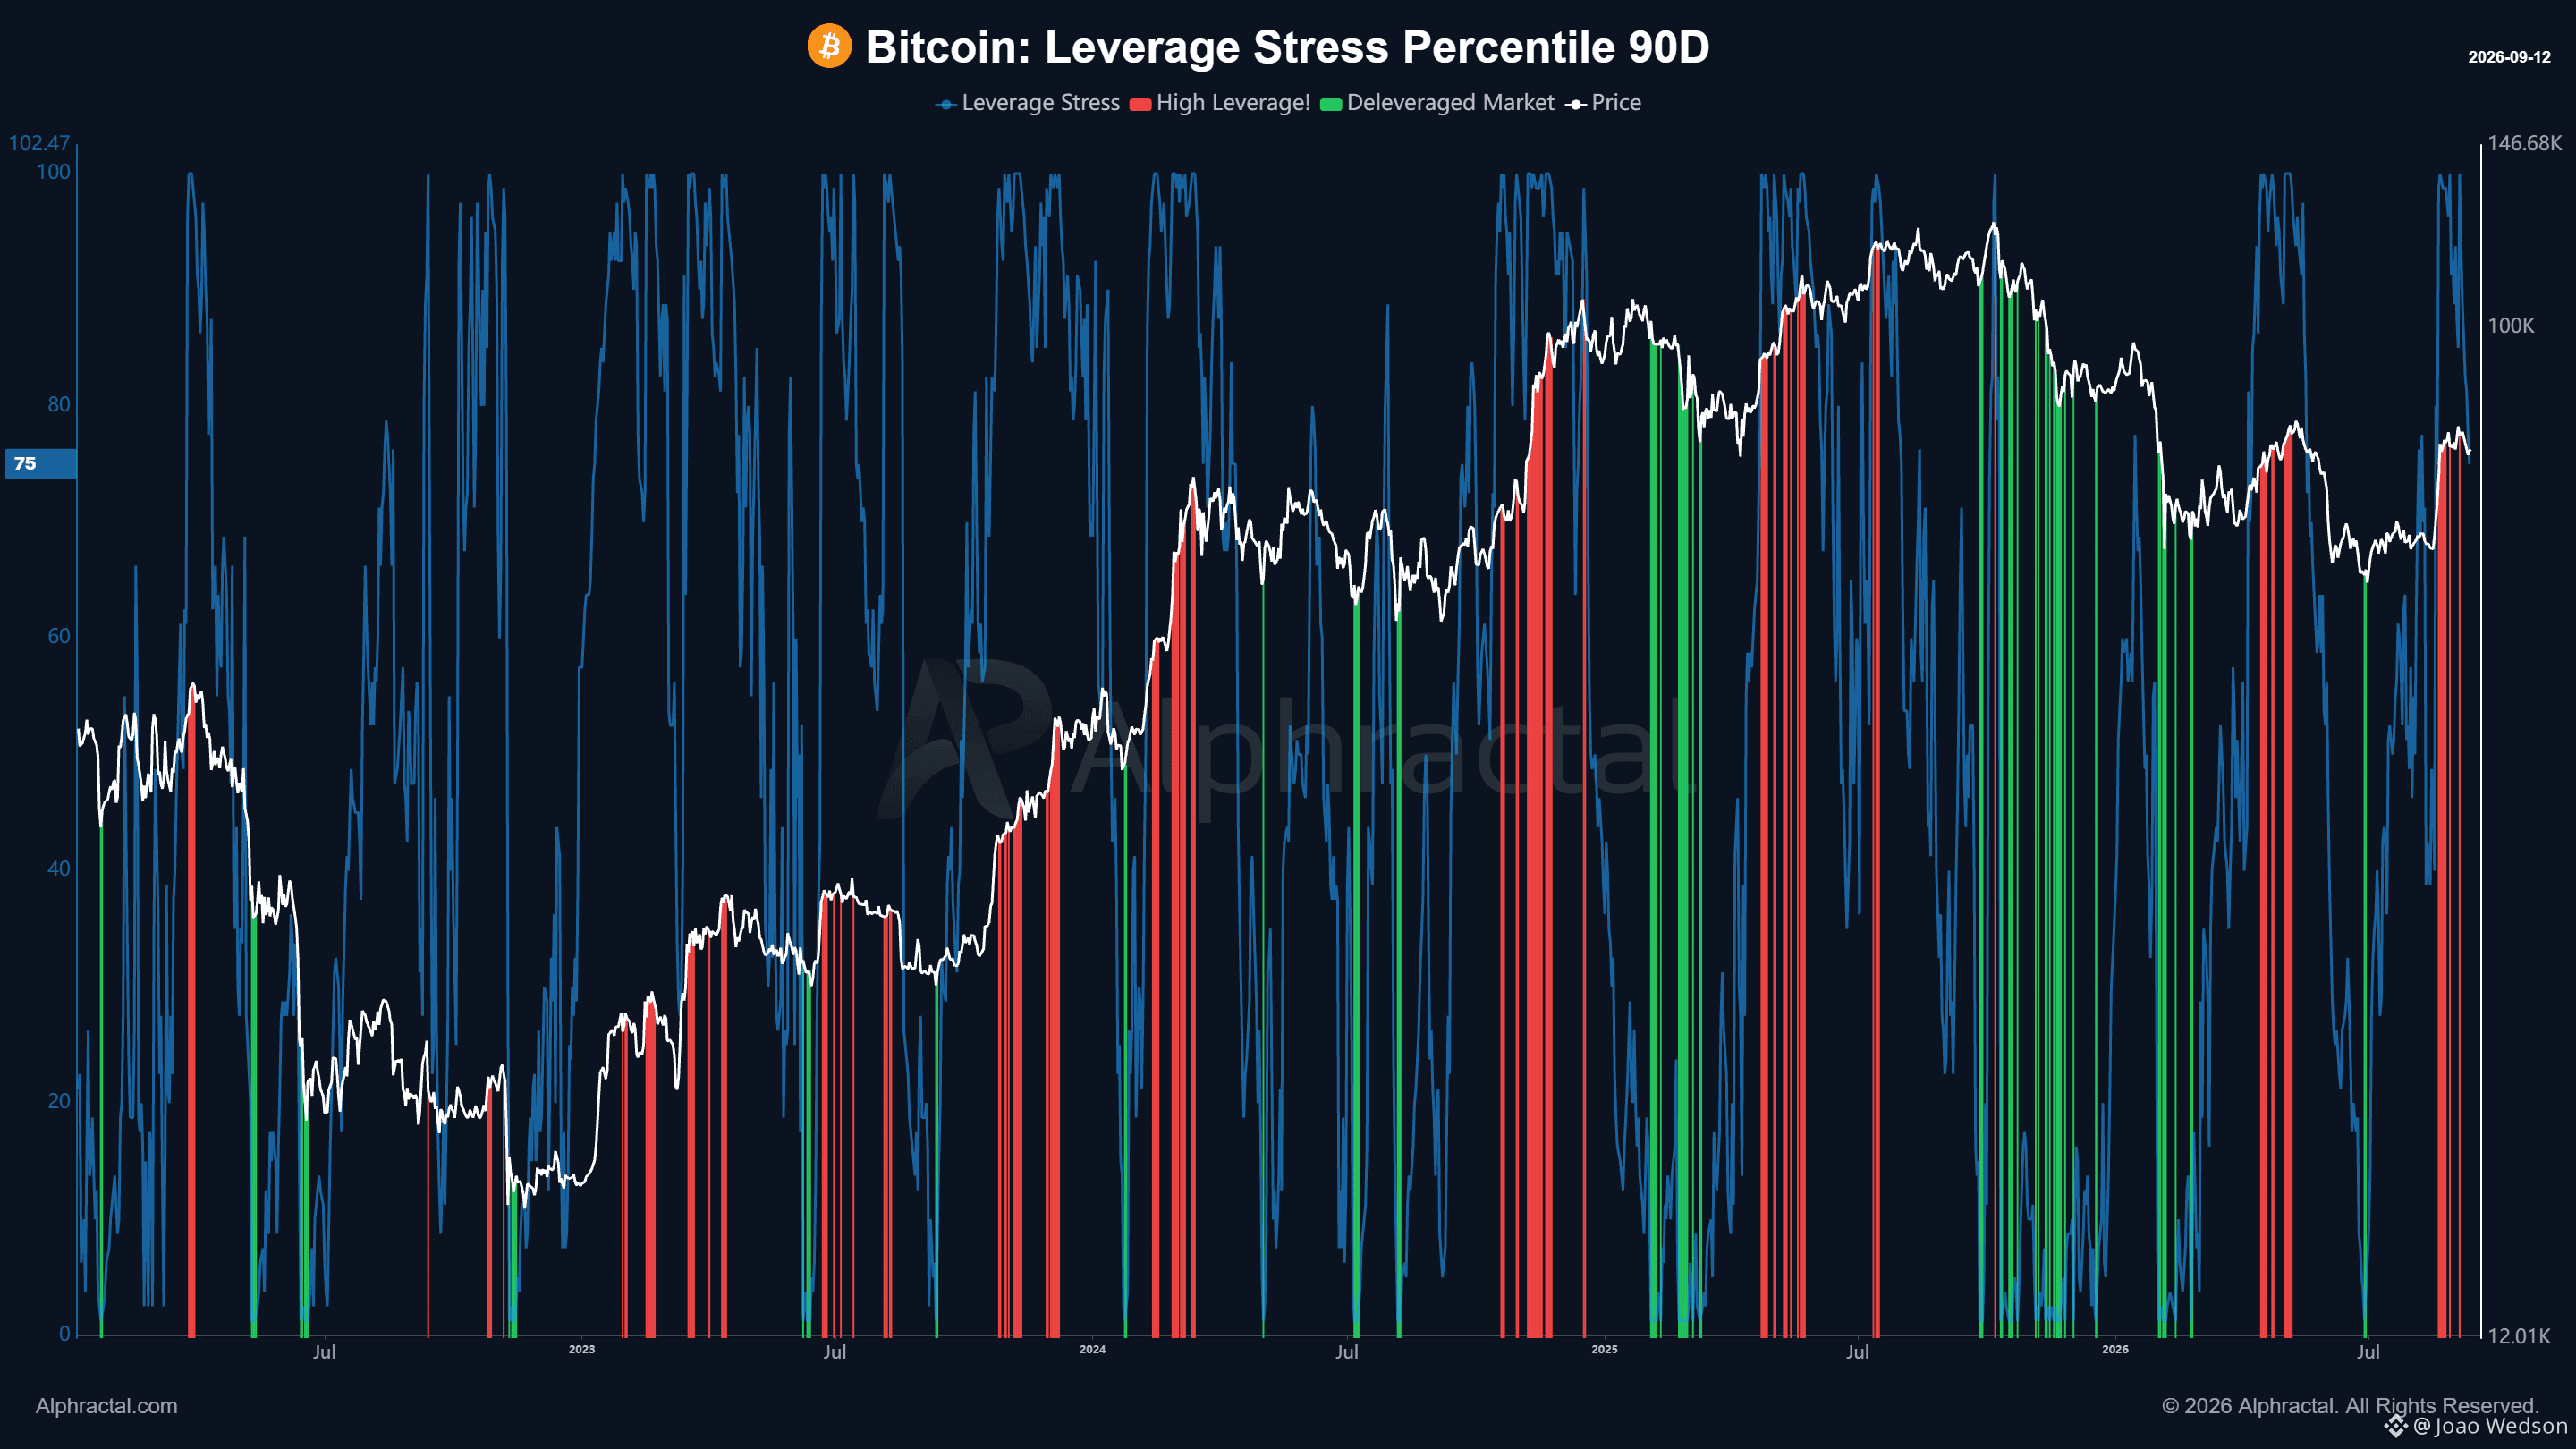
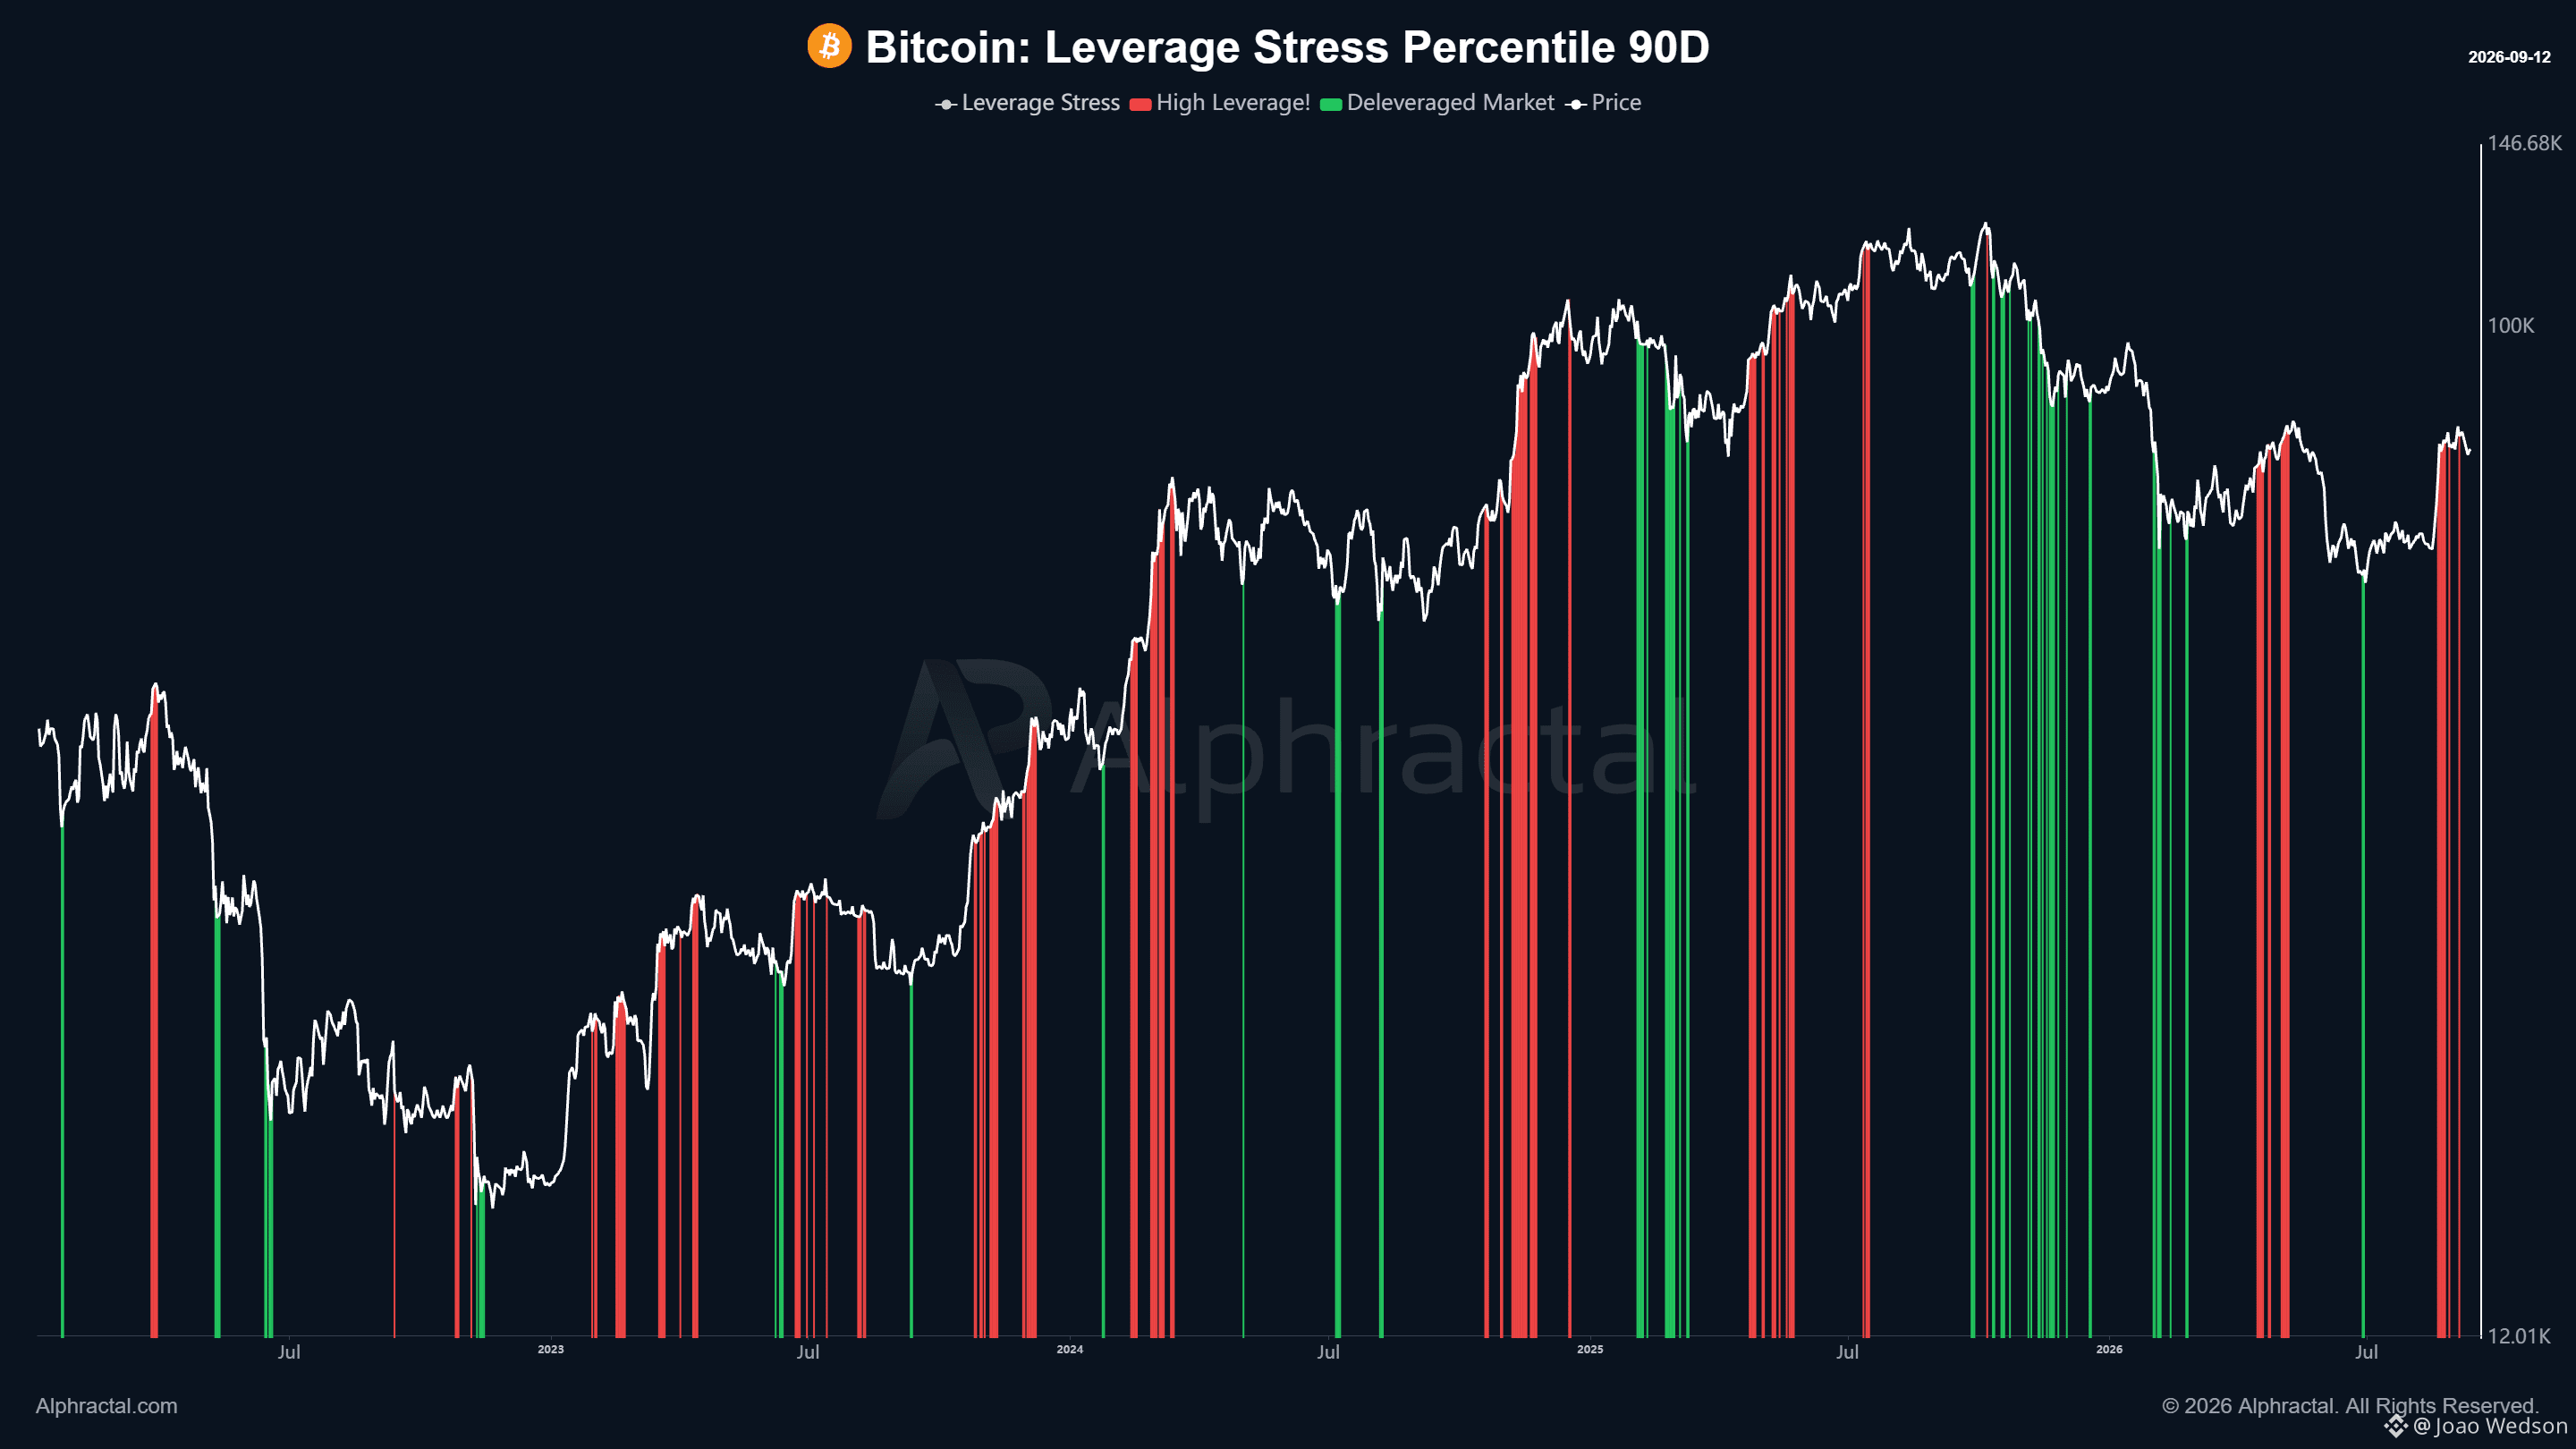
လွန်ခဲ့တဲ့ ရက်အနည်းငယ်အတွင်း Bitcoin မှာ leverage အရမ်းမြင့်မားနေခဲ့ပြီး အခုတော့ အဲဒီပိုလျှံတဲ့ leverage က ပြန်လျော့ကျစပြုလာပါပြီ။ ဈေးကွက်က ပုံမှန်အားဖြင့် ဒီလို မညီမျှမှုမျိုးကို နည်းလမ်းနှစ်ခုထဲက တစ်ခုနဲ့ ဖြေရှင်းတတ်ပါတယ်။ တစ်ခုက ဈေးနှုန်း ပြန်လည်ချိန်ညှိမှု၊ နောက်တစ်ခုကတော့ leverage အေးသွားတဲ့အချိန်အတွင်း ဘေးတိုက်တည်ငြိမ်နေတဲ့ ကာလတစ်ခုပါ။ Bitcoin က leverage လျော့ကျနေချိန်မှာလည်း လက်ရှိဖွဲ့စည်းပုံကို ထိန်းထားနိုင်မယ်ဆိုရင် နောက်ထပ် လှုပ်ရှားမှုအတွက် ပိုကျန်းမာတဲ့ အခြေအနေတစ်ခု ဖြစ်ပါလိမ့်မယ်။ တစ်ပြိုင်နက်တည်းမှာပဲ ဈေးနှုန်းက အားနည်းလာပြီး leverage ကလည်း မြင့်မားနေဆဲ ဖြစ်နေမယ်ဆိုရင် ဈေးကွက် ပြန်တည်ငြိမ်မလာခင်အထိ နောက်ထပ် ကျဆင်းနိုင်ခြေ ပိုများလာတဲ့ ပိုကျယ်ပြန့်တဲ့ deleveraging လုပ်ငန်းစဉ်ကို ညွှန်ပြနိုင်ပါတယ်။ $BTC #Bitcoin
လွန်ခဲ့တဲ့ ရက်အနည်းငယ်အတွင်း Bitcoin မှာ leverage အရမ်းမြင့်မားနေခဲ့ပြီး အခုတော့ အဲဒီပိုလျှံတဲ့ leverage က ပြန်လျော့ကျစပြုလာပါပြီ။ ဈေးကွက်က ပုံမှန်အားဖြင့် ဒီလို မညီမျှမှုမျိုးကို နည်းလမ်းနှစ်ခုထဲက တစ်ခုနဲ့ ဖြေရှင်းတတ်ပါတယ်။ တစ်ခုက ဈေးနှုန်း ပြန်လည်ချိန်ညှိမှု၊ နောက်တစ်ခုကတော့ leverage အေးသွားတဲ့အချိန်အတွင်း ဘေးတိုက်တည်ငြိမ်နေတဲ့ ကာလတစ်ခုပါ။ Bitcoin က leverage လျော့ကျနေချိန်မှာလည်း လက်ရှိဖွဲ့စည်းပုံကို ထိန်းထားနိုင်မယ်ဆိုရင် နောက်ထပ် လှုပ်ရှားမှုအတွက် ပိုကျန်းမာတဲ့ အခြေအနေတစ်ခု ဖြစ်ပါလိမ့်မယ်။ တစ်ပြိုင်နက်တည်းမှာပဲ ဈေးနှုန်းက အားနည်းလာပြီး leverage ကလည်း မြင့်မားနေဆဲ ဖြစ်နေမယ်ဆိုရင် ဈေးကွက် ပြန်တည်ငြိမ်မလာခင်အထိ နောက်ထပ် ကျဆင်းနိုင်ခြေ ပိုများလာတဲ့ ပိုကျယ်ပြန့်တဲ့ deleveraging လုပ်ငန်းစဉ်ကို ညွှန်ပြနိုင်ပါတယ်။ $BTC #Bitcoin
50
·
--
ဘာသာပြန်ဆိုချက် ကြည့်မည်
Zcash has entered a region where taking some profits starts to make sense.
Price is now above several important on-chain levels and has also moved significantly higher within the Fibonacci-Adjusted Market Mean Price, entering a more stretched zone.
Market stress has also reached the second-highest level of the model, which is usually an interesting area to start reducing exposure.
The NUPL remains positive as well, showing that the network is holding a significant amount of unrealized profit.
And there is one more important detail. Addresses holding 100K to 1M $ZEC have started to decline slightly, which is a typical sign of profit-taking by whales.
For those who accumulated much lower, this is already a region worth paying attention to.
#Zcash $ZEC


54
·
--
Zcash သည် အမြတ်အချို့ကို စတင်ရယူခြင်းက သင့်လျော်လာသည့် အခြေအနေတစ်ခုသို့ ရောက်ရှိလာပါပြီ။
ဈေးနှုန်းသည် ယခုအခါ အရေးကြီးသော on-chain အဆင့်များစွာကို ကျော်လွန်နေပြီး Fibonacci-Adjusted Market Mean Price အတွင်းတွင်လည်း သိသိသာသာ မြင့်တက်လာကာ အတော်အတန် အဆမတန်မြင့်တက်နေသည့် ဇုန်သို့ ဝင်ရောက်လာပါပြီ။
စျေးကွက်ဖိအားသည်လည်း မော်ဒယ်၏ ဒုတိယအမြင့်ဆုံးအဆင့်သို့ ရောက်ရှိလာပါပြီ။ ဤအဆင့်သည် ပိုင်ဆိုင်မှုထိတွေ့မှုကို စတင်လျှော့ချရန် စိတ်ဝင်စားစရာကောင်းသည့် အခြေအနေတစ်ခု ဖြစ်လေ့ရှိပါတယ်။
NUPL သည်လည်း အပေါင်းလက္ခဏာဆောင်နေဆဲဖြစ်ပြီး ကွန်ရက်အတွင်း အကောင်အထည်မဖော်ရသေးသော အမြတ်ပမာဏ များပြားစွာ ရှိနေကြောင်း ပြသနေပါတယ်။
နောက်ထပ် အရေးကြီးတဲ့အချက်တစ်ခုလည်း ရှိပါသေးတယ်။ $ZEC 100K မှ 1M အထိ ကိုင်ဆောင်ထားသော လိပ်စာအရေအတွက်သည် အနည်းငယ် စတင်ကျဆင်းလာပြီး၊ ၎င်းသည် ဝေလငါးများ အမြတ်ရယူနေသည့် ပုံမှန်လက္ခဏာတစ်ခု ဖြစ်ပါတယ်။
ဈေးနှုန်းများစွာ နိမ့်နေချိန်ကတည်းက စုဆောင်းထားသူများအတွက်တော့ ယခုအခြေအနေသည် အာရုံစိုက်စောင့်ကြည့်သင့်သည့် အဆင့်တစ်ခု ဖြစ်နေပါပြီ။
Alphractal အစီအစဉ်အားလုံးအတွက် 50% လျှော့စျေး ပရိုမိုးရှင်းသည် ယခုအပတ်တွင် ကုန်ဆုံးတော့မှာ ဖြစ်ပါတယ်။
ပလက်ဖောင်းကို မစမ်းသုံးရသေးပါက အခမဲ့အစမ်းသုံးခွင့်ကို ရယူပြီး ကျွန်ုပ်တို့၏ မက်ထရစ်များ၊ Alpha AI နှင့် ကိရိယာများကို လေ့လာကြည့်ပါ။ Alphractal က သင့်အတွက် ဘာတွေ လုပ်ဆောင်ပေးနိုင်သည်ကိုလည်း ကြည့်ရှုနိုင်ပါတယ်။
အချိန်ကန့်သတ်ထားသော 50% လျှော့စျေး။ လက်လွတ်မခံပါနဲ့။
https://app.alphractal.com/plans?utm_source=coinmarketcap&utm_medium=update


50
·
--
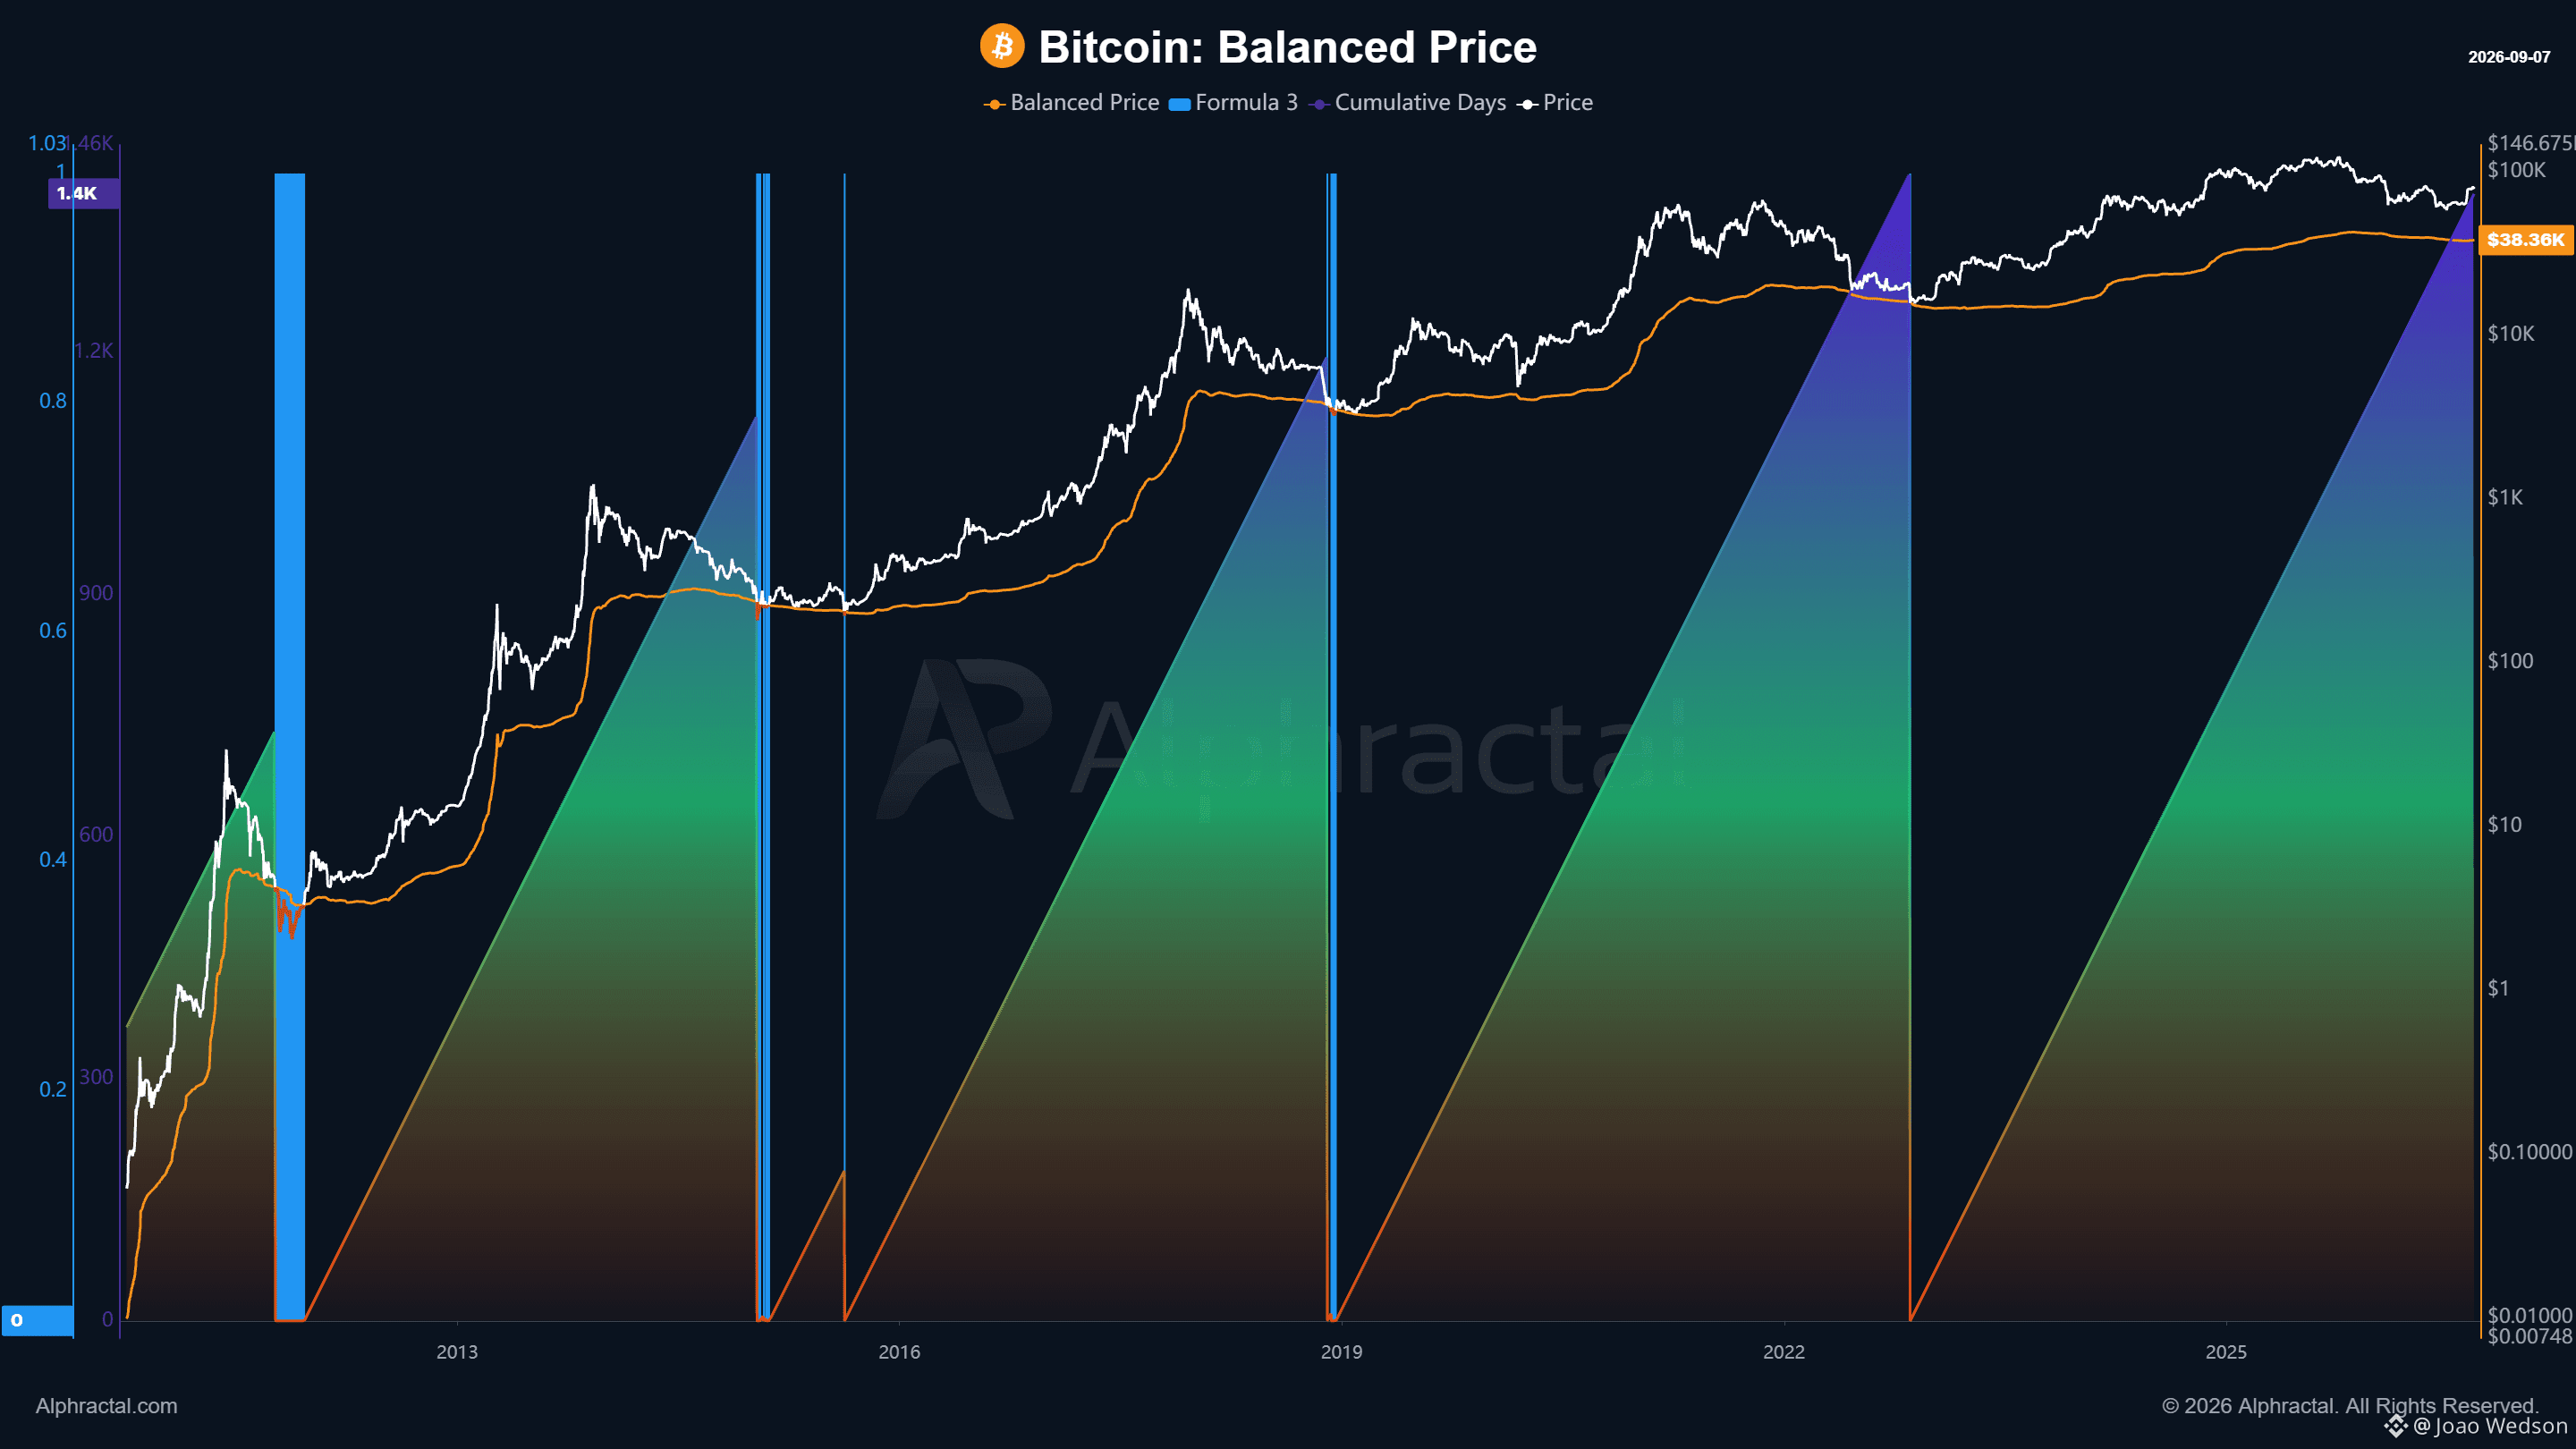
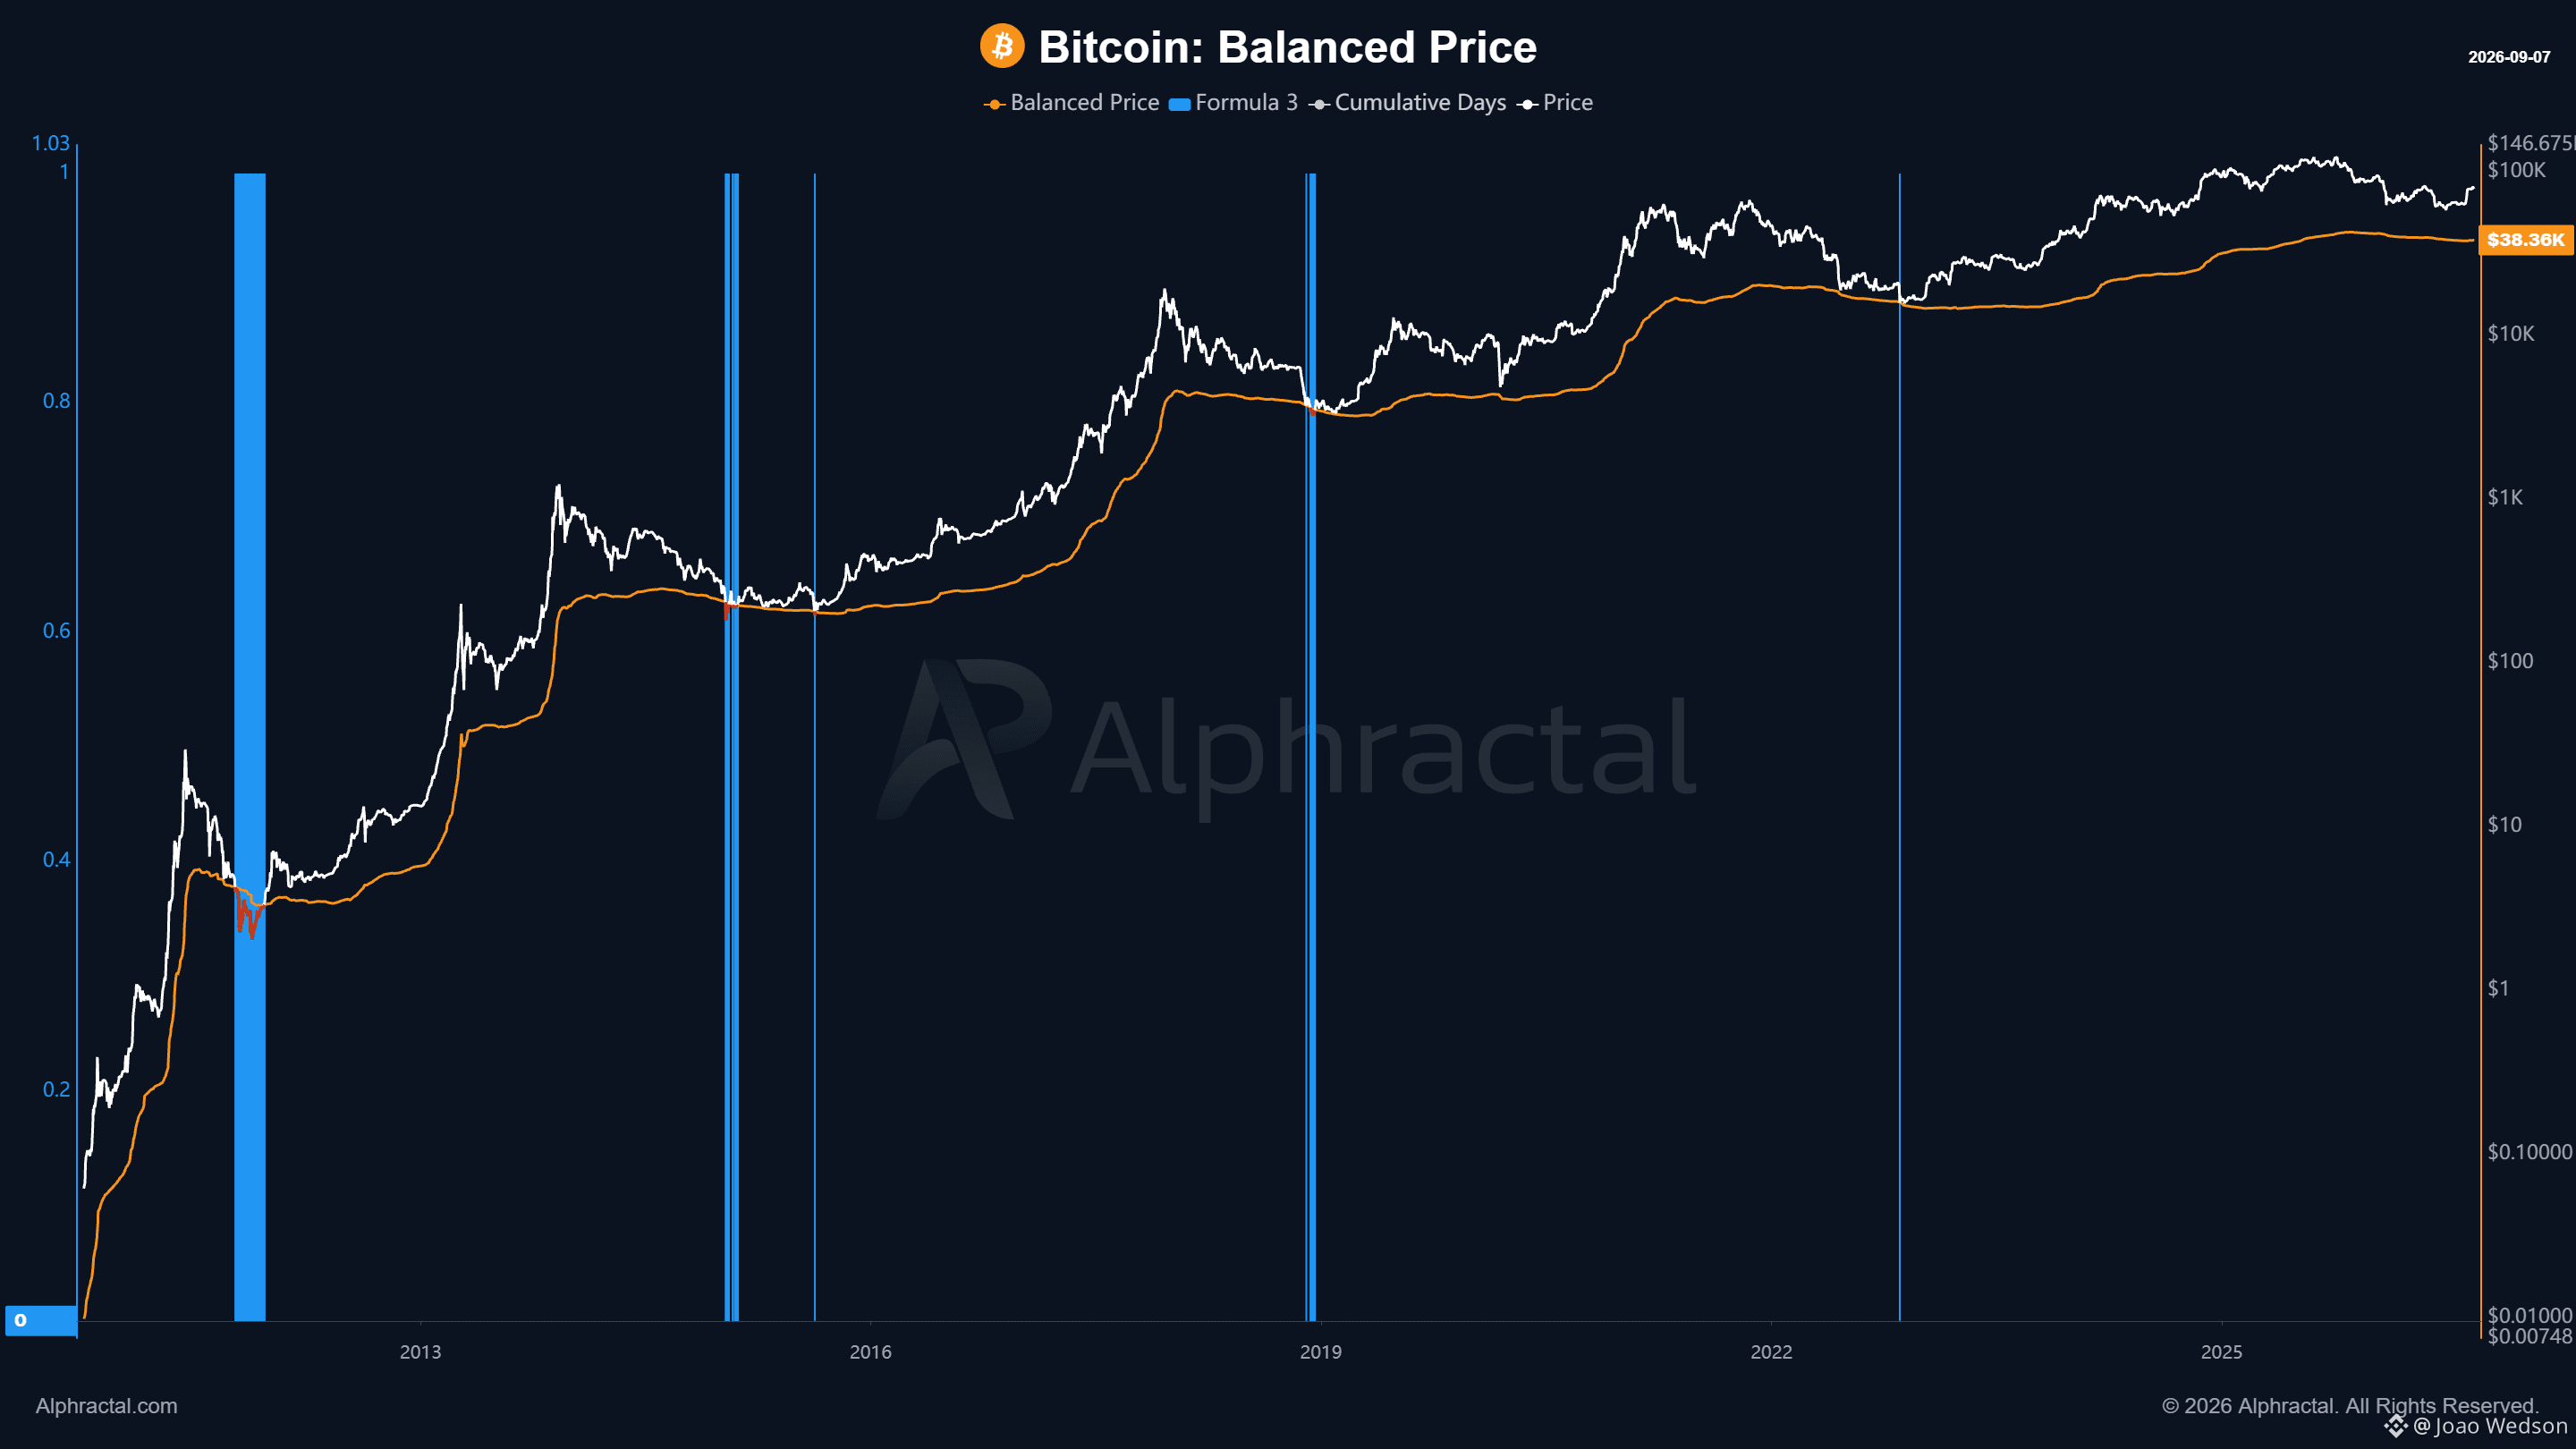
Bitcoin ကို $40K အောက်မှာ နောက်တစ်ကြိမ် ဘယ်တော့မှ မတွေ့ရတော့ဘူးလား?
ဒါဟာ ခန့်မှန်းချက်မဟုတ်ပါဘူး။ ယခင်က Bitcoin စျေးကွက်စက်ဝန်းရဲ့ အနက်ရှိုင်းဆုံး အောက်ခြေစျေးနှုန်းတွေကို ရှာဖွေရာမှာ အလွန်ထိရောက်ခဲ့တဲ့ မက်ထရစ်တစ်ခုဖြစ်တဲ့ Balanced Price ကို အခြေခံထားတဲ့ စိတ်ဝင်စားစရာ လေ့လာတွေ့ရှိချက်တစ်ခုသာ ဖြစ်ပါတယ်။
ဤဇုန်နဲ့ အဓိကစျေးနှုန်းထိတွေ့မှုတွေကြား စုစုပေါင်းကာလဟာ တဖြည်းဖြည်း ရှည်လာနေပါတယ်:
732 ရက် → 1.12K → 1.20K → 1.42K ရက်
လက်ရှိစက်ဝန်းမှာ Balanced Price နဲ့ နောက်ဆုံးထိတွေ့ခဲ့ချိန်ကစပြီး ယခုအချိန်အထိ ရက်ပေါင်း 1.40K ခန့် စုဆောင်းရောက်ရှိနေပါပြီ။
နောက်ထပ် စိတ်ဝင်စားစရာအချက်တစ်ခုကတော့ ဒီမက်ထရစ်အောက်မှာ Bitcoin ရှိနေတဲ့ကာလဟာလည်း တဖြည်းဖြည်း တိုလာနေတာပါ။ အစောပိုင်းစက်ဝန်းတွေမှာ ရက်သတ္တပတ်များစွာ အောက်မှာရှိခဲ့ပြီး၊ နောက်ပိုင်းမှာ ရက် 20 ဝန်းကျင်၊ ထို့နောက် ပိုနည်းလာကာ 2022 ခုနှစ်မှာတော့ ဒီဇုန်အောက်မှာ စျေးနှုန်းရှိခဲ့တဲ့ကာလဟာ လက်တွေ့အားဖြင့် 1 ရက်သာ ရှိခဲ့ပါတယ်။
ယနေ့မှာ Balanced Price ဟာ $38.4K ဝန်းကျင်မှာ ရှိနေပါတယ်။
Balanced Price ဟာ ရေရှည်သုံးစွဲမှုပုံစံကို ပြသတဲ့ အဟောင်းဒင်္ဂါးများရဲ့ အချက်အလက်ကို အသုံးပြုပြီး စျေးကွက်တစ်ခုလုံးရဲ့ ကုန်ကျစရိတ်အခြေခံကို ချိန်ညှိပေးပါတယ်။ ဒါကြောင့် ယခင်က အလွန်အမင်း အရှုံးပေါ်ရောင်းချမှုကာလတွေမှာ တွေ့ရလေ့ရှိတဲ့ တန်ဖိုးသတ်မှတ်ဇုန်တစ်ခုကို ဖန်တီးပေးပါတယ်။
ဒါဟာ Bitcoin ဟာ $38K ကို ပြန်ရောက်ဖို့ လိုအပ်တယ်လို့ ဆိုလိုတာမဟုတ်ပါဘူး။ သမိုင်းတစ်လျှောက် ပြောင်းလဲလာပုံက ပိုပြီးစိတ်ဝင်စားစရာကောင်းတဲ့ မေးခွန်းတစ်ခုကို ပေါ်ပေါက်စေပါတယ်:
တစ်ချိန်ချိန်မှာ Bitcoin က Balanced Price ကို ပြန်လည်ထိတွေ့တာ ရပ်သွားရင် ဘယ်လိုဖြစ်မလဲ?
အခြားတစ်ဖက်မှာတော့ ဒီသမိုင်းဝင်ပုံစံ ထပ်မံဖြစ်ပေါ်လာမယ်ဆိုရင် $40K ဝန်းကျင်ကို ဖြစ်နိုင်ခြေရှိတဲ့ အရှုံးပေါ်ရောင်းချမှု ပစ်မှတ်တစ်ခုအဖြစ် စဉ်းစားဖို့ အွန်ချိန်းအထောက်အထား ရှိလာမှာဖြစ်ပါတယ်။ ယခုပဲ ဝင်ရောက်လိုက်ပါ! https://app.alphractal.com/plans?utm_source=coinmarketcap&utm_medium=update&utm_campaign=founding_access&utm_content=ceo_joao
48
·
--
ဘာသာပြန်ဆိုချက် ကြည့်မည်
New video is live.
Crypto narratives change faster than most people realize.
And very often, the reason is simple: price moves first, then the narrative follows.
In this video, I explore crypto sentiment from a different perspective using:
Google Trends
Crypto influencer activity
Number of posts
Fear & Greed Index
Wikipedia interest
Alphractal sentiment metrics
And more
The goal is to understand how attention, conviction and market narratives change depending on price action.
Sometimes the most interesting signal is not what people are saying.
It is when they start saying it.
Watch the full video here:
https://youtu.be/LhTu8OzN7WI
78
Log in to explore more content
Join global crypto users on Binance Square
⚡️ Get latest and useful information about crypto.
💬 Trusted by the world’s largest crypto exchange.
👍 Discover real insights from verified creators.
အီးမေးလ် / ဖုန်းနံပါတ်
ရေပန်းစားနေသော ခေါင်းစဉ်များ
FedWatch
ကြည့်ရှုမှု 16.3M ကြိမ်
39,185 ဦး ဆွေးနွေးနေသည်
🚨 သံချောင်းသံများက ထပ်မံ၍ ကျယ်လောင်စွာ မြည်နေပြီ!
သင်သိသလိုပဲ၊ FED က မနေ့ညမှာ အတိုးနှုန်း ဆုံးဖြတ်ချက်ကို ကြေညာခဲ့ပြီး နှုန်းထားတွေကို မပြောင်းလဲဘဲ ထားခဲ့ပါတယ်။ #FedWatch နောက်က လိုက်လာတဲ့ အခြားဒေတာတွေနဲ့ ပတ်သက်ပြီး အခြေအနေက ဒီလိုပါ
နှစ်စဉ် ငွေကြေးဖောင်းပွမှုက 3.6% အထိ တက်လာပြီး လစဉ် ငွေကြေးဖောင်းပွမှုက 0.5% အထိ တက်လာခဲ့ပါတယ်။ Core PCE ကိုယ်ပိုင် စားသုံးမှုအသုံးစရိတ် စျေးနှုန်းညွှန်းကိန်းလည်း နှစ်စဉ်အခြေခံအားဖြင့် 3.1% အထိ ရောက်ရှိခဲ့ပါတယ်။
ဒီကိန်းဂဏန်းတွေက မျှော်မှန်းချက်တွေနဲ့ ကိုက်ညီပေမယ့် တကယ့် စိုးရိမ်စရာက ငွေကြေးဖောင်းပွမှုက ထပ်မံပြီး အရှိန်မြှင့်လာနေပြီဆိုတာပါပဲ။ FED ရဲ့ 2% ရည်မှန်းချက်ကတော့ အတော်လေး ဝေးနေသေးပုံရပါတယ်။
ကျွန်တော့်အမြင်အရတော့ လာမယ့်ကာလအတွင်း အတိုးနှုန်းလျှော့ချမှုတွေကို အကြောင်းပြဖို့ ခက်ခဲစေပါတယ်။ အတိုးနှုန်းမြင့်မားတာက ပိုကြာရှည်နေမယ်ဆိုရင် $BTC နဲ့ altcoins တွေအပေါ် ရောင်းအားဖိအား ထပ်တိုးလာစေနိုင်ပါတယ်။
Crypto ပစ္စည်းတွေက သူတို့ရဲ့ ခံနိုင်ရည်ကို ထိန်းထားနိုင်မယ်လို့ သင်ထင်ပါသလား?
Kripto Kurdu
·နှစ်သက်မှု 20 ခု
·ကြည့်ရှုမှု 3.8k ကြိမ်
EarningsSeason
ကြည့်ရှုမှု 6.4M ကြိမ်
31,904 ဦး ဆွေးနွေးနေသည်
USMidtermElections
ကြည့်ရှုမှု 26,759 ကြိမ်
527 ဦး ဆွေးနွေးနေသည်