

L – A – Z – E – R – X
15.1k ပို့စ်များ

L – A – Z – E – R – X
 Square Verified+
တိုင်ကြားမည်
သုံးစွဲသူကို ဘလော့မည်
Building wealth, one sat at a time | Sharing my crypto journey...
အမှန်တကယ်ရောင်းဝယ်နေ
Frequent Trader
1.3 နှစ်
19 ဖော်လိုလုပ်ထားသည်
39.3K+ ဖော်လိုလုပ်သူများ
38.5K+ လိုက်ခ်လုပ်ထားသည်
ပို့စ်များ
ပိုင်ဆိုင်မှုစာရင်း
အားလုံး
ဆိုဈေးများ
တိုက်ရိုက်ထုတ်လွှင့်ခြင်း
·
--
တက်ရိပ်ရှိသည်
ဘာသာပြန်ဆိုချက် ကြည့်မည်
🚀 $PROM — Bulls Are Taking Control!
PROM is trading at $5.753, up 13.61%, with strong buying momentum and 24-hour volume reaching 1.12M PROM ($6.21M).
Price surged to a high of $5.899 after bouncing from the $5.430 area. A short pullback is underway, but buyers remain in focus.
Key Levels:
- Current Price: $5.753
- 24H High: $5.899
- 24H Low: $5.035
- Watch Resistance: $5.899
- Watch Support: $5.716
A clean breakout above $5.899 could open the door for another bullish move. Eyes on PROM!
{spot}(PROMUSDT)
$MSFTB
{spot}(MSFTBUSDT)
$MET
{spot}(METUSDT)
🚀 $PROM — Bulls Are Taking Control!
PROM is trading at $5.753, up 13.61%, with strong buying momentum and 24-hour volume reaching 1.12M PROM ($6.21M).
Price surged to a high of $5.899 after bouncing from the $5.430 area. A short pullback is underway, but buyers remain in focus.
Key Levels:
- Current Price: $5.753
- 24H High: $5.899
- 24H Low: $5.035
- Watch Resistance: $5.899
- Watch Support: $5.716
A clean breakout above $5.899 could open the door for another bullish move. Eyes on PROM!
$MSFTB
$MET
PROM is trading at $5.753, up 13.61%, with strong buying momentum and 24-hour volume reaching 1.12M PROM ($6.21M).
Price surged to a high of $5.899 after bouncing from the $5.430 area. A short pullback is underway, but buyers remain in focus.
Key Levels:
- Current Price: $5.753
- 24H High: $5.899
- 24H Low: $5.035
- Watch Resistance: $5.899
- Watch Support: $5.716
A clean breakout above $5.899 could open the door for another bullish move. Eyes on PROM!
$MSFTB
$MET
A) $5.753
B) $5.899
C) $5.430
D) $5.035
20 နာရီ ကျန်သေးသည်
91
·
--
တက်ရိပ်ရှိသည်
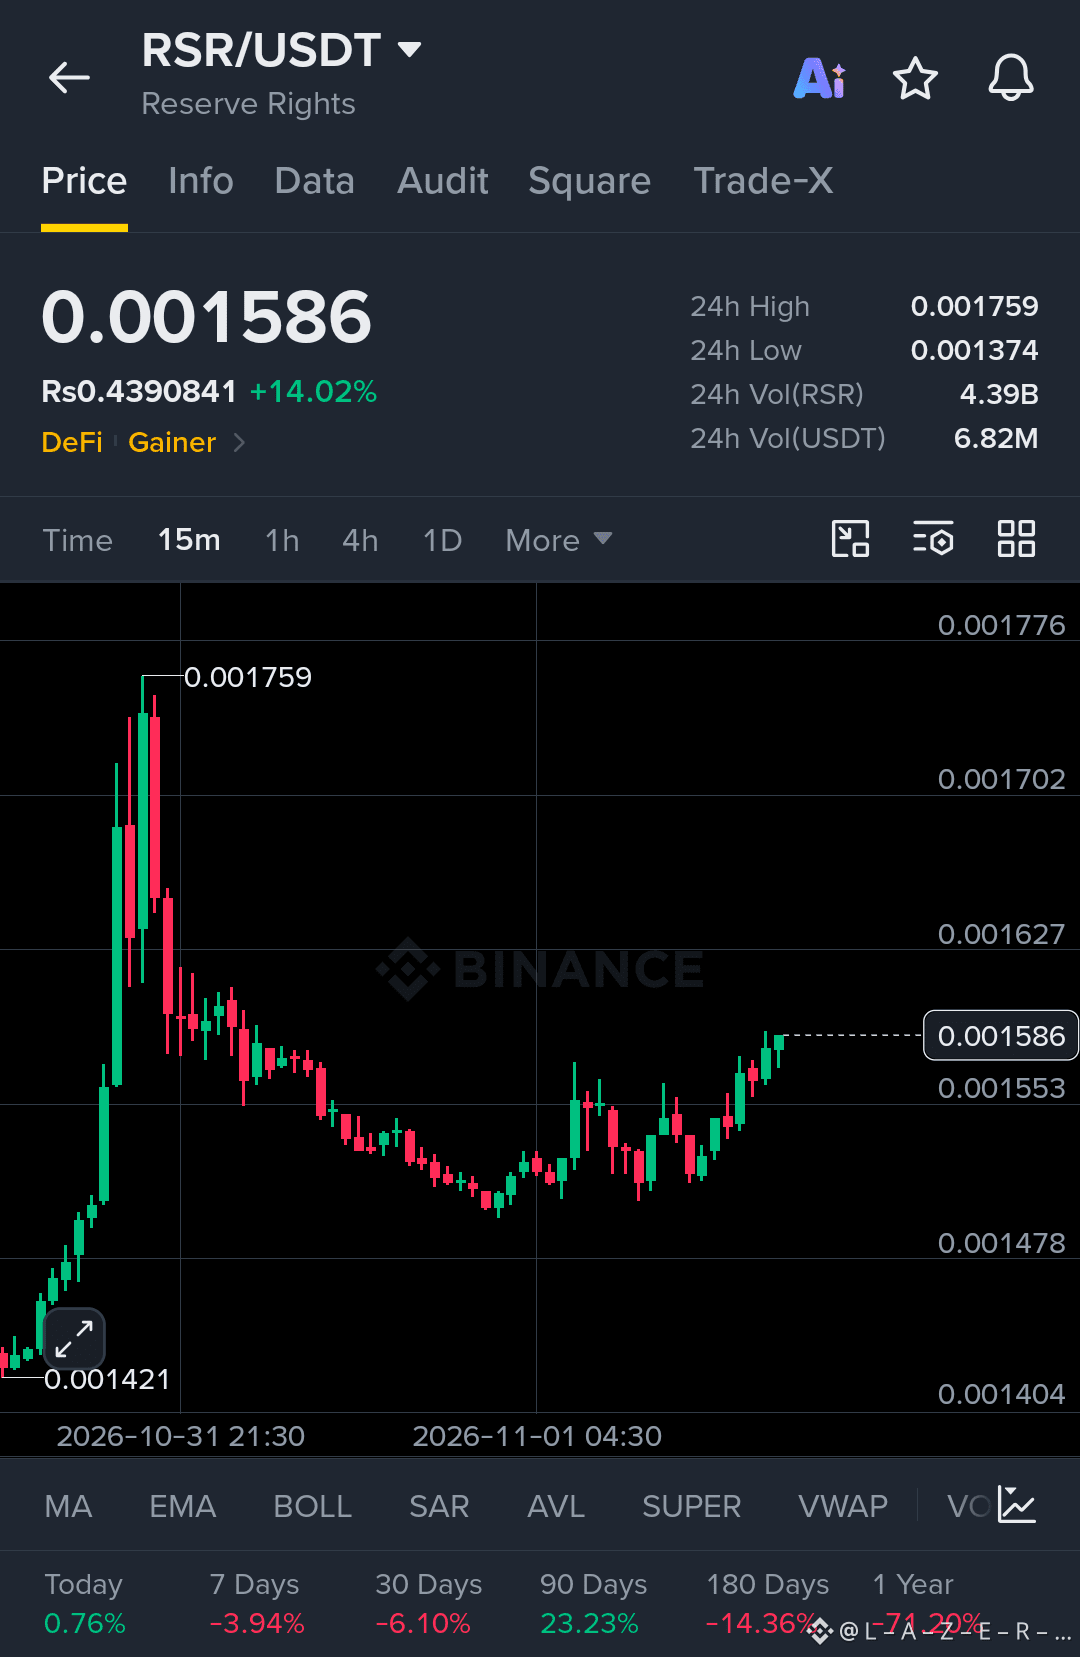
$RSR /USDT — အတက်လမ်းကြောင်း အရှိန်အဟုန် ပိုမိုအားကောင်းလာနေပါပြီ!
RSR သည် အားကောင်းသော ပြန်လည်နာလန်ထူမှုကို ပြသနေပြီး လက်ရှိတွင် 0.001586 ဖြင့် အရောင်းအဝယ်ဖြစ်ကာ ၂၄ နာရီအတွင်း 14.02% မြင့်တက်ထားသည်။
• ၂၄ နာရီအတွင်း အမြင့်ဆုံး: 0.001759
• ၂၄ နာရီအတွင်း အနိမ့်ဆုံး: 0.001374
• ၂၄ နာရီအတွင်း ကုန်သွယ်မှုပမာဏ: 4.39B RSR
• USDT ကုန်သွယ်မှုပမာဏ: 6.82M
အစောပိုင်း ဈေးပြန်ကျမှုနောက်ပိုင်း ဝယ်လက်များ ပြန်လည်ဝင်ရောက်လာနေပြီး ၁၅ မိနစ်ဇယားတွင် ဈေးပိုမြင့်လာရန် တွန်းအားအသစ်တစ်ရပ်ကို ပြသနေသည်။ RSR သည် မကြာသေးမီက အမြင့်ဆုံးဈေးနှုန်းအနီးသို့ ရောက်ရှိလာသည့်အတွက် နောက်ထပ်ဈေးရွေ့လျားမှုသည် အရေးကြီးလာမည်။
0.001759 ကို ဂရုတစိုက် စောင့်ကြည့်ပါ။ ဤအဆင့်ကို ကျော်လွန်၍ အားကောင်းစွာ တက်လာပါက RSR ကို စိတ်ဝင်စားမှုအသစ်များ ဖြစ်ပေါ်လာစေနိုင်သည်။
သတိရှိရှိ စောင့်ကြည့်ပြီး သင့်အန္တရာယ်ကို စီမံခန့်ခွဲပါ။ နောက်ထပ်ဈေးရွေ့လျားမှုက အရေးကြီးပါတယ်!
{spot}(RSRUSDT)
#BinanceToResumePhaseOneOfWithdrawals #BinanceSAFUFundTransferCompleted7499BTC #YiHe:ProofOfReserves:10TokensAt100%Backing #CZSaysCompensationIsinPlaceUsersAreProtected
$RSR /USDT — အတက်လမ်းကြောင်း အရှိန်အဟုန် ပိုမိုအားကောင်းလာနေပါပြီ!
RSR သည် အားကောင်းသော ပြန်လည်နာလန်ထူမှုကို ပြသနေပြီး လက်ရှိတွင် 0.001586 ဖြင့် အရောင်းအဝယ်ဖြစ်ကာ ၂၄ နာရီအတွင်း 14.02% မြင့်တက်ထားသည်။
• ၂၄ နာရီအတွင်း အမြင့်ဆုံး: 0.001759
• ၂၄ နာရီအတွင်း အနိမ့်ဆုံး: 0.001374
• ၂၄ နာရီအတွင်း ကုန်သွယ်မှုပမာဏ: 4.39B RSR
• USDT ကုန်သွယ်မှုပမာဏ: 6.82M
အစောပိုင်း ဈေးပြန်ကျမှုနောက်ပိုင်း ဝယ်လက်များ ပြန်လည်ဝင်ရောက်လာနေပြီး ၁၅ မိနစ်ဇယားတွင် ဈေးပိုမြင့်လာရန် တွန်းအားအသစ်တစ်ရပ်ကို ပြသနေသည်။ RSR သည် မကြာသေးမီက အမြင့်ဆုံးဈေးနှုန်းအနီးသို့ ရောက်ရှိလာသည့်အတွက် နောက်ထပ်ဈေးရွေ့လျားမှုသည် အရေးကြီးလာမည်။
0.001759 ကို ဂရုတစိုက် စောင့်ကြည့်ပါ။ ဤအဆင့်ကို ကျော်လွန်၍ အားကောင်းစွာ တက်လာပါက RSR ကို စိတ်ဝင်စားမှုအသစ်များ ဖြစ်ပေါ်လာစေနိုင်သည်။
သတိရှိရှိ စောင့်ကြည့်ပြီး သင့်အန္တရာယ်ကို စီမံခန့်ခွဲပါ။ နောက်ထပ်ဈေးရွေ့လျားမှုက အရေးကြီးပါတယ်!
#BinanceToResumePhaseOneOfWithdrawals #BinanceSAFUFundTransferCompleted7499BTC #YiHe:ProofOfReserves:10TokensAt100%Backing #CZSaysCompensationIsinPlaceUsersAreProtected
RSR သည် အားကောင်းသော ပြန်လည်နာလန်ထူမှုကို ပြသနေပြီး လက်ရှိတွင် 0.001586 ဖြင့် အရောင်းအဝယ်ဖြစ်ကာ ၂၄ နာရီအတွင်း 14.02% မြင့်တက်ထားသည်။
• ၂၄ နာရီအတွင်း အမြင့်ဆုံး: 0.001759
• ၂၄ နာရီအတွင်း အနိမ့်ဆုံး: 0.001374
• ၂၄ နာရီအတွင်း ကုန်သွယ်မှုပမာဏ: 4.39B RSR
• USDT ကုန်သွယ်မှုပမာဏ: 6.82M
အစောပိုင်း ဈေးပြန်ကျမှုနောက်ပိုင်း ဝယ်လက်များ ပြန်လည်ဝင်ရောက်လာနေပြီး ၁၅ မိနစ်ဇယားတွင် ဈေးပိုမြင့်လာရန် တွန်းအားအသစ်တစ်ရပ်ကို ပြသနေသည်။ RSR သည် မကြာသေးမီက အမြင့်ဆုံးဈေးနှုန်းအနီးသို့ ရောက်ရှိလာသည့်အတွက် နောက်ထပ်ဈေးရွေ့လျားမှုသည် အရေးကြီးလာမည်။
0.001759 ကို ဂရုတစိုက် စောင့်ကြည့်ပါ။ ဤအဆင့်ကို ကျော်လွန်၍ အားကောင်းစွာ တက်လာပါက RSR ကို စိတ်ဝင်စားမှုအသစ်များ ဖြစ်ပေါ်လာစေနိုင်သည်။
သတိရှိရှိ စောင့်ကြည့်ပြီး သင့်အန္တရာယ်ကို စီမံခန့်ခွဲပါ။ နောက်ထပ်ဈေးရွေ့လျားမှုက အရေးကြီးပါတယ်!
#BinanceToResumePhaseOneOfWithdrawals #BinanceSAFUFundTransferCompleted7499BTC #YiHe:ProofOfReserves:10TokensAt100%Backing #CZSaysCompensationIsinPlaceUsersAreProtected
79
·
--
ကျရိပ်ရှိသည်
ဘာသာပြန်ဆိုချက် ကြည့်မည်
🚨 $6.3 BILLION BINANCE HEIST — TRUMP STEPS IN!
One of crypto’s biggest security crises is unfolding. Nearly $6.3B reportedly stolen, with around $3B frozen so far.
North Korea-linked hackers are suspected, while the FBI and US Secret Service investigate.
Who controls the remaining billions? Can investigators recover the funds?
The crypto world is watching every move.
#Binance #CryptoHack #NorthKorea
$TRUMP
🚨 $6.3 BILLION BINANCE HEIST — TRUMP STEPS IN!
One of crypto’s biggest security crises is unfolding. Nearly $6.3B reportedly stolen, with around $3B frozen so far.
North Korea-linked hackers are suspected, while the FBI and US Secret Service investigate.
Who controls the remaining billions? Can investigators recover the funds?
The crypto world is watching every move.
#Binance #CryptoHack #NorthKorea
$TRUMP
One of crypto’s biggest security crises is unfolding. Nearly $6.3B reportedly stolen, with around $3B frozen so far.
North Korea-linked hackers are suspected, while the FBI and US Secret Service investigate.
Who controls the remaining billions? Can investigators recover the funds?
The crypto world is watching every move.
#Binance #CryptoHack #NorthKorea
$TRUMP


1
108
·
--
တက်ရိပ်ရှိသည်
ဘာသာပြန်ဆိုချက် ကြည့်မည်
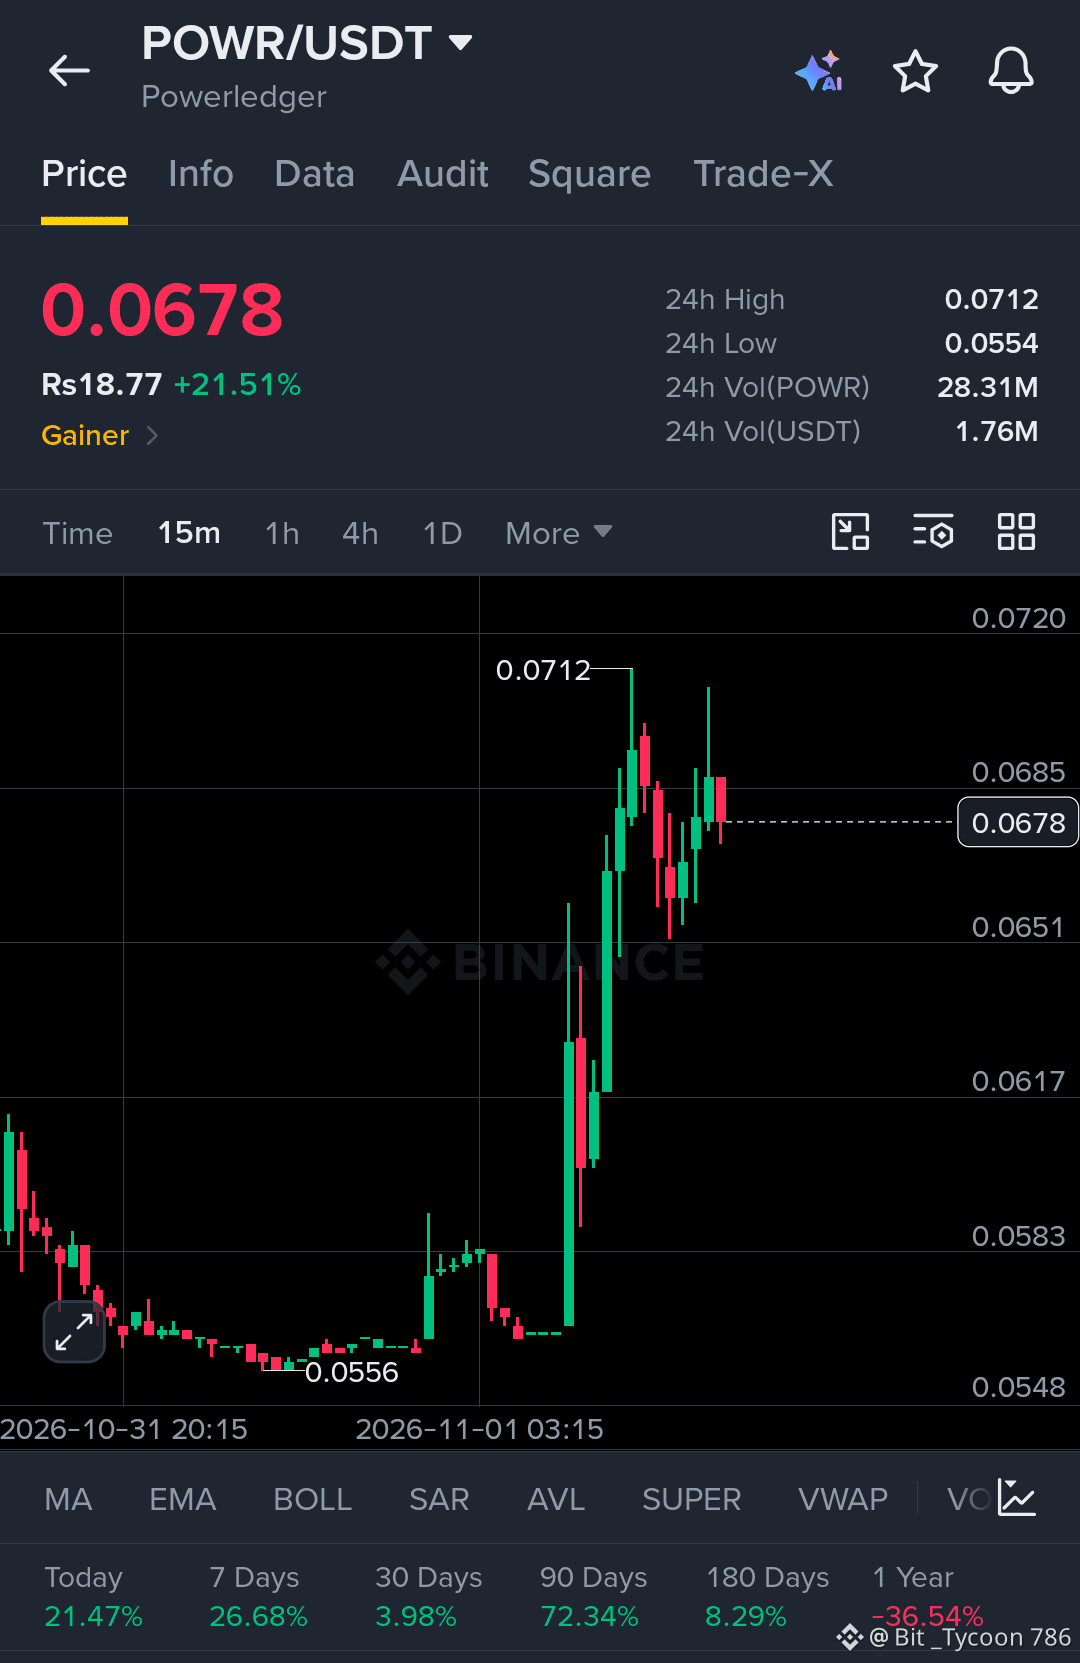
$POWR is heating up with a strong bullish breakout! Price has jumped 21.51% in 24 hours, moving from $0.0554 to a high of $0.0712. Buyers have stepped in aggressively, and momentum is still looking strong after the sharp move.
Market Overview
Current Price: $0.0678
24H Change: +21.51%
24H High: $0.0712
24H Low: $0.0554
24H Volume: 28.31M POWR
Trading Volume: $1.76M USDT
Trade Setup: LONG
Entry Zone: $0.0665 – $0.0680
Stop Loss: $0.0640
TP1: $0.0695
TP2: $0.0712
TP3: $0.0740
What to Watch
The $0.0712 level is the main resistance to watch. A strong breakout above this level with fresh buying volume could open the way toward $0.0740.
For now, POWR is holding near $0.0678 after a powerful rally. A small pullback toward the entry zone could offer a better opportunity than chasing the current candle.
If buyers defend $0.0651, bullish momentum could continue. But a drop below $0.0640 would weaken this setup.
The trend is looking strong, but smart entries matter more than excitement. Let the buyers confirm the next move.
Risk managed. Eyes on the targets. Let’s go $POWR
{spot}(POWRUSDT)
#BinanceSAFUFundTransferCompleted7499BTC #BackedNotBroken:RichardTengSaysUsersBearNoLoss #B14gReportsUnauthorizedTransferOfAbout97MCORE #CZSaysCompensationIsinPlaceUsersAreProtected #IntelHasItsWorstDaySince1974
$POWR is heating up with a strong bullish breakout! Price has jumped 21.51% in 24 hours, moving from $0.0554 to a high of $0.0712. Buyers have stepped in aggressively, and momentum is still looking strong after the sharp move.
Market Overview
Current Price: $0.0678
24H Change: +21.51%
24H High: $0.0712
24H Low: $0.0554
24H Volume: 28.31M POWR
Trading Volume: $1.76M USDT
Trade Setup: LONG
Entry Zone: $0.0665 – $0.0680
Stop Loss: $0.0640
TP1: $0.0695
TP2: $0.0712
TP3: $0.0740
What to Watch
The $0.0712 level is the main resistance to watch. A strong breakout above this level with fresh buying volume could open the way toward $0.0740.
For now, POWR is holding near $0.0678 after a powerful rally. A small pullback toward the entry zone could offer a better opportunity than chasing the current candle.
If buyers defend $0.0651, bullish momentum could continue. But a drop below $0.0640 would weaken this setup.
The trend is looking strong, but smart entries matter more than excitement. Let the buyers confirm the next move.
Risk managed. Eyes on the targets. Let’s go $POWR
#BinanceSAFUFundTransferCompleted7499BTC #BackedNotBroken:RichardTengSaysUsersBearNoLoss #B14gReportsUnauthorizedTransferOfAbout97MCORE #CZSaysCompensationIsinPlaceUsersAreProtected #IntelHasItsWorstDaySince1974
Market Overview
Current Price: $0.0678
24H Change: +21.51%
24H High: $0.0712
24H Low: $0.0554
24H Volume: 28.31M POWR
Trading Volume: $1.76M USDT
Trade Setup: LONG
Entry Zone: $0.0665 – $0.0680
Stop Loss: $0.0640
TP1: $0.0695
TP2: $0.0712
TP3: $0.0740
What to Watch
The $0.0712 level is the main resistance to watch. A strong breakout above this level with fresh buying volume could open the way toward $0.0740.
For now, POWR is holding near $0.0678 after a powerful rally. A small pullback toward the entry zone could offer a better opportunity than chasing the current candle.
If buyers defend $0.0651, bullish momentum could continue. But a drop below $0.0640 would weaken this setup.
The trend is looking strong, but smart entries matter more than excitement. Let the buyers confirm the next move.
Risk managed. Eyes on the targets. Let’s go $POWR
#BinanceSAFUFundTransferCompleted7499BTC #BackedNotBroken:RichardTengSaysUsersBearNoLoss #B14gReportsUnauthorizedTransferOfAbout97MCORE #CZSaysCompensationIsinPlaceUsersAreProtected #IntelHasItsWorstDaySince1974
54
·
--
တက်ရိပ်ရှိသည်
ဘာသာပြန်ဆိုချက် ကြည့်မည်
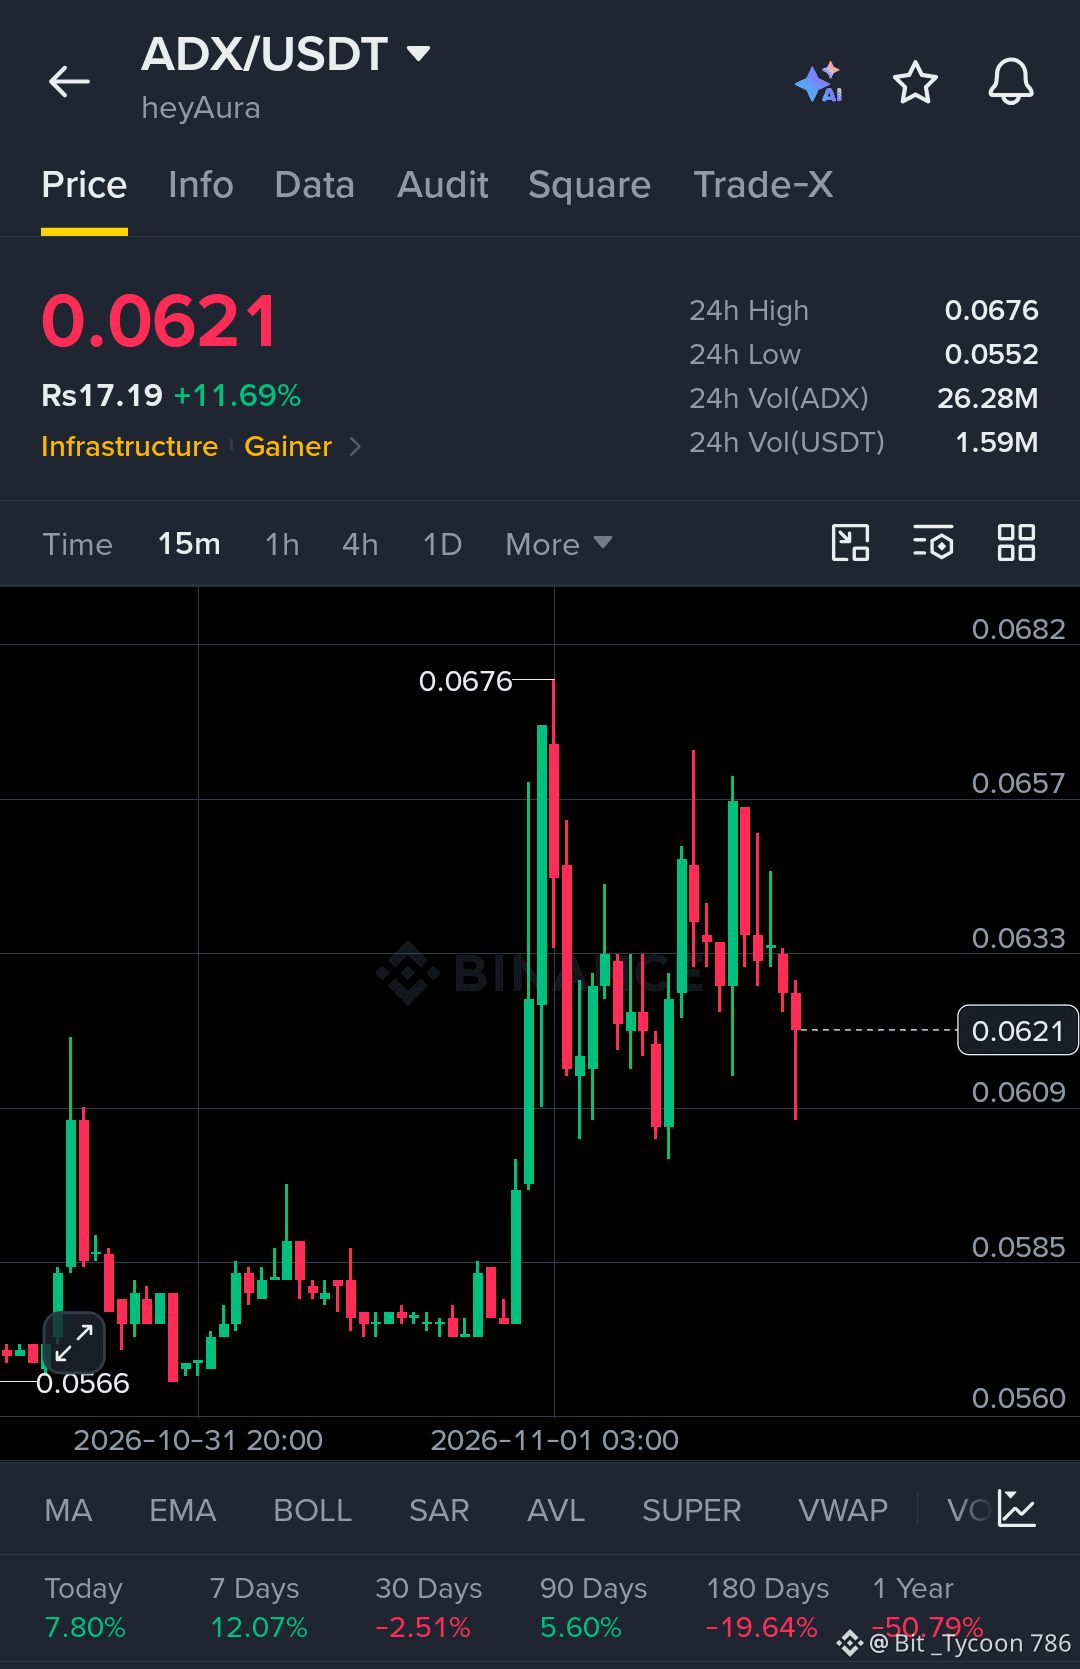
$ADX is showing strong bullish momentum, climbing 11.69% in 24 hours and pushing from $0.0552 to a high of $0.0676. Buyers have stepped in with strength, and price is now consolidating around $0.0621 after a sharp breakout.
Market Overview
Current Price: $0.0621
24H Change: +11.69%
24H High: $0.0676
24H Low: $0.0552
24H Volume: 26.28M ADX
Trading Volume: $1.59M USDT
Trade Setup: LONG
Entry Zone: $0.0610 – $0.0622
Stop Loss: $0.0590
TP1: $0.0633
TP2: $0.0657
TP3: $0.0676
What to Watch
The $0.0633 level is the first important resistance. A clean breakout above this zone with rising volume could open the door toward $0.0657 and eventually the recent high of $0.0676.
ADX has already made a strong move, so chasing green candles is not the best idea. A healthy pullback followed by fresh buying pressure would give a better entry.
As long as buyers defend the $0.0609 area, the bullish setup remains interesting. Losing that support could weaken the momentum.
The opportunity is there, but patience and risk management matter. Let the chart confirm the next move.
Risk managed. Eyes on the targets. Let’s go $ADX
{spot}(ADXUSDT)
#BinanceSAFUFundTransferCompleted7499BTC #BackedNotBroken:RichardTengSaysUsersBearNoLoss #B14gReportsUnauthorizedTransferOfAbout97MCORE #USSpotETHETFsPost23StraightDaysOfNetOutflows #CZSaysCompensationIsinPlaceUsersAreProtected
$ADX is showing strong bullish momentum, climbing 11.69% in 24 hours and pushing from $0.0552 to a high of $0.0676. Buyers have stepped in with strength, and price is now consolidating around $0.0621 after a sharp breakout.
Market Overview
Current Price: $0.0621
24H Change: +11.69%
24H High: $0.0676
24H Low: $0.0552
24H Volume: 26.28M ADX
Trading Volume: $1.59M USDT
Trade Setup: LONG
Entry Zone: $0.0610 – $0.0622
Stop Loss: $0.0590
TP1: $0.0633
TP2: $0.0657
TP3: $0.0676
What to Watch
The $0.0633 level is the first important resistance. A clean breakout above this zone with rising volume could open the door toward $0.0657 and eventually the recent high of $0.0676.
ADX has already made a strong move, so chasing green candles is not the best idea. A healthy pullback followed by fresh buying pressure would give a better entry.
As long as buyers defend the $0.0609 area, the bullish setup remains interesting. Losing that support could weaken the momentum.
The opportunity is there, but patience and risk management matter. Let the chart confirm the next move.
Risk managed. Eyes on the targets. Let’s go $ADX
#BinanceSAFUFundTransferCompleted7499BTC #BackedNotBroken:RichardTengSaysUsersBearNoLoss #B14gReportsUnauthorizedTransferOfAbout97MCORE #USSpotETHETFsPost23StraightDaysOfNetOutflows #CZSaysCompensationIsinPlaceUsersAreProtected
Market Overview
Current Price: $0.0621
24H Change: +11.69%
24H High: $0.0676
24H Low: $0.0552
24H Volume: 26.28M ADX
Trading Volume: $1.59M USDT
Trade Setup: LONG
Entry Zone: $0.0610 – $0.0622
Stop Loss: $0.0590
TP1: $0.0633
TP2: $0.0657
TP3: $0.0676
What to Watch
The $0.0633 level is the first important resistance. A clean breakout above this zone with rising volume could open the door toward $0.0657 and eventually the recent high of $0.0676.
ADX has already made a strong move, so chasing green candles is not the best idea. A healthy pullback followed by fresh buying pressure would give a better entry.
As long as buyers defend the $0.0609 area, the bullish setup remains interesting. Losing that support could weaken the momentum.
The opportunity is there, but patience and risk management matter. Let the chart confirm the next move.
Risk managed. Eyes on the targets. Let’s go $ADX
#BinanceSAFUFundTransferCompleted7499BTC #BackedNotBroken:RichardTengSaysUsersBearNoLoss #B14gReportsUnauthorizedTransferOfAbout97MCORE #USSpotETHETFsPost23StraightDaysOfNetOutflows #CZSaysCompensationIsinPlaceUsersAreProtected
71
·
--
တက်ရိပ်ရှိသည်
ဘာသာပြန်ဆိုချက် ကြည့်မည်
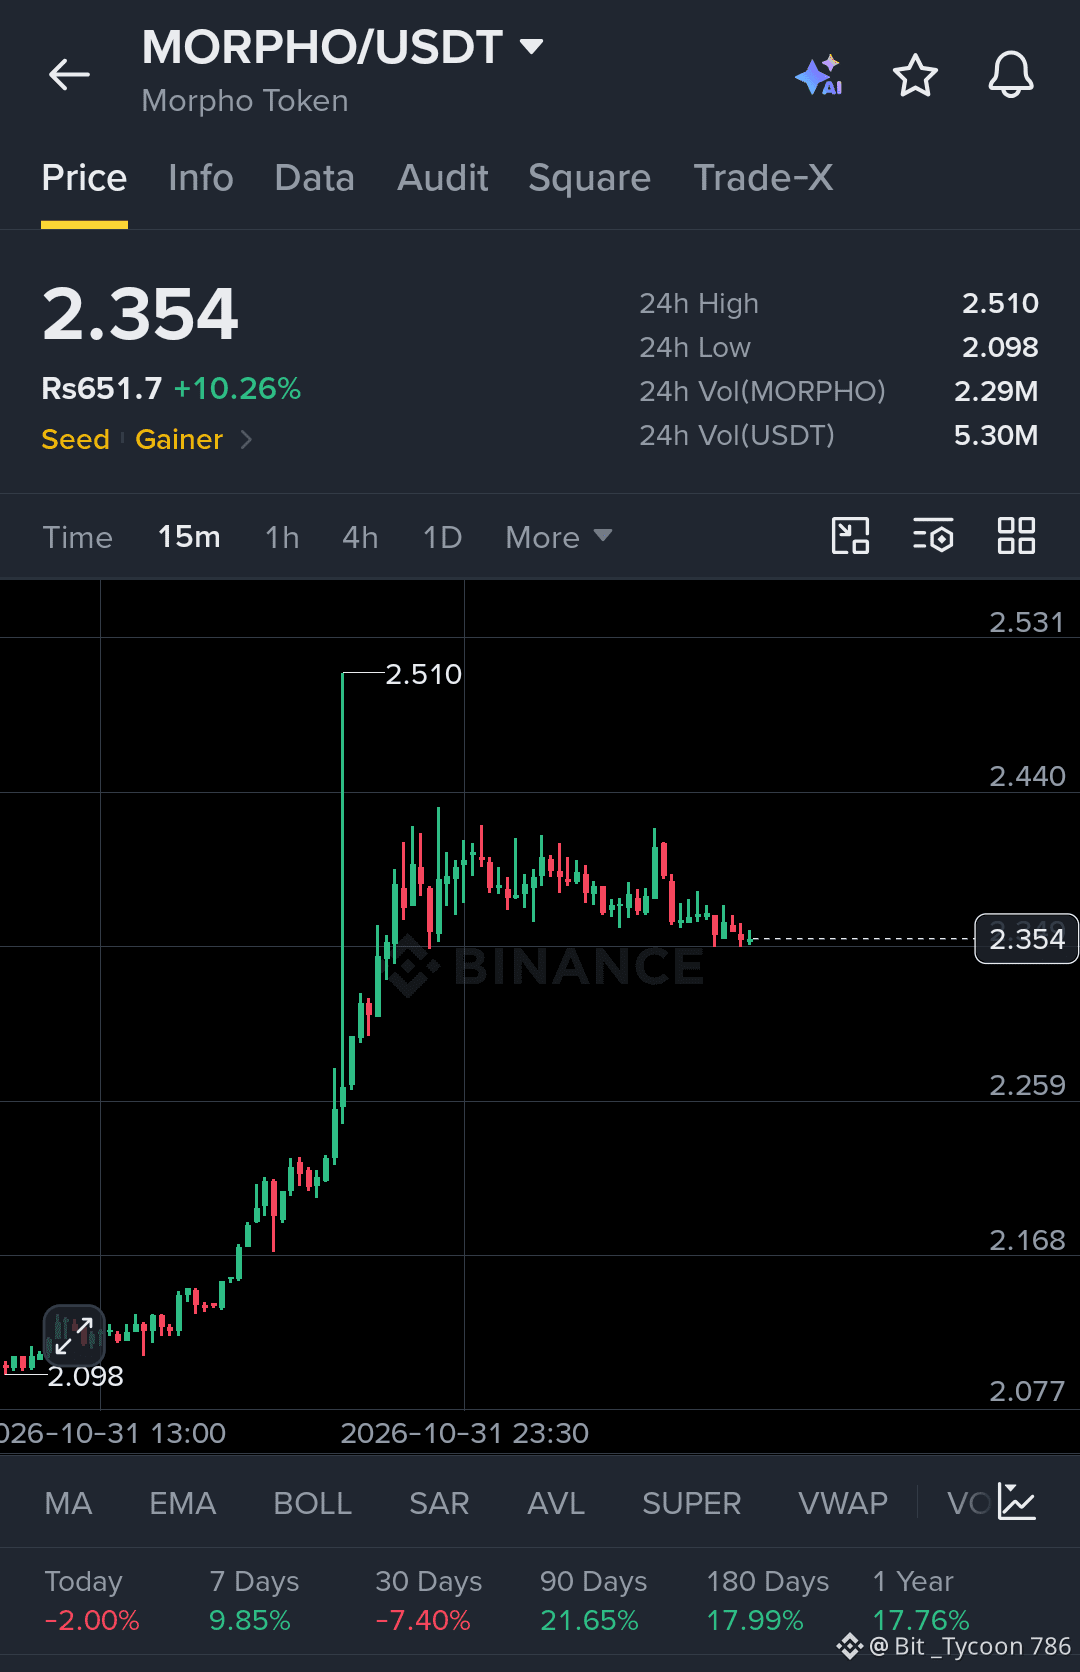
$MORPHO is showing strong bullish momentum after a sharp move from $2.09 to $2.51. Buyers are still holding control, and price is now consolidating around $2.35 after the big push.
Current Price: $2.354
24H Change: +10.26%
24H High: $2.510
24H Low: $2.098
24H Volume: $5.30M USDT
Trade Setup: LONG
Entry Zone: $2.33 – $2.37
Stop Loss: $2.28
TP1: $2.42
TP2: $2.48
TP3: $2.51
The key level to watch is $2.40. A clean break above it with strong volume could bring another bullish wave toward $2.48 and the recent high at $2.51.
If buyers defend the current zone, the next move could get interesting. But losing $2.28 would weaken this setup, so keep risk under control.
Momentum is building. Let the price confirm the move instead of chasing the pump.
Risk managed. Eyes on the targets. Let’s go $MORPHO
{spot}(MORPHOUSDT)
#BinanceSAFUFundTransferCompleted7499BTC #YiHe:ProofOfReserves:10TokensAt100%Backing #B14gReportsUnauthorizedTransferOfAbout97MCORE #CZSaysCompensationIsinPlaceUsersAreProtected
$MORPHO is showing strong bullish momentum after a sharp move from $2.09 to $2.51. Buyers are still holding control, and price is now consolidating around $2.35 after the big push.
Current Price: $2.354
24H Change: +10.26%
24H High: $2.510
24H Low: $2.098
24H Volume: $5.30M USDT
Trade Setup: LONG
Entry Zone: $2.33 – $2.37
Stop Loss: $2.28
TP1: $2.42
TP2: $2.48
TP3: $2.51
The key level to watch is $2.40. A clean break above it with strong volume could bring another bullish wave toward $2.48 and the recent high at $2.51.
If buyers defend the current zone, the next move could get interesting. But losing $2.28 would weaken this setup, so keep risk under control.
Momentum is building. Let the price confirm the move instead of chasing the pump.
Risk managed. Eyes on the targets. Let’s go $MORPHO
#BinanceSAFUFundTransferCompleted7499BTC #YiHe:ProofOfReserves:10TokensAt100%Backing #B14gReportsUnauthorizedTransferOfAbout97MCORE #CZSaysCompensationIsinPlaceUsersAreProtected
Current Price: $2.354
24H Change: +10.26%
24H High: $2.510
24H Low: $2.098
24H Volume: $5.30M USDT
Trade Setup: LONG
Entry Zone: $2.33 – $2.37
Stop Loss: $2.28
TP1: $2.42
TP2: $2.48
TP3: $2.51
The key level to watch is $2.40. A clean break above it with strong volume could bring another bullish wave toward $2.48 and the recent high at $2.51.
If buyers defend the current zone, the next move could get interesting. But losing $2.28 would weaken this setup, so keep risk under control.
Momentum is building. Let the price confirm the move instead of chasing the pump.
Risk managed. Eyes on the targets. Let’s go $MORPHO
#BinanceSAFUFundTransferCompleted7499BTC #YiHe:ProofOfReserves:10TokensAt100%Backing #B14gReportsUnauthorizedTransferOfAbout97MCORE #CZSaysCompensationIsinPlaceUsersAreProtected
1
76
·
--
တက်ရိပ်ရှိသည်
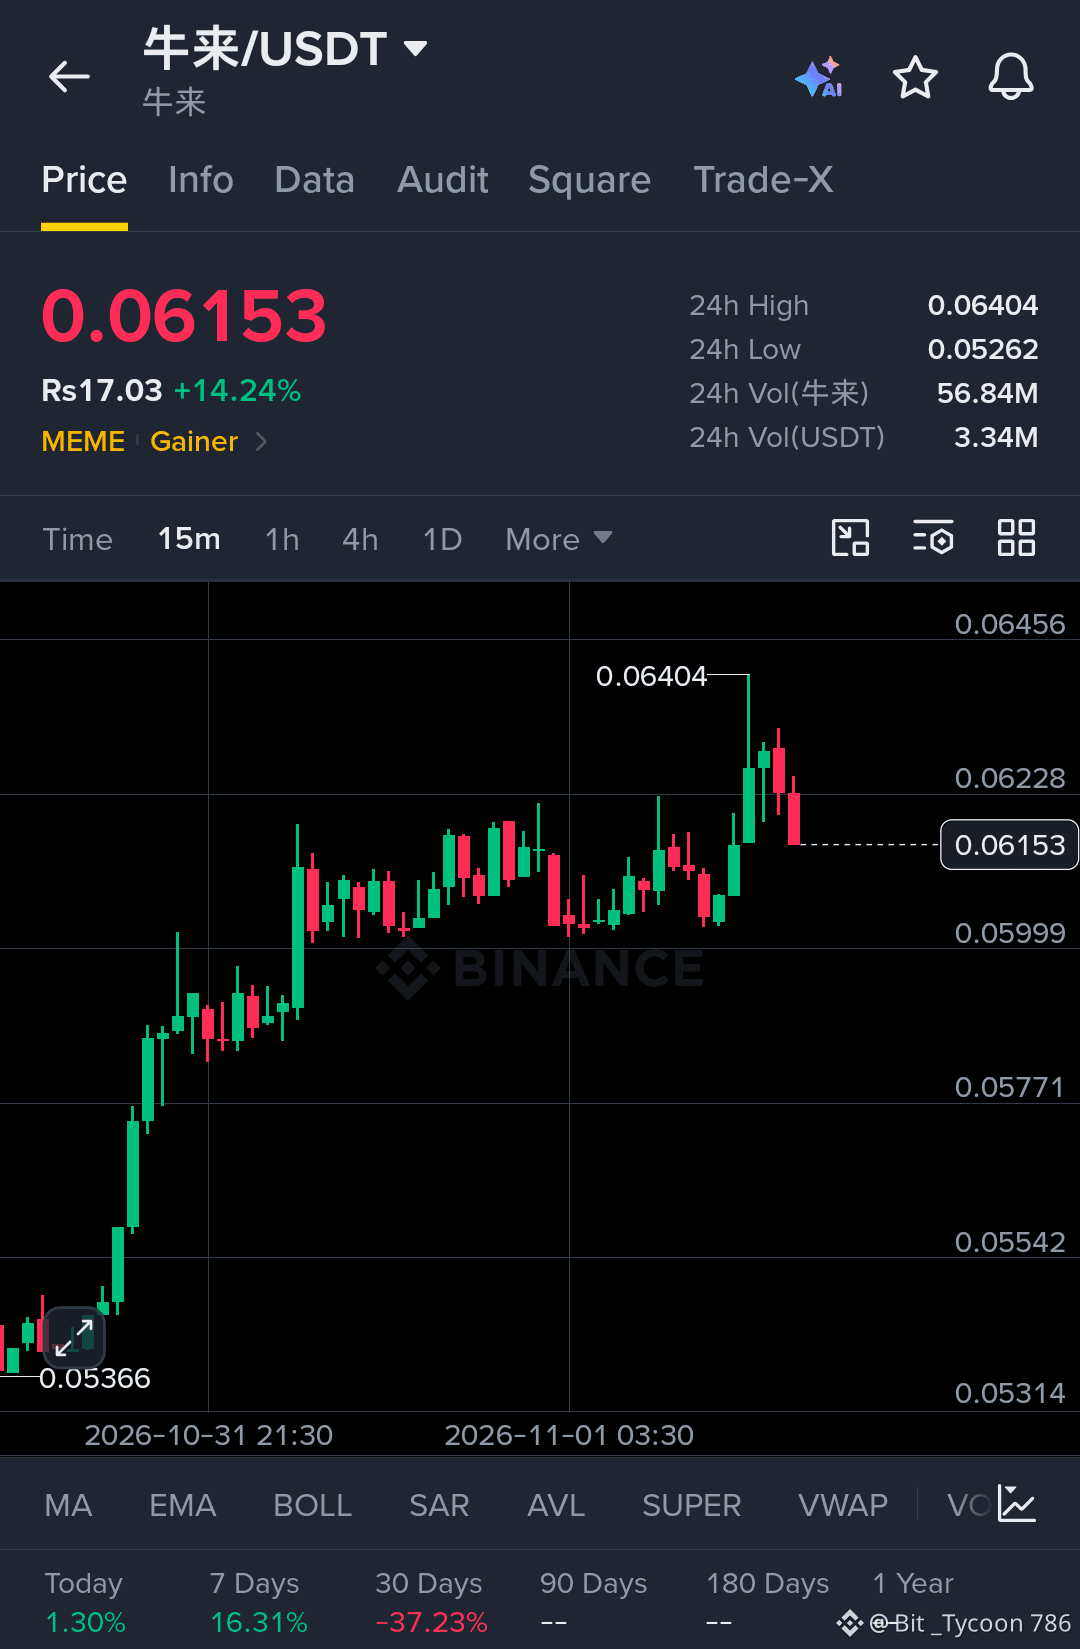
$牛来 /USDT သည် 0.06153 ဖြင့် အရောင်းအဝယ်ဖြစ်နေပြီး၊ ပြီးခဲ့သည့် ၂၄ နာရီအတွင်း 14.24% မြင့်တက်ခဲ့သည်။ ဤအတက်သည် 0.05366 ဝန်းကျင်မှ ပြင်းထန်စွာ မြင့်တက်လာမှုနောက်တွင် ဖြစ်ပေါ်ခဲ့ပြီး၊ ဈေးနှုန်းသည် 0.06000–0.06200 ဝန်းကျင်တွင် ပိုမိုမြင့်မားသော အရောင်းအဝယ်အပိုင်းအခြားတစ်ခုကို တဖြည်းဖြည်း တည်ဆောက်လာခဲ့သည်။
၁၅ မိနစ်ဇယားတွင် တိုကင်သည် ဆက်တိုက်ရှိသော ခုခံမှုအဆင့်များကို ကျော်ဖြတ်လာစဉ် ဝယ်ယူမှုအရှိန် မြန်ဆန်လာခဲ့သည်။ ဈေးနှုန်းသည် နောက်ဆုံးတွင် 0.06404 သို့ ရောက်ရှိခဲ့ပြီးနောက် ရောင်းအားဖိအားနှင့် ရင်ဆိုင်ခဲ့ရသည်။ နောက်ဆုံးဖယောင်းတိုင်များအရ ဈေးနှုန်းသည် 0.06153 ဘက်သို့ ပြန်ဆုတ်လာပြီး၊ မြင့်တက်မှုနောက်တွင် ရေတိုအမြတ်ယူရောင်းချမှုအချို့ ရှိနေကြောင်း ပြသနေသည်။
အရောင်းအဝယ်ပမာဏသည် တိုကင် 56.84 သန်းအထိ ရောက်ရှိခဲ့ပြီး၊ ၂၄ နာရီအတွင်း USDT 3.34 သန်းခန့်နှင့် ညီမျှသည်။ ဤလှုပ်ရှားမှုမြင့်တက်လာခြင်းသည် ဈေးနှုန်းအတက်နှင့် တိုက်ဆိုင်နေသော်လည်း၊ မကြာသေးမီက ဈေးနှုန်းပြန်လည်ကျဆင်းခဲ့မှုအရ လက်ရှိအဆင့်တွင် ဝယ်ယူသူများအနေဖြင့် အားကောင်းမှုကို ဆက်လက်ပြသရန် လိုအပ်နေသေးသည်။
ချက်ချင်းရင်ဆိုင်ရမည့် ခုခံမှုသည် 0.06228 ဝန်းကျင်တွင်ရှိပြီး၊ ထို့နောက် 0.06404 တွင် ရှိသည်။ အောက်ဘက်တွင် 0.06000 သည် အနီးရှိ အရေးကြီးသော ထောက်ပံ့မှုအပိုင်းအခြားဖြစ်ပြီး၊ 0.05999 သည် ဇယားပေါ်ရှိ နောက်ထပ် ရည်ညွှန်းအဆင့်ဖြစ်သည်။
ပိုမိုကျယ်ပြန့်သော ရေတိုဈေးကွက်ဖွဲ့စည်းပုံမှာ အားကောင်းသည့်ဘက်တွင် ဆက်လက်ရှိနေသော်လည်း၊ မကြာသေးမီက တည်ဆောက်ထားသော အပိုင်းအခြားကို ထိန်းထားနိုင်ရန် အရေးကြီးသည်။ 0.06228 အထက်သို့ ပြန်လည်မြင့်တက်ခြင်းသည် ပြန်လည်နာလန်ထူရန် ကြိုးပမ်းမှုကို ပိုမိုအားကောင်းစေမည်ဖြစ်ပြီး၊ 0.06000 အောက်တွင် ဆက်တိုက်ကျဆင်းနေပါက ဈေးကွက်သည် ပိုမိုနက်ရှိုင်းသော ဈေးနှုန်းစုစည်းမှုတစ်ခု လိုအပ်နေကြောင်း ညွှန်ပြနိုင်သည်။
{spot}(牛来USDT)
#BinanceSAFUFundTransferCompleted7499BTC #YiHe:ProofOfReserves:10TokensAt100%Backing #CZSaysCompensationIsinPlaceUsersAreProtected #B14gReportsUnauthorizedTransferOfAbout97MCORE #USSpotETHETFsPost23StraightDaysOfNetOutflows
$牛来 /USDT သည် 0.06153 ဖြင့် အရောင်းအဝယ်ဖြစ်နေပြီး၊ ပြီးခဲ့သည့် ၂၄ နာရီအတွင်း 14.24% မြင့်တက်ခဲ့သည်။ ဤအတက်သည် 0.05366 ဝန်းကျင်မှ ပြင်းထန်စွာ မြင့်တက်လာမှုနောက်တွင် ဖြစ်ပေါ်ခဲ့ပြီး၊ ဈေးနှုန်းသည် 0.06000–0.06200 ဝန်းကျင်တွင် ပိုမိုမြင့်မားသော အရောင်းအဝယ်အပိုင်းအခြားတစ်ခုကို တဖြည်းဖြည်း တည်ဆောက်လာခဲ့သည်။
၁၅ မိနစ်ဇယားတွင် တိုကင်သည် ဆက်တိုက်ရှိသော ခုခံမှုအဆင့်များကို ကျော်ဖြတ်လာစဉ် ဝယ်ယူမှုအရှိန် မြန်ဆန်လာခဲ့သည်။ ဈေးနှုန်းသည် နောက်ဆုံးတွင် 0.06404 သို့ ရောက်ရှိခဲ့ပြီးနောက် ရောင်းအားဖိအားနှင့် ရင်ဆိုင်ခဲ့ရသည်။ နောက်ဆုံးဖယောင်းတိုင်များအရ ဈေးနှုန်းသည် 0.06153 ဘက်သို့ ပြန်ဆုတ်လာပြီး၊ မြင့်တက်မှုနောက်တွင် ရေတိုအမြတ်ယူရောင်းချမှုအချို့ ရှိနေကြောင်း ပြသနေသည်။
အရောင်းအဝယ်ပမာဏသည် တိုကင် 56.84 သန်းအထိ ရောက်ရှိခဲ့ပြီး၊ ၂၄ နာရီအတွင်း USDT 3.34 သန်းခန့်နှင့် ညီမျှသည်။ ဤလှုပ်ရှားမှုမြင့်တက်လာခြင်းသည် ဈေးနှုန်းအတက်နှင့် တိုက်ဆိုင်နေသော်လည်း၊ မကြာသေးမီက ဈေးနှုန်းပြန်လည်ကျဆင်းခဲ့မှုအရ လက်ရှိအဆင့်တွင် ဝယ်ယူသူများအနေဖြင့် အားကောင်းမှုကို ဆက်လက်ပြသရန် လိုအပ်နေသေးသည်။
ချက်ချင်းရင်ဆိုင်ရမည့် ခုခံမှုသည် 0.06228 ဝန်းကျင်တွင်ရှိပြီး၊ ထို့နောက် 0.06404 တွင် ရှိသည်။ အောက်ဘက်တွင် 0.06000 သည် အနီးရှိ အရေးကြီးသော ထောက်ပံ့မှုအပိုင်းအခြားဖြစ်ပြီး၊ 0.05999 သည် ဇယားပေါ်ရှိ နောက်ထပ် ရည်ညွှန်းအဆင့်ဖြစ်သည်။
ပိုမိုကျယ်ပြန့်သော ရေတိုဈေးကွက်ဖွဲ့စည်းပုံမှာ အားကောင်းသည့်ဘက်တွင် ဆက်လက်ရှိနေသော်လည်း၊ မကြာသေးမီက တည်ဆောက်ထားသော အပိုင်းအခြားကို ထိန်းထားနိုင်ရန် အရေးကြီးသည်။ 0.06228 အထက်သို့ ပြန်လည်မြင့်တက်ခြင်းသည် ပြန်လည်နာလန်ထူရန် ကြိုးပမ်းမှုကို ပိုမိုအားကောင်းစေမည်ဖြစ်ပြီး၊ 0.06000 အောက်တွင် ဆက်တိုက်ကျဆင်းနေပါက ဈေးကွက်သည် ပိုမိုနက်ရှိုင်းသော ဈေးနှုန်းစုစည်းမှုတစ်ခု လိုအပ်နေကြောင်း ညွှန်ပြနိုင်သည်။
#BinanceSAFUFundTransferCompleted7499BTC #YiHe:ProofOfReserves:10TokensAt100%Backing #CZSaysCompensationIsinPlaceUsersAreProtected #B14gReportsUnauthorizedTransferOfAbout97MCORE #USSpotETHETFsPost23StraightDaysOfNetOutflows
၁၅ မိနစ်ဇယားတွင် တိုကင်သည် ဆက်တိုက်ရှိသော ခုခံမှုအဆင့်များကို ကျော်ဖြတ်လာစဉ် ဝယ်ယူမှုအရှိန် မြန်ဆန်လာခဲ့သည်။ ဈေးနှုန်းသည် နောက်ဆုံးတွင် 0.06404 သို့ ရောက်ရှိခဲ့ပြီးနောက် ရောင်းအားဖိအားနှင့် ရင်ဆိုင်ခဲ့ရသည်။ နောက်ဆုံးဖယောင်းတိုင်များအရ ဈေးနှုန်းသည် 0.06153 ဘက်သို့ ပြန်ဆုတ်လာပြီး၊ မြင့်တက်မှုနောက်တွင် ရေတိုအမြတ်ယူရောင်းချမှုအချို့ ရှိနေကြောင်း ပြသနေသည်။
အရောင်းအဝယ်ပမာဏသည် တိုကင် 56.84 သန်းအထိ ရောက်ရှိခဲ့ပြီး၊ ၂၄ နာရီအတွင်း USDT 3.34 သန်းခန့်နှင့် ညီမျှသည်။ ဤလှုပ်ရှားမှုမြင့်တက်လာခြင်းသည် ဈေးနှုန်းအတက်နှင့် တိုက်ဆိုင်နေသော်လည်း၊ မကြာသေးမီက ဈေးနှုန်းပြန်လည်ကျဆင်းခဲ့မှုအရ လက်ရှိအဆင့်တွင် ဝယ်ယူသူများအနေဖြင့် အားကောင်းမှုကို ဆက်လက်ပြသရန် လိုအပ်နေသေးသည်။
ချက်ချင်းရင်ဆိုင်ရမည့် ခုခံမှုသည် 0.06228 ဝန်းကျင်တွင်ရှိပြီး၊ ထို့နောက် 0.06404 တွင် ရှိသည်။ အောက်ဘက်တွင် 0.06000 သည် အနီးရှိ အရေးကြီးသော ထောက်ပံ့မှုအပိုင်းအခြားဖြစ်ပြီး၊ 0.05999 သည် ဇယားပေါ်ရှိ နောက်ထပ် ရည်ညွှန်းအဆင့်ဖြစ်သည်။
ပိုမိုကျယ်ပြန့်သော ရေတိုဈေးကွက်ဖွဲ့စည်းပုံမှာ အားကောင်းသည့်ဘက်တွင် ဆက်လက်ရှိနေသော်လည်း၊ မကြာသေးမီက တည်ဆောက်ထားသော အပိုင်းအခြားကို ထိန်းထားနိုင်ရန် အရေးကြီးသည်။ 0.06228 အထက်သို့ ပြန်လည်မြင့်တက်ခြင်းသည် ပြန်လည်နာလန်ထူရန် ကြိုးပမ်းမှုကို ပိုမိုအားကောင်းစေမည်ဖြစ်ပြီး၊ 0.06000 အောက်တွင် ဆက်တိုက်ကျဆင်းနေပါက ဈေးကွက်သည် ပိုမိုနက်ရှိုင်းသော ဈေးနှုန်းစုစည်းမှုတစ်ခု လိုအပ်နေကြောင်း ညွှန်ပြနိုင်သည်။
#BinanceSAFUFundTransferCompleted7499BTC #YiHe:ProofOfReserves:10TokensAt100%Backing #CZSaysCompensationIsinPlaceUsersAreProtected #B14gReportsUnauthorizedTransferOfAbout97MCORE #USSpotETHETFsPost23StraightDaysOfNetOutflows
122
·
--
တက်ရိပ်ရှိသည်
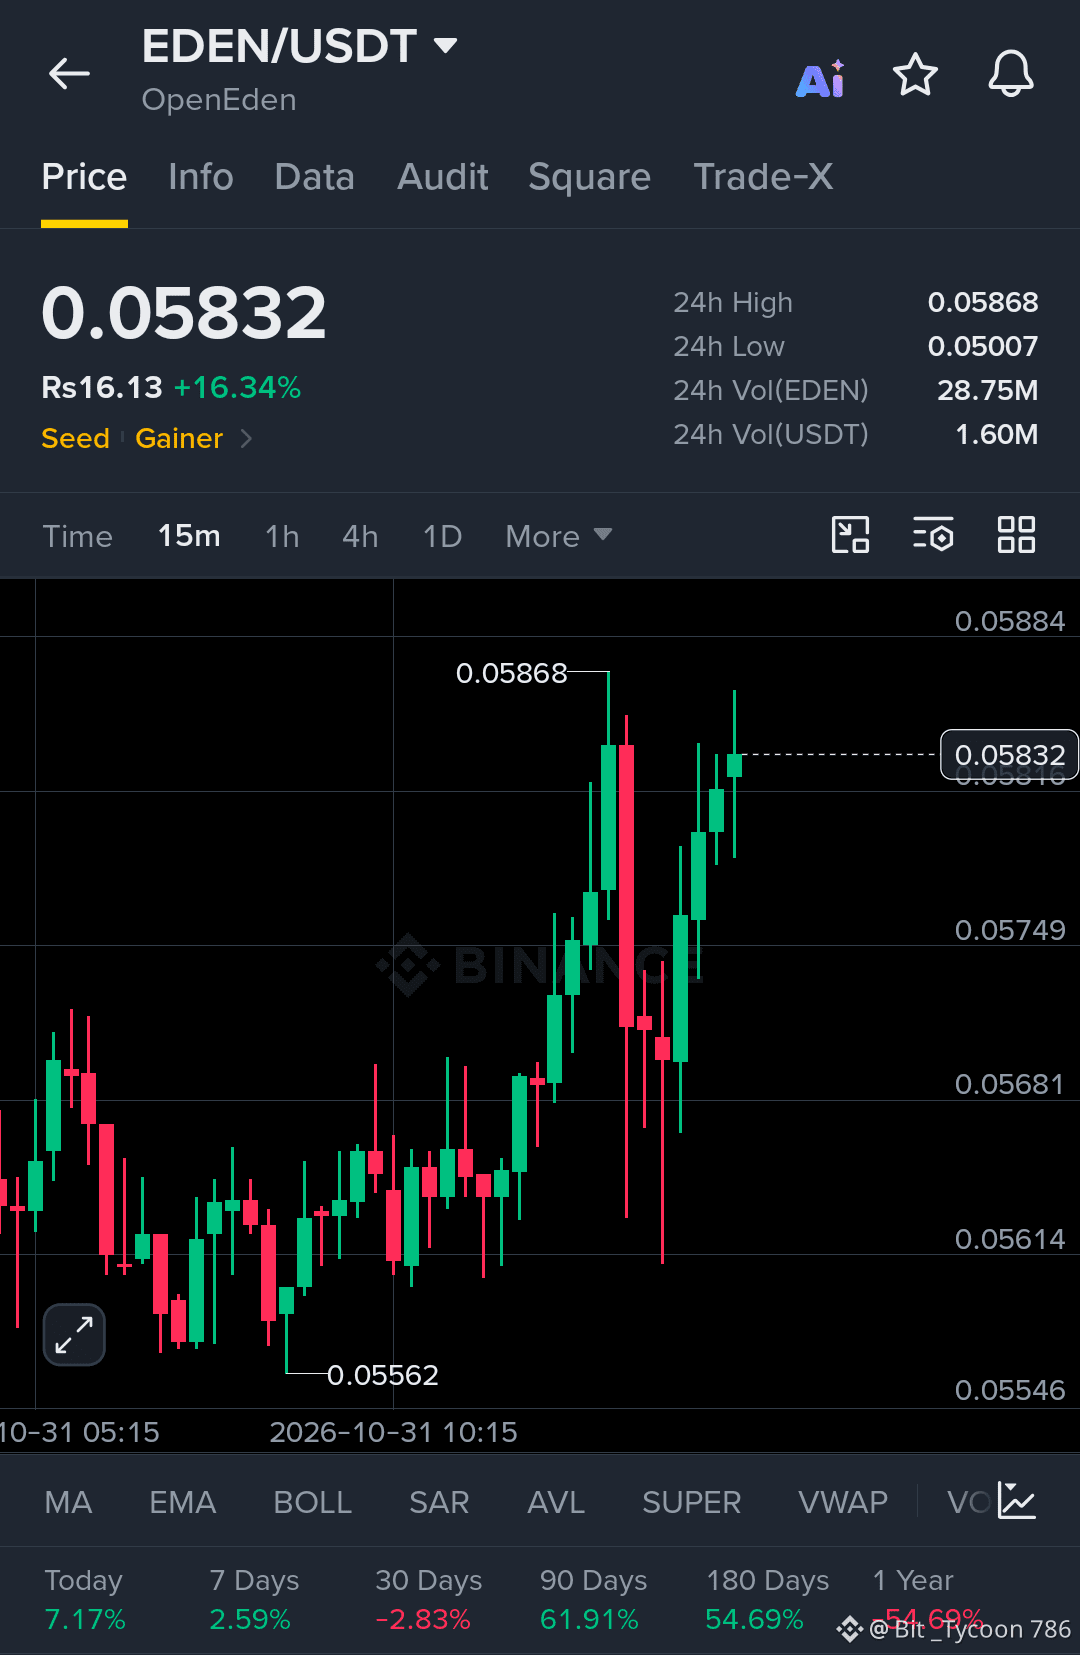
OpenEden ($EDEN ) သည် $0.05832 ဖြင့် အရောင်းအဝယ်ဖြစ်နေပြီး လွန်ခဲ့သော ၂၄ နာရီအတွင်း 16.34% မြင့်တက်ခဲ့သည်။ အရောင်းအဝယ်မတည်ငြိမ်သည့် ကာလတစ်ခုအပြီး ဈေးနှုန်းသည် $0.05562 နှင့် $0.05681 ကြား ရွေ့လျားခဲ့ပြီးနောက် ဝယ်ယူမှုများကြောင့် ပိုမိုမြင့်မားသော အပိုင်းအခြားသို့ ရောက်ရှိလာခဲ့သည်။
၁၅ မိနစ်ဇယားတွင် ကာလတိုအရှိန်အဟုန် တိုးတက်လာသည်ကို တွေ့ရသည်။ EDEN သည် $0.05868 အနီးသို့ လျင်မြန်စွာ မြင့်တက်ခဲ့ပြီးနောက် ရောင်းအားဖိအားနှင့် ရင်ဆိုင်ကာ ပြန်လည်ကျဆင်းခဲ့သော်လည်း ဝယ်သူများက နောက်ပိုင်းတွင် ထိန်းချုပ်မှုကို ပြန်လည်ရယူခဲ့သည်။ နောက်ဆုံးဖယောင်းတိုင်များတွင် ဈေးနှုန်းသည် ယခုအရောင်းအဝယ်ကာလ၏ အမြင့်ဆုံးအဆင့်သို့ ပြန်လည်တက်လာသည်ကို တွေ့ရပြီး၊ အစပိုင်းတွင် ဈေးနှုန်းပယ်ချခံရသော်လည်း ဝယ်လိုအား ဆက်လက်ရှိနေကြောင်း ပြသနေသည်။
လွန်ခဲ့သော ၂၄ နာရီအတွင်း အရောင်းအဝယ်ပမာဏမှာ EDEN ၂၈.၇၅ သန်းရှိပြီး USDT ၁.၆၀ သန်းခန့်နှင့် ညီမျှသည်။ ဈေးနှုန်းမြင့်တက်မှုနှင့်အတူ အရောင်းအဝယ်လှုပ်ရှားမှုလည်း တိုးလာခဲ့သော်လည်း မကြာသေးမီက ဈေးနှုန်းအတက်အကျများက ဤရွေ့လျားမှု၏ အားကောင်းမှုကို ဈေးကွက်က စမ်းသပ်နေဆဲဖြစ်ကြောင်း ညွှန်ပြနေသည်။
စောင့်ကြည့်ရမည့် လတ်တလော ခုခံမှုအဆင့်မှာ $0.05868 ဖြစ်သည်။ ထိုအဆင့်အထက်တွင် ဈေးနှုန်း ဆက်လက်တည်ရှိနိုင်ပါက ထပ်မံမြင့်တက်နိုင်ခြေရှိကြောင်း ပြသမည်ဖြစ်ပြီး၊ $0.05816 နှင့် $0.05749 တို့မှာ အနီးရှိ ထောက်ပံ့မှုအဆင့်များဖြစ်သည်။ ပိုမိုနက်ရှိုင်းသော ပြန်လည်ကျဆင်းမှုဖြစ်ပါက $0.05681 အဆင့်ကို ပြန်လည်အာရုံစိုက်လာနိုင်သည်။
EDEN ၏ ကာလတိုဈေးနှုန်းဖွဲ့စည်းပုံ တိုးတက်လာသော်လည်း ပြန်လည်ရယူထားသည့် အဆင့်များကို ဆက်လက်ထိန်းထားနိုင်ခြင်းသည် အရေးကြီးမည်ဖြစ်သည်။ နောက်ထပ်အခြေအနေသည် ဝယ်သူများက မကြာသေးမီက ခုခံမှုအဆင့်အထက်တွင် ဈေးကွက်က လက်ခံတည်ငြိမ်လာအောင် လုပ်ဆောင်နိုင်မနိုင်အပေါ် မူတည်မည်ဖြစ်ပြီး၊ မဟုတ်ပါက ဈေးနှုန်းသည် ယခင်အပိုင်းအခြားသို့ ပြန်လည်ကျဆင်းသွားနိုင်သည်။
{spot}(EDENUSDT)
#HeYiSaysWithdrawalsExpectedtoResumeWithin42Hours #CZSaysCompensationIsinPlaceUsersAreProtected #IntelHasItsWorstDaySince1974 #USDCCirculationFallsAbout800MInSevenDays #ASICHasReceivedNoPredictionMarketApplications
OpenEden ($EDEN ) သည် $0.05832 ဖြင့် အရောင်းအဝယ်ဖြစ်နေပြီး လွန်ခဲ့သော ၂၄ နာရီအတွင်း 16.34% မြင့်တက်ခဲ့သည်။ အရောင်းအဝယ်မတည်ငြိမ်သည့် ကာလတစ်ခုအပြီး ဈေးနှုန်းသည် $0.05562 နှင့် $0.05681 ကြား ရွေ့လျားခဲ့ပြီးနောက် ဝယ်ယူမှုများကြောင့် ပိုမိုမြင့်မားသော အပိုင်းအခြားသို့ ရောက်ရှိလာခဲ့သည်။
၁၅ မိနစ်ဇယားတွင် ကာလတိုအရှိန်အဟုန် တိုးတက်လာသည်ကို တွေ့ရသည်။ EDEN သည် $0.05868 အနီးသို့ လျင်မြန်စွာ မြင့်တက်ခဲ့ပြီးနောက် ရောင်းအားဖိအားနှင့် ရင်ဆိုင်ကာ ပြန်လည်ကျဆင်းခဲ့သော်လည်း ဝယ်သူများက နောက်ပိုင်းတွင် ထိန်းချုပ်မှုကို ပြန်လည်ရယူခဲ့သည်။ နောက်ဆုံးဖယောင်းတိုင်များတွင် ဈေးနှုန်းသည် ယခုအရောင်းအဝယ်ကာလ၏ အမြင့်ဆုံးအဆင့်သို့ ပြန်လည်တက်လာသည်ကို တွေ့ရပြီး၊ အစပိုင်းတွင် ဈေးနှုန်းပယ်ချခံရသော်လည်း ဝယ်လိုအား ဆက်လက်ရှိနေကြောင်း ပြသနေသည်။
လွန်ခဲ့သော ၂၄ နာရီအတွင်း အရောင်းအဝယ်ပမာဏမှာ EDEN ၂၈.၇၅ သန်းရှိပြီး USDT ၁.၆၀ သန်းခန့်နှင့် ညီမျှသည်။ ဈေးနှုန်းမြင့်တက်မှုနှင့်အတူ အရောင်းအဝယ်လှုပ်ရှားမှုလည်း တိုးလာခဲ့သော်လည်း မကြာသေးမီက ဈေးနှုန်းအတက်အကျများက ဤရွေ့လျားမှု၏ အားကောင်းမှုကို ဈေးကွက်က စမ်းသပ်နေဆဲဖြစ်ကြောင်း ညွှန်ပြနေသည်။
စောင့်ကြည့်ရမည့် လတ်တလော ခုခံမှုအဆင့်မှာ $0.05868 ဖြစ်သည်။ ထိုအဆင့်အထက်တွင် ဈေးနှုန်း ဆက်လက်တည်ရှိနိုင်ပါက ထပ်မံမြင့်တက်နိုင်ခြေရှိကြောင်း ပြသမည်ဖြစ်ပြီး၊ $0.05816 နှင့် $0.05749 တို့မှာ အနီးရှိ ထောက်ပံ့မှုအဆင့်များဖြစ်သည်။ ပိုမိုနက်ရှိုင်းသော ပြန်လည်ကျဆင်းမှုဖြစ်ပါက $0.05681 အဆင့်ကို ပြန်လည်အာရုံစိုက်လာနိုင်သည်။
EDEN ၏ ကာလတိုဈေးနှုန်းဖွဲ့စည်းပုံ တိုးတက်လာသော်လည်း ပြန်လည်ရယူထားသည့် အဆင့်များကို ဆက်လက်ထိန်းထားနိုင်ခြင်းသည် အရေးကြီးမည်ဖြစ်သည်။ နောက်ထပ်အခြေအနေသည် ဝယ်သူများက မကြာသေးမီက ခုခံမှုအဆင့်အထက်တွင် ဈေးကွက်က လက်ခံတည်ငြိမ်လာအောင် လုပ်ဆောင်နိုင်မနိုင်အပေါ် မူတည်မည်ဖြစ်ပြီး၊ မဟုတ်ပါက ဈေးနှုန်းသည် ယခင်အပိုင်းအခြားသို့ ပြန်လည်ကျဆင်းသွားနိုင်သည်။
#HeYiSaysWithdrawalsExpectedtoResumeWithin42Hours #CZSaysCompensationIsinPlaceUsersAreProtected #IntelHasItsWorstDaySince1974 #USDCCirculationFallsAbout800MInSevenDays #ASICHasReceivedNoPredictionMarketApplications
၁၅ မိနစ်ဇယားတွင် ကာလတိုအရှိန်အဟုန် တိုးတက်လာသည်ကို တွေ့ရသည်။ EDEN သည် $0.05868 အနီးသို့ လျင်မြန်စွာ မြင့်တက်ခဲ့ပြီးနောက် ရောင်းအားဖိအားနှင့် ရင်ဆိုင်ကာ ပြန်လည်ကျဆင်းခဲ့သော်လည်း ဝယ်သူများက နောက်ပိုင်းတွင် ထိန်းချုပ်မှုကို ပြန်လည်ရယူခဲ့သည်။ နောက်ဆုံးဖယောင်းတိုင်များတွင် ဈေးနှုန်းသည် ယခုအရောင်းအဝယ်ကာလ၏ အမြင့်ဆုံးအဆင့်သို့ ပြန်လည်တက်လာသည်ကို တွေ့ရပြီး၊ အစပိုင်းတွင် ဈေးနှုန်းပယ်ချခံရသော်လည်း ဝယ်လိုအား ဆက်လက်ရှိနေကြောင်း ပြသနေသည်။
လွန်ခဲ့သော ၂၄ နာရီအတွင်း အရောင်းအဝယ်ပမာဏမှာ EDEN ၂၈.၇၅ သန်းရှိပြီး USDT ၁.၆၀ သန်းခန့်နှင့် ညီမျှသည်။ ဈေးနှုန်းမြင့်တက်မှုနှင့်အတူ အရောင်းအဝယ်လှုပ်ရှားမှုလည်း တိုးလာခဲ့သော်လည်း မကြာသေးမီက ဈေးနှုန်းအတက်အကျများက ဤရွေ့လျားမှု၏ အားကောင်းမှုကို ဈေးကွက်က စမ်းသပ်နေဆဲဖြစ်ကြောင်း ညွှန်ပြနေသည်။
စောင့်ကြည့်ရမည့် လတ်တလော ခုခံမှုအဆင့်မှာ $0.05868 ဖြစ်သည်။ ထိုအဆင့်အထက်တွင် ဈေးနှုန်း ဆက်လက်တည်ရှိနိုင်ပါက ထပ်မံမြင့်တက်နိုင်ခြေရှိကြောင်း ပြသမည်ဖြစ်ပြီး၊ $0.05816 နှင့် $0.05749 တို့မှာ အနီးရှိ ထောက်ပံ့မှုအဆင့်များဖြစ်သည်။ ပိုမိုနက်ရှိုင်းသော ပြန်လည်ကျဆင်းမှုဖြစ်ပါက $0.05681 အဆင့်ကို ပြန်လည်အာရုံစိုက်လာနိုင်သည်။
EDEN ၏ ကာလတိုဈေးနှုန်းဖွဲ့စည်းပုံ တိုးတက်လာသော်လည်း ပြန်လည်ရယူထားသည့် အဆင့်များကို ဆက်လက်ထိန်းထားနိုင်ခြင်းသည် အရေးကြီးမည်ဖြစ်သည်။ နောက်ထပ်အခြေအနေသည် ဝယ်သူများက မကြာသေးမီက ခုခံမှုအဆင့်အထက်တွင် ဈေးကွက်က လက်ခံတည်ငြိမ်လာအောင် လုပ်ဆောင်နိုင်မနိုင်အပေါ် မူတည်မည်ဖြစ်ပြီး၊ မဟုတ်ပါက ဈေးနှုန်းသည် ယခင်အပိုင်းအခြားသို့ ပြန်လည်ကျဆင်းသွားနိုင်သည်။
#HeYiSaysWithdrawalsExpectedtoResumeWithin42Hours #CZSaysCompensationIsinPlaceUsersAreProtected #IntelHasItsWorstDaySince1974 #USDCCirculationFallsAbout800MInSevenDays #ASICHasReceivedNoPredictionMarketApplications
60
·
--
တက်ရိပ်ရှိသည်
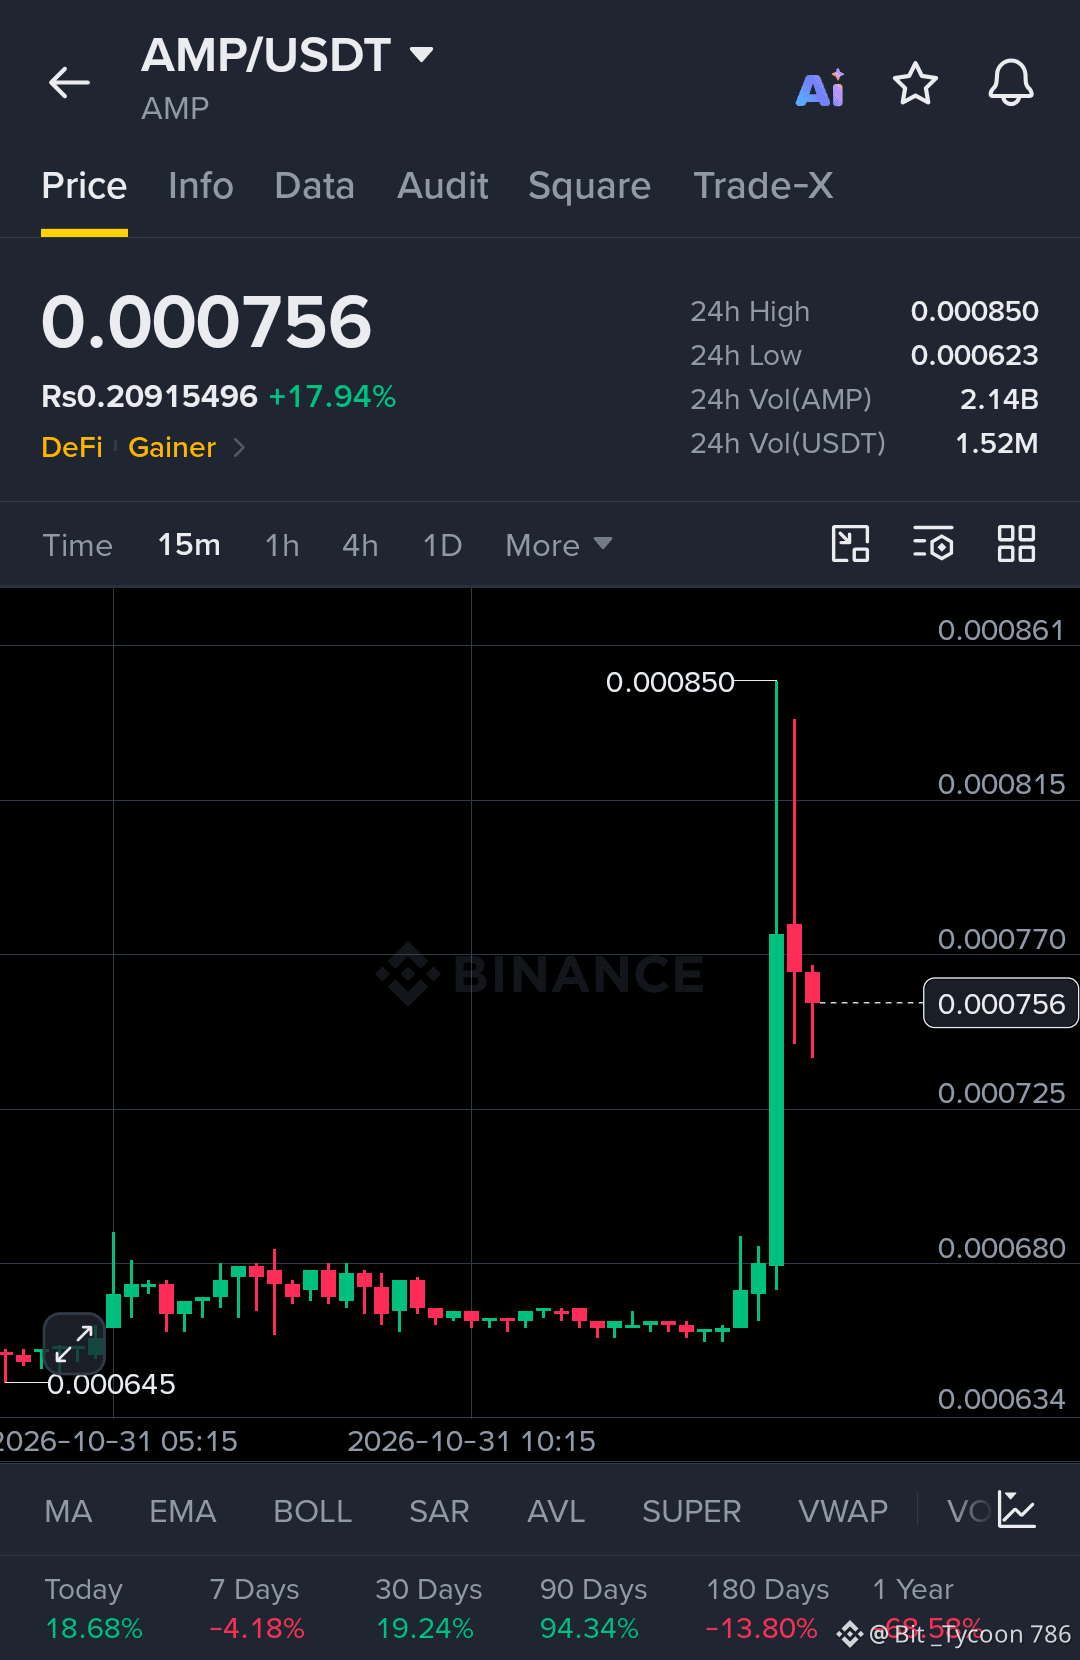
$AMP သည် လက်ရှိ $0.000756 ဖြင့် အရောင်းအဝယ်ဖြစ်နေပြီး၊ ဝယ်ယူမှုများ သိသိသာသာ မြင့်တက်လာပြီးနောက် ပြီးခဲ့သည့် 24 နာရီအတွင်း 17.94% တက်လာခဲ့သည်။ ဈေးနှုန်းသည် အချိန်အတော်ကြာ အတက်အကျနည်းပါးစွာ ရွေ့လျားခဲ့ပြီး၊ အရောင်းအဝယ်အများစုမှာ $0.000645–$0.000680 အတွင်း စုစည်းနေခဲ့သည်။
15 မိနစ်ဇယားတွင် AMP သည် ထိုဈေးနှုန်းစုစည်းမှုအပိုင်းကို ကျော်တက်ခဲ့ပြီး ခဏတာ $0.000850 အထိ ရောက်ရှိခဲ့သည်။ အစပိုင်း မြင့်တက်မှုနောက်တွင် ပြင်းထန်စွာ ဈေးပြန်ကျဆင်းခဲ့ကာ၊ ဈေးနှုန်းသည် $0.000756 ဝန်းကျင်သို့ ပြန်လည်ဆုတ်ယုတ်လာသည်။ ယင်းက အရောင်းသမားများသည် ထိုအချိန်က အမြင့်ဆုံးဈေးအနီးတွင် လှုပ်ရှားလာခဲ့ကြောင်း ပြသပြီး၊ ယခုအခါ ဈေးကွက်က ဈေးနှုန်းကျော်တက်မှုကို ထိန်းထားနိုင်မနိုင် သုံးသပ်နေသည်။
အရောင်းအဝယ်ပမာဏမှာ AMP 2.14 ဘီလီယံရှိပြီး၊ ပြီးခဲ့သည့် 24 နာရီအတွင်း USDT 1.52 သန်းခန့်နှင့် ညီမျှသည်။ ယခင်က ဈေးကွက်ငြိမ်သက်နေခဲ့သည့် အခြေအနေနှင့် နှိုင်းယှဉ်လျှင် ယခုလှုပ်ရှားမှု မြင့်တက်လာခြင်းမှာ မှတ်သားဖွယ်ဖြစ်သည်။
လက်ရှိဈေးနှုန်းအနီးရှိ $0.000750–$0.000725 အပိုင်းကို ဖြစ်နိုင်ခြေရှိသော ထောက်ခံမှုအဖြစ် စောင့်ကြည့်သင့်သည်။ အပေါ်ဘက်တွင် အနီးဆုံး ခုခံမှုမှာ $0.000770 ဖြစ်ပြီး၊ ထို့နောက် မကြာသေးမီက အမြင့်ဆုံးဈေးဖြစ်သည့် $0.000850 ရှိသည်။ ဤအဆင့်များကို ကျော်လွန်ပြီး ပြန်လည်မြင့်တက်နိုင်ပါက ဝယ်ယူမှုစိတ်ဝင်စားမှု ဆက်လက်ရှိနေကြောင်း ပိုမိုခိုင်မာသော အထောက်အထား ဖြစ်လာမည်။
လက်ရှိအချိန်တွင် AMP သည် ရေတိုအတွင်း သိသာထင်ရှားသော ဈေးနှုန်းလှုပ်ရှားမှုတစ်ခုကို ပြသခဲ့သော်လည်း၊ ရုတ်တရက်မြင့်တက်ပြီးနောက် ပြန်လည်ဆုတ်ယုတ်လာသဖြင့် အတည်ပြုချက်ရရှိရန် အရေးကြီးသည်။ ဈေးနှုန်းသည် ကျော်တက်ခဲ့သည့် အပိုင်းအထက်တွင် တည်ငြိမ်နိုင်မနိုင်က ယင်းသည် ပိုမိုကျယ်ပြန့်သော ပြန်လည်နာလန်ထူမှု၏ အစလား၊ သို့မဟုတ် ယာယီမတည်ငြိမ်မှု မြင့်တက်ခြင်းသာလားကို ဆုံးဖြတ်ရာတွင် အထောက်အကူပြုမည်။
{spot}(AMPUSDT)
#HeYiSaysWithdrawalsExpectedtoResumeWithin42Hours #IntelHasItsWorstDaySince1974 #USDCCirculationFallsAbout800MInSevenDays
$AMP သည် လက်ရှိ $0.000756 ဖြင့် အရောင်းအဝယ်ဖြစ်နေပြီး၊ ဝယ်ယူမှုများ သိသိသာသာ မြင့်တက်လာပြီးနောက် ပြီးခဲ့သည့် 24 နာရီအတွင်း 17.94% တက်လာခဲ့သည်။ ဈေးနှုန်းသည် အချိန်အတော်ကြာ အတက်အကျနည်းပါးစွာ ရွေ့လျားခဲ့ပြီး၊ အရောင်းအဝယ်အများစုမှာ $0.000645–$0.000680 အတွင်း စုစည်းနေခဲ့သည်။
15 မိနစ်ဇယားတွင် AMP သည် ထိုဈေးနှုန်းစုစည်းမှုအပိုင်းကို ကျော်တက်ခဲ့ပြီး ခဏတာ $0.000850 အထိ ရောက်ရှိခဲ့သည်။ အစပိုင်း မြင့်တက်မှုနောက်တွင် ပြင်းထန်စွာ ဈေးပြန်ကျဆင်းခဲ့ကာ၊ ဈေးနှုန်းသည် $0.000756 ဝန်းကျင်သို့ ပြန်လည်ဆုတ်ယုတ်လာသည်။ ယင်းက အရောင်းသမားများသည် ထိုအချိန်က အမြင့်ဆုံးဈေးအနီးတွင် လှုပ်ရှားလာခဲ့ကြောင်း ပြသပြီး၊ ယခုအခါ ဈေးကွက်က ဈေးနှုန်းကျော်တက်မှုကို ထိန်းထားနိုင်မနိုင် သုံးသပ်နေသည်။
အရောင်းအဝယ်ပမာဏမှာ AMP 2.14 ဘီလီယံရှိပြီး၊ ပြီးခဲ့သည့် 24 နာရီအတွင်း USDT 1.52 သန်းခန့်နှင့် ညီမျှသည်။ ယခင်က ဈေးကွက်ငြိမ်သက်နေခဲ့သည့် အခြေအနေနှင့် နှိုင်းယှဉ်လျှင် ယခုလှုပ်ရှားမှု မြင့်တက်လာခြင်းမှာ မှတ်သားဖွယ်ဖြစ်သည်။
လက်ရှိဈေးနှုန်းအနီးရှိ $0.000750–$0.000725 အပိုင်းကို ဖြစ်နိုင်ခြေရှိသော ထောက်ခံမှုအဖြစ် စောင့်ကြည့်သင့်သည်။ အပေါ်ဘက်တွင် အနီးဆုံး ခုခံမှုမှာ $0.000770 ဖြစ်ပြီး၊ ထို့နောက် မကြာသေးမီက အမြင့်ဆုံးဈေးဖြစ်သည့် $0.000850 ရှိသည်။ ဤအဆင့်များကို ကျော်လွန်ပြီး ပြန်လည်မြင့်တက်နိုင်ပါက ဝယ်ယူမှုစိတ်ဝင်စားမှု ဆက်လက်ရှိနေကြောင်း ပိုမိုခိုင်မာသော အထောက်အထား ဖြစ်လာမည်။
လက်ရှိအချိန်တွင် AMP သည် ရေတိုအတွင်း သိသာထင်ရှားသော ဈေးနှုန်းလှုပ်ရှားမှုတစ်ခုကို ပြသခဲ့သော်လည်း၊ ရုတ်တရက်မြင့်တက်ပြီးနောက် ပြန်လည်ဆုတ်ယုတ်လာသဖြင့် အတည်ပြုချက်ရရှိရန် အရေးကြီးသည်။ ဈေးနှုန်းသည် ကျော်တက်ခဲ့သည့် အပိုင်းအထက်တွင် တည်ငြိမ်နိုင်မနိုင်က ယင်းသည် ပိုမိုကျယ်ပြန့်သော ပြန်လည်နာလန်ထူမှု၏ အစလား၊ သို့မဟုတ် ယာယီမတည်ငြိမ်မှု မြင့်တက်ခြင်းသာလားကို ဆုံးဖြတ်ရာတွင် အထောက်အကူပြုမည်။
#HeYiSaysWithdrawalsExpectedtoResumeWithin42Hours #IntelHasItsWorstDaySince1974 #USDCCirculationFallsAbout800MInSevenDays
15 မိနစ်ဇယားတွင် AMP သည် ထိုဈေးနှုန်းစုစည်းမှုအပိုင်းကို ကျော်တက်ခဲ့ပြီး ခဏတာ $0.000850 အထိ ရောက်ရှိခဲ့သည်။ အစပိုင်း မြင့်တက်မှုနောက်တွင် ပြင်းထန်စွာ ဈေးပြန်ကျဆင်းခဲ့ကာ၊ ဈေးနှုန်းသည် $0.000756 ဝန်းကျင်သို့ ပြန်လည်ဆုတ်ယုတ်လာသည်။ ယင်းက အရောင်းသမားများသည် ထိုအချိန်က အမြင့်ဆုံးဈေးအနီးတွင် လှုပ်ရှားလာခဲ့ကြောင်း ပြသပြီး၊ ယခုအခါ ဈေးကွက်က ဈေးနှုန်းကျော်တက်မှုကို ထိန်းထားနိုင်မနိုင် သုံးသပ်နေသည်။
အရောင်းအဝယ်ပမာဏမှာ AMP 2.14 ဘီလီယံရှိပြီး၊ ပြီးခဲ့သည့် 24 နာရီအတွင်း USDT 1.52 သန်းခန့်နှင့် ညီမျှသည်။ ယခင်က ဈေးကွက်ငြိမ်သက်နေခဲ့သည့် အခြေအနေနှင့် နှိုင်းယှဉ်လျှင် ယခုလှုပ်ရှားမှု မြင့်တက်လာခြင်းမှာ မှတ်သားဖွယ်ဖြစ်သည်။
လက်ရှိဈေးနှုန်းအနီးရှိ $0.000750–$0.000725 အပိုင်းကို ဖြစ်နိုင်ခြေရှိသော ထောက်ခံမှုအဖြစ် စောင့်ကြည့်သင့်သည်။ အပေါ်ဘက်တွင် အနီးဆုံး ခုခံမှုမှာ $0.000770 ဖြစ်ပြီး၊ ထို့နောက် မကြာသေးမီက အမြင့်ဆုံးဈေးဖြစ်သည့် $0.000850 ရှိသည်။ ဤအဆင့်များကို ကျော်လွန်ပြီး ပြန်လည်မြင့်တက်နိုင်ပါက ဝယ်ယူမှုစိတ်ဝင်စားမှု ဆက်လက်ရှိနေကြောင်း ပိုမိုခိုင်မာသော အထောက်အထား ဖြစ်လာမည်။
လက်ရှိအချိန်တွင် AMP သည် ရေတိုအတွင်း သိသာထင်ရှားသော ဈေးနှုန်းလှုပ်ရှားမှုတစ်ခုကို ပြသခဲ့သော်လည်း၊ ရုတ်တရက်မြင့်တက်ပြီးနောက် ပြန်လည်ဆုတ်ယုတ်လာသဖြင့် အတည်ပြုချက်ရရှိရန် အရေးကြီးသည်။ ဈေးနှုန်းသည် ကျော်တက်ခဲ့သည့် အပိုင်းအထက်တွင် တည်ငြိမ်နိုင်မနိုင်က ယင်းသည် ပိုမိုကျယ်ပြန့်သော ပြန်လည်နာလန်ထူမှု၏ အစလား၊ သို့မဟုတ် ယာယီမတည်ငြိမ်မှု မြင့်တက်ခြင်းသာလားကို ဆုံးဖြတ်ရာတွင် အထောက်အကူပြုမည်။
#HeYiSaysWithdrawalsExpectedtoResumeWithin42Hours #IntelHasItsWorstDaySince1974 #USDCCirculationFallsAbout800MInSevenDays
56
·
--
တက်ရိပ်ရှိသည်
ဘာသာပြန်ဆိုချက် ကြည့်မည်
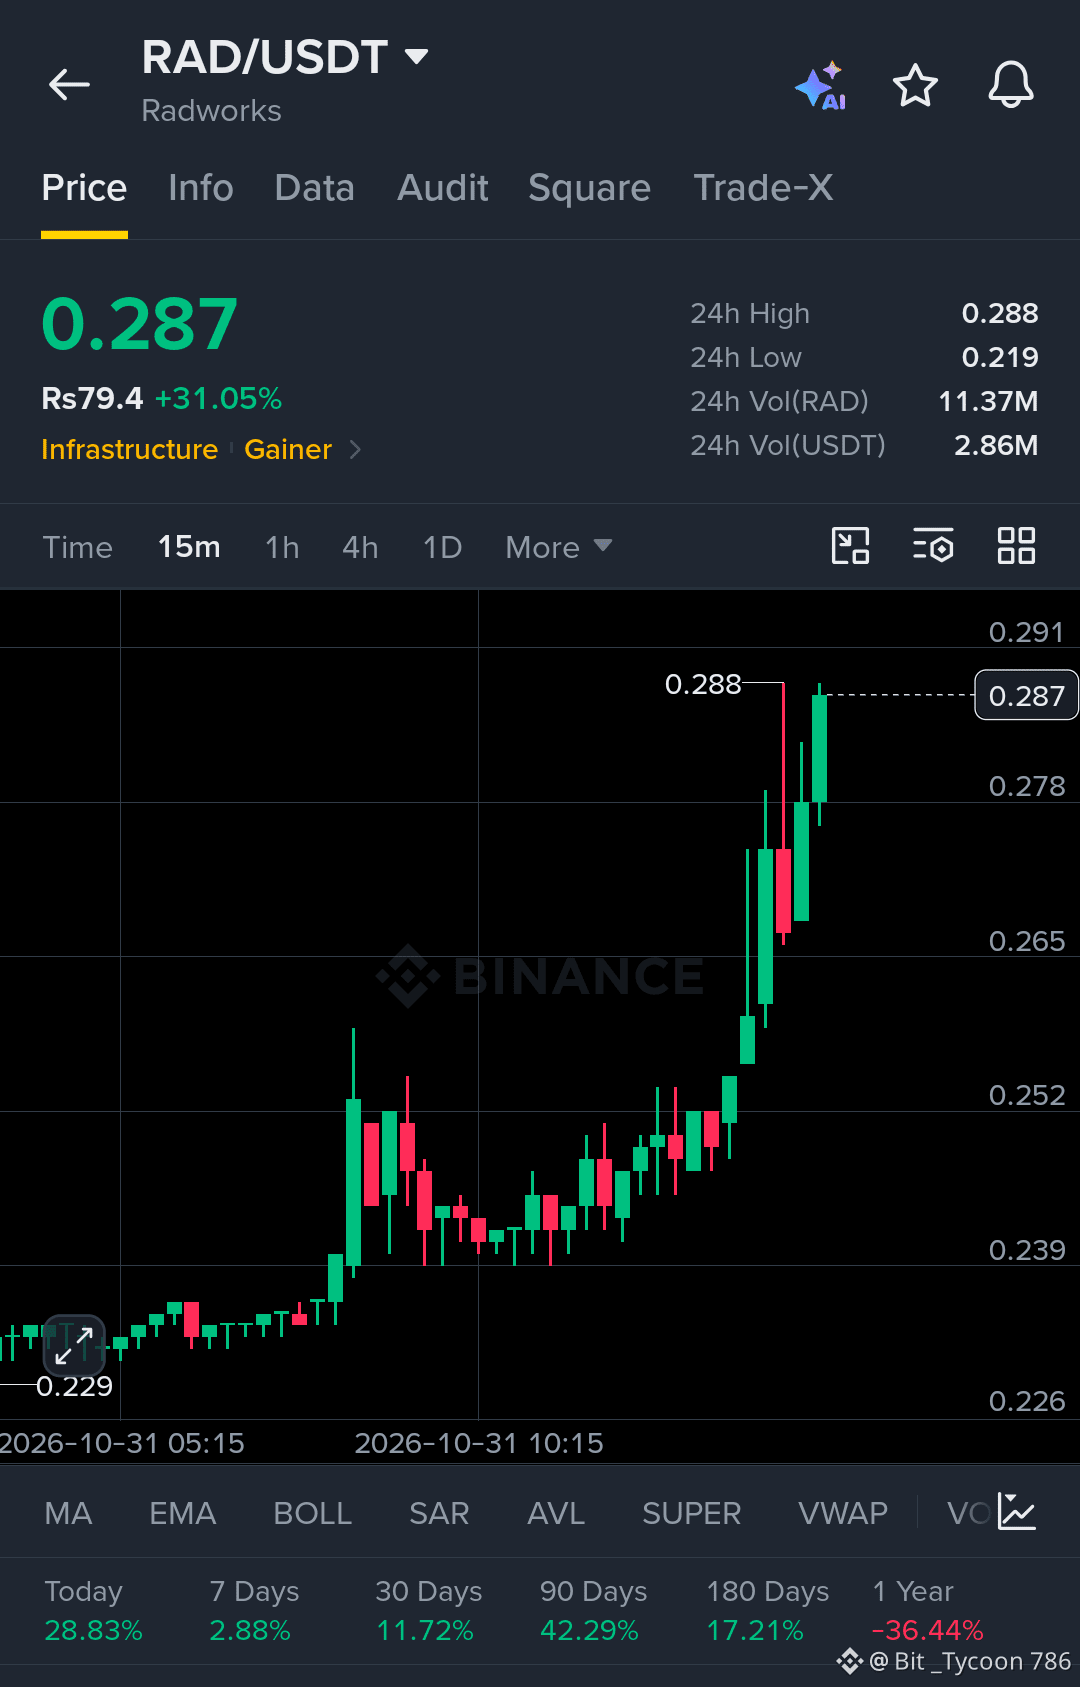
$RAD is showing a notable increase in market activity, with price climbing to $0.287 and gaining 31.05% over the last 24 hours. The move has pushed it close to its daily high of $0.288, following a period of relatively quiet trading around the $0.23–$0.25 range.
The 15-minute chart shows a clear shift in short-term momentum. Buying pressure increased as RAD moved above previous consolidation levels, with a brief pullback toward $0.265 before buyers stepped in again. Price has since recovered toward the recent high, suggesting that demand remains active.
Volume has also expanded, reaching 11.37 million RAD, equivalent to approximately 2.86 million USDT in trading volume. This makes the recent move worth monitoring, particularly as price approaches the $0.288–$0.291 resistance area.
For now, $0.278 is an important nearby level to watch, while $0.265 remains a deeper support reference. A sustained move above resistance could strengthen the current structure, whereas rejection may lead to further consolidation.
The next move will depend on whether buyers can maintain participation near the recent highs.
{spot}(RADUSDT)
#USDCCirculationFallsAbout800MInSevenDays #ASICHasReceivedNoPredictionMarketApplications
$RAD is showing a notable increase in market activity, with price climbing to $0.287 and gaining 31.05% over the last 24 hours. The move has pushed it close to its daily high of $0.288, following a period of relatively quiet trading around the $0.23–$0.25 range.
The 15-minute chart shows a clear shift in short-term momentum. Buying pressure increased as RAD moved above previous consolidation levels, with a brief pullback toward $0.265 before buyers stepped in again. Price has since recovered toward the recent high, suggesting that demand remains active.
Volume has also expanded, reaching 11.37 million RAD, equivalent to approximately 2.86 million USDT in trading volume. This makes the recent move worth monitoring, particularly as price approaches the $0.288–$0.291 resistance area.
For now, $0.278 is an important nearby level to watch, while $0.265 remains a deeper support reference. A sustained move above resistance could strengthen the current structure, whereas rejection may lead to further consolidation.
The next move will depend on whether buyers can maintain participation near the recent highs.
#USDCCirculationFallsAbout800MInSevenDays #ASICHasReceivedNoPredictionMarketApplications
The 15-minute chart shows a clear shift in short-term momentum. Buying pressure increased as RAD moved above previous consolidation levels, with a brief pullback toward $0.265 before buyers stepped in again. Price has since recovered toward the recent high, suggesting that demand remains active.
Volume has also expanded, reaching 11.37 million RAD, equivalent to approximately 2.86 million USDT in trading volume. This makes the recent move worth monitoring, particularly as price approaches the $0.288–$0.291 resistance area.
For now, $0.278 is an important nearby level to watch, while $0.265 remains a deeper support reference. A sustained move above resistance could strengthen the current structure, whereas rejection may lead to further consolidation.
The next move will depend on whether buyers can maintain participation near the recent highs.
#USDCCirculationFallsAbout800MInSevenDays #ASICHasReceivedNoPredictionMarketApplications
54
·
--
တက်ရိပ်ရှိသည်
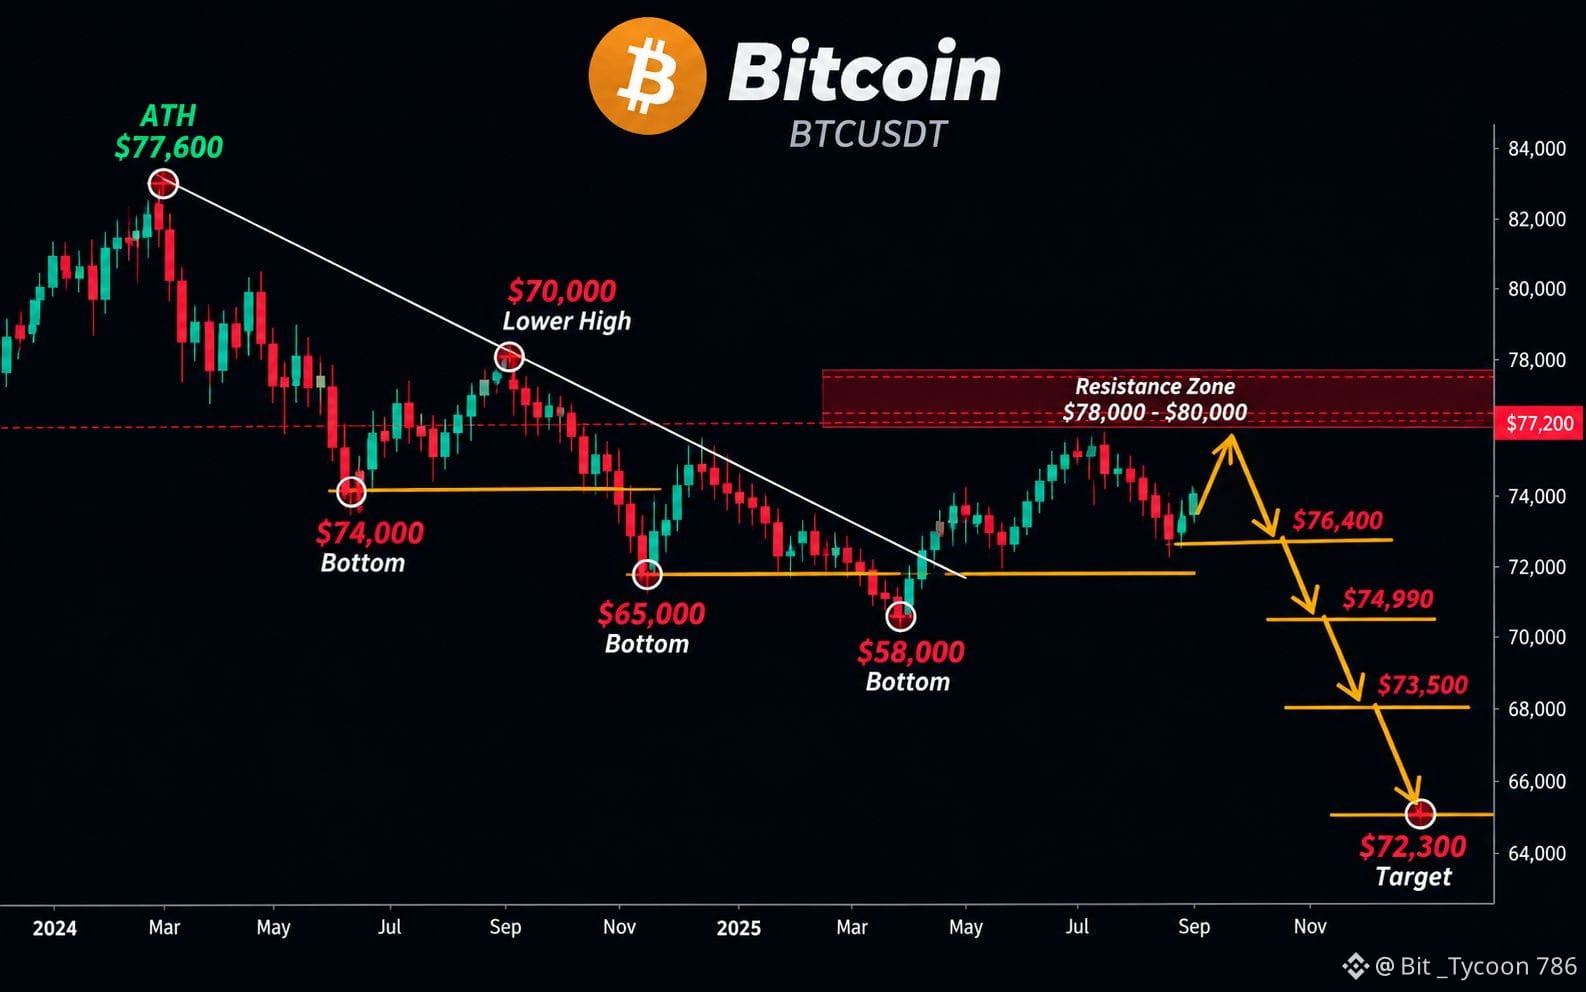
🚨 သတိပေးချက်: BTC စျေးကွက်အခြေအနေ 🚨
$BTC သည် $77,180 ဝန်းကျင်တွင် အရောင်းအဝယ်ဖြစ်နေပြီး ကာလတိုအတွင်း အကျဘက်အရှိန်အဟုန်က ဆက်လက်လွှမ်းမိုးနေသည်။ ရောင်းချသူများက ခုခံမှုကို ကာကွယ်နေပြီး $76,400 သည် စောင့်ကြည့်ရမည့် အရေးကြီးသော ထောက်ပံ့စျေးနှုန်းအဖြစ် ရှိနေသည်။
စျေးနှုန်းကျိုးကျသွားပါက ဝယ်လိုအားနည်းသော အောက်ပိုင်းဇုန်များသို့ ငွေဖြစ်လွယ်မှုကို ထပ်မံရှာဖွေသည့် လှုပ်ရှားမှုတစ်ခု ဖြစ်ပေါ်လာနိုင်သည်။
📉 လမ်းကြောင်း:
$76,400 → $74,990 → $73,500 → $72,300 ငွေဖြစ်လွယ်မှုကို ရှင်းထုတ်ခြင်း။
ငွေဖြစ်လွယ်မှုကို ရှင်းထုတ်သည့် လှုပ်ရှားမှုကြောင့် မထိတ်လန့်ပါနှင့်။ တကယ့်စုဆောင်းဝယ်ယူမှုက စျေးနှုန်းထိုးကျပြီးနောက်မှ ဖြစ်ပေါ်သည်။ ဒီပို့စ်ကို သိမ်းထားပြီး ရက်သတ္တပတ်အနည်းငယ်ကြာလျှင် ပြန်လာကြည့်ပါ။ 👇
လက်ရှိစျေးကွက် ကိုးကားချက်: 2026 ခုနှစ် အောက်တိုဘာ 31 ရက်။ ကာလတိုအတွင်း အကျဘက်ဖြစ်နိုင်သည့် အခြေအနေဖြစ်ပြီး ခုခံမှုကို ပြန်လည်ကျော်တက်နိုင်ပါက ဤလမ်းကြောင်း မှားယွင်းသွားနိုင်သည်။ COINOTAG +2
{spot}(BTCUSDT)
🚨 သတိပေးချက်: BTC စျေးကွက်အခြေအနေ 🚨
$BTC သည် $77,180 ဝန်းကျင်တွင် အရောင်းအဝယ်ဖြစ်နေပြီး ကာလတိုအတွင်း အကျဘက်အရှိန်အဟုန်က ဆက်လက်လွှမ်းမိုးနေသည်။ ရောင်းချသူများက ခုခံမှုကို ကာကွယ်နေပြီး $76,400 သည် စောင့်ကြည့်ရမည့် အရေးကြီးသော ထောက်ပံ့စျေးနှုန်းအဖြစ် ရှိနေသည်။
စျေးနှုန်းကျိုးကျသွားပါက ဝယ်လိုအားနည်းသော အောက်ပိုင်းဇုန်များသို့ ငွေဖြစ်လွယ်မှုကို ထပ်မံရှာဖွေသည့် လှုပ်ရှားမှုတစ်ခု ဖြစ်ပေါ်လာနိုင်သည်။
📉 လမ်းကြောင်း:
$76,400 → $74,990 → $73,500 → $72,300 ငွေဖြစ်လွယ်မှုကို ရှင်းထုတ်ခြင်း။
ငွေဖြစ်လွယ်မှုကို ရှင်းထုတ်သည့် လှုပ်ရှားမှုကြောင့် မထိတ်လန့်ပါနှင့်။ တကယ့်စုဆောင်းဝယ်ယူမှုက စျေးနှုန်းထိုးကျပြီးနောက်မှ ဖြစ်ပေါ်သည်။ ဒီပို့စ်ကို သိမ်းထားပြီး ရက်သတ္တပတ်အနည်းငယ်ကြာလျှင် ပြန်လာကြည့်ပါ။ 👇
လက်ရှိစျေးကွက် ကိုးကားချက်: 2026 ခုနှစ် အောက်တိုဘာ 31 ရက်။ ကာလတိုအတွင်း အကျဘက်ဖြစ်နိုင်သည့် အခြေအနေဖြစ်ပြီး ခုခံမှုကို ပြန်လည်ကျော်တက်နိုင်ပါက ဤလမ်းကြောင်း မှားယွင်းသွားနိုင်သည်။ COINOTAG +2
$BTC သည် $77,180 ဝန်းကျင်တွင် အရောင်းအဝယ်ဖြစ်နေပြီး ကာလတိုအတွင်း အကျဘက်အရှိန်အဟုန်က ဆက်လက်လွှမ်းမိုးနေသည်။ ရောင်းချသူများက ခုခံမှုကို ကာကွယ်နေပြီး $76,400 သည် စောင့်ကြည့်ရမည့် အရေးကြီးသော ထောက်ပံ့စျေးနှုန်းအဖြစ် ရှိနေသည်။
စျေးနှုန်းကျိုးကျသွားပါက ဝယ်လိုအားနည်းသော အောက်ပိုင်းဇုန်များသို့ ငွေဖြစ်လွယ်မှုကို ထပ်မံရှာဖွေသည့် လှုပ်ရှားမှုတစ်ခု ဖြစ်ပေါ်လာနိုင်သည်။
📉 လမ်းကြောင်း:
$76,400 → $74,990 → $73,500 → $72,300 ငွေဖြစ်လွယ်မှုကို ရှင်းထုတ်ခြင်း။
ငွေဖြစ်လွယ်မှုကို ရှင်းထုတ်သည့် လှုပ်ရှားမှုကြောင့် မထိတ်လန့်ပါနှင့်။ တကယ့်စုဆောင်းဝယ်ယူမှုက စျေးနှုန်းထိုးကျပြီးနောက်မှ ဖြစ်ပေါ်သည်။ ဒီပို့စ်ကို သိမ်းထားပြီး ရက်သတ္တပတ်အနည်းငယ်ကြာလျှင် ပြန်လာကြည့်ပါ။ 👇
လက်ရှိစျေးကွက် ကိုးကားချက်: 2026 ခုနှစ် အောက်တိုဘာ 31 ရက်။ ကာလတိုအတွင်း အကျဘက်ဖြစ်နိုင်သည့် အခြေအနေဖြစ်ပြီး ခုခံမှုကို ပြန်လည်ကျော်တက်နိုင်ပါက ဤလမ်းကြောင်း မှားယွင်းသွားနိုင်သည်။ COINOTAG +2
160
·
--
တက်ရိပ်ရှိသည်
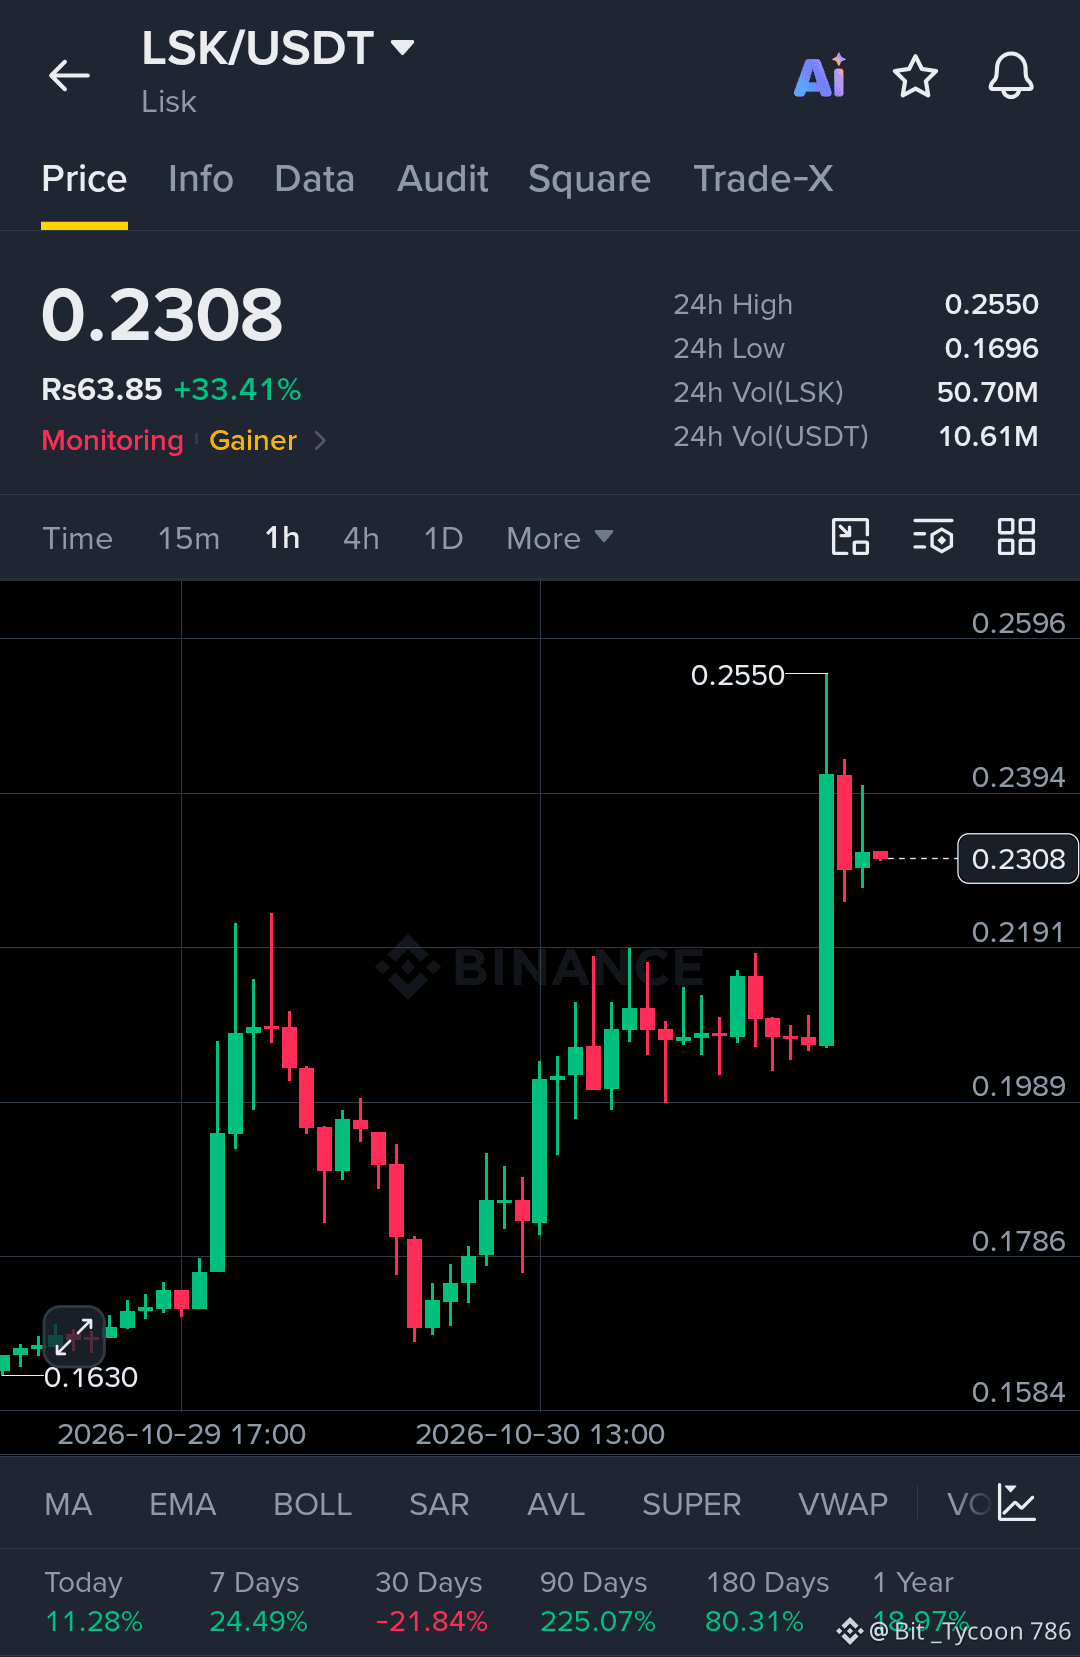
$LSK (Lisk) သည် အားကောင်းသော ပြန်လည်ဦးမော့မှုကို ပြသနေပြီး ဈေးနှုန်းသည် $0.2308 သို့ မြင့်တက်လာကာ လွန်ခဲ့သော 24 နာရီအတွင်း 33.41% တက်လာခဲ့သည်။ ယခုအတက်သည် ဈေးနှုန်းစုစည်းနေခဲ့သည့် ကာလတစ်ခုနောက်ပိုင်း ဖြစ်ပေါ်လာပြီး $0.1630 ဝန်းကျင်မှ တဖြည်းဖြည်း ပြန်လည်ဦးမော့လာခြင်းလည်း ဖြစ်သည်။
Lisk သည် Ethereum နှင့် ကိုက်ညီသော Layer 2 ဂေဟစနစ်မှတစ်ဆင့် blockchain နည်းပညာကို developer များ ပိုမိုလက်လှမ်းမီစေရန် အာရုံစိုက်လုပ်ဆောင်နေသည်။ ၎င်း၏ ပိုမိုကျယ်ပြန့်သော ဦးတည်ချက်မှာ အက်ပ်များကို ပံ့ပိုးပေးခြင်းနှင့် blockchain အသုံးပြုမှုကို တိုးချဲ့ခြင်းတို့အပေါ် အခြေခံထားသည်။
1 နာရီဇယားတွင် LSK သည် $0.199–$0.205 ဝန်းကျင်ရှိ ယခင်ဈေးနှုန်းစုစည်းမှုအကွာအဝေးကို ကျော်တက်သွားခဲ့သည်။ ဈေးနှုန်းသည် အရှိန်ပြင်းစွာ တက်ကာ $0.2550 သို့ ရောက်ရှိခဲ့ပြီးနောက် ပြန်လည်ကျဆင်းခဲ့သည်။ နောက်ဆုံးပေါ် candle များအရ $0.2300 ဝန်းကျင်တွင် အတန်ငယ် တည်ငြိမ်လာသည့် လက္ခဏာများ တွေ့ရသည်။
ပထမဆုံး စောင့်ကြည့်ရမည့် ပံ့ပိုးမှုဧရိယာမှာ $0.2190 ဝန်းကျင်ဖြစ်ပြီး၊ ထို့နောက် $0.1990 ဖြစ်သည်။ အတက်ဘက်တွင် $0.2390–$0.2550 သည် ချက်ချင်း ရင်ဆိုင်ရမည့် ခုခံမှုဇုန်ဖြစ်သည်။
24 နာရီအတွင်း အရောင်းအဝယ်ပမာဏသည် ခန့်မှန်းခြေ $10.61 သန်းအထိ ရောက်ရှိခဲ့ပြီး ဈေးကွက်တွင် ပါဝင်လှုပ်ရှားမှု မြင့်တက်လာကြောင်း ဖော်ပြနေသည်။ ယခု အဓိကမေးခွန်းမှာ LSK သည် ၎င်း၏ breakout ပုံစံကို ထိန်းထားနိုင်ပြီး ယခင်အရောင်းအဝယ်အကွာအဝေးအထက်တွင် ပံ့ပိုးမှုတစ်ခု တည်ဆောက်နိုင်မနိုင် ဖြစ်သည်။
{spot}(LSKUSDT)
#ASICHasReceivedNoPredictionMarketApplications #UniswapA16zSeekDeFiExemptionFromIllinoisCryptoTax #HKDollarStablecoinHKDAPToLaunchOnSolana #KOSPIFalls3.53%BackBelow6000
$LSK (Lisk) သည် အားကောင်းသော ပြန်လည်ဦးမော့မှုကို ပြသနေပြီး ဈေးနှုန်းသည် $0.2308 သို့ မြင့်တက်လာကာ လွန်ခဲ့သော 24 နာရီအတွင်း 33.41% တက်လာခဲ့သည်။ ယခုအတက်သည် ဈေးနှုန်းစုစည်းနေခဲ့သည့် ကာလတစ်ခုနောက်ပိုင်း ဖြစ်ပေါ်လာပြီး $0.1630 ဝန်းကျင်မှ တဖြည်းဖြည်း ပြန်လည်ဦးမော့လာခြင်းလည်း ဖြစ်သည်။
Lisk သည် Ethereum နှင့် ကိုက်ညီသော Layer 2 ဂေဟစနစ်မှတစ်ဆင့် blockchain နည်းပညာကို developer များ ပိုမိုလက်လှမ်းမီစေရန် အာရုံစိုက်လုပ်ဆောင်နေသည်။ ၎င်း၏ ပိုမိုကျယ်ပြန့်သော ဦးတည်ချက်မှာ အက်ပ်များကို ပံ့ပိုးပေးခြင်းနှင့် blockchain အသုံးပြုမှုကို တိုးချဲ့ခြင်းတို့အပေါ် အခြေခံထားသည်။
1 နာရီဇယားတွင် LSK သည် $0.199–$0.205 ဝန်းကျင်ရှိ ယခင်ဈေးနှုန်းစုစည်းမှုအကွာအဝေးကို ကျော်တက်သွားခဲ့သည်။ ဈေးနှုန်းသည် အရှိန်ပြင်းစွာ တက်ကာ $0.2550 သို့ ရောက်ရှိခဲ့ပြီးနောက် ပြန်လည်ကျဆင်းခဲ့သည်။ နောက်ဆုံးပေါ် candle များအရ $0.2300 ဝန်းကျင်တွင် အတန်ငယ် တည်ငြိမ်လာသည့် လက္ခဏာများ တွေ့ရသည်။
ပထမဆုံး စောင့်ကြည့်ရမည့် ပံ့ပိုးမှုဧရိယာမှာ $0.2190 ဝန်းကျင်ဖြစ်ပြီး၊ ထို့နောက် $0.1990 ဖြစ်သည်။ အတက်ဘက်တွင် $0.2390–$0.2550 သည် ချက်ချင်း ရင်ဆိုင်ရမည့် ခုခံမှုဇုန်ဖြစ်သည်။
24 နာရီအတွင်း အရောင်းအဝယ်ပမာဏသည် ခန့်မှန်းခြေ $10.61 သန်းအထိ ရောက်ရှိခဲ့ပြီး ဈေးကွက်တွင် ပါဝင်လှုပ်ရှားမှု မြင့်တက်လာကြောင်း ဖော်ပြနေသည်။ ယခု အဓိကမေးခွန်းမှာ LSK သည် ၎င်း၏ breakout ပုံစံကို ထိန်းထားနိုင်ပြီး ယခင်အရောင်းအဝယ်အကွာအဝေးအထက်တွင် ပံ့ပိုးမှုတစ်ခု တည်ဆောက်နိုင်မနိုင် ဖြစ်သည်။
#ASICHasReceivedNoPredictionMarketApplications #UniswapA16zSeekDeFiExemptionFromIllinoisCryptoTax #HKDollarStablecoinHKDAPToLaunchOnSolana #KOSPIFalls3.53%BackBelow6000
Lisk သည် Ethereum နှင့် ကိုက်ညီသော Layer 2 ဂေဟစနစ်မှတစ်ဆင့် blockchain နည်းပညာကို developer များ ပိုမိုလက်လှမ်းမီစေရန် အာရုံစိုက်လုပ်ဆောင်နေသည်။ ၎င်း၏ ပိုမိုကျယ်ပြန့်သော ဦးတည်ချက်မှာ အက်ပ်များကို ပံ့ပိုးပေးခြင်းနှင့် blockchain အသုံးပြုမှုကို တိုးချဲ့ခြင်းတို့အပေါ် အခြေခံထားသည်။
1 နာရီဇယားတွင် LSK သည် $0.199–$0.205 ဝန်းကျင်ရှိ ယခင်ဈေးနှုန်းစုစည်းမှုအကွာအဝေးကို ကျော်တက်သွားခဲ့သည်။ ဈေးနှုန်းသည် အရှိန်ပြင်းစွာ တက်ကာ $0.2550 သို့ ရောက်ရှိခဲ့ပြီးနောက် ပြန်လည်ကျဆင်းခဲ့သည်။ နောက်ဆုံးပေါ် candle များအရ $0.2300 ဝန်းကျင်တွင် အတန်ငယ် တည်ငြိမ်လာသည့် လက္ခဏာများ တွေ့ရသည်။
ပထမဆုံး စောင့်ကြည့်ရမည့် ပံ့ပိုးမှုဧရိယာမှာ $0.2190 ဝန်းကျင်ဖြစ်ပြီး၊ ထို့နောက် $0.1990 ဖြစ်သည်။ အတက်ဘက်တွင် $0.2390–$0.2550 သည် ချက်ချင်း ရင်ဆိုင်ရမည့် ခုခံမှုဇုန်ဖြစ်သည်။
24 နာရီအတွင်း အရောင်းအဝယ်ပမာဏသည် ခန့်မှန်းခြေ $10.61 သန်းအထိ ရောက်ရှိခဲ့ပြီး ဈေးကွက်တွင် ပါဝင်လှုပ်ရှားမှု မြင့်တက်လာကြောင်း ဖော်ပြနေသည်။ ယခု အဓိကမေးခွန်းမှာ LSK သည် ၎င်း၏ breakout ပုံစံကို ထိန်းထားနိုင်ပြီး ယခင်အရောင်းအဝယ်အကွာအဝေးအထက်တွင် ပံ့ပိုးမှုတစ်ခု တည်ဆောက်နိုင်မနိုင် ဖြစ်သည်။
#ASICHasReceivedNoPredictionMarketApplications #UniswapA16zSeekDeFiExemptionFromIllinoisCryptoTax #HKDollarStablecoinHKDAPToLaunchOnSolana #KOSPIFalls3.53%BackBelow6000
1
146
·
--
တက်ရိပ်ရှိသည်
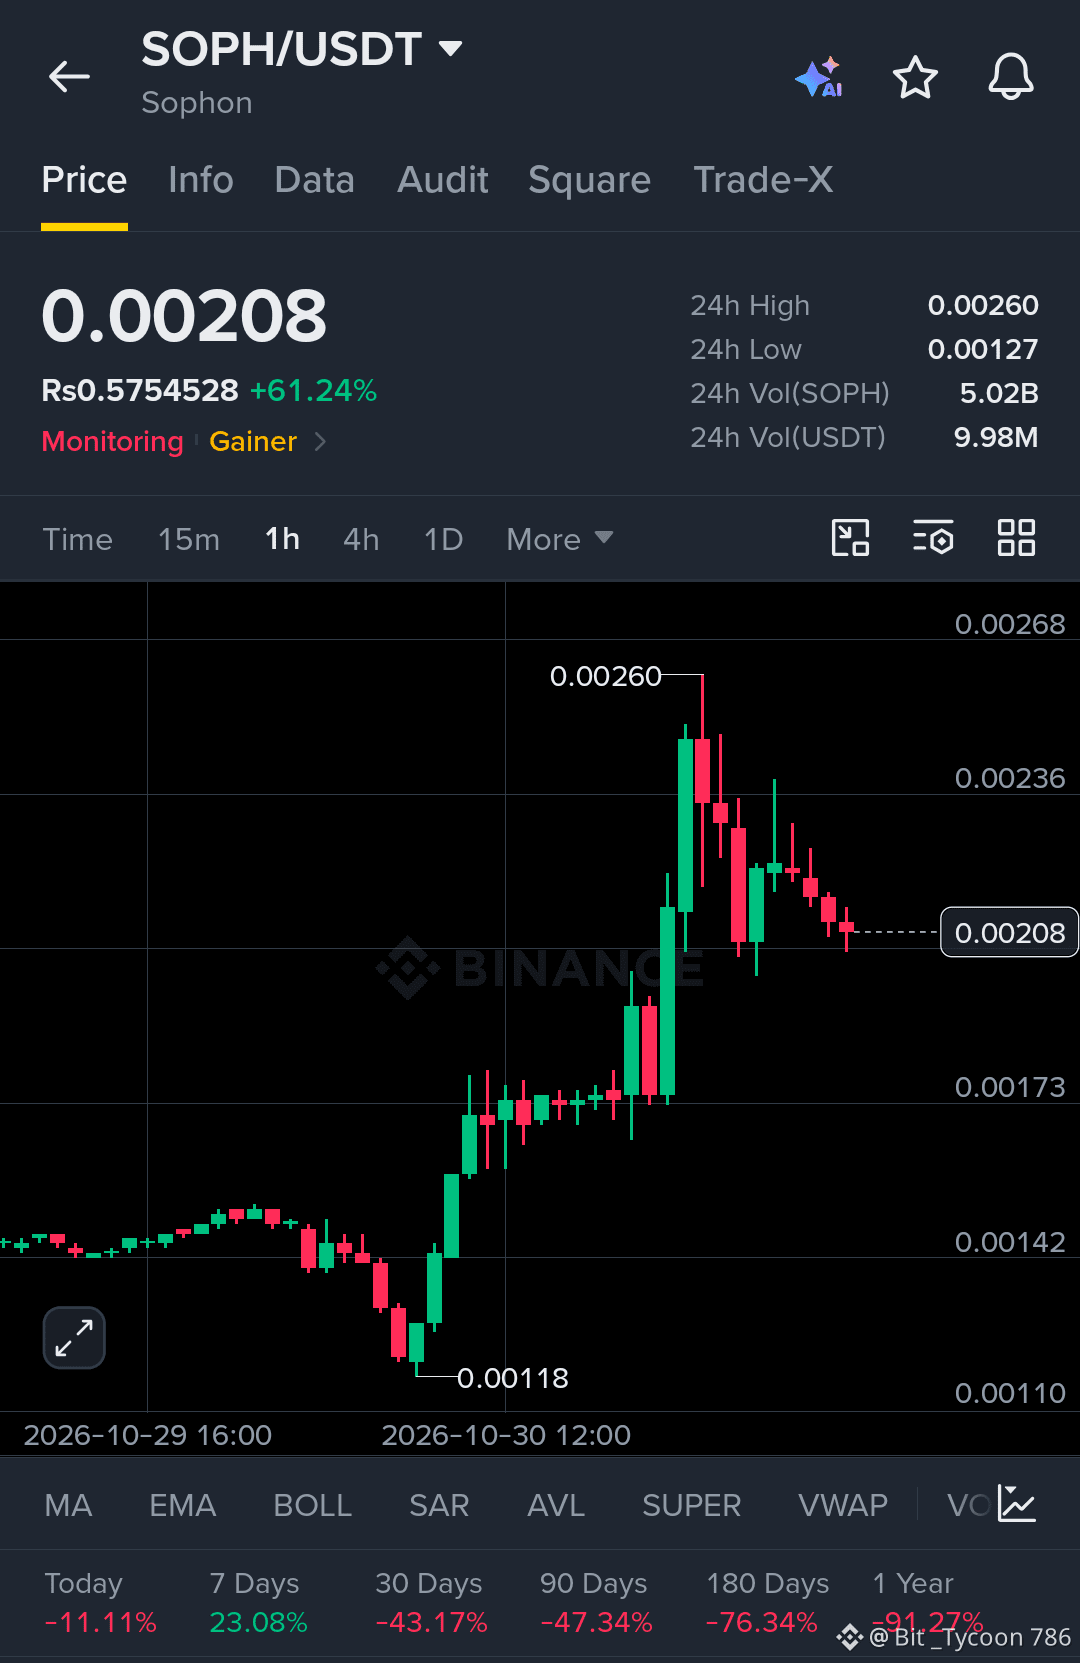
$SOPH သည် $0.00118 အနိမ့်ဆုံးဈေးမှ သိသိသာသာ မြင့်တက်ပြီးနောက် ရေတိုအတွင်း အားကောင်းသော အရှိန်အဟုန်ကို ပြသနေသည်။ တိုကင်၏ လက်ရှိဈေးနှုန်းမှာ $0.00208 ဝန်းကျင်ရှိပြီး၊ ပြီးခဲ့သည့် 24 နာရီအတွင်း 61.24% မြင့်တက်ခဲ့သည်။
Sophon ၏ ဈေးနှုန်းလှုပ်ရှားမှုကြောင့် ဈေးကွက်လှုပ်ရှားမှု ပိုမိုအားကောင်းလာခဲ့ပြီး၊ 24 နာရီအတွင်း အရောင်းအဝယ်ပမာဏသည် SOPH 5.02 ဘီလီယံခန့်အထိ ရောက်ရှိခဲ့ကာ USDT ပမာဏအားဖြင့် $9.98 သန်းနှင့် ညီမျှသည်။
1 နာရီဇယားတွင် ဈေးနှုန်းသည် $0.00260 အနီးသို့ မြင့်တက်ခဲ့သော်လည်း ရောင်းချမှုဖိအားနှင့် ရင်ဆိုင်ခဲ့ရသည်။ ထိုအချိန်မှစ၍ အနီရောင်ဖယောင်းတိုင်များ ဆက်တိုက်ပေါ်လာပြီး၊ လျင်မြန်စွာ မြင့်တက်ပြီးနောက် အရှိန်လျော့သည့်အဆင့်သို့ ရောက်ရှိနေကြောင်း ပြသနေသည်။
$0.00200 ဝန်းကျင်သည် ရေတိုအတွက် စောင့်ကြည့်ရမည့် အရေးကြီးသော အဆင့်ဖြစ်သည်။ ထိုအဆင့်အထက်တွင် ထိန်းထားနိုင်ပါက ဈေးနှုန်းတည်ငြိမ်လာစေရန် အထောက်အကူဖြစ်နိုင်ပြီး၊ $0.00173 သည်လည်း မှတ်သားဖွယ်ရာ အခြားထောက်ပံ့မှုဇုန်တစ်ခုဖြစ်သည်။ အတက်ဘက်တွင် ဇယားပေါ်၌ မြင်ရသော အဓိကခုခံမှုအဆင့်များမှာ $0.00236 နှင့် $0.00260 ဖြစ်သည်။
မကြာသေးမီက ဈေးတက်မှုကြောင့် ရေတိုဈေးကွက်ဖွဲ့စည်းပုံ ပြောင်းလဲသွားသော်လည်း ဈေးပြန်ကျမှုမှာ တည်ငြိမ်ရန် လိုအပ်နေဆဲဖြစ်သည်။ SOPH သည် ပြန်လည်နာလန်ထူမှုကို ဆက်လက်တိုးချဲ့နိုင်မနိုင် ဆုံးဖြတ်ရာတွင် အရောင်းအဝယ်ပမာဏ ဆက်လက်အားကောင်းနေခြင်းနှင့် ခုခံမှုအဆင့်ကို အောင်မြင်စွာ ပြန်လည်ကျော်ဖြတ်နိုင်ခြင်းတို့သည် အရေးကြီးမည်ဖြစ်သည်။
{spot}(SOPHUSDT)
#ASICHasReceivedNoPredictionMarketApplications #UniswapA16zSeekDeFiExemptionFromIllinoisCryptoTax #HKDollarStablecoinHKDAPToLaunchOnSolana #KOSPIFalls3.53%BackBelow6000
$SOPH သည် $0.00118 အနိမ့်ဆုံးဈေးမှ သိသိသာသာ မြင့်တက်ပြီးနောက် ရေတိုအတွင်း အားကောင်းသော အရှိန်အဟုန်ကို ပြသနေသည်။ တိုကင်၏ လက်ရှိဈေးနှုန်းမှာ $0.00208 ဝန်းကျင်ရှိပြီး၊ ပြီးခဲ့သည့် 24 နာရီအတွင်း 61.24% မြင့်တက်ခဲ့သည်။
Sophon ၏ ဈေးနှုန်းလှုပ်ရှားမှုကြောင့် ဈေးကွက်လှုပ်ရှားမှု ပိုမိုအားကောင်းလာခဲ့ပြီး၊ 24 နာရီအတွင်း အရောင်းအဝယ်ပမာဏသည် SOPH 5.02 ဘီလီယံခန့်အထိ ရောက်ရှိခဲ့ကာ USDT ပမာဏအားဖြင့် $9.98 သန်းနှင့် ညီမျှသည်။
1 နာရီဇယားတွင် ဈေးနှုန်းသည် $0.00260 အနီးသို့ မြင့်တက်ခဲ့သော်လည်း ရောင်းချမှုဖိအားနှင့် ရင်ဆိုင်ခဲ့ရသည်။ ထိုအချိန်မှစ၍ အနီရောင်ဖယောင်းတိုင်များ ဆက်တိုက်ပေါ်လာပြီး၊ လျင်မြန်စွာ မြင့်တက်ပြီးနောက် အရှိန်လျော့သည့်အဆင့်သို့ ရောက်ရှိနေကြောင်း ပြသနေသည်။
$0.00200 ဝန်းကျင်သည် ရေတိုအတွက် စောင့်ကြည့်ရမည့် အရေးကြီးသော အဆင့်ဖြစ်သည်။ ထိုအဆင့်အထက်တွင် ထိန်းထားနိုင်ပါက ဈေးနှုန်းတည်ငြိမ်လာစေရန် အထောက်အကူဖြစ်နိုင်ပြီး၊ $0.00173 သည်လည်း မှတ်သားဖွယ်ရာ အခြားထောက်ပံ့မှုဇုန်တစ်ခုဖြစ်သည်။ အတက်ဘက်တွင် ဇယားပေါ်၌ မြင်ရသော အဓိကခုခံမှုအဆင့်များမှာ $0.00236 နှင့် $0.00260 ဖြစ်သည်။
မကြာသေးမီက ဈေးတက်မှုကြောင့် ရေတိုဈေးကွက်ဖွဲ့စည်းပုံ ပြောင်းလဲသွားသော်လည်း ဈေးပြန်ကျမှုမှာ တည်ငြိမ်ရန် လိုအပ်နေဆဲဖြစ်သည်။ SOPH သည် ပြန်လည်နာလန်ထူမှုကို ဆက်လက်တိုးချဲ့နိုင်မနိုင် ဆုံးဖြတ်ရာတွင် အရောင်းအဝယ်ပမာဏ ဆက်လက်အားကောင်းနေခြင်းနှင့် ခုခံမှုအဆင့်ကို အောင်မြင်စွာ ပြန်လည်ကျော်ဖြတ်နိုင်ခြင်းတို့သည် အရေးကြီးမည်ဖြစ်သည်။
#ASICHasReceivedNoPredictionMarketApplications #UniswapA16zSeekDeFiExemptionFromIllinoisCryptoTax #HKDollarStablecoinHKDAPToLaunchOnSolana #KOSPIFalls3.53%BackBelow6000
Sophon ၏ ဈေးနှုန်းလှုပ်ရှားမှုကြောင့် ဈေးကွက်လှုပ်ရှားမှု ပိုမိုအားကောင်းလာခဲ့ပြီး၊ 24 နာရီအတွင်း အရောင်းအဝယ်ပမာဏသည် SOPH 5.02 ဘီလီယံခန့်အထိ ရောက်ရှိခဲ့ကာ USDT ပမာဏအားဖြင့် $9.98 သန်းနှင့် ညီမျှသည်။
1 နာရီဇယားတွင် ဈေးနှုန်းသည် $0.00260 အနီးသို့ မြင့်တက်ခဲ့သော်လည်း ရောင်းချမှုဖိအားနှင့် ရင်ဆိုင်ခဲ့ရသည်။ ထိုအချိန်မှစ၍ အနီရောင်ဖယောင်းတိုင်များ ဆက်တိုက်ပေါ်လာပြီး၊ လျင်မြန်စွာ မြင့်တက်ပြီးနောက် အရှိန်လျော့သည့်အဆင့်သို့ ရောက်ရှိနေကြောင်း ပြသနေသည်။
$0.00200 ဝန်းကျင်သည် ရေတိုအတွက် စောင့်ကြည့်ရမည့် အရေးကြီးသော အဆင့်ဖြစ်သည်။ ထိုအဆင့်အထက်တွင် ထိန်းထားနိုင်ပါက ဈေးနှုန်းတည်ငြိမ်လာစေရန် အထောက်အကူဖြစ်နိုင်ပြီး၊ $0.00173 သည်လည်း မှတ်သားဖွယ်ရာ အခြားထောက်ပံ့မှုဇုန်တစ်ခုဖြစ်သည်။ အတက်ဘက်တွင် ဇယားပေါ်၌ မြင်ရသော အဓိကခုခံမှုအဆင့်များမှာ $0.00236 နှင့် $0.00260 ဖြစ်သည်။
မကြာသေးမီက ဈေးတက်မှုကြောင့် ရေတိုဈေးကွက်ဖွဲ့စည်းပုံ ပြောင်းလဲသွားသော်လည်း ဈေးပြန်ကျမှုမှာ တည်ငြိမ်ရန် လိုအပ်နေဆဲဖြစ်သည်။ SOPH သည် ပြန်လည်နာလန်ထူမှုကို ဆက်လက်တိုးချဲ့နိုင်မနိုင် ဆုံးဖြတ်ရာတွင် အရောင်းအဝယ်ပမာဏ ဆက်လက်အားကောင်းနေခြင်းနှင့် ခုခံမှုအဆင့်ကို အောင်မြင်စွာ ပြန်လည်ကျော်ဖြတ်နိုင်ခြင်းတို့သည် အရေးကြီးမည်ဖြစ်သည်။
#ASICHasReceivedNoPredictionMarketApplications #UniswapA16zSeekDeFiExemptionFromIllinoisCryptoTax #HKDollarStablecoinHKDAPToLaunchOnSolana #KOSPIFalls3.53%BackBelow6000
1
116
·
--
တက်ရိပ်ရှိသည်
ဘာသာပြန်ဆိုချက် ကြည့်မည်
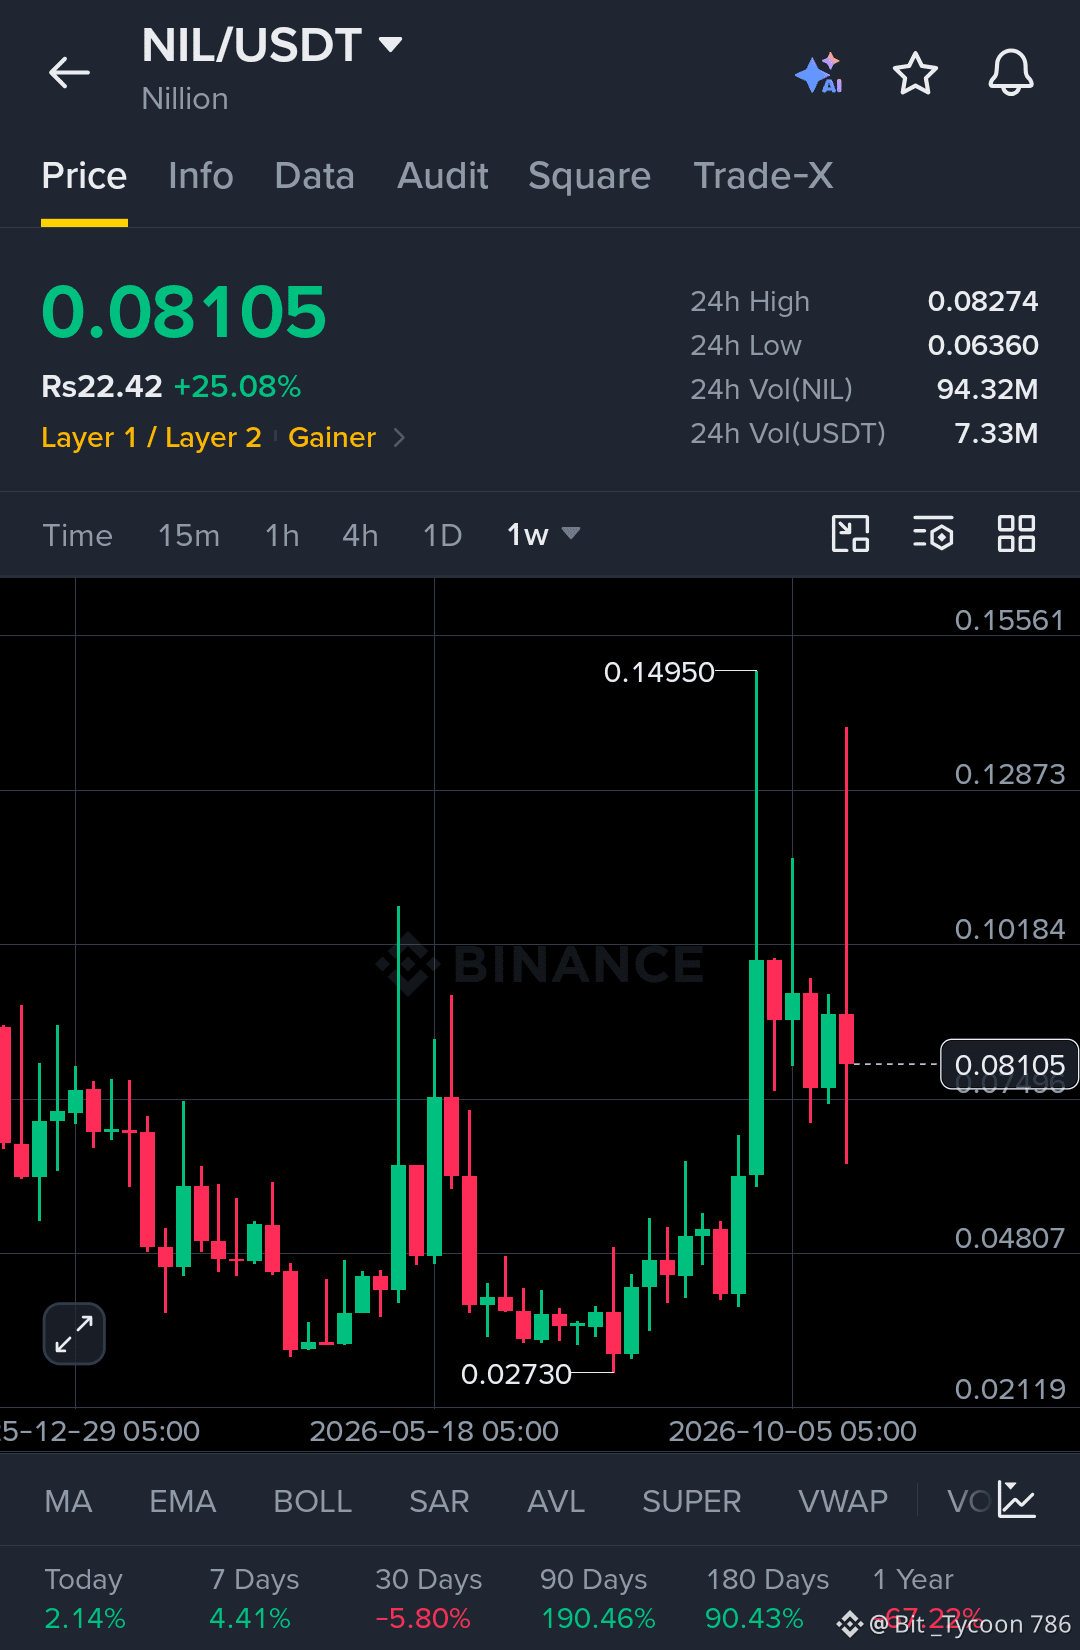
$NIL (Nillion) is showing a notable recovery on the weekly chart, with price currently trading around $0.08105, up 25.08% over the past 24 hours.
Nillion focuses on privacy-preserving computation, allowing data to be processed without exposing the underlying information. Its core proposition is built around secure data infrastructure and privacy-focused applications.
From a technical perspective, NIL has recovered significantly from its previous low near $0.02730. The move toward $0.14950 marked a strong expansion, although price has since pulled back and entered a consolidation phase.
The $0.075–$0.080 region is an important area to monitor. Holding above it could help maintain the current recovery structure. On the upside, $0.090–$0.102 represents the next resistance zone, followed by the previous high near $0.14950.
NIL has gained considerable momentum, but the weekly chart still requires confirmation. Sustained buying activity and a successful resistance reclaim will be important in determining whether this recovery can develop into a broader trend.
{spot}(NILUSDT)
#ASICHasReceivedNoPredictionMarketApplications #UniswapA16zSeekDeFiExemptionFromIllinoisCryptoTax #HKDollarStablecoinHKDAPToLaunchOnSolana #KOSPIFalls3.53%BackBelow6000
$NIL (Nillion) is showing a notable recovery on the weekly chart, with price currently trading around $0.08105, up 25.08% over the past 24 hours.
Nillion focuses on privacy-preserving computation, allowing data to be processed without exposing the underlying information. Its core proposition is built around secure data infrastructure and privacy-focused applications.
From a technical perspective, NIL has recovered significantly from its previous low near $0.02730. The move toward $0.14950 marked a strong expansion, although price has since pulled back and entered a consolidation phase.
The $0.075–$0.080 region is an important area to monitor. Holding above it could help maintain the current recovery structure. On the upside, $0.090–$0.102 represents the next resistance zone, followed by the previous high near $0.14950.
NIL has gained considerable momentum, but the weekly chart still requires confirmation. Sustained buying activity and a successful resistance reclaim will be important in determining whether this recovery can develop into a broader trend.
#ASICHasReceivedNoPredictionMarketApplications #UniswapA16zSeekDeFiExemptionFromIllinoisCryptoTax #HKDollarStablecoinHKDAPToLaunchOnSolana #KOSPIFalls3.53%BackBelow6000
Nillion focuses on privacy-preserving computation, allowing data to be processed without exposing the underlying information. Its core proposition is built around secure data infrastructure and privacy-focused applications.
From a technical perspective, NIL has recovered significantly from its previous low near $0.02730. The move toward $0.14950 marked a strong expansion, although price has since pulled back and entered a consolidation phase.
The $0.075–$0.080 region is an important area to monitor. Holding above it could help maintain the current recovery structure. On the upside, $0.090–$0.102 represents the next resistance zone, followed by the previous high near $0.14950.
NIL has gained considerable momentum, but the weekly chart still requires confirmation. Sustained buying activity and a successful resistance reclaim will be important in determining whether this recovery can develop into a broader trend.
#ASICHasReceivedNoPredictionMarketApplications #UniswapA16zSeekDeFiExemptionFromIllinoisCryptoTax #HKDollarStablecoinHKDAPToLaunchOnSolana #KOSPIFalls3.53%BackBelow6000
2
137
·
--
တက်ရိပ်ရှိသည်
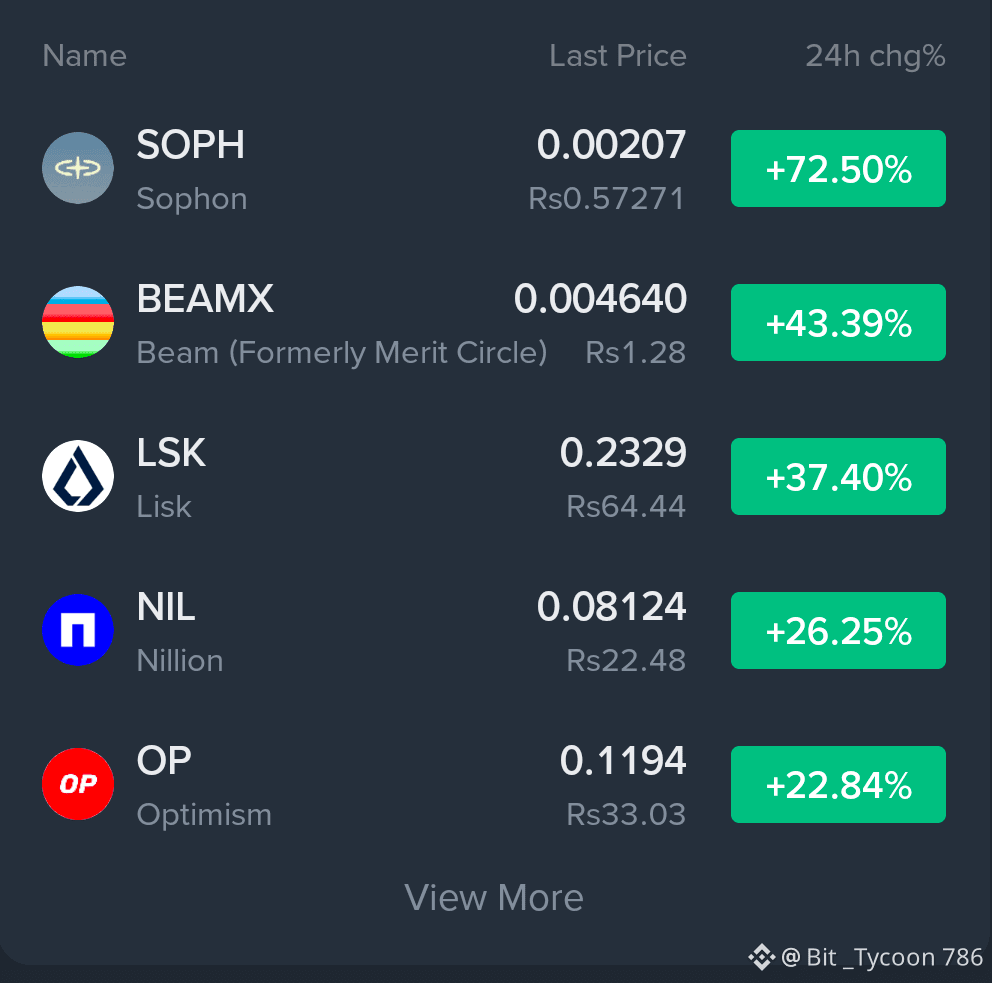
🚨ယနေ့ အတက်အများဆုံး ခရစ်ပတိုငွေကြေး ၅ မျိုး!
စျေးကွက်က ပိုမိုလှုပ်ရှားလာပြီး ဒီဒစ်ဂျစ်တယ်ငွေကြေးတွေက အတက်အများဆုံးဖြစ်နေပါတယ်!
1. $SOPH — +72.50%
2. $BEAMX — +43.39%
3. $LSK — +37.40%
4. $NIL — +26.25%
5. $OP — +22.84%
စျေးနှုန်းတွေ အားကောင်းစွာတက်နေပြီး အရှိန်အဟုန်ကလည်း အထင်ကြီးစရာပါ။ စျေးကွက်မှာ လှုပ်ရှားမှုတွေ အများကြီးရှိနေပါတယ်။
အတက်အများဆုံးနေ့လေး ပျော်ရွှင်ပါစေ! ဒီဒစ်ဂျစ်တယ်ငွေကြေးတွေကို ဘယ်သူတွေ စောင့်ကြည့်နေကြလဲ?
#AmazonSharesFallAbout7%InPremarketTrading
🚨ယနေ့ အတက်အများဆုံး ခရစ်ပတိုငွေကြေး ၅ မျိုး!
စျေးကွက်က ပိုမိုလှုပ်ရှားလာပြီး ဒီဒစ်ဂျစ်တယ်ငွေကြေးတွေက အတက်အများဆုံးဖြစ်နေပါတယ်!
1. $SOPH — +72.50%
2. $BEAMX — +43.39%
3. $LSK — +37.40%
4. $NIL — +26.25%
5. $OP — +22.84%
စျေးနှုန်းတွေ အားကောင်းစွာတက်နေပြီး အရှိန်အဟုန်ကလည်း အထင်ကြီးစရာပါ။ စျေးကွက်မှာ လှုပ်ရှားမှုတွေ အများကြီးရှိနေပါတယ်။
အတက်အများဆုံးနေ့လေး ပျော်ရွှင်ပါစေ! ဒီဒစ်ဂျစ်တယ်ငွေကြေးတွေကို ဘယ်သူတွေ စောင့်ကြည့်နေကြလဲ?
#AmazonSharesFallAbout7%InPremarketTrading
စျေးကွက်က ပိုမိုလှုပ်ရှားလာပြီး ဒီဒစ်ဂျစ်တယ်ငွေကြေးတွေက အတက်အများဆုံးဖြစ်နေပါတယ်!
1. $SOPH — +72.50%
2. $BEAMX — +43.39%
3. $LSK — +37.40%
4. $NIL — +26.25%
5. $OP — +22.84%
စျေးနှုန်းတွေ အားကောင်းစွာတက်နေပြီး အရှိန်အဟုန်ကလည်း အထင်ကြီးစရာပါ။ စျေးကွက်မှာ လှုပ်ရှားမှုတွေ အများကြီးရှိနေပါတယ်။
အတက်အများဆုံးနေ့လေး ပျော်ရွှင်ပါစေ! ဒီဒစ်ဂျစ်တယ်ငွေကြေးတွေကို ဘယ်သူတွေ စောင့်ကြည့်နေကြလဲ?
#AmazonSharesFallAbout7%InPremarketTrading
1
270
ဘာသာပြန်ဆိုချက် ကြည့်မည်
🚨 THE CRYPTO MARKET JUST FACED A MASSIVE SHOCK!
Billions of dollars in reported outflows, a sudden Bitcoin crash, and huge liquidations have put the entire market on edge.
Around $5.6 BILLION reportedly flowed out of Binance-labelled wallets. At the same time, Bitcoin dropped below $77,000, nearly $800 MILLION in long positions were liquidated, and roughly $80 BILLION in total crypto market value disappeared in just 15 minutes.
But that wasn't the end of the story.
Tether and Circle reportedly froze $2.316 BILLION in stablecoins linked to the incident. CZ has said that user funds remain SAFU, while Binance continues investigating what happened.
Now Bitcoin is showing some signs of recovery, but the market is still extremely sensitive. One sudden move could trigger another wave of volatility.
This is the moment when emotions can become your biggest enemy.
Don't rush into trades. Don't follow panic. Watch Bitcoin's price action, manage your risk, and protect your capital.
Stay calm. Follow the facts. Let the market show its next move.
Remember, the reported figures are still subject to investigation. Trade carefully and never risk more than you can afford to lose.
@CZ #BTC #Binance #CryptoNews
#FedWatch
🚨 THE CRYPTO MARKET JUST FACED A MASSIVE SHOCK!
Billions of dollars in reported outflows, a sudden Bitcoin crash, and huge liquidations have put the entire market on edge.
Around $5.6 BILLION reportedly flowed out of Binance-labelled wallets. At the same time, Bitcoin dropped below $77,000, nearly $800 MILLION in long positions were liquidated, and roughly $80 BILLION in total crypto market value disappeared in just 15 minutes.
But that wasn't the end of the story.
Tether and Circle reportedly froze $2.316 BILLION in stablecoins linked to the incident. CZ has said that user funds remain SAFU, while Binance continues investigating what happened.
Now Bitcoin is showing some signs of recovery, but the market is still extremely sensitive. One sudden move could trigger another wave of volatility.
This is the moment when emotions can become your biggest enemy.
Don't rush into trades. Don't follow panic. Watch Bitcoin's price action, manage your risk, and protect your capital.
Stay calm. Follow the facts. Let the market show its next move.
Remember, the reported figures are still subject to investigation. Trade carefully and never risk more than you can afford to lose.
@CZ #BTC #Binance #CryptoNews
#FedWatch
Billions of dollars in reported outflows, a sudden Bitcoin crash, and huge liquidations have put the entire market on edge.
Around $5.6 BILLION reportedly flowed out of Binance-labelled wallets. At the same time, Bitcoin dropped below $77,000, nearly $800 MILLION in long positions were liquidated, and roughly $80 BILLION in total crypto market value disappeared in just 15 minutes.
But that wasn't the end of the story.
Tether and Circle reportedly froze $2.316 BILLION in stablecoins linked to the incident. CZ has said that user funds remain SAFU, while Binance continues investigating what happened.
Now Bitcoin is showing some signs of recovery, but the market is still extremely sensitive. One sudden move could trigger another wave of volatility.
This is the moment when emotions can become your biggest enemy.
Don't rush into trades. Don't follow panic. Watch Bitcoin's price action, manage your risk, and protect your capital.
Stay calm. Follow the facts. Let the market show its next move.
Remember, the reported figures are still subject to investigation. Trade carefully and never risk more than you can afford to lose.
@CZ #BTC #Binance #CryptoNews
#FedWatch


3
182
·
--
ကျရိပ်ရှိသည်
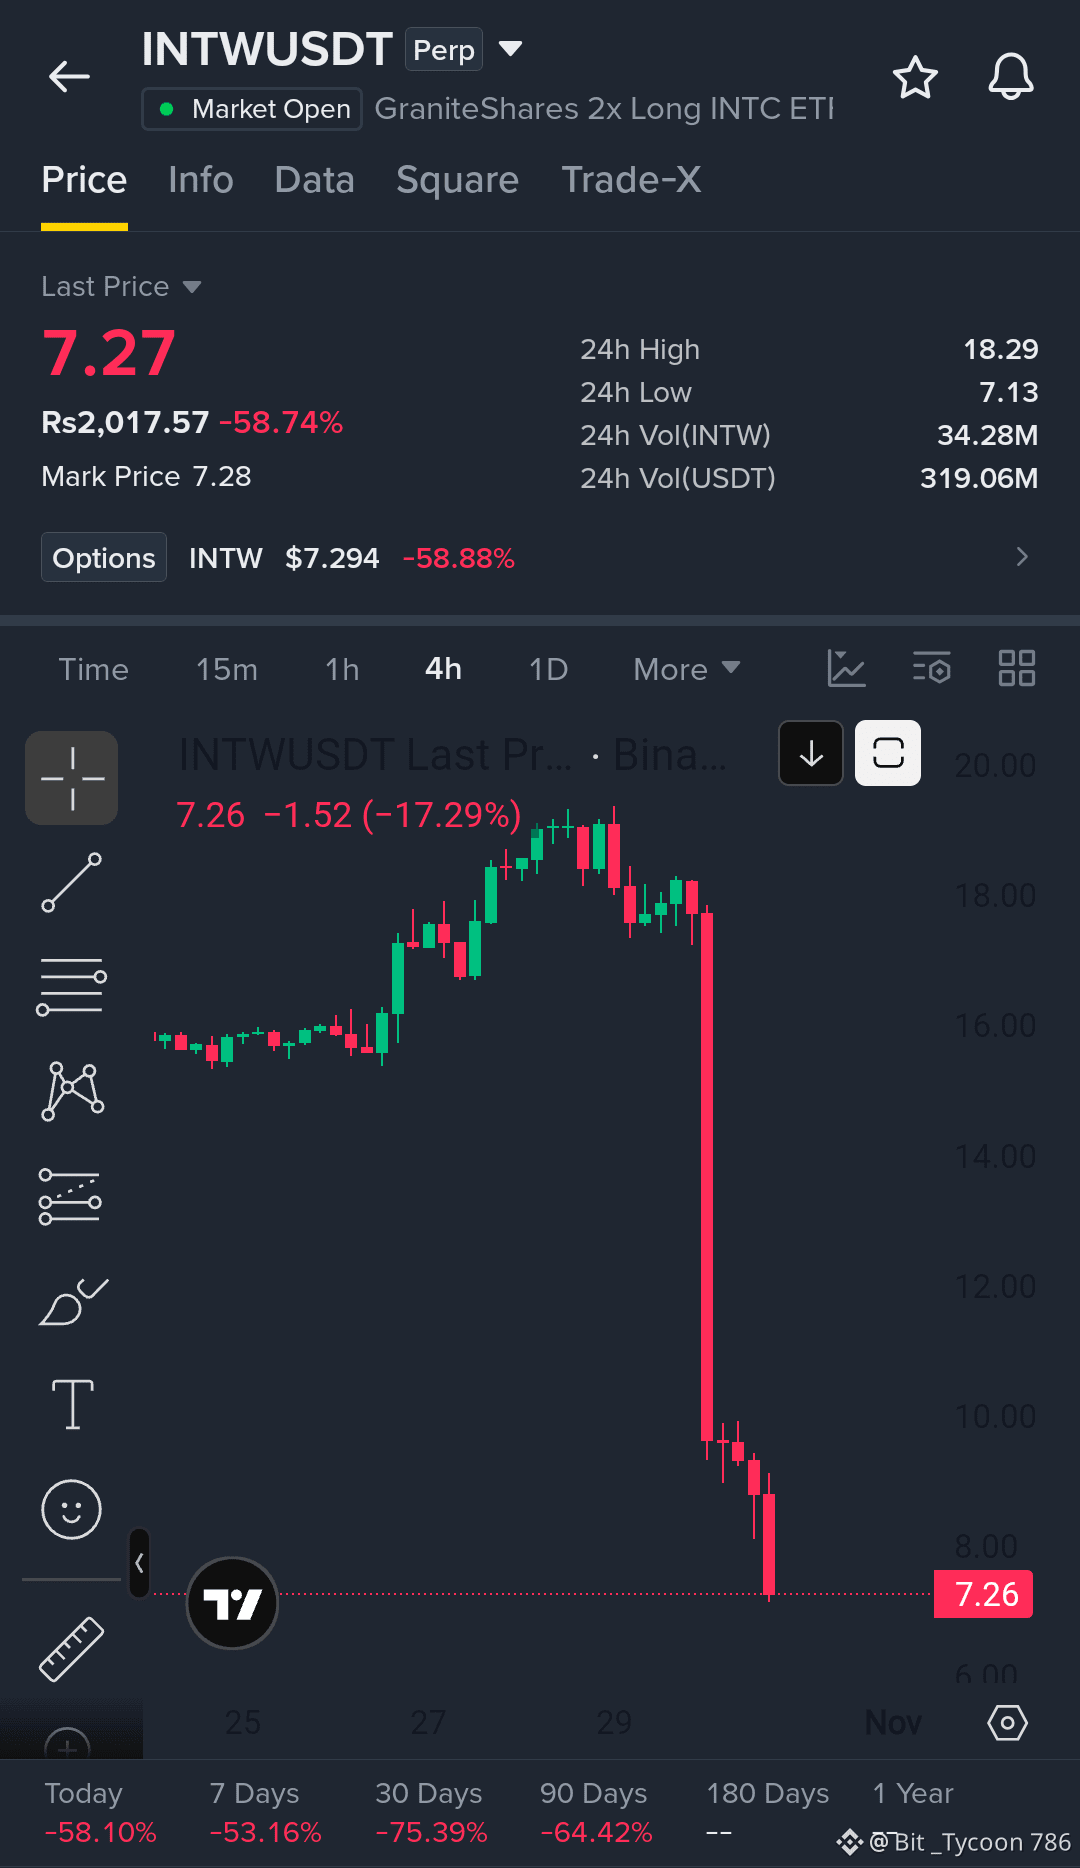
$INTW သည် $18–$19 အပိုင်းအခြားမှ ပြင်းထန်စွာ ကျဆင်းသွားပြီးနောက် အလွန်ပြင်းထန်သော ရောင်းအားဖိအားနှင့် ရင်ဆိုင်နေရသည်။ လက်ရှိတွင် ဈေးနှုန်းသည် $7.27 ဝန်းကျင်၌ အရောင်းအဝယ်ဖြစ်နေပြီး 24 နာရီအတွင်း 58.74% ကျဆင်းခဲ့သည်။
4 နာရီဇယားတွင် အားကောင်းသော ကျဆင်းလှုပ်ရှားမှုကို တွေ့ရပြီး အချိန်တိုအတွင်း ဈေးနှုန်းသည် ပံ့ပိုးမှုအဆင့်များစွာကို ဆုံးရှုံးခဲ့သည်။ ရောင်းအားဖိအားက ဆက်လက်လွှမ်းမိုးနေပြီး နောက်ဆုံးဖယောင်းတိုင်များတွင် ရေရှည်တည်တံ့မည့် ပြန်လည်နာလန်ထူမှုရှိကြောင်း ပြသသည့် လက္ခဏာအနည်းငယ်သာ တွေ့ရသည်။
$7.13 ဝန်းကျင်သည် ချက်ချင်းစောင့်ကြည့်ရမည့် ပံ့ပိုးမှုအဆင့်ဖြစ်သည်။ ဤအဆင့်အောက်သို့ ကျဆင်းပါက နောက်ထပ်ဈေးကျနိုင်ခြေ ပေါ်လာနိုင်သည်။ ပြန်လည်နာလန်ထူမှုဘက်တွင် $8.00–$10.00 သည် ဝယ်သူများ ထိန်းချုပ်မှုကို ပြန်လည်ရယူရန် လိုအပ်မည့် အရေးကြီးသော ဈေးနှုန်းဇုန်ဖြစ်သည်။
24 နာရီအတွင်း အရောင်းအဝယ်ပမာဏသည် $319 million ဝန်းကျင်ရှိပြီး ယခုလို ဈေးနှုန်းပြင်းထန်စွာ ကျဆင်းနေစဉ် ဈေးကွက်လှုပ်ရှားမှု မြင့်တက်နေသည်။ လက်ရှိအချိန်တွင် INTW သည် နည်းပညာပိုင်းအရ အားနည်းနေဆဲဖြစ်ပြီး အတက်ဘက်အရှိန်အဟုန်ကို အတည်ပြုနိုင်ရန် ပိုမိုခိုင်မာသော ပြန်လည်နာလန်ထူမှုပုံစံ လိုအပ်သည်။
{future}(INTWUSDT)
#KOSPIFalls3.53%BackBelow6000 #AmazonSharesFallAbout7%InPremarketTrading #USMidtermElections #BinanceWillListPredictPREDICT #TwoAddressesHoldingAbout1.28BUSDTFrozen
$INTW သည် $18–$19 အပိုင်းအခြားမှ ပြင်းထန်စွာ ကျဆင်းသွားပြီးနောက် အလွန်ပြင်းထန်သော ရောင်းအားဖိအားနှင့် ရင်ဆိုင်နေရသည်။ လက်ရှိတွင် ဈေးနှုန်းသည် $7.27 ဝန်းကျင်၌ အရောင်းအဝယ်ဖြစ်နေပြီး 24 နာရီအတွင်း 58.74% ကျဆင်းခဲ့သည်။
4 နာရီဇယားတွင် အားကောင်းသော ကျဆင်းလှုပ်ရှားမှုကို တွေ့ရပြီး အချိန်တိုအတွင်း ဈေးနှုန်းသည် ပံ့ပိုးမှုအဆင့်များစွာကို ဆုံးရှုံးခဲ့သည်။ ရောင်းအားဖိအားက ဆက်လက်လွှမ်းမိုးနေပြီး နောက်ဆုံးဖယောင်းတိုင်များတွင် ရေရှည်တည်တံ့မည့် ပြန်လည်နာလန်ထူမှုရှိကြောင်း ပြသသည့် လက္ခဏာအနည်းငယ်သာ တွေ့ရသည်။
$7.13 ဝန်းကျင်သည် ချက်ချင်းစောင့်ကြည့်ရမည့် ပံ့ပိုးမှုအဆင့်ဖြစ်သည်။ ဤအဆင့်အောက်သို့ ကျဆင်းပါက နောက်ထပ်ဈေးကျနိုင်ခြေ ပေါ်လာနိုင်သည်။ ပြန်လည်နာလန်ထူမှုဘက်တွင် $8.00–$10.00 သည် ဝယ်သူများ ထိန်းချုပ်မှုကို ပြန်လည်ရယူရန် လိုအပ်မည့် အရေးကြီးသော ဈေးနှုန်းဇုန်ဖြစ်သည်။
24 နာရီအတွင်း အရောင်းအဝယ်ပမာဏသည် $319 million ဝန်းကျင်ရှိပြီး ယခုလို ဈေးနှုန်းပြင်းထန်စွာ ကျဆင်းနေစဉ် ဈေးကွက်လှုပ်ရှားမှု မြင့်တက်နေသည်။ လက်ရှိအချိန်တွင် INTW သည် နည်းပညာပိုင်းအရ အားနည်းနေဆဲဖြစ်ပြီး အတက်ဘက်အရှိန်အဟုန်ကို အတည်ပြုနိုင်ရန် ပိုမိုခိုင်မာသော ပြန်လည်နာလန်ထူမှုပုံစံ လိုအပ်သည်။
#KOSPIFalls3.53%BackBelow6000 #AmazonSharesFallAbout7%InPremarketTrading #USMidtermElections #BinanceWillListPredictPREDICT #TwoAddressesHoldingAbout1.28BUSDTFrozen
4 နာရီဇယားတွင် အားကောင်းသော ကျဆင်းလှုပ်ရှားမှုကို တွေ့ရပြီး အချိန်တိုအတွင်း ဈေးနှုန်းသည် ပံ့ပိုးမှုအဆင့်များစွာကို ဆုံးရှုံးခဲ့သည်။ ရောင်းအားဖိအားက ဆက်လက်လွှမ်းမိုးနေပြီး နောက်ဆုံးဖယောင်းတိုင်များတွင် ရေရှည်တည်တံ့မည့် ပြန်လည်နာလန်ထူမှုရှိကြောင်း ပြသသည့် လက္ခဏာအနည်းငယ်သာ တွေ့ရသည်။
$7.13 ဝန်းကျင်သည် ချက်ချင်းစောင့်ကြည့်ရမည့် ပံ့ပိုးမှုအဆင့်ဖြစ်သည်။ ဤအဆင့်အောက်သို့ ကျဆင်းပါက နောက်ထပ်ဈေးကျနိုင်ခြေ ပေါ်လာနိုင်သည်။ ပြန်လည်နာလန်ထူမှုဘက်တွင် $8.00–$10.00 သည် ဝယ်သူများ ထိန်းချုပ်မှုကို ပြန်လည်ရယူရန် လိုအပ်မည့် အရေးကြီးသော ဈေးနှုန်းဇုန်ဖြစ်သည်။
24 နာရီအတွင်း အရောင်းအဝယ်ပမာဏသည် $319 million ဝန်းကျင်ရှိပြီး ယခုလို ဈေးနှုန်းပြင်းထန်စွာ ကျဆင်းနေစဉ် ဈေးကွက်လှုပ်ရှားမှု မြင့်တက်နေသည်။ လက်ရှိအချိန်တွင် INTW သည် နည်းပညာပိုင်းအရ အားနည်းနေဆဲဖြစ်ပြီး အတက်ဘက်အရှိန်အဟုန်ကို အတည်ပြုနိုင်ရန် ပိုမိုခိုင်မာသော ပြန်လည်နာလန်ထူမှုပုံစံ လိုအပ်သည်။
#KOSPIFalls3.53%BackBelow6000 #AmazonSharesFallAbout7%InPremarketTrading #USMidtermElections #BinanceWillListPredictPREDICT #TwoAddressesHoldingAbout1.28BUSDTFrozen
2
226
·
--
ကျရိပ်ရှိသည်
$BNB သည် BNB Chain ဂေဟစနစ်အတွင်း အဓိကကျသော အရင်းအမြစ်တစ်ခုအဖြစ် ဆက်လက်တည်ရှိနေပြီး ကွန်ရက်လှုပ်ရှားမှုများ၊ ငွေလွှဲခများ၊ staking နှင့် ဗဟိုချုပ်ကိုင်မှုမရှိသော အက်ပ်လီကေးရှင်းအမျိုးမျိုးကို ပံ့ပိုးပေးနေသည်။
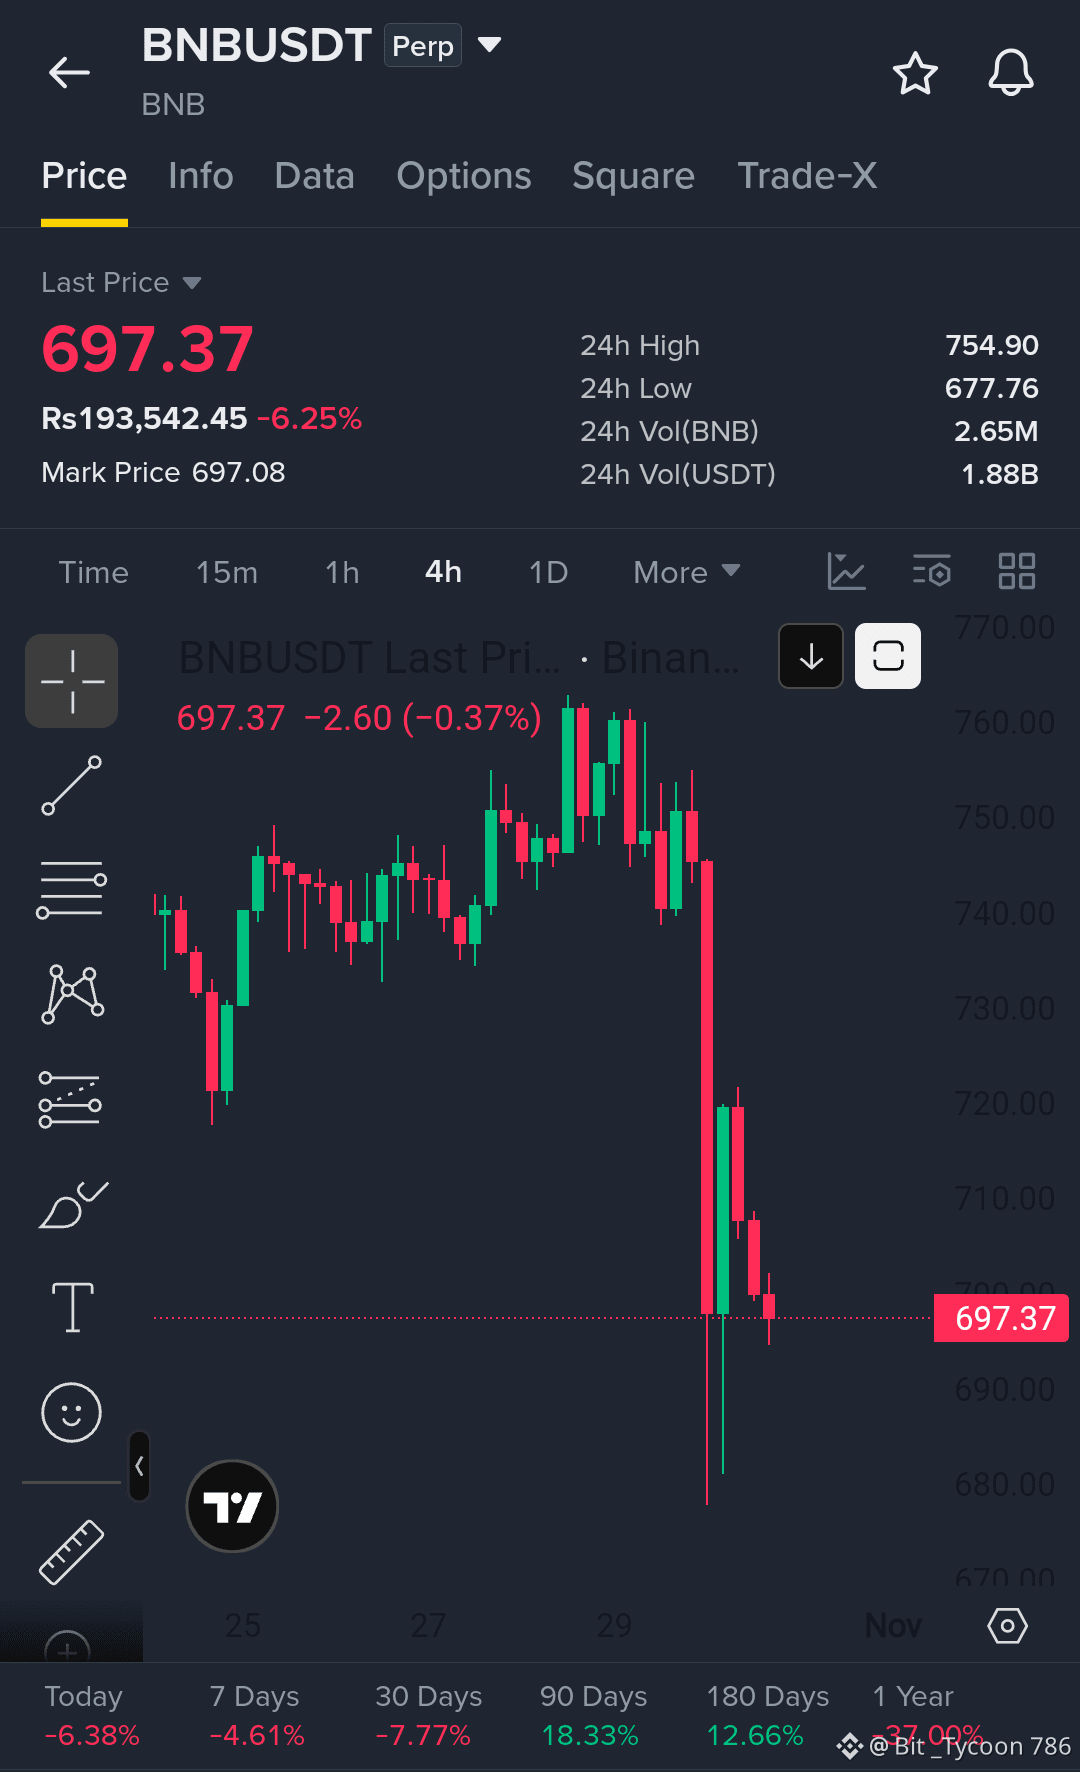
စျေးကွက်အခြေအနေအရ BNB သည် သိသာထင်ရှားသော ရောင်းအားဖိအားနှင့် ရင်ဆိုင်နေရသည်။ လက်ရှိစျေးနှုန်းမှာ $697.37 ဝန်းကျင်ဖြစ်ပြီး ၂၄ နာရီအတွင်း 6.25% ကျဆင်းခဲ့သည်။ ၄ နာရီဇယားတွင် $750–$760 ဝန်းကျင်မှ ပြင်းထန်စွာ ငြင်းပယ်ခံရပြီးနောက် $678 အထိ သိသိသာသာ ကျဆင်းကာ ယာယီပြန်လည်တက်လာခဲ့သည်ကို တွေ့ရသည်။
ဝယ်ယူသူများသည် အောက်ခြေစျေးနှုန်းအဆင့်များကို ကာကွယ်ရန် ကြိုးပမ်းခဲ့သော်လည်း စျေးနှုန်းသည် $700 အဆင့်ကို ပြန်လည်ရောက်ရှိရန် ရုန်းကန်နေရသည်။ $720–$730 အပိုင်းအခြားသည် အရေးကြီးသော ပြန်လည်နာလန်ထူရေးဇုန်ဖြစ်ပြီး၊ $678 သည် စောင့်ကြည့်ရမည့် အဓိကပံ့ပိုးမှုအဆင့်အဖြစ် ဆက်လက်တည်ရှိနေသည်။
လက်ရှိတွင် စျေးကွက်ဖွဲ့စည်းပုံသည် ဖိအားအောက်တွင် ရှိနေဆဲဖြစ်သည်။ အနီးအနားရှိ ခုခံမှုအဆင့်များကို ကျော်လွန်၍ ဆက်တိုက်ပြန်လည်နာလန်ထူနိုင်ပါက ကာလတိုအလားအလာ ပိုမိုကောင်းမွန်လာမည်ဖြစ်ပြီး၊ ထပ်မံကျဆင်းပါက အောက်ဘက်သို့ ဆက်လက်ကျဆင်းနိုင်သည်။
BNB ၏ ပိုမိုကျယ်ပြန့်သော ဂေဟစနစ်လှုပ်ရှားမှုနှင့် ကာလတိုစျေးကွက်စွမ်းဆောင်ရည်တို့သည် စောင့်ကြည့်သင့်သော သီးခြားအချက်နှစ်ချက်အဖြစ် ဆက်လက်ရှိနေသည်။
{spot}(BNBUSDT)
#KOSPIFalls3.53%BackBelow6000 #AmazonSharesFallAbout7%InPremarketTrading #USMidtermElections #BinanceWillListPredictPREDICT #TwoAddressesHoldingAbout1.28BUSDTFrozen
$BNB သည် BNB Chain ဂေဟစနစ်အတွင်း အဓိကကျသော အရင်းအမြစ်တစ်ခုအဖြစ် ဆက်လက်တည်ရှိနေပြီး ကွန်ရက်လှုပ်ရှားမှုများ၊ ငွေလွှဲခများ၊ staking နှင့် ဗဟိုချုပ်ကိုင်မှုမရှိသော အက်ပ်လီကေးရှင်းအမျိုးမျိုးကို ပံ့ပိုးပေးနေသည်။
စျေးကွက်အခြေအနေအရ BNB သည် သိသာထင်ရှားသော ရောင်းအားဖိအားနှင့် ရင်ဆိုင်နေရသည်။ လက်ရှိစျေးနှုန်းမှာ $697.37 ဝန်းကျင်ဖြစ်ပြီး ၂၄ နာရီအတွင်း 6.25% ကျဆင်းခဲ့သည်။ ၄ နာရီဇယားတွင် $750–$760 ဝန်းကျင်မှ ပြင်းထန်စွာ ငြင်းပယ်ခံရပြီးနောက် $678 အထိ သိသိသာသာ ကျဆင်းကာ ယာယီပြန်လည်တက်လာခဲ့သည်ကို တွေ့ရသည်။
ဝယ်ယူသူများသည် အောက်ခြေစျေးနှုန်းအဆင့်များကို ကာကွယ်ရန် ကြိုးပမ်းခဲ့သော်လည်း စျေးနှုန်းသည် $700 အဆင့်ကို ပြန်လည်ရောက်ရှိရန် ရုန်းကန်နေရသည်။ $720–$730 အပိုင်းအခြားသည် အရေးကြီးသော ပြန်လည်နာလန်ထူရေးဇုန်ဖြစ်ပြီး၊ $678 သည် စောင့်ကြည့်ရမည့် အဓိကပံ့ပိုးမှုအဆင့်အဖြစ် ဆက်လက်တည်ရှိနေသည်။
လက်ရှိတွင် စျေးကွက်ဖွဲ့စည်းပုံသည် ဖိအားအောက်တွင် ရှိနေဆဲဖြစ်သည်။ အနီးအနားရှိ ခုခံမှုအဆင့်များကို ကျော်လွန်၍ ဆက်တိုက်ပြန်လည်နာလန်ထူနိုင်ပါက ကာလတိုအလားအလာ ပိုမိုကောင်းမွန်လာမည်ဖြစ်ပြီး၊ ထပ်မံကျဆင်းပါက အောက်ဘက်သို့ ဆက်လက်ကျဆင်းနိုင်သည်။
BNB ၏ ပိုမိုကျယ်ပြန့်သော ဂေဟစနစ်လှုပ်ရှားမှုနှင့် ကာလတိုစျေးကွက်စွမ်းဆောင်ရည်တို့သည် စောင့်ကြည့်သင့်သော သီးခြားအချက်နှစ်ချက်အဖြစ် ဆက်လက်ရှိနေသည်။
#KOSPIFalls3.53%BackBelow6000 #AmazonSharesFallAbout7%InPremarketTrading #USMidtermElections #BinanceWillListPredictPREDICT #TwoAddressesHoldingAbout1.28BUSDTFrozen
စျေးကွက်အခြေအနေအရ BNB သည် သိသာထင်ရှားသော ရောင်းအားဖိအားနှင့် ရင်ဆိုင်နေရသည်။ လက်ရှိစျေးနှုန်းမှာ $697.37 ဝန်းကျင်ဖြစ်ပြီး ၂၄ နာရီအတွင်း 6.25% ကျဆင်းခဲ့သည်။ ၄ နာရီဇယားတွင် $750–$760 ဝန်းကျင်မှ ပြင်းထန်စွာ ငြင်းပယ်ခံရပြီးနောက် $678 အထိ သိသိသာသာ ကျဆင်းကာ ယာယီပြန်လည်တက်လာခဲ့သည်ကို တွေ့ရသည်။
ဝယ်ယူသူများသည် အောက်ခြေစျေးနှုန်းအဆင့်များကို ကာကွယ်ရန် ကြိုးပမ်းခဲ့သော်လည်း စျေးနှုန်းသည် $700 အဆင့်ကို ပြန်လည်ရောက်ရှိရန် ရုန်းကန်နေရသည်။ $720–$730 အပိုင်းအခြားသည် အရေးကြီးသော ပြန်လည်နာလန်ထူရေးဇုန်ဖြစ်ပြီး၊ $678 သည် စောင့်ကြည့်ရမည့် အဓိကပံ့ပိုးမှုအဆင့်အဖြစ် ဆက်လက်တည်ရှိနေသည်။
လက်ရှိတွင် စျေးကွက်ဖွဲ့စည်းပုံသည် ဖိအားအောက်တွင် ရှိနေဆဲဖြစ်သည်။ အနီးအနားရှိ ခုခံမှုအဆင့်များကို ကျော်လွန်၍ ဆက်တိုက်ပြန်လည်နာလန်ထူနိုင်ပါက ကာလတိုအလားအလာ ပိုမိုကောင်းမွန်လာမည်ဖြစ်ပြီး၊ ထပ်မံကျဆင်းပါက အောက်ဘက်သို့ ဆက်လက်ကျဆင်းနိုင်သည်။
BNB ၏ ပိုမိုကျယ်ပြန့်သော ဂေဟစနစ်လှုပ်ရှားမှုနှင့် ကာလတိုစျေးကွက်စွမ်းဆောင်ရည်တို့သည် စောင့်ကြည့်သင့်သော သီးခြားအချက်နှစ်ချက်အဖြစ် ဆက်လက်ရှိနေသည်။
#KOSPIFalls3.53%BackBelow6000 #AmazonSharesFallAbout7%InPremarketTrading #USMidtermElections #BinanceWillListPredictPREDICT #TwoAddressesHoldingAbout1.28BUSDTFrozen
2
90
·
--
တက်ရိပ်ရှိသည်
🇺🇸 ချီကာဂို PMI သတိပေးချက်!
အမေရိကန် ချီကာဂို PMI ကို ဈေးကွက်ဖွင့်ပြီးနောက် မကြာမီ အရှေ့ပိုင်းစံတော်ချိန် နံနက် ၉:၄၅ တွင် ထုတ်ပြန်မည်။
၅၈ အထက် = ဈေးတက်မည်ဟု မျှော်လင့်နိုင်သည်
၅၆ ဝန်းကျင် = ကြားနေ
၅၂ အောက် = ဈေးကျမည်ဟု မျှော်လင့်နိုင်သည်
ဈေးကွက်သဘောထားအတွက် အရေးကြီးသော အချိန်အခါတစ်ခုပါ။ ကုန်သည်များက BTC ၏ နောက်ထပ်လှုပ်ရှားမှုကို စောင့်ကြည့်နေစဉ် ဒေတာအပေါ် အားလုံး၏အာရုံစိုက်မှု ရှိနေပါသည်။
$BTC #USMidtermElections
🇺🇸 ချီကာဂို PMI သတိပေးချက်!
အမေရိကန် ချီကာဂို PMI ကို ဈေးကွက်ဖွင့်ပြီးနောက် မကြာမီ အရှေ့ပိုင်းစံတော်ချိန် နံနက် ၉:၄၅ တွင် ထုတ်ပြန်မည်။
၅၈ အထက် = ဈေးတက်မည်ဟု မျှော်လင့်နိုင်သည်
၅၆ ဝန်းကျင် = ကြားနေ
၅၂ အောက် = ဈေးကျမည်ဟု မျှော်လင့်နိုင်သည်
ဈေးကွက်သဘောထားအတွက် အရေးကြီးသော အချိန်အခါတစ်ခုပါ။ ကုန်သည်များက BTC ၏ နောက်ထပ်လှုပ်ရှားမှုကို စောင့်ကြည့်နေစဉ် ဒေတာအပေါ် အားလုံး၏အာရုံစိုက်မှု ရှိနေပါသည်။
$BTC #USMidtermElections
အမေရိကန် ချီကာဂို PMI ကို ဈေးကွက်ဖွင့်ပြီးနောက် မကြာမီ အရှေ့ပိုင်းစံတော်ချိန် နံနက် ၉:၄၅ တွင် ထုတ်ပြန်မည်။
၅၈ အထက် = ဈေးတက်မည်ဟု မျှော်လင့်နိုင်သည်
၅၆ ဝန်းကျင် = ကြားနေ
၅၂ အောက် = ဈေးကျမည်ဟု မျှော်လင့်နိုင်သည်
ဈေးကွက်သဘောထားအတွက် အရေးကြီးသော အချိန်အခါတစ်ခုပါ။ ကုန်သည်များက BTC ၏ နောက်ထပ်လှုပ်ရှားမှုကို စောင့်ကြည့်နေစဉ် ဒေတာအပေါ် အားလုံး၏အာရုံစိုက်မှု ရှိနေပါသည်။
$BTC #USMidtermElections

1
85
·
--
တက်ရိပ်ရှိသည်
ဘာသာပြန်ဆိုချက် ကြည့်မည်
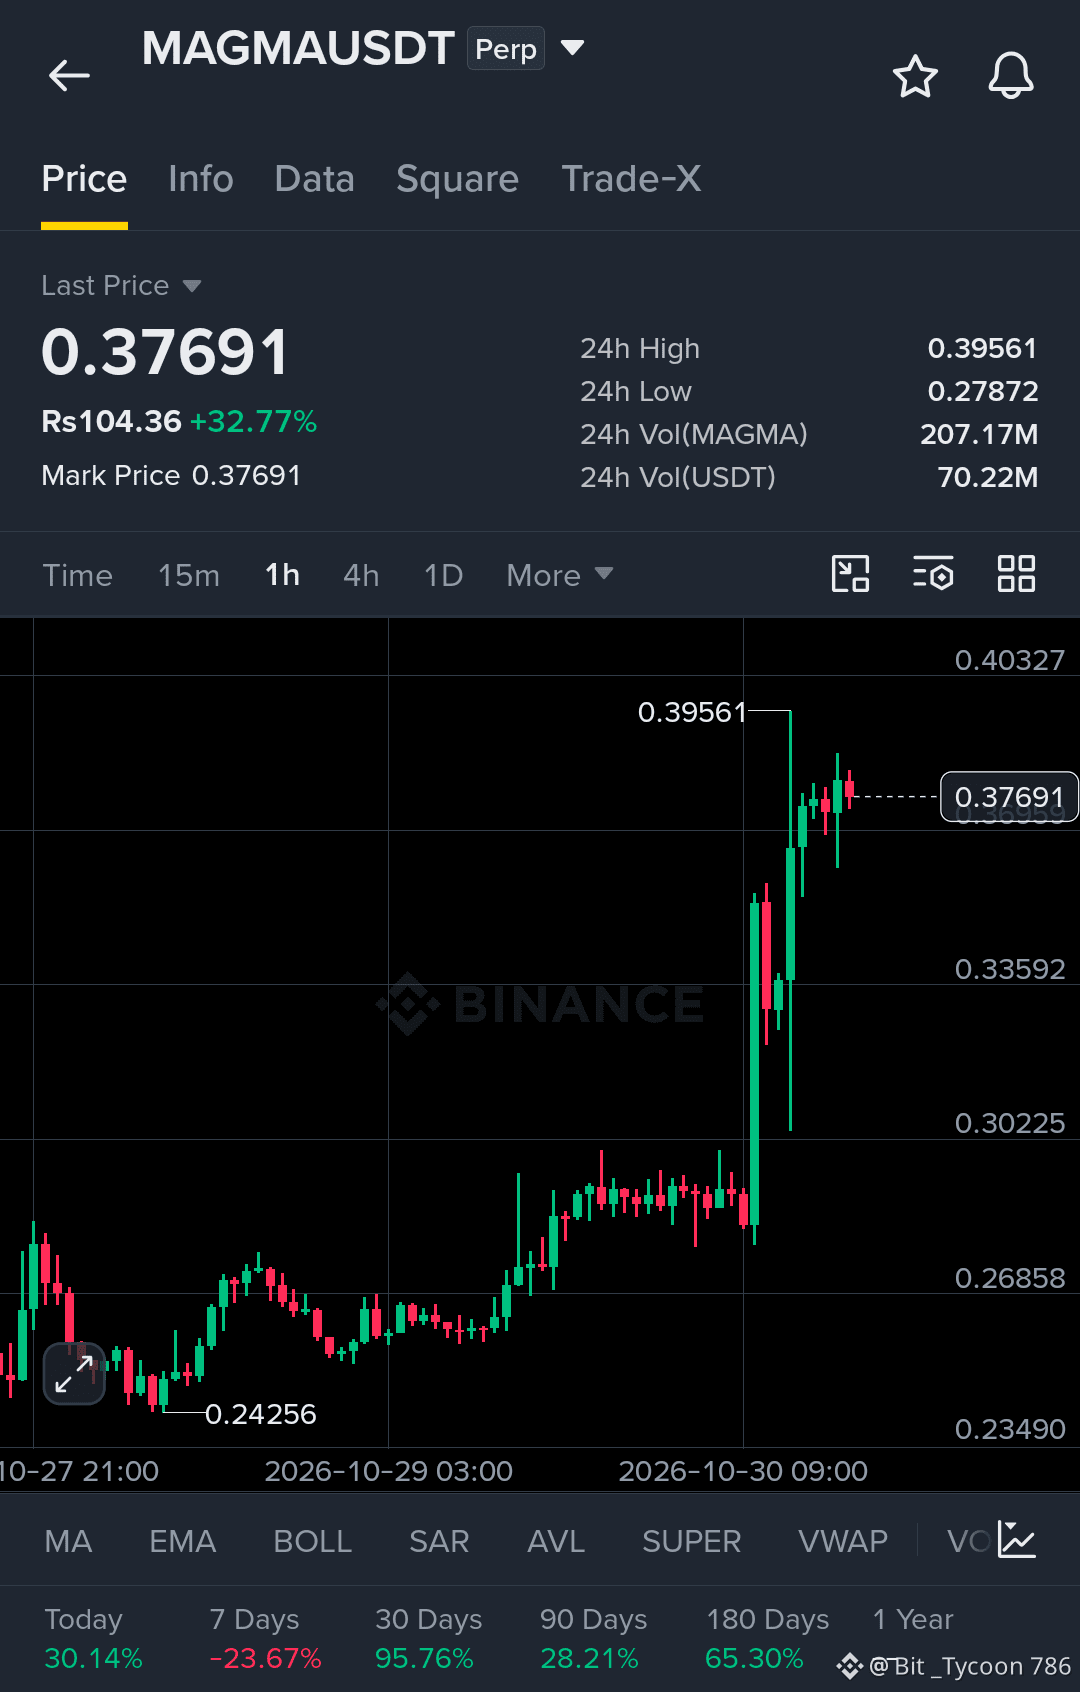
$MAGMA IS HEATING UP! Buyers are taking control, and bullish momentum is building fast.
MAGMA surged from $0.27872 to $0.39561 before pulling back to $0.37021, still holding an impressive +27.66% gain.
The bulls are showing strength, and the next big move could be just around the corner.
Trade Setup
Entry Zone: $0.35500 – $0.36500
Target 1: $0.39561
Target 2: $0.42000
Target 3: $0.44500
Stop Loss: $0.33500
A clean breakout above $0.39561 could open the door toward $0.42000 and potentially $0.44500.
Watch the resistance, respect the stop loss, and don't chase the price. The next move needs confirmation.
Risk managed. Eyes on the targets. Let’s go $MAGMA
{future}(MAGMAUSDT)
#BinanceWillListPredictPREDICT
$MAGMA IS HEATING UP! Buyers are taking control, and bullish momentum is building fast.
MAGMA surged from $0.27872 to $0.39561 before pulling back to $0.37021, still holding an impressive +27.66% gain.
The bulls are showing strength, and the next big move could be just around the corner.
Trade Setup
Entry Zone: $0.35500 – $0.36500
Target 1: $0.39561
Target 2: $0.42000
Target 3: $0.44500
Stop Loss: $0.33500
A clean breakout above $0.39561 could open the door toward $0.42000 and potentially $0.44500.
Watch the resistance, respect the stop loss, and don't chase the price. The next move needs confirmation.
Risk managed. Eyes on the targets. Let’s go $MAGMA
#BinanceWillListPredictPREDICT
MAGMA surged from $0.27872 to $0.39561 before pulling back to $0.37021, still holding an impressive +27.66% gain.
The bulls are showing strength, and the next big move could be just around the corner.
Trade Setup
Entry Zone: $0.35500 – $0.36500
Target 1: $0.39561
Target 2: $0.42000
Target 3: $0.44500
Stop Loss: $0.33500
A clean breakout above $0.39561 could open the door toward $0.42000 and potentially $0.44500.
Watch the resistance, respect the stop loss, and don't chase the price. The next move needs confirmation.
Risk managed. Eyes on the targets. Let’s go $MAGMA
#BinanceWillListPredictPREDICT
1
71
Log in to explore more content
Join global crypto users on Binance Square
⚡️ Get latest and useful information about crypto.
💬 Trusted by the world’s largest crypto exchange.
👍 Discover real insights from verified creators.
အီးမေးလ် / ဖုန်းနံပါတ်
ရေပန်းစားနေသော ခေါင်းစဉ်များ
BinanceRestoresWithdrawalsForMultipleNetworksAndAssets
ကြည့်ရှုမှု 355 ကြိမ်
20 ဦး ဆွေးနွေးနေသည်
Binance က SOL ငွေထုတ်ယူမှုကို ထပ်မံဖွင့်လှစ်၊ ပြန်လည်ဖွင့်ထားသော ကွန်ရက်စုစုပေါင်း ၁၀ ခုအထိ ရှိလာ
Binance News
·နှစ်သက်မှု 15 ခု
·ကြည့်ရှုမှု 8.8k ကြိမ်
BinanceRestoresWithdrawalsForEthereumNetwork&BNBSmartChain
ကြည့်ရှုမှု 2,999 ကြိမ်
56 ဦး ဆွေးနွေးနေသည်
BinanceUpdatesProofofReservesAddresses
ကြည့်ရှုမှု 16,390 ကြိမ်
414 ဦး ဆွေးနွေးနေသည်