

#tradingtips
tradingtips
9.9M views
24,226 Discussing
ရေပန်းစားသော
နောက်ဆုံး

·
--
Article
🎯 Gráfico STRK: Las 2 zonas de soporte institucional tras el Hype dominical.Para todos los que vienen del cuadro de comentarios buscando proteger su capital ante el inminente desbloqueo del 15 de octubre, aquí tienen el mapa técnico de soporte para Starknet ($STRK ).
Si la presión de los 127 millones de tokens entrantes al mercado invalida el impulso actual del domingo, estas son las únicas dos paradas donde las ballenas e instituciones tienen órdenes de compra acumuladas para reacumular el activo de forma segura:
Zona de Soporte Principal ($0.095 - $0.086): Esta área representa la consolidación previa al quiebre estructural. Es el punto ideal para buscar gatillos de entrada en Spot si el precio corrige de forma ordenada.Soporte de Liquidación Macro ($0.072): La base del canal técnico y el precio promedio de cotización previo al rally. Si el mercado global corrige, este es el suelo institucional donde el riesgo/beneficio es óptimo.
Estrategia: Queda totalmente prohibido comprar en la resistencia actual de $0.1205. Deja que el mercado digiera el desbloqueo semanal, coloca tus alarmas en estas dos zonas y opera con paciencia.
#STRK #TechnicalAnalysis #Starknet #TradingTips
{future}(STRKUSDT)
🎯 Gráfico STRK: Las 2 zonas de soporte institucional tras el Hype dominical.
Para todos los que vienen del cuadro de comentarios buscando proteger su capital ante el inminente desbloqueo del 15 de octubre, aquí tienen el mapa técnico de soporte para Starknet ($STRK ).
Si la presión de los 127 millones de tokens entrantes al mercado invalida el impulso actual del domingo, estas son las únicas dos paradas donde las ballenas e instituciones tienen órdenes de compra acumuladas para reacumular el activo de forma segura:
Zona de Soporte Principal ($0.095 - $0.086): Esta área representa la consolidación previa al quiebre estructural. Es el punto ideal para buscar gatillos de entrada en Spot si el precio corrige de forma ordenada.Soporte de Liquidación Macro ($0.072): La base del canal técnico y el precio promedio de cotización previo al rally. Si el mercado global corrige, este es el suelo institucional donde el riesgo/beneficio es óptimo.
Estrategia: Queda totalmente prohibido comprar en la resistencia actual de $0.1205. Deja que el mercado digiera el desbloqueo semanal, coloca tus alarmas en estas dos zonas y opera con paciencia.
#STRK #TechnicalAnalysis #Starknet #TradingTips
Si la presión de los 127 millones de tokens entrantes al mercado invalida el impulso actual del domingo, estas son las únicas dos paradas donde las ballenas e instituciones tienen órdenes de compra acumuladas para reacumular el activo de forma segura:
Zona de Soporte Principal ($0.095 - $0.086): Esta área representa la consolidación previa al quiebre estructural. Es el punto ideal para buscar gatillos de entrada en Spot si el precio corrige de forma ordenada.Soporte de Liquidación Macro ($0.072): La base del canal técnico y el precio promedio de cotización previo al rally. Si el mercado global corrige, este es el suelo institucional donde el riesgo/beneficio es óptimo.
Estrategia: Queda totalmente prohibido comprar en la resistencia actual de $0.1205. Deja que el mercado digiera el desbloqueo semanal, coloca tus alarmas en estas dos zonas y opera con paciencia.
#STRK #TechnicalAnalysis #Starknet #TradingTips
2
406


·
--
$MAGIC - Chasing 35% rips in greed territory usually ends with bagholding.
Volume confirms interest but 36M USDT on a 35% candle means late buyers are providing exit liquidity for early positions.
Live example: $MAGIC +35.5% on 36.0M USDT volume.
Tape now: $BTC 83,613 USDT (+1.0%) · $ETH 2,547 USDT (+1.9%)
#TradingTips #RiskManagement
$MAGIC - Chasing 35% rips in greed territory usually ends with bagholding.
Volume confirms interest but 36M USDT on a 35% candle means late buyers are providing exit liquidity for early positions.
Live example: $MAGIC +35.5% on 36.0M USDT volume.
Tape now: $BTC 83,613 USDT (+1.0%) · $ETH 2,547 USDT (+1.9%)
#TradingTips #RiskManagement
Volume confirms interest but 36M USDT on a 35% candle means late buyers are providing exit liquidity for early positions.
Live example: $MAGIC +35.5% on 36.0M USDT volume.
Tape now: $BTC 83,613 USDT (+1.0%) · $ETH 2,547 USDT (+1.9%)
#TradingTips #RiskManagement
87

·
--
🧠 3 things to know about $ETH's MACD bull cross
1️⃣ Oct 10: MACD crossed its signal at $2,491 (4H)
2️⃣ ETH ~$2,546 now (+2.2%), histogram green 13 candles
3️⃣ Catch: MACD still under zero (-12), so trend not flipped
🎯 My take: 4H close over $2,538 + MACD over zero = confirmed
💬 Do you trust MACD crosses below the zero line? 👇
📖 Full lesson: https://app.binance.com/uni-qr/cart/376365218980945
#MACD #TradingTips #Ethereum
🧠 3 things to know about $ETH 's MACD bull cross
1️⃣ Oct 10: MACD crossed its signal at $2,491 (4H)
2️⃣ ETH ~$2,546 now (+2.2%), histogram green 13 candles
3️⃣ Catch: MACD still under zero (-12), so trend not flipped
🎯 My take: 4H close over $2,538 + MACD over zero = confirmed
💬 Do you trust MACD crosses below the zero line? 👇
📖 Full lesson: https://app.binance.com/uni-qr/cart/376365218980945
#MACD #TradingTips #Ethereum
1️⃣ Oct 10: MACD crossed its signal at $2,491 (4H)
2️⃣ ETH ~$2,546 now (+2.2%), histogram green 13 candles
3️⃣ Catch: MACD still under zero (-12), so trend not flipped
🎯 My take: 4H close over $2,538 + MACD over zero = confirmed
💬 Do you trust MACD crosses below the zero line? 👇
📖 Full lesson: https://app.binance.com/uni-qr/cart/376365218980945
#MACD #TradingTips #Ethereum
14
·
--
Article
MACD Crossovers, Histogram & Divergence: Explained Simply📘 What is MACD?
MACD stands for Moving Average Convergence Divergence. It measures momentum: how fast price is moving, and whether that speed is growing or fading.
It is built from two EMAs. The MACD line = 12 EMA minus 26 EMA. When the fast EMA pulls away from the slow one, momentum is strong. When they squeeze together, momentum is fading.
$ETH printed a textbook MACD bull cross on the 4H chart 2 days ago, so we use it as a live example.
📊 Live chart in the cover and in the image post below.
🔍 The 3 parts
• MACD line: the gap between the 12 and 26 EMA
• Signal line: a 9 EMA of the MACD line. It is slower and smoother
• Histogram: the bars showing MACD minus signal. Taller bars = momentum growing
• Zero line: MACD above zero means the 12 EMA is above the 26 EMA (short-term uptrend)
🔍 How to spot the signals
• Bull cross: the MACD line crosses ABOVE the signal line. The histogram flips from red to green
• Bear cross: the MACD line crosses BELOW the signal line. The histogram flips to red
• Zero-line cross: MACD moves from negative to positive (or back). This is slower but confirms the trend
• Shrinking histogram: momentum is fading, even if price is still moving the same way
• Divergence: price makes a new high (or low) but MACD does not. The move is losing power
📈 How traders use it
• Entry: a bull cross that happens near support, or right after a pullback in an uptrend. A cross above the zero line is the stronger version
• Stop-loss: under the swing low that formed before the cross, not under a random number
• Target: the next resistance level, aiming for at least 2x your risk. Some traders exit when the histogram starts shrinking
• Filter: in a downtrend, ignore bull crosses below zero unless price also breaks a key level
🧪 Live example: $ETH 4H
• Oct 6: bear cross near $2,699. ETH then dropped to $2,406 on Oct 8 (-11%)
• Oct 10, 00:00 UTC: bull cross at $2,491. The histogram has been green for 13 candles in a row
• Now: ETH about $2,545, +2.2% since the cross. 4H RSI 53
• But the MACD line is still BELOW zero (about -12, signal about -24). The 12 EMA (~$2,522) has not crossed the 26 EMA (~$2,534) yet
• What would confirm it: MACD above zero and a 4H close above the $2,538 Oct 7 floor that ETH is now testing
• What would cancel it: a bear cross and a drop back under $2,474
🧪 Bonus: $BTC daily
• Sep 29: bear cross at $83,664. MACD is still above zero (+852), so the bigger trend is not broken
• The red histogram peaked at -568 on Oct 10 and is now -466. Selling momentum is fading, but there is no bull cross yet
⚠️ Common mistakes
• Taking every cross on 5m charts. Most of them are noise
• Buying a bull cross deep below zero in a strong downtrend
• Forgetting MACD lags: by the time it crosses, part of the move is already done
• Using MACD alone, without support/resistance or volume
✅ Quick checklist
• Is the cross on the 4H or daily chart?
• Is it above or below the zero line?
• Is the histogram growing after the cross?
• Is price at a real support or resistance level?
• Is your stop under the swing and sized to 1-2% risk?
💬 Do you use MACD crosses, or do you prefer RSI or moving averages? 👇
Not financial advice. DYOR.
#TradingTips #MACD #Ethereum
MACD Crossovers, Histogram & Divergence: Explained Simply
📘 What is MACD?
MACD stands for Moving Average Convergence Divergence. It measures momentum: how fast price is moving, and whether that speed is growing or fading.
It is built from two EMAs. The MACD line = 12 EMA minus 26 EMA. When the fast EMA pulls away from the slow one, momentum is strong. When they squeeze together, momentum is fading.
$ETH printed a textbook MACD bull cross on the 4H chart 2 days ago, so we use it as a live example.
📊 Live chart in the cover and in the image post below.
🔍 The 3 parts
• MACD line: the gap between the 12 and 26 EMA
• Signal line: a 9 EMA of the MACD line. It is slower and smoother
• Histogram: the bars showing MACD minus signal. Taller bars = momentum growing
• Zero line: MACD above zero means the 12 EMA is above the 26 EMA (short-term uptrend)
🔍 How to spot the signals
• Bull cross: the MACD line crosses ABOVE the signal line. The histogram flips from red to green
• Bear cross: the MACD line crosses BELOW the signal line. The histogram flips to red
• Zero-line cross: MACD moves from negative to positive (or back). This is slower but confirms the trend
• Shrinking histogram: momentum is fading, even if price is still moving the same way
• Divergence: price makes a new high (or low) but MACD does not. The move is losing power
📈 How traders use it
• Entry: a bull cross that happens near support, or right after a pullback in an uptrend. A cross above the zero line is the stronger version
• Stop-loss: under the swing low that formed before the cross, not under a random number
• Target: the next resistance level, aiming for at least 2x your risk. Some traders exit when the histogram starts shrinking
• Filter: in a downtrend, ignore bull crosses below zero unless price also breaks a key level
🧪 Live example: $ETH 4H
• Oct 6: bear cross near $2,699. ETH then dropped to $2,406 on Oct 8 (-11%)
• Oct 10, 00:00 UTC: bull cross at $2,491. The histogram has been green for 13 candles in a row
• Now: ETH about $2,545, +2.2% since the cross. 4H RSI 53
• But the MACD line is still BELOW zero (about -12, signal about -24). The 12 EMA (~$2,522) has not crossed the 26 EMA (~$2,534) yet
• What would confirm it: MACD above zero and a 4H close above the $2,538 Oct 7 floor that ETH is now testing
• What would cancel it: a bear cross and a drop back under $2,474
🧪 Bonus: $BTC daily
• Sep 29: bear cross at $83,664. MACD is still above zero (+852), so the bigger trend is not broken
• The red histogram peaked at -568 on Oct 10 and is now -466. Selling momentum is fading, but there is no bull cross yet
⚠️ Common mistakes
• Taking every cross on 5m charts. Most of them are noise
• Buying a bull cross deep below zero in a strong downtrend
• Forgetting MACD lags: by the time it crosses, part of the move is already done
• Using MACD alone, without support/resistance or volume
✅ Quick checklist
• Is the cross on the 4H or daily chart?
• Is it above or below the zero line?
• Is the histogram growing after the cross?
• Is price at a real support or resistance level?
• Is your stop under the swing and sized to 1-2% risk?
💬 Do you use MACD crosses, or do you prefer RSI or moving averages? 👇
Not financial advice. DYOR.
#TradingTips #MACD #Ethereum
MACD stands for Moving Average Convergence Divergence. It measures momentum: how fast price is moving, and whether that speed is growing or fading.
It is built from two EMAs. The MACD line = 12 EMA minus 26 EMA. When the fast EMA pulls away from the slow one, momentum is strong. When they squeeze together, momentum is fading.
$ETH printed a textbook MACD bull cross on the 4H chart 2 days ago, so we use it as a live example.
📊 Live chart in the cover and in the image post below.
🔍 The 3 parts
• MACD line: the gap between the 12 and 26 EMA
• Signal line: a 9 EMA of the MACD line. It is slower and smoother
• Histogram: the bars showing MACD minus signal. Taller bars = momentum growing
• Zero line: MACD above zero means the 12 EMA is above the 26 EMA (short-term uptrend)
🔍 How to spot the signals
• Bull cross: the MACD line crosses ABOVE the signal line. The histogram flips from red to green
• Bear cross: the MACD line crosses BELOW the signal line. The histogram flips to red
• Zero-line cross: MACD moves from negative to positive (or back). This is slower but confirms the trend
• Shrinking histogram: momentum is fading, even if price is still moving the same way
• Divergence: price makes a new high (or low) but MACD does not. The move is losing power
📈 How traders use it
• Entry: a bull cross that happens near support, or right after a pullback in an uptrend. A cross above the zero line is the stronger version
• Stop-loss: under the swing low that formed before the cross, not under a random number
• Target: the next resistance level, aiming for at least 2x your risk. Some traders exit when the histogram starts shrinking
• Filter: in a downtrend, ignore bull crosses below zero unless price also breaks a key level
🧪 Live example: $ETH 4H
• Oct 6: bear cross near $2,699. ETH then dropped to $2,406 on Oct 8 (-11%)
• Oct 10, 00:00 UTC: bull cross at $2,491. The histogram has been green for 13 candles in a row
• Now: ETH about $2,545, +2.2% since the cross. 4H RSI 53
• But the MACD line is still BELOW zero (about -12, signal about -24). The 12 EMA (~$2,522) has not crossed the 26 EMA (~$2,534) yet
• What would confirm it: MACD above zero and a 4H close above the $2,538 Oct 7 floor that ETH is now testing
• What would cancel it: a bear cross and a drop back under $2,474
🧪 Bonus: $BTC daily
• Sep 29: bear cross at $83,664. MACD is still above zero (+852), so the bigger trend is not broken
• The red histogram peaked at -568 on Oct 10 and is now -466. Selling momentum is fading, but there is no bull cross yet
⚠️ Common mistakes
• Taking every cross on 5m charts. Most of them are noise
• Buying a bull cross deep below zero in a strong downtrend
• Forgetting MACD lags: by the time it crosses, part of the move is already done
• Using MACD alone, without support/resistance or volume
✅ Quick checklist
• Is the cross on the 4H or daily chart?
• Is it above or below the zero line?
• Is the histogram growing after the cross?
• Is price at a real support or resistance level?
• Is your stop under the swing and sized to 1-2% risk?
💬 Do you use MACD crosses, or do you prefer RSI or moving averages? 👇
Not financial advice. DYOR.
#TradingTips #MACD #Ethereum
36
·
--
$MAGIC - Chasing 46% moves on 33.5M volume usually ends in a round-trip.
When greed hits 69, extended names reverse faster than the index - wait for the first pullback to show drying volume before touching it.
Live example: $MAGIC +46.5% on 33.5M USDT volume.
Tape now: $BTC 83,765 USDT (+0.9%) · $ETH 2,546 USDT (+1.4%)
#TradingTips #RiskManagement
$MAGIC - Chasing 46% moves on 33.5M volume usually ends in a round-trip.
When greed hits 69, extended names reverse faster than the index - wait for the first pullback to show drying volume before touching it.
Live example: $MAGIC +46.5% on 33.5M USDT volume.
Tape now: $BTC 83,765 USDT (+0.9%) · $ETH 2,546 USDT (+1.4%)
#TradingTips #RiskManagement
When greed hits 69, extended names reverse faster than the index - wait for the first pullback to show drying volume before touching it.
Live example: $MAGIC +46.5% on 33.5M USDT volume.
Tape now: $BTC 83,765 USDT (+0.9%) · $ETH 2,546 USDT (+1.4%)
#TradingTips #RiskManagement
252

·
--
$AAVE moves 1.0% an hour and most people still guess their size
Trading is math not a feeling
Take a $1000 account and risk 10 bucks which is 1 percent
The 1h ATR sits at $1.70 meaning price swings about 1.70 bucks normally
Place your stop at that exact 1.0 percent distance from entry
Divide your 10 dollar risk by that 1.70 dollar swing
You get roughly 5 tokens of $AAVE for that specific trade
Never risk more than your plan allows no matter the chart
What is your go to risk percentage per trade
#AAVE #TradingTips
$AAVE moves 1.0% an hour and most people still guess their size
Trading is math not a feeling
Take a $1000 account and risk 10 bucks which is 1 percent
The 1h ATR sits at $1.70 meaning price swings about 1.70 bucks normally
Place your stop at that exact 1.0 percent distance from entry
Divide your 10 dollar risk by that 1.70 dollar swing
You get roughly 5 tokens of $AAVE for that specific trade
Never risk more than your plan allows no matter the chart
What is your go to risk percentage per trade
#AAVE #TradingTips
Trading is math not a feeling
Take a $1000 account and risk 10 bucks which is 1 percent
The 1h ATR sits at $1.70 meaning price swings about 1.70 bucks normally
Place your stop at that exact 1.0 percent distance from entry
Divide your 10 dollar risk by that 1.70 dollar swing
You get roughly 5 tokens of $AAVE for that specific trade
Never risk more than your plan allows no matter the chart
What is your go to risk percentage per trade
#AAVE #TradingTips
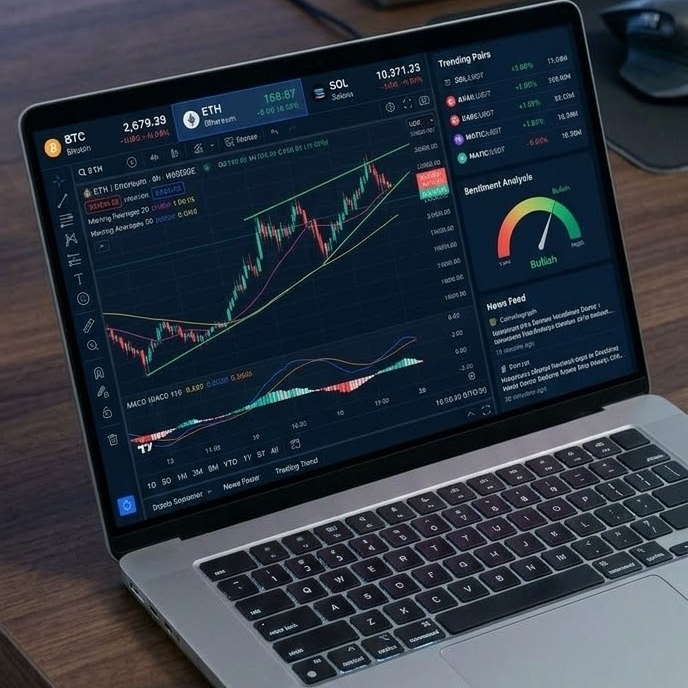
El token xrp muestra un comportamiento interesante en gráficos de 4 horas, probando una importante zona de soporte técnico tras la reciente consolidación del mercado.
Niveles clave a monitorear:
Soporte principal: $1.35 – $1.38
Resistencia clave: $1.48 – $1.53
Estructura: El precio busca mantener el impulso sobre el soporte clave antes de intentar un nuevo testeo hacia la zona superior de resistencia.
💡 Estrategia (Spot / Futuros conservador):
Escenario Alcista: Confirmación con volumen al romper los $1.48, buscando objetivos hacia $1.55 y $1.62.
Gestión de Riesgo: Mantener Stop Loss ajustado por debajo de $1.34 para proteger capital en caso de invalidación de la estructura.
¿Cómo ven a xrp para los próximos días? ¿Siguen acumulando o esperan confirmación? Dejen sus comentarios abajo 👇
$XRP $BTC $SOL #Write2Earn. #CryptoAnalysis📈📉🐋📅🚀 #tradingtips #BinanceSquare
El token xrp muestra un comportamiento interesante en gráficos de 4 horas, probando una importante zona de soporte técnico tras la reciente consolidación del mercado.
Niveles clave a monitorear:
Soporte principal: $1.35 – $1.38
Resistencia clave: $1.48 – $1.53
Estructura: El precio busca mantener el impulso sobre el soporte clave antes de intentar un nuevo testeo hacia la zona superior de resistencia.
💡 Estrategia (Spot / Futuros conservador):
Escenario Alcista: Confirmación con volumen al romper los $1.48, buscando objetivos hacia $1.55 y $1.62.
Gestión de Riesgo: Mantener Stop Loss ajustado por debajo de $1.34 para proteger capital en caso de invalidación de la estructura.
¿Cómo ven a xrp para los próximos días? ¿Siguen acumulando o esperan confirmación? Dejen sus comentarios abajo 👇
$XRP $BTC $SOL #Write2Earn. #CryptoAnalysis📈📉🐋📅🚀 #tradingtips #BinanceSquare
Niveles clave a monitorear:
Soporte principal: $1.35 – $1.38
Resistencia clave: $1.48 – $1.53
Estructura: El precio busca mantener el impulso sobre el soporte clave antes de intentar un nuevo testeo hacia la zona superior de resistencia.
💡 Estrategia (Spot / Futuros conservador):
Escenario Alcista: Confirmación con volumen al romper los $1.48, buscando objetivos hacia $1.55 y $1.62.
Gestión de Riesgo: Mantener Stop Loss ajustado por debajo de $1.34 para proteger capital en caso de invalidación de la estructura.
¿Cómo ven a xrp para los próximos días? ¿Siguen acumulando o esperan confirmación? Dejen sus comentarios abajo 👇
$XRP $BTC $SOL #Write2Earn. #CryptoAnalysis📈📉🐋📅🚀 #tradingtips #BinanceSquare
109
·
--
$INJ moves 1.4 percent an hour so most people size it like a stablecoin
They buy a bag without doing the math and panic on the first normal hourly swing
Here is how I size a position using real data from the current chart
Say you have a one thousand dollar account and want to risk one percent
That means you can only lose ten dollars if your stop gets hit
Right now the one hour ATR is 1.4 percent of the 7.8090 dollar price
That ATR is about eleven cents of normal movement
If your stop goes one ATR away at eleven cents you divide your ten dollar risk by that eleven cents
That gives you roughly ninety one shares of $INJ for that trade
Position sizing is just math that keeps you in the game when volatility hits
What is your maximum risk percentage on every trade
#INJ #TradingTips
$INJ moves 1.4 percent an hour so most people size it like a stablecoin
They buy a bag without doing the math and panic on the first normal hourly swing
Here is how I size a position using real data from the current chart
Say you have a one thousand dollar account and want to risk one percent
That means you can only lose ten dollars if your stop gets hit
Right now the one hour ATR is 1.4 percent of the 7.8090 dollar price
That ATR is about eleven cents of normal movement
If your stop goes one ATR away at eleven cents you divide your ten dollar risk by that eleven cents
That gives you roughly ninety one shares of $INJ for that trade
Position sizing is just math that keeps you in the game when volatility hits
What is your maximum risk percentage on every trade
#INJ #TradingTips
They buy a bag without doing the math and panic on the first normal hourly swing
Here is how I size a position using real data from the current chart
Say you have a one thousand dollar account and want to risk one percent
That means you can only lose ten dollars if your stop gets hit
Right now the one hour ATR is 1.4 percent of the 7.8090 dollar price
That ATR is about eleven cents of normal movement
If your stop goes one ATR away at eleven cents you divide your ten dollar risk by that eleven cents
That gives you roughly ninety one shares of $INJ for that trade
Position sizing is just math that keeps you in the game when volatility hits
What is your maximum risk percentage on every trade
#INJ #TradingTips
46
·
--
$ALGO moves 1.7 percent an hour and most traders size it wrong
Position sizing is the only shield you actually control
Say you have a 1000 dollar account and want 1 risk
The 1h ATR on $ALGO sits at 1.7 percent right now
That means a normal swing takes price 0.00213 dollars away
Place your stop right there below the recent low of 0.11620
Divide your 10 dollar risk by that exact distance to find size
Too many traders guess this math and blow up on chop
What position size do you use on a normal hourly swing
#ALGO #TradingTips
$ALGO moves 1.7 percent an hour and most traders size it wrong
Position sizing is the only shield you actually control
Say you have a 1000 dollar account and want 1 risk
The 1h ATR on $ALGO sits at 1.7 percent right now
That means a normal swing takes price 0.00213 dollars away
Place your stop right there below the recent low of 0.11620
Divide your 10 dollar risk by that exact distance to find size
Too many traders guess this math and blow up on chop
What position size do you use on a normal hourly swing
#ALGO #TradingTips
Position sizing is the only shield you actually control
Say you have a 1000 dollar account and want 1 risk
The 1h ATR on $ALGO sits at 1.7 percent right now
That means a normal swing takes price 0.00213 dollars away
Place your stop right there below the recent low of 0.11620
Divide your 10 dollar risk by that exact distance to find size
Too many traders guess this math and blow up on chop
What position size do you use on a normal hourly swing
#ALGO #TradingTips
4

·
--
တက်ရိပ်ရှိသည်
🚨 Account Washed Out: Hard Lessons Learned 🚨
I recently wiped out my entire trading account due to high leverage and not using a strict Stop-Loss. It is a tough lesson, but I now realize how crucial proper risk management is in crypto.
I am starting back from zero and focusing on learning.
#tradingtips #RiskManagement #CryptoCommunity
🚨 Account Washed Out: Hard Lessons Learned 🚨
I recently wiped out my entire trading account due to high leverage and not using a strict Stop-Loss. It is a tough lesson, but I now realize how crucial proper risk management is in crypto.
I am starting back from zero and focusing on learning.
#tradingtips #RiskManagement #CryptoCommunity
I recently wiped out my entire trading account due to high leverage and not using a strict Stop-Loss. It is a tough lesson, but I now realize how crucial proper risk management is in crypto.
I am starting back from zero and focusing on learning.
#tradingtips #RiskManagement #CryptoCommunity

Best Wishes!
From abdullah Saeedo51
Fully Claimed
·
--
$W is up 18.3 percent and most traders buy right at the absolute top
Look at the facts before you click market buy on that green candle
Price sits at 0.02097 which is 97 percent of the 24 hour range
Every buyer right now is taking shares from someone who bought at 0.01695 and wants out
An RSI of 82 means the fuel is already spent and the hourly swings are massive at 2.7 percent
When you buy the top gainer you are just exit liquidity for an early holder
Wait for the retest or miss the move completely
What is your personal rule for avoiding green candle FOMO
Open $W and set an alert at that level
#W #TradingTips
$W is up 18.3 percent and most traders buy right at the absolute top
Look at the facts before you click market buy on that green candle
Price sits at 0.02097 which is 97 percent of the 24 hour range
Every buyer right now is taking shares from someone who bought at 0.01695 and wants out
An RSI of 82 means the fuel is already spent and the hourly swings are massive at 2.7 percent
When you buy the top gainer you are just exit liquidity for an early holder
Wait for the retest or miss the move completely
What is your personal rule for avoiding green candle FOMO
Open $W and set an alert at that level
#W #TradingTips
Look at the facts before you click market buy on that green candle
Price sits at 0.02097 which is 97 percent of the 24 hour range
Every buyer right now is taking shares from someone who bought at 0.01695 and wants out
An RSI of 82 means the fuel is already spent and the hourly swings are massive at 2.7 percent
When you buy the top gainer you are just exit liquidity for an early holder
Wait for the retest or miss the move completely
What is your personal rule for avoiding green candle FOMO
Open $W and set an alert at that level
#W #TradingTips
44
·
--
Article
Golden Cross & Death Cross: Explained Simply📘 What are moving averages and the golden/death cross?
A moving average (MA) is the average closing price over the last X candles. It smooths out the noise so you can see the trend.
The 3 most watched are the 20, 50 and 200 MA. On a daily chart: 20 = about one month, 50 = about one quarter, 200 = about one year.
A golden cross is when the 50 MA crosses ABOVE the 200 MA. A death cross is when it crosses BELOW. $BTC printed a golden cross just 5 weeks ago, so we can use it as a live example.
📊 Live chart in the cover and in the image post below.
🔍 SMA vs EMA
• SMA (simple): every candle counts the same. Slower and smoother
• EMA (exponential): recent candles count more. It reacts faster
• The classic golden/death cross uses the 50 and 200-day SMA
• Many traders use EMAs for the 20 and 50 because they turn quicker
• Different settings give slightly different cross dates. Pick one and stay with it
🔍 How to read them
• Price above 20 > 50 > 200, all rising: strong uptrend
• Price below 20 < 50 < 200, all falling: strong downtrend
• MAs tangled together and flat: no trend, a range. Crosses here are mostly noise
• In a trend, the 20 or 50 often acts as support (uptrend) or resistance (downtrend)
📈 How traders use it
• Entry: not on the cross itself. Wait for a pullback to the 20/50 MA or a key level that holds, then a strong close
• Stop-loss: under the swing low (or under the 50 MA) for longs, above the swing high for shorts
• Target: the next resistance/support level. Aim for at least 2x your risk
• Use crosses as a trend filter: after a golden cross, favour longs; after a death cross, be careful with them
🧪 Live example: $BTC daily
• Sep 8, 2026: the 50-day SMA crossed above the 200-day SMA. Golden cross at a close of $78,456
• Lesson 1, the dip after: BTC fell to $74,968 on Sep 15, 4.4% under the cross price
• Then it ran to $87,396 on Sep 21, +11% above the cross
• Now: about $83,600, +6.5% since the cross. Daily RSI ~54
• It sits above the 20 EMA (~$83.3K), 50 EMA (~$80.0K) and 200 EMA (~$75.8K). The stack is in uptrend order
• Key level: the 20 EMA. A daily close back under ~$83.3K puts the 50 EMA (~$80K) in play
🧪 Why crosses lag: two older BTC examples
• Apr 7, 2025: a death cross printed on the same day BTC hit its low ($74,508). Six weeks later BTC was at $111,980, about +50%
• Nov 16, 2025: a death cross at $94,261. This one worked: BTC slid to $57,800 by Jul 1, 2026 (-39%)
• Same signal, very different results. The cross confirms what price already did. It does not predict
⚠️ Common mistakes
• Buying the golden cross candle, after price has already run far above the 200 MA
• Trading crosses in a sideways market, where the lines cross back and forth
• Using 50/200 crosses on 5m or 15m charts. They work best on daily
• Forgetting that the 50 and 200 MA are slow: a big move can happen before they cross
✅ Quick checklist
• Is it the daily chart?
• Are price and MAs in clean order (20 > 50 > 200 or the reverse)?
• Did price pull back to a MA or level and hold on a close?
• Is your stop under the swing, sized to 1-2% risk?
• Is the next level at least 2R away?
💬 Do you trade golden crosses, or do you think they are too late to be useful? 👇
Not financial advice. DYOR.
#TradingTips #GoldenCross #Bitcoin
Golden Cross & Death Cross: Explained Simply
📘 What are moving averages and the golden/death cross?
A moving average (MA) is the average closing price over the last X candles. It smooths out the noise so you can see the trend.
The 3 most watched are the 20, 50 and 200 MA. On a daily chart: 20 = about one month, 50 = about one quarter, 200 = about one year.
A golden cross is when the 50 MA crosses ABOVE the 200 MA. A death cross is when it crosses BELOW. $BTC printed a golden cross just 5 weeks ago, so we can use it as a live example.
📊 Live chart in the cover and in the image post below.
🔍 SMA vs EMA
• SMA (simple): every candle counts the same. Slower and smoother
• EMA (exponential): recent candles count more. It reacts faster
• The classic golden/death cross uses the 50 and 200-day SMA
• Many traders use EMAs for the 20 and 50 because they turn quicker
• Different settings give slightly different cross dates. Pick one and stay with it
🔍 How to read them
• Price above 20 > 50 > 200, all rising: strong uptrend
• Price below 20 < 50 < 200, all falling: strong downtrend
• MAs tangled together and flat: no trend, a range. Crosses here are mostly noise
• In a trend, the 20 or 50 often acts as support (uptrend) or resistance (downtrend)
📈 How traders use it
• Entry: not on the cross itself. Wait for a pullback to the 20/50 MA or a key level that holds, then a strong close
• Stop-loss: under the swing low (or under the 50 MA) for longs, above the swing high for shorts
• Target: the next resistance/support level. Aim for at least 2x your risk
• Use crosses as a trend filter: after a golden cross, favour longs; after a death cross, be careful with them
🧪 Live example: $BTC daily
• Sep 8, 2026: the 50-day SMA crossed above the 200-day SMA. Golden cross at a close of $78,456
• Lesson 1, the dip after: BTC fell to $74,968 on Sep 15, 4.4% under the cross price
• Then it ran to $87,396 on Sep 21, +11% above the cross
• Now: about $83,600, +6.5% since the cross. Daily RSI ~54
• It sits above the 20 EMA (~$83.3K), 50 EMA (~$80.0K) and 200 EMA (~$75.8K). The stack is in uptrend order
• Key level: the 20 EMA. A daily close back under ~$83.3K puts the 50 EMA (~$80K) in play
🧪 Why crosses lag: two older BTC examples
• Apr 7, 2025: a death cross printed on the same day BTC hit its low ($74,508). Six weeks later BTC was at $111,980, about +50%
• Nov 16, 2025: a death cross at $94,261. This one worked: BTC slid to $57,800 by Jul 1, 2026 (-39%)
• Same signal, very different results. The cross confirms what price already did. It does not predict
⚠️ Common mistakes
• Buying the golden cross candle, after price has already run far above the 200 MA
• Trading crosses in a sideways market, where the lines cross back and forth
• Using 50/200 crosses on 5m or 15m charts. They work best on daily
• Forgetting that the 50 and 200 MA are slow: a big move can happen before they cross
✅ Quick checklist
• Is it the daily chart?
• Are price and MAs in clean order (20 > 50 > 200 or the reverse)?
• Did price pull back to a MA or level and hold on a close?
• Is your stop under the swing, sized to 1-2% risk?
• Is the next level at least 2R away?
💬 Do you trade golden crosses, or do you think they are too late to be useful? 👇
Not financial advice. DYOR.
#TradingTips #GoldenCross #Bitcoin
A moving average (MA) is the average closing price over the last X candles. It smooths out the noise so you can see the trend.
The 3 most watched are the 20, 50 and 200 MA. On a daily chart: 20 = about one month, 50 = about one quarter, 200 = about one year.
A golden cross is when the 50 MA crosses ABOVE the 200 MA. A death cross is when it crosses BELOW. $BTC printed a golden cross just 5 weeks ago, so we can use it as a live example.
📊 Live chart in the cover and in the image post below.
🔍 SMA vs EMA
• SMA (simple): every candle counts the same. Slower and smoother
• EMA (exponential): recent candles count more. It reacts faster
• The classic golden/death cross uses the 50 and 200-day SMA
• Many traders use EMAs for the 20 and 50 because they turn quicker
• Different settings give slightly different cross dates. Pick one and stay with it
🔍 How to read them
• Price above 20 > 50 > 200, all rising: strong uptrend
• Price below 20 < 50 < 200, all falling: strong downtrend
• MAs tangled together and flat: no trend, a range. Crosses here are mostly noise
• In a trend, the 20 or 50 often acts as support (uptrend) or resistance (downtrend)
📈 How traders use it
• Entry: not on the cross itself. Wait for a pullback to the 20/50 MA or a key level that holds, then a strong close
• Stop-loss: under the swing low (or under the 50 MA) for longs, above the swing high for shorts
• Target: the next resistance/support level. Aim for at least 2x your risk
• Use crosses as a trend filter: after a golden cross, favour longs; after a death cross, be careful with them
🧪 Live example: $BTC daily
• Sep 8, 2026: the 50-day SMA crossed above the 200-day SMA. Golden cross at a close of $78,456
• Lesson 1, the dip after: BTC fell to $74,968 on Sep 15, 4.4% under the cross price
• Then it ran to $87,396 on Sep 21, +11% above the cross
• Now: about $83,600, +6.5% since the cross. Daily RSI ~54
• It sits above the 20 EMA (~$83.3K), 50 EMA (~$80.0K) and 200 EMA (~$75.8K). The stack is in uptrend order
• Key level: the 20 EMA. A daily close back under ~$83.3K puts the 50 EMA (~$80K) in play
🧪 Why crosses lag: two older BTC examples
• Apr 7, 2025: a death cross printed on the same day BTC hit its low ($74,508). Six weeks later BTC was at $111,980, about +50%
• Nov 16, 2025: a death cross at $94,261. This one worked: BTC slid to $57,800 by Jul 1, 2026 (-39%)
• Same signal, very different results. The cross confirms what price already did. It does not predict
⚠️ Common mistakes
• Buying the golden cross candle, after price has already run far above the 200 MA
• Trading crosses in a sideways market, where the lines cross back and forth
• Using 50/200 crosses on 5m or 15m charts. They work best on daily
• Forgetting that the 50 and 200 MA are slow: a big move can happen before they cross
✅ Quick checklist
• Is it the daily chart?
• Are price and MAs in clean order (20 > 50 > 200 or the reverse)?
• Did price pull back to a MA or level and hold on a close?
• Is your stop under the swing, sized to 1-2% risk?
• Is the next level at least 2R away?
💬 Do you trade golden crosses, or do you think they are too late to be useful? 👇
Not financial advice. DYOR.
#TradingTips #GoldenCross #Bitcoin
1
30

🎉🎉 Don't Follow the Crowd, Learn Before You Invest! 🚀
In the crypto market, many people make decisions by watching others. When a coin starts rising, everyone begins talking about it. Some people say it will go much higher, and others start sharing their profits. At that moment, we may feel that we should buy the coin quickly.
But have you ever thought about what happens when the price suddenly falls?
Many people buy coins because they are afraid of missing a good chance. They do not check the project or think about the risk. They only follow what other people are doing. This can become a big problem when the market moves in the opposite direction.
I believe we should learn to make our own decisions. Before buying any coin, take some time to understand what the project is about, why people are interested in it, and what risks it may have. A coin becoming popular does not mean its price will keep going up.
Another thing we should remember is that every person has a different financial situation. Someone may be able to take a big risk, but that does not mean we should do the same. Always think about your own ability before investing money.
We should not expect to become rich overnight. Crypto trading needs time, learning, and careful planning. There will be good days and bad days. Sometimes we may make a profit, and sometimes we may lose money. The important thing is to learn from every experience and avoid repeating the same mistakes.
Do not let excitement control your decisions. If you do not understand a coin, it is better to wait and learn more instead of buying it in a hurry. Protecting your money is just as important as making a profit.
Remember, you do not need to follow every trend to be successful. Make decisions with a clear mind, understand the risks, and never invest money you cannot afford to lose.
What is your opinion? Do you prefer to follow popular coins, or do you research a project before investing? Share your thoughts below! 👇
#BinanceSquare #Crypto #CryptoLearning #TradingTips
$BNB
{spot}(BNBUSDT)
🎉🎉 Don't Follow the Crowd, Learn Before You Invest! 🚀
In the crypto market, many people make decisions by watching others. When a coin starts rising, everyone begins talking about it. Some people say it will go much higher, and others start sharing their profits. At that moment, we may feel that we should buy the coin quickly.
But have you ever thought about what happens when the price suddenly falls?
Many people buy coins because they are afraid of missing a good chance. They do not check the project or think about the risk. They only follow what other people are doing. This can become a big problem when the market moves in the opposite direction.
I believe we should learn to make our own decisions. Before buying any coin, take some time to understand what the project is about, why people are interested in it, and what risks it may have. A coin becoming popular does not mean its price will keep going up.
Another thing we should remember is that every person has a different financial situation. Someone may be able to take a big risk, but that does not mean we should do the same. Always think about your own ability before investing money.
We should not expect to become rich overnight. Crypto trading needs time, learning, and careful planning. There will be good days and bad days. Sometimes we may make a profit, and sometimes we may lose money. The important thing is to learn from every experience and avoid repeating the same mistakes.
Do not let excitement control your decisions. If you do not understand a coin, it is better to wait and learn more instead of buying it in a hurry. Protecting your money is just as important as making a profit.
Remember, you do not need to follow every trend to be successful. Make decisions with a clear mind, understand the risks, and never invest money you cannot afford to lose.
What is your opinion? Do you prefer to follow popular coins, or do you research a project before investing? Share your thoughts below! 👇
#BinanceSquare #Crypto #CryptoLearning #TradingTips
$BNB
In the crypto market, many people make decisions by watching others. When a coin starts rising, everyone begins talking about it. Some people say it will go much higher, and others start sharing their profits. At that moment, we may feel that we should buy the coin quickly.
But have you ever thought about what happens when the price suddenly falls?
Many people buy coins because they are afraid of missing a good chance. They do not check the project or think about the risk. They only follow what other people are doing. This can become a big problem when the market moves in the opposite direction.
I believe we should learn to make our own decisions. Before buying any coin, take some time to understand what the project is about, why people are interested in it, and what risks it may have. A coin becoming popular does not mean its price will keep going up.
Another thing we should remember is that every person has a different financial situation. Someone may be able to take a big risk, but that does not mean we should do the same. Always think about your own ability before investing money.
We should not expect to become rich overnight. Crypto trading needs time, learning, and careful planning. There will be good days and bad days. Sometimes we may make a profit, and sometimes we may lose money. The important thing is to learn from every experience and avoid repeating the same mistakes.
Do not let excitement control your decisions. If you do not understand a coin, it is better to wait and learn more instead of buying it in a hurry. Protecting your money is just as important as making a profit.
Remember, you do not need to follow every trend to be successful. Make decisions with a clear mind, understand the risks, and never invest money you cannot afford to lose.
What is your opinion? Do you prefer to follow popular coins, or do you research a project before investing? Share your thoughts below! 👇
#BinanceSquare #Crypto #CryptoLearning #TradingTips
$BNB
18

·
--
🌍 Geopolitics Moving Crypto Again 🧠
Whenever tension rises in the world $BTC reacts first 📊
Not because crypto is risky
Because crypto is open 24/7 while stock market is closed ⏰
Here is what I noticed 👇
Tension up ➡️ BTCdown 2-3% fast ➡️ ETH follows ➡️ Then safe coins like $USDT
dominance goes up 📈
But after 24-48h ➡️ BTCrecovers first because people see it as digital safe haven 🛡️
Smart traders dont panic sell
They wait for that first red candle and then buy BTC and $ETH on dip 🎯
War creates volatility
Volatility creates opportunity ⚡
Do you buy the fear or sell the fear 🤔
{spot}(ETHUSDT)
#CryptoNews #Bitcoin #Geopolitics #tradingtips
🌍 Geopolitics Moving Crypto Again 🧠
Whenever tension rises in the world $BTC reacts first 📊
Not because crypto is risky
Because crypto is open 24/7 while stock market is closed ⏰
Here is what I noticed 👇
Tension up ➡️ BTCdown 2-3% fast ➡️ ETH follows ➡️ Then safe coins like $USDT
dominance goes up 📈
But after 24-48h ➡️ BTCrecovers first because people see it as digital safe haven 🛡️
Smart traders dont panic sell
They wait for that first red candle and then buy BTC and $ETH on dip 🎯
War creates volatility
Volatility creates opportunity ⚡
Do you buy the fear or sell the fear 🤔
#CryptoNews #Bitcoin #Geopolitics #tradingtips
Whenever tension rises in the world $BTC reacts first 📊
Not because crypto is risky
Because crypto is open 24/7 while stock market is closed ⏰
Here is what I noticed 👇
Tension up ➡️ BTCdown 2-3% fast ➡️ ETH follows ➡️ Then safe coins like $USDT
dominance goes up 📈
But after 24-48h ➡️ BTCrecovers first because people see it as digital safe haven 🛡️
Smart traders dont panic sell
They wait for that first red candle and then buy BTC and $ETH on dip 🎯
War creates volatility
Volatility creates opportunity ⚡
Do you buy the fear or sell the fear 🤔
#CryptoNews #Bitcoin #Geopolitics #tradingtips
1
145
·
--
$SAGA drops to $0.02190 today yet traders still guess their size
The 1h ATR sits at 1.0 percent of the current price
That means normal hourly movement measures right around $0.00022
Take a $1000 account and risk 1 percent which equals $10 total
Divide that risk by the hourly ATR distance of $0.00022
That gives you a size of roughly 45454 tokens for the trade
If price hits your stop one hour away you lose only your ten bucks
Never let a random guess decide how much coin you hold
Tap $SAGA and check the hourly chart yourself
What is your max risk per trade right now
#SAGA #TradingTips
$SAGA drops to $0.02190 today yet traders still guess their size
The 1h ATR sits at 1.0 percent of the current price
That means normal hourly movement measures right around $0.00022
Take a $1000 account and risk 1 percent which equals $10 total
Divide that risk by the hourly ATR distance of $0.00022
That gives you a size of roughly 45454 tokens for the trade
If price hits your stop one hour away you lose only your ten bucks
Never let a random guess decide how much coin you hold
Tap $SAGA and check the hourly chart yourself
What is your max risk per trade right now
#SAGA #TradingTips
The 1h ATR sits at 1.0 percent of the current price
That means normal hourly movement measures right around $0.00022
Take a $1000 account and risk 1 percent which equals $10 total
Divide that risk by the hourly ATR distance of $0.00022
That gives you a size of roughly 45454 tokens for the trade
If price hits your stop one hour away you lose only your ten bucks
Never let a random guess decide how much coin you hold
Tap $SAGA and check the hourly chart yourself
What is your max risk per trade right now
#SAGA #TradingTips
30
·
--
Your $STX stop at a random 3 percent away is just a donation to the market
Most traders put stops at round numbers instead of where the structure breaks
Take $STX sitting right now at $0.38540 near the bottom of its daily range
The 1h ATR is 1.4 percent which is the normal hourly noise of the asset
If you tuck your stop inside that 1.4 percent band volatility stops you out for free
The last 24h swing low on $STX is $0.38580 right under current price action
Your stop belongs behind that actual invalidation point not at an arbitrary percentage
Put your stop where the trade is dead not where it hurts
Where do you usually put your stops
#STX #TradingTips
Your $STX stop at a random 3 percent away is just a donation to the market
Most traders put stops at round numbers instead of where the structure breaks
Take $STX sitting right now at $0.38540 near the bottom of its daily range
The 1h ATR is 1.4 percent which is the normal hourly noise of the asset
If you tuck your stop inside that 1.4 percent band volatility stops you out for free
The last 24h swing low on $STX is $0.38580 right under current price action
Your stop belongs behind that actual invalidation point not at an arbitrary percentage
Put your stop where the trade is dead not where it hurts
Where do you usually put your stops
#STX #TradingTips
Most traders put stops at round numbers instead of where the structure breaks
Take $STX sitting right now at $0.38540 near the bottom of its daily range
The 1h ATR is 1.4 percent which is the normal hourly noise of the asset
If you tuck your stop inside that 1.4 percent band volatility stops you out for free
The last 24h swing low on $STX is $0.38580 right under current price action
Your stop belongs behind that actual invalidation point not at an arbitrary percentage
Put your stop where the trade is dead not where it hurts
Where do you usually put your stops
#STX #TradingTips
10

🚀 THE ULTIMATE ALTCOIN STRATEGY: How to Maximize Profits Right Now!
💎
As $BTC continues its massive consolidation phase near the highs, smart money is quietly moving into altcoins. If you want to grow your portfolio, you need a clear plan!
Here are 3 critical rules to survive and win in the current market:
1️⃣ Don't Chase Green Candles: Buying a coin after it has already pumped 50% is the easiest way to lose money. Wait for a healthy correction or support test.
2. Watch $ETH Momentum: Ethereum is the king of altcoins. Keep a close eye on $ETH; when it breaks its major resistance, the real altcoin season will officially begin!
3. Take Profits Radically: In crypto, profit is only real when it's in your stablecoin wallet. Always secure some profits on the way up.
What are your top 3 altcoin picks for this week? Are you buying Layer-1s or AI tokens? Let me know in the comments below! 👇
#CryptoStrategy #Altcoins #BinanceSquare #tradingtips
🚀 THE ULTIMATE ALTCOIN STRATEGY: How to Maximize Profits Right Now!
💎
As $BTC continues its massive consolidation phase near the highs, smart money is quietly moving into altcoins. If you want to grow your portfolio, you need a clear plan!
Here are 3 critical rules to survive and win in the current market:
1️⃣ Don't Chase Green Candles: Buying a coin after it has already pumped 50% is the easiest way to lose money. Wait for a healthy correction or support test.
2. Watch $ETH Momentum: Ethereum is the king of altcoins. Keep a close eye on $ETH; when it breaks its major resistance, the real altcoin season will officially begin!
3. Take Profits Radically: In crypto, profit is only real when it's in your stablecoin wallet. Always secure some profits on the way up.
What are your top 3 altcoin picks for this week? Are you buying Layer-1s or AI tokens? Let me know in the comments below! 👇
#CryptoStrategy #Altcoins #BinanceSquare #tradingtips
💎
As $BTC continues its massive consolidation phase near the highs, smart money is quietly moving into altcoins. If you want to grow your portfolio, you need a clear plan!
Here are 3 critical rules to survive and win in the current market:
1️⃣ Don't Chase Green Candles: Buying a coin after it has already pumped 50% is the easiest way to lose money. Wait for a healthy correction or support test.
2. Watch $ETH Momentum: Ethereum is the king of altcoins. Keep a close eye on $ETH; when it breaks its major resistance, the real altcoin season will officially begin!
3. Take Profits Radically: In crypto, profit is only real when it's in your stablecoin wallet. Always secure some profits on the way up.
What are your top 3 altcoin picks for this week? Are you buying Layer-1s or AI tokens? Let me know in the comments below! 👇
#CryptoStrategy #Altcoins #BinanceSquare #tradingtips
51

·
--
Most traders lose money right when a breakout looks cleanest because that is exactly where late liquidity gets trapped. We have all felt that itch to chase green candles right into local resistance, only to watch the entire pump retrace before our stops even register.
Taking a look at the structure on $STRK, the pump from that $0.070 base looks promising on the surface, but this is the exact danger zone where patience matters most. The token needs to hold firm above the $0.096 to $0.098 support cluster to keep this trend valid. If buyers fail to defend that zone, this entire breakout risks turning into a distribution trap, dragging momentum down even if major caps like $BTC remain stable.
Pushing toward the $0.110 and $0.115 target range requires a clean, confirmed breakout above $0.1054 with actual volume behind it. Until that happens, jumping in mid-range without confirmation leaves your position completely exposed to sharp pullbacks.
Are you bidding the retest here or waiting for the clean reclaim first?
#STRK #Altcoins #TradingTips
Most traders lose money right when a breakout looks cleanest because that is exactly where late liquidity gets trapped. We have all felt that itch to chase green candles right into local resistance, only to watch the entire pump retrace before our stops even register.
Taking a look at the structure on $STRK , the pump from that $0.070 base looks promising on the surface, but this is the exact danger zone where patience matters most. The token needs to hold firm above the $0.096 to $0.098 support cluster to keep this trend valid. If buyers fail to defend that zone, this entire breakout risks turning into a distribution trap, dragging momentum down even if major caps like $BTC remain stable.
Pushing toward the $0.110 and $0.115 target range requires a clean, confirmed breakout above $0.1054 with actual volume behind it. Until that happens, jumping in mid-range without confirmation leaves your position completely exposed to sharp pullbacks.
Are you bidding the retest here or waiting for the clean reclaim first?
#STRK #Altcoins #TradingTips
Taking a look at the structure on $STRK , the pump from that $0.070 base looks promising on the surface, but this is the exact danger zone where patience matters most. The token needs to hold firm above the $0.096 to $0.098 support cluster to keep this trend valid. If buyers fail to defend that zone, this entire breakout risks turning into a distribution trap, dragging momentum down even if major caps like $BTC remain stable.
Pushing toward the $0.110 and $0.115 target range requires a clean, confirmed breakout above $0.1054 with actual volume behind it. Until that happens, jumping in mid-range without confirmation leaves your position completely exposed to sharp pullbacks.
Are you bidding the retest here or waiting for the clean reclaim first?
#STRK #Altcoins #TradingTips
143

Retail Interest Explodes as "Buy Crypto" Searches Set 2026 Record! 🚀📈The retail crowd is officially waking up! Global search trends for "Buy Crypto" have witnessed a massive surge, projected to shatter all 2026 records this October. Interestingly, data shows that search interest is highly distributed across various altcoins rather than being heavily concentrated on Bitcoin alone, indicating a massive shift toward diversification.
Currently, Bitcoin $BTC is comfortably holding its immediate baseline between the $82.9K – $83K zone. However, the derivative structures tell a cautious short-term story; according to active Polymarket contracts, there is currently a 63% probability that Bitcoin might retest the $80,000 psychological support floor later this month before the next massive continuation impulse.
Meanwhile, dominant Layer-1 ecosystems are highly stable, with Solana $SOL anchoring near $109.70 and Ethereum $ETH defending $2,503.
🛑 Educational Playbook: Surviving the Retail Surge & Volatility Hunts:
When massive retail volume begins entering the market, sudden spikes and liquidations are common. Keep these 3 golden rules locked tonight:
1️⃣ Do Not Chase Green Candles: New retail traders usually buy due to FOMO at local resistance levels. Smart money waits for structural 4-hour retests. Look for consolidated price floors before setting entries.
2️⃣ Prepare for the $80K Liquidity Sweep: If the Polymarket narrative triggers a short-term drop to $80K, view it as a healthy leverage shakeout. Keep your margins conservative and your leverage strictly limited to 3x–5x to survive these sweeps.
3️⃣ Spot DCA for Altcoins: Since retail interest is shifting toward altcoins, utilizing steady Dollar-Cost Averaging (DCA) on high-conviction assets like Solana during minor cool-offs is exponentially safer than chasing high-multiplier futures.
The Q4 macro structure remains incredibly bullish, but only the disciplined will hold their positions to the top. Protect your capital and trade objective levels! 📊📈
Are you accumulating altcoins during this retail surge or waiting for the $80K Bitcoin retest? Let's discuss below! 👇
#CryptoNews #Bitcoin #RetailFrenzy #TradingTips
Retail Interest Explodes as "Buy Crypto" Searches Set 2026 Record! 🚀📈
The retail crowd is officially waking up! Global search trends for "Buy Crypto" have witnessed a massive surge, projected to shatter all 2026 records this October. Interestingly, data shows that search interest is highly distributed across various altcoins rather than being heavily concentrated on Bitcoin alone, indicating a massive shift toward diversification.
Currently, Bitcoin $BTC is comfortably holding its immediate baseline between the $82.9K – $83K zone. However, the derivative structures tell a cautious short-term story; according to active Polymarket contracts, there is currently a 63% probability that Bitcoin might retest the $80,000 psychological support floor later this month before the next massive continuation impulse.
Meanwhile, dominant Layer-1 ecosystems are highly stable, with Solana $SOL anchoring near $109.70 and Ethereum $ETH defending $2,503.
🛑 Educational Playbook: Surviving the Retail Surge & Volatility Hunts:
When massive retail volume begins entering the market, sudden spikes and liquidations are common. Keep these 3 golden rules locked tonight:
1️⃣ Do Not Chase Green Candles: New retail traders usually buy due to FOMO at local resistance levels. Smart money waits for structural 4-hour retests. Look for consolidated price floors before setting entries.
2️⃣ Prepare for the $80K Liquidity Sweep: If the Polymarket narrative triggers a short-term drop to $80K, view it as a healthy leverage shakeout. Keep your margins conservative and your leverage strictly limited to 3x–5x to survive these sweeps.
3️⃣ Spot DCA for Altcoins: Since retail interest is shifting toward altcoins, utilizing steady Dollar-Cost Averaging (DCA) on high-conviction assets like Solana during minor cool-offs is exponentially safer than chasing high-multiplier futures.
The Q4 macro structure remains incredibly bullish, but only the disciplined will hold their positions to the top. Protect your capital and trade objective levels! 📊📈
Are you accumulating altcoins during this retail surge or waiting for the $80K Bitcoin retest? Let's discuss below! 👇
#CryptoNews #Bitcoin #RetailFrenzy #TradingTips
Currently, Bitcoin $BTC is comfortably holding its immediate baseline between the $82.9K – $83K zone. However, the derivative structures tell a cautious short-term story; according to active Polymarket contracts, there is currently a 63% probability that Bitcoin might retest the $80,000 psychological support floor later this month before the next massive continuation impulse.
Meanwhile, dominant Layer-1 ecosystems are highly stable, with Solana $SOL anchoring near $109.70 and Ethereum $ETH defending $2,503.
🛑 Educational Playbook: Surviving the Retail Surge & Volatility Hunts:
When massive retail volume begins entering the market, sudden spikes and liquidations are common. Keep these 3 golden rules locked tonight:
1️⃣ Do Not Chase Green Candles: New retail traders usually buy due to FOMO at local resistance levels. Smart money waits for structural 4-hour retests. Look for consolidated price floors before setting entries.
2️⃣ Prepare for the $80K Liquidity Sweep: If the Polymarket narrative triggers a short-term drop to $80K, view it as a healthy leverage shakeout. Keep your margins conservative and your leverage strictly limited to 3x–5x to survive these sweeps.
3️⃣ Spot DCA for Altcoins: Since retail interest is shifting toward altcoins, utilizing steady Dollar-Cost Averaging (DCA) on high-conviction assets like Solana during minor cool-offs is exponentially safer than chasing high-multiplier futures.
The Q4 macro structure remains incredibly bullish, but only the disciplined will hold their positions to the top. Protect your capital and trade objective levels! 📊📈
Are you accumulating altcoins during this retail surge or waiting for the $80K Bitcoin retest? Let's discuss below! 👇
#CryptoNews #Bitcoin #RetailFrenzy #TradingTips
1
157
·
--
$SHIB moves 0.6 percent an hour and most traders size positions completely wrong
People blow accounts on low price coins because they buy the exact same dollar amount of everything
If you trade a one thousand dollar account and risk one percent that is ten dollars
The one hour ATR is 0.6 percent of the price so a normal hourly swing puts you down that much
Divide your ten dollar risk by the 0.6 percent move to find your proper position size
That math gives you a position worth sixteen hundred dollars which is more than your whole account
When your position is bigger than your account leverage steps in and wipes you out before the hour ends
Always calculate your size from your stop distance instead of guessing an amount
Tap $SHIB and check the hourly chart yourself
What is your maximum risk percentage per trade
#SHIB #TradingTips
$SHIB moves 0.6 percent an hour and most traders size positions completely wrong
People blow accounts on low price coins because they buy the exact same dollar amount of everything
If you trade a one thousand dollar account and risk one percent that is ten dollars
The one hour ATR is 0.6 percent of the price so a normal hourly swing puts you down that much
Divide your ten dollar risk by the 0.6 percent move to find your proper position size
That math gives you a position worth sixteen hundred dollars which is more than your whole account
When your position is bigger than your account leverage steps in and wipes you out before the hour ends
Always calculate your size from your stop distance instead of guessing an amount
Tap $SHIB and check the hourly chart yourself
What is your maximum risk percentage per trade
#SHIB #TradingTips
People blow accounts on low price coins because they buy the exact same dollar amount of everything
If you trade a one thousand dollar account and risk one percent that is ten dollars
The one hour ATR is 0.6 percent of the price so a normal hourly swing puts you down that much
Divide your ten dollar risk by the 0.6 percent move to find your proper position size
That math gives you a position worth sixteen hundred dollars which is more than your whole account
When your position is bigger than your account leverage steps in and wipes you out before the hour ends
Always calculate your size from your stop distance instead of guessing an amount
Tap $SHIB and check the hourly chart yourself
What is your maximum risk percentage per trade
#SHIB #TradingTips
18
Log in to explore more content
Join global crypto users on Binance Square
⚡️ Get latest and useful information about crypto.
💬 Trusted by the world’s largest crypto exchange.
👍 Discover real insights from verified creators.
အီးမေးလ် / ဖုန်းနံပါတ်
ရေပန်းစားနေသော ခေါင်းစဉ်များ
1
#SuiFoundationInvests$30MInDATANetwork
0 views
6 Discussing
2
#ArgentinaCentralBankWillNotPushCryptoIntoBankingForTwoYears
6,617 views
206 Discussing
3
#LedgerConfirmsUnauthorizedHardwareImplantInUserDevice
37,576 views
252 Discussing
4
#EtherETFsExtendOutflowsToNineDays
148,908 views
2,149 Discussing
5
#EthereumSurpasses2500USDT
335,608 views
3,239 Discussing
6
#XRPLedgerPatchesXRPCreationBug
370,052 views
3,473 Discussing
7
#STRKRisesAbout20%In24Hours
331,496 views
3,175 Discussing
8
#TetherFreezesUSDTLinkedToLedgerTheft
130,047 views
2,051 Discussing
9
#CFTCMovesToFoldEventContractsIntoSwapsRules
55,447 views
1,266 Discussing
10
#LedgerPausesCryptoBilisSales
98,588 views
1,128 Discussing