
#cryptoanalysis"
cryptoanalysis"
ကြည့်ရှုမှု 1.5M ကြိမ်
4,711 ဦး ဆွေးနွေးနေသည်
ရေပန်းစားသော
နောက်ဆုံး

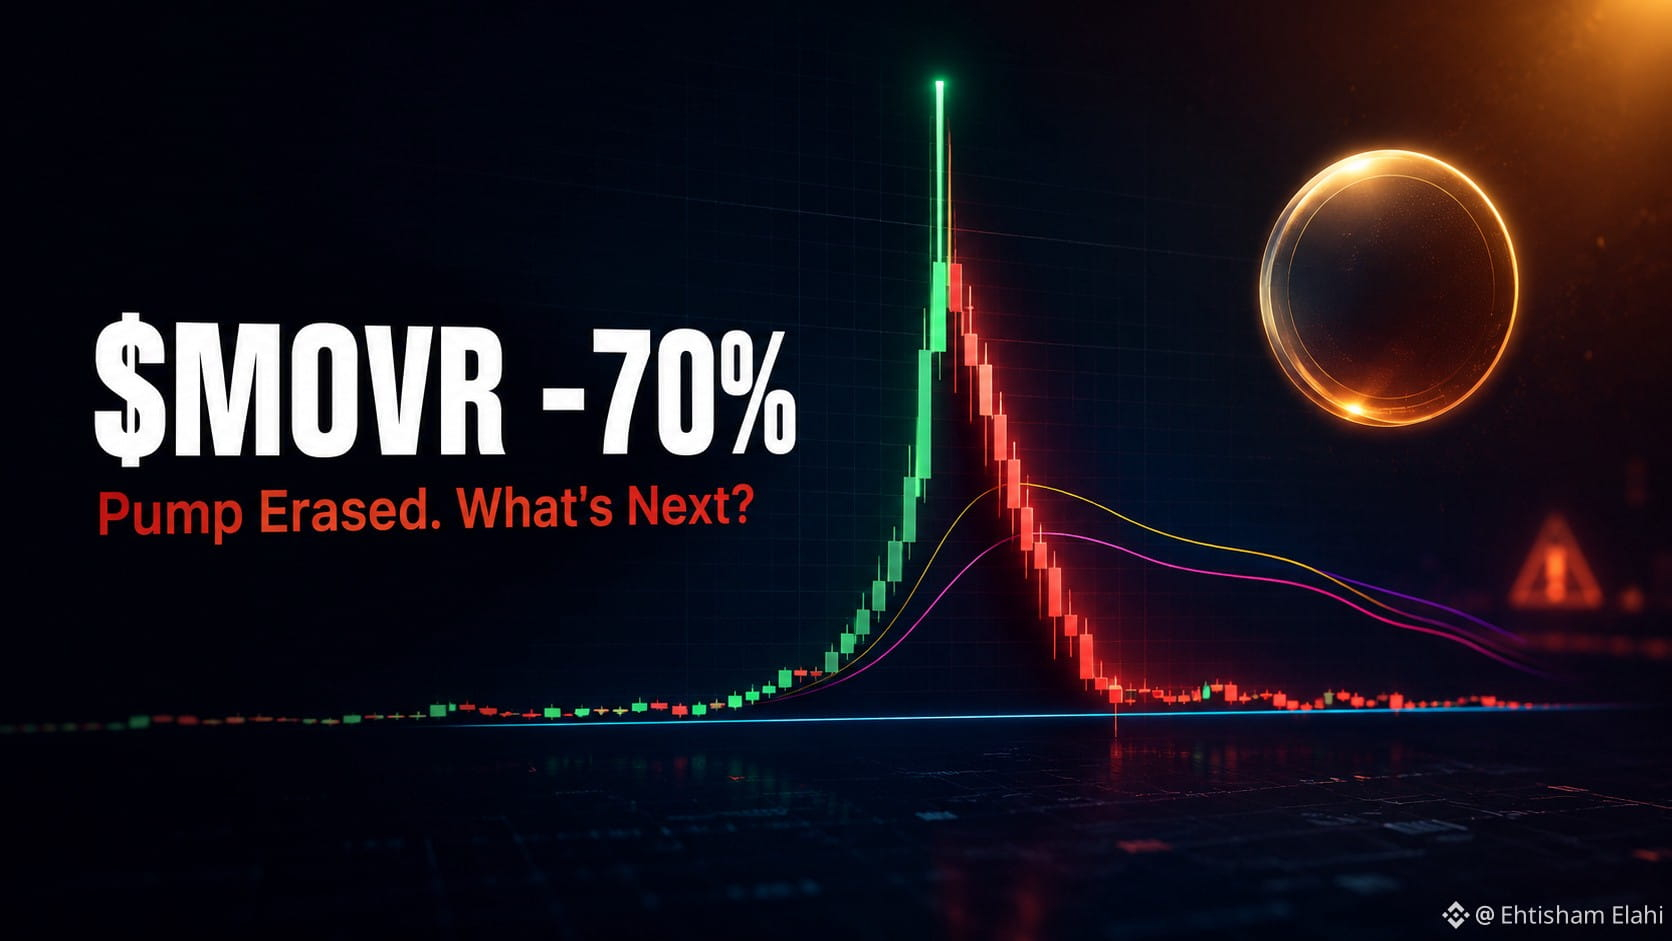
$MOVR သည် 3.34 အထိ ရုတ်တရက်တက်သွားပြီး ယခု 0.997 သို့ ပြန်ရောက်နေပါပြီ။ Pump တစ်ခုလုံး ပြီးဆုံးသွားပါပြီ။ 👀
နေ့စဉ်ဇယား အကျဉ်းချုပ်:
📉 7D: -10.27%
📉 30D: -46.16%
📉 180D: -63.10%
📉 1Y: -74.12%
ရုတ်တရက်တက်ခဲ့မှုကြောင့် အပေါ်ဘက်အရိပ်ရှည်တစ်ခု ဖြစ်ပေါ်ခဲ့ပြီး၊ နောက်ပိုင်းမှာ ဈေးနှုန်းဟာ စတင်ခဲ့တဲ့နေရာဆီ ပြန်ကျဆင်းလာကာ အမြင့်ဆုံးဈေးထက် 70% ခန့် နိမ့်နေပါတယ်။ အရောင်းအဝယ်ပမာဏလည်း ခန်းခြောက်သွားပြီး နေ့စဉ်ဖယောင်းတိုင်တွေက သေးငယ်၊ အနီရောင်ဖြစ်ကာ အောက်ဘက်ကို တဖြည်းဖြည်း ရွေ့လျားနေပါတယ်။
ယခုဈေးနှုန်းဟာ ရွေ့လျားပျမ်းမျှလိုင်း သုံးခုစလုံးရဲ့ အောက်မှာ ရှိနေပါတယ်: MA(7) 1.022၊ MA(99) 1.095 နဲ့ MA(25) 1.137။ ဒီလို အစီအစဉ်က အပေါ်ဘက်မှာ ရောင်းလိုအားဖိအား ဖြစ်စေပါတယ်။
စောင့်ကြည့်နေတဲ့ ဈေးနှုန်းအဆင့်များ:
ထောက်ပံ့မှု: 0.934 (24h အနိမ့်ဆုံး)၊ ထို့နောက် 0.622 (စက်ဝန်းအနိမ့်ဆုံး)
ခုခံမှု: 1.022၊ ထို့နောက် 1.137၊ ထို့နောက် 1.682
အော်ဒါစာအုပ်မှာ ဝယ်ယူအော်ဒါ 48% နဲ့ ရောင်းချအော်ဒါ 52% ဖြစ်ပြီး မျှတနေတဲ့အတွက် ဘယ်ဘက်မှာမှ ထင်ရှားတဲ့ အသာစီးမရှိပါဘူး။ ပြန်လည်နာလန်ထူမှု စတင်နိုင်ဖို့တောင် ဈေးတက်လာတဲ့ အရောင်းအဝယ်ပမာဏနဲ့အတူ နေ့စဉ်ပိတ်ဈေး 1.022 အထက်မှာ ရှိဖို့ နွားဈေးကွက်ဘက်က လိုအပ်ပါတယ်။ 0.934 အောက်ကို ကျိုးကျော်သွားရင် 0.622 ကို ပြန်လည်စမ်းသပ်ဖို့ လမ်းပွင့်သွားပါမယ်။
⚠️ သတိပြုရန်: MOVR မှာ Binance ရဲ့ Monitoring Tag ပါဝင်ပြီး၊ ၎င်းက ဈေးနှုန်းအတက်အကျနဲ့ အန္တရာယ် ပိုမိုမြင့်မားကြောင်း သတိပေးပါတယ်။ အဲဒီအတိုင်း ရင်းနှီးမြှုပ်နှံမှုပမာဏကို ချိန်ညှိပါ။
ဒီရုတ်တရက်တက်မှုက တစ်ကြိမ်တည်း pump လုပ်တာလား၊ ဒါမှမဟုတ် ပိုကြီးမားတဲ့အရာတစ်ခုရဲ့ အစလား။ သင့်အမြင်ကို အောက်မှာ မျှဝေပါ 👇
ဤသည် ငွေကြေးဆိုင်ရာ အကြံဉာဏ်မဟုတ်ပါ။ ကိုယ်တိုင် သုတေသနလုပ်ပါ။
$MOVR
{spot}(MOVRUSDT)
#movr #CryptoTrading #CryptoAnalysis" #BİNANCESQUARE #AIChipSlumpNasdaq
$MOVR သည် 3.34 အထိ ရုတ်တရက်တက်သွားပြီး ယခု 0.997 သို့ ပြန်ရောက်နေပါပြီ။ Pump တစ်ခုလုံး ပြီးဆုံးသွားပါပြီ။ 👀
နေ့စဉ်ဇယား အကျဉ်းချုပ်:
📉 7D: -10.27%
📉 30D: -46.16%
📉 180D: -63.10%
📉 1Y: -74.12%
ရုတ်တရက်တက်ခဲ့မှုကြောင့် အပေါ်ဘက်အရိပ်ရှည်တစ်ခု ဖြစ်ပေါ်ခဲ့ပြီး၊ နောက်ပိုင်းမှာ ဈေးနှုန်းဟာ စတင်ခဲ့တဲ့နေရာဆီ ပြန်ကျဆင်းလာကာ အမြင့်ဆုံးဈေးထက် 70% ခန့် နိမ့်နေပါတယ်။ အရောင်းအဝယ်ပမာဏလည်း ခန်းခြောက်သွားပြီး နေ့စဉ်ဖယောင်းတိုင်တွေက သေးငယ်၊ အနီရောင်ဖြစ်ကာ အောက်ဘက်ကို တဖြည်းဖြည်း ရွေ့လျားနေပါတယ်။
ယခုဈေးနှုန်းဟာ ရွေ့လျားပျမ်းမျှလိုင်း သုံးခုစလုံးရဲ့ အောက်မှာ ရှိနေပါတယ်: MA(7) 1.022၊ MA(99) 1.095 နဲ့ MA(25) 1.137။ ဒီလို အစီအစဉ်က အပေါ်ဘက်မှာ ရောင်းလိုအားဖိအား ဖြစ်စေပါတယ်။
စောင့်ကြည့်နေတဲ့ ဈေးနှုန်းအဆင့်များ:
ထောက်ပံ့မှု: 0.934 (24h အနိမ့်ဆုံး)၊ ထို့နောက် 0.622 (စက်ဝန်းအနိမ့်ဆုံး)
ခုခံမှု: 1.022၊ ထို့နောက် 1.137၊ ထို့နောက် 1.682
အော်ဒါစာအုပ်မှာ ဝယ်ယူအော်ဒါ 48% နဲ့ ရောင်းချအော်ဒါ 52% ဖြစ်ပြီး မျှတနေတဲ့အတွက် ဘယ်ဘက်မှာမှ ထင်ရှားတဲ့ အသာစီးမရှိပါဘူး။ ပြန်လည်နာလန်ထူမှု စတင်နိုင်ဖို့တောင် ဈေးတက်လာတဲ့ အရောင်းအဝယ်ပမာဏနဲ့အတူ နေ့စဉ်ပိတ်ဈေး 1.022 အထက်မှာ ရှိဖို့ နွားဈေးကွက်ဘက်က လိုအပ်ပါတယ်။ 0.934 အောက်ကို ကျိုးကျော်သွားရင် 0.622 ကို ပြန်လည်စမ်းသပ်ဖို့ လမ်းပွင့်သွားပါမယ်။
⚠️ သတိပြုရန်: MOVR မှာ Binance ရဲ့ Monitoring Tag ပါဝင်ပြီး၊ ၎င်းက ဈေးနှုန်းအတက်အကျနဲ့ အန္တရာယ် ပိုမိုမြင့်မားကြောင်း သတိပေးပါတယ်။ အဲဒီအတိုင်း ရင်းနှီးမြှုပ်နှံမှုပမာဏကို ချိန်ညှိပါ။
ဒီရုတ်တရက်တက်မှုက တစ်ကြိမ်တည်း pump လုပ်တာလား၊ ဒါမှမဟုတ် ပိုကြီးမားတဲ့အရာတစ်ခုရဲ့ အစလား။ သင့်အမြင်ကို အောက်မှာ မျှဝေပါ 👇
ဤသည် ငွေကြေးဆိုင်ရာ အကြံဉာဏ်မဟုတ်ပါ။ ကိုယ်တိုင် သုတေသနလုပ်ပါ။
$MOVR
#movr #CryptoTrading #CryptoAnalysis" #BİNANCESQUARE #AIChipSlumpNasdaq
နေ့စဉ်ဇယား အကျဉ်းချုပ်:
📉 7D: -10.27%
📉 30D: -46.16%
📉 180D: -63.10%
📉 1Y: -74.12%
ရုတ်တရက်တက်ခဲ့မှုကြောင့် အပေါ်ဘက်အရိပ်ရှည်တစ်ခု ဖြစ်ပေါ်ခဲ့ပြီး၊ နောက်ပိုင်းမှာ ဈေးနှုန်းဟာ စတင်ခဲ့တဲ့နေရာဆီ ပြန်ကျဆင်းလာကာ အမြင့်ဆုံးဈေးထက် 70% ခန့် နိမ့်နေပါတယ်။ အရောင်းအဝယ်ပမာဏလည်း ခန်းခြောက်သွားပြီး နေ့စဉ်ဖယောင်းတိုင်တွေက သေးငယ်၊ အနီရောင်ဖြစ်ကာ အောက်ဘက်ကို တဖြည်းဖြည်း ရွေ့လျားနေပါတယ်။
ယခုဈေးနှုန်းဟာ ရွေ့လျားပျမ်းမျှလိုင်း သုံးခုစလုံးရဲ့ အောက်မှာ ရှိနေပါတယ်: MA(7) 1.022၊ MA(99) 1.095 နဲ့ MA(25) 1.137။ ဒီလို အစီအစဉ်က အပေါ်ဘက်မှာ ရောင်းလိုအားဖိအား ဖြစ်စေပါတယ်။
စောင့်ကြည့်နေတဲ့ ဈေးနှုန်းအဆင့်များ:
ထောက်ပံ့မှု: 0.934 (24h အနိမ့်ဆုံး)၊ ထို့နောက် 0.622 (စက်ဝန်းအနိမ့်ဆုံး)
ခုခံမှု: 1.022၊ ထို့နောက် 1.137၊ ထို့နောက် 1.682
အော်ဒါစာအုပ်မှာ ဝယ်ယူအော်ဒါ 48% နဲ့ ရောင်းချအော်ဒါ 52% ဖြစ်ပြီး မျှတနေတဲ့အတွက် ဘယ်ဘက်မှာမှ ထင်ရှားတဲ့ အသာစီးမရှိပါဘူး။ ပြန်လည်နာလန်ထူမှု စတင်နိုင်ဖို့တောင် ဈေးတက်လာတဲ့ အရောင်းအဝယ်ပမာဏနဲ့အတူ နေ့စဉ်ပိတ်ဈေး 1.022 အထက်မှာ ရှိဖို့ နွားဈေးကွက်ဘက်က လိုအပ်ပါတယ်။ 0.934 အောက်ကို ကျိုးကျော်သွားရင် 0.622 ကို ပြန်လည်စမ်းသပ်ဖို့ လမ်းပွင့်သွားပါမယ်။
⚠️ သတိပြုရန်: MOVR မှာ Binance ရဲ့ Monitoring Tag ပါဝင်ပြီး၊ ၎င်းက ဈေးနှုန်းအတက်အကျနဲ့ အန္တရာယ် ပိုမိုမြင့်မားကြောင်း သတိပေးပါတယ်။ အဲဒီအတိုင်း ရင်းနှီးမြှုပ်နှံမှုပမာဏကို ချိန်ညှိပါ။
ဒီရုတ်တရက်တက်မှုက တစ်ကြိမ်တည်း pump လုပ်တာလား၊ ဒါမှမဟုတ် ပိုကြီးမားတဲ့အရာတစ်ခုရဲ့ အစလား။ သင့်အမြင်ကို အောက်မှာ မျှဝေပါ 👇
ဤသည် ငွေကြေးဆိုင်ရာ အကြံဉာဏ်မဟုတ်ပါ။ ကိုယ်တိုင် သုတေသနလုပ်ပါ။
$MOVR
#movr #CryptoTrading #CryptoAnalysis" #BİNANCESQUARE #AIChipSlumpNasdaq
616

·
--
Article
ဘာသာပြန်ဆိုချက် ကြည့်မည်
Bitcoin at $74.7K: Is BTC Preparing for Another Move? | 4H Analysis
btc/USDTBitcoin at $74.7K: Is BTC Preparing for Another Move? | 4H Analysis
$BTC /USDT | 4-Hour Technical Analysis
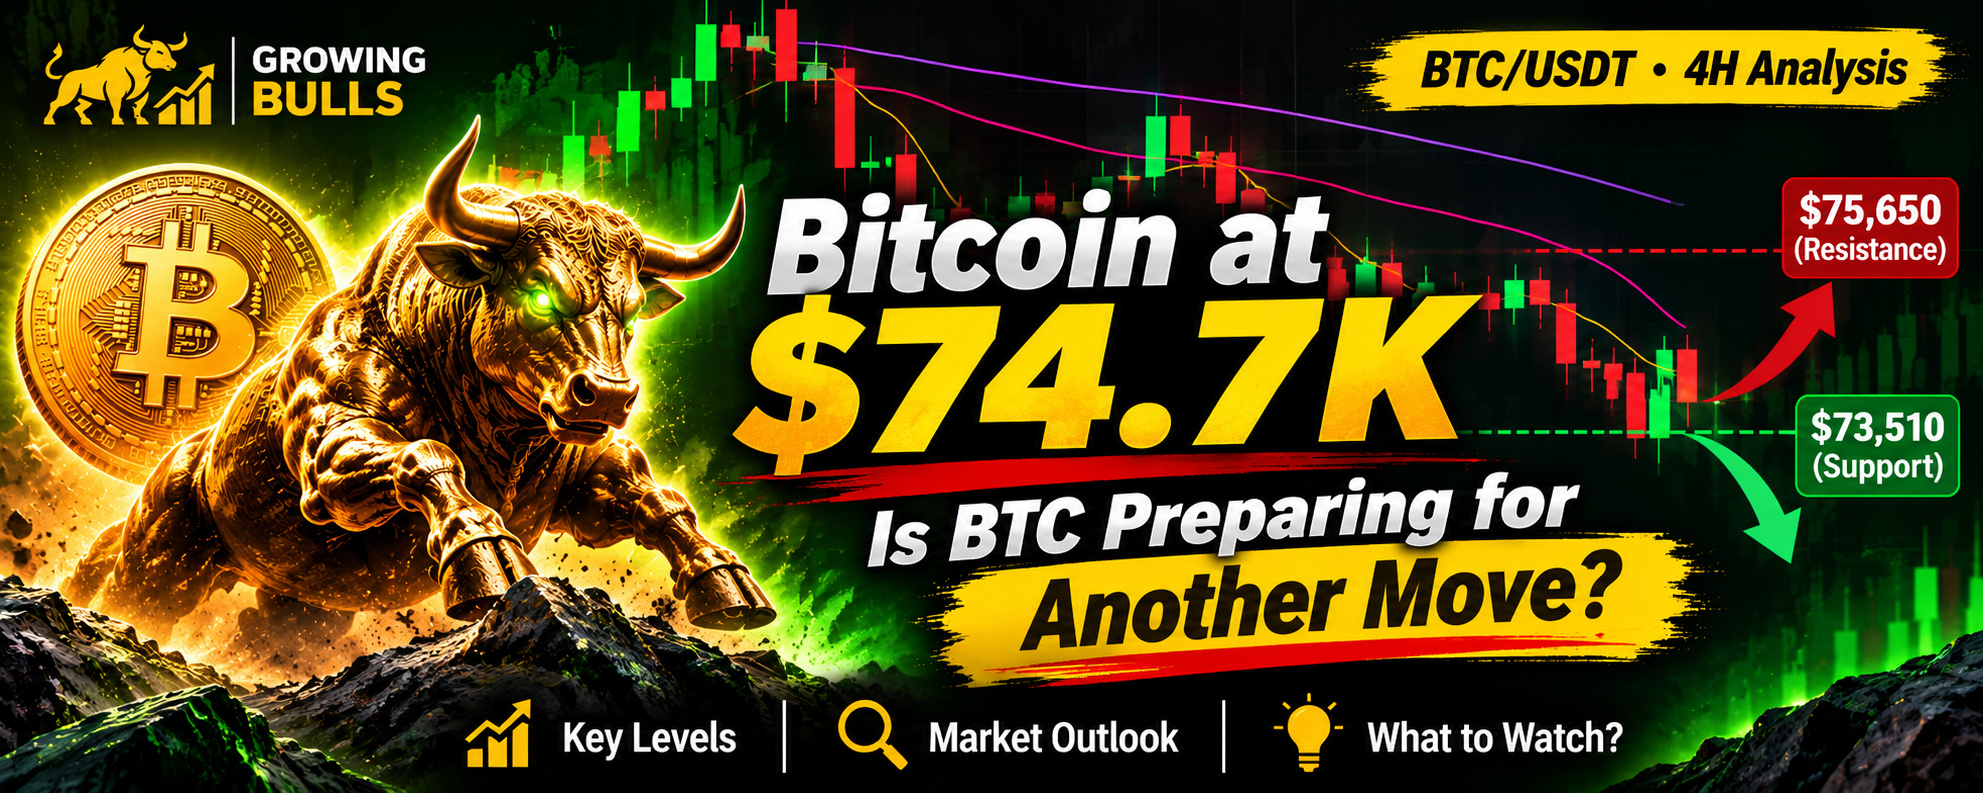
$BTC is currently trading around $74,753, down approximately 1.50% over the last 24 hours, according to the chart provided.
The 4-hour chart shows a weak market structure, with $BTC trading below its 7, 25 and 99 moving averages.
But is this simply a temporary consolidation, or could sellers be preparing for another move lower?
Moving Average Overview
Current moving average readings:
MA(7): $74,880
MA(25): $75,649
MA(99): $78,242
All three moving averages are above the current price. This reflects continued bearish pressure.
The MA(25) near $75,650 is particularly important because a sustained move above this level could indicate improving short-term momentum.
Important Price Zones
Support areas:
$73,510 – Recent local low
$73,000 – Psychological price zone
$72,000 – Potential downside area
Resistance areas:
$74,880 – Immediate resistance
$75,650 – MA(25) resistance
$76,800 – Previous consolidation area
$78,240 – MA(99) resistance
Two Scenarios Worth Watching
1. Bullish Recovery
If buyers defend the $73,510 support zone, Bitcoin could attempt a recovery toward $74,880 and $75,650.
A strong 4-hour close above $75,650, supported by increasing volume, would provide stronger evidence of a short-term recovery.
2. Bearish Continuation
If Bitcoin fails to reclaim the nearby resistance levels, selling pressure could bring another test of $73,510.
A confirmed breakdown below this support could expose the $73,000 and $72,000 areas.
Growing Bulls Market Perspective
At the moment, Bitcoin's 4-hour structure remains bearish.
However, the recent recovery attempts suggest that buyers are still participating in the market. The next important development will be whether BTC can reclaim $75,650 or lose the $73,510 support.
Rather than assuming a direction, watching these two levels and the accompanying volume could provide a clearer picture of the next market move.
Final View: Cautiously Bearish | Key Levels: $73,510 Support and $75,650 Resistance.
Disclaimer: This article represents my personal technical analysis and opinion based on the chart provided. It is for educational and informational purposes only and does not constitute financial or investment advice. Cryptocurrency markets are highly volatile. Always conduct your own research (DYOR).
Growing Bulls 🐂
#btc #bitcoin #CryptoAnalysis"
#growingbull
{spot}(BTCUSDT)
Bitcoin at $74.7K: Is BTC Preparing for Another Move? | 4H Analysis btc/USDT
Bitcoin at $74.7K: Is BTC Preparing for Another Move? | 4H Analysis
$BTC /USDT | 4-Hour Technical Analysis
$BTC is currently trading around $74,753, down approximately 1.50% over the last 24 hours, according to the chart provided.
The 4-hour chart shows a weak market structure, with $BTC trading below its 7, 25 and 99 moving averages.
But is this simply a temporary consolidation, or could sellers be preparing for another move lower?
Moving Average Overview
Current moving average readings:
MA(7): $74,880
MA(25): $75,649
MA(99): $78,242
All three moving averages are above the current price. This reflects continued bearish pressure.
The MA(25) near $75,650 is particularly important because a sustained move above this level could indicate improving short-term momentum.
Important Price Zones
Support areas:
$73,510 – Recent local low
$73,000 – Psychological price zone
$72,000 – Potential downside area
Resistance areas:
$74,880 – Immediate resistance
$75,650 – MA(25) resistance
$76,800 – Previous consolidation area
$78,240 – MA(99) resistance
Two Scenarios Worth Watching
1. Bullish Recovery
If buyers defend the $73,510 support zone, Bitcoin could attempt a recovery toward $74,880 and $75,650.
A strong 4-hour close above $75,650, supported by increasing volume, would provide stronger evidence of a short-term recovery.
2. Bearish Continuation
If Bitcoin fails to reclaim the nearby resistance levels, selling pressure could bring another test of $73,510.
A confirmed breakdown below this support could expose the $73,000 and $72,000 areas.
Growing Bulls Market Perspective
At the moment, Bitcoin's 4-hour structure remains bearish.
However, the recent recovery attempts suggest that buyers are still participating in the market. The next important development will be whether BTC can reclaim $75,650 or lose the $73,510 support.
Rather than assuming a direction, watching these two levels and the accompanying volume could provide a clearer picture of the next market move.
Final View: Cautiously Bearish | Key Levels: $73,510 Support and $75,650 Resistance.
Disclaimer: This article represents my personal technical analysis and opinion based on the chart provided. It is for educational and informational purposes only and does not constitute financial or investment advice. Cryptocurrency markets are highly volatile. Always conduct your own research (DYOR).
Growing Bulls 🐂
#btc #bitcoin #CryptoAnalysis"
#growingbull
$BTC /USDT | 4-Hour Technical Analysis
$BTC is currently trading around $74,753, down approximately 1.50% over the last 24 hours, according to the chart provided.
The 4-hour chart shows a weak market structure, with $BTC trading below its 7, 25 and 99 moving averages.
But is this simply a temporary consolidation, or could sellers be preparing for another move lower?
Moving Average Overview
Current moving average readings:
MA(7): $74,880
MA(25): $75,649
MA(99): $78,242
All three moving averages are above the current price. This reflects continued bearish pressure.
The MA(25) near $75,650 is particularly important because a sustained move above this level could indicate improving short-term momentum.
Important Price Zones
Support areas:
$73,510 – Recent local low
$73,000 – Psychological price zone
$72,000 – Potential downside area
Resistance areas:
$74,880 – Immediate resistance
$75,650 – MA(25) resistance
$76,800 – Previous consolidation area
$78,240 – MA(99) resistance
Two Scenarios Worth Watching
1. Bullish Recovery
If buyers defend the $73,510 support zone, Bitcoin could attempt a recovery toward $74,880 and $75,650.
A strong 4-hour close above $75,650, supported by increasing volume, would provide stronger evidence of a short-term recovery.
2. Bearish Continuation
If Bitcoin fails to reclaim the nearby resistance levels, selling pressure could bring another test of $73,510.
A confirmed breakdown below this support could expose the $73,000 and $72,000 areas.
Growing Bulls Market Perspective
At the moment, Bitcoin's 4-hour structure remains bearish.
However, the recent recovery attempts suggest that buyers are still participating in the market. The next important development will be whether BTC can reclaim $75,650 or lose the $73,510 support.
Rather than assuming a direction, watching these two levels and the accompanying volume could provide a clearer picture of the next market move.
Final View: Cautiously Bearish | Key Levels: $73,510 Support and $75,650 Resistance.
Disclaimer: This article represents my personal technical analysis and opinion based on the chart provided. It is for educational and informational purposes only and does not constitute financial or investment advice. Cryptocurrency markets are highly volatile. Always conduct your own research (DYOR).
Growing Bulls 🐂
#btc #bitcoin #CryptoAnalysis"
#growingbull
177

·
--
တက်ရိပ်ရှိသည်
ဘာသာပြန်ဆိုချက် ကြည့်မည်
🚨 $BTC /USDT Quick Update
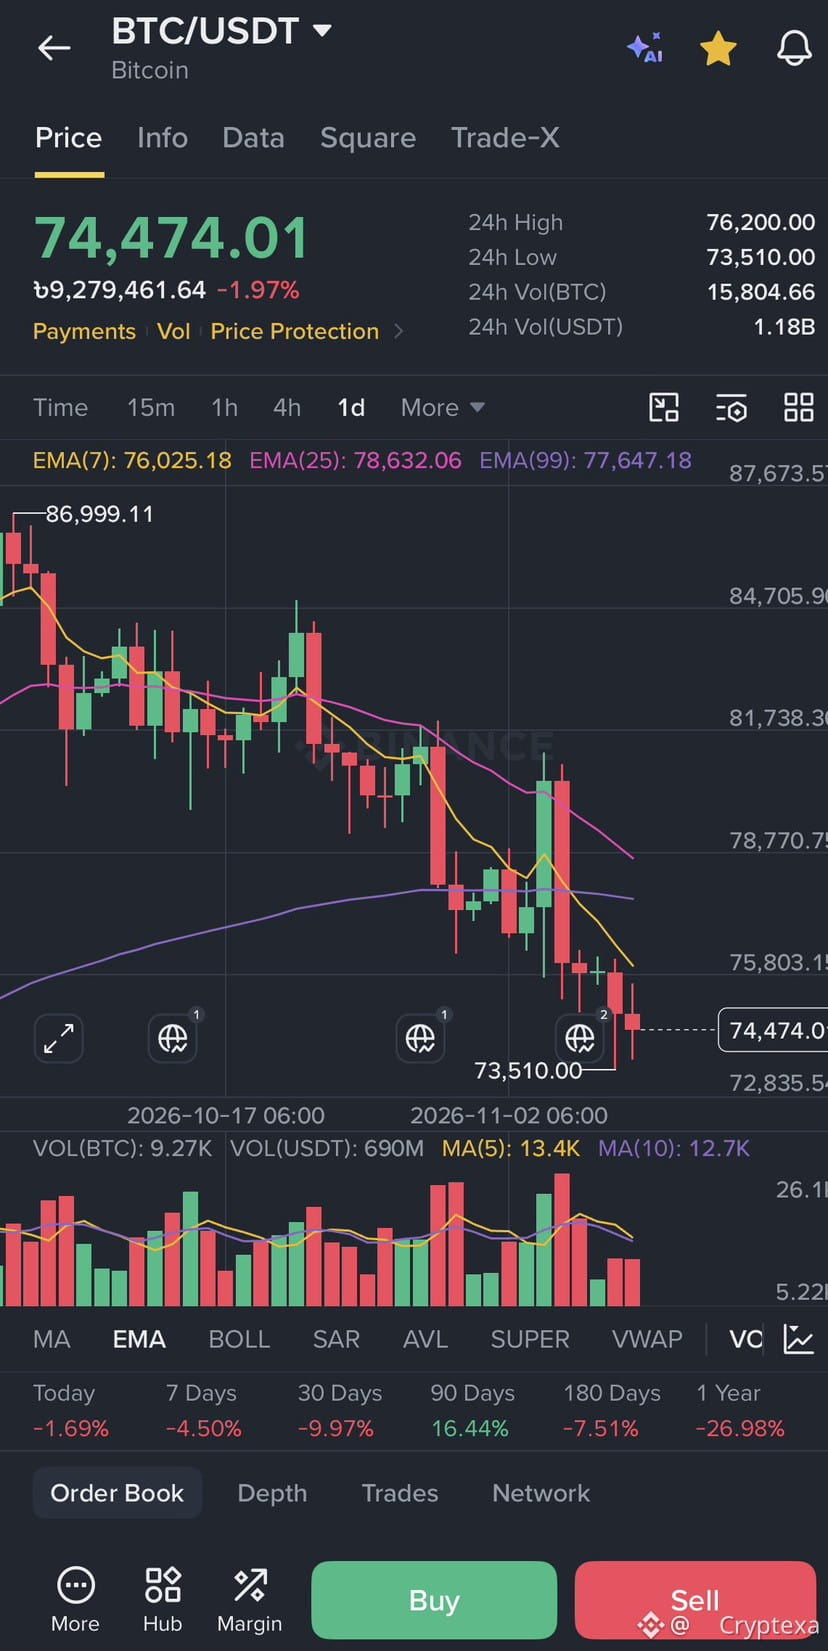
$BTC trades at $74,474, hovering right above key support at $73,510 while staying below daily EMAs.
1. Entry/Support Zone: $73,500 – $74,200
2. Target 1: $76,200 (24h High / EMA 7)
3. Target 2: $78,500 (EMA 25 Resistance)
4. Stop-Loss: $72,800 (Below recent wick low)
Holding the $73.5k support zone is vital for a bounce to $76.2k+. Losing it risks a push down to $71.0k. Drop your targets below! 👇
#BTCUSDTAnalysis #bitcoin #CryptoAnalysis" #BİNANCESQUARE #TradingSignals📞📞📞👇
🚨 $BTC /USDT Quick Update
$BTC trades at $74,474, hovering right above key support at $73,510 while staying below daily EMAs.
1. Entry/Support Zone: $73,500 – $74,200
2. Target 1: $76,200 (24h High / EMA 7)
3. Target 2: $78,500 (EMA 25 Resistance)
4. Stop-Loss: $72,800 (Below recent wick low)
Holding the $73.5k support zone is vital for a bounce to $76.2k+. Losing it risks a push down to $71.0k. Drop your targets below! 👇
#BTCUSDTAnalysis #bitcoin #CryptoAnalysis" #BİNANCESQUARE #TradingSignals📞📞📞👇
$BTC trades at $74,474, hovering right above key support at $73,510 while staying below daily EMAs.
1. Entry/Support Zone: $73,500 – $74,200
2. Target 1: $76,200 (24h High / EMA 7)
3. Target 2: $78,500 (EMA 25 Resistance)
4. Stop-Loss: $72,800 (Below recent wick low)
Holding the $73.5k support zone is vital for a bounce to $76.2k+. Losing it risks a push down to $71.0k. Drop your targets below! 👇
#BTCUSDTAnalysis #bitcoin #CryptoAnalysis" #BİNANCESQUARE #TradingSignals📞📞📞👇
2
91

·
--
ဘာသာပြန်ဆိုချက် ကြည့်မည်
🚨 $BTC — MARKET ANALYSIS | NOV 9
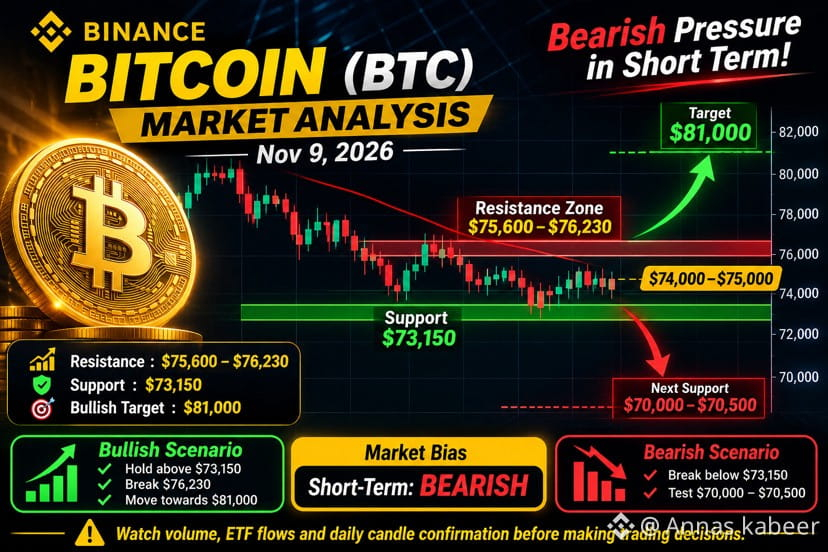
$BTC is facing strong selling pressure, with bearish momentum dominating the short-term market structure.
📉 Support: $73,150
📈 Resistance: $75,600–$76,230
🎯 Bullish Target: $81,000
A confirmed breakout above resistance could trigger a recovery, while a breakdown below support may expose the $70K zone.
Market Bias: Short-term bearish. Watch volume and daily candle confirmation before making trading decisions.
#bitcoin #BTC #CryptoAnalysis"
#BinanceSquareFamily
#Follow_Like_Comment
Me on binance
{spot}(BTCUSDT)
🚨 $BTC — MARKET ANALYSIS | NOV 9
$BTC is facing strong selling pressure, with bearish momentum dominating the short-term market structure.
📉 Support: $73,150
📈 Resistance: $75,600–$76,230
🎯 Bullish Target: $81,000
A confirmed breakout above resistance could trigger a recovery, while a breakdown below support may expose the $70K zone.
Market Bias: Short-term bearish. Watch volume and daily candle confirmation before making trading decisions.
#bitcoin #BTC #CryptoAnalysis"
#BinanceSquareFamily
#Follow_Like_Comment
Me on binance
$BTC is facing strong selling pressure, with bearish momentum dominating the short-term market structure.
📉 Support: $73,150
📈 Resistance: $75,600–$76,230
🎯 Bullish Target: $81,000
A confirmed breakout above resistance could trigger a recovery, while a breakdown below support may expose the $70K zone.
Market Bias: Short-term bearish. Watch volume and daily candle confirmation before making trading decisions.
#bitcoin #BTC #CryptoAnalysis"
#BinanceSquareFamily
#Follow_Like_Comment
Me on binance
78

·
--
တက်ရိပ်ရှိသည်
ဘာသာပြန်ဆိုချက် ကြည့်မည်
{spot}(ZECUSDT)
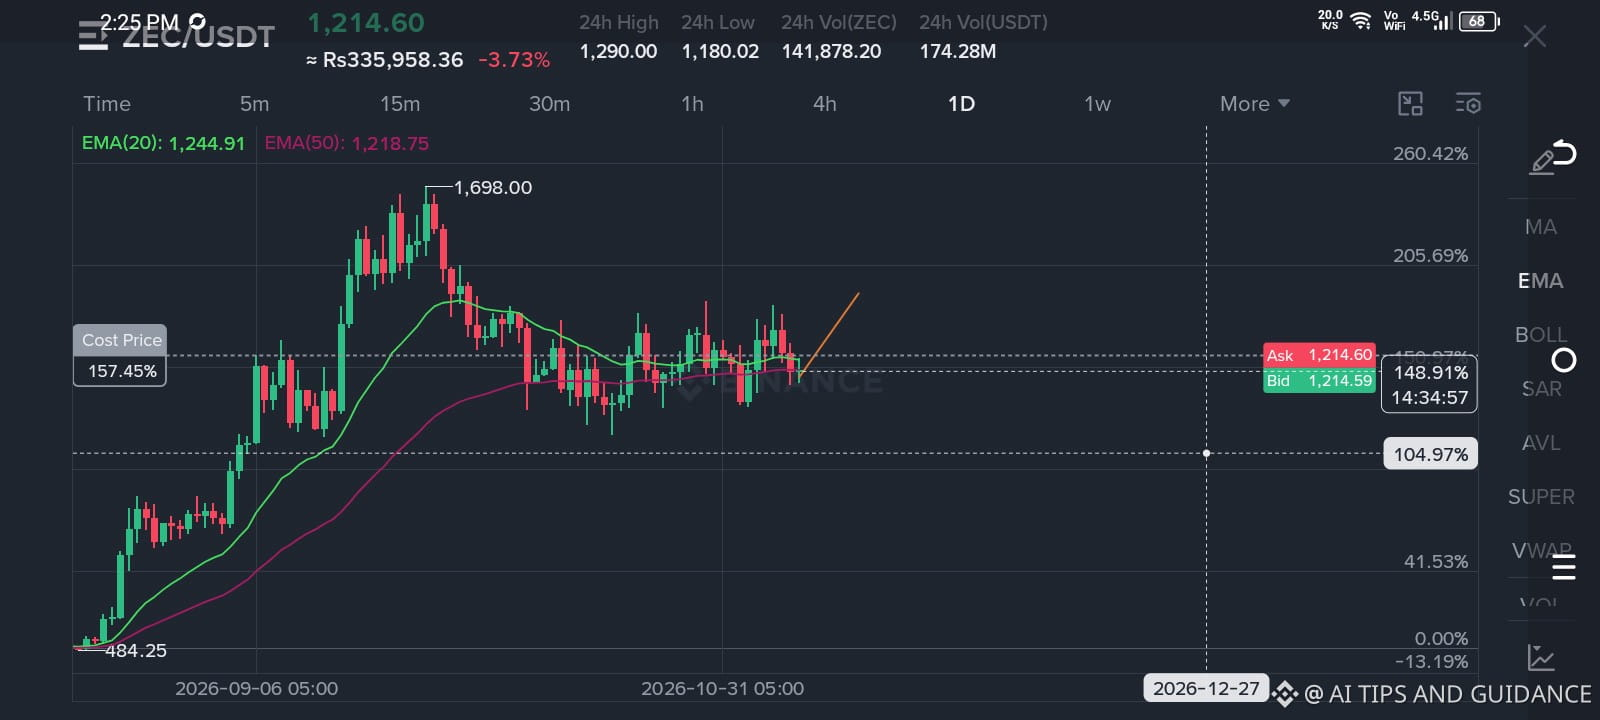
🚀 $ZEC /USDT — 5 DAY MARKET OUTLOOK
📊 My current view: Potential Bullish Recovery
ZEC is showing an interesting market structure. The next few daily candles could be important for its direction.
🎯 UPSIDE TARGETS:
• Target 1: $1,275
• Target 2: $1,335
📉 KEY SUPPORT:
• $1,178
• $1,160
🔍 WHAT I'M WATCHING:
A daily close above $1,245 could strengthen the bullish scenario and open the way toward higher targets.
⚠️ If support breaks, the bullish outlook may weaken and further downside is possible.
⏳ Timeframe: Next 5 Days
This is my independent market analysis, not a guaranteed prediction or financial advice.
DYOR. Crypto markets are highly volatile. Always understand the risks before making financial decisions.
#ZEC #zcash #CryptoAnalysis" #BinanceSquare
🚀 $ZEC /USDT — 5 DAY MARKET OUTLOOK
📊 My current view: Potential Bullish Recovery
ZEC is showing an interesting market structure. The next few daily candles could be important for its direction.
🎯 UPSIDE TARGETS:
• Target 1: $1,275
• Target 2: $1,335
📉 KEY SUPPORT:
• $1,178
• $1,160
🔍 WHAT I'M WATCHING:
A daily close above $1,245 could strengthen the bullish scenario and open the way toward higher targets.
⚠️ If support breaks, the bullish outlook may weaken and further downside is possible.
⏳ Timeframe: Next 5 Days
This is my independent market analysis, not a guaranteed prediction or financial advice.
DYOR. Crypto markets are highly volatile. Always understand the risks before making financial decisions.
#ZEC #zcash #CryptoAnalysis" #BinanceSquare
📊 My current view: Potential Bullish Recovery
ZEC is showing an interesting market structure. The next few daily candles could be important for its direction.
🎯 UPSIDE TARGETS:
• Target 1: $1,275
• Target 2: $1,335
📉 KEY SUPPORT:
• $1,178
• $1,160
🔍 WHAT I'M WATCHING:
A daily close above $1,245 could strengthen the bullish scenario and open the way toward higher targets.
⚠️ If support breaks, the bullish outlook may weaken and further downside is possible.
⏳ Timeframe: Next 5 Days
This is my independent market analysis, not a guaranteed prediction or financial advice.
DYOR. Crypto markets are highly volatile. Always understand the risks before making financial decisions.
#ZEC #zcash #CryptoAnalysis" #BinanceSquare
347
·
--
တက်ရိပ်ရှိသည်
ဘာသာပြန်ဆိုချက် ကြည့်မည်
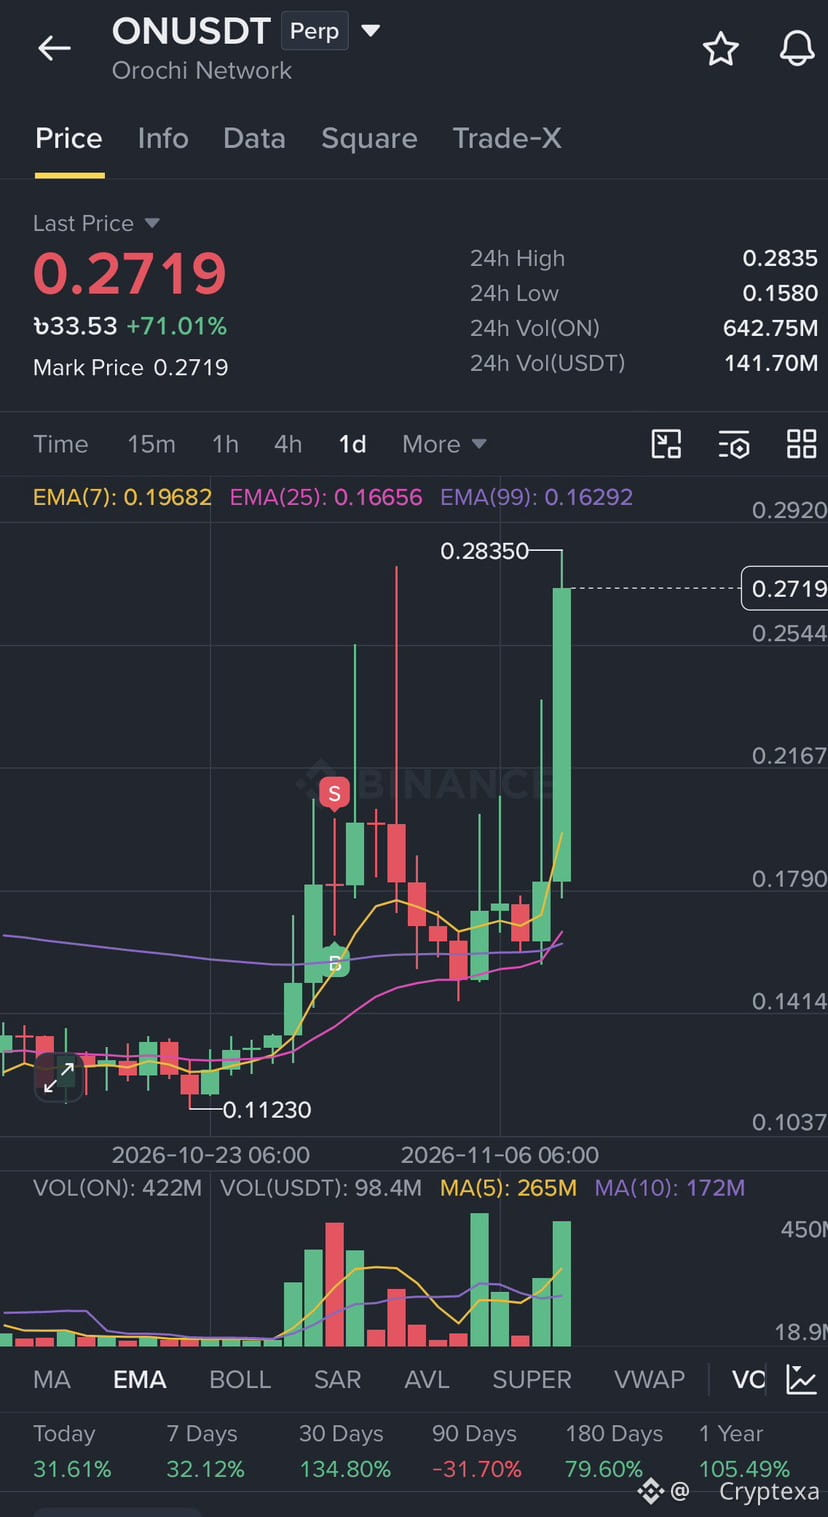
$ON /USDT Quick Update & Prediction 🚨
$ON surges +71.01% to $0.2719, tapping a 24h high of $0.2835 with massive volume expansion.
Entry/Support: 0.2450 – 0.2550 retes
Target 1: 0.2835
Target 2: 0.3200
Stop-Loss: 0.2150
Holding above $0.2500 structure keeps the bullish continuation intact toward $0.3200. Share your targets below! 👇
#ONUSDTLong🤑🚀 #CryptoAnalysis" #BİNANCESQUARE #TradingSignalslb
{future}(ONUSDT)
$ON /USDT Quick Update & Prediction 🚨
$ON surges +71.01% to $0.2719, tapping a 24h high of $0.2835 with massive volume expansion.
Entry/Support: 0.2450 – 0.2550 retes
Target 1: 0.2835
Target 2: 0.3200
Stop-Loss: 0.2150
Holding above $0.2500 structure keeps the bullish continuation intact toward $0.3200. Share your targets below! 👇
#ONUSDTLong🤑🚀 #CryptoAnalysis" #BİNANCESQUARE #TradingSignalslb
$ON surges +71.01% to $0.2719, tapping a 24h high of $0.2835 with massive volume expansion.
Entry/Support: 0.2450 – 0.2550 retes
Target 1: 0.2835
Target 2: 0.3200
Stop-Loss: 0.2150
Holding above $0.2500 structure keeps the bullish continuation intact toward $0.3200. Share your targets below! 👇
#ONUSDTLong🤑🚀 #CryptoAnalysis" #BİNANCESQUARE #TradingSignalslb
1
173
·
--
တက်ရိပ်ရှိသည်
ဘာသာပြန်ဆိုချက် ကြည့်မည်
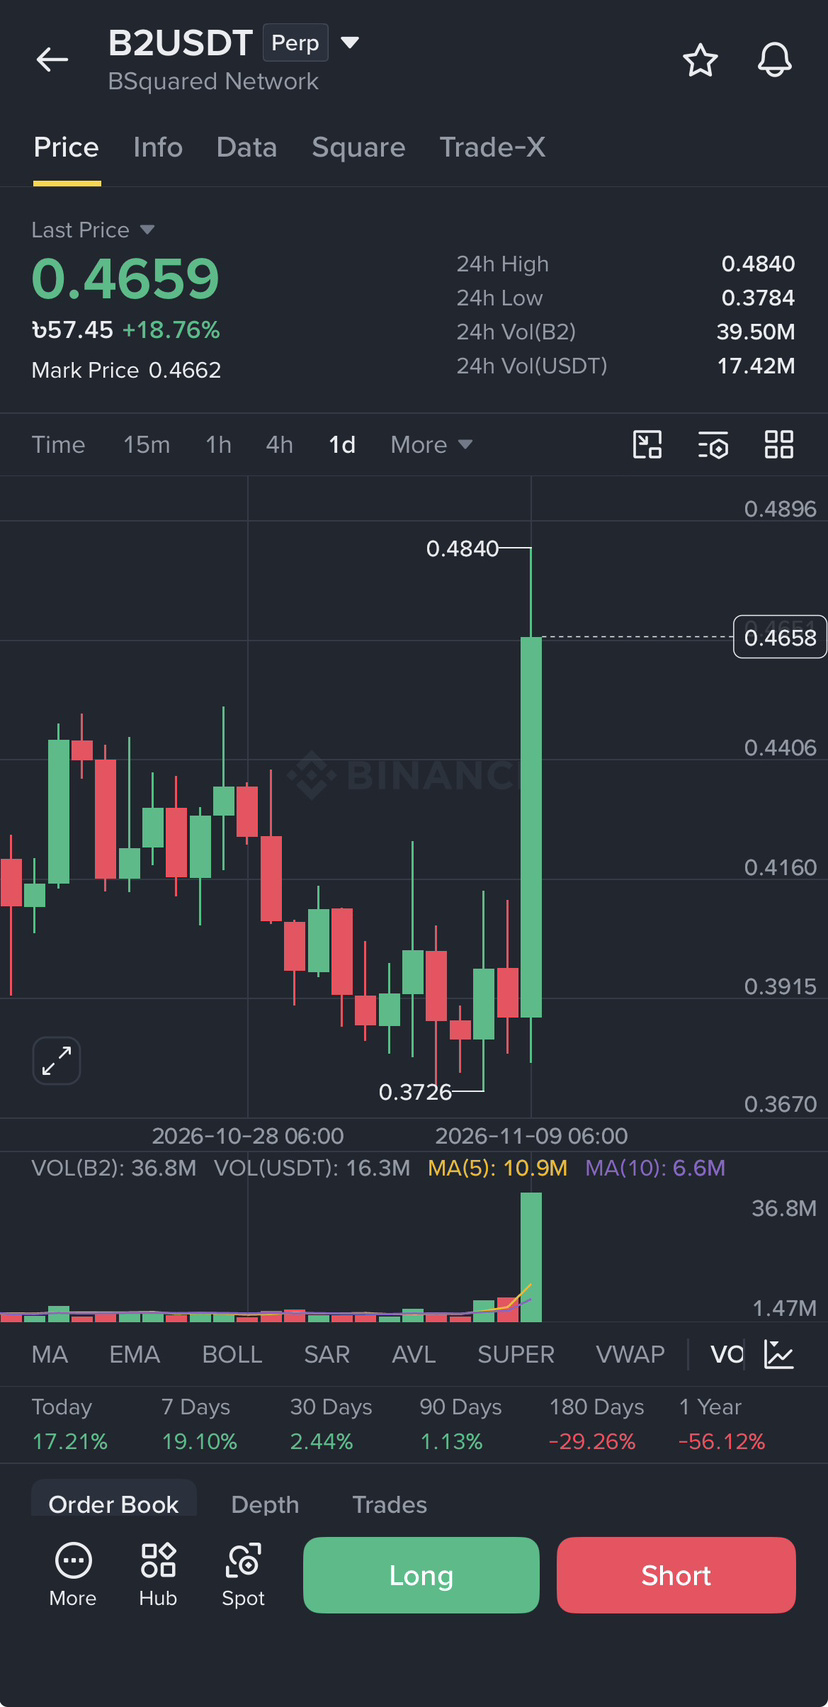
🚨 $B2 USDT Quick Update & Prediction 🚨
$B2 surgers +18.76% to $0.4659, hitting a 24h high of $0.4840 on massive volume.
1. Entry/Support: 0.4400 – 0.4450 retest
2. Target 1: 0.4840
3. Target 2: 0.5000
4. Stop-Loss: 0.4150
If $0.44 holds, expect continuation to $0.50. Drop your targets below! 👇
#B2USDT🔥🔥 #CryptoAnalysis" #BİNANCESQUARE #TradingSignalslb
🚨 $B2 USDT Quick Update & Prediction 🚨
$B2 surgers +18.76% to $0.4659, hitting a 24h high of $0.4840 on massive volume.
1. Entry/Support: 0.4400 – 0.4450 retest
2. Target 1: 0.4840
3. Target 2: 0.5000
4. Stop-Loss: 0.4150
If $0.44 holds, expect continuation to $0.50. Drop your targets below! 👇
#B2USDT🔥🔥 #CryptoAnalysis" #BİNANCESQUARE #TradingSignalslb
$B2 surgers +18.76% to $0.4659, hitting a 24h high of $0.4840 on massive volume.
1. Entry/Support: 0.4400 – 0.4450 retest
2. Target 1: 0.4840
3. Target 2: 0.5000
4. Stop-Loss: 0.4150
If $0.44 holds, expect continuation to $0.50. Drop your targets below! 👇
#B2USDT🔥🔥 #CryptoAnalysis" #BİNANCESQUARE #TradingSignalslb
1
136

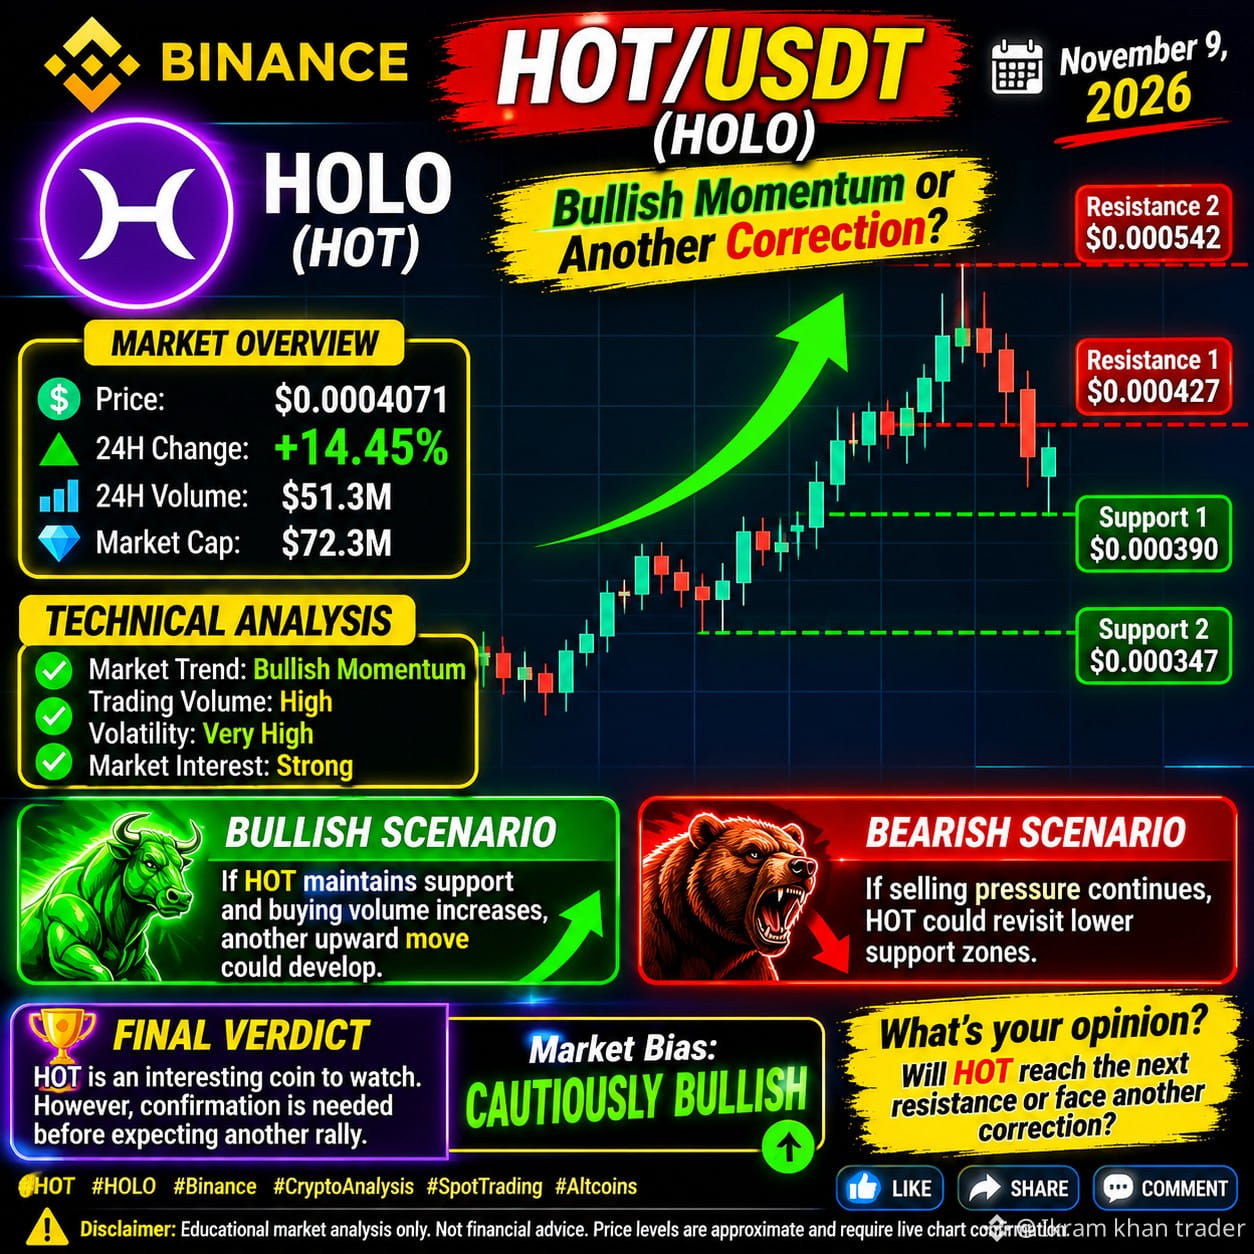
🚀🔥 HOT/USDT – ဈေးကွက်ဆိုင်ရာ ပြည့်စုံသော သုံးသပ်ချက် 🔥🚀
📅 ၂၀၂၆ ခုနှစ်၊ နိုဝင်ဘာ ၉ ရက်
အိတ်ချိန်း: Binance Spot
💎 HOLO (HOT) – အတက်လမ်းကြောင်းအရှိန်အဟုန် ဆက်ရှိမလား၊ နောက်ထပ် ပြန်လည်ကျဆင်းမလား။
📊 ဈေးကွက်အခြေအနေ အကျဉ်းချုပ်
$HOT
💰 ဈေးနှုန်း: $0.0004071
🟢 ၂၄ နာရီအတွင်း ပြောင်းလဲမှု: +14.45%
📈 ၂၄ နာရီအတွင်း ကုန်သွယ်မှုပမာဏ: $51.3M
💎 ဈေးကွက်တန်ဖိုး: $72.3M
🎯 အရေးကြီးသော ဈေးနှုန်းအဆင့်များ
🟢 ပံ့ပိုးမှုအဆင့် ၁: $0.000390
🟢 ပံ့ပိုးမှုအဆင့် ၂: $0.000347
🔴 ခုခံမှုအဆင့် ၁: $0.000427
🔴 ခုခံမှုအဆင့် ၂: $0.000542
📈 နည်းပညာဆိုင်ရာ သုံးသပ်ချက်
🔥 ဈေးကွက်လမ်းကြောင်း: အတက်လမ်းကြောင်းအရှိန်အဟုန်
📊 ကုန်သွယ်မှုပမာဏ: မြင့်မား
⚡ ဈေးနှုန်းအတက်အကျ: အလွန်မြင့်မား
💎 ဈေးကွက်စိတ်ဝင်စားမှု: အားကောင်း
🟢 အတက်လမ်းကြောင်း ဖြစ်နိုင်ခြေ
HOT သည် ပံ့ပိုးမှုအဆင့်ကို ထိန်းထားနိုင်ပြီး ဝယ်ယူမှုပမာဏ တိုးလာပါက နောက်ထပ် ဈေးတက်မှုတစ်ခု ဖြစ်ပေါ်လာနိုင်သည်။
🔴 အကျလမ်းကြောင်း ဖြစ်နိုင်ခြေ
ရောင်းချမှုဖိအား ဆက်လက်ရှိနေပါက HOT သည် ပိုမိုနိမ့်သော ပံ့ပိုးမှုအဆင့်များသို့ ပြန်လည်ရောက်ရှိနိုင်သည်။
🏆 နောက်ဆုံးသုံးသပ်ချက်
HOT သည် စောင့်ကြည့်လေ့လာရန် စိတ်ဝင်စားဖွယ်ကောင်းသော ကွိုင်တစ်ခုဖြစ်သည်။ သို့သော် နောက်ထပ် ဈေးတက်မှုကို မျှော်လင့်မီ အတည်ပြုချက် လိုအပ်သည်။
📊 ဈေးကွက်အမြင်: သတိထား၍ အတက်ဘက် 🟢
💬 သင့်အမြင်က ဘယ်လိုလဲ။
HOT သည် နောက်ထပ် ခုခံမှုအဆင့်ကို ရောက်မလား၊ ဒါမှမဟုတ် နောက်ထပ် ပြန်လည်ကျဆင်းမှု ကြုံရမလား။
👍 LIKE | 🔄 SHARE | 💬 မှတ်ချက်ရေးပါ
#HOT #HOLO #Binance #CryptoAnalysis" ဖြစ်ပြီး #SpotTrading. g #Altcoins #CryptoMarket #TradingSignals
🚀🔥 HOT/USDT – ဈေးကွက်ဆိုင်ရာ ပြည့်စုံသော သုံးသပ်ချက် 🔥🚀
📅 ၂၀၂၆ ခုနှစ်၊ နိုဝင်ဘာ ၉ ရက်
အိတ်ချိန်း: Binance Spot
💎 HOLO (HOT) – အတက်လမ်းကြောင်းအရှိန်အဟုန် ဆက်ရှိမလား၊ နောက်ထပ် ပြန်လည်ကျဆင်းမလား။
📊 ဈေးကွက်အခြေအနေ အကျဉ်းချုပ်
$HOT
💰 ဈေးနှုန်း: $0.0004071
🟢 ၂၄ နာရီအတွင်း ပြောင်းလဲမှု: +14.45%
📈 ၂၄ နာရီအတွင်း ကုန်သွယ်မှုပမာဏ: $51.3M
💎 ဈေးကွက်တန်ဖိုး: $72.3M
🎯 အရေးကြီးသော ဈေးနှုန်းအဆင့်များ
🟢 ပံ့ပိုးမှုအဆင့် ၁: $0.000390
🟢 ပံ့ပိုးမှုအဆင့် ၂: $0.000347
🔴 ခုခံမှုအဆင့် ၁: $0.000427
🔴 ခုခံမှုအဆင့် ၂: $0.000542
📈 နည်းပညာဆိုင်ရာ သုံးသပ်ချက်
🔥 ဈေးကွက်လမ်းကြောင်း: အတက်လမ်းကြောင်းအရှိန်အဟုန်
📊 ကုန်သွယ်မှုပမာဏ: မြင့်မား
⚡ ဈေးနှုန်းအတက်အကျ: အလွန်မြင့်မား
💎 ဈေးကွက်စိတ်ဝင်စားမှု: အားကောင်း
🟢 အတက်လမ်းကြောင်း ဖြစ်နိုင်ခြေ
HOT သည် ပံ့ပိုးမှုအဆင့်ကို ထိန်းထားနိုင်ပြီး ဝယ်ယူမှုပမာဏ တိုးလာပါက နောက်ထပ် ဈေးတက်မှုတစ်ခု ဖြစ်ပေါ်လာနိုင်သည်။
🔴 အကျလမ်းကြောင်း ဖြစ်နိုင်ခြေ
ရောင်းချမှုဖိအား ဆက်လက်ရှိနေပါက HOT သည် ပိုမိုနိမ့်သော ပံ့ပိုးမှုအဆင့်များသို့ ပြန်လည်ရောက်ရှိနိုင်သည်။
🏆 နောက်ဆုံးသုံးသပ်ချက်
HOT သည် စောင့်ကြည့်လေ့လာရန် စိတ်ဝင်စားဖွယ်ကောင်းသော ကွိုင်တစ်ခုဖြစ်သည်။ သို့သော် နောက်ထပ် ဈေးတက်မှုကို မျှော်လင့်မီ အတည်ပြုချက် လိုအပ်သည်။
📊 ဈေးကွက်အမြင်: သတိထား၍ အတက်ဘက် 🟢
💬 သင့်အမြင်က ဘယ်လိုလဲ။
HOT သည် နောက်ထပ် ခုခံမှုအဆင့်ကို ရောက်မလား၊ ဒါမှမဟုတ် နောက်ထပ် ပြန်လည်ကျဆင်းမှု ကြုံရမလား။
👍 LIKE | 🔄 SHARE | 💬 မှတ်ချက်ရေးပါ
#HOT #HOLO #Binance #CryptoAnalysis" ဖြစ်ပြီး #SpotTrading. g #Altcoins #CryptoMarket #TradingSignals
📅 ၂၀၂၆ ခုနှစ်၊ နိုဝင်ဘာ ၉ ရက်
အိတ်ချိန်း: Binance Spot
💎 HOLO (HOT) – အတက်လမ်းကြောင်းအရှိန်အဟုန် ဆက်ရှိမလား၊ နောက်ထပ် ပြန်လည်ကျဆင်းမလား။
📊 ဈေးကွက်အခြေအနေ အကျဉ်းချုပ်
$HOT
💰 ဈေးနှုန်း: $0.0004071
🟢 ၂၄ နာရီအတွင်း ပြောင်းလဲမှု: +14.45%
📈 ၂၄ နာရီအတွင်း ကုန်သွယ်မှုပမာဏ: $51.3M
💎 ဈေးကွက်တန်ဖိုး: $72.3M
🎯 အရေးကြီးသော ဈေးနှုန်းအဆင့်များ
🟢 ပံ့ပိုးမှုအဆင့် ၁: $0.000390
🟢 ပံ့ပိုးမှုအဆင့် ၂: $0.000347
🔴 ခုခံမှုအဆင့် ၁: $0.000427
🔴 ခုခံမှုအဆင့် ၂: $0.000542
📈 နည်းပညာဆိုင်ရာ သုံးသပ်ချက်
🔥 ဈေးကွက်လမ်းကြောင်း: အတက်လမ်းကြောင်းအရှိန်အဟုန်
📊 ကုန်သွယ်မှုပမာဏ: မြင့်မား
⚡ ဈေးနှုန်းအတက်အကျ: အလွန်မြင့်မား
💎 ဈေးကွက်စိတ်ဝင်စားမှု: အားကောင်း
🟢 အတက်လမ်းကြောင်း ဖြစ်နိုင်ခြေ
HOT သည် ပံ့ပိုးမှုအဆင့်ကို ထိန်းထားနိုင်ပြီး ဝယ်ယူမှုပမာဏ တိုးလာပါက နောက်ထပ် ဈေးတက်မှုတစ်ခု ဖြစ်ပေါ်လာနိုင်သည်။
🔴 အကျလမ်းကြောင်း ဖြစ်နိုင်ခြေ
ရောင်းချမှုဖိအား ဆက်လက်ရှိနေပါက HOT သည် ပိုမိုနိမ့်သော ပံ့ပိုးမှုအဆင့်များသို့ ပြန်လည်ရောက်ရှိနိုင်သည်။
🏆 နောက်ဆုံးသုံးသပ်ချက်
HOT သည် စောင့်ကြည့်လေ့လာရန် စိတ်ဝင်စားဖွယ်ကောင်းသော ကွိုင်တစ်ခုဖြစ်သည်။ သို့သော် နောက်ထပ် ဈေးတက်မှုကို မျှော်လင့်မီ အတည်ပြုချက် လိုအပ်သည်။
📊 ဈေးကွက်အမြင်: သတိထား၍ အတက်ဘက် 🟢
💬 သင့်အမြင်က ဘယ်လိုလဲ။
HOT သည် နောက်ထပ် ခုခံမှုအဆင့်ကို ရောက်မလား၊ ဒါမှမဟုတ် နောက်ထပ် ပြန်လည်ကျဆင်းမှု ကြုံရမလား။
👍 LIKE | 🔄 SHARE | 💬 မှတ်ချက်ရေးပါ
#HOT #HOLO #Binance #CryptoAnalysis" ဖြစ်ပြီး #SpotTrading. g #Altcoins #CryptoMarket #TradingSignals
143

·
--
ဘာသာပြန်ဆိုချက် ကြည့်မည်
$NAORIS is setting up a clean 1:3.4 Risk-to-Reward ratio as it holds critical demand levels between $0.085–$0.095.
📍 Watch Zone: Demand retest at $0.085 – $0.095
📈 Targeting: $0.150 | $0.210 | $0.275 (R/R 1:3.4)
{future}(NAORISUSDT)
#BinanceSquareTalks
#altcoins
#CryptoAnalysis"
$NAORIS is setting up a clean 1:3.4 Risk-to-Reward ratio as it holds critical demand levels between $0.085–$0.095.
📍 Watch Zone: Demand retest at $0.085 – $0.095
📈 Targeting: $0.150 | $0.210 | $0.275 (R/R 1:3.4)
#BinanceSquareTalks
#altcoins
#CryptoAnalysis"
📍 Watch Zone: Demand retest at $0.085 – $0.095
📈 Targeting: $0.150 | $0.210 | $0.275 (R/R 1:3.4)
#BinanceSquareTalks
#altcoins
#CryptoAnalysis"
125

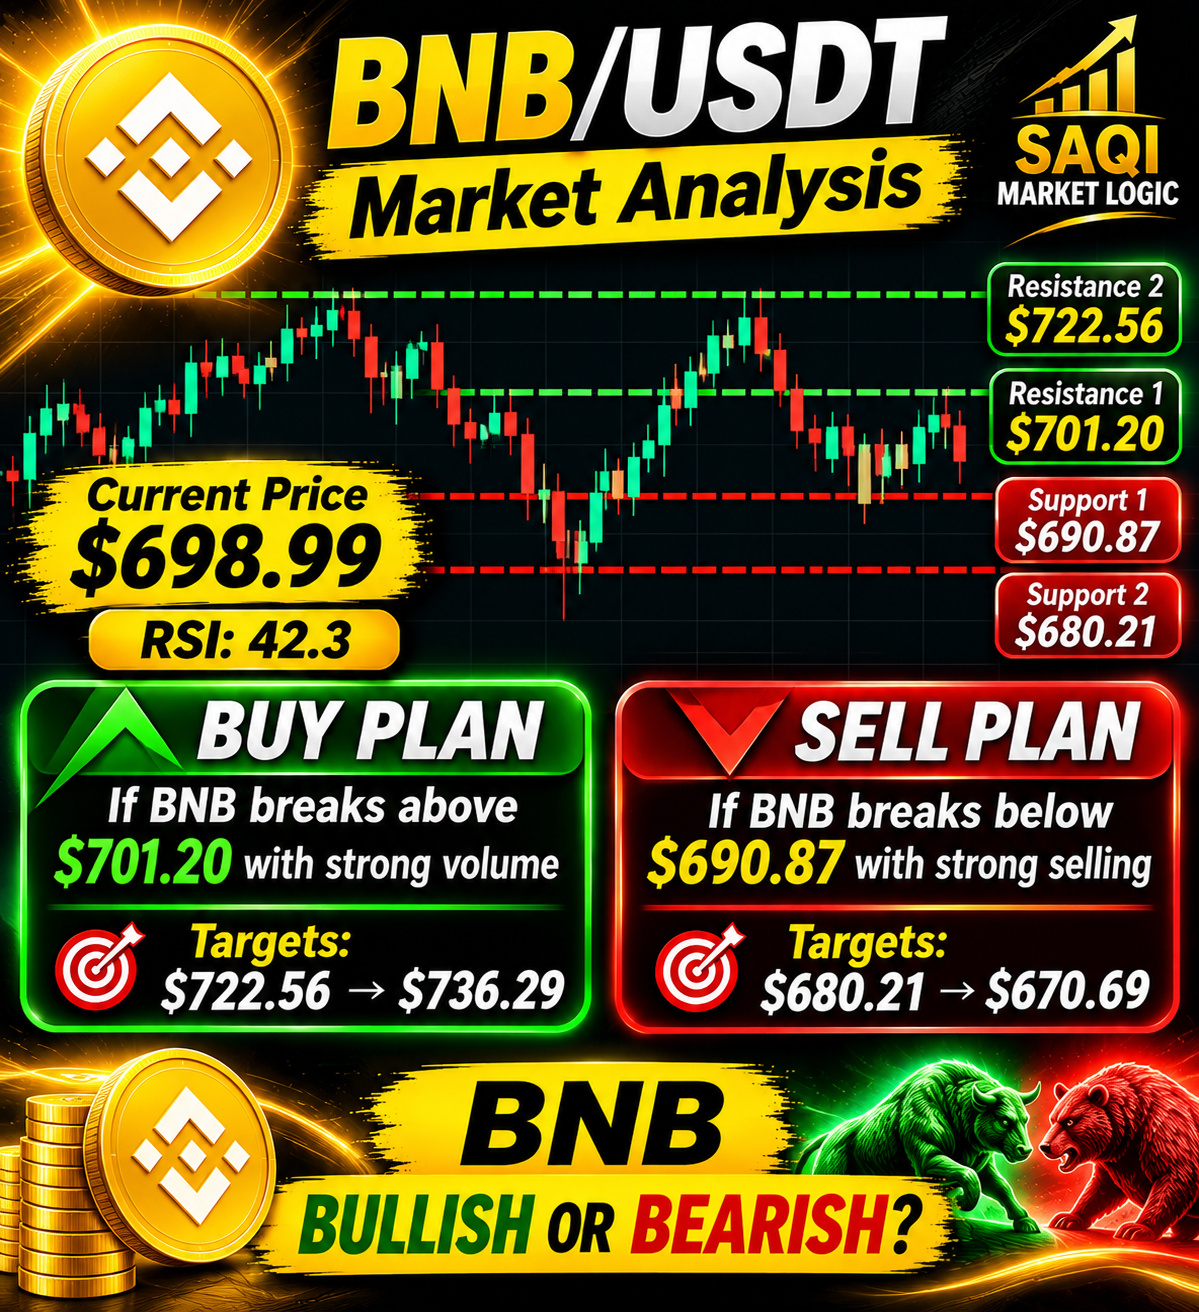
$BNB သည် အရေးကြီးသော အရောင်းအဝယ်ဇုန်တစ်ခုသို့ ချဉ်းကပ်လာနေပါပြီ!
ဝယ်သူတွေက BNB ကို $701.20 အထက်သို့ တွန်းတင်နိုင်မလား၊ ဒါမှမဟုတ် ရောင်းသူတွေက $690.87 အောက်မှာ ထိန်းချုပ်မှုရယူမလား?
📈 ဝယ်မလား၊ 📉 ရောင်းမလား? သင့်ခန့်မှန်းချက်က ဘာလဲ?
{future}(BNBUSDT)
#BNBbull #BNBU #Binance #CryptoAnalysis" #TechnicalAnalysis
$BNB သည် အရေးကြီးသော အရောင်းအဝယ်ဇုန်တစ်ခုသို့ ချဉ်းကပ်လာနေပါပြီ!
ဝယ်သူတွေက BNB ကို $701.20 အထက်သို့ တွန်းတင်နိုင်မလား၊ ဒါမှမဟုတ် ရောင်းသူတွေက $690.87 အောက်မှာ ထိန်းချုပ်မှုရယူမလား?
📈 ဝယ်မလား၊ 📉 ရောင်းမလား? သင့်ခန့်မှန်းချက်က ဘာလဲ?
#BNBbull #BNBU #Binance #CryptoAnalysis" #TechnicalAnalysis
ဝယ်သူတွေက BNB ကို $701.20 အထက်သို့ တွန်းတင်နိုင်မလား၊ ဒါမှမဟုတ် ရောင်းသူတွေက $690.87 အောက်မှာ ထိန်းချုပ်မှုရယူမလား?
📈 ဝယ်မလား၊ 📉 ရောင်းမလား? သင့်ခန့်မှန်းချက်က ဘာလဲ?
#BNBbull #BNBU #Binance #CryptoAnalysis" #TechnicalAnalysis
1
74

·
--
တက်ရိပ်ရှိသည်
🚨 HAMSTER KOMBAT ($HMSTR
): ပြန်လည်နာလန်ထူလာတော့မလား? 🐹🔥
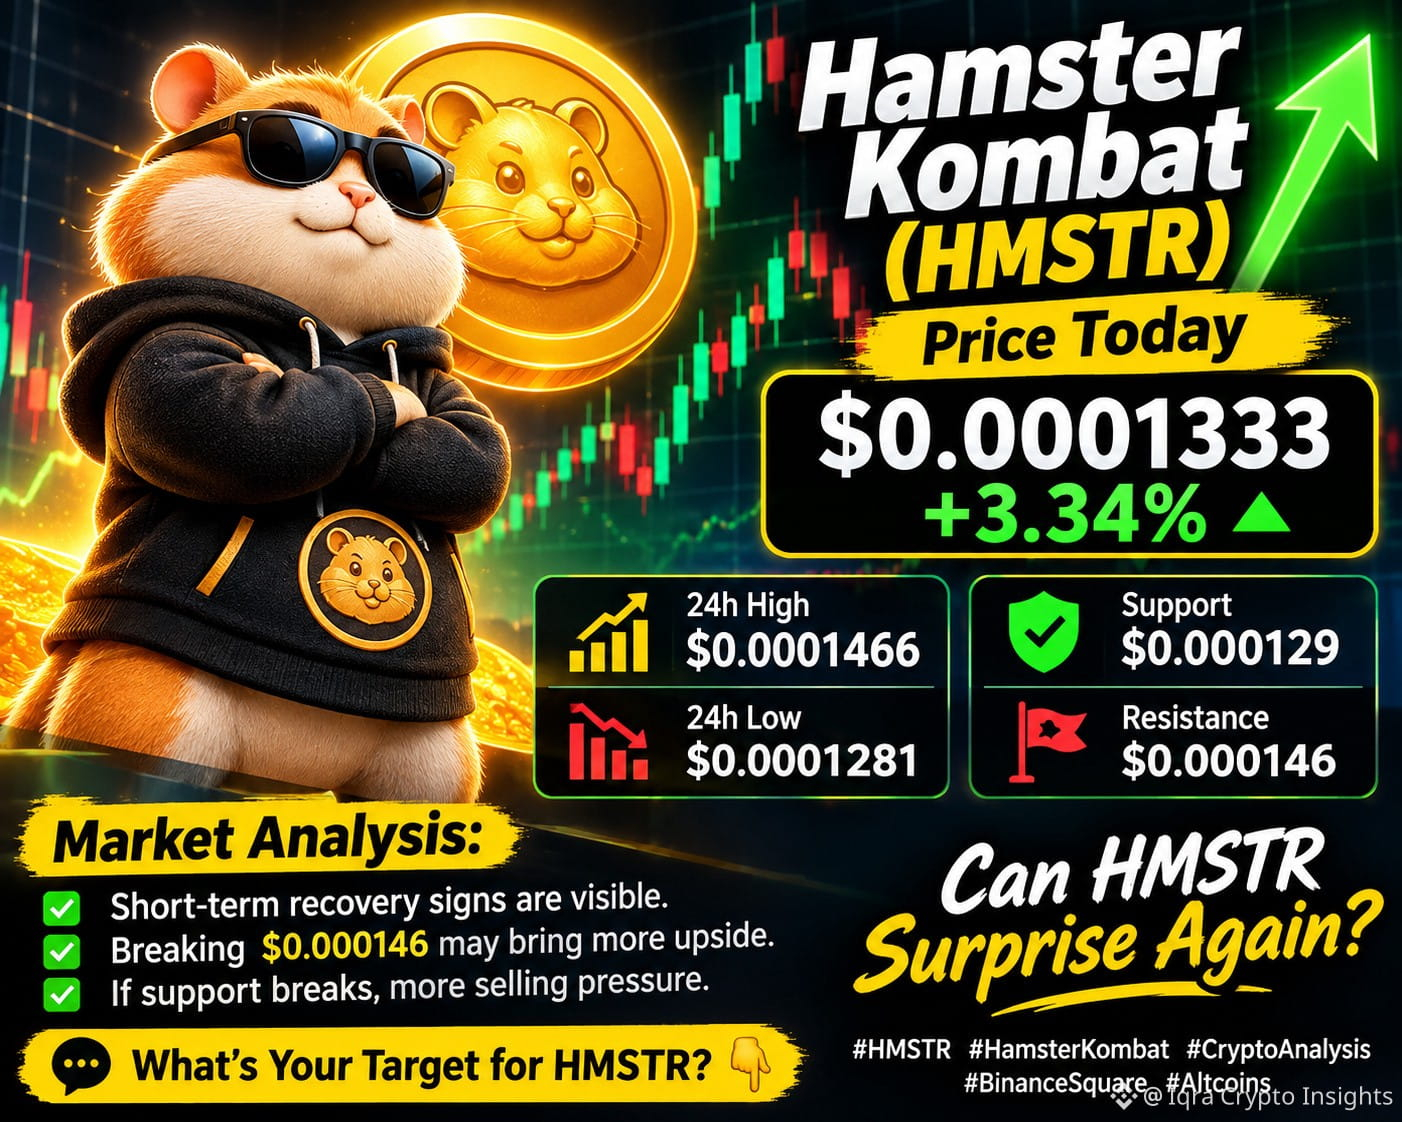
Hamster Kombat သည် ရေတိုပြန်လည်နာလန်ထူလာမည့် လက္ခဏာများ ပြသနေသည်!
💰 လက်ရှိဈေးနှုန်း: $0.0001333
📈 ၂၄ နာရီအတွင်း ပြောင်းလဲမှု: +3.34%
{future}(HMSTRUSDT)
🔍 ဈေးကွက်သုံးသပ်ချက်:
- ထောက်ခံဈေး: $0.000129
- ခုခံဈေး: $0.000146
- ခုခံဈေးကို ကျော်တက်နိုင်ပါက အတက်ဘက်အရှိန်အဟုန်သစ် ရရှိလာနိုင်သည်။
- ထောက်ခံဈေးအောက် ကျဆင်းပါက ရောင်းအားဖိအား ပိုမိုမြင့်တက်လာနိုင်သည်။
⚠️ ကုန်သည်များအနေဖြင့် အရောင်းအဝယ်မလုပ်မီ ပမာဏနှင့် ဈေးနှုန်းလှုပ်ရှားမှုကို စောင့်ကြည့်သင့်သည်။
🐹 HMSTR က ဈေးကွက်ကို နောက်တစ်ကြိမ် အံ့အားသင့်စေနိုင်မလား?
ဒီနိုဝင်ဘာလအတွက် HMSTR ၏ သင့်ဈေးနှုန်းပစ်မှတ်က ဘယ်လောက်လဲ? 👇
#HMSTR #hamsterkombat24 #CryptoAnalysis"
🚨 HAMSTER KOMBAT ($HMSTR
): ပြန်လည်နာလန်ထူလာတော့မလား? 🐹🔥
Hamster Kombat သည် ရေတိုပြန်လည်နာလန်ထူလာမည့် လက္ခဏာများ ပြသနေသည်!
💰 လက်ရှိဈေးနှုန်း: $0.0001333
📈 ၂၄ နာရီအတွင်း ပြောင်းလဲမှု: +3.34%
🔍 ဈေးကွက်သုံးသပ်ချက်:
- ထောက်ခံဈေး: $0.000129
- ခုခံဈေး: $0.000146
- ခုခံဈေးကို ကျော်တက်နိုင်ပါက အတက်ဘက်အရှိန်အဟုန်သစ် ရရှိလာနိုင်သည်။
- ထောက်ခံဈေးအောက် ကျဆင်းပါက ရောင်းအားဖိအား ပိုမိုမြင့်တက်လာနိုင်သည်။
⚠️ ကုန်သည်များအနေဖြင့် အရောင်းအဝယ်မလုပ်မီ ပမာဏနှင့် ဈေးနှုန်းလှုပ်ရှားမှုကို စောင့်ကြည့်သင့်သည်။
🐹 HMSTR က ဈေးကွက်ကို နောက်တစ်ကြိမ် အံ့အားသင့်စေနိုင်မလား?
ဒီနိုဝင်ဘာလအတွက် HMSTR ၏ သင့်ဈေးနှုန်းပစ်မှတ်က ဘယ်လောက်လဲ? 👇
#HMSTR #hamsterkombat24 #CryptoAnalysis"
): ပြန်လည်နာလန်ထူလာတော့မလား? 🐹🔥
Hamster Kombat သည် ရေတိုပြန်လည်နာလန်ထူလာမည့် လက္ခဏာများ ပြသနေသည်!
💰 လက်ရှိဈေးနှုန်း: $0.0001333
📈 ၂၄ နာရီအတွင်း ပြောင်းလဲမှု: +3.34%
🔍 ဈေးကွက်သုံးသပ်ချက်:
- ထောက်ခံဈေး: $0.000129
- ခုခံဈေး: $0.000146
- ခုခံဈေးကို ကျော်တက်နိုင်ပါက အတက်ဘက်အရှိန်အဟုန်သစ် ရရှိလာနိုင်သည်။
- ထောက်ခံဈေးအောက် ကျဆင်းပါက ရောင်းအားဖိအား ပိုမိုမြင့်တက်လာနိုင်သည်။
⚠️ ကုန်သည်များအနေဖြင့် အရောင်းအဝယ်မလုပ်မီ ပမာဏနှင့် ဈေးနှုန်းလှုပ်ရှားမှုကို စောင့်ကြည့်သင့်သည်။
🐹 HMSTR က ဈေးကွက်ကို နောက်တစ်ကြိမ် အံ့အားသင့်စေနိုင်မလား?
ဒီနိုဝင်ဘာလအတွက် HMSTR ၏ သင့်ဈေးနှုန်းပစ်မှတ်က ဘယ်လောက်လဲ? 👇
#HMSTR #hamsterkombat24 #CryptoAnalysis"
1
497

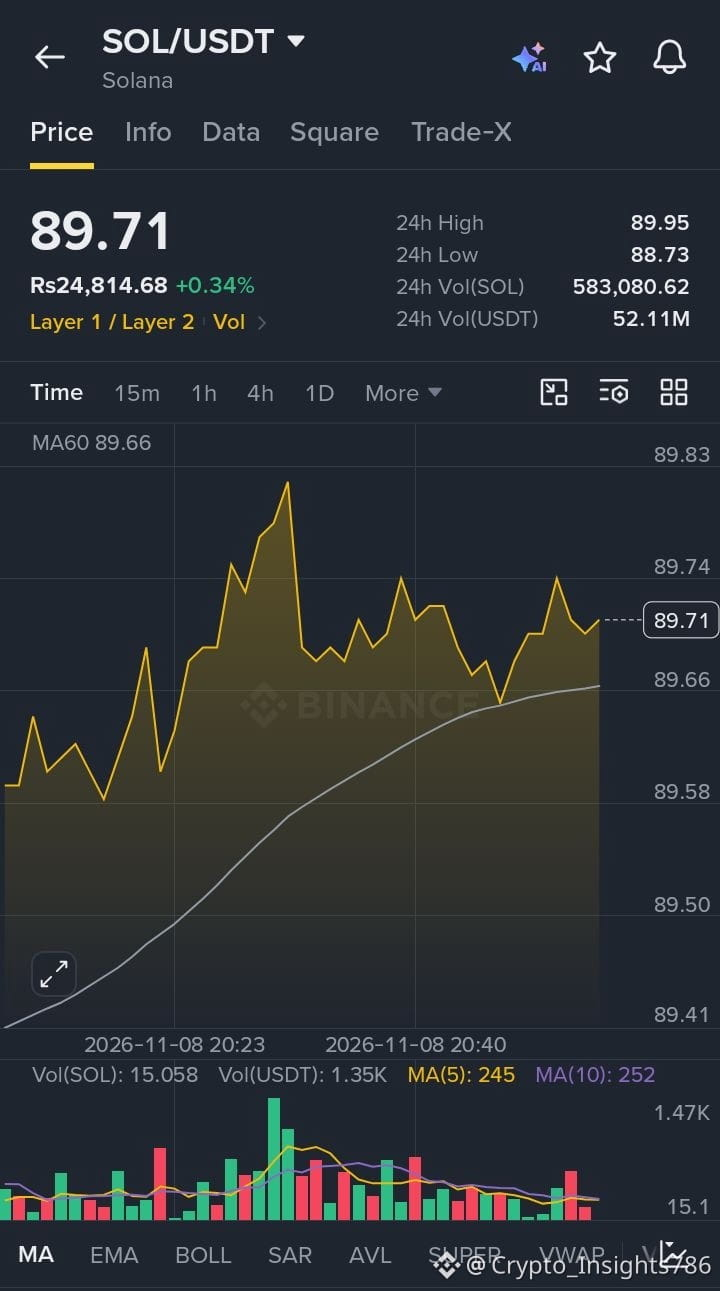
$SOL လက်ရှိဈေးနှုန်း: $89.71
📉 ဈေးကွက်လမ်းကြောင်း: ကျဆင်းနေ
🔹 ပံ့ပိုးမှု: $88 – $85 🔹 ခုခံမှု: $91 – $93
$SOL သည် ရောင်းအားဖိအားနှင့် ရင်ဆိုင်နေရပြီး အဓိကရွေ့လျားပျမ်းမျှတန်ဖိုးများအောက်တွင် အရောင်းအဝယ်ဖြစ်နေသည်။ RSI သည် 30 အနီးတွင်ရှိပြီး အလွန်အကျွံရောင်းချထားသည့် အခြေအနေကို ညွှန်ပြနေသည်။ ဝယ်သူများက $88 ပံ့ပိုးမှုဇုန်ကို ကာကွယ်ပါက $93 သို့ ပြန်တက်နိုင်သည်။ သို့သော် $88 အောက်သို့ ကျဆင်းသွားပါက ထပ်မံကျဆင်းနိုင်သည်။
🎯 အလားအလာ: ကာလတိုအတွင်း ကျဆင်းနိုင်သည်။ အတက်လမ်းကြောင်းအရှိန်အဟုန်ကို မျှော်လင့်မီ $93 အထက်သို့ အားကောင်းစွာ ဖောက်ထွက်မှုရှိမရှိ စောင့်ကြည့်ပါ။
#solana #sol #CryptoAnalysis" #BİNANCESQUARE #CryptoMarket
{spot}(SOLUSDT)
$SOL လက်ရှိဈေးနှုန်း: $89.71
📉 ဈေးကွက်လမ်းကြောင်း: ကျဆင်းနေ
🔹 ပံ့ပိုးမှု: $88 – $85 🔹 ခုခံမှု: $91 – $93
$SOL သည် ရောင်းအားဖိအားနှင့် ရင်ဆိုင်နေရပြီး အဓိကရွေ့လျားပျမ်းမျှတန်ဖိုးများအောက်တွင် အရောင်းအဝယ်ဖြစ်နေသည်။ RSI သည် 30 အနီးတွင်ရှိပြီး အလွန်အကျွံရောင်းချထားသည့် အခြေအနေကို ညွှန်ပြနေသည်။ ဝယ်သူများက $88 ပံ့ပိုးမှုဇုန်ကို ကာကွယ်ပါက $93 သို့ ပြန်တက်နိုင်သည်။ သို့သော် $88 အောက်သို့ ကျဆင်းသွားပါက ထပ်မံကျဆင်းနိုင်သည်။
🎯 အလားအလာ: ကာလတိုအတွင်း ကျဆင်းနိုင်သည်။ အတက်လမ်းကြောင်းအရှိန်အဟုန်ကို မျှော်လင့်မီ $93 အထက်သို့ အားကောင်းစွာ ဖောက်ထွက်မှုရှိမရှိ စောင့်ကြည့်ပါ။
#solana #sol #CryptoAnalysis" #BİNANCESQUARE #CryptoMarket
📉 ဈေးကွက်လမ်းကြောင်း: ကျဆင်းနေ
🔹 ပံ့ပိုးမှု: $88 – $85 🔹 ခုခံမှု: $91 – $93
$SOL သည် ရောင်းအားဖိအားနှင့် ရင်ဆိုင်နေရပြီး အဓိကရွေ့လျားပျမ်းမျှတန်ဖိုးများအောက်တွင် အရောင်းအဝယ်ဖြစ်နေသည်။ RSI သည် 30 အနီးတွင်ရှိပြီး အလွန်အကျွံရောင်းချထားသည့် အခြေအနေကို ညွှန်ပြနေသည်။ ဝယ်သူများက $88 ပံ့ပိုးမှုဇုန်ကို ကာကွယ်ပါက $93 သို့ ပြန်တက်နိုင်သည်။ သို့သော် $88 အောက်သို့ ကျဆင်းသွားပါက ထပ်မံကျဆင်းနိုင်သည်။
🎯 အလားအလာ: ကာလတိုအတွင်း ကျဆင်းနိုင်သည်။ အတက်လမ်းကြောင်းအရှိန်အဟုန်ကို မျှော်လင့်မီ $93 အထက်သို့ အားကောင်းစွာ ဖောက်ထွက်မှုရှိမရှိ စောင့်ကြည့်ပါ။
#solana #sol #CryptoAnalysis" #BİNANCESQUARE #CryptoMarket
41

·
--
ဘာသာပြန်ဆိုချက် ကြည့်မည်
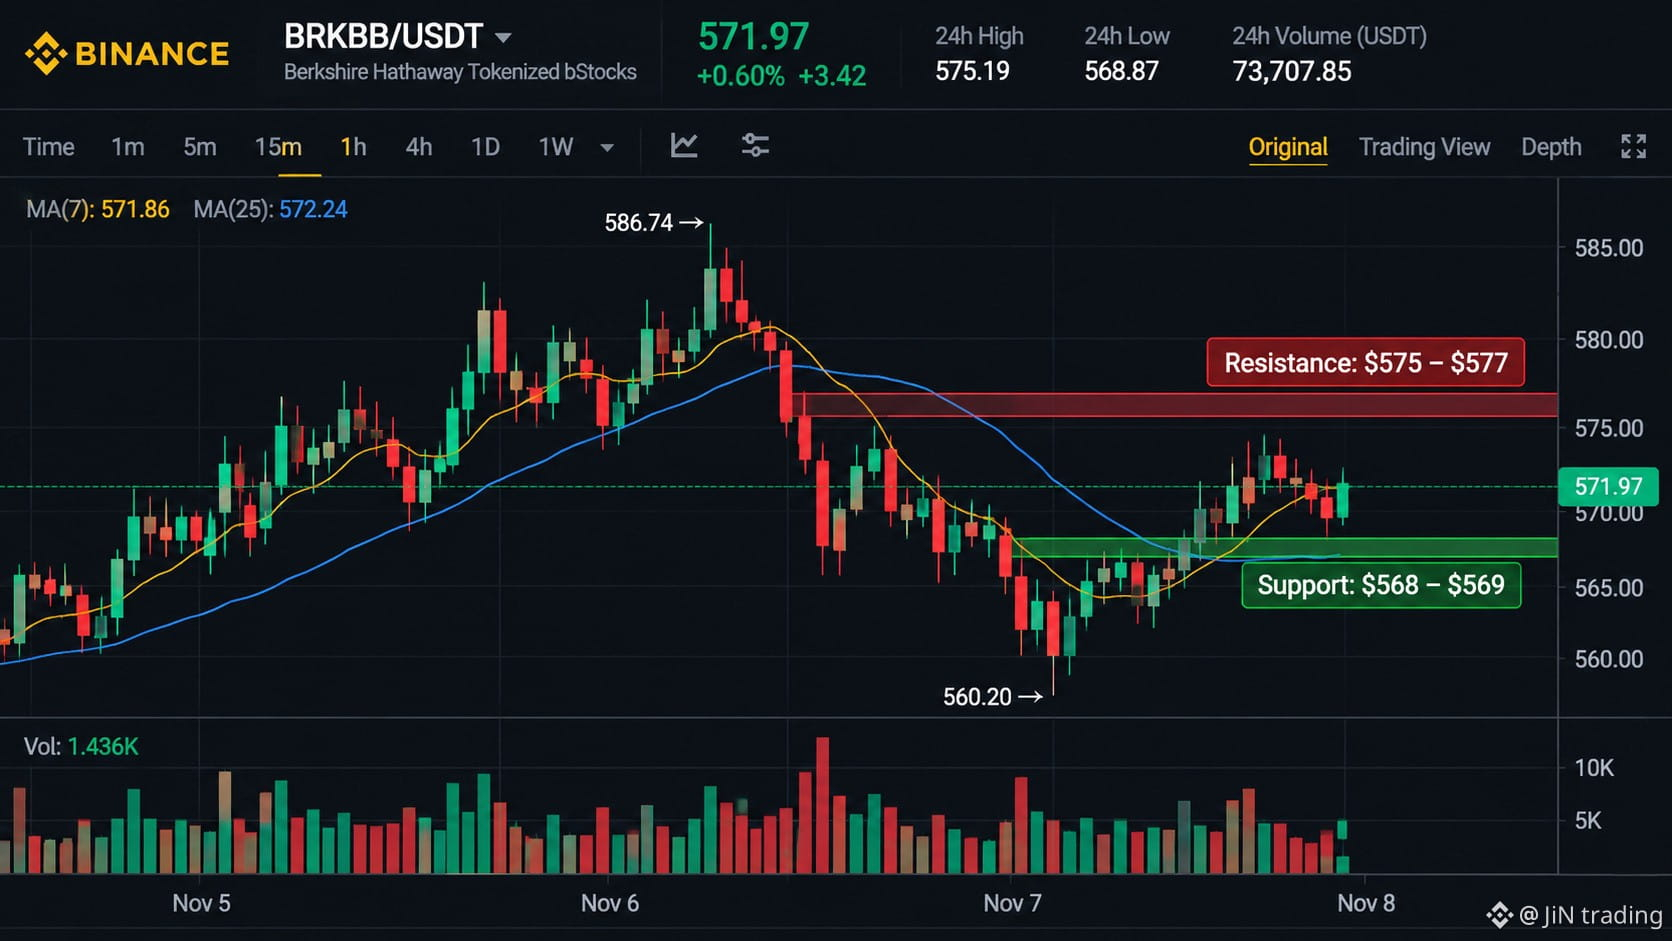
🚨 $BRKBB PRICE ANALYSIS: IS BERKSHIRE HEADING TOWARD A NEW HIGH?
Berkshire Hathaway Tokenized bStocks (BRKBB) is trading around $571.97, showing a modest 24-hour recovery.
After recently reaching an all-time high of $586.74, the token is now approaching an important resistance area.
📊 KEY MARKET LEVELS
🟢 Immediate Support: $568 – $569
🟢 Stronger Support: $560
🔴 Immediate Resistance: $575 – $577
🎯 Major Resistance: $586 – $587
📈 BULLISH SCENARIO
If $BRKBB breaks above $577 with stronger buying volume, a retest of $586–$587 could be possible.
📉 BEARISH SCENARIO
If the price fails to hold $568, further downside toward $560 may come into focus.
MY MARKET VIEW:
$BRKBB is showing signs of consolidation after its recent rally. I'm watching the $568 support and $577 resistance levels before considering the next directional move.
⚠️ Trading volume and liquidity deserve special attention because BRKBB has a relatively small market size.
👇 WHAT'S YOUR PREDICTION?
1️⃣ BRKBB breaks $587 🚀
2️⃣ BRKBB drops below $560 📉
3️⃣ BRKBB continues consolidating
Share your analysis below!
#BRKBB #BerkshireHathaway #BinanceSquare #CryptoAnalysis" #Trading
🚨 $BRKBB PRICE ANALYSIS: IS BERKSHIRE HEADING TOWARD A NEW HIGH?
Berkshire Hathaway Tokenized bStocks (BRKBB) is trading around $571.97, showing a modest 24-hour recovery.
After recently reaching an all-time high of $586.74, the token is now approaching an important resistance area.
📊 KEY MARKET LEVELS
🟢 Immediate Support: $568 – $569
🟢 Stronger Support: $560
🔴 Immediate Resistance: $575 – $577
🎯 Major Resistance: $586 – $587
📈 BULLISH SCENARIO
If $BRKBB breaks above $577 with stronger buying volume, a retest of $586–$587 could be possible.
📉 BEARISH SCENARIO
If the price fails to hold $568, further downside toward $560 may come into focus.
MY MARKET VIEW:
$BRKBB is showing signs of consolidation after its recent rally. I'm watching the $568 support and $577 resistance levels before considering the next directional move.
⚠️ Trading volume and liquidity deserve special attention because BRKBB has a relatively small market size.
👇 WHAT'S YOUR PREDICTION?
1️⃣ BRKBB breaks $587 🚀
2️⃣ BRKBB drops below $560 📉
3️⃣ BRKBB continues consolidating
Share your analysis below!
#BRKBB #BerkshireHathaway #BinanceSquare #CryptoAnalysis" #Trading
Berkshire Hathaway Tokenized bStocks (BRKBB) is trading around $571.97, showing a modest 24-hour recovery.
After recently reaching an all-time high of $586.74, the token is now approaching an important resistance area.
📊 KEY MARKET LEVELS
🟢 Immediate Support: $568 – $569
🟢 Stronger Support: $560
🔴 Immediate Resistance: $575 – $577
🎯 Major Resistance: $586 – $587
📈 BULLISH SCENARIO
If $BRKBB breaks above $577 with stronger buying volume, a retest of $586–$587 could be possible.
📉 BEARISH SCENARIO
If the price fails to hold $568, further downside toward $560 may come into focus.
MY MARKET VIEW:
$BRKBB is showing signs of consolidation after its recent rally. I'm watching the $568 support and $577 resistance levels before considering the next directional move.
⚠️ Trading volume and liquidity deserve special attention because BRKBB has a relatively small market size.
👇 WHAT'S YOUR PREDICTION?
1️⃣ BRKBB breaks $587 🚀
2️⃣ BRKBB drops below $560 📉
3️⃣ BRKBB continues consolidating
Share your analysis below!
#BRKBB #BerkshireHathaway #BinanceSquare #CryptoAnalysis" #Trading
95
{spot}(ETHUSDT)
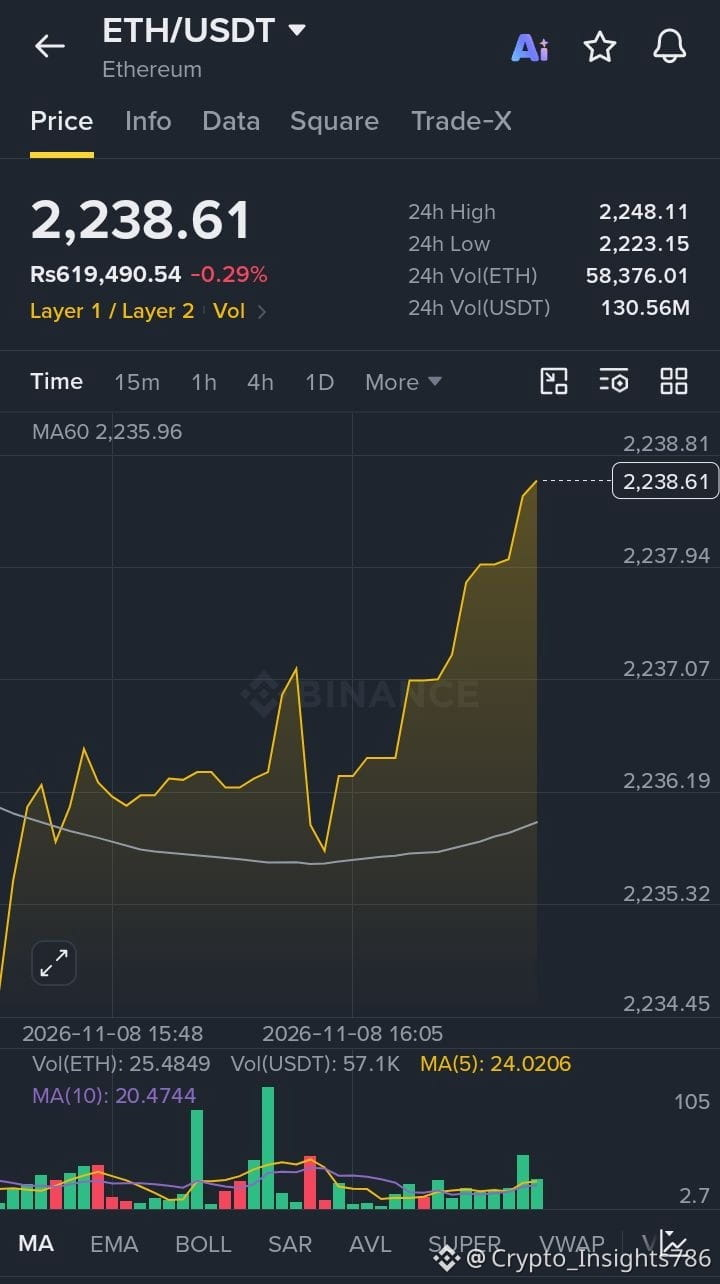
$ETH လက်ရှိဈေးနှုန်း: $2,238
📉 ဈေးကွက်အလားအလာ: $ETH သည် $2,300 သို့ ပြန်လည်တက်ရန် ရုန်းကန်နေရသဖြင့် အကျဘက်ဖိအား ဆက်လက်ရှိနေသည်။
🔹 ထောက်ပံ့ဈေး: $2,220 🔹 ခုခံဈေး: $2,300 🔹 နောက်ပစ်မှတ်: $2,350
အလားအလာ: $ETH သည် $2,220 အထက်တွင် ဆက်ထိန်းထားနိုင်ပါက $2,300–$2,350 သို့ ပြန်လည်တက်လာနိုင်သည်။ ထောက်ပံ့ဈေးအောက်သို့ ကျဆင်းပါက ထပ်မံကျဆင်းနိုင်သည်။
#Ethereum #ETH #CryptoAnalysis" #BinanceSquare #CryptoMarketAlert
$ETH လက်ရှိဈေးနှုန်း: $2,238
📉 ဈေးကွက်အလားအလာ: $ETH သည် $2,300 သို့ ပြန်လည်တက်ရန် ရုန်းကန်နေရသဖြင့် အကျဘက်ဖိအား ဆက်လက်ရှိနေသည်။
🔹 ထောက်ပံ့ဈေး: $2,220 🔹 ခုခံဈေး: $2,300 🔹 နောက်ပစ်မှတ်: $2,350
အလားအလာ: $ETH သည် $2,220 အထက်တွင် ဆက်ထိန်းထားနိုင်ပါက $2,300–$2,350 သို့ ပြန်လည်တက်လာနိုင်သည်။ ထောက်ပံ့ဈေးအောက်သို့ ကျဆင်းပါက ထပ်မံကျဆင်းနိုင်သည်။
#Ethereum #ETH #CryptoAnalysis" #BinanceSquare #CryptoMarketAlert
📉 ဈေးကွက်အလားအလာ: $ETH သည် $2,300 သို့ ပြန်လည်တက်ရန် ရုန်းကန်နေရသဖြင့် အကျဘက်ဖိအား ဆက်လက်ရှိနေသည်။
🔹 ထောက်ပံ့ဈေး: $2,220 🔹 ခုခံဈေး: $2,300 🔹 နောက်ပစ်မှတ်: $2,350
အလားအလာ: $ETH သည် $2,220 အထက်တွင် ဆက်ထိန်းထားနိုင်ပါက $2,300–$2,350 သို့ ပြန်လည်တက်လာနိုင်သည်။ ထောက်ပံ့ဈေးအောက်သို့ ကျဆင်းပါက ထပ်မံကျဆင်းနိုင်သည်။
#Ethereum #ETH #CryptoAnalysis" #BinanceSquare #CryptoMarketAlert
96

·
--
တက်ရိပ်ရှိသည်
🚀 ETHEREUM (ETH) – အတက်ဘက်သို့ ခွဲထွက်မှု ဖြစ်လာတော့မလား?
$ETH
{future}(ETHUSDT)
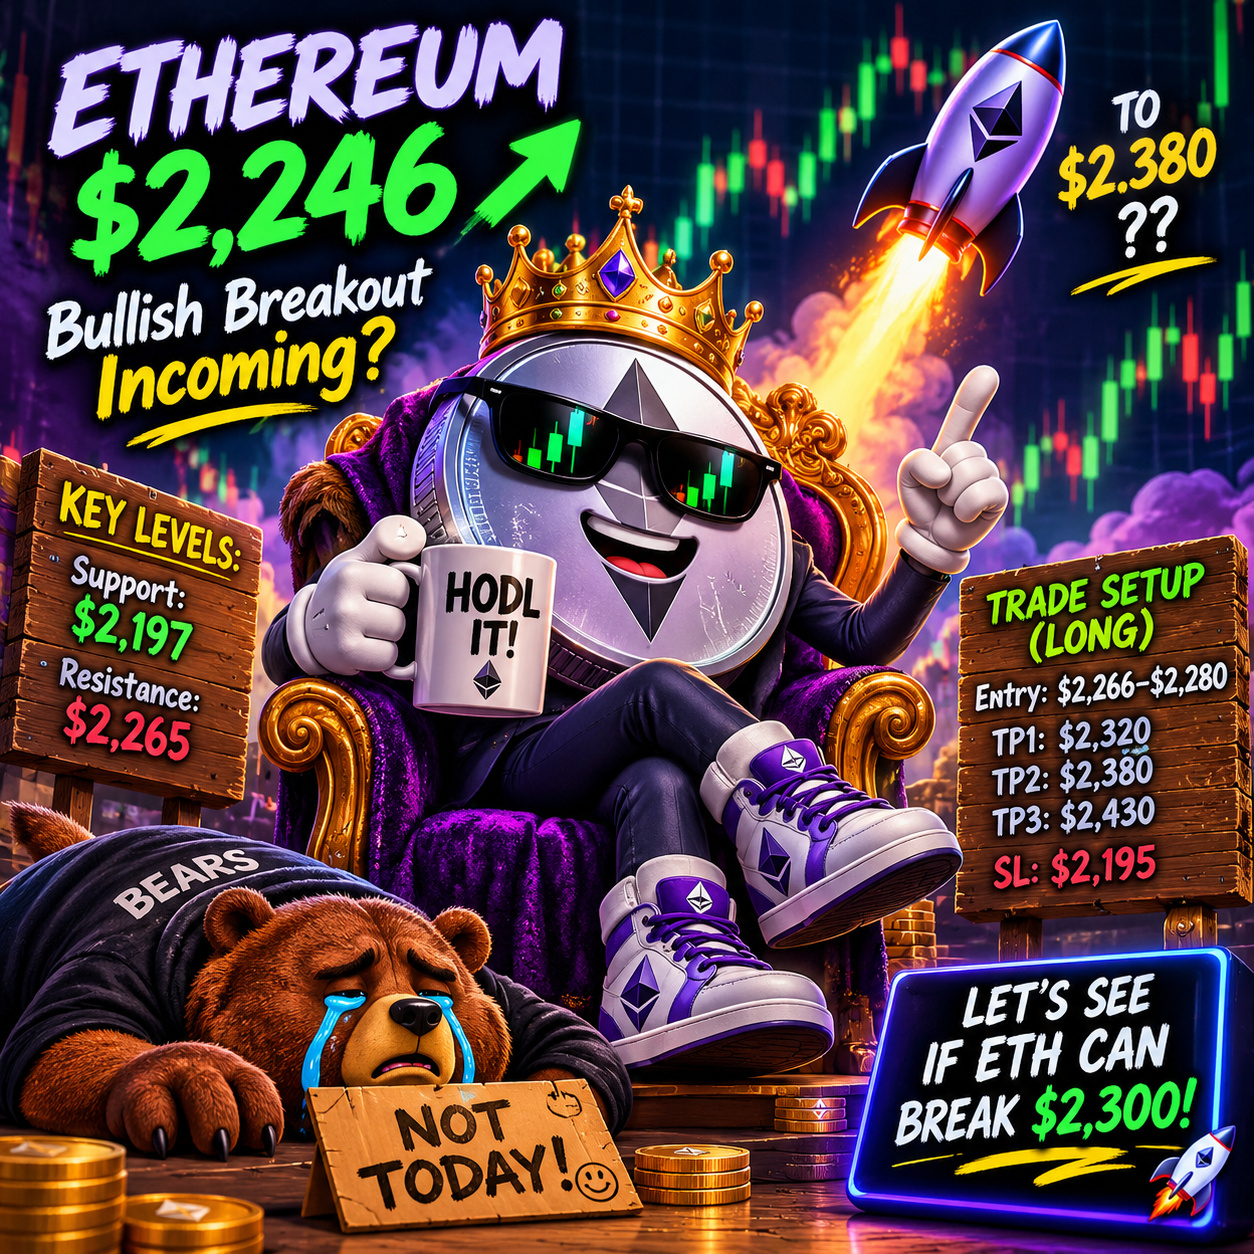
ETH သည် $2,246 ဝန်းကျင်တွင် အရောင်းအဝယ်ဖြစ်နေသည်။ ဈေးကွက်တွင် ရောထွေးသောအချက်ပြမှုများ ပြသနေသော်လည်း ခွဲထွက်မှုတစ်ခု ဖြစ်လာပါက အတက်ဘက်အရှိန်အဟုန်သစ် ရရှိနိုင်သည်! 👀
📊 အရောင်းအဝယ်အစီအစဉ် (LONG)
- 🟢 ဝင်ရောက်ရန်: $2,266–$2,280 (ခွဲထွက်ပြီး ပြန်လည်စမ်းသပ်ပြီးနောက်)
- 🎯 TP1: $2,320
- 🎯 TP2: $2,380
- 🎯 TP3: $2,430
- 🛑 Stop Loss: $2,195
အရေးကြီးသော ဈေးနှုန်းအဆင့်များ:
- ပံ့ပိုးမှု: $2,197
- ခုခံမှု: $2,265
🔥 ကျွန်ုပ်၏မဟာဗျူဟာ: $2,265 အထက်တွင် အတည်ပြုချက်ရသည်အထိ စောင့်ပါ။ ဈေးတက်နေချိန် နောက်ကလိုက်မဝယ်ပါနှင့်!
ဒီတစ်ပတ်အတွင်း ETH က $2,300 ကို ကျော်တက်နိုင်မယ်လို့ ထင်ပါသလား? 👇
#ETH #Ethereum #cryptotrading #BinanceSquareFamily #altcoins #CryptoAnalysis"
ဈေးနှုန်းနှင့် အဆင့်များသည် အနီးစပ်ဆုံးအချိန်ကာလတစ်ခု၏ အခြေအနေကို ဖော်ပြခြင်းသာဖြစ်ပြီး တိုက်ရိုက်အတည်ပြုထားခြင်း မဟုတ်ပါ။ သင့်လျော်သော စွန့်စားမှုစီမံခန့်ခွဲမှုဖြင့် အရောင်းအဝယ်လုပ်ပါ။
🚀 ETHEREUM (ETH) – အတက်ဘက်သို့ ခွဲထွက်မှု ဖြစ်လာတော့မလား?
$ETH
ETH သည် $2,246 ဝန်းကျင်တွင် အရောင်းအဝယ်ဖြစ်နေသည်။ ဈေးကွက်တွင် ရောထွေးသောအချက်ပြမှုများ ပြသနေသော်လည်း ခွဲထွက်မှုတစ်ခု ဖြစ်လာပါက အတက်ဘက်အရှိန်အဟုန်သစ် ရရှိနိုင်သည်! 👀
📊 အရောင်းအဝယ်အစီအစဉ် (LONG)
- 🟢 ဝင်ရောက်ရန်: $2,266–$2,280 (ခွဲထွက်ပြီး ပြန်လည်စမ်းသပ်ပြီးနောက်)
- 🎯 TP1: $2,320
- 🎯 TP2: $2,380
- 🎯 TP3: $2,430
- 🛑 Stop Loss: $2,195
အရေးကြီးသော ဈေးနှုန်းအဆင့်များ:
- ပံ့ပိုးမှု: $2,197
- ခုခံမှု: $2,265
🔥 ကျွန်ုပ်၏မဟာဗျူဟာ: $2,265 အထက်တွင် အတည်ပြုချက်ရသည်အထိ စောင့်ပါ။ ဈေးတက်နေချိန် နောက်ကလိုက်မဝယ်ပါနှင့်!
ဒီတစ်ပတ်အတွင်း ETH က $2,300 ကို ကျော်တက်နိုင်မယ်လို့ ထင်ပါသလား? 👇
#ETH #Ethereum #cryptotrading #BinanceSquareFamily #altcoins #CryptoAnalysis"
ဈေးနှုန်းနှင့် အဆင့်များသည် အနီးစပ်ဆုံးအချိန်ကာလတစ်ခု၏ အခြေအနေကို ဖော်ပြခြင်းသာဖြစ်ပြီး တိုက်ရိုက်အတည်ပြုထားခြင်း မဟုတ်ပါ။ သင့်လျော်သော စွန့်စားမှုစီမံခန့်ခွဲမှုဖြင့် အရောင်းအဝယ်လုပ်ပါ။
$ETH
ETH သည် $2,246 ဝန်းကျင်တွင် အရောင်းအဝယ်ဖြစ်နေသည်။ ဈေးကွက်တွင် ရောထွေးသောအချက်ပြမှုများ ပြသနေသော်လည်း ခွဲထွက်မှုတစ်ခု ဖြစ်လာပါက အတက်ဘက်အရှိန်အဟုန်သစ် ရရှိနိုင်သည်! 👀
📊 အရောင်းအဝယ်အစီအစဉ် (LONG)
- 🟢 ဝင်ရောက်ရန်: $2,266–$2,280 (ခွဲထွက်ပြီး ပြန်လည်စမ်းသပ်ပြီးနောက်)
- 🎯 TP1: $2,320
- 🎯 TP2: $2,380
- 🎯 TP3: $2,430
- 🛑 Stop Loss: $2,195
အရေးကြီးသော ဈေးနှုန်းအဆင့်များ:
- ပံ့ပိုးမှု: $2,197
- ခုခံမှု: $2,265
🔥 ကျွန်ုပ်၏မဟာဗျူဟာ: $2,265 အထက်တွင် အတည်ပြုချက်ရသည်အထိ စောင့်ပါ။ ဈေးတက်နေချိန် နောက်ကလိုက်မဝယ်ပါနှင့်!
ဒီတစ်ပတ်အတွင်း ETH က $2,300 ကို ကျော်တက်နိုင်မယ်လို့ ထင်ပါသလား? 👇
#ETH #Ethereum #cryptotrading #BinanceSquareFamily #altcoins #CryptoAnalysis"
ဈေးနှုန်းနှင့် အဆင့်များသည် အနီးစပ်ဆုံးအချိန်ကာလတစ်ခု၏ အခြေအနေကို ဖော်ပြခြင်းသာဖြစ်ပြီး တိုက်ရိုက်အတည်ပြုထားခြင်း မဟုတ်ပါ။ သင့်လျော်သော စွန့်စားမှုစီမံခန့်ခွဲမှုဖြင့် အရောင်းအဝယ်လုပ်ပါ။
274

·
--
$LSK ကွိုင်က အလျင်အမြန်နဲ့ အန္တရာယ်ကြီးစွာ ထိုးတက်မလား?
ပြင်ဆင်ထားကြပါ
{future}(LSKUSDT)
ကျွန်ုပ်အမြင်အရ $LSK ကို စောင့်ကြည့်သင့်ပါတယ်။ ဈေးတက်အောင် ကူညီပေးနိုင်မယ့် အကြောင်းရင်းကောင်းတွေ ရှိပေမယ့် အလျင်အမြန် ထိုးတက်မယ်လို့တော့ အတည်မပြုနိုင်ပါဘူး။
ရရှိနိုင်တဲ့ အချက်အလက်တွေအရ :
ကျွန်ုပ်အကြံပြုတဲ့ ဝယ်ယူမှုမဟာဗျူဟာ
$LSK အတွက် ရင်းနှီးမြှုပ်နှံငွေ ခွဲဝေမှု
ပထမအကြိမ် : 0.181-0.185 ===>30%
ဒုတိယအကြိမ် : 0.172-0.176===>35%
တတိယအကြိမ် : 0.16-0.16 ===>35%
ဖြစ်နိုင်ခြေရှိတဲ့ ရည်မှန်းဈေးများ :
0.30=====> 58%
0.50=====>163%
1.00=====>426%
ဤရည်မှန်းချက်များသည် ဖြစ်နိုင်ခြေရှိသော အခြေအနေများသာဖြစ်ပြီး အာမခံထားသော ခန့်မှန်းချက်များ မဟုတ်ပါ။
နေ့စဉ်ပိတ်ဈေး 0.1728 အောက်ကျဆင်းပါက ဤအခြေအနေအပေါ် ယုံကြည်မှု လျော့နည်းစေပါသည်။
0.1613 အောက်ကျိုးကျပါက ထပ်မံဝယ်ယူခြင်းကို ရပ်တန့်မည် သို့မဟုတ် အရောင်းအဝယ်ကို ပြန်လည်သုံးသပ်မည်။
အရောင်းအဝယ်ပမာဏ မြင့်မားစွာဖြင့် 0.201 ကို ကျော်တက်ပါက အားကောင်းသော အရှိန်အဟုန် ပြန်လည်ရရှိလာကြောင်း အချက်ပြနိုင်ပါသည်။
#BinanceSquare #LSK #CryptoAnalysis" #blockchain #تحليل
$LSK ကွိုင်က အလျင်အမြန်နဲ့ အန္တရာယ်ကြီးစွာ ထိုးတက်မလား?
ပြင်ဆင်ထားကြပါ
ကျွန်ုပ်အမြင်အရ $LSK ကို စောင့်ကြည့်သင့်ပါတယ်။ ဈေးတက်အောင် ကူညီပေးနိုင်မယ့် အကြောင်းရင်းကောင်းတွေ ရှိပေမယ့် အလျင်အမြန် ထိုးတက်မယ်လို့တော့ အတည်မပြုနိုင်ပါဘူး။
ရရှိနိုင်တဲ့ အချက်အလက်တွေအရ :
ကျွန်ုပ်အကြံပြုတဲ့ ဝယ်ယူမှုမဟာဗျူဟာ
$LSK အတွက် ရင်းနှီးမြှုပ်နှံငွေ ခွဲဝေမှု
ပထမအကြိမ် : 0.181-0.185 ===>30%
ဒုတိယအကြိမ် : 0.172-0.176===>35%
တတိယအကြိမ် : 0.16-0.16 ===>35%
ဖြစ်နိုင်ခြေရှိတဲ့ ရည်မှန်းဈေးများ :
0.30=====> 58%
0.50=====>163%
1.00=====>426%
ဤရည်မှန်းချက်များသည် ဖြစ်နိုင်ခြေရှိသော အခြေအနေများသာဖြစ်ပြီး အာမခံထားသော ခန့်မှန်းချက်များ မဟုတ်ပါ။
နေ့စဉ်ပိတ်ဈေး 0.1728 အောက်ကျဆင်းပါက ဤအခြေအနေအပေါ် ယုံကြည်မှု လျော့နည်းစေပါသည်။
0.1613 အောက်ကျိုးကျပါက ထပ်မံဝယ်ယူခြင်းကို ရပ်တန့်မည် သို့မဟုတ် အရောင်းအဝယ်ကို ပြန်လည်သုံးသပ်မည်။
အရောင်းအဝယ်ပမာဏ မြင့်မားစွာဖြင့် 0.201 ကို ကျော်တက်ပါက အားကောင်းသော အရှိန်အဟုန် ပြန်လည်ရရှိလာကြောင်း အချက်ပြနိုင်ပါသည်။
#BinanceSquare #LSK #CryptoAnalysis" #blockchain #تحليل
ပြင်ဆင်ထားကြပါ
ကျွန်ုပ်အမြင်အရ $LSK ကို စောင့်ကြည့်သင့်ပါတယ်။ ဈေးတက်အောင် ကူညီပေးနိုင်မယ့် အကြောင်းရင်းကောင်းတွေ ရှိပေမယ့် အလျင်အမြန် ထိုးတက်မယ်လို့တော့ အတည်မပြုနိုင်ပါဘူး။
ရရှိနိုင်တဲ့ အချက်အလက်တွေအရ :
ကျွန်ုပ်အကြံပြုတဲ့ ဝယ်ယူမှုမဟာဗျူဟာ
$LSK အတွက် ရင်းနှီးမြှုပ်နှံငွေ ခွဲဝေမှု
ပထမအကြိမ် : 0.181-0.185 ===>30%
ဒုတိယအကြိမ် : 0.172-0.176===>35%
တတိယအကြိမ် : 0.16-0.16 ===>35%
ဖြစ်နိုင်ခြေရှိတဲ့ ရည်မှန်းဈေးများ :
0.30=====> 58%
0.50=====>163%
1.00=====>426%
ဤရည်မှန်းချက်များသည် ဖြစ်နိုင်ခြေရှိသော အခြေအနေများသာဖြစ်ပြီး အာမခံထားသော ခန့်မှန်းချက်များ မဟုတ်ပါ။
နေ့စဉ်ပိတ်ဈေး 0.1728 အောက်ကျဆင်းပါက ဤအခြေအနေအပေါ် ယုံကြည်မှု လျော့နည်းစေပါသည်။
0.1613 အောက်ကျိုးကျပါက ထပ်မံဝယ်ယူခြင်းကို ရပ်တန့်မည် သို့မဟုတ် အရောင်းအဝယ်ကို ပြန်လည်သုံးသပ်မည်။
အရောင်းအဝယ်ပမာဏ မြင့်မားစွာဖြင့် 0.201 ကို ကျော်တက်ပါက အားကောင်းသော အရှိန်အဟုန် ပြန်လည်ရရှိလာကြောင်း အချက်ပြနိုင်ပါသည်။
#BinanceSquare #LSK #CryptoAnalysis" #blockchain #تحليل

أبو حسين77:
العملة تحت المراقبة كيف ستنفجر لا تبيع للناس الوهم
3
2
1.3k

·
--
🚨 BTC ကာလတို စျေးကွက်အခြေအနေ အပ်ဒိတ်! 🚨
Bitcoin သည် အရှိန်အဟုန် လျော့ကျလာသဖြင့် လက်ရှိတွင် အားနည်းသော ဈေးနှုန်းအပိုင်းအခြား၌ အရောင်းအဝယ် ဖြစ်နေပါသည် 📉‼️
🔍 စောင့်ကြည့်ရမည့် အဓိကဈေးနှုန်းများ:
⛔️ ငြင်းပယ်ခံရသည့် ဈေးနှုန်း:
BTC သည် $76,245 မှ ပြင်းထန်စွာ ငြင်းပယ်ခံခဲ့ရပါသည်။
⚠️ အရေးကြီးသော အောက်ခံဈေးနှုန်း
ယခုအချိန်တွင် $75,000 အထောက်အပံ့အဆင့်သည် အဓိကကျပါသည်။
📉 အောက်ဘက်သို့ ကျဆင်းနိုင်ခြေ‼️
$75,000 အောက်သို့ ကျိုးကျသွားပါက အရောင်းဖိအား ပိုမိုများပြားလာပြီး ဈေးနှုန်းသည် $74,100 – $74,200 ပစ်မှတ်ဇုန်သို့ ဦးတည်သွားနိုင်ပါသည်! 🎯
🚀 အပြုသဘောဆောင်သော ဇုန်📈
🟢 နောက်ထပ် ထိုးကျမှုကို ယာယီနှောင့်နှေးစေနိုင်သည့် $76500 မှ 76800 အတွင်း ခုခံမှုအဆင့်တစ်ခု လိုအပ်ပါသည်။
👉🏻 သတိပြုရန်: ဤပို့စ်သည် ပညာပေးရည်ရွယ်ချက်အတွက်သာဖြစ်ပြီး ငွေကြေးဆိုင်ရာ အကြံဉာဏ် မဟုတ်ပါ။ 🧠📚
#BTC #CryptoNews #BinaceSquare #MarketTrend #CryptoAnalysis
🚨 BTC ကာလတို စျေးကွက်အခြေအနေ အပ်ဒိတ်! 🚨
Bitcoin သည် အရှိန်အဟုန် လျော့ကျလာသဖြင့် လက်ရှိတွင် အားနည်းသော ဈေးနှုန်းအပိုင်းအခြား၌ အရောင်းအဝယ် ဖြစ်နေပါသည် 📉‼️
🔍 စောင့်ကြည့်ရမည့် အဓိကဈေးနှုန်းများ:
⛔️ ငြင်းပယ်ခံရသည့် ဈေးနှုန်း:
BTC သည် $76,245 မှ ပြင်းထန်စွာ ငြင်းပယ်ခံခဲ့ရပါသည်။
⚠️ အရေးကြီးသော အောက်ခံဈေးနှုန်း
ယခုအချိန်တွင် $75,000 အထောက်အပံ့အဆင့်သည် အဓိကကျပါသည်။
📉 အောက်ဘက်သို့ ကျဆင်းနိုင်ခြေ‼️
$75,000 အောက်သို့ ကျိုးကျသွားပါက အရောင်းဖိအား ပိုမိုများပြားလာပြီး ဈေးနှုန်းသည် $74,100 – $74,200 ပစ်မှတ်ဇုန်သို့ ဦးတည်သွားနိုင်ပါသည်! 🎯
🚀 အပြုသဘောဆောင်သော ဇုန်📈
🟢 နောက်ထပ် ထိုးကျမှုကို ယာယီနှောင့်နှေးစေနိုင်သည့် $76500 မှ 76800 အတွင်း ခုခံမှုအဆင့်တစ်ခု လိုအပ်ပါသည်။
👉🏻 သတိပြုရန်: ဤပို့စ်သည် ပညာပေးရည်ရွယ်ချက်အတွက်သာဖြစ်ပြီး ငွေကြေးဆိုင်ရာ အကြံဉာဏ် မဟုတ်ပါ။ 🧠📚
#BTC #CryptoNews #BinaceSquare #MarketTrend #CryptoAnalysis
Bitcoin သည် အရှိန်အဟုန် လျော့ကျလာသဖြင့် လက်ရှိတွင် အားနည်းသော ဈေးနှုန်းအပိုင်းအခြား၌ အရောင်းအဝယ် ဖြစ်နေပါသည် 📉‼️
🔍 စောင့်ကြည့်ရမည့် အဓိကဈေးနှုန်းများ:
⛔️ ငြင်းပယ်ခံရသည့် ဈေးနှုန်း:
BTC သည် $76,245 မှ ပြင်းထန်စွာ ငြင်းပယ်ခံခဲ့ရပါသည်။
⚠️ အရေးကြီးသော အောက်ခံဈေးနှုန်း
ယခုအချိန်တွင် $75,000 အထောက်အပံ့အဆင့်သည် အဓိကကျပါသည်။
📉 အောက်ဘက်သို့ ကျဆင်းနိုင်ခြေ‼️
$75,000 အောက်သို့ ကျိုးကျသွားပါက အရောင်းဖိအား ပိုမိုများပြားလာပြီး ဈေးနှုန်းသည် $74,100 – $74,200 ပစ်မှတ်ဇုန်သို့ ဦးတည်သွားနိုင်ပါသည်! 🎯
🚀 အပြုသဘောဆောင်သော ဇုန်📈
🟢 နောက်ထပ် ထိုးကျမှုကို ယာယီနှောင့်နှေးစေနိုင်သည့် $76500 မှ 76800 အတွင်း ခုခံမှုအဆင့်တစ်ခု လိုအပ်ပါသည်။
👉🏻 သတိပြုရန်: ဤပို့စ်သည် ပညာပေးရည်ရွယ်ချက်အတွက်သာဖြစ်ပြီး ငွေကြေးဆိုင်ရာ အကြံဉာဏ် မဟုတ်ပါ။ 🧠📚
#BTC #CryptoNews #BinaceSquare #MarketTrend #CryptoAnalysis

1
85

·
--
တက်ရိပ်ရှိသည်
$LSK က $4–$5 ဈေးနှုန်းအကွာအဝေးသို့ ပြန်လည်ရောက်ရှိနိုင်မလား?
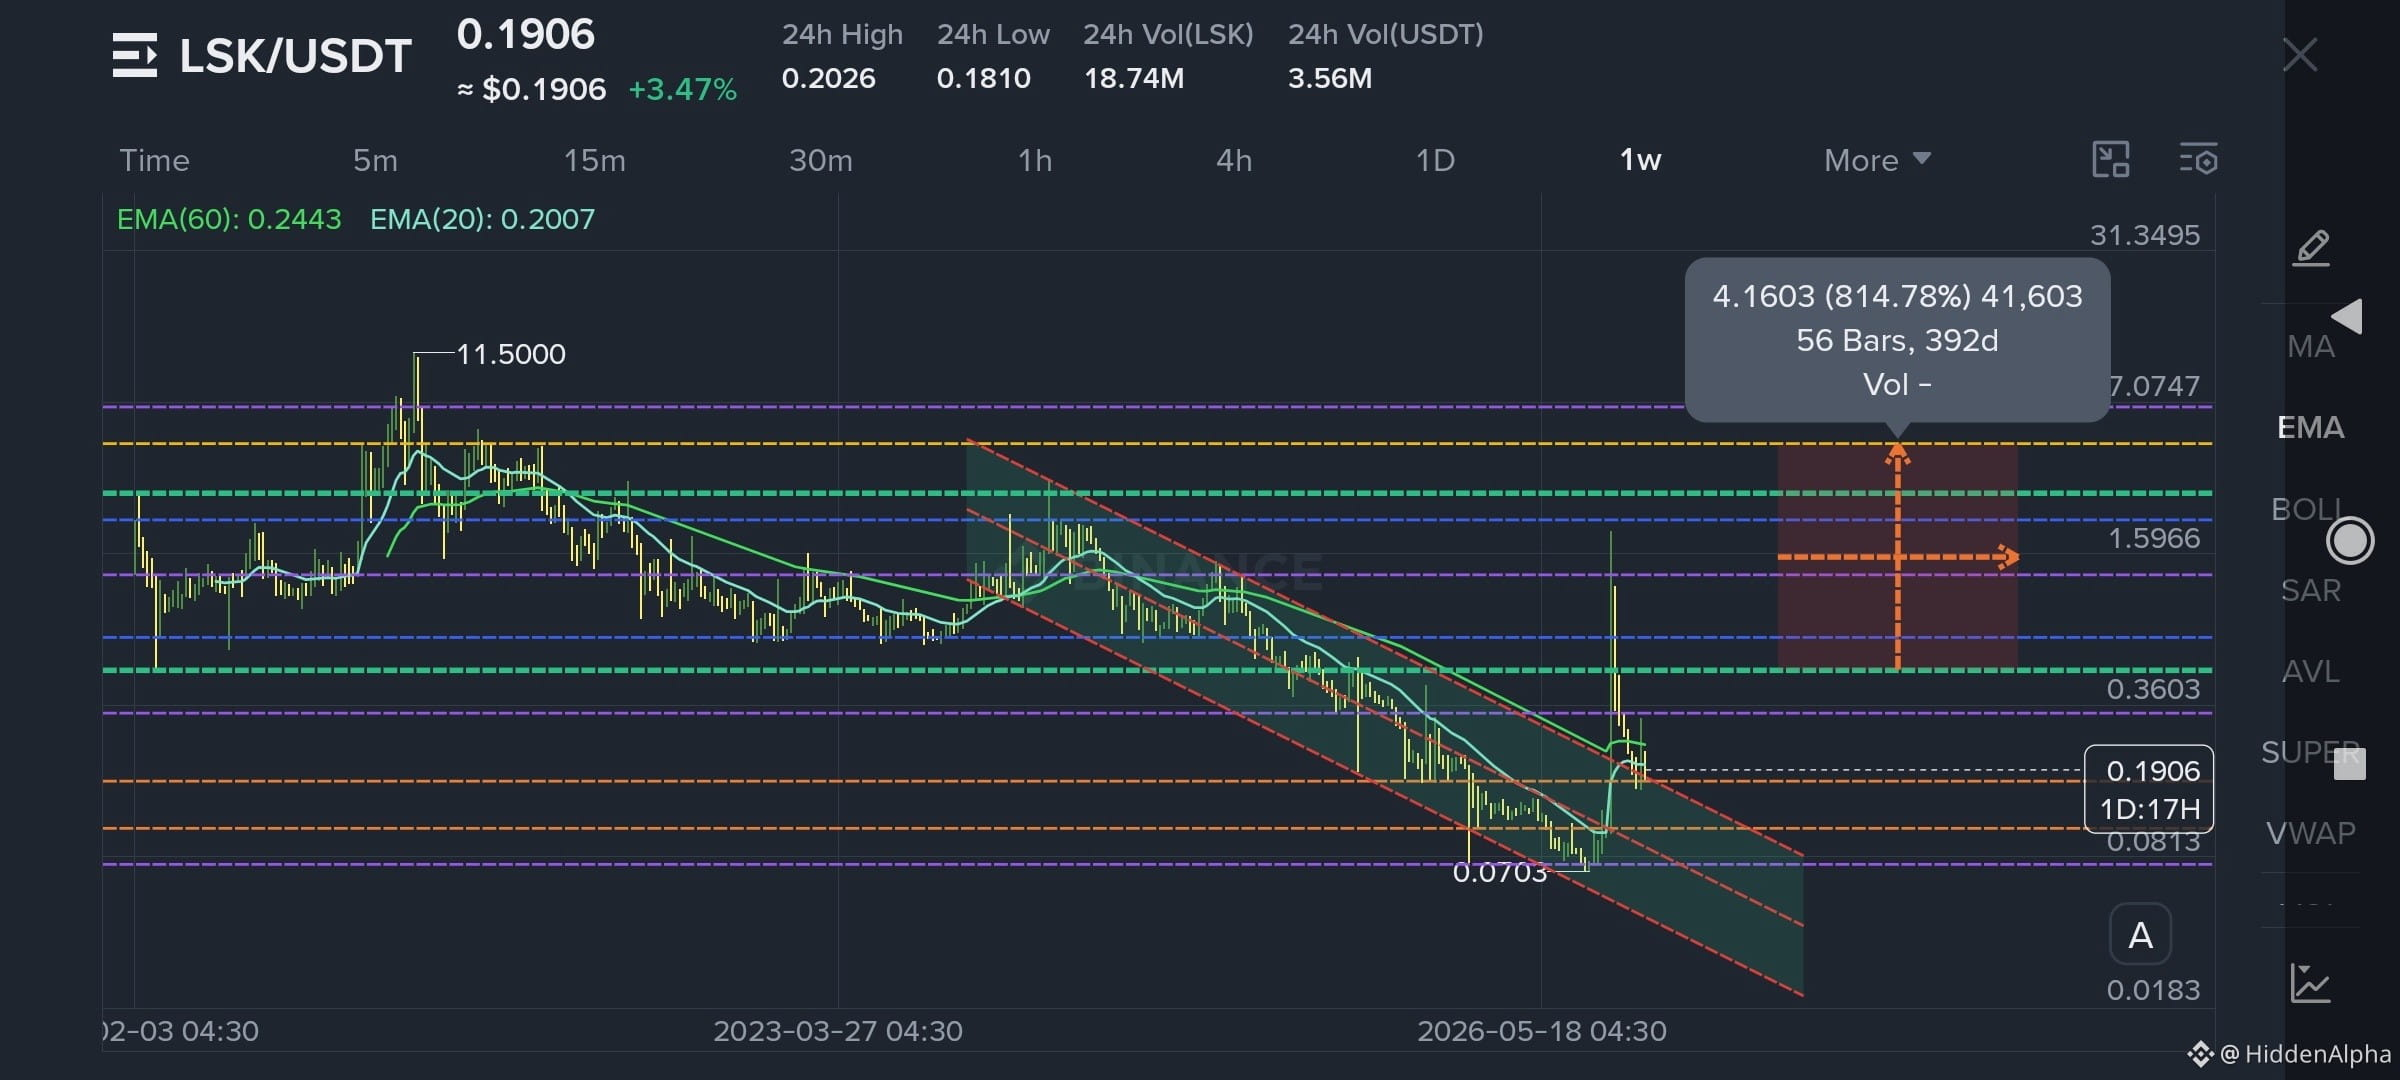
LSK/USDT အပတ်စဉ်ဇယားကို ကျွန်ုပ်၏သုံးသပ်ချက်၊ ပရောဂျက်၏ အခြေခံအချက်များနှင့် ရေရှည်အလားအလာတို့နှင့် ပေါင်းစပ်စဉ်းစားကြည့်ရာ၊ $4–$5 ဈေးနှုန်းအကွာအဝေးသို့ ပြန်လည်ရောက်ရှိနိုင်ခြင်းသည် ထည့်သွင်းစဉ်းစားသင့်သော အခြေအနေတစ်ခုဟု ယုံကြည်ပါသည်။
ကျဆင်းမှုကြာရှည်ခဲ့ပြီးနောက် $LSK သည် ဈေးနှုန်းသိသိသာသာ နိမ့်ကျသည့်အဆင့်များသို့ ရောက်ရှိခဲ့သည်။ သို့သော် မကြာသေးမီက ဈေးနှုန်းလှုပ်ရှားမှုများနှင့် မတည်ငြိမ်မှုမြင့်တက်လာခြင်းတို့ကြောင့် ရေရှည်အလားအလာမှာ စိတ်ဝင်စားဖွယ်ကောင်းလာသည်။
သေချာသည်မှာ $4–$5 သို့ ရောက်ရှိရန် ချက်ချင်းဖြစ်လာမည်မဟုတ်ပါ။ $LSK သည် အရေးပါသော ခုခံမှုအဆင့်များကို ကျော်ဖြတ်ရန်၊ ရေရှည်တည်တံ့နိုင်သည့် အတက်လမ်းကြောင်းတစ်ခုကို တည်ဆောက်ရန်နှင့် ၎င်း၏ဂေဟစနစ်ဖွံ့ဖြိုးတိုးတက်မှု၊ အခြေခံတိုးတက်မှုတို့မှ ဆက်လက်ပံ့ပိုးမှုရရှိရန် လိုအပ်မည်ဖြစ်သည်။
ကျွန်ုပ်၏ ရေရှည်ဈေးနှုန်းရည်မှန်းချက် — $4–$5
ကျဆင်းမှုကာလကြာရှည်စွာ ကြုံတွေ့ခဲ့ရသော်လည်း ပြန်လည်နာလန်ထူရန်နှင့် ဖွံ့ဖြိုးတိုးတက်ရန် အလားအလာရှိနေသေးသည့် ပရောဂျက်များမှ crypto လောက၏ စိတ်ဝင်စားဖွယ်အကောင်းဆုံး အခွင့်အလမ်းအချို့ ပေါ်ပေါက်လာနိုင်သည်ဟု ယုံကြည်ပါသည်။
ဤသည်မှာ ကျွန်ုပ်၏ ကိုယ်ပိုင်ဈေးကွက်သုံးသပ်ချက်နှင့် ရေရှည်အမြင်သာဖြစ်ပြီး၊ အာမခံထားသော ခန့်မှန်းချက် သို့မဟုတ် ငွေကြေးဆိုင်ရာ အကြံဉာဏ်မဟုတ်ပါ။
စိတ်လှုပ်ရှားဖွယ်ရာများနောက် လိုက်ခြင်းထက် စိတ်ရှည်ခြင်း၊ သုတေသနပြုခြင်းနှင့် စွန့်စားမှုကို စီမံခန့်ခွဲခြင်းတို့က ပိုအရေးကြီးပါသည်။
#LSK #LSKUSDT #CryptoAnalysis" #CryptoMarket
{spot}(LSKUSDT)
$LSK က $4–$5 ဈေးနှုန်းအကွာအဝေးသို့ ပြန်လည်ရောက်ရှိနိုင်မလား?
LSK/USDT အပတ်စဉ်ဇယားကို ကျွန်ုပ်၏သုံးသပ်ချက်၊ ပရောဂျက်၏ အခြေခံအချက်များနှင့် ရေရှည်အလားအလာတို့နှင့် ပေါင်းစပ်စဉ်းစားကြည့်ရာ၊ $4–$5 ဈေးနှုန်းအကွာအဝေးသို့ ပြန်လည်ရောက်ရှိနိုင်ခြင်းသည် ထည့်သွင်းစဉ်းစားသင့်သော အခြေအနေတစ်ခုဟု ယုံကြည်ပါသည်။
ကျဆင်းမှုကြာရှည်ခဲ့ပြီးနောက် $LSK သည် ဈေးနှုန်းသိသိသာသာ နိမ့်ကျသည့်အဆင့်များသို့ ရောက်ရှိခဲ့သည်။ သို့သော် မကြာသေးမီက ဈေးနှုန်းလှုပ်ရှားမှုများနှင့် မတည်ငြိမ်မှုမြင့်တက်လာခြင်းတို့ကြောင့် ရေရှည်အလားအလာမှာ စိတ်ဝင်စားဖွယ်ကောင်းလာသည်။
သေချာသည်မှာ $4–$5 သို့ ရောက်ရှိရန် ချက်ချင်းဖြစ်လာမည်မဟုတ်ပါ။ $LSK သည် အရေးပါသော ခုခံမှုအဆင့်များကို ကျော်ဖြတ်ရန်၊ ရေရှည်တည်တံ့နိုင်သည့် အတက်လမ်းကြောင်းတစ်ခုကို တည်ဆောက်ရန်နှင့် ၎င်း၏ဂေဟစနစ်ဖွံ့ဖြိုးတိုးတက်မှု၊ အခြေခံတိုးတက်မှုတို့မှ ဆက်လက်ပံ့ပိုးမှုရရှိရန် လိုအပ်မည်ဖြစ်သည်။
ကျွန်ုပ်၏ ရေရှည်ဈေးနှုန်းရည်မှန်းချက် — $4–$5
ကျဆင်းမှုကာလကြာရှည်စွာ ကြုံတွေ့ခဲ့ရသော်လည်း ပြန်လည်နာလန်ထူရန်နှင့် ဖွံ့ဖြိုးတိုးတက်ရန် အလားအလာရှိနေသေးသည့် ပရောဂျက်များမှ crypto လောက၏ စိတ်ဝင်စားဖွယ်အကောင်းဆုံး အခွင့်အလမ်းအချို့ ပေါ်ပေါက်လာနိုင်သည်ဟု ယုံကြည်ပါသည်။
ဤသည်မှာ ကျွန်ုပ်၏ ကိုယ်ပိုင်ဈေးကွက်သုံးသပ်ချက်နှင့် ရေရှည်အမြင်သာဖြစ်ပြီး၊ အာမခံထားသော ခန့်မှန်းချက် သို့မဟုတ် ငွေကြေးဆိုင်ရာ အကြံဉာဏ်မဟုတ်ပါ။
စိတ်လှုပ်ရှားဖွယ်ရာများနောက် လိုက်ခြင်းထက် စိတ်ရှည်ခြင်း၊ သုတေသနပြုခြင်းနှင့် စွန့်စားမှုကို စီမံခန့်ခွဲခြင်းတို့က ပိုအရေးကြီးပါသည်။
#LSK #LSKUSDT #CryptoAnalysis" #CryptoMarket
LSK/USDT အပတ်စဉ်ဇယားကို ကျွန်ုပ်၏သုံးသပ်ချက်၊ ပရောဂျက်၏ အခြေခံအချက်များနှင့် ရေရှည်အလားအလာတို့နှင့် ပေါင်းစပ်စဉ်းစားကြည့်ရာ၊ $4–$5 ဈေးနှုန်းအကွာအဝေးသို့ ပြန်လည်ရောက်ရှိနိုင်ခြင်းသည် ထည့်သွင်းစဉ်းစားသင့်သော အခြေအနေတစ်ခုဟု ယုံကြည်ပါသည်။
ကျဆင်းမှုကြာရှည်ခဲ့ပြီးနောက် $LSK သည် ဈေးနှုန်းသိသိသာသာ နိမ့်ကျသည့်အဆင့်များသို့ ရောက်ရှိခဲ့သည်။ သို့သော် မကြာသေးမီက ဈေးနှုန်းလှုပ်ရှားမှုများနှင့် မတည်ငြိမ်မှုမြင့်တက်လာခြင်းတို့ကြောင့် ရေရှည်အလားအလာမှာ စိတ်ဝင်စားဖွယ်ကောင်းလာသည်။
သေချာသည်မှာ $4–$5 သို့ ရောက်ရှိရန် ချက်ချင်းဖြစ်လာမည်မဟုတ်ပါ။ $LSK သည် အရေးပါသော ခုခံမှုအဆင့်များကို ကျော်ဖြတ်ရန်၊ ရေရှည်တည်တံ့နိုင်သည့် အတက်လမ်းကြောင်းတစ်ခုကို တည်ဆောက်ရန်နှင့် ၎င်း၏ဂေဟစနစ်ဖွံ့ဖြိုးတိုးတက်မှု၊ အခြေခံတိုးတက်မှုတို့မှ ဆက်လက်ပံ့ပိုးမှုရရှိရန် လိုအပ်မည်ဖြစ်သည်။
ကျွန်ုပ်၏ ရေရှည်ဈေးနှုန်းရည်မှန်းချက် — $4–$5
ကျဆင်းမှုကာလကြာရှည်စွာ ကြုံတွေ့ခဲ့ရသော်လည်း ပြန်လည်နာလန်ထူရန်နှင့် ဖွံ့ဖြိုးတိုးတက်ရန် အလားအလာရှိနေသေးသည့် ပရောဂျက်များမှ crypto လောက၏ စိတ်ဝင်စားဖွယ်အကောင်းဆုံး အခွင့်အလမ်းအချို့ ပေါ်ပေါက်လာနိုင်သည်ဟု ယုံကြည်ပါသည်။
ဤသည်မှာ ကျွန်ုပ်၏ ကိုယ်ပိုင်ဈေးကွက်သုံးသပ်ချက်နှင့် ရေရှည်အမြင်သာဖြစ်ပြီး၊ အာမခံထားသော ခန့်မှန်းချက် သို့မဟုတ် ငွေကြေးဆိုင်ရာ အကြံဉာဏ်မဟုတ်ပါ။
စိတ်လှုပ်ရှားဖွယ်ရာများနောက် လိုက်ခြင်းထက် စိတ်ရှည်ခြင်း၊ သုတေသနပြုခြင်းနှင့် စွန့်စားမှုကို စီမံခန့်ခွဲခြင်းတို့က ပိုအရေးကြီးပါသည်။
#LSK #LSKUSDT #CryptoAnalysis" #CryptoMarket
2
1.3k

·
--
ခရစ်ပတိုဈေးကွက် ဆွေးနွေးမှု
#CryptoAnalysis"
ခရစ်ပတိုဈေးကွက် ဆွေးနွေးမှု
#CryptoAnalysis"
#CryptoAnalysis"


Hawk自由哥
·
--
[ပြန်ဖွင့်မည်] 🎙️ ခရစ်တိုဈေးကွက်အခြေအနေများ ဆွေးနွေးခြင်း/အသစ်ဝင်သူများ၏ မေးခွန်းများကို ဖြေကြားခြင်း/Binance Square ကို အတူတကွ တည်ဆောက်ခြင်း🔥
03 နာရီ 13 မိနစ် 18 စက္ကန့် · 10.2k ဦး နားဆင်နေသည်
2
·
--
ကျရိပ်ရှိသည်
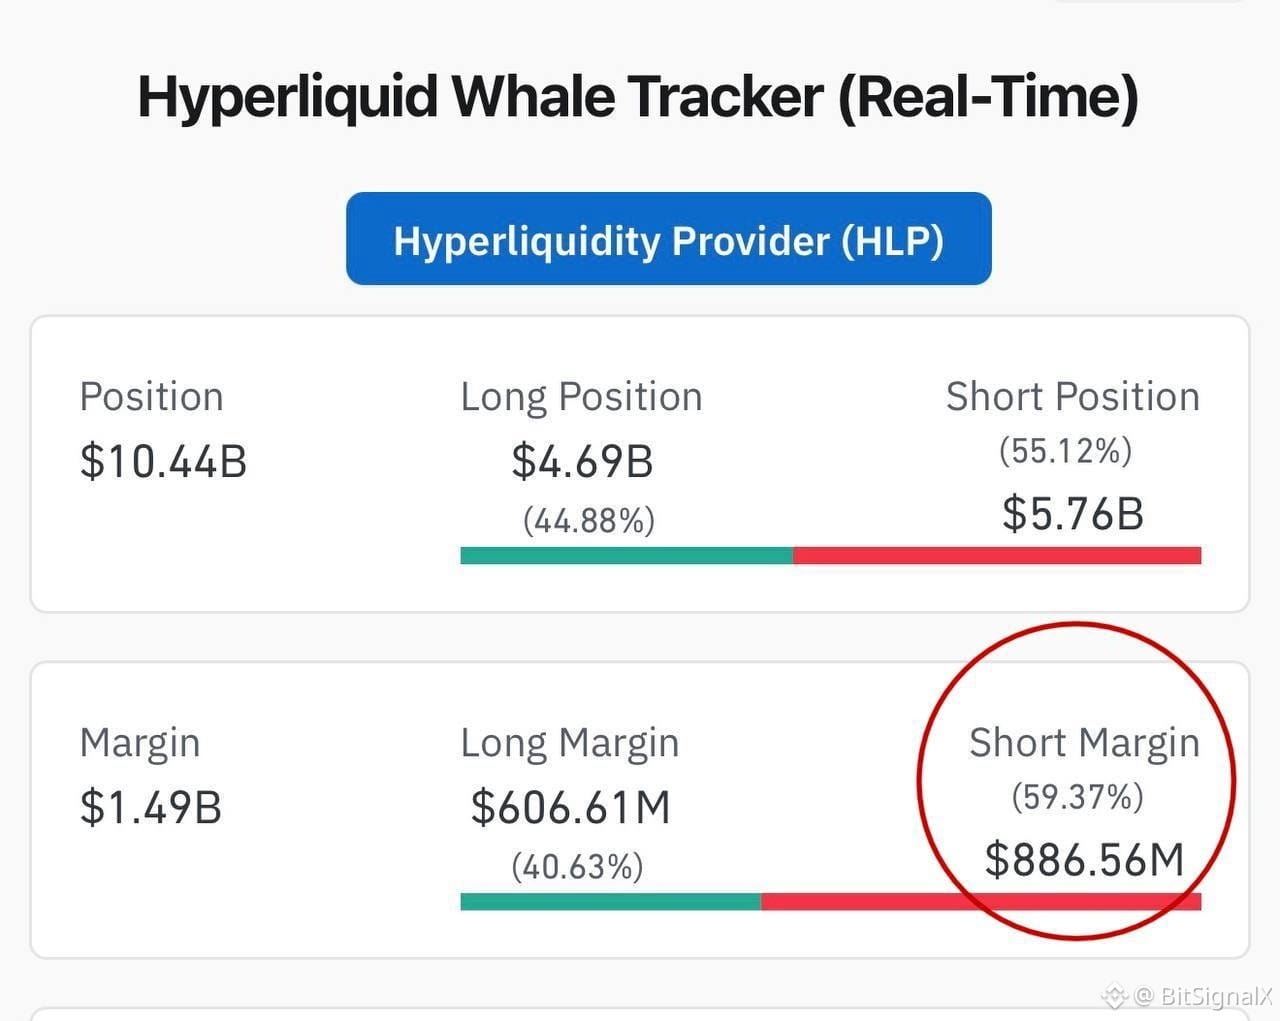
🐋 ဝေလငါးတွေကလည်း ရှော့အနေအထားမှာ
$BTC
{future}(BTCUSDT)
$ETH
{future}(ETHUSDT)
#Hyperliquid အိတ်ချိန်းရှိ ဝေလငါးကုန်သည်အများစုသည် ဈေးကွက်တွင် ရှော့အနေအထားများကို အဓိကထား၍ ဆက်လက်ကိုင်ဆောင်ထားကြသည်။
📊 ဤသည်မှာ ကျွန်ုပ်တို့၏ လက်ရှိသုံးသပ်ချက်နှင့် ပြုပြင်ကျဆင်းမှုအခြေအနေ ဆက်လက်ဖြစ်ပေါ်လာမည်ဟူသော မျှော်မှန်းချက်ကို ထပ်မံအတည်ပြုနေခြင်းဖြစ်သည်။
အဓိကကစားသမားများသည် ဈေးကျမည်ဟု ဆက်လက်လောင်းကြေးထပ်နေကြပြီး၊ ယင်းက ဈေးကွက်၏ ကျဆင်းမည့်ပုံရိပ်ကို ပိုမိုအားကောင်းစေသည်။
⚙️ ဝေလငါးများ၏ လုပ်ဆောင်ချက်များနှင့် အရေးကြီးသော ပံ့ပိုးမှုအဆင့်များ၌ ဈေးနှုန်း၏ တုံ့ပြန်မှုကို ကျွန်ုပ်တို့ ဆက်လက်ဂရုတစိုက် စောင့်ကြည့်နေပါမည်။
🔥 အသုံးဝင်သော သုံးသပ်ချက်များအတွက် စာရေးသူကို အားပေးပါ!
ကျွန်ုပ်၏ သုံးသပ်ချက်များနှင့် ကုန်သွယ်မှုအစီအစဉ်များက သင့်ကို ဝင်ငွေရရှိစေရန် ကူညီပေးပါက၊ အကြံပေးငွေ ပေးသနားခြင်းအတွက် ကျေးဇူးတင်ရှိပါမည် ❤️
ထို့အပြင် လိုက်ခ်ပေးရန်၊ မှတ်ချက်ရေးရန်နှင့် ချန်နယ်ကို စာရင်းသွင်းရန် မမေ့ပါနှင့် — သင်၏အားပေးမှုက ပိုမိုကောင်းမွန်သော သုံးသပ်ချက်များ ပြုလုပ်ရန်နှင့် ကုန်သွယ်မှုအခွင့်အလမ်းအသစ်များ ရှာဖွေရန် ကျွန်ုပ်ကို စိတ်အားထက်သန်စေပါသည်။ 🚀
#BTC #ETH #BitSignal #CryptoAnalysis"
🐋 ဝေလငါးတွေကလည်း ရှော့အနေအထားမှာ
$BTC
$ETH
#Hyperliquid အိတ်ချိန်းရှိ ဝေလငါးကုန်သည်အများစုသည် ဈေးကွက်တွင် ရှော့အနေအထားများကို အဓိကထား၍ ဆက်လက်ကိုင်ဆောင်ထားကြသည်။
📊 ဤသည်မှာ ကျွန်ုပ်တို့၏ လက်ရှိသုံးသပ်ချက်နှင့် ပြုပြင်ကျဆင်းမှုအခြေအနေ ဆက်လက်ဖြစ်ပေါ်လာမည်ဟူသော မျှော်မှန်းချက်ကို ထပ်မံအတည်ပြုနေခြင်းဖြစ်သည်။
အဓိကကစားသမားများသည် ဈေးကျမည်ဟု ဆက်လက်လောင်းကြေးထပ်နေကြပြီး၊ ယင်းက ဈေးကွက်၏ ကျဆင်းမည့်ပုံရိပ်ကို ပိုမိုအားကောင်းစေသည်။
⚙️ ဝေလငါးများ၏ လုပ်ဆောင်ချက်များနှင့် အရေးကြီးသော ပံ့ပိုးမှုအဆင့်များ၌ ဈေးနှုန်း၏ တုံ့ပြန်မှုကို ကျွန်ုပ်တို့ ဆက်လက်ဂရုတစိုက် စောင့်ကြည့်နေပါမည်။
🔥 အသုံးဝင်သော သုံးသပ်ချက်များအတွက် စာရေးသူကို အားပေးပါ!
ကျွန်ုပ်၏ သုံးသပ်ချက်များနှင့် ကုန်သွယ်မှုအစီအစဉ်များက သင့်ကို ဝင်ငွေရရှိစေရန် ကူညီပေးပါက၊ အကြံပေးငွေ ပေးသနားခြင်းအတွက် ကျေးဇူးတင်ရှိပါမည် ❤️
ထို့အပြင် လိုက်ခ်ပေးရန်၊ မှတ်ချက်ရေးရန်နှင့် ချန်နယ်ကို စာရင်းသွင်းရန် မမေ့ပါနှင့် — သင်၏အားပေးမှုက ပိုမိုကောင်းမွန်သော သုံးသပ်ချက်များ ပြုလုပ်ရန်နှင့် ကုန်သွယ်မှုအခွင့်အလမ်းအသစ်များ ရှာဖွေရန် ကျွန်ုပ်ကို စိတ်အားထက်သန်စေပါသည်။ 🚀
#BTC #ETH #BitSignal #CryptoAnalysis"
$BTC
$ETH
#Hyperliquid အိတ်ချိန်းရှိ ဝေလငါးကုန်သည်အများစုသည် ဈေးကွက်တွင် ရှော့အနေအထားများကို အဓိကထား၍ ဆက်လက်ကိုင်ဆောင်ထားကြသည်။
📊 ဤသည်မှာ ကျွန်ုပ်တို့၏ လက်ရှိသုံးသပ်ချက်နှင့် ပြုပြင်ကျဆင်းမှုအခြေအနေ ဆက်လက်ဖြစ်ပေါ်လာမည်ဟူသော မျှော်မှန်းချက်ကို ထပ်မံအတည်ပြုနေခြင်းဖြစ်သည်။
အဓိကကစားသမားများသည် ဈေးကျမည်ဟု ဆက်လက်လောင်းကြေးထပ်နေကြပြီး၊ ယင်းက ဈေးကွက်၏ ကျဆင်းမည့်ပုံရိပ်ကို ပိုမိုအားကောင်းစေသည်။
⚙️ ဝေလငါးများ၏ လုပ်ဆောင်ချက်များနှင့် အရေးကြီးသော ပံ့ပိုးမှုအဆင့်များ၌ ဈေးနှုန်း၏ တုံ့ပြန်မှုကို ကျွန်ုပ်တို့ ဆက်လက်ဂရုတစိုက် စောင့်ကြည့်နေပါမည်။
🔥 အသုံးဝင်သော သုံးသပ်ချက်များအတွက် စာရေးသူကို အားပေးပါ!
ကျွန်ုပ်၏ သုံးသပ်ချက်များနှင့် ကုန်သွယ်မှုအစီအစဉ်များက သင့်ကို ဝင်ငွေရရှိစေရန် ကူညီပေးပါက၊ အကြံပေးငွေ ပေးသနားခြင်းအတွက် ကျေးဇူးတင်ရှိပါမည် ❤️
ထို့အပြင် လိုက်ခ်ပေးရန်၊ မှတ်ချက်ရေးရန်နှင့် ချန်နယ်ကို စာရင်းသွင်းရန် မမေ့ပါနှင့် — သင်၏အားပေးမှုက ပိုမိုကောင်းမွန်သော သုံးသပ်ချက်များ ပြုလုပ်ရန်နှင့် ကုန်သွယ်မှုအခွင့်အလမ်းအသစ်များ ရှာဖွေရန် ကျွန်ုပ်ကို စိတ်အားထက်သန်စေပါသည်။ 🚀
#BTC #ETH #BitSignal #CryptoAnalysis"
3
1.5k
Log in to explore more content
Join global crypto users on Binance Square
⚡️ Get latest and useful information about crypto.
💬 Trusted by the world’s largest crypto exchange.
👍 Discover real insights from verified creators.
အီးမေးလ် / ဖုန်းနံပါတ်
ရေပန်းစားနေသော ခေါင်းစဉ်များ
1
#NvidiaInvestigatesAfterHuang’sAffairApology
ကြည့်ရှုမှု 198,417 ကြိမ်
1,669 ဦး ဆွေးနွေးနေသည်
2
#BitcoinFiveWeeklyLosses
ကြည့်ရှုမှု 226,138 ကြိမ်
2,131 ဦး ဆွေးနွေးနေသည်
3
#AIChipSlumpNasdaq
ကြည့်ရှုမှု 121,988 ကြိမ်
1,320 ဦး ဆွေးနွေးနေသည်
4
#CPITestsDecemberRateOutlook
ကြည့်ရှုမှု 646,380 ကြိမ်
2,773 ဦး ဆွေးနွေးနေသည်
5
#AnthropicRejectsIPODelayValuationinQuestion
ကြည့်ရှုမှု 35,065 ကြိမ်
389 ဦး ဆွေးနွေးနေသည်
6
#CryptoLiquidationsReach$1.16BIn24Hours
ကြည့်ရှုမှု 10,980 ကြိမ်
45 ဦး ဆွေးနွေးနေသည်
7
#BrentCrudeDrops3.8%To$94.56
ကြည့်ရှုမှု 9,049 ကြိမ်
23 ဦး ဆွေးနွေးနေသည်
8
#EUInstitutionsInviteIndustryToSetTokenizedSecuritiesStandards
ကြည့်ရှုမှု 1,789 ကြိမ်
16 ဦး ဆွေးနွေးနေသည်
9
#ChinaCACListsFiveIssuesAffectingBlockchainFilings
ကြည့်ရှုမှု 13,515 ကြိမ်
149 ဦး ဆွေးနွေးနေသည်
10
#UKBanksCanNowApplyToConductCryptoAssetBusiness
ကြည့်ရှုမှု 11,890 ကြိမ်
107 ဦး ဆွေးနွေးနေသည်