

#bitcoinetf
bitcoinetf
1.9M views
4,630 Discussing
ရေပန်းစားသော
နောက်ဆုံး

🔥 THE $2B BITCOIN ETF INJECTION JUST TURNED THE GAME ON ITS HEAD.
📊 Smart money poured a record $2 billion into US spot #BitcoinETF in April – the biggest monthly surge this year – and #IBIT ripped the top spot, outpacing rivals even as a late‑month outflow trimmed the rest of the fund family. At the same time #BTC is trading at $
🔥 THE $2B BITCOIN ETF INJECTION JUST TURNED THE GAME ON ITS HEAD.
📊 Smart money poured a record $2 billion into US spot #BitcoinETF in April – the biggest monthly surge this year – and #IBIT ripped the top spot, outpacing rivals even as a late‑month outflow trimmed the rest of the fund family. At the same time #BTC is trading at $
📊 Smart money poured a record $2 billion into US spot #BitcoinETF in April – the biggest monthly surge this year – and #IBIT ripped the top spot, outpacing rivals even as a late‑month outflow trimmed the rest of the fund family. At the same time #BTC is trading at $
BTC+၀.၅၇%
IBITETF-၀.၀၈%
4

🚨 BITCOIN ETF UPDATE
U.S. Spot Bitcoin ETFs recorded around $2.39 BILLION in net inflows over the latest reported week.
That was the largest weekly total of 2026 according to the report. 📊
Despite BTC's recent pullback, ETF demand remains a major market story.
Are institutions still interested in BTC?
DYOR — Not Financial Advice.
#bitcoin #BTC #BitcoinETF #CryptoNews #BinanceSquare
🚨 BITCOIN ETF UPDATE
U.S. Spot Bitcoin ETFs recorded around $2.39 BILLION in net inflows over the latest reported week.
That was the largest weekly total of 2026 according to the report. 📊
Despite BTC's recent pullback, ETF demand remains a major market story.
Are institutions still interested in BTC?
DYOR — Not Financial Advice.
#bitcoin #BTC #BitcoinETF #CryptoNews #BinanceSquare
U.S. Spot Bitcoin ETFs recorded around $2.39 BILLION in net inflows over the latest reported week.
That was the largest weekly total of 2026 according to the report. 📊
Despite BTC's recent pullback, ETF demand remains a major market story.
Are institutions still interested in BTC?
DYOR — Not Financial Advice.
#bitcoin #BTC #BitcoinETF #CryptoNews #BinanceSquare
5

Bitcoin ETFs have secured a massive $2.95 billion in inflows over the last 30 days, maintaining an eight day winning streak as they recover from recent regulatory sell off periods.
#BitcoinETF #ETFInflows
Bitcoin ETFs have secured a massive $2.95 billion in inflows over the last 30 days, maintaining an eight day winning streak as they recover from recent regulatory sell off periods.
#BitcoinETF #ETFInflows
#BitcoinETF #ETFInflows
10

$BTC ETF flows are still positive, but the momentum is cooling fast.
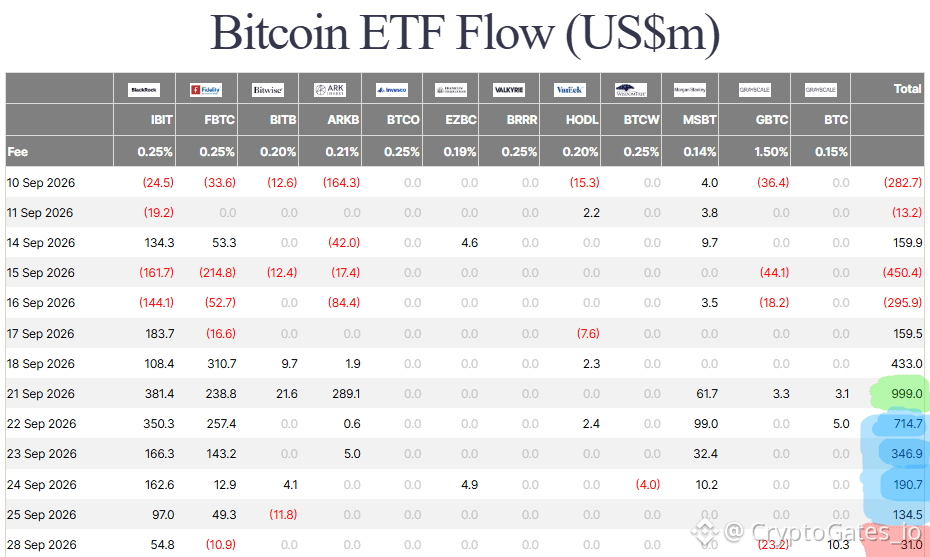
US spot Bitcoin ETFs have logged 8 straight days of net inflows. The daily prints tell a different story: $999M on Sep 21, then $714.7M, $346.9M, $190.7M, $134.5M, and just $31M on Sep 28. That is roughly a 97% drop from the peak day in one week 📉
Context matters too. On Sep 15 and 16, ETFs saw $450.4M and $295.9M of outflows, so the swing back to inflows was sharp.
BTC is sitting near $83K while flow intensity fades. Three scenarios I'm mapping:
Flows stabilize, and price builds a base
Flows keep shrinking and momentum stalls
A fresh inflow spike restarts the move
Price and flows need to agree before conviction means much.
Verify first. Risk later. Scale slowly...
#BTC #BitcoinETF #ETFFlows
$BTC ETF flows are still positive, but the momentum is cooling fast.
US spot Bitcoin ETFs have logged 8 straight days of net inflows. The daily prints tell a different story: $999M on Sep 21, then $714.7M, $346.9M, $190.7M, $134.5M, and just $31M on Sep 28. That is roughly a 97% drop from the peak day in one week 📉
Context matters too. On Sep 15 and 16, ETFs saw $450.4M and $295.9M of outflows, so the swing back to inflows was sharp.
BTC is sitting near $83K while flow intensity fades. Three scenarios I'm mapping:
Flows stabilize, and price builds a base
Flows keep shrinking and momentum stalls
A fresh inflow spike restarts the move
Price and flows need to agree before conviction means much.
Verify first. Risk later. Scale slowly...
#BTC #BitcoinETF #ETFFlows
US spot Bitcoin ETFs have logged 8 straight days of net inflows. The daily prints tell a different story: $999M on Sep 21, then $714.7M, $346.9M, $190.7M, $134.5M, and just $31M on Sep 28. That is roughly a 97% drop from the peak day in one week 📉
Context matters too. On Sep 15 and 16, ETFs saw $450.4M and $295.9M of outflows, so the swing back to inflows was sharp.
BTC is sitting near $83K while flow intensity fades. Three scenarios I'm mapping:
Flows stabilize, and price builds a base
Flows keep shrinking and momentum stalls
A fresh inflow spike restarts the move
Price and flows need to agree before conviction means much.
Verify first. Risk later. Scale slowly...
#BTC #BitcoinETF #ETFFlows
26
ETF Inflows Support BTC Near $84k
Bitcoin holds steady near $84k as spot ETFs record eight straight days of inflows, despite macro pressure from high treasury yields and rising crude prices.
#BitcoinETF #TreasuryYields
ETF Inflows Support BTC Near $84k
Bitcoin holds steady near $84k as spot ETFs record eight straight days of inflows, despite macro pressure from high treasury yields and rising crude prices.
#BitcoinETF #TreasuryYields
Bitcoin holds steady near $84k as spot ETFs record eight straight days of inflows, despite macro pressure from high treasury yields and rising crude prices.
#BitcoinETF #TreasuryYields
1
17

·
--
CoinShares:IBIT流入难证机构需求,基差交易是关键干扰
据Cointelegraph,CoinShares最新指出,BlackRock的$IBIT虽然提供了机构买入的线索,但基差交易的存在意味着ETF流入并不必然代表对$BTC上涨的押注。
这一判断的核心在于,部分资金可能通过持有IBIT现货并做空期货等方式进行套利,从而推高ETF净流入,却并不反映方向性看涨观点。因此,单看IBIT的资金流入数据,可能高估了机构对比特币的真实需求强度。
从市场影响看,如果后续ETF资金流数据继续走强,但IBIT与期货之间的基差并未同步收窄,那么这种流入的“含金量”就需要打折扣。反之,若基差交易占比下降,流入数据对$BTC资金面的支撑作用可能更直接。
需要观察的是,IBIT的流入结构是否伴随基差变化,以及$BTC在关键价位附近的成交量能否确认机构买盘的真实存在。交易层面,更值得等待资金流与基差信号的一致性确认,而不是单纯依据净流入数字做方向判断。
$IBIT $BTC #BitcoinETF #CryptoMarket
以上为信息整理与个人分析,不构成投资建议。
关注我,持续跟踪关键市场变化与数据。
CoinShares:IBIT流入难证机构需求,基差交易是关键干扰
据Cointelegraph,CoinShares最新指出,BlackRock的$IBIT虽然提供了机构买入的线索,但基差交易的存在意味着ETF流入并不必然代表对$BTC 上涨的押注。
这一判断的核心在于,部分资金可能通过持有IBIT现货并做空期货等方式进行套利,从而推高ETF净流入,却并不反映方向性看涨观点。因此,单看IBIT的资金流入数据,可能高估了机构对比特币的真实需求强度。
从市场影响看,如果后续ETF资金流数据继续走强,但IBIT与期货之间的基差并未同步收窄,那么这种流入的“含金量”就需要打折扣。反之,若基差交易占比下降,流入数据对$BTC 资金面的支撑作用可能更直接。
需要观察的是,IBIT的流入结构是否伴随基差变化,以及$BTC 在关键价位附近的成交量能否确认机构买盘的真实存在。交易层面,更值得等待资金流与基差信号的一致性确认,而不是单纯依据净流入数字做方向判断。
$IBIT $BTC #BitcoinETF #CryptoMarket
以上为信息整理与个人分析,不构成投资建议。
关注我,持续跟踪关键市场变化与数据。
据Cointelegraph,CoinShares最新指出,BlackRock的$IBIT虽然提供了机构买入的线索,但基差交易的存在意味着ETF流入并不必然代表对$BTC 上涨的押注。
这一判断的核心在于,部分资金可能通过持有IBIT现货并做空期货等方式进行套利,从而推高ETF净流入,却并不反映方向性看涨观点。因此,单看IBIT的资金流入数据,可能高估了机构对比特币的真实需求强度。
从市场影响看,如果后续ETF资金流数据继续走强,但IBIT与期货之间的基差并未同步收窄,那么这种流入的“含金量”就需要打折扣。反之,若基差交易占比下降,流入数据对$BTC 资金面的支撑作用可能更直接。
需要观察的是,IBIT的流入结构是否伴随基差变化,以及$BTC 在关键价位附近的成交量能否确认机构买盘的真实存在。交易层面,更值得等待资金流与基差信号的一致性确认,而不是单纯依据净流入数字做方向判断。
$IBIT $BTC #BitcoinETF #CryptoMarket
以上为信息整理与个人分析,不构成投资建议。
关注我,持续跟踪关键市场变化与数据。

92

·
--
比特币ETF资金刷新高?CoinShares提醒:流入不等于机构看涨!IBIT确实显示机构买入,但基础交易让数据复杂化。别被表面数字迷惑,不是所有资金都在赌BTC涨价!#BitcoinETF #比特币ETF $BTC
Bitcoin ETFs hitting new highs? CoinShares warns: Inflows ≠ institutional bullish bets! While IBIT shows some institutional buying, basis trades complicate the picture. Don't be fooled by surface numbers - not all this money is betting on $BTC rising! #BitcoinETF $BTC
比特币ETF资金刷新高?CoinShares提醒:流入不等于机构看涨!IBIT确实显示机构买入,但基础交易让数据复杂化。别被表面数字迷惑,不是所有资金都在赌BTC涨价!#BitcoinETF #比特币ETF $BTC
Bitcoin ETFs hitting new highs? CoinShares warns: Inflows ≠ institutional bullish bets! While IBIT shows some institutional buying, basis trades complicate the picture. Don't be fooled by surface numbers - not all this money is betting on $BTC rising! #BitcoinETF $BTC
Bitcoin ETFs hitting new highs? CoinShares warns: Inflows ≠ institutional bullish bets! While IBIT shows some institutional buying, basis trades complicate the picture. Don't be fooled by surface numbers - not all this money is betting on $BTC rising! #BitcoinETF $BTC
107
Don't get blinded by ETF inflows
CoinShares reports that recent Bitcoin ETF inflows may stem from basis trades instead of direct long bets, making it harder to gauge true institutional conviction.
#BitcoinETF #BasisTrading
Don't get blinded by ETF inflows
CoinShares reports that recent Bitcoin ETF inflows may stem from basis trades instead of direct long bets, making it harder to gauge true institutional conviction.
#BitcoinETF #BasisTrading
CoinShares reports that recent Bitcoin ETF inflows may stem from basis trades instead of direct long bets, making it harder to gauge true institutional conviction.
#BitcoinETF #BasisTrading

1
·
--
比特币强势反弹突破84,000美元!ETF资金流入3000万美元,以太坊也跟着小涨。不过ZEC走势不佳,成为周一唯一资金外流的加密ETF。市场情绪还是偏向乐观啊!
Bitcoin rebounds above $84K as ETFs pull in $30M! Ethereum leads modest recovery while ZEC extends its slide with the only outflow among crypto ETFs on Monday. Market sentiment remains bullish!
#BitcoinETF $BTC $ZEC
比特币强势反弹突破84,000美元!ETF资金流入3000万美元,以太坊也跟着小涨。不过ZEC走势不佳,成为周一唯一资金外流的加密ETF。市场情绪还是偏向乐观啊!
Bitcoin rebounds above $84K as ETFs pull in $30M! Ethereum leads modest recovery while ZEC extends its slide with the only outflow among crypto ETFs on Monday. Market sentiment remains bullish!
#BitcoinETF $BTC $ZEC
Bitcoin rebounds above $84K as ETFs pull in $30M! Ethereum leads modest recovery while ZEC extends its slide with the only outflow among crypto ETFs on Monday. Market sentiment remains bullish!
#BitcoinETF $BTC $ZEC
377

·
--
What Does A Single Bitcoin ETF Outflow Day Actually Tell You?$BTC | Every time the US spot Bitcoin ETFs post a big red flow number, someone asks whether institutions are quietly leaving and the top is in.
A single outflow day tells you almost nothing on its own. It becomes a real signal only when it repeats for five to ten straight sessions, which is roughly the window SatoshiMacro's daily flow tracker shows preceding actual BTC corrections historically. One red print is noise; a red week is data.
## Why One Day Of ETF Flow Data Rarely Means Anything
On the desk we never sized a position off one data point, and ETF flow reads are no different. SatoshiMacro's flow tracker showed US spot Bitcoin ETFs recording a net inflow of US$134.5 million on 25 September 2026, led by IBIT at plus US$97.0 million and FBTC at plus US$49.3 million. That is a green day. The session before it could just as easily have printed red by a similar margin, and neither one predicts tomorrow.
The eleven funds the tracker follows, IBIT, FBTC, GBTC, ARKB, BITB, the Grayscale Mini Trust, BTCO, EZBC, HODL, BRRR and DEFI, have traded since the SEC approved the category on 11 January 2024. Across that history, roughly 60 percent of trading sessions have closed with a positive net flow. That base rate alone tells you a single green or red day sits well inside normal variance, not at some extreme worth reacting to.
## What Actually Separates Signal From Noise
The pattern that has mattered historically is duration, not magnitude. Sustained inflow runs of five to ten trading days have preceded BTC rallies of eight to twenty percent. Outflow runs of similar length have preceded corrections of five to twelve percent. That is the threshold I actually watch, not the headline number on any single day.
Magnitude matters too, but only at the extremes. The largest single inflow day on record was a USD 1.4 billion session in November 2024, driven by the post-election Bitcoin rally. The largest single outflow was a USD 1.1 billion session in late February 2025, tied to broad macro de-risking. Both got attention precisely because they were rare, not because one unusual day is diagnostic by itself.
## A Worked Example: Reading A Real Outflow Run
Say the tracker shows six straight red days totalling roughly US$800 million in net redemptions, with GBTC as the largest single contributor. That clears the five-to-ten-day threshold above, so it is worth treating as a genuine de-risking signal, not a certainty that a top is in.
My read is you check where the outflow is concentrated before drawing any conclusion. GBTC has bled roughly USD 28 billion in net outflows since launch, mostly investors migrating to cheaper fee structures, which is a structural story that keeps repeating and tells you little about fresh demand. IBIT and FBTC both turning negative at the same time is a different reading entirely, since IBIT alone has pulled in over USD 60 billion in net inflows since launch and reached USD 50 billion in assets faster than any ETF on record. A GBTC-only outflow run barely moves my thinking. IBIT and FBTC joining it does.
## Why This Matters More For AUD Investors Than It Looks
Australian investors accessing these funds through an AFSL-licensed broker, with Stake and Interactive Brokers the common routes, are literally inside this flow data on the buy side, not just reading a US chart from the outside. Every buy order routed through one of those platforms adds to the print that Farside publishes the next US afternoon.
That flow also transmits directly to spot BTC price, which is what actually drives your AUD-denominated Bitcoin holdings, not the US dollar headline. It matters at a smaller scale too. Combined ASX-listed spot Bitcoin ETF holdings totalled A$427.9 million as of August 2026, a fraction of the US market but the same underlying mechanic, and the same signal-versus-noise question applies before you read anything into a single day's move there either.
## Where This Data Actually Comes From
The tracker pulls from Farside Investors, who publish the daily issuer-by-issuer flow table scraped from each fund's official AUM disclosure, with SoSoValue as a fallback source. Updates land on a T+1 cadence, meaning yesterday's flows post the next US afternoon, so anything you read on a given Sydney morning is already a session old by the time it lands. That lag matters for how you use the number: it is a same-day confirmation tool, not a live trading signal.
It also explains why smaller issuers regularly print a flat zero. ARKB, BITB, the Grayscale Mini Trust, BTCO, EZBC, HODL, BRRR and DEFI each carry far smaller assets under management than IBIT, FBTC or GBTC, so a day with no creations or redemptions at all is completely normal for them and should not be read as a warning sign about the fund itself.
## The Honest Limitation
This is a flow signal, not a forecasting model. It tells you about institutional positioning through one specific product wrapper. It says nothing about on-chain accumulation, leverage building in perpetual futures, or retail sentiment away from these eleven funds. I treat it as one input into a wider cycle read, alongside the other tier signals in the SatoshiMacro Model, never as the whole picture on its own.
If you are trading the reaction rather than the fund itself, remember the flow-to-price relationship SatoshiMacro's tracker documents runs one to three trading days ahead at swing-trade horizons and two to four weeks at trend-trade horizons. React to the run, not the print.
https://satoshimacro.com/tools/crypto/etf-flows/daily-spot-etf-flows/?utm_source=binance_square&utm_medium=social&utm_campaign=autopilot_article
#SatoshiMacro #BitcoinETF #ETFFlows #Bitcoin
What Does A Single Bitcoin ETF Outflow Day Actually Tell You?
$BTC | Every time the US spot Bitcoin ETFs post a big red flow number, someone asks whether institutions are quietly leaving and the top is in.
A single outflow day tells you almost nothing on its own. It becomes a real signal only when it repeats for five to ten straight sessions, which is roughly the window SatoshiMacro's daily flow tracker shows preceding actual BTC corrections historically. One red print is noise; a red week is data.
## Why One Day Of ETF Flow Data Rarely Means Anything
On the desk we never sized a position off one data point, and ETF flow reads are no different. SatoshiMacro's flow tracker showed US spot Bitcoin ETFs recording a net inflow of US$134.5 million on 25 September 2026, led by IBIT at plus US$97.0 million and FBTC at plus US$49.3 million. That is a green day. The session before it could just as easily have printed red by a similar margin, and neither one predicts tomorrow.
The eleven funds the tracker follows, IBIT, FBTC, GBTC, ARKB, BITB, the Grayscale Mini Trust, BTCO, EZBC, HODL, BRRR and DEFI, have traded since the SEC approved the category on 11 January 2024. Across that history, roughly 60 percent of trading sessions have closed with a positive net flow. That base rate alone tells you a single green or red day sits well inside normal variance, not at some extreme worth reacting to.
## What Actually Separates Signal From Noise
The pattern that has mattered historically is duration, not magnitude. Sustained inflow runs of five to ten trading days have preceded BTC rallies of eight to twenty percent. Outflow runs of similar length have preceded corrections of five to twelve percent. That is the threshold I actually watch, not the headline number on any single day.
Magnitude matters too, but only at the extremes. The largest single inflow day on record was a USD 1.4 billion session in November 2024, driven by the post-election Bitcoin rally. The largest single outflow was a USD 1.1 billion session in late February 2025, tied to broad macro de-risking. Both got attention precisely because they were rare, not because one unusual day is diagnostic by itself.
## A Worked Example: Reading A Real Outflow Run
Say the tracker shows six straight red days totalling roughly US$800 million in net redemptions, with GBTC as the largest single contributor. That clears the five-to-ten-day threshold above, so it is worth treating as a genuine de-risking signal, not a certainty that a top is in.
My read is you check where the outflow is concentrated before drawing any conclusion. GBTC has bled roughly USD 28 billion in net outflows since launch, mostly investors migrating to cheaper fee structures, which is a structural story that keeps repeating and tells you little about fresh demand. IBIT and FBTC both turning negative at the same time is a different reading entirely, since IBIT alone has pulled in over USD 60 billion in net inflows since launch and reached USD 50 billion in assets faster than any ETF on record. A GBTC-only outflow run barely moves my thinking. IBIT and FBTC joining it does.
## Why This Matters More For AUD Investors Than It Looks
Australian investors accessing these funds through an AFSL-licensed broker, with Stake and Interactive Brokers the common routes, are literally inside this flow data on the buy side, not just reading a US chart from the outside. Every buy order routed through one of those platforms adds to the print that Farside publishes the next US afternoon.
That flow also transmits directly to spot BTC price, which is what actually drives your AUD-denominated Bitcoin holdings, not the US dollar headline. It matters at a smaller scale too. Combined ASX-listed spot Bitcoin ETF holdings totalled A$427.9 million as of August 2026, a fraction of the US market but the same underlying mechanic, and the same signal-versus-noise question applies before you read anything into a single day's move there either.
## Where This Data Actually Comes From
The tracker pulls from Farside Investors, who publish the daily issuer-by-issuer flow table scraped from each fund's official AUM disclosure, with SoSoValue as a fallback source. Updates land on a T+1 cadence, meaning yesterday's flows post the next US afternoon, so anything you read on a given Sydney morning is already a session old by the time it lands. That lag matters for how you use the number: it is a same-day confirmation tool, not a live trading signal.
It also explains why smaller issuers regularly print a flat zero. ARKB, BITB, the Grayscale Mini Trust, BTCO, EZBC, HODL, BRRR and DEFI each carry far smaller assets under management than IBIT, FBTC or GBTC, so a day with no creations or redemptions at all is completely normal for them and should not be read as a warning sign about the fund itself.
## The Honest Limitation
This is a flow signal, not a forecasting model. It tells you about institutional positioning through one specific product wrapper. It says nothing about on-chain accumulation, leverage building in perpetual futures, or retail sentiment away from these eleven funds. I treat it as one input into a wider cycle read, alongside the other tier signals in the SatoshiMacro Model, never as the whole picture on its own.
If you are trading the reaction rather than the fund itself, remember the flow-to-price relationship SatoshiMacro's tracker documents runs one to three trading days ahead at swing-trade horizons and two to four weeks at trend-trade horizons. React to the run, not the print.
https://satoshimacro.com/tools/crypto/etf-flows/daily-spot-etf-flows/?utm_source=binance_square&utm_medium=social&utm_campaign=autopilot_article
#SatoshiMacro #BitcoinETF #ETFFlows #Bitcoin
A single outflow day tells you almost nothing on its own. It becomes a real signal only when it repeats for five to ten straight sessions, which is roughly the window SatoshiMacro's daily flow tracker shows preceding actual BTC corrections historically. One red print is noise; a red week is data.
## Why One Day Of ETF Flow Data Rarely Means Anything
On the desk we never sized a position off one data point, and ETF flow reads are no different. SatoshiMacro's flow tracker showed US spot Bitcoin ETFs recording a net inflow of US$134.5 million on 25 September 2026, led by IBIT at plus US$97.0 million and FBTC at plus US$49.3 million. That is a green day. The session before it could just as easily have printed red by a similar margin, and neither one predicts tomorrow.
The eleven funds the tracker follows, IBIT, FBTC, GBTC, ARKB, BITB, the Grayscale Mini Trust, BTCO, EZBC, HODL, BRRR and DEFI, have traded since the SEC approved the category on 11 January 2024. Across that history, roughly 60 percent of trading sessions have closed with a positive net flow. That base rate alone tells you a single green or red day sits well inside normal variance, not at some extreme worth reacting to.
## What Actually Separates Signal From Noise
The pattern that has mattered historically is duration, not magnitude. Sustained inflow runs of five to ten trading days have preceded BTC rallies of eight to twenty percent. Outflow runs of similar length have preceded corrections of five to twelve percent. That is the threshold I actually watch, not the headline number on any single day.
Magnitude matters too, but only at the extremes. The largest single inflow day on record was a USD 1.4 billion session in November 2024, driven by the post-election Bitcoin rally. The largest single outflow was a USD 1.1 billion session in late February 2025, tied to broad macro de-risking. Both got attention precisely because they were rare, not because one unusual day is diagnostic by itself.
## A Worked Example: Reading A Real Outflow Run
Say the tracker shows six straight red days totalling roughly US$800 million in net redemptions, with GBTC as the largest single contributor. That clears the five-to-ten-day threshold above, so it is worth treating as a genuine de-risking signal, not a certainty that a top is in.
My read is you check where the outflow is concentrated before drawing any conclusion. GBTC has bled roughly USD 28 billion in net outflows since launch, mostly investors migrating to cheaper fee structures, which is a structural story that keeps repeating and tells you little about fresh demand. IBIT and FBTC both turning negative at the same time is a different reading entirely, since IBIT alone has pulled in over USD 60 billion in net inflows since launch and reached USD 50 billion in assets faster than any ETF on record. A GBTC-only outflow run barely moves my thinking. IBIT and FBTC joining it does.
## Why This Matters More For AUD Investors Than It Looks
Australian investors accessing these funds through an AFSL-licensed broker, with Stake and Interactive Brokers the common routes, are literally inside this flow data on the buy side, not just reading a US chart from the outside. Every buy order routed through one of those platforms adds to the print that Farside publishes the next US afternoon.
That flow also transmits directly to spot BTC price, which is what actually drives your AUD-denominated Bitcoin holdings, not the US dollar headline. It matters at a smaller scale too. Combined ASX-listed spot Bitcoin ETF holdings totalled A$427.9 million as of August 2026, a fraction of the US market but the same underlying mechanic, and the same signal-versus-noise question applies before you read anything into a single day's move there either.
## Where This Data Actually Comes From
The tracker pulls from Farside Investors, who publish the daily issuer-by-issuer flow table scraped from each fund's official AUM disclosure, with SoSoValue as a fallback source. Updates land on a T+1 cadence, meaning yesterday's flows post the next US afternoon, so anything you read on a given Sydney morning is already a session old by the time it lands. That lag matters for how you use the number: it is a same-day confirmation tool, not a live trading signal.
It also explains why smaller issuers regularly print a flat zero. ARKB, BITB, the Grayscale Mini Trust, BTCO, EZBC, HODL, BRRR and DEFI each carry far smaller assets under management than IBIT, FBTC or GBTC, so a day with no creations or redemptions at all is completely normal for them and should not be read as a warning sign about the fund itself.
## The Honest Limitation
This is a flow signal, not a forecasting model. It tells you about institutional positioning through one specific product wrapper. It says nothing about on-chain accumulation, leverage building in perpetual futures, or retail sentiment away from these eleven funds. I treat it as one input into a wider cycle read, alongside the other tier signals in the SatoshiMacro Model, never as the whole picture on its own.
If you are trading the reaction rather than the fund itself, remember the flow-to-price relationship SatoshiMacro's tracker documents runs one to three trading days ahead at swing-trade horizons and two to four weeks at trend-trade horizons. React to the run, not the print.
https://satoshimacro.com/tools/crypto/etf-flows/daily-spot-etf-flows/?utm_source=binance_square&utm_medium=social&utm_campaign=autopilot_article
#SatoshiMacro #BitcoinETF #ETFFlows #Bitcoin
81

👀 EVERYONE IS WATCHING THE PRICE… BUT THIS NUMBER MATTERS MORE.
$BTC pulled back from the $86K area.
{spot}(BTCUSDT)
But Bitcoin ETF demand is still showing strength.
One day alone saw nearly $1 BILLION in inflows. 🧲🔥
So what’s happening?
📉 Price is cooling.
💰 Demand is still there.
Is this a normal reset… or the setup for the next move? 👀
#Bitcoin #BTC #Crypto #Binance #BitcoinETF #CryptoMarket #Web3 #Trading
👀 EVERYONE IS WATCHING THE PRICE… BUT THIS NUMBER MATTERS MORE.
$BTC pulled back from the $86K area.
But Bitcoin ETF demand is still showing strength.
One day alone saw nearly $1 BILLION in inflows. 🧲🔥
So what’s happening?
📉 Price is cooling.
💰 Demand is still there.
Is this a normal reset… or the setup for the next move? 👀
#Bitcoin #BTC #Crypto #Binance #BitcoinETF #CryptoMarket #Web3 #Trading
$BTC pulled back from the $86K area.
But Bitcoin ETF demand is still showing strength.
One day alone saw nearly $1 BILLION in inflows. 🧲🔥
So what’s happening?
📉 Price is cooling.
💰 Demand is still there.
Is this a normal reset… or the setup for the next move? 👀
#Bitcoin #BTC #Crypto #Binance #BitcoinETF #CryptoMarket #Web3 #Trading
41

·
--
$BTC
ETF买了这么多,怎么还在跌?
截至9月28日23:52(北京时间),币安BTC/USDT报83,251,24小时跌1.46%。Farside统计,上周美国现货BTC ETF净流入约23.86亿美元,五个交易日都是净流入。
这两组数据放一起,我暂时乐观不起来。ETF确实在买,但这笔买盘能不能推着价格往上走,还得看其他地方有多少人在卖。光凭净流入,就说机构已经把底托住了,我觉得有点早。
还有个变化:上周一净流入约9.99亿美元,到周五只有1.35亿美元。钱还在进,力度却小了不少。当然,几天的数据不能直接推成趋势,但也不能只挑那个最大的数字看。
我的看法是,接下来如果流入减少,价格反而能稳住,那倒值得多看一眼,可能卖压也在减轻。要是资金继续进、价格继续跌,我会先怀疑上面还有卖盘没消化完,不急着把每次回落都叫洗盘。
周一的ETF完整数据还没出来,先等这一笔。
#比特币 #BitcoinETF
$BTC
ETF买了这么多,怎么还在跌?
截至9月28日23:52(北京时间),币安BTC/USDT报83,251,24小时跌1.46%。Farside统计,上周美国现货BTC ETF净流入约23.86亿美元,五个交易日都是净流入。
这两组数据放一起,我暂时乐观不起来。ETF确实在买,但这笔买盘能不能推着价格往上走,还得看其他地方有多少人在卖。光凭净流入,就说机构已经把底托住了,我觉得有点早。
还有个变化:上周一净流入约9.99亿美元,到周五只有1.35亿美元。钱还在进,力度却小了不少。当然,几天的数据不能直接推成趋势,但也不能只挑那个最大的数字看。
我的看法是,接下来如果流入减少,价格反而能稳住,那倒值得多看一眼,可能卖压也在减轻。要是资金继续进、价格继续跌,我会先怀疑上面还有卖盘没消化完,不急着把每次回落都叫洗盘。
周一的ETF完整数据还没出来,先等这一笔。
#比特币 #BitcoinETF
ETF买了这么多,怎么还在跌?
截至9月28日23:52(北京时间),币安BTC/USDT报83,251,24小时跌1.46%。Farside统计,上周美国现货BTC ETF净流入约23.86亿美元,五个交易日都是净流入。
这两组数据放一起,我暂时乐观不起来。ETF确实在买,但这笔买盘能不能推着价格往上走,还得看其他地方有多少人在卖。光凭净流入,就说机构已经把底托住了,我觉得有点早。
还有个变化:上周一净流入约9.99亿美元,到周五只有1.35亿美元。钱还在进,力度却小了不少。当然,几天的数据不能直接推成趋势,但也不能只挑那个最大的数字看。
我的看法是,接下来如果流入减少,价格反而能稳住,那倒值得多看一眼,可能卖压也在减轻。要是资金继续进、价格继续跌,我会先怀疑上面还有卖盘没消化完,不急着把每次回落都叫洗盘。
周一的ETF完整数据还没出来,先等这一笔。
#比特币 #BitcoinETF
60

BITCOIN ETFS DRAW $3B AS 2026 FLOWS TURN POSITIVE!
Institutional Bitcoin demand has staged a sharp comeback.
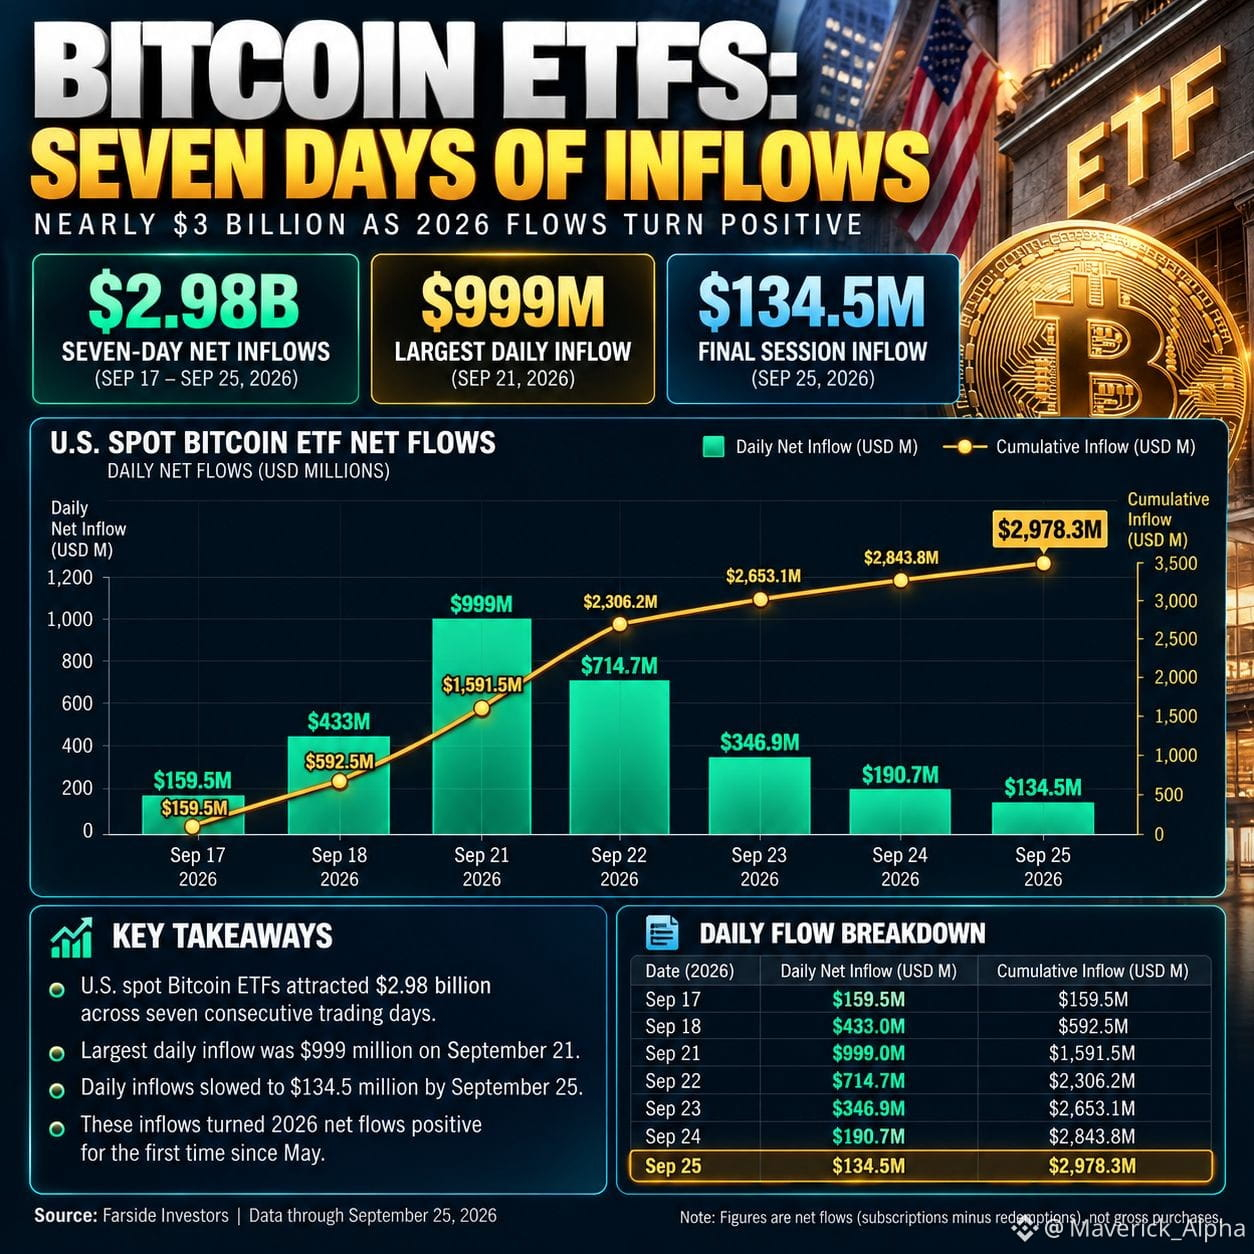
U.S. spot Bitcoin ETFs attracted $2.98 billion across seven consecutive trading days, reversing their earlier 2026 net outflows.
The biggest session brought in $999 million on September 21. BlackRock and Fidelity were major contributors to the rally in fund flows.
But there's a catch: daily inflows slowed to $134.5 million by September 25.
The recovery is significant, although continued inflows and Bitcoin's price action will determine whether demand remains strong.
MY FINAL TAKE
Nearly $3 billion in net inflows shows renewed demand through U.S. Bitcoin ETFs. The next test is whether that demand broadens and continues.
Can Bitcoin ETFs maintain their inflow streak as momentum slows?
#Bitcoin #BitcoinETF
$BTC
{future}(BTCUSDT)
BITCOIN ETFS DRAW $3B AS 2026 FLOWS TURN POSITIVE!
Institutional Bitcoin demand has staged a sharp comeback.
U.S. spot Bitcoin ETFs attracted $2.98 billion across seven consecutive trading days, reversing their earlier 2026 net outflows.
The biggest session brought in $999 million on September 21. BlackRock and Fidelity were major contributors to the rally in fund flows.
But there's a catch: daily inflows slowed to $134.5 million by September 25.
The recovery is significant, although continued inflows and Bitcoin's price action will determine whether demand remains strong.
MY FINAL TAKE
Nearly $3 billion in net inflows shows renewed demand through U.S. Bitcoin ETFs. The next test is whether that demand broadens and continues.
Can Bitcoin ETFs maintain their inflow streak as momentum slows?
#Bitcoin #BitcoinETF
$BTC
Institutional Bitcoin demand has staged a sharp comeback.
U.S. spot Bitcoin ETFs attracted $2.98 billion across seven consecutive trading days, reversing their earlier 2026 net outflows.
The biggest session brought in $999 million on September 21. BlackRock and Fidelity were major contributors to the rally in fund flows.
But there's a catch: daily inflows slowed to $134.5 million by September 25.
The recovery is significant, although continued inflows and Bitcoin's price action will determine whether demand remains strong.
MY FINAL TAKE
Nearly $3 billion in net inflows shows renewed demand through U.S. Bitcoin ETFs. The next test is whether that demand broadens and continues.
Can Bitcoin ETFs maintain their inflow streak as momentum slows?
#Bitcoin #BitcoinETF
$BTC

36

·
--
တက်ရိပ်ရှိသည်
#BitcoinSpotETFs$2.39BWeeklyNetInflowBREAKING: BITCOIN ETF DEMAND IS BACK! 🔥
Bitcoin Spot ETFs recorded a massive $2.39 BILLION in weekly net inflows! 💰📈
Institutional demand continues to show strong interest in $BTC, with billions flowing into spot Bitcoin ETFs.
Could this renewed capital flow become another catalyst for Bitcoin’s next major move? 👀🚀
#Bitcoin #BTC #Crypto #BitcoinETF $BTC
{future}(BTCUSDT)
#BitcoinSpotETFs$2.39BWeeklyNetInflowBREAKING: BITCOIN ETF DEMAND IS BACK! 🔥
Bitcoin Spot ETFs recorded a massive $2.39 BILLION in weekly net inflows! 💰📈
Institutional demand continues to show strong interest in $BTC , with billions flowing into spot Bitcoin ETFs.
Could this renewed capital flow become another catalyst for Bitcoin’s next major move? 👀🚀
#Bitcoin #BTC #Crypto #BitcoinETF $BTC
Bitcoin Spot ETFs recorded a massive $2.39 BILLION in weekly net inflows! 💰📈
Institutional demand continues to show strong interest in $BTC , with billions flowing into spot Bitcoin ETFs.
Could this renewed capital flow become another catalyst for Bitcoin’s next major move? 👀🚀
#Bitcoin #BTC #Crypto #BitcoinETF $BTC

1
117

·
--
တက်ရိပ်ရှိသည်
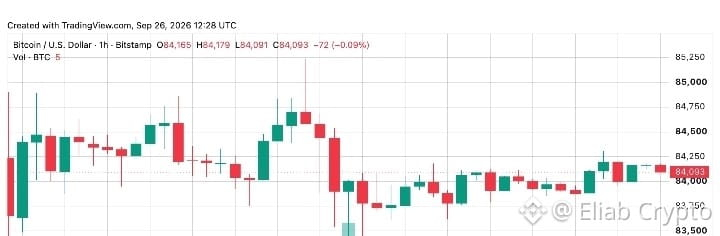
#U.S. spot Bitcoin ETFs recorded approximately $2.4 billion in net inflows between September 21 and 25. Flows remained positive every day, confirming that institutional interest is still present
However, the pace gradually slowed: from around $999 million on #September 21 to nearly $134 million on September 25. This does not necessarily mean the trend is over, but it shows that the market should monitor demand quality instead of price alone
#bitcoin #BitcoinETF
#U.S. spot Bitcoin ETFs recorded approximately $2.4 billion in net inflows between September 21 and 25. Flows remained positive every day, confirming that institutional interest is still present
However, the pace gradually slowed: from around $999 million on #September 21 to nearly $134 million on September 25. This does not necessarily mean the trend is over, but it shows that the market should monitor demand quality instead of price alone
#bitcoin #BitcoinETF
However, the pace gradually slowed: from around $999 million on #September 21 to nearly $134 million on September 25. This does not necessarily mean the trend is over, but it shows that the market should monitor demand quality instead of price alone
#bitcoin #BitcoinETF
3
100

₿ BTC ETF WATCH
Bitcoin remains around the $84K area while ETF activity is getting renewed attention.
Recent reports showed around $2.39B in weekly U.S. spot Bitcoin ETF inflows through September 25.
Today’s key themes:
🔸 $84K–$85K price zone
🔸 ETF flows
🔸 Trading volume
🔸 Interest-rate expectations
🔸 Macro news
Strong flows are interesting—but they don't guarantee the next price move.
Watch the data, not the predictions.
$BTC
{spot}(BTCUSDT)
$NVDAB
{spot}(NVDABUSDT)
$ETH
{future}(ETHUSDT)
#Bitcoin #BTC #Crypto #BinanceSquare #BitcoinETF
₿ BTC ETF WATCH
Bitcoin remains around the $84K area while ETF activity is getting renewed attention.
Recent reports showed around $2.39B in weekly U.S. spot Bitcoin ETF inflows through September 25.
Today’s key themes:
🔸 $84K–$85K price zone
🔸 ETF flows
🔸 Trading volume
🔸 Interest-rate expectations
🔸 Macro news
Strong flows are interesting—but they don't guarantee the next price move.
Watch the data, not the predictions.
$BTC
$NVDAB
$ETH
#Bitcoin #BTC #Crypto #BinanceSquare #BitcoinETF
Bitcoin remains around the $84K area while ETF activity is getting renewed attention.
Recent reports showed around $2.39B in weekly U.S. spot Bitcoin ETF inflows through September 25.
Today’s key themes:
🔸 $84K–$85K price zone
🔸 ETF flows
🔸 Trading volume
🔸 Interest-rate expectations
🔸 Macro news
Strong flows are interesting—but they don't guarantee the next price move.
Watch the data, not the predictions.
$BTC
$NVDAB
$ETH
#Bitcoin #BTC #Crypto #BinanceSquare #BitcoinETF

34

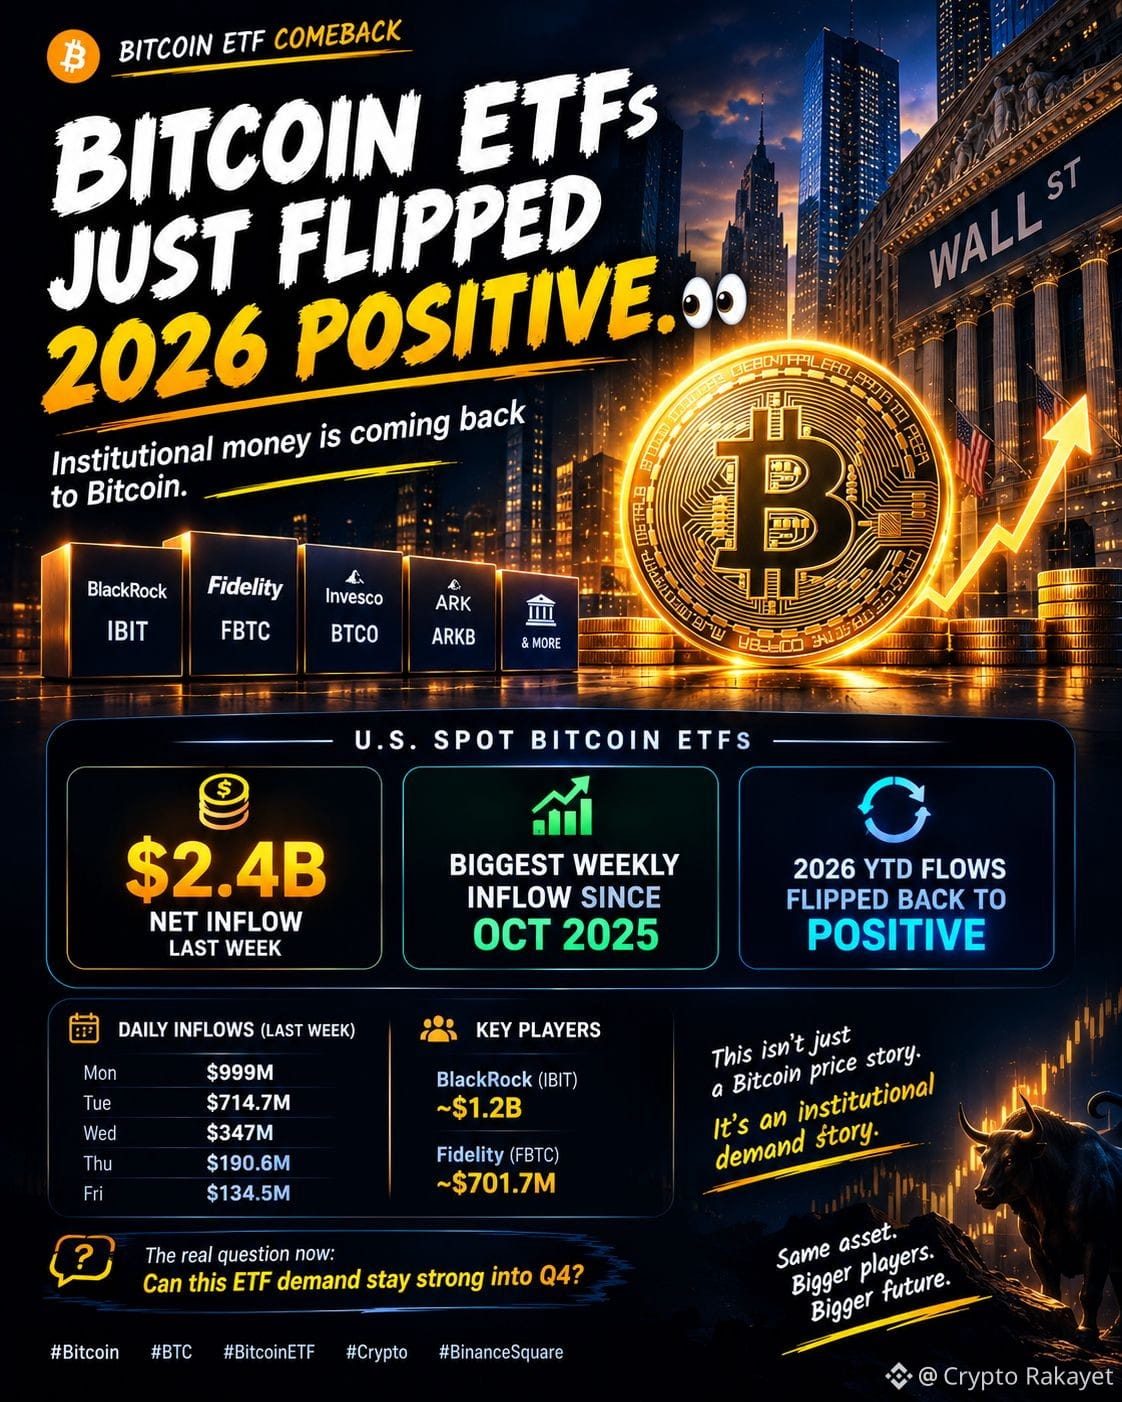
🚨 BITCOIN ETFs JUST FLIPPED 2026 POSITIVE. 👀
Institutional money is coming back to Bitcoin.
U.S. spot Bitcoin ETFs recorded around:
💰 $2.4 BILLION in net inflows last week
📈 Biggest weekly inflow since October 2025
🔄 2026 YTD ETF flows flipped back into positive territory
🏦 $57.6B+ cumulative net inflows since launch
And the daily numbers were massive:
🔥 Monday: $999M
🔥 Tuesday: $714.7M
🔥 Wednesday: $347M
🔥 Thursday: $190.6M
🔥 Friday: $134.5M
That's roughly $2.4B in just five trading sessions.
Even more interesting:
BlackRock's IBIT alone attracted about $1.2B during the week, while Fidelity's FBTC added around $701.7M.
This isn't just a Bitcoin price story.
It's an institutional demand story. 👀
But there's one thing I'm watching closely:
The daily inflows declined throughout the week.
So the real question isn't simply:
“Are institutions buying Bitcoin?”
The answer is clearly YES.
The bigger question is:
Can this ETF demand stay strong into Q4? 🔥
If the inflows continue, institutional demand could remain one of the most important forces shaping Bitcoin's next phase.
What are you watching more closely?
🏦 ETF FLOWS
or
📊 BTC PRICE ACTION?
#bitcoin #BTC #BitcoinETF #crypto #BinanceSquare
🚨 BITCOIN ETFs JUST FLIPPED 2026 POSITIVE. 👀
Institutional money is coming back to Bitcoin.
U.S. spot Bitcoin ETFs recorded around:
💰 $2.4 BILLION in net inflows last week
📈 Biggest weekly inflow since October 2025
🔄 2026 YTD ETF flows flipped back into positive territory
🏦 $57.6B+ cumulative net inflows since launch
And the daily numbers were massive:
🔥 Monday: $999M
🔥 Tuesday: $714.7M
🔥 Wednesday: $347M
🔥 Thursday: $190.6M
🔥 Friday: $134.5M
That's roughly $2.4B in just five trading sessions.
Even more interesting:
BlackRock's IBIT alone attracted about $1.2B during the week, while Fidelity's FBTC added around $701.7M.
This isn't just a Bitcoin price story.
It's an institutional demand story. 👀
But there's one thing I'm watching closely:
The daily inflows declined throughout the week.
So the real question isn't simply:
“Are institutions buying Bitcoin?”
The answer is clearly YES.
The bigger question is:
Can this ETF demand stay strong into Q4? 🔥
If the inflows continue, institutional demand could remain one of the most important forces shaping Bitcoin's next phase.
What are you watching more closely?
🏦 ETF FLOWS
or
📊 BTC PRICE ACTION?
#bitcoin #BTC #BitcoinETF #crypto #BinanceSquare
Institutional money is coming back to Bitcoin.
U.S. spot Bitcoin ETFs recorded around:
💰 $2.4 BILLION in net inflows last week
📈 Biggest weekly inflow since October 2025
🔄 2026 YTD ETF flows flipped back into positive territory
🏦 $57.6B+ cumulative net inflows since launch
And the daily numbers were massive:
🔥 Monday: $999M
🔥 Tuesday: $714.7M
🔥 Wednesday: $347M
🔥 Thursday: $190.6M
🔥 Friday: $134.5M
That's roughly $2.4B in just five trading sessions.
Even more interesting:
BlackRock's IBIT alone attracted about $1.2B during the week, while Fidelity's FBTC added around $701.7M.
This isn't just a Bitcoin price story.
It's an institutional demand story. 👀
But there's one thing I'm watching closely:
The daily inflows declined throughout the week.
So the real question isn't simply:
“Are institutions buying Bitcoin?”
The answer is clearly YES.
The bigger question is:
Can this ETF demand stay strong into Q4? 🔥
If the inflows continue, institutional demand could remain one of the most important forces shaping Bitcoin's next phase.
What are you watching more closely?
🏦 ETF FLOWS
or
📊 BTC PRICE ACTION?
#bitcoin #BTC #BitcoinETF #crypto #BinanceSquare
68

US spot Bitcoin ETFs flipped their 2026 net flows positive after a strong multi-day inflow streak.
Largest daily print recently was close to $1B.
Institutional demand is still very much present even as price consolidates.
This remains one of the most important narratives right now.
Not financial advice. DYOR.
#BitcoinETF #Institutional #BTC
US spot Bitcoin ETFs flipped their 2026 net flows positive after a strong multi-day inflow streak.
Largest daily print recently was close to $1B.
Institutional demand is still very much present even as price consolidates.
This remains one of the most important narratives right now.
Not financial advice. DYOR.
#BitcoinETF #Institutional #BTC
Largest daily print recently was close to $1B.
Institutional demand is still very much present even as price consolidates.
This remains one of the most important narratives right now.
Not financial advice. DYOR.
#BitcoinETF #Institutional #BTC
34

·
--
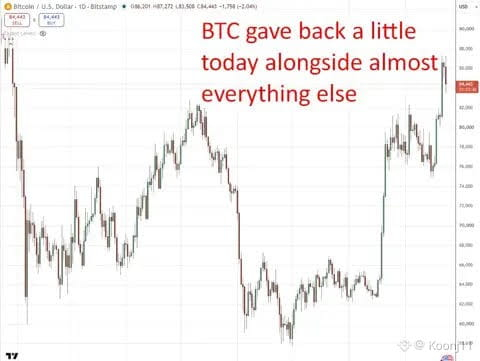
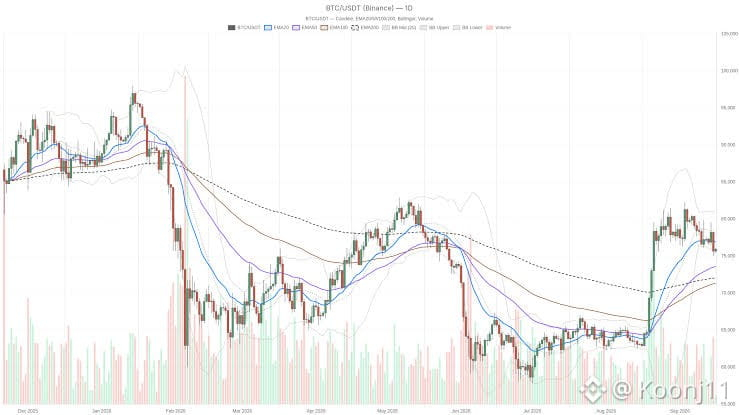
$BTC — Bitcoin ETF Update
U.S. Spot Bitcoin ETFs recorded approximately $2.4B in net inflows during the week ending September 25, marking the strongest weekly inflow period of 2026.
The inflow streak reached 7 consecutive trading days, while Bitcoin remained around the $84K area.
ETF Watch: • Weekly Inflows: ~$2.4B
• BTC: ~$84K
• Inflow Streak: 7 sessions
• Key Support: $82K–$83K
• Resistance: $85K–$87K
• Focus: Institutional ETF demand
The key question for the market is whether continued ETF demand can translate into stronger price momentum around the $85K resistance zone.
#BTC #bitcoin #BitcoinETF #CryptoNews #CryptoMarkets
$BTC — Bitcoin ETF Update
U.S. Spot Bitcoin ETFs recorded approximately $2.4B in net inflows during the week ending September 25, marking the strongest weekly inflow period of 2026.
The inflow streak reached 7 consecutive trading days, while Bitcoin remained around the $84K area.
ETF Watch: • Weekly Inflows: ~$2.4B
• BTC: ~$84K
• Inflow Streak: 7 sessions
• Key Support: $82K–$83K
• Resistance: $85K–$87K
• Focus: Institutional ETF demand
The key question for the market is whether continued ETF demand can translate into stronger price momentum around the $85K resistance zone.
#BTC #bitcoin #BitcoinETF #CryptoNews #CryptoMarkets
U.S. Spot Bitcoin ETFs recorded approximately $2.4B in net inflows during the week ending September 25, marking the strongest weekly inflow period of 2026.
The inflow streak reached 7 consecutive trading days, while Bitcoin remained around the $84K area.
ETF Watch: • Weekly Inflows: ~$2.4B
• BTC: ~$84K
• Inflow Streak: 7 sessions
• Key Support: $82K–$83K
• Resistance: $85K–$87K
• Focus: Institutional ETF demand
The key question for the market is whether continued ETF demand can translate into stronger price momentum around the $85K resistance zone.
#BTC #bitcoin #BitcoinETF #CryptoNews #CryptoMarkets
57

·
--
တက်ရိပ်ရှိသည်
🐋 INSTITUTIONS ARE BUYING BITCOIN — BUT WHY?
Something important is happening behind the Bitcoin price action. 👀
U.S. spot Bitcoin ETFs just recorded $2.4 BILLION in net inflows in one week — their strongest weekly inflow since October 2025. 🚨
That pushed Bitcoin ETF flows for 2026 back into positive territory after being billions of dollars underwater earlier this year.
And this isn't just one random day.
Recent sessions showed major inflows, including nearly $1 BILLION on September 21 and another $714.7M on September 22.
BlackRock's IBIT and Fidelity's FBTC have accounted for a large portion of those recent flows.
So what does this actually mean for BTC?
🏦 Institutional demand is returning
💰 Billions are flowing through spot ETFs
🐋 Large players are gaining exposure
📈 Bitcoin liquidity is being absorbed through regulated investment vehicles
BUT…
⚠️ ETF inflows do NOT guarantee that Bitcoin will continue rising.
Other investors can sell into that demand, and macro conditions, derivatives positioning and broader market liquidity can still change the picture.
That's why I'm watching ETF flows + BTC price + volume + exchange flows together.
The BIG question now:
Are institutions positioning for the next major Bitcoin move… or simply adding exposure while BTC remains volatile? 👀
👇 What do you think?
🐋 INSTITUTIONAL ACCUMULATION
or
⏳ JUST TEMPORARY DEMAND?
#Bitcoin #Crypto #BitcoinETF #InstitutionalInvestors
🐋 INSTITUTIONS ARE BUYING BITCOIN — BUT WHY?
Something important is happening behind the Bitcoin price action. 👀
U.S. spot Bitcoin ETFs just recorded $2.4 BILLION in net inflows in one week — their strongest weekly inflow since October 2025. 🚨
That pushed Bitcoin ETF flows for 2026 back into positive territory after being billions of dollars underwater earlier this year.
And this isn't just one random day.
Recent sessions showed major inflows, including nearly $1 BILLION on September 21 and another $714.7M on September 22.
BlackRock's IBIT and Fidelity's FBTC have accounted for a large portion of those recent flows.
So what does this actually mean for BTC?
🏦 Institutional demand is returning
💰 Billions are flowing through spot ETFs
🐋 Large players are gaining exposure
📈 Bitcoin liquidity is being absorbed through regulated investment vehicles
BUT…
⚠️ ETF inflows do NOT guarantee that Bitcoin will continue rising.
Other investors can sell into that demand, and macro conditions, derivatives positioning and broader market liquidity can still change the picture.
That's why I'm watching ETF flows + BTC price + volume + exchange flows together.
The BIG question now:
Are institutions positioning for the next major Bitcoin move… or simply adding exposure while BTC remains volatile? 👀
👇 What do you think?
🐋 INSTITUTIONAL ACCUMULATION
or
⏳ JUST TEMPORARY DEMAND?
#Bitcoin #Crypto #BitcoinETF #InstitutionalInvestors
Something important is happening behind the Bitcoin price action. 👀
U.S. spot Bitcoin ETFs just recorded $2.4 BILLION in net inflows in one week — their strongest weekly inflow since October 2025. 🚨
That pushed Bitcoin ETF flows for 2026 back into positive territory after being billions of dollars underwater earlier this year.
And this isn't just one random day.
Recent sessions showed major inflows, including nearly $1 BILLION on September 21 and another $714.7M on September 22.
BlackRock's IBIT and Fidelity's FBTC have accounted for a large portion of those recent flows.
So what does this actually mean for BTC?
🏦 Institutional demand is returning
💰 Billions are flowing through spot ETFs
🐋 Large players are gaining exposure
📈 Bitcoin liquidity is being absorbed through regulated investment vehicles
BUT…
⚠️ ETF inflows do NOT guarantee that Bitcoin will continue rising.
Other investors can sell into that demand, and macro conditions, derivatives positioning and broader market liquidity can still change the picture.
That's why I'm watching ETF flows + BTC price + volume + exchange flows together.
The BIG question now:
Are institutions positioning for the next major Bitcoin move… or simply adding exposure while BTC remains volatile? 👀
👇 What do you think?
🐋 INSTITUTIONAL ACCUMULATION
or
⏳ JUST TEMPORARY DEMAND?
#Bitcoin #Crypto #BitcoinETF #InstitutionalInvestors

173
Log in to explore more content
Join global crypto users on Binance Square
⚡️ Get latest and useful information about crypto.
💬 Trusted by the world’s largest crypto exchange.
👍 Discover real insights from verified creators.
အီးမေးလ် / ဖုန်းနံပါတ်
ရေပန်းစားနေသော ခေါင်းစဉ်များ
1
#EarningsSeason
376,360 views
2,872 Discussing
2
#SECChairWantsStockMarketsOnChain
172 views
26 Discussing
3
#MulticoinInvestsInGrass
0 views
6 Discussing
4
#CEARenamesToBNBStandardUnderBNC
384 views
40 Discussing
5
#BitwiseLaunchesFirstSpotNEARETF
42,884 views
666 Discussing
6
#USJobOpeningsFallToFiveMonthLow
48,898 views
519 Discussing
7
#ECBToTestAIAgentsInDigitalEuroPayments
33,713 views
592 Discussing
8
#JapanFSABacksFourthStablecoinTradeSettlementPilot
38,696 views
621 Discussing
9
#BitgetHackerFailsToMoveStolenFunds
54,933 views
673 Discussing
10
#BitMineETHHoldingsTop6Million
43,343 views
744 Discussing