
The Buzzing Bee
7k Posts

The Buzzing Bee
 Square Verified+
Words matter!🔥 Facts matter! Truths matter!🔥 Crypto news from all over the world 👩💻 Twitter: @Aby71721

#BinanceTurns7 task 2

#BinanceTurns7

Creator of the Year
Open Trade
Occasional Trader
7.8 Years
8 Following
144.0K+ Followers
214.3K+ Liked
6 Badges
Posts
Portfolio
All
Quotes
Videos
Live
PINNED
Dear Friends 😊
All of my coins analysis contents provided are for educational purposes only and should not be followed PLEASE always #dyor
All of my coins analysis contents provided are for educational purposes only and should not be followed PLEASE always #dyor
✨️✨️ XRP and XLM have always been compared for one simple reason:
Both were built around moving value.
But the market is starting to tell two very different stories.
XRP has become one of the biggest names in institutional crypto payments.
Stellar is taking a different route - building the infrastructure underneath tokenized assets, stablecoins, remittances and regulated financial products.
And that distinction is getting harder to ignore.
XLM now sits at the intersection of several narratives the market keeps coming back to:
Institutional settlement
💵 Stablecoins
🌍 Cross-border payments
📈 Tokenized RWAs
⚙ Soroban smart contracts
Meanwhile, the technical side still matters.
When liquidity rotates back into payment-focused assets, XLM doesn't need to become “the next XRP.”
It only needs the market to recognize what has been building underneath it.
The interesting part of this cycle isn't necessarily who wins the XRP vs XLM debate.
It's how much of the financial system eventually ends up running on either rail.
$XRP
$XLM
$ALGO
Both were built around moving value.
But the market is starting to tell two very different stories.
XRP has become one of the biggest names in institutional crypto payments.
Stellar is taking a different route - building the infrastructure underneath tokenized assets, stablecoins, remittances and regulated financial products.
And that distinction is getting harder to ignore.
XLM now sits at the intersection of several narratives the market keeps coming back to:
Institutional settlement
💵 Stablecoins
🌍 Cross-border payments
📈 Tokenized RWAs
⚙ Soroban smart contracts
Meanwhile, the technical side still matters.
When liquidity rotates back into payment-focused assets, XLM doesn't need to become “the next XRP.”
It only needs the market to recognize what has been building underneath it.
The interesting part of this cycle isn't necessarily who wins the XRP vs XLM debate.
It's how much of the financial system eventually ends up running on either rail.
$XRP
$XLM
$ALGO
$BTC Pushing $80K: Weekend Market Update
Following up on our recent market look, the momentum hasn't slowed down after the weekend. With btc now flirting with $79.8K, Ethereum has pushed past $2,487 (+29.8% 7d), while Solana officially reclaimed triple digits at $100.36 (+30.3% 7d).
We're seeing massive rallies across key assets - Hyperliquid surged to $81.70 (+39.6% 7d), and XRP delivered a staggering +49.2% weekly run to touch $1.49.
$ADA
$ALGO
Following up on our recent market look, the momentum hasn't slowed down after the weekend. With btc now flirting with $79.8K, Ethereum has pushed past $2,487 (+29.8% 7d), while Solana officially reclaimed triple digits at $100.36 (+30.3% 7d).
We're seeing massive rallies across key assets - Hyperliquid surged to $81.70 (+39.6% 7d), and XRP delivered a staggering +49.2% weekly run to touch $1.49.
$ADA
$ALGO
✨️✨️ Strategy Stops Selling $BTC and Builds a $6.7B Liquidity Buffer
Strategy made no btc purchases or sales from Aug. 17–23, keeping its treasury unchanged at 840,447 $BTC , acquired for $63.36B at an average price of $75,385. The pause is notable because it follows four weeks in which the company sold a combined 6,916 BTC.
Instead of immediately recycling new capital into Bitcoin, Strategy sold 18.26M $MSTR shares for ~$2.01B. It used $300M to lift its restricted USD Reserve to $5.1B, spent $136.4M repurchasing $STRC, and created a separate $1.59B “USD Cash” pool.
That distinction is important. The $5.1B reserve is primarily designed to cover preferred dividends and debt interest. The new $1.59B pool is flexible capital that can be used for future BTC purchases, debt repayment, preferred/common-stock buybacks or additional reserve funding. In effect, Strategy now has roughly $6.7B of designated dollar liquidity, but only the new pool is broadly deployable.
Meanwhile, BTC gained roughly 25% last week without Strategy buying a single coin, returning the company’s 840K+ BTC position to unrealized profit. Bernstein also notes that Strategy’s strengthened reserves now cover roughly 2.8 years of dividends and expects btc purchases could resume as $STRC recovers toward par. That creates a materially different setup from earlier in the summer:
Strategy is no longer supplying BTC to the rally, the market has proved it can advance without Strategy buying, and Strategy now has fresh liquidity available if it chooses to re-enter. This isn't simply a “Saylor stopped buying” story. Strategy has traded immediate accumulation for balance-sheet optionality while BTC rallied without needing its bid.
$ETH
#BitcoinRises23.6%Weekly
Strategy made no btc purchases or sales from Aug. 17–23, keeping its treasury unchanged at 840,447 $BTC , acquired for $63.36B at an average price of $75,385. The pause is notable because it follows four weeks in which the company sold a combined 6,916 BTC.
Instead of immediately recycling new capital into Bitcoin, Strategy sold 18.26M $MSTR shares for ~$2.01B. It used $300M to lift its restricted USD Reserve to $5.1B, spent $136.4M repurchasing $STRC, and created a separate $1.59B “USD Cash” pool.
That distinction is important. The $5.1B reserve is primarily designed to cover preferred dividends and debt interest. The new $1.59B pool is flexible capital that can be used for future BTC purchases, debt repayment, preferred/common-stock buybacks or additional reserve funding. In effect, Strategy now has roughly $6.7B of designated dollar liquidity, but only the new pool is broadly deployable.
Meanwhile, BTC gained roughly 25% last week without Strategy buying a single coin, returning the company’s 840K+ BTC position to unrealized profit. Bernstein also notes that Strategy’s strengthened reserves now cover roughly 2.8 years of dividends and expects btc purchases could resume as $STRC recovers toward par. That creates a materially different setup from earlier in the summer:
Strategy is no longer supplying BTC to the rally, the market has proved it can advance without Strategy buying, and Strategy now has fresh liquidity available if it chooses to re-enter. This isn't simply a “Saylor stopped buying” story. Strategy has traded immediate accumulation for balance-sheet optionality while BTC rallied without needing its bid.
$ETH
#BitcoinRises23.6%Weekly


🇺🇸 ETF FLOWS: Crypto spot ETFs closed last week with strong net inflows across the board, led by Bitcoin and Ethereum.
$BTC : 1.92B
ETH : 697.18M
XRP : 39.78M
$SOL : 28.34M
LINK: 13.35M
$HYPE : 3.89M
AVAX: 1.30M
HBAR: 848.19K
DOGE: 654.42K
Bitcoin dominated the flows, while Ethereum also saw a notable wave of capital.
The broader inflows suggest institutional interest remains strong across several crypto assets.
✅️ FOLLOW FOR MORE ✅️
$BTC : 1.92B
ETH : 697.18M
XRP : 39.78M
$SOL : 28.34M
LINK: 13.35M
$HYPE : 3.89M
AVAX: 1.30M
HBAR: 848.19K
DOGE: 654.42K
Bitcoin dominated the flows, while Ethereum also saw a notable wave of capital.
The broader inflows suggest institutional interest remains strong across several crypto assets.
✅️ FOLLOW FOR MORE ✅️
💥💥 BTC a little over $77K as traders watch PCE inflation, GDP revision, and Warsh’s Jackson Hole speech for the next catalyst.
RWA deposits hit $7.4B, tripling as tokenized assets and collateral use grow, even as overall DeFi activity drops.
$BTC
$ETH
$AVAX
RWA deposits hit $7.4B, tripling as tokenized assets and collateral use grow, even as overall DeFi activity drops.
$BTC
$ETH
$AVAX
🔹️💥 XRP Just Passed BNB in Market Cap
XRP's climb didn't just push its price higher; it pushed the asset itself past BNB in total network size. XRP now sits at a $96.7B market cap against BNB's $94.1B.
The flip traces to one number: XRP is up over 55% in the past seven days, more than triple bnb 17% gain over the same stretch. SOL, still smaller than both at $56.1B, gained nearly 29% and didn't close any distance at all.
Indices like CD20 rebalance on a fixed quarterly schedule, but the market caps that set their weights move in real time.
A single lopsided week is enough to quietly reorder the ranking long before the next official reconstitution.
Worth watching whether xrp holds this lead once the current momentum cools, or whether it turns out to be a brief crossover built on one unusually strong week.
$XRP
$BNB
$SOL
XRP's climb didn't just push its price higher; it pushed the asset itself past BNB in total network size. XRP now sits at a $96.7B market cap against BNB's $94.1B.
The flip traces to one number: XRP is up over 55% in the past seven days, more than triple bnb 17% gain over the same stretch. SOL, still smaller than both at $56.1B, gained nearly 29% and didn't close any distance at all.
Indices like CD20 rebalance on a fixed quarterly schedule, but the market caps that set their weights move in real time.
A single lopsided week is enough to quietly reorder the ranking long before the next official reconstitution.
Worth watching whether xrp holds this lead once the current momentum cools, or whether it turns out to be a brief crossover built on one unusually strong week.
$XRP
$BNB
$SOL
🚨🚨 POL Distribution Zone Could Trigger the Next Drop
Sellers are rotating inside the value area and the short levels look clean from here.
📊 What I see
- Auction shows distribution between 0.1056 and 0.11198
- Price is sitting near the entry zone at 0.10809
- Sellers still control the value area flow
🎯 My current view
- Bias: Short
- Trigger: Entry around 0.10809
- Target: TP1 0.10518 then TP2 0.10372
- Invalidation: Stop at 0.10955
- Confidence: 63 percent
💧 Execution perspective
A short on POL is a pure price-action opportunity that can move fast once distribution continues. POL offers the chart momentum side, while Omniston covers the routing and liquidity comparison side when volatility expands.
Its role is to compare available paths across liquidity sources before execution. That makes the infrastructure angle useful beside this short setup because clean signals still need practical route handling.
Would you take the short at this entry or wait for one more rejection candle 👇
$POL
Sellers are rotating inside the value area and the short levels look clean from here.
📊 What I see
- Auction shows distribution between 0.1056 and 0.11198
- Price is sitting near the entry zone at 0.10809
- Sellers still control the value area flow
🎯 My current view
- Bias: Short
- Trigger: Entry around 0.10809
- Target: TP1 0.10518 then TP2 0.10372
- Invalidation: Stop at 0.10955
- Confidence: 63 percent
💧 Execution perspective
A short on POL is a pure price-action opportunity that can move fast once distribution continues. POL offers the chart momentum side, while Omniston covers the routing and liquidity comparison side when volatility expands.
Its role is to compare available paths across liquidity sources before execution. That makes the infrastructure angle useful beside this short setup because clean signals still need practical route handling.
Would you take the short at this entry or wait for one more rejection candle 👇
$POL
✨️💥 Regulatory win locked in for XRP, but this rally was shorts burning, not entirely believers buying.
However, the price action is riding borrowed momentum. This recent high % rally was a short squeeze on thin institutional participation, not a fundamental re-rating.
The bull case is long-term infrastructure adoption. The bear case is that this is just another short squeeze that some view as a washed-out asset.
$XRP
$AVAX
$ETH
However, the price action is riding borrowed momentum. This recent high % rally was a short squeeze on thin institutional participation, not a fundamental re-rating.
The bull case is long-term infrastructure adoption. The bear case is that this is just another short squeeze that some view as a washed-out asset.
$XRP
$AVAX
$ETH
Verified
✨️💥 NVDA is currently moving inside a downward channel after getting rejected from the upper part of the channel. Price is now around 214.72, and I'm watching the 200 EMA around 195-196 as the main area of interest.
As NVDA has already bounced twice from around the 200 EMA and previous fake break down and more bounce from this, so I'm expecting this area to act as an important support again if price comes down there.
There is also some confluence around the 189-196 zone:
200 EMA: around 195.36
Support zone: around 189.73
Previous trendline support is also coming into this area.
Price has reacted from this region before, which makes it more interesting to watch.
The MFI is currently around 59.67, so money flow is still healthy. It isn't showing an oversold condition yet.
The RSI is around 51.01, which is more or less neutral. For me, this means I would rather wait for the price to come down and see whether these indicators start showing weakness/exhaustion before looking for a possible bounce.
My expectation is that NVDA could continue moving lower toward the 195 -190 support area.
If price reaches this zone and we get a green reversal candle / bullish candle, especially with improving volume and MFI/RSI turning back up, that could give a better confirmation for a bounce, from there, the first area I would watch is around 214 -215.
So personally, I would not rush the entry just because price is coming down. I would like to see how price behaves around the 200 EMA/support zone first. Still bullish on the bigger trend, but short term I'm expecting some more downside before potentially getting another bounce. The 190 -196 area is the key zone I'm watching.
$NVDA
As NVDA has already bounced twice from around the 200 EMA and previous fake break down and more bounce from this, so I'm expecting this area to act as an important support again if price comes down there.
There is also some confluence around the 189-196 zone:
200 EMA: around 195.36
Support zone: around 189.73
Previous trendline support is also coming into this area.
Price has reacted from this region before, which makes it more interesting to watch.
The MFI is currently around 59.67, so money flow is still healthy. It isn't showing an oversold condition yet.
The RSI is around 51.01, which is more or less neutral. For me, this means I would rather wait for the price to come down and see whether these indicators start showing weakness/exhaustion before looking for a possible bounce.
My expectation is that NVDA could continue moving lower toward the 195 -190 support area.
If price reaches this zone and we get a green reversal candle / bullish candle, especially with improving volume and MFI/RSI turning back up, that could give a better confirmation for a bounce, from there, the first area I would watch is around 214 -215.
So personally, I would not rush the entry just because price is coming down. I would like to see how price behaves around the 200 EMA/support zone first. Still bullish on the bigger trend, but short term I'm expecting some more downside before potentially getting another bounce. The 190 -196 area is the key zone I'm watching.
$NVDA

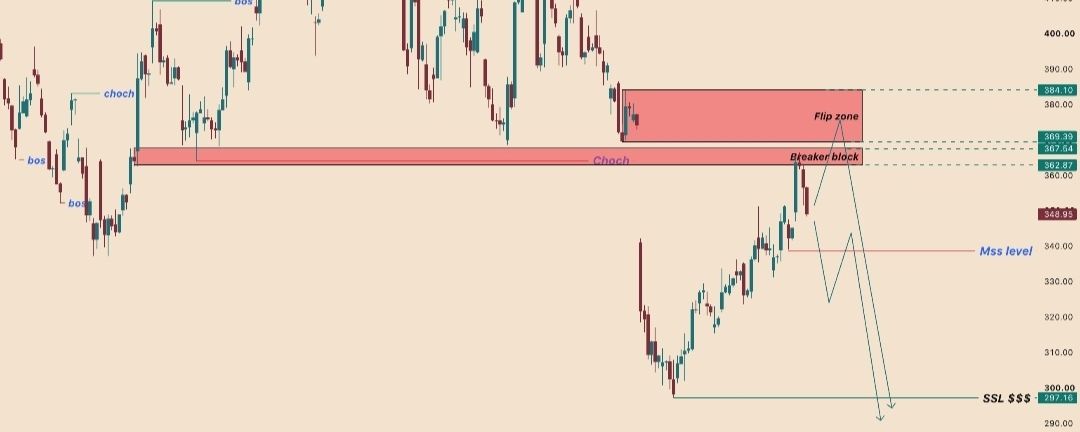
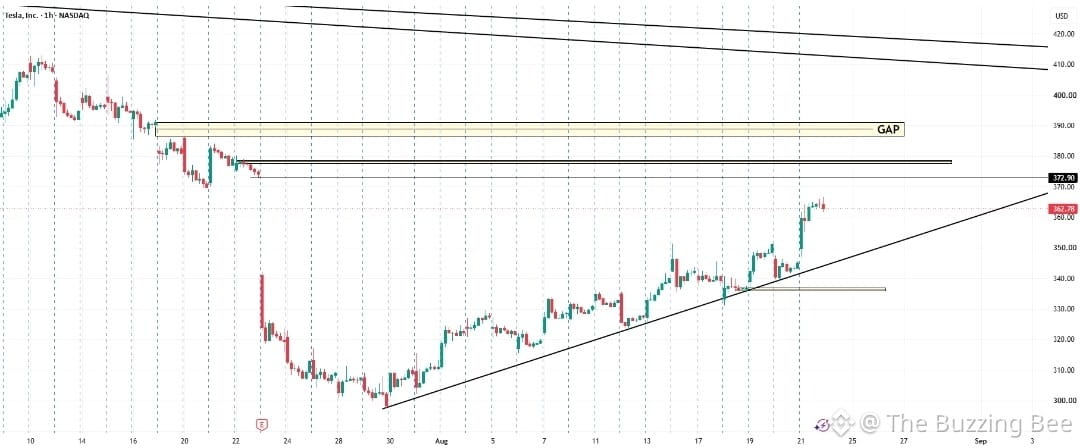
🚨💥 TSLA is maintaining a bullish recovery structure after reclaiming the rising trendline.
Price is currently trading around $362.78, with the next major resistance near $372.90.
If TSLA continues to hold above the rising trendline and breaks through $372.90, the next area of interest is the $377-379 resistance zone, followed by the $387-391 gap.
On the downside, a sustained break below the rising trendline would weaken the bullish structure, with the $337-338 support zone becoming an important area to watch.
Bullish scenario: Hold the rising structure → reclaim $372.90→ test $377-379 → potentially move toward the $387-391 gap.
Bearish scenario: Rejection from resistance followed by a loss of the rising structure could send price back toward the lower support zone.
This is a technical-analysis scenario, not a guaranteed outcome. Price action around the marked levels will determine the next move.
✅️ FOLLOW FOR MORE ✅️
$TSLA
Price is currently trading around $362.78, with the next major resistance near $372.90.
If TSLA continues to hold above the rising trendline and breaks through $372.90, the next area of interest is the $377-379 resistance zone, followed by the $387-391 gap.
On the downside, a sustained break below the rising trendline would weaken the bullish structure, with the $337-338 support zone becoming an important area to watch.
Bullish scenario: Hold the rising structure → reclaim $372.90→ test $377-379 → potentially move toward the $387-391 gap.
Bearish scenario: Rejection from resistance followed by a loss of the rising structure could send price back toward the lower support zone.
This is a technical-analysis scenario, not a guaranteed outcome. Price action around the marked levels will determine the next move.
✅️ FOLLOW FOR MORE ✅️
$TSLA
Verified
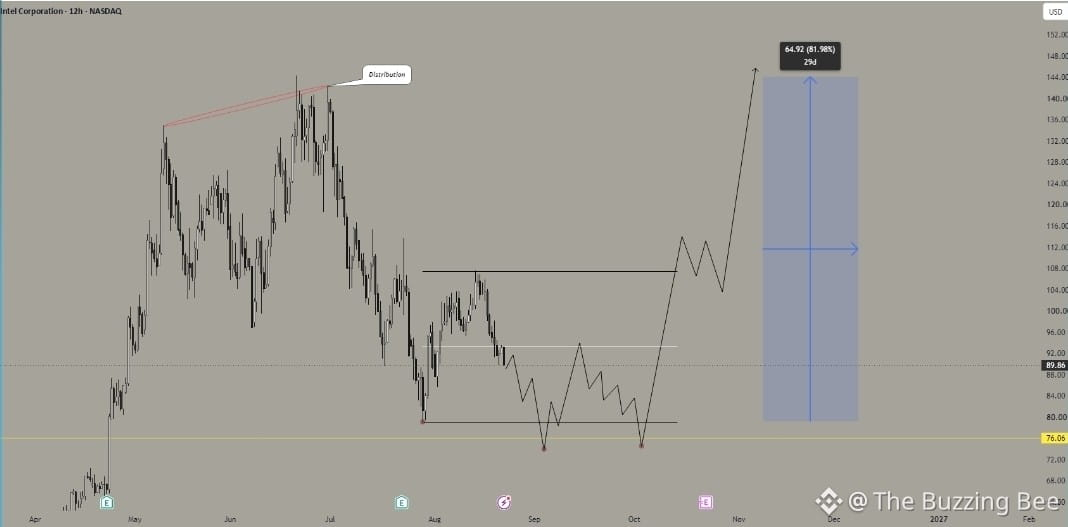
💥💥 Intel looks pretty good right now.
The broader structure is trending, and we've already seen what I interpret as significant distribution / institutional positioning at the previous top.
Now I'm looking for the opposite side of that cycle.
I expect INTC to eventually develop a proper accumulation model, and that's the setup I'm pre-planning right now.
If the accumulation forms and confirms, I'm not interested in targeting a small bounce.
I'm looking for the rotation all the way back toward ATHs - and potentially beyond.
The fundamental backdrop is also changing: Intel reported $16.1B in Q2 revenue, up $3.3B YoY, while DCAI revenue increased 59% YoY.
But fundamentals aren't what gives me the entry.
Distribution shows you where large positioning took place. Accumulation shows you where the next
expansion is being built.
I want to identify the accumulation before the next major leg begins.
Price action tells the story first.
$INTC
The broader structure is trending, and we've already seen what I interpret as significant distribution / institutional positioning at the previous top.
Now I'm looking for the opposite side of that cycle.
I expect INTC to eventually develop a proper accumulation model, and that's the setup I'm pre-planning right now.
If the accumulation forms and confirms, I'm not interested in targeting a small bounce.
I'm looking for the rotation all the way back toward ATHs - and potentially beyond.
The fundamental backdrop is also changing: Intel reported $16.1B in Q2 revenue, up $3.3B YoY, while DCAI revenue increased 59% YoY.
But fundamentals aren't what gives me the entry.
Distribution shows you where large positioning took place. Accumulation shows you where the next
expansion is being built.
I want to identify the accumulation before the next major leg begins.
Price action tells the story first.
$INTC
🚀🚀 Longing #KAITO Here
Long (5x - 10x)
Entry: $0.3750 - $0.3700
Reason: Chart looks bullish for it. Worth buying for short term quick profits too. Already broke out of the resistance zone also.
Targets: $0.3900, $0.4020, $0.4140, $0.4300, $0.4400
Stoploss: $0.3620
$KAITO
Long (5x - 10x)
Entry: $0.3750 - $0.3700
Reason: Chart looks bullish for it. Worth buying for short term quick profits too. Already broke out of the resistance zone also.
Targets: $0.3900, $0.4020, $0.4140, $0.4300, $0.4400
Stoploss: $0.3620
$KAITO
✨️💫 Crypto Sentiment Hits a 2026 High After Strongest Week in Years
Market sentiment has shifted sharply higher.
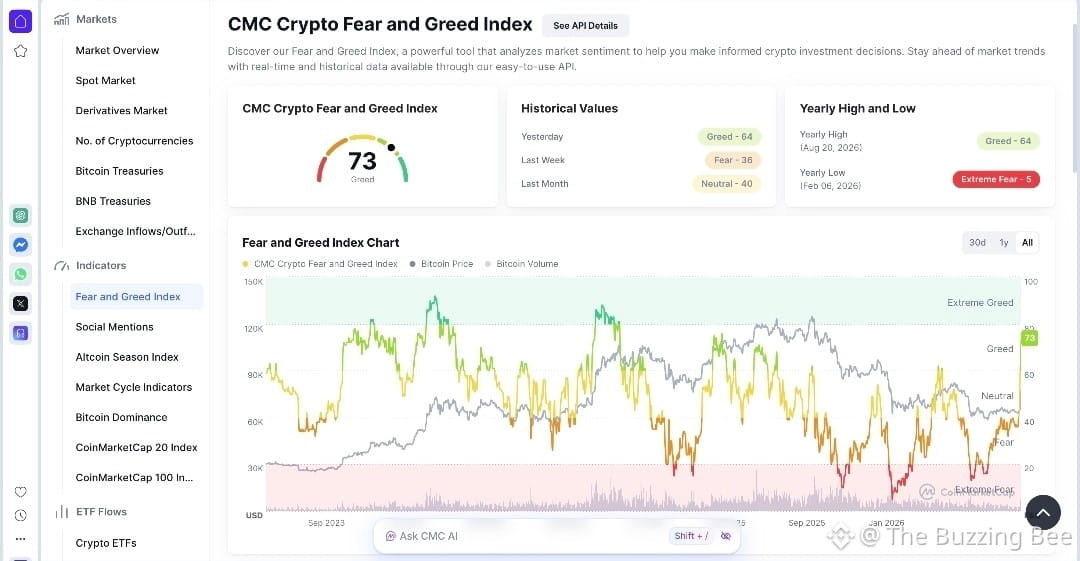
The CoinMarketCap Fear and Greed Index reached 73 today, its highest reading of 2026 so far. Just one week earlier the same index was sitting at 36, deep in “Fear” territory. The jump of more than 35 points in seven days marks one of the fastest sentiment recoveries of the year.
At the same time, total crypto market capitalization has climbed about 5.6% to roughly $2.6 trillion. BTC has moved back above $77,000 as part of the broader rebound.
The rapid change in the Fear and Greed Index reflects the strong price action and rising risk appetite seen across the market this week. Readings in the 70s typically indicate “Greed,” a level not reached for many months.
Sentiment has improved quickly alongside the recent price gains.
$BTC
$ADA
$AAVE
Market sentiment has shifted sharply higher.
The CoinMarketCap Fear and Greed Index reached 73 today, its highest reading of 2026 so far. Just one week earlier the same index was sitting at 36, deep in “Fear” territory. The jump of more than 35 points in seven days marks one of the fastest sentiment recoveries of the year.
At the same time, total crypto market capitalization has climbed about 5.6% to roughly $2.6 trillion. BTC has moved back above $77,000 as part of the broader rebound.
The rapid change in the Fear and Greed Index reflects the strong price action and rising risk appetite seen across the market this week. Readings in the 70s typically indicate “Greed,” a level not reached for many months.
Sentiment has improved quickly alongside the recent price gains.
$BTC
$ADA
$AAVE
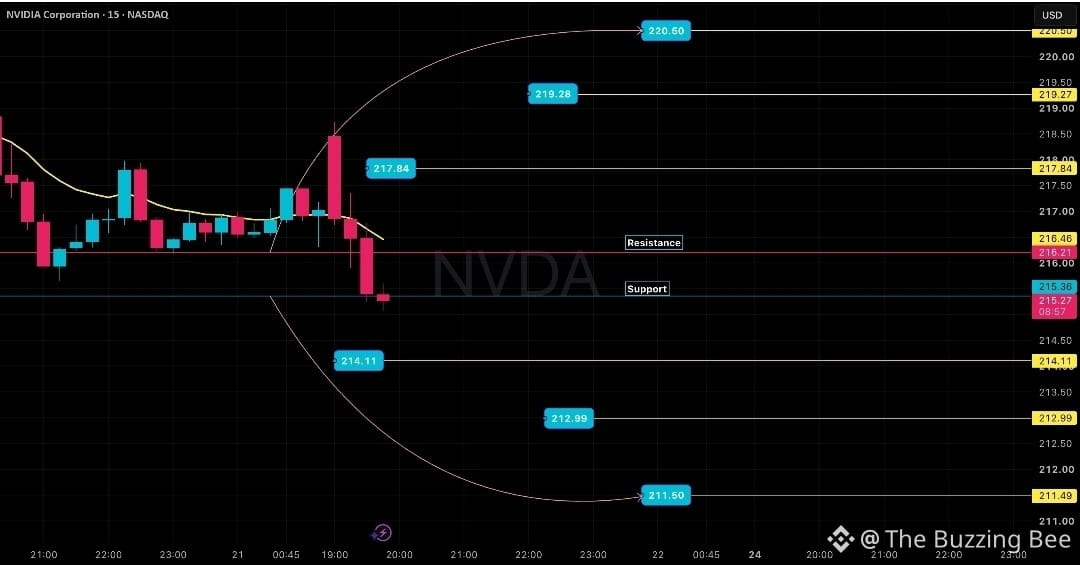
🚨💫✨️ NVDA is currently trading around $215.49, sitting right on an important support zone after a sharp rejection from the higher levels.
Immediate Resistance: $216.21-$216.49
Immediate Support: $215.49
Bullish Scenario
A sustained 15-min close above $216.49 could trigger an upside move toward:
$217.84
$219.27
$220.50
Bearish Scenario
If $215.49 breaks decisively, weakness could extend toward:
$214.11
$212.99
$211.49
Key takeaway:
Trading plan:
The $215.49-$216.49 zone is the immediate battle zone. Wait for a confirmed breakout/breakdown rather than chasing the first move.
Above $216.49 → bullish bias Below $215.49 → bearish bias Between these levels → wait & watch
Educational setup based on the attached chart, not financial advice. Manage risk and position size accordingly.
$NVDA
Immediate Resistance: $216.21-$216.49
Immediate Support: $215.49
Bullish Scenario
A sustained 15-min close above $216.49 could trigger an upside move toward:
$217.84
$219.27
$220.50
Bearish Scenario
If $215.49 breaks decisively, weakness could extend toward:
$214.11
$212.99
$211.49
Key takeaway:
Trading plan:
The $215.49-$216.49 zone is the immediate battle zone. Wait for a confirmed breakout/breakdown rather than chasing the first move.
Above $216.49 → bullish bias Below $215.49 → bearish bias Between these levels → wait & watch
Educational setup based on the attached chart, not financial advice. Manage risk and position size accordingly.
$NVDA
✨️✨️💫 XRP Rallies Over 22% in the Past 7 Days
XRP has posted a strong weekly gain of more than 22%.
The token has moved higher alongside the broader crypto market rebound. Most of the advance has come in the last few days as Bitcoin and major coins turned up and risk appetite improved.
Key points:
> Weekly performance stands out compared with many other large-cap coins
> The rise has been supported by higher trading volume
> XRP is participating in the same short-term strength seen across several altcoins
This kind of move often appears when the overall market shifts from quiet trading into a clearer risk-on period. XRP has responded quickly to that change in sentiment.
A solid weekly advance for XRP.
Do you see this weekly strength continuing if the broader market holds its recent gains?
$XRP
XRP has posted a strong weekly gain of more than 22%.
The token has moved higher alongside the broader crypto market rebound. Most of the advance has come in the last few days as Bitcoin and major coins turned up and risk appetite improved.
Key points:
> Weekly performance stands out compared with many other large-cap coins
> The rise has been supported by higher trading volume
> XRP is participating in the same short-term strength seen across several altcoins
This kind of move often appears when the overall market shifts from quiet trading into a clearer risk-on period. XRP has responded quickly to that change in sentiment.
A solid weekly advance for XRP.
Do you see this weekly strength continuing if the broader market holds its recent gains?
$XRP

Log in to explore more content