
CryptoZeno
6k Posts

CryptoZeno
Verified Creator on #BinanceSquare #CoinMarketCap and #CryptoQuant | On Chain Research and Market Insights with Smart Trading Signals

NES Holder
High-Frequency Trader
5.4 Years
29 Following
8.7K+ Followers
34.7K+ Liked
Posts
All
Quotes
Videos
PINNED
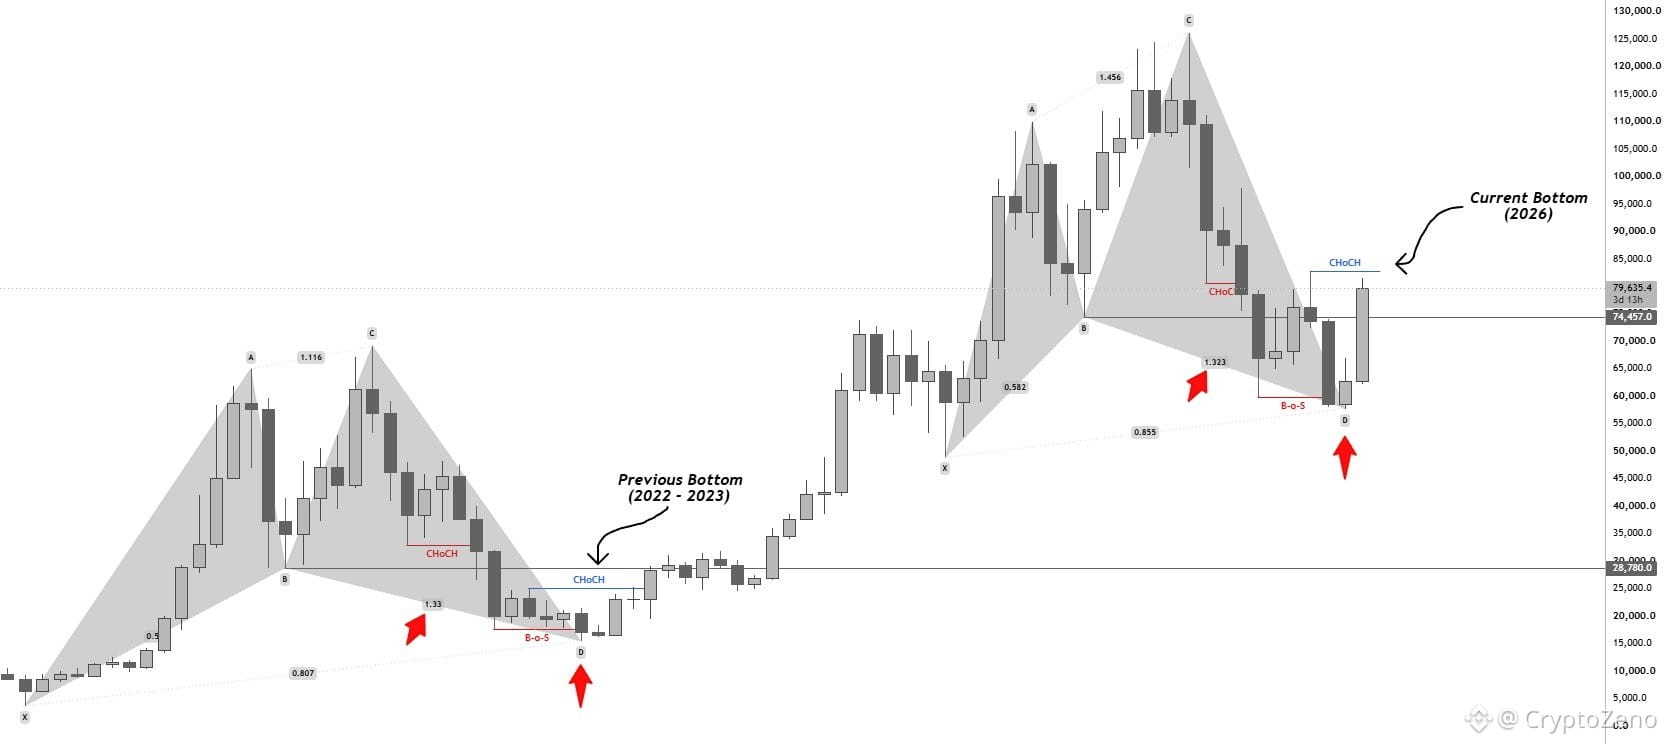
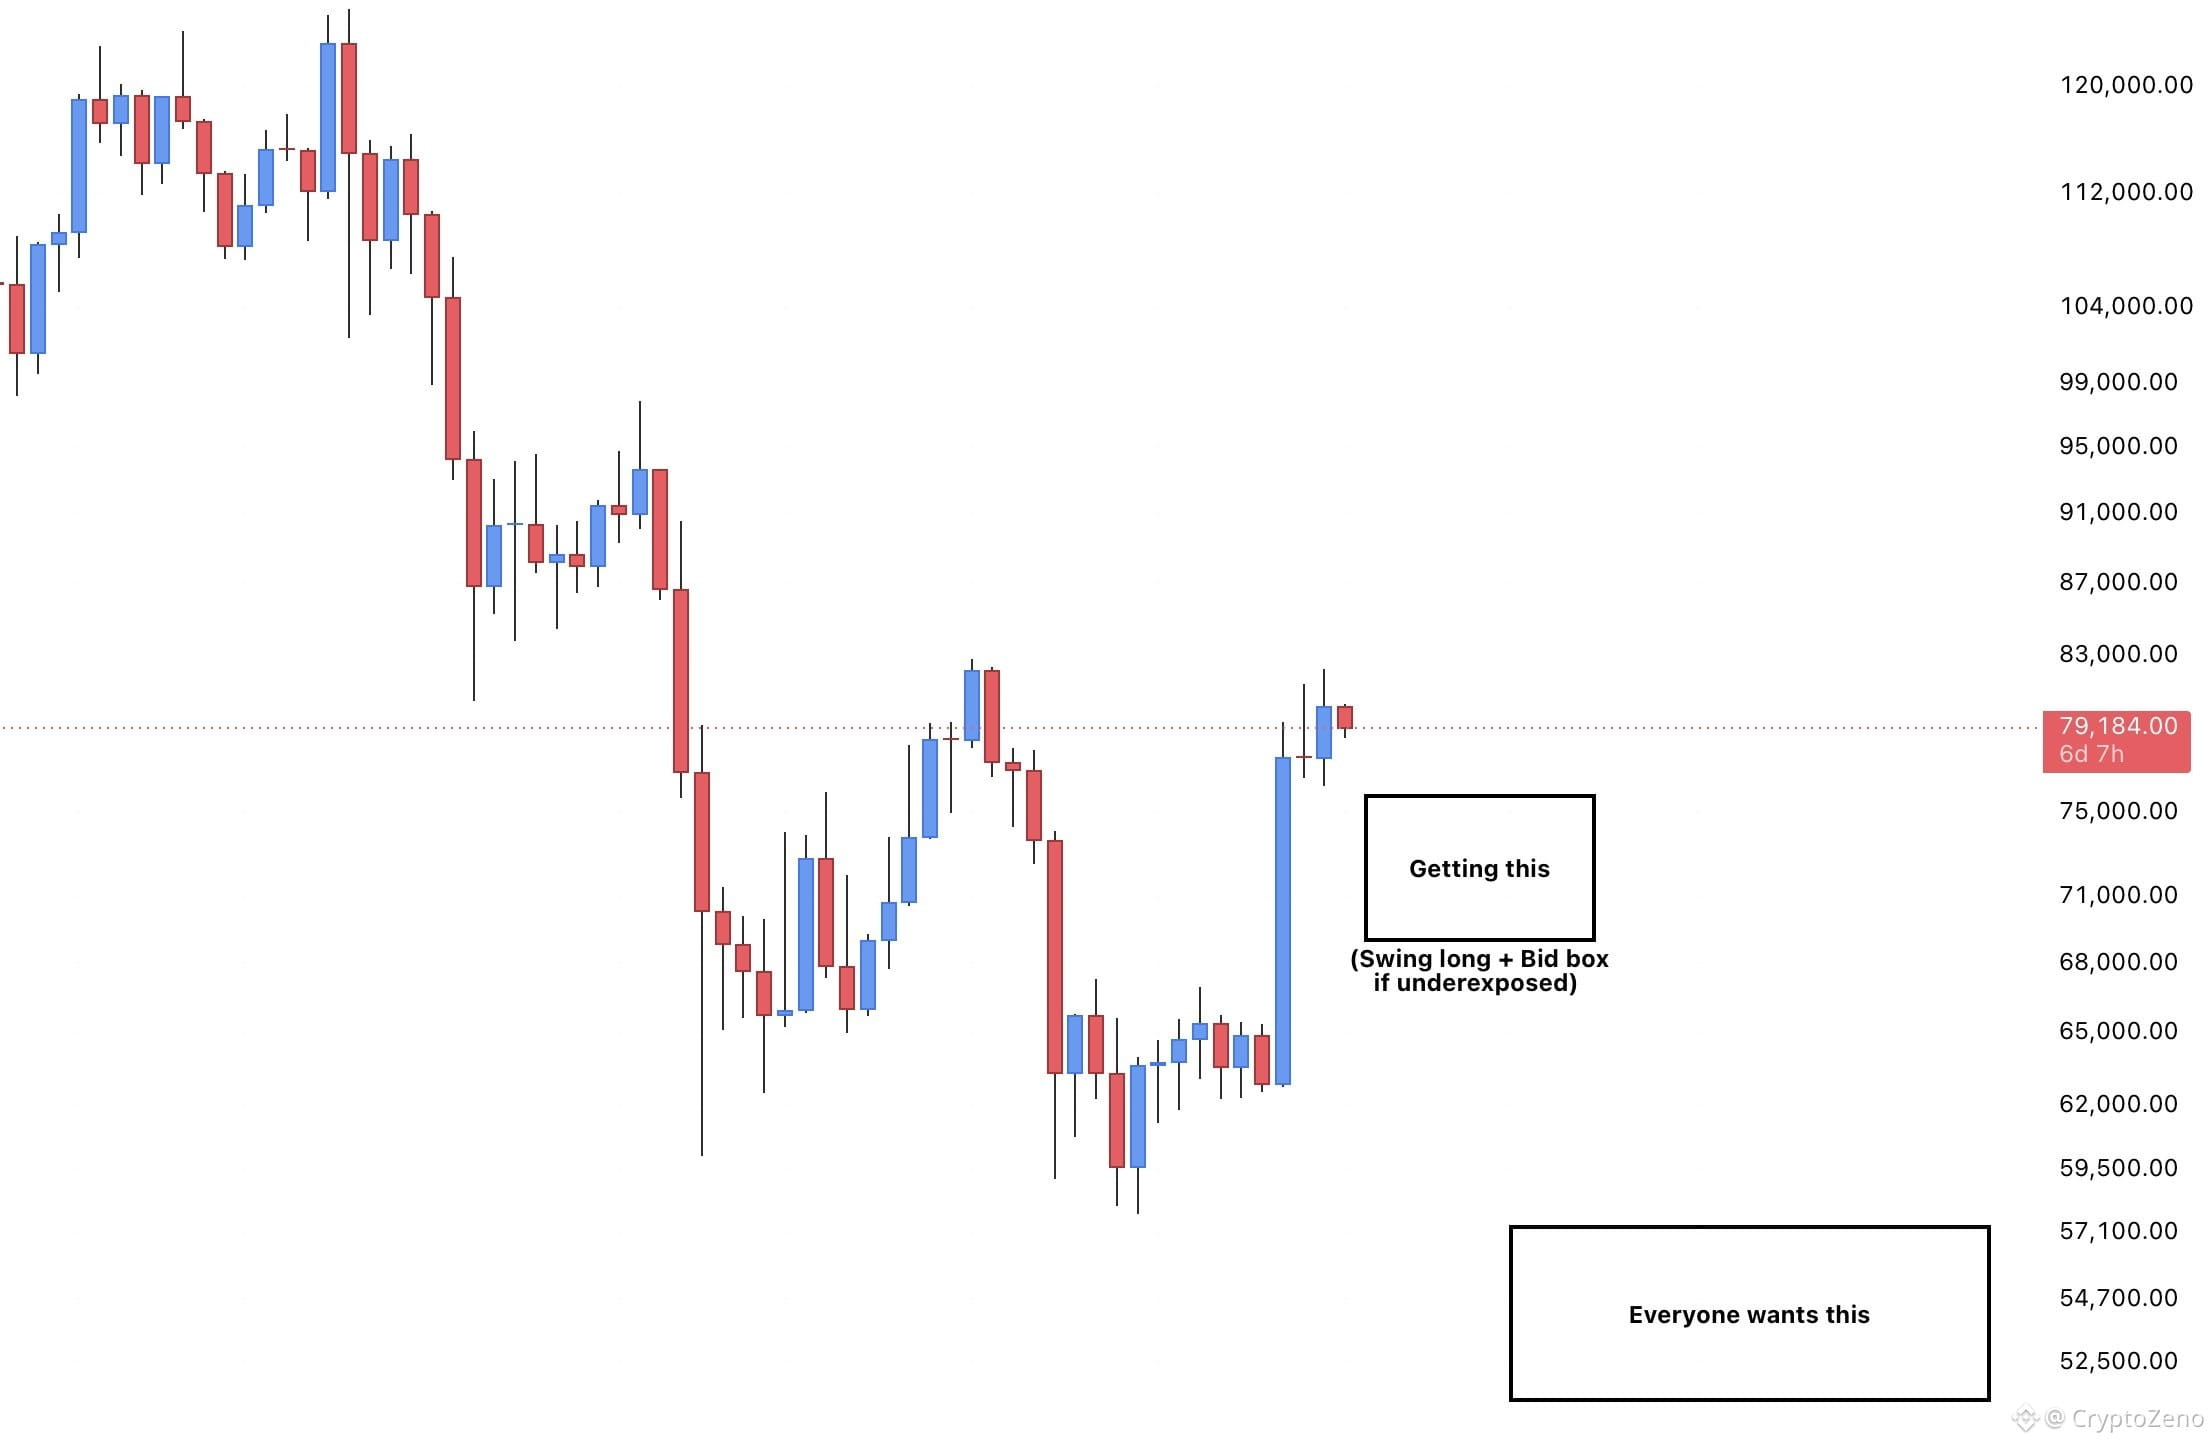
$BTC Same Structure. Same Bottom.
Yet people made the same mistake they’ve made EVERY. SINGLE. TIME we get a dip.
They waited for lower.
Suddenly, everyone had a new reason why Bitcoin was going to 54K.
Funny how that works.
Yet people made the same mistake they’ve made EVERY. SINGLE. TIME we get a dip.
They waited for lower.
Suddenly, everyone had a new reason why Bitcoin was going to 54K.
Funny how that works.
PINNED
Verified
THIS IS INSANE
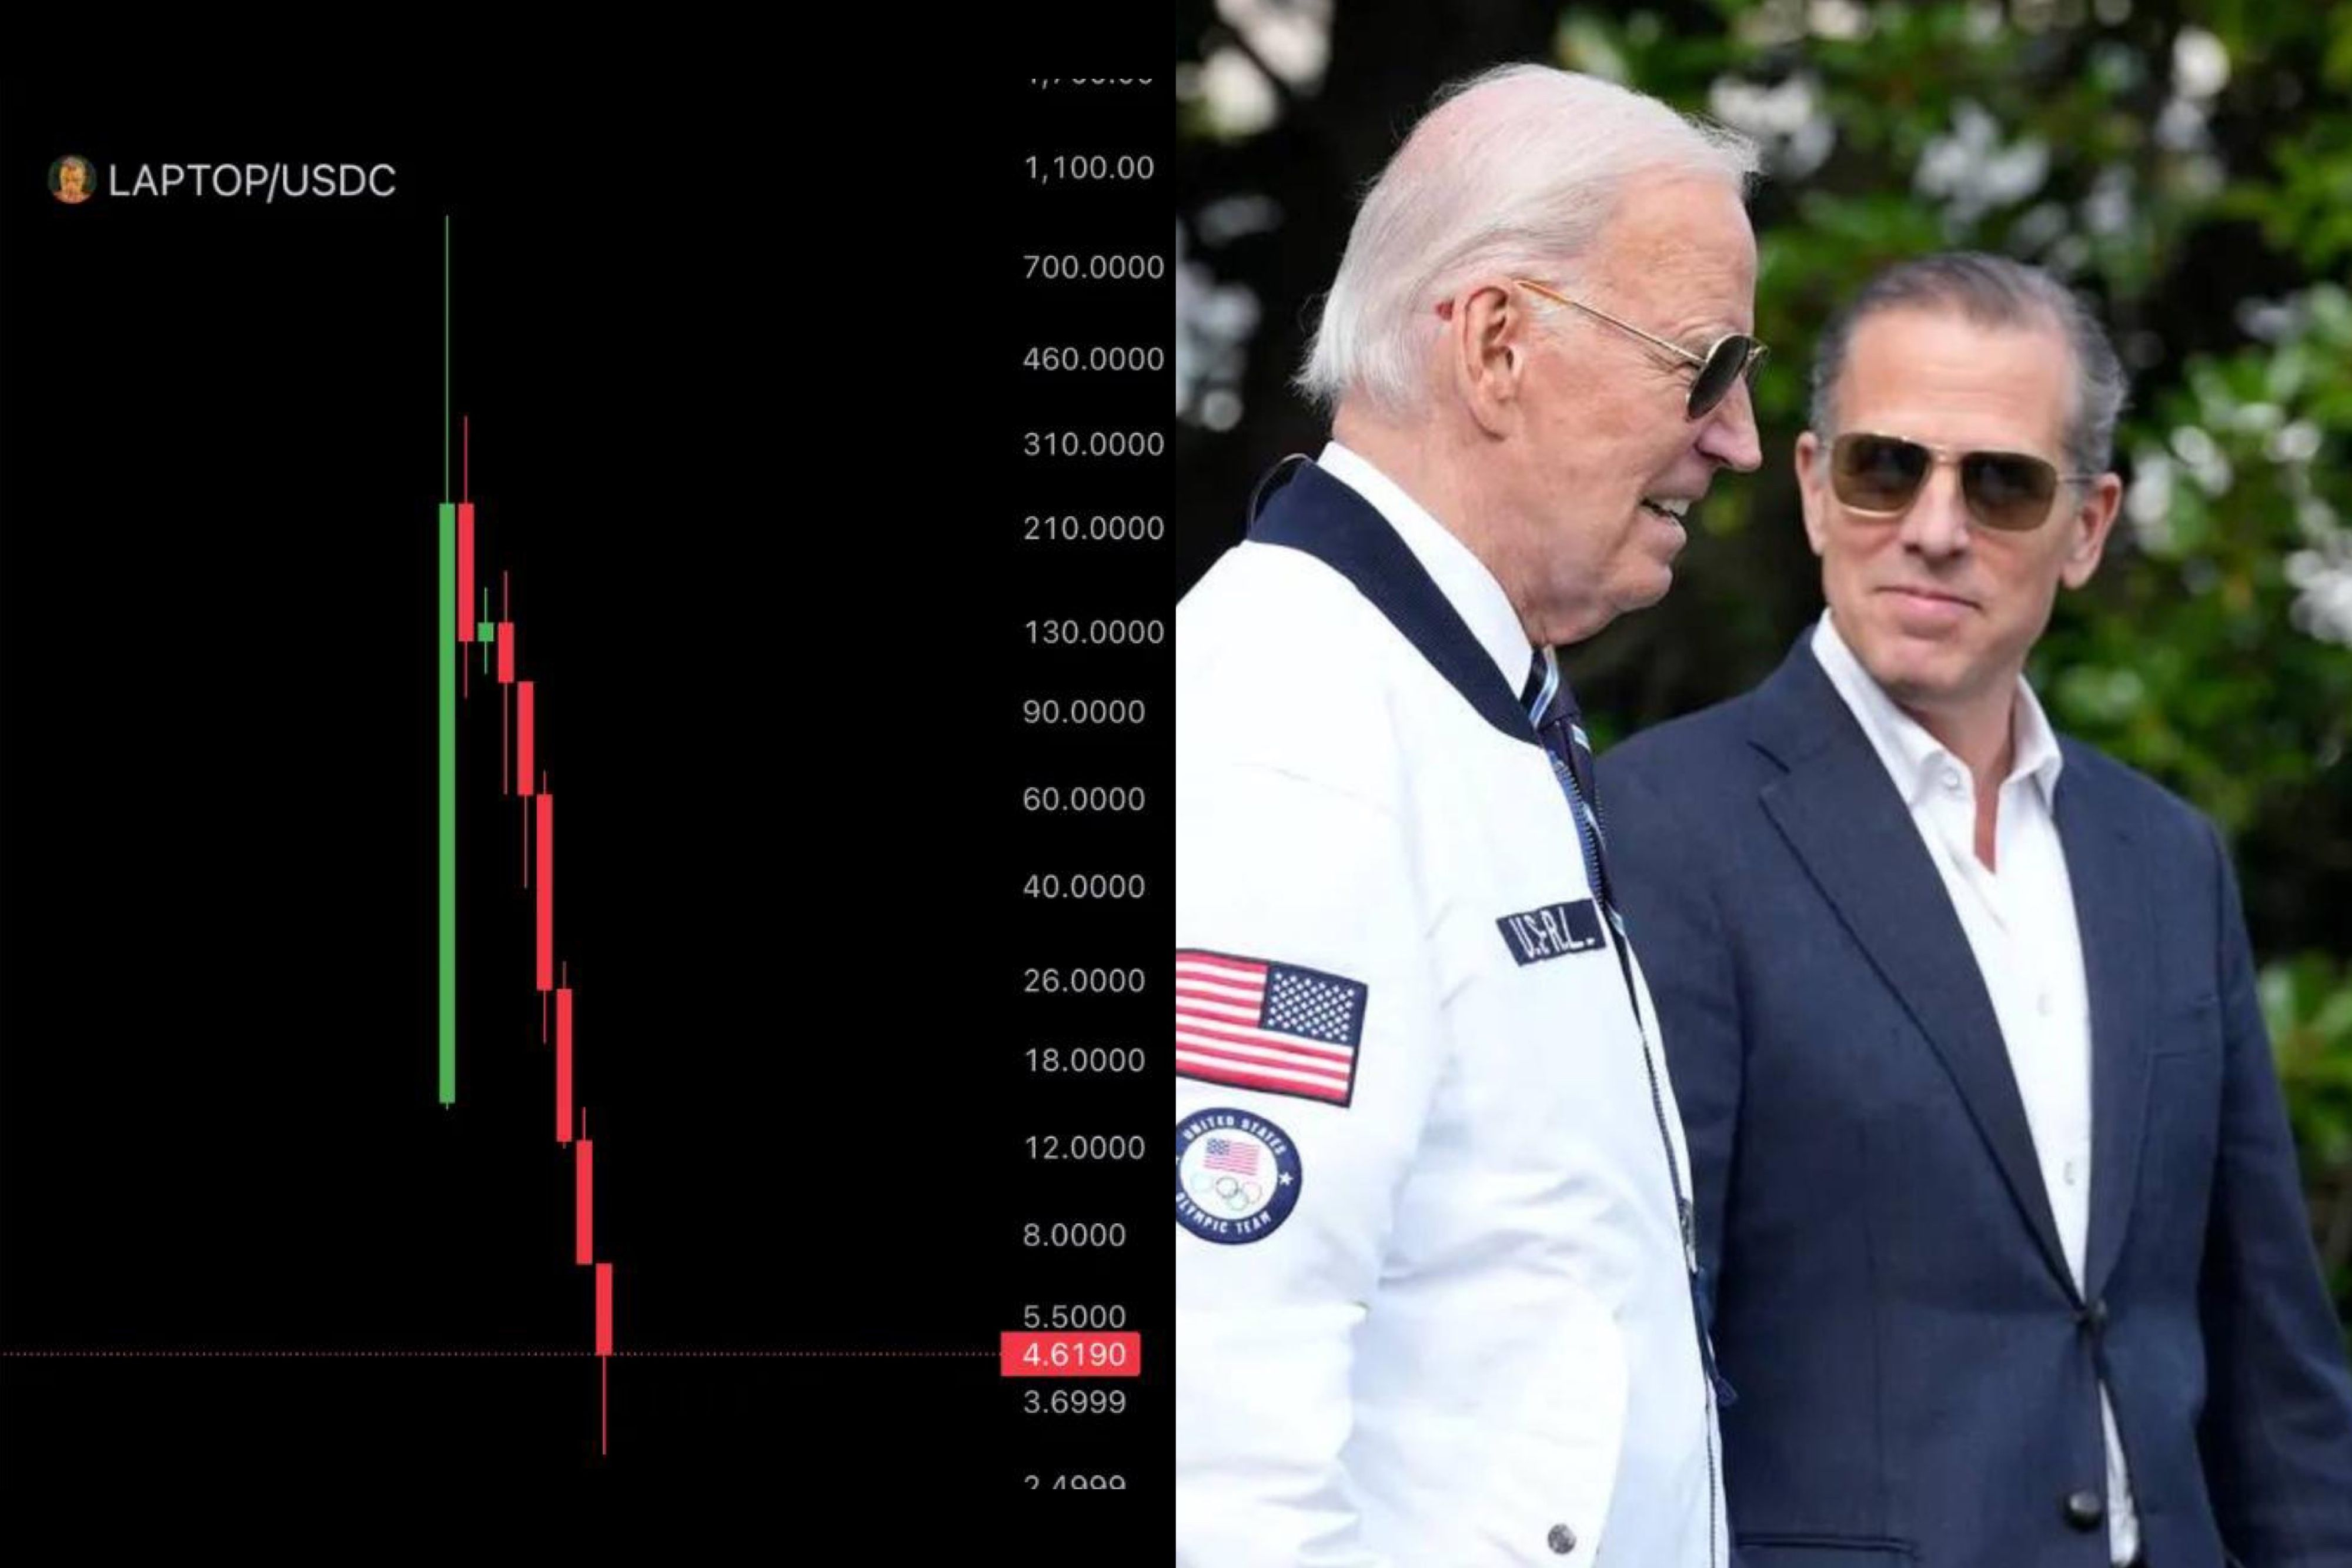
Hunter Biden's memecoin, $LAPTOP crashed 98% within minutes of its launch.
It was supposed to compensate the $TRUMP losers
Hunter Biden's memecoin, $LAPTOP crashed 98% within minutes of its launch.
It was supposed to compensate the $TRUMP losers
Don't FOMO!
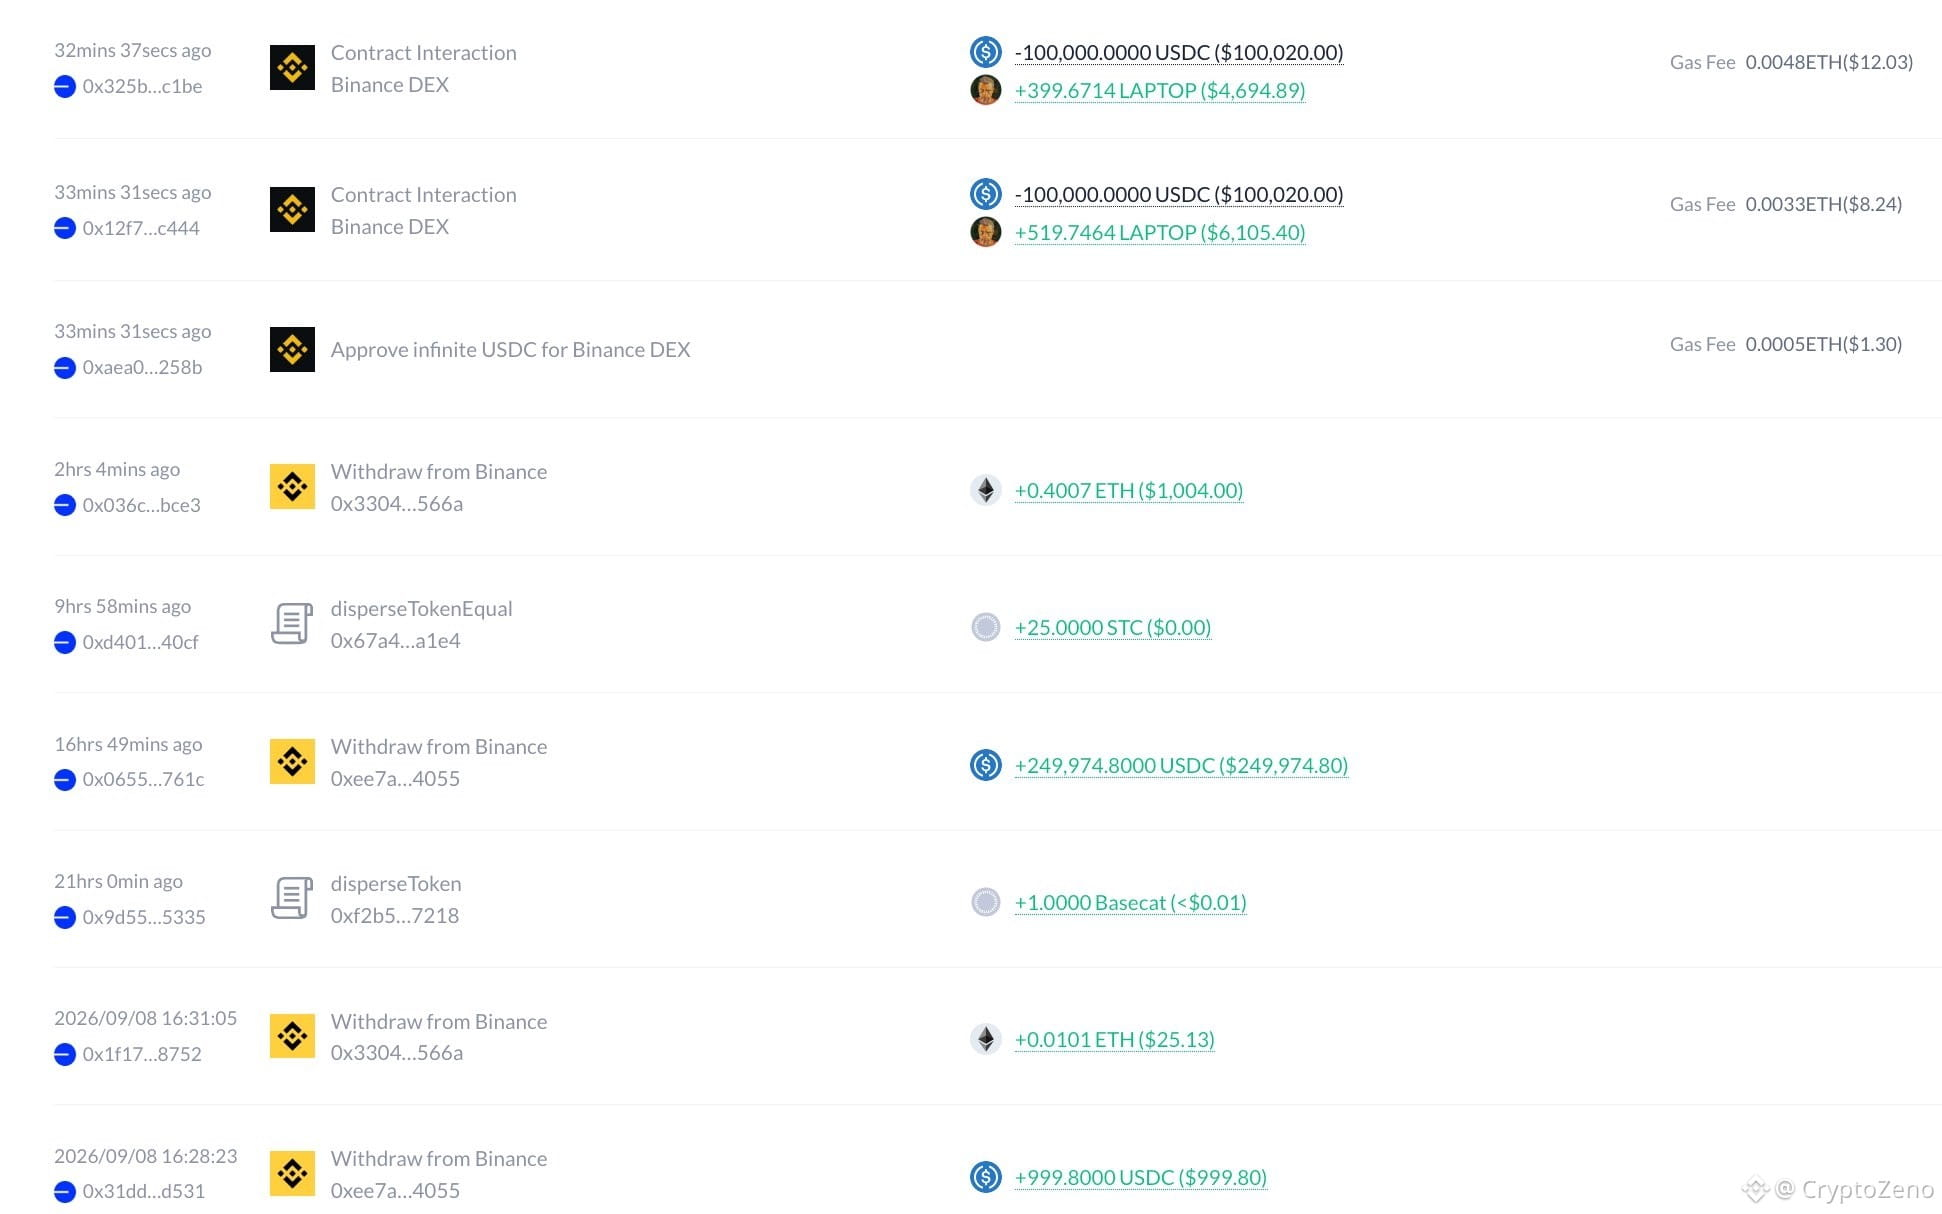
This guy turned $200K into just $3K by FOMOing into HunterBiden $LAPTOP.
He withdrew $250K from Binance in advance to buy LAPTOP as soon as it launched.
He ended up spending $200K to buy 919 LAPTOP at a high price of $218, which is now worth only $3K.
This guy turned $200K into just $3K by FOMOing into HunterBiden $LAPTOP.
He withdrew $250K from Binance in advance to buy LAPTOP as soon as it launched.
He ended up spending $200K to buy 919 LAPTOP at a high price of $218, which is now worth only $3K.
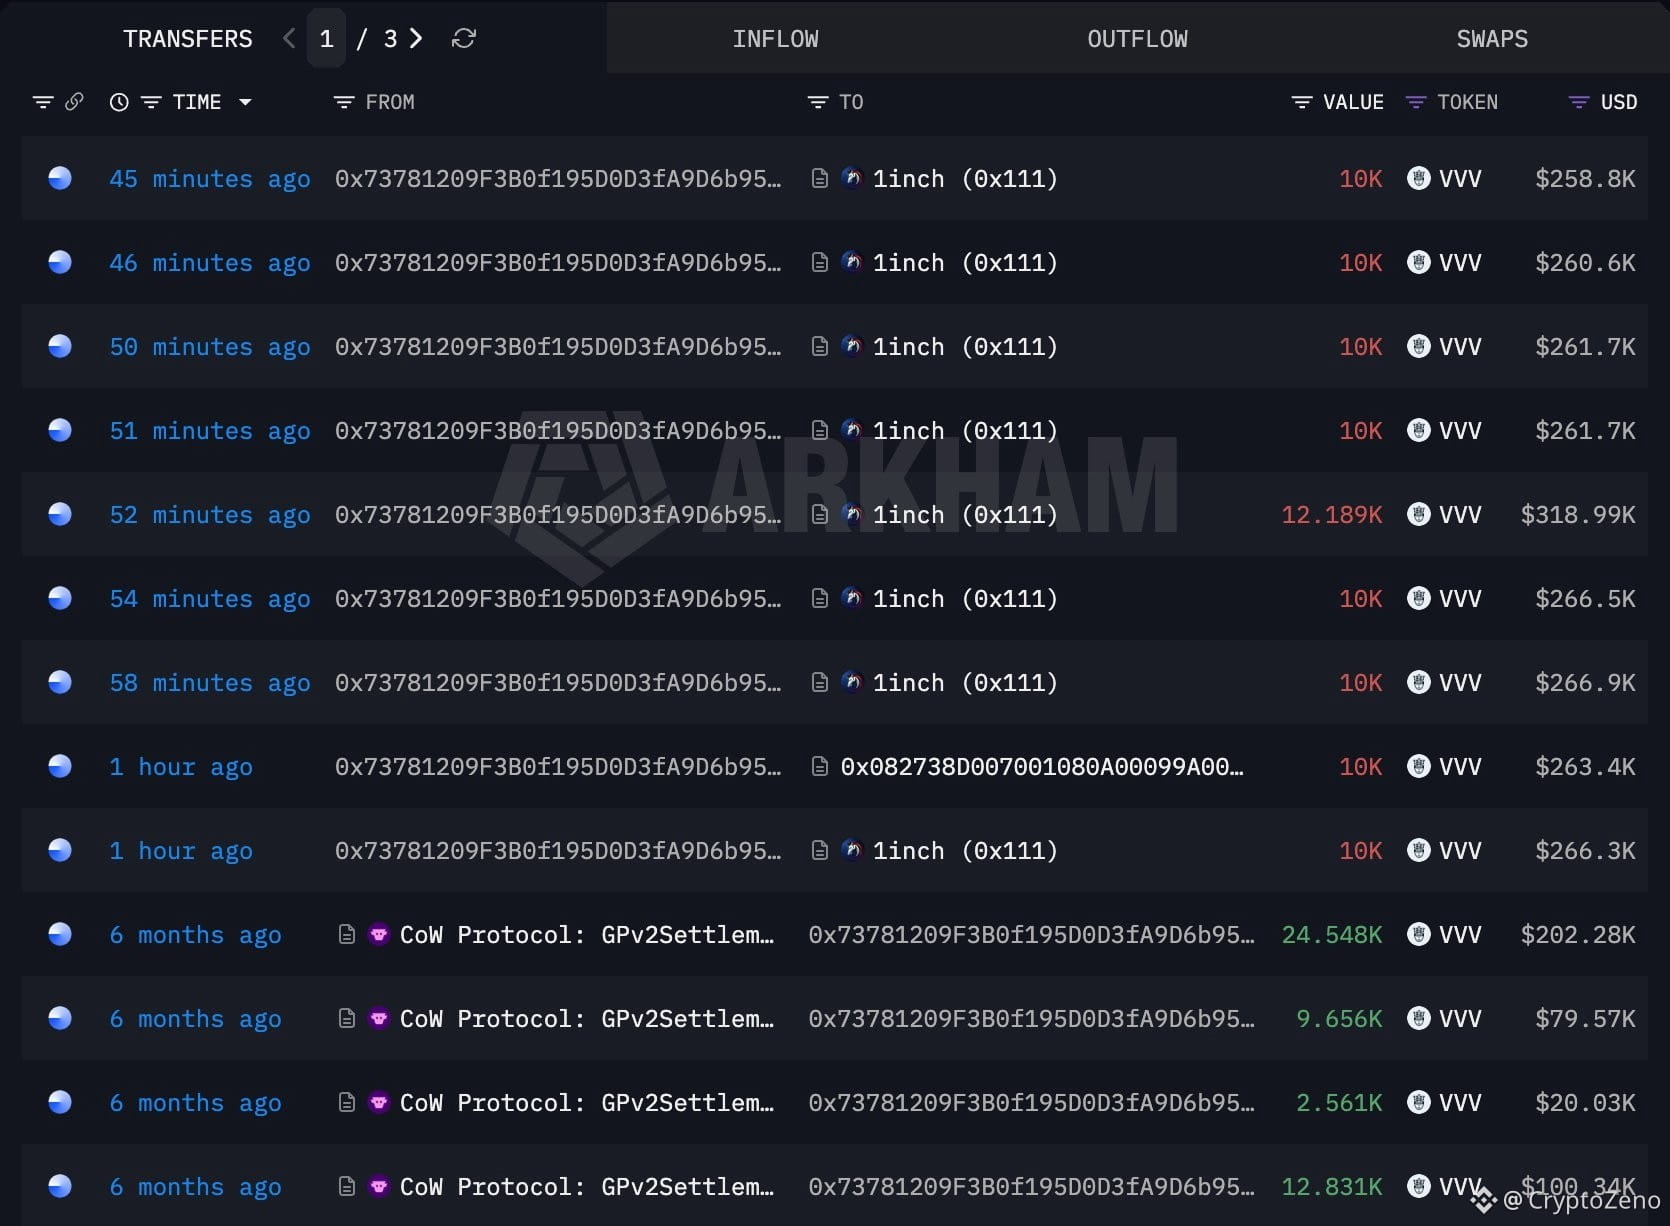
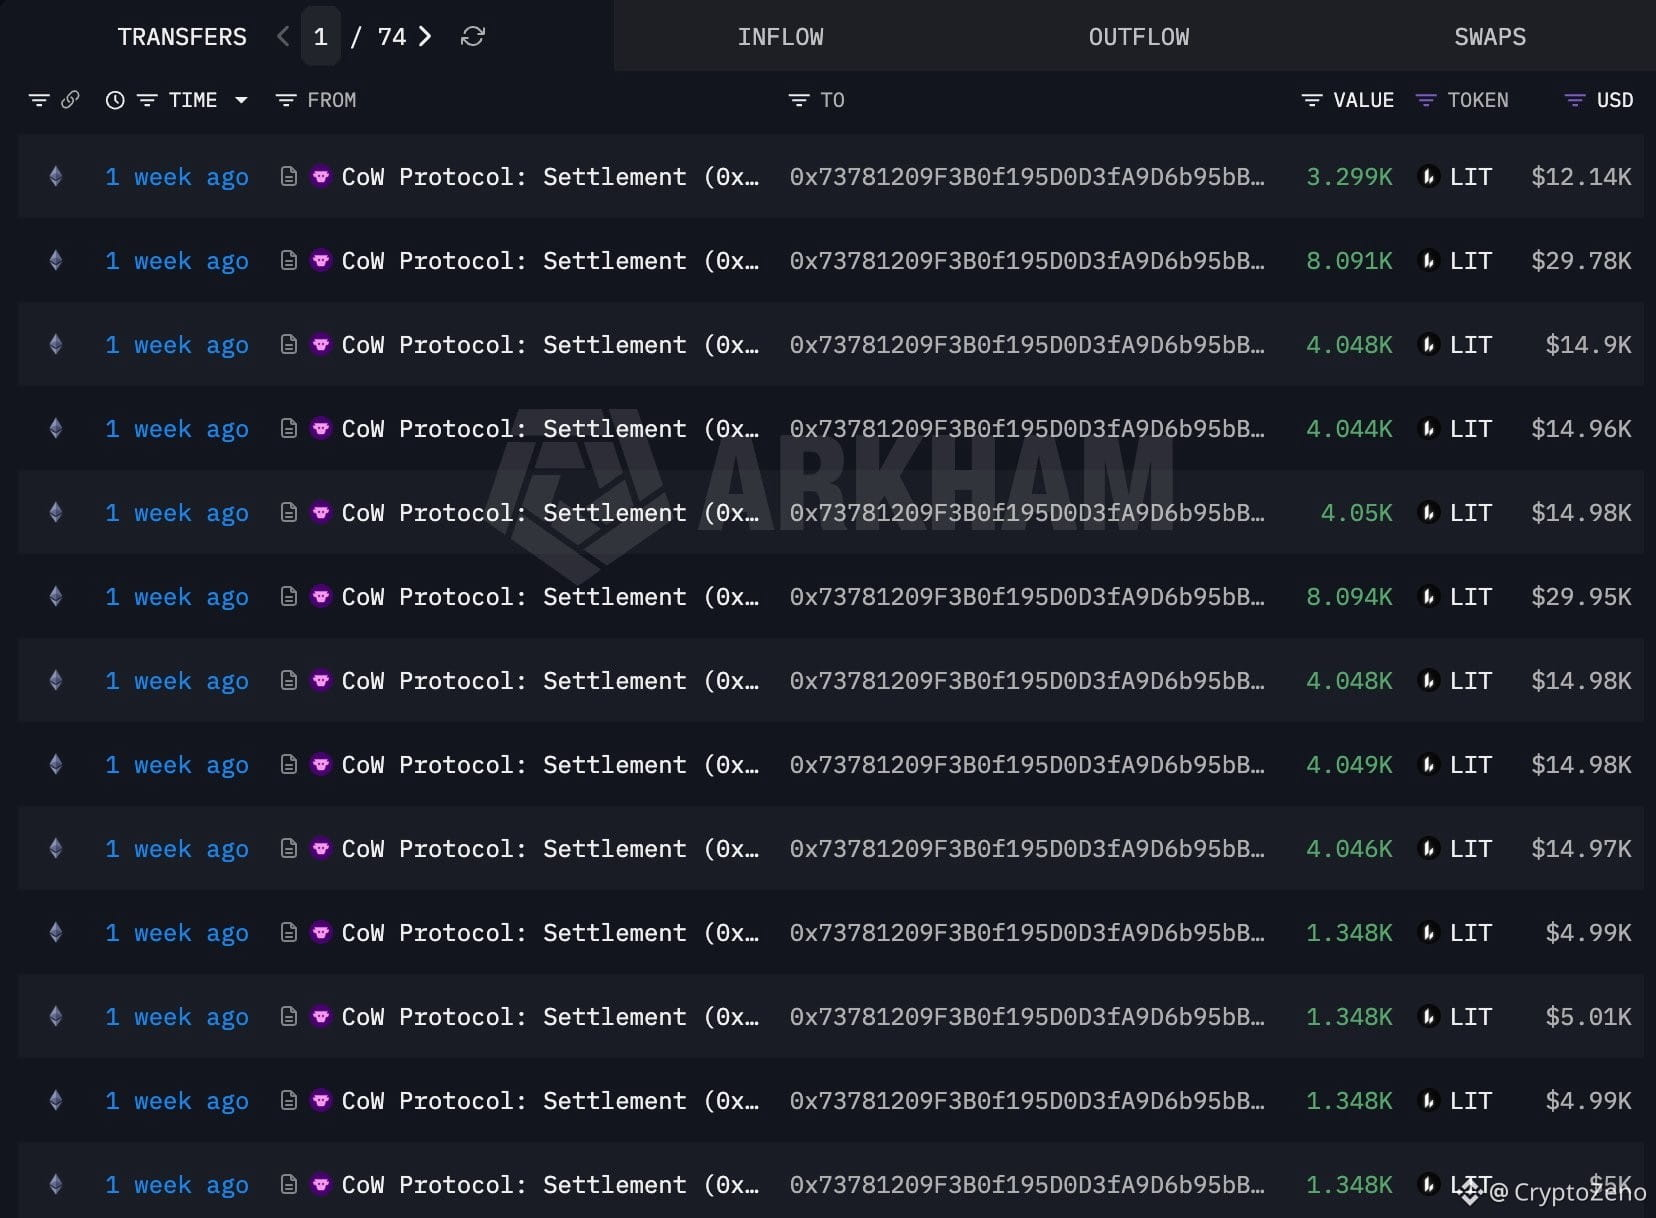
In just 6 months, whale 0x7378 made $14.93M from $VVV and $LIT !
6 months ago, he bought 102,189 VVV at $7.87.
After the price jumped today, he sold 92,189 VVV ($2.37M) at $25.75 and still holds 10K
VVV ($259.5K), making $1.83M in profit.
He also spent $11.3M to buy 4.74M LIT ($24.4M now) at an average price of $2.39 over the past 3 months, and is now sitting on a $13.1M unrealized profit.
6 months ago, he bought 102,189 VVV at $7.87.
After the price jumped today, he sold 92,189 VVV ($2.37M) at $25.75 and still holds 10K
VVV ($259.5K), making $1.83M in profit.
He also spent $11.3M to buy 4.74M LIT ($24.4M now) at an average price of $2.39 over the past 3 months, and is now sitting on a $13.1M unrealized profit.
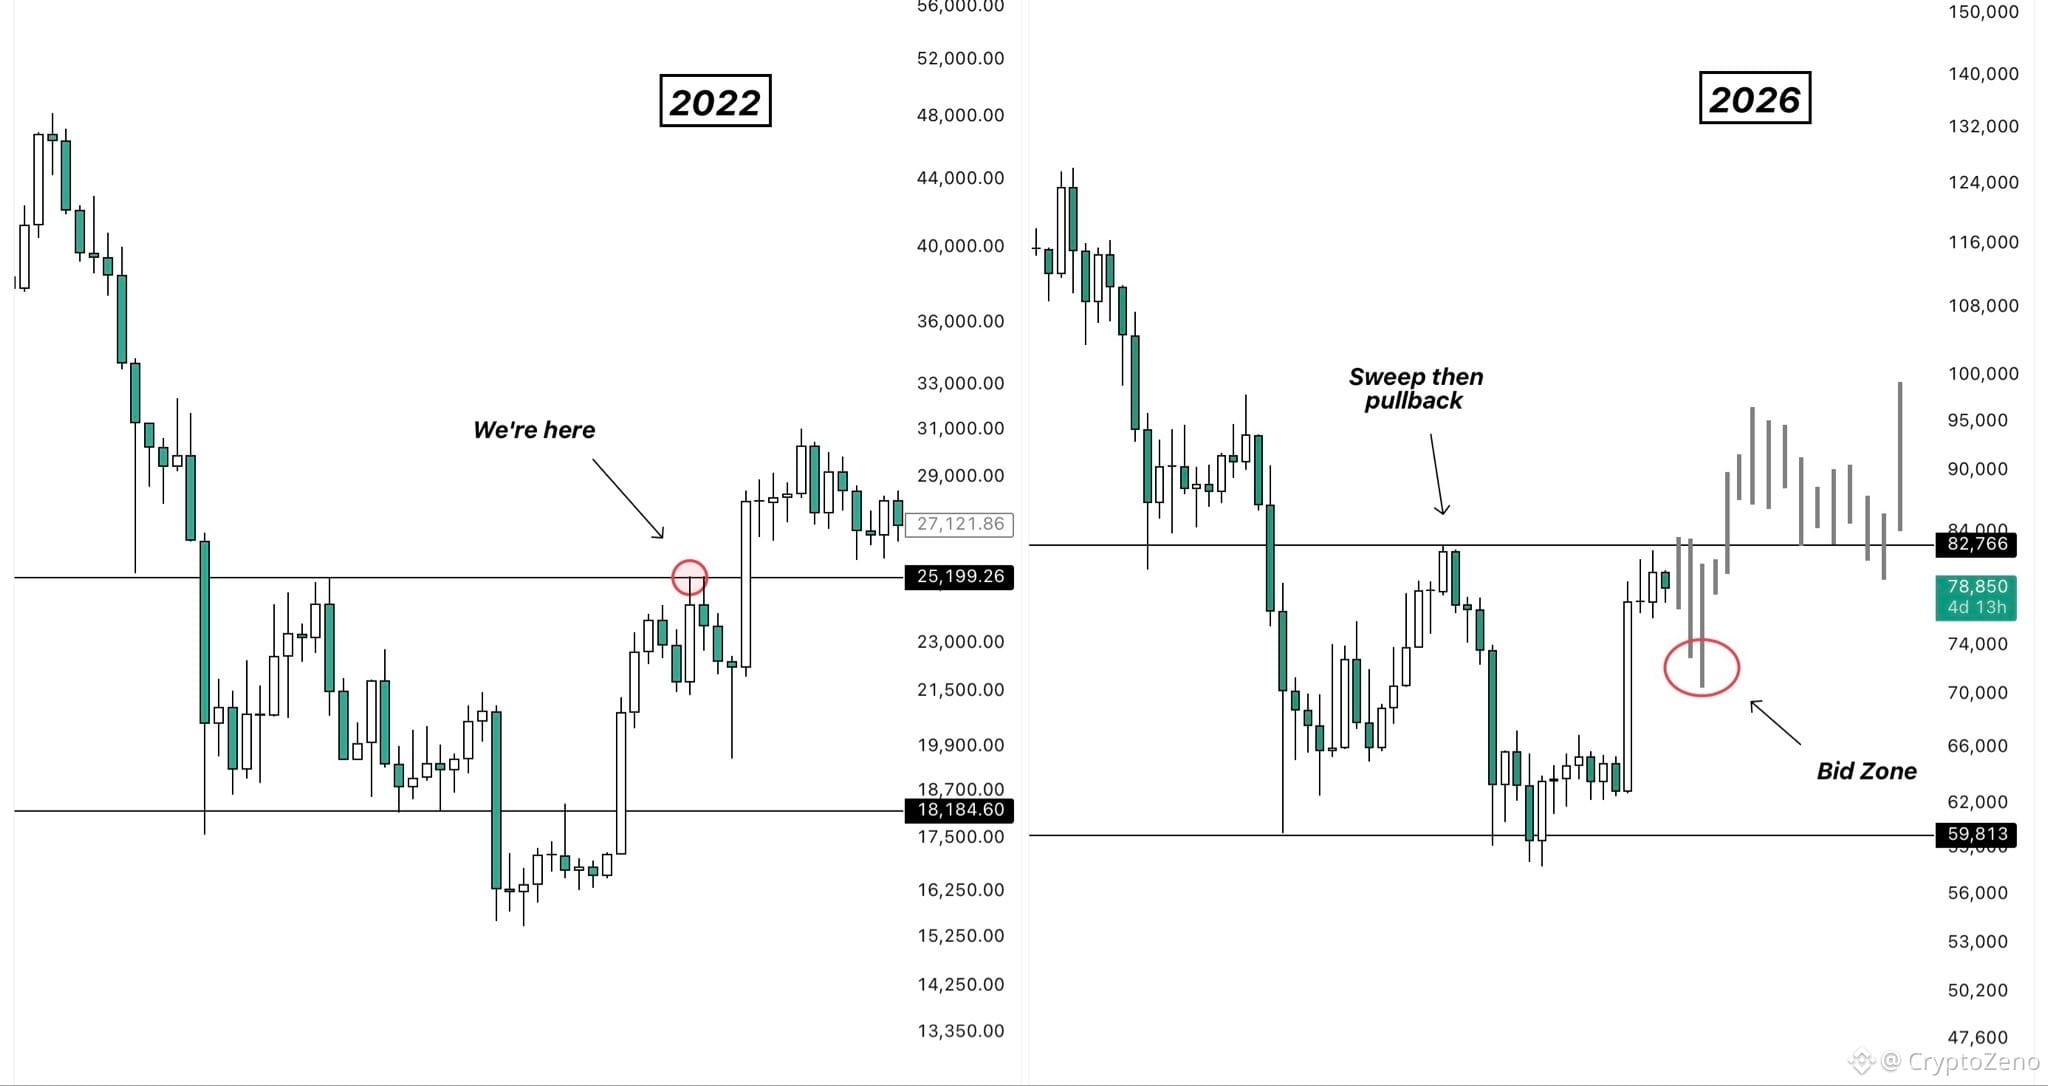
$BTC 2022 vs 2026:
Back in 2022, BTC swept the previous high almost perfectly, followed by a short-term pullback before the next larger bullish expansion.
This time around, price is once again close to sweeping the previous high around $82.8k.
I’m expecting another manipulation move to the upside to wipe out the shorts that have tried to snipe the local top, followed by a short-term pullback into the $70k–$74k region.
This is where I’ve placed my bids to add to my already running swing long. The goal is to use these opportunities to build the position further and maximize the potential return from the broader move.
Even if I don’t manage to snipe the exact bottom of the pullback, it doesn’t really matter. What counts is the long-term vision.
Back in 2022, BTC swept the previous high almost perfectly, followed by a short-term pullback before the next larger bullish expansion.
This time around, price is once again close to sweeping the previous high around $82.8k.
I’m expecting another manipulation move to the upside to wipe out the shorts that have tried to snipe the local top, followed by a short-term pullback into the $70k–$74k region.
This is where I’ve placed my bids to add to my already running swing long. The goal is to use these opportunities to build the position further and maximize the potential return from the broader move.
Even if I don’t manage to snipe the exact bottom of the pullback, it doesn’t really matter. What counts is the long-term vision.
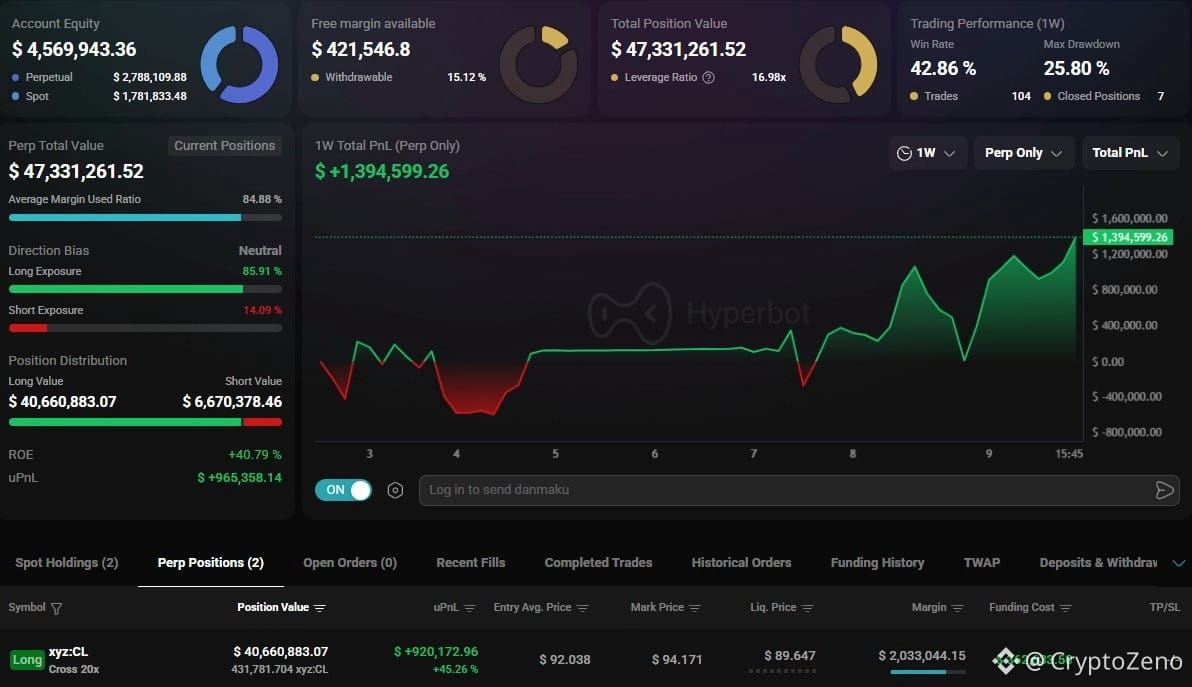
Someone opened a $40,600,000 Oil long with 20x leverage.
Liquidation Price: $89.64
He is betting on the US-Iran war escalation.
Liquidation Price: $89.64
He is betting on the US-Iran war escalation.
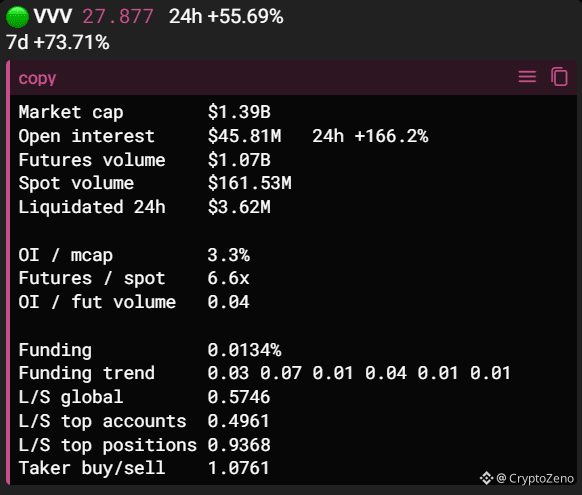
$VVV OI up 166% after a fresh ATH, but structure stays healthy.
OI at just 3.3% of mcap, futures at 6.6x spot, both within the healthy range. Remarkably measured leverage for a $1.39B market cap token, especially on a day OI jumped 166%.
There's a split: L/S at 0.57, the crowd is clearly short. Top trader positions at 0.94, close to even but far less short than the crowd, big money isn't buying into this downside bet as much.
Funding is low at 0.0134%, longs aren't paying a real cost yet. Taker at 1.08, buyers slightly aggressive.
$3.62M liquidated in 24h, a large number, this move hasn't been painless.
The supply side is genuinely notable. Annual emissions cut from 3M to 2.5M, dropping to 2M on October 1, an automatic burn mechanism (every $100 in API credits burns $5 of VVV), and roughly 42% of supply already burned, a real deflationary structure.
OI is up 166%, three times faster than price (56%). That points to fresh leverage flowing in fast, and moves like this after a new ATH usually get tested with a pullback.
The fundamental side (tightening supply, real revenue, a strong narrative) and the technical side (the split, healthy structure) point the same way. But price already made a new high and OI grew this fast, so the risk/reward here is different from getting in earlier.
OI at just 3.3% of mcap, futures at 6.6x spot, both within the healthy range. Remarkably measured leverage for a $1.39B market cap token, especially on a day OI jumped 166%.
There's a split: L/S at 0.57, the crowd is clearly short. Top trader positions at 0.94, close to even but far less short than the crowd, big money isn't buying into this downside bet as much.
Funding is low at 0.0134%, longs aren't paying a real cost yet. Taker at 1.08, buyers slightly aggressive.
$3.62M liquidated in 24h, a large number, this move hasn't been painless.
The supply side is genuinely notable. Annual emissions cut from 3M to 2.5M, dropping to 2M on October 1, an automatic burn mechanism (every $100 in API credits burns $5 of VVV), and roughly 42% of supply already burned, a real deflationary structure.
OI is up 166%, three times faster than price (56%). That points to fresh leverage flowing in fast, and moves like this after a new ATH usually get tested with a pullback.
The fundamental side (tightening supply, real revenue, a strong narrative) and the technical side (the split, healthy structure) point the same way. But price already made a new high and OI grew this fast, so the risk/reward here is different from getting in earlier.
$FF update: moved from 0.14 to 0.15, the split stays strong, but this is data week, worth staying cautious.
Price is at 0.15113, up from 0.14467 in the last update. The split remains very strong: top trader positions at 3.19, close to the earlier 3.42. L/S at 0.88, the crowd leans mildly short.
Structure stays healthy: OI at 13.5% of mcap, futures at 4.1x spot. OI is up 31.8%, a bit faster than price (25.98%) but not extreme. Taker at 1.21, buyers are the aggressive side.
A single whale sell order sits above, $157K at 0.20, placed 18 hours ago. Roughly 32% above current price, could be the next test point, but it can be cancelled, not a fixed wall.
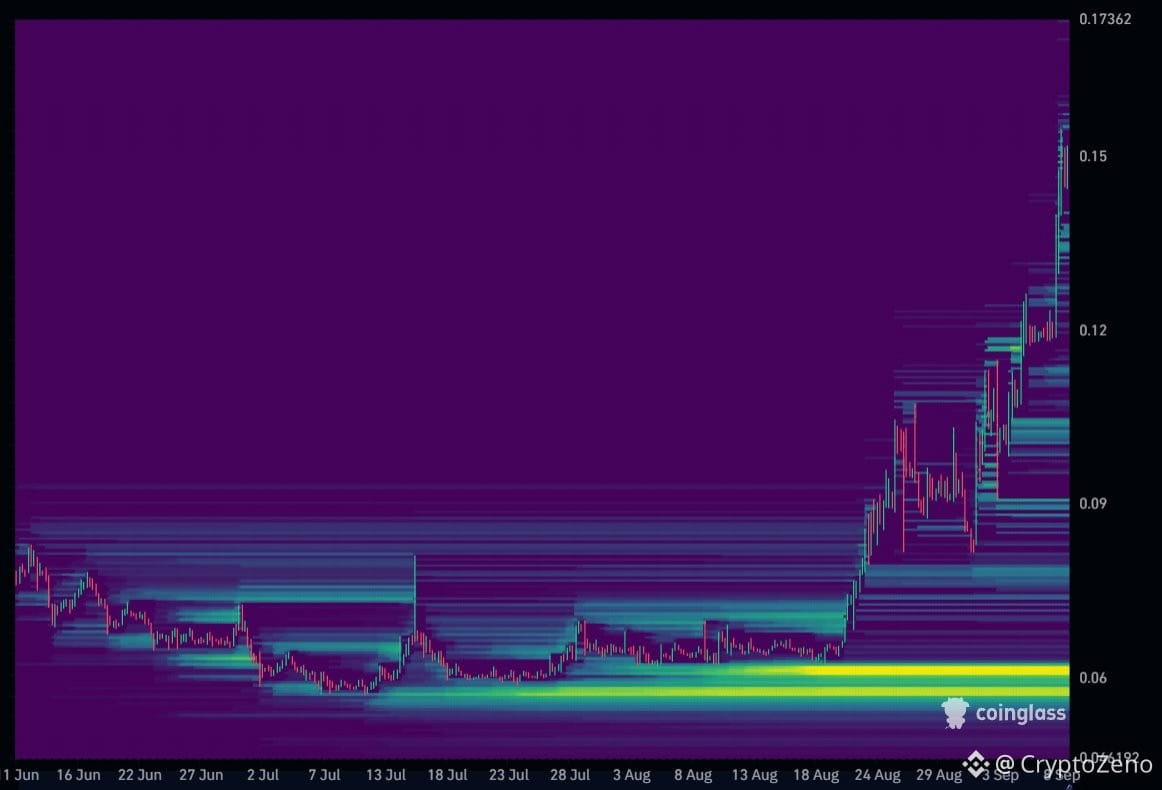
Below, the liquidation map calls for attention. There's a dense cluster at 0.06, roughly 60% below current price. Far off, but a zone that could get targeted in a downside scenario.
Worth flagging this week: CPI and PPI land this week, key macro data. Weeks like this can bring sudden, sharp market-wide moves. FF's own structure looks healthy, but a broader market shock could still hit this picture.
Price is at 0.15113, up from 0.14467 in the last update. The split remains very strong: top trader positions at 3.19, close to the earlier 3.42. L/S at 0.88, the crowd leans mildly short.
Structure stays healthy: OI at 13.5% of mcap, futures at 4.1x spot. OI is up 31.8%, a bit faster than price (25.98%) but not extreme. Taker at 1.21, buyers are the aggressive side.
A single whale sell order sits above, $157K at 0.20, placed 18 hours ago. Roughly 32% above current price, could be the next test point, but it can be cancelled, not a fixed wall.
Below, the liquidation map calls for attention. There's a dense cluster at 0.06, roughly 60% below current price. Far off, but a zone that could get targeted in a downside scenario.
Worth flagging this week: CPI and PPI land this week, key macro data. Weeks like this can bring sudden, sharp market-wide moves. FF's own structure looks healthy, but a broader market shock could still hit this picture.
🚨 $BTC Log Curves Are Flashing A 2026–2027 Warning
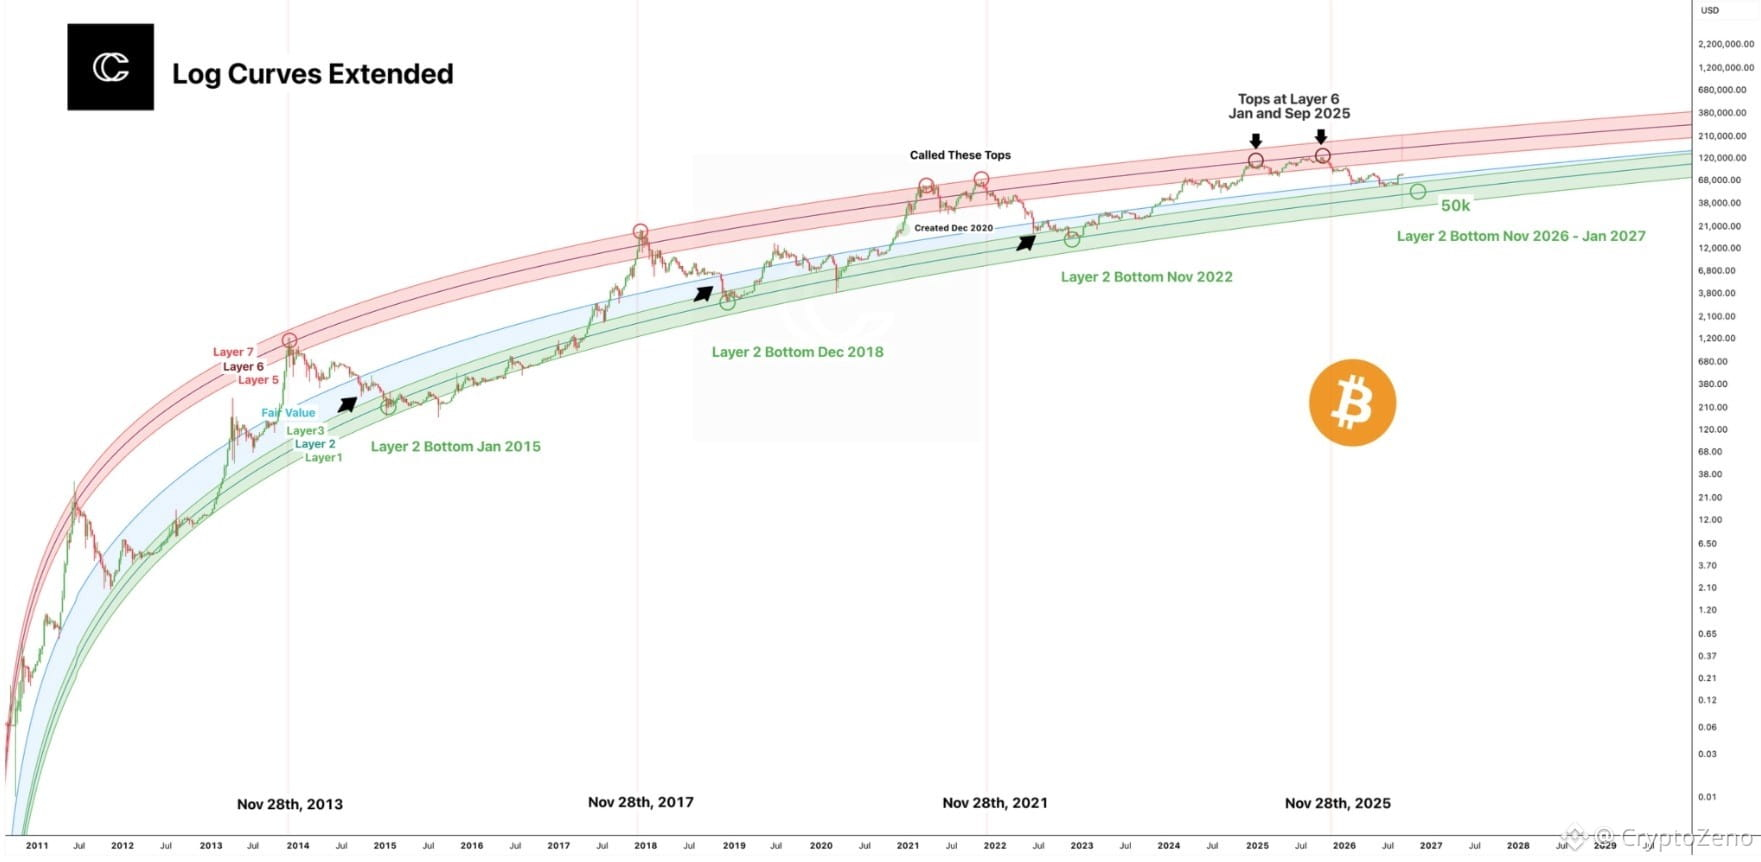
#Bitcoin is once again approaching the upper boundaries of the long term logarithmic growth curve, a zone that has historically aligned with major cycle tops. The chart highlights how previous peaks repeatedly interacted with the upper Layer 6 and Layer 7 bands before entering deep multi month corrections. In 2025, BTC reached the Layer 6 region twice, creating a structure that deserves attention as the cycle matures.
What makes the current setup more interesting is the distance between the projected top zone and the historical Layer 2 support structure. The model suggests that if BTC completes another major distribution phase near the upper logarithmic bands, the next large scale correction could eventually push price toward the lower green channel. The projected Layer 2 bottom around November 2026 to January 2027 sits near the $50K area, making it a critical long term valuation zone rather than an immediate target.
Historically, these logarithmic curves have acted less like precise price targets and more like structural boundaries for Bitcoin market cycles. Major tops formed near the red bands, while deep bear market bottoms repeatedly found support around the lower green layers. The repeating interaction between these zones suggests that time and price compression may be just as important as momentum when evaluating the current cycle.
The key question now is whether BTC can break decisively above the established upper curve and invalidate the historical pattern, or whether the market is approaching another distribution phase. If the logarithmic structure continues to rhyme with previous cycles, the next major opportunity may not come at the top, but after a prolonged reset toward the lower valuation bands.
#Bitcoin is once again approaching the upper boundaries of the long term logarithmic growth curve, a zone that has historically aligned with major cycle tops. The chart highlights how previous peaks repeatedly interacted with the upper Layer 6 and Layer 7 bands before entering deep multi month corrections. In 2025, BTC reached the Layer 6 region twice, creating a structure that deserves attention as the cycle matures.
What makes the current setup more interesting is the distance between the projected top zone and the historical Layer 2 support structure. The model suggests that if BTC completes another major distribution phase near the upper logarithmic bands, the next large scale correction could eventually push price toward the lower green channel. The projected Layer 2 bottom around November 2026 to January 2027 sits near the $50K area, making it a critical long term valuation zone rather than an immediate target.
Historically, these logarithmic curves have acted less like precise price targets and more like structural boundaries for Bitcoin market cycles. Major tops formed near the red bands, while deep bear market bottoms repeatedly found support around the lower green layers. The repeating interaction between these zones suggests that time and price compression may be just as important as momentum when evaluating the current cycle.
The key question now is whether BTC can break decisively above the established upper curve and invalidate the historical pattern, or whether the market is approaching another distribution phase. If the logarithmic structure continues to rhyme with previous cycles, the next major opportunity may not come at the top, but after a prolonged reset toward the lower valuation bands.
Patience pays off!
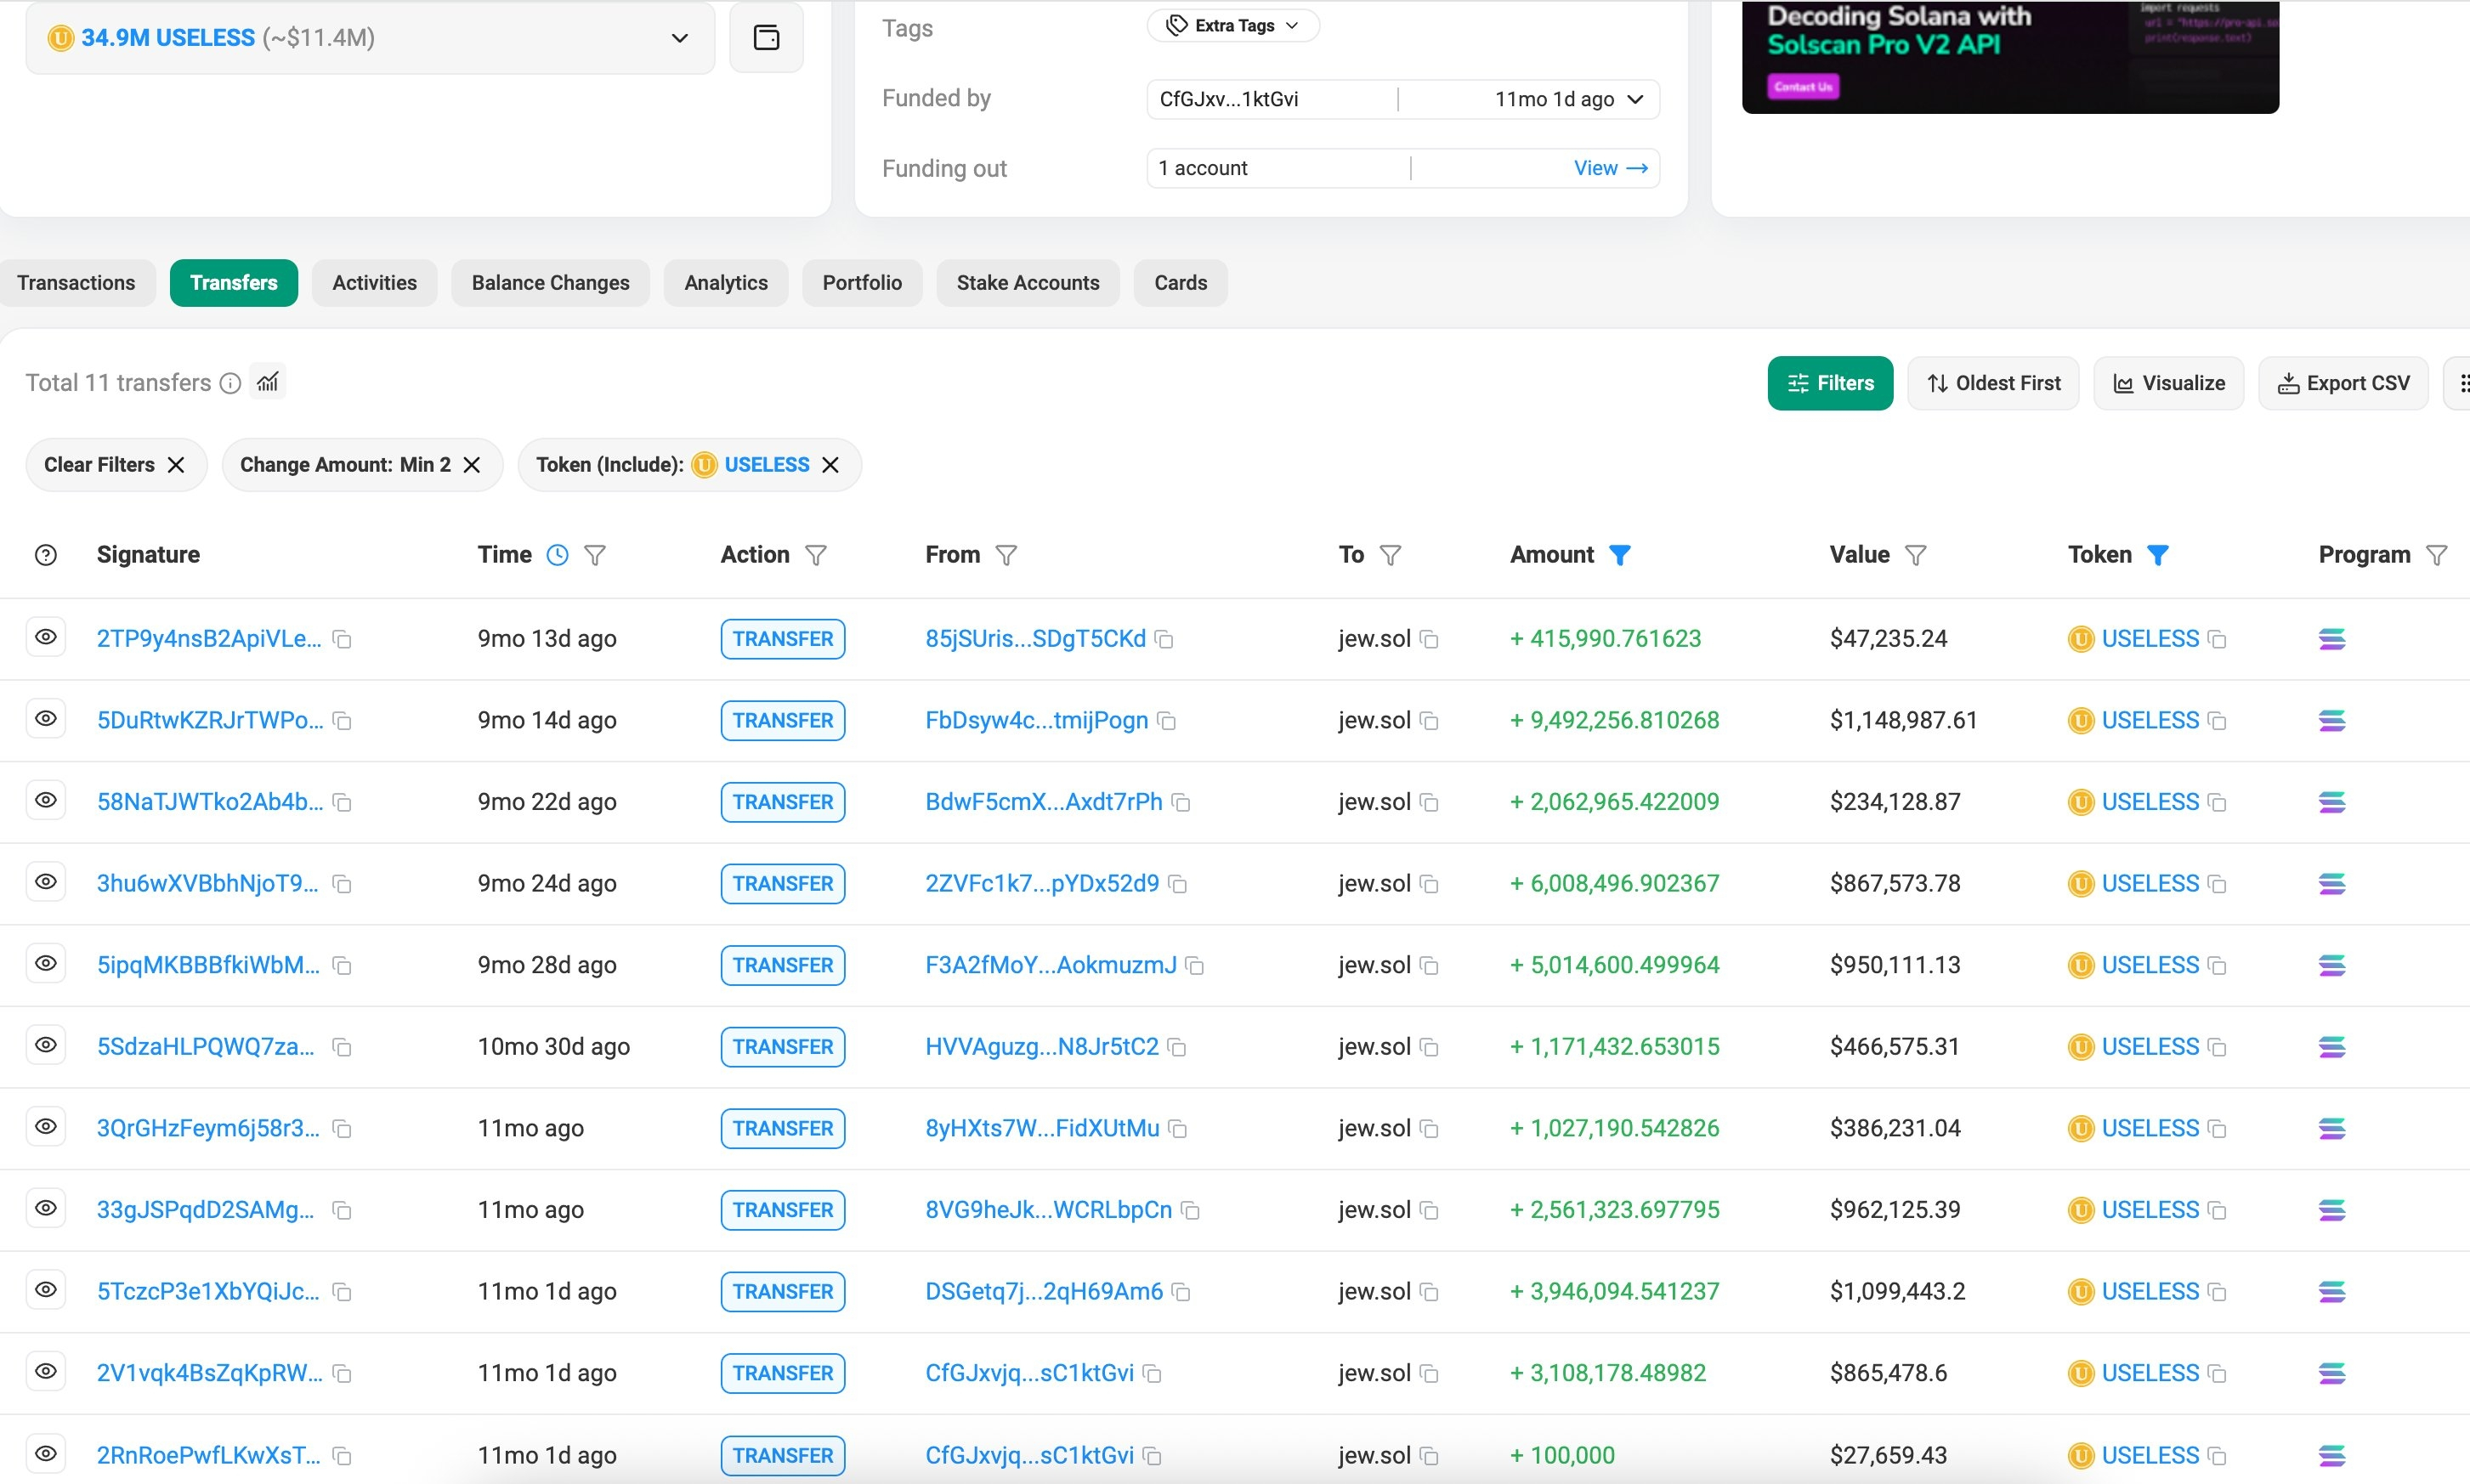
jew.sol has held 34.9M $USELESS ($11.4M) for over 9 months, turning a loss of over $5M into a profit of over $5M.
In September and October 2025, jew.sol spent $6.4M to buy 34.9M $USELESS at an average price of $0.1833.
At one point, he was down over $5M.
Now, as $USELESS rises, he is sitting on over $5M in unrealized profit.
jew.sol has held 34.9M $USELESS ($11.4M) for over 9 months, turning a loss of over $5M into a profit of over $5M.
In September and October 2025, jew.sol spent $6.4M to buy 34.9M $USELESS at an average price of $0.1833.
At one point, he was down over $5M.
Now, as $USELESS rises, he is sitting on over $5M in unrealized profit.
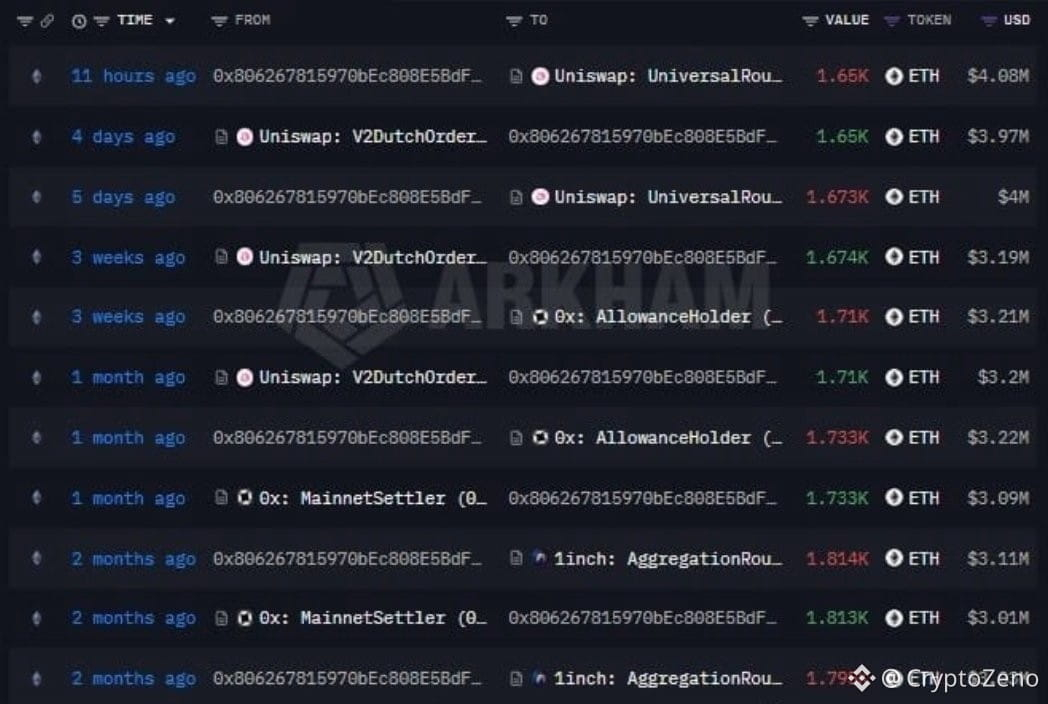
A large wallet is continuously executing ETH transactions on a scale of millions of USD.
According to the data in the image recent transactions range from approximately 1650 to over 1800 $ETH each time equivalent to about 3 to 4 million USD. Notably this activity has appeared multiple times over the course of several months rather than being a single transaction.
The flow of funds through protocols like Uniswap 1inch and 0x suggests this could be swap activity or onchain transaction routing but based solely on the image its not yet possible to conclude the wallets ultimate purpose.
When an address continuously rotates thousands of ETH like this its worth tracking where the funds will ultimately flow.
According to the data in the image recent transactions range from approximately 1650 to over 1800 $ETH each time equivalent to about 3 to 4 million USD. Notably this activity has appeared multiple times over the course of several months rather than being a single transaction.
The flow of funds through protocols like Uniswap 1inch and 0x suggests this could be swap activity or onchain transaction routing but based solely on the image its not yet possible to conclude the wallets ultimate purpose.
When an address continuously rotates thousands of ETH like this its worth tracking where the funds will ultimately flow.
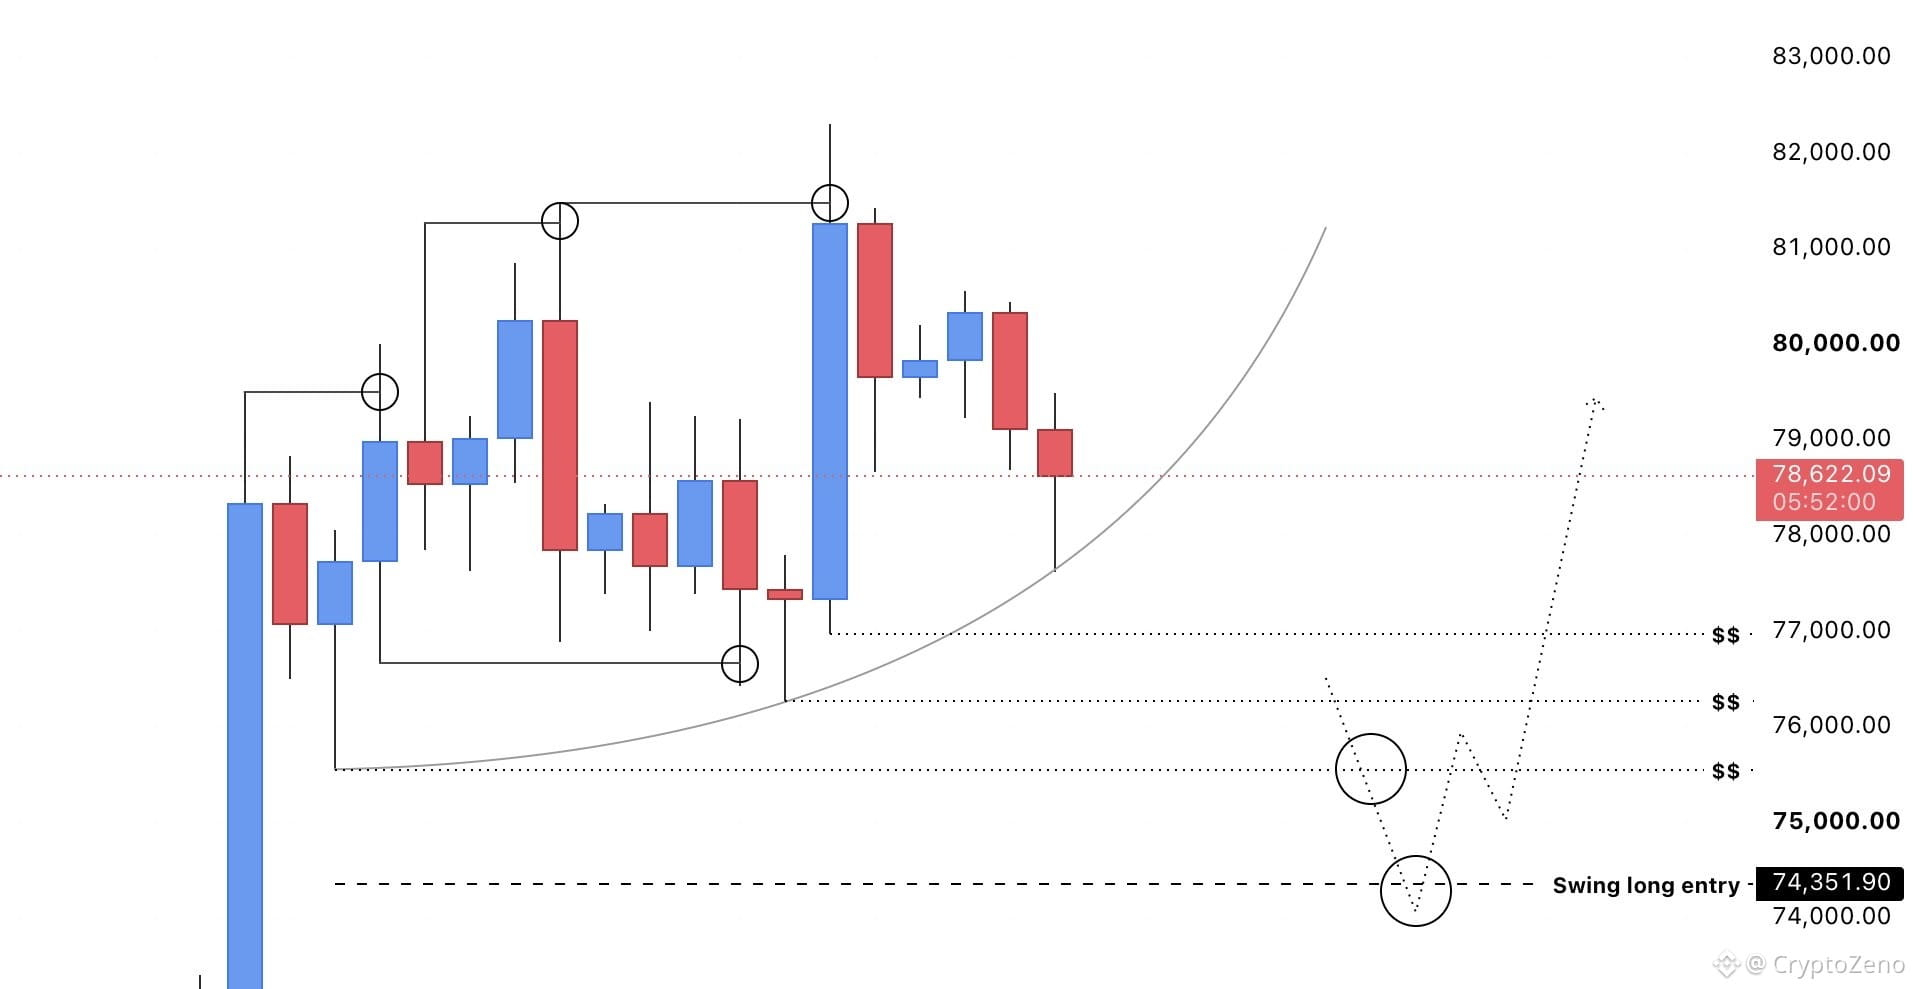
$BTC Price is sweeping the highs while leaving most of the lows unswept, building liquidity below the range lows.
This makes participants feel psychologically safe in local longs, but price will likely eventually sweep some of the lows and take that liquidity.
Ultimately, I'm still bullish on the HTF. Just waiting for 74.3K before entering my second swing long.
This makes participants feel psychologically safe in local longs, but price will likely eventually sweep some of the lows and take that liquidity.
Ultimately, I'm still bullish on the HTF. Just waiting for 74.3K before entering my second swing long.
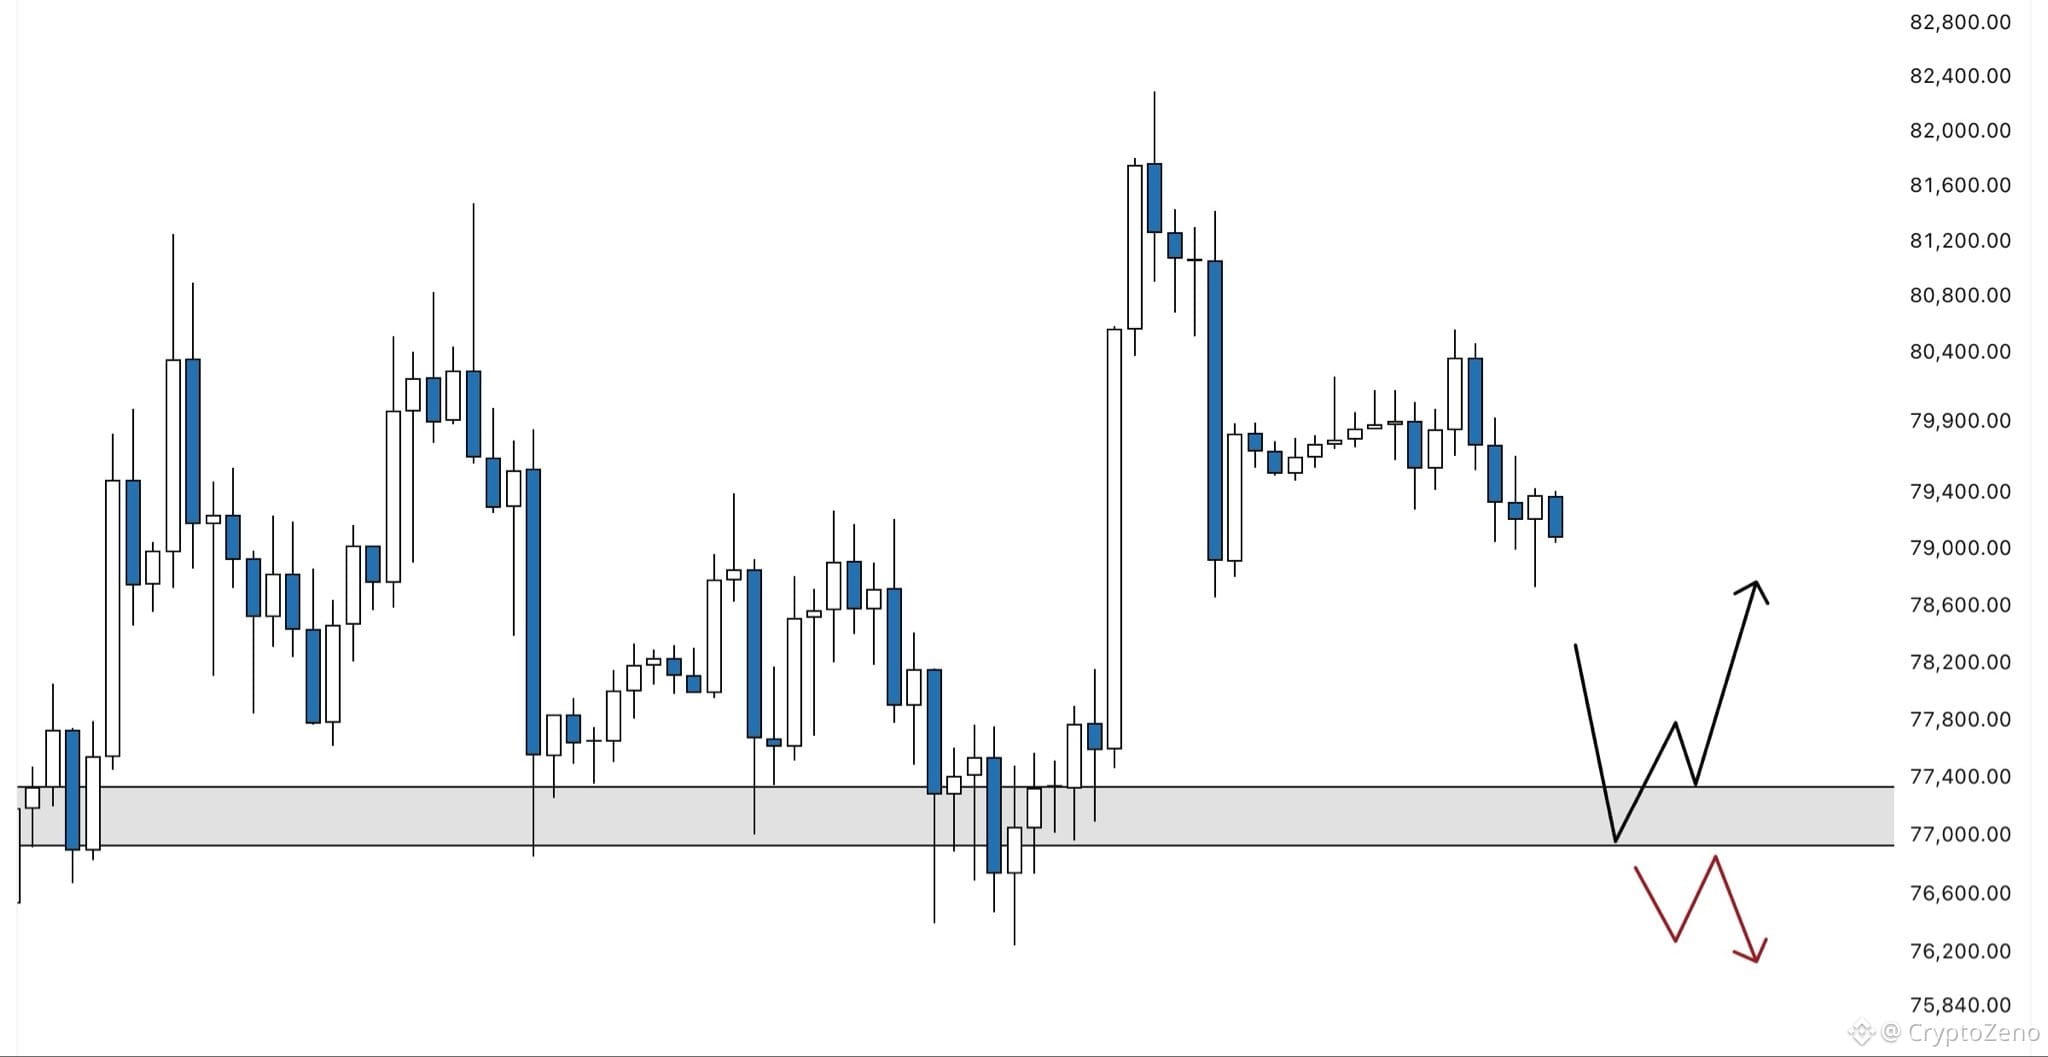
$BTC This zone has to hold.
The current main support is the area between 77k and 77.4k.
Looking at the LTF structure, it’s likely that we see a further drop in price and a retest of this zone.
If we get this retest, this zone has to hold for bullish continuation.
If it instead breaks, a violent and quick move into the low 70s is extremely likely.
The current main support is the area between 77k and 77.4k.
Looking at the LTF structure, it’s likely that we see a further drop in price and a retest of this zone.
If we get this retest, this zone has to hold for bullish continuation.
If it instead breaks, a violent and quick move into the low 70s is extremely likely.
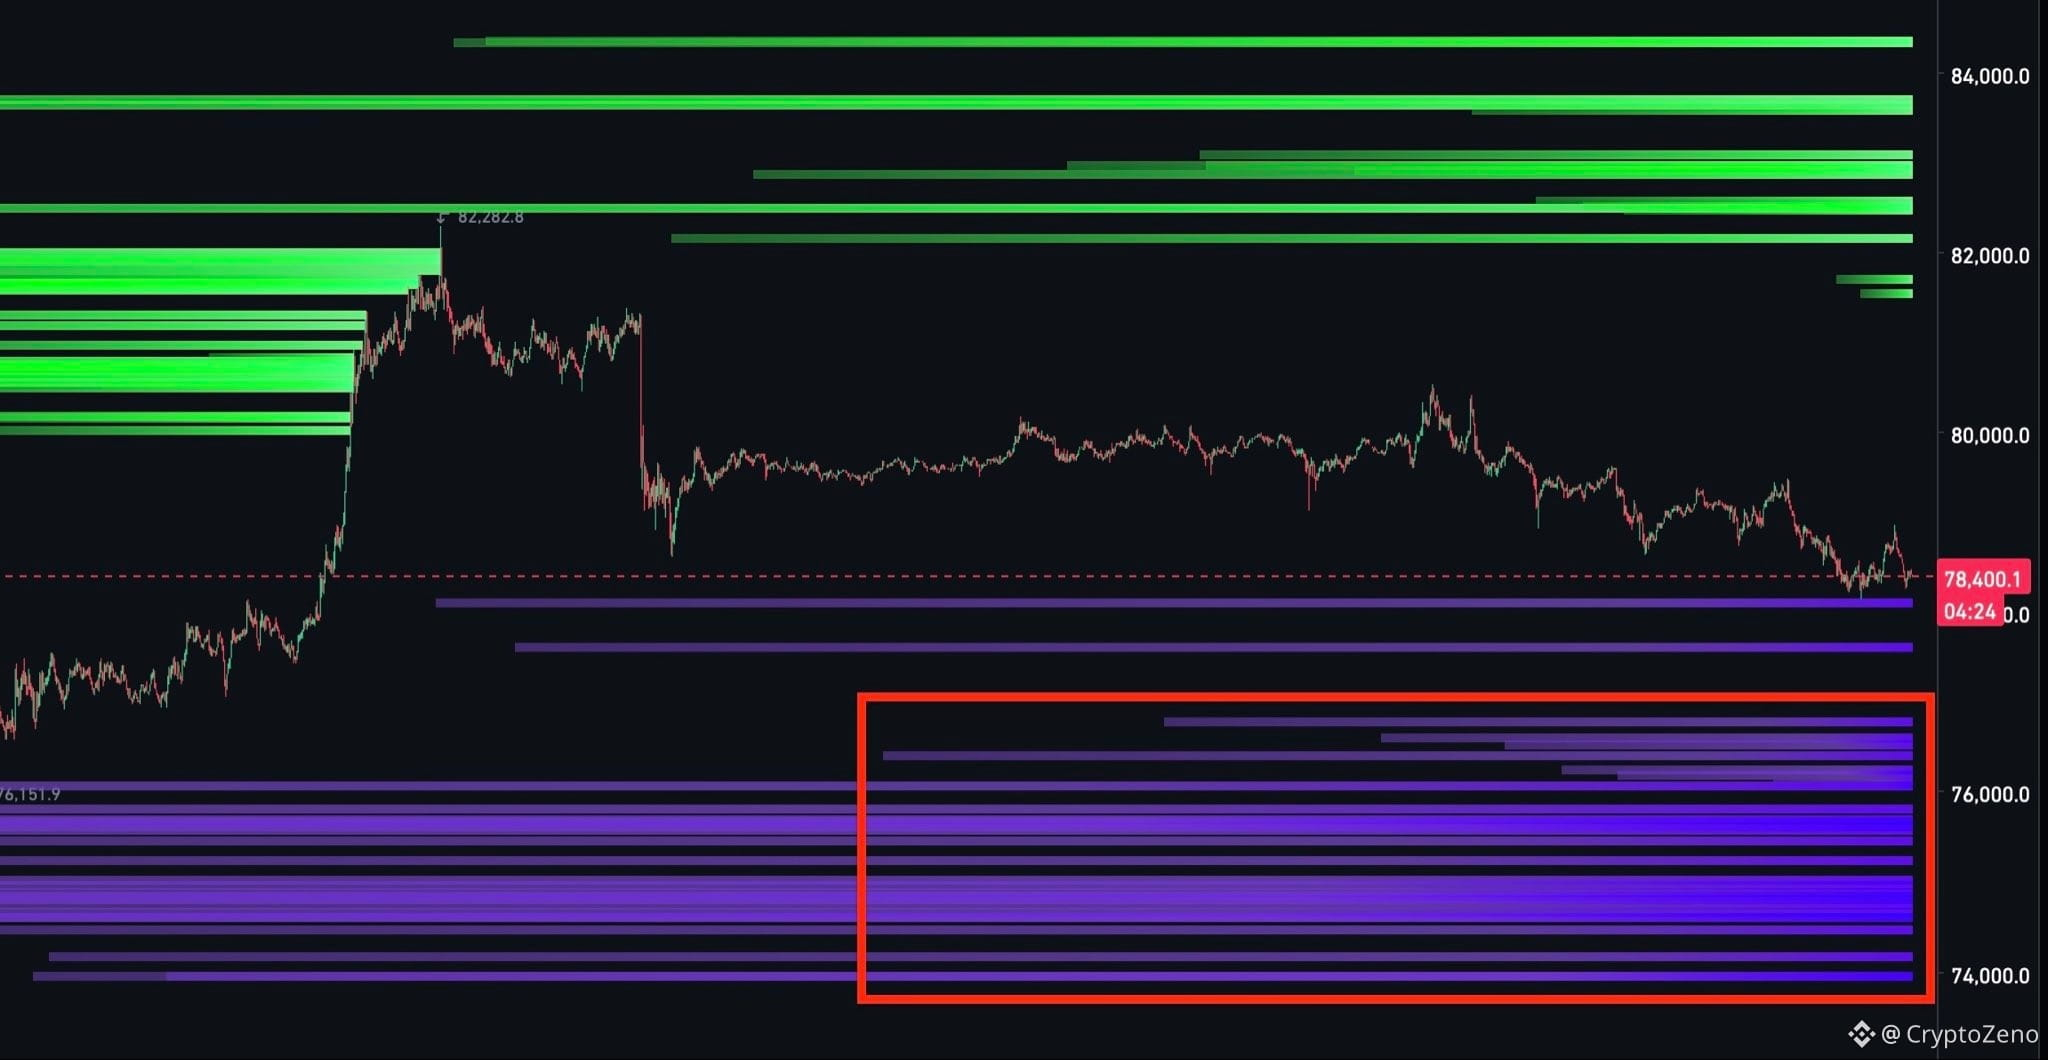
$BTC This downside liquidity is going to get cleared eventually.
Over the past two weeks, liquidity has been stacking up below $76K.
Since then, BTC has swept the highs three times, but has front-run the downside cluster every single time.
I believe that once we get a confirmed break below $77K, we could see a sharp correction where longs get squeezed and this liquidity finally gets swept.
This would also bring price closer to my main area of interest for another swing long around $72K–$74K, where I’ll be looking to add to my already running position.
Over the past two weeks, liquidity has been stacking up below $76K.
Since then, BTC has swept the highs three times, but has front-run the downside cluster every single time.
I believe that once we get a confirmed break below $77K, we could see a sharp correction where longs get squeezed and this liquidity finally gets swept.
This would also bring price closer to my main area of interest for another swing long around $72K–$74K, where I’ll be looking to add to my already running position.
$BTC Never fails... ✔️
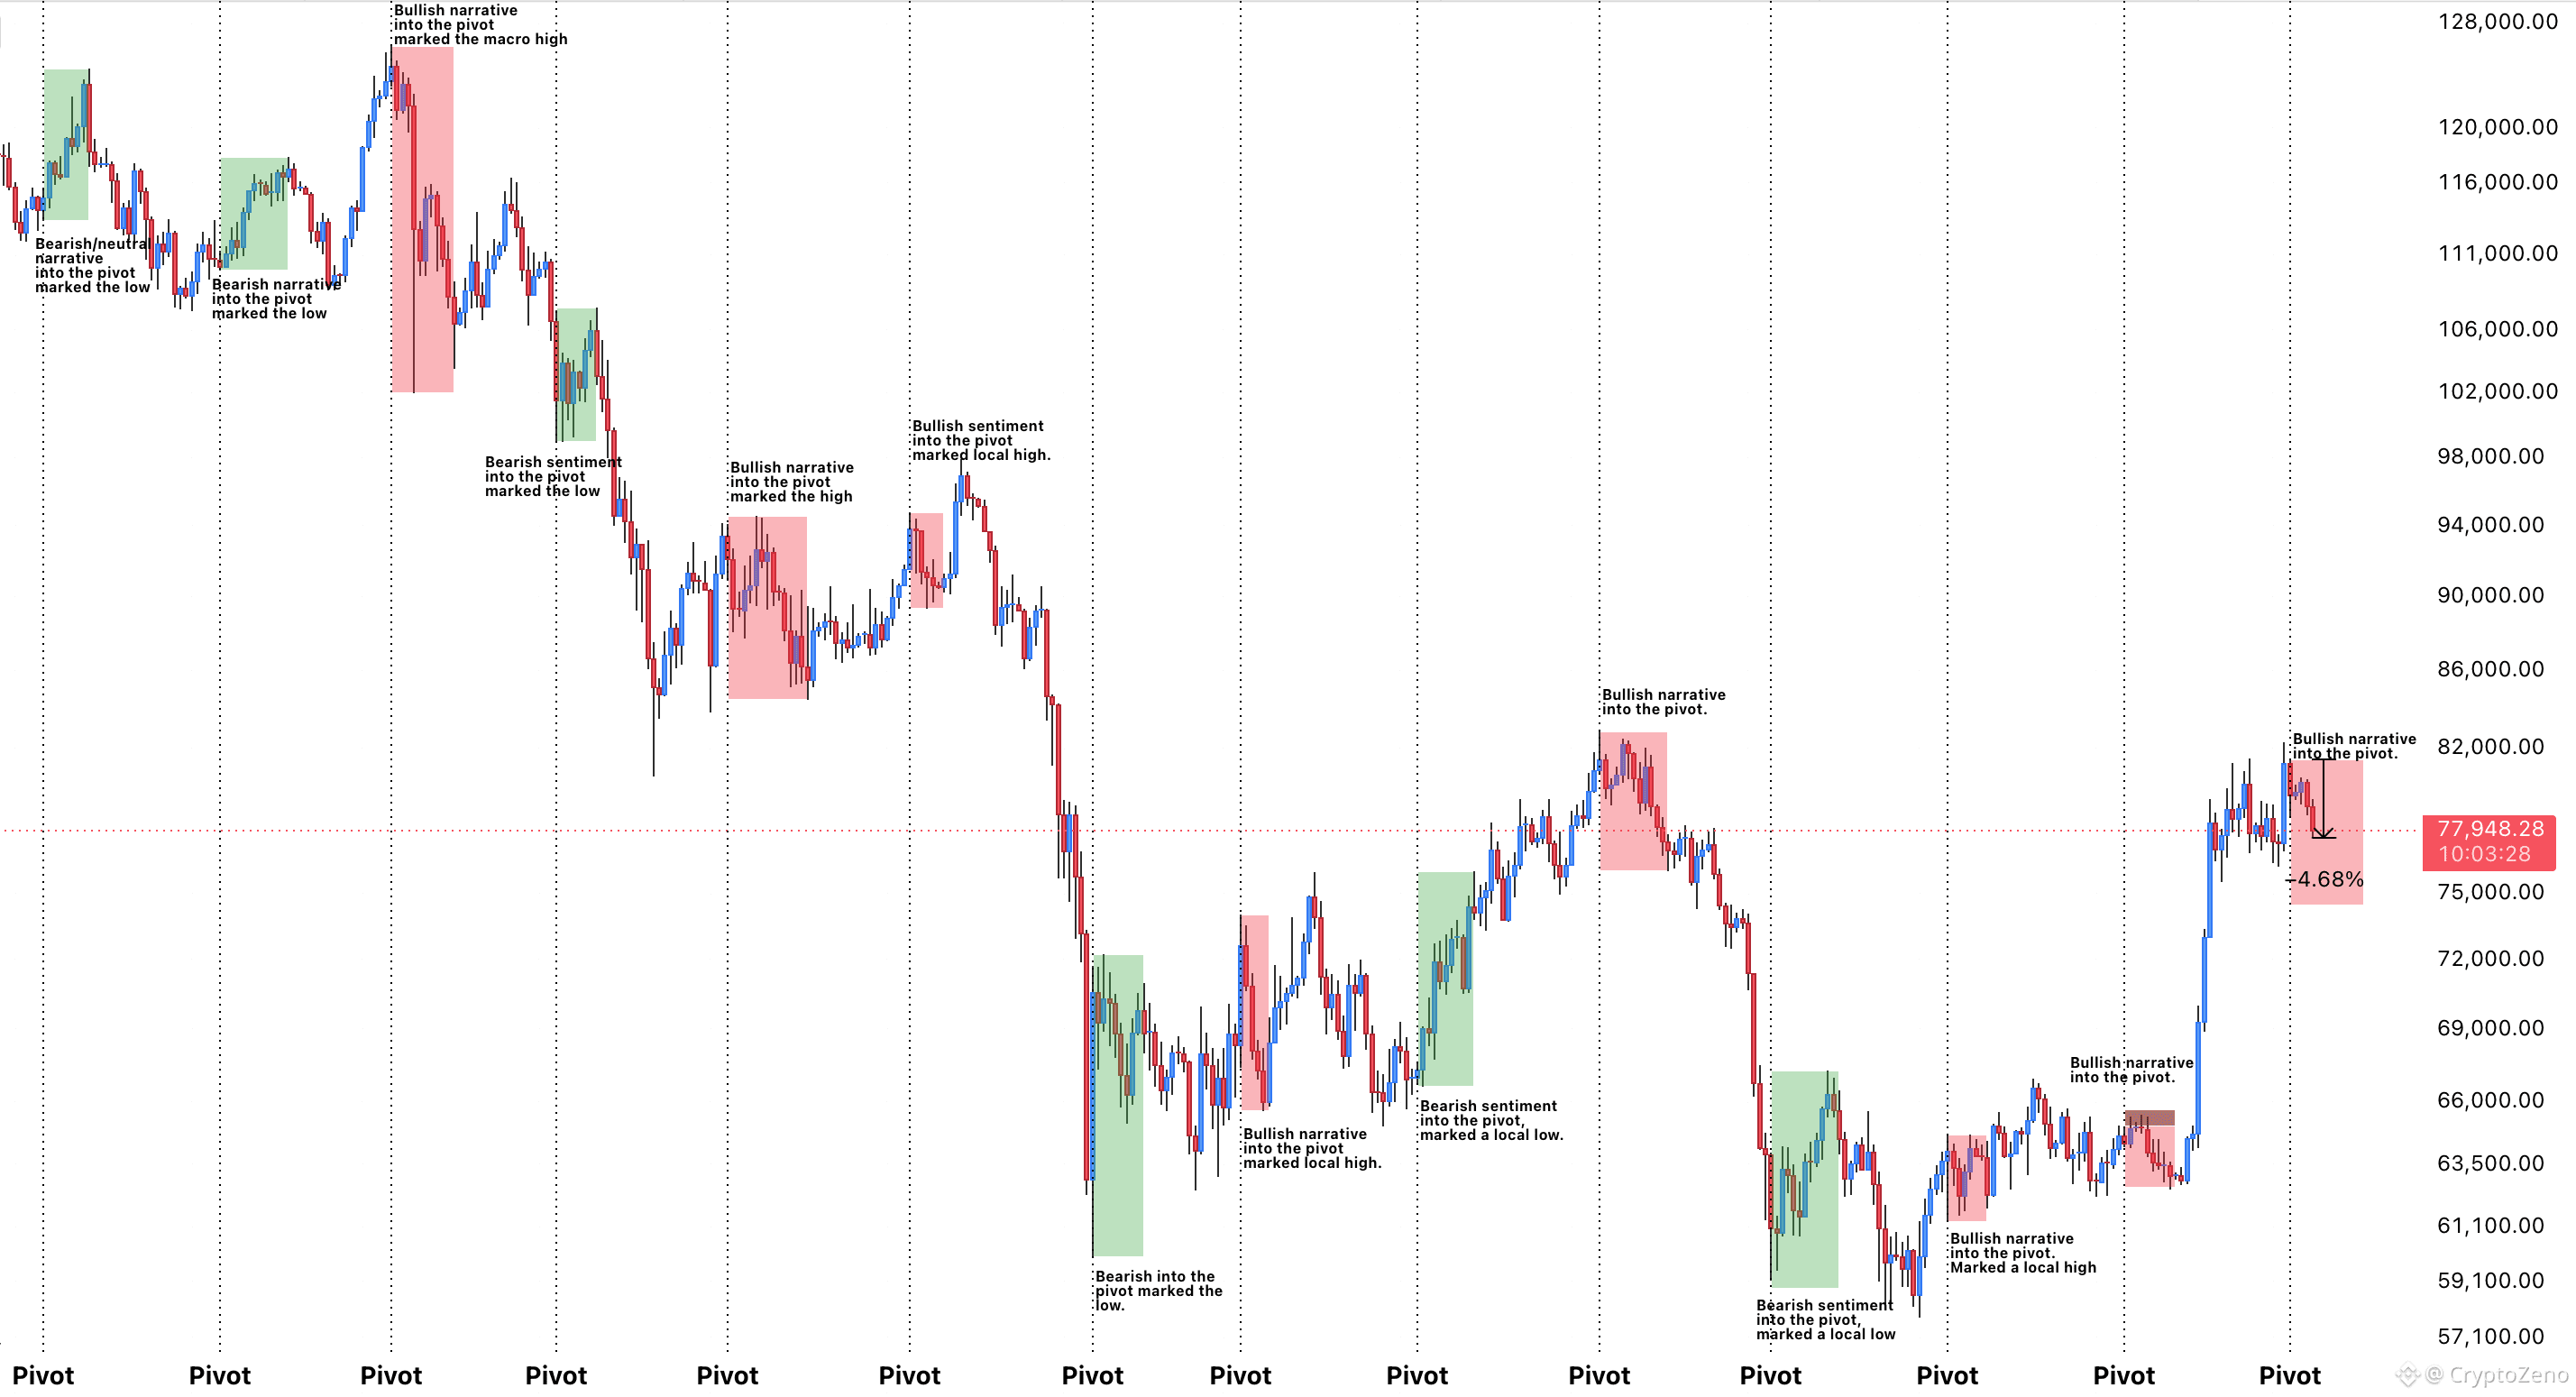
Bullish sentiment into my 4–6th pivot has always marked a local top.
Down -4.6% since.
Pay attention to the sentiment heading into the 4–6th pivot next month.
Bullish sentiment into my 4–6th pivot has always marked a local top.
Down -4.6% since.
Pay attention to the sentiment heading into the 4–6th pivot next month.
$BTC Another retest of $77K is becoming increasingly likely.
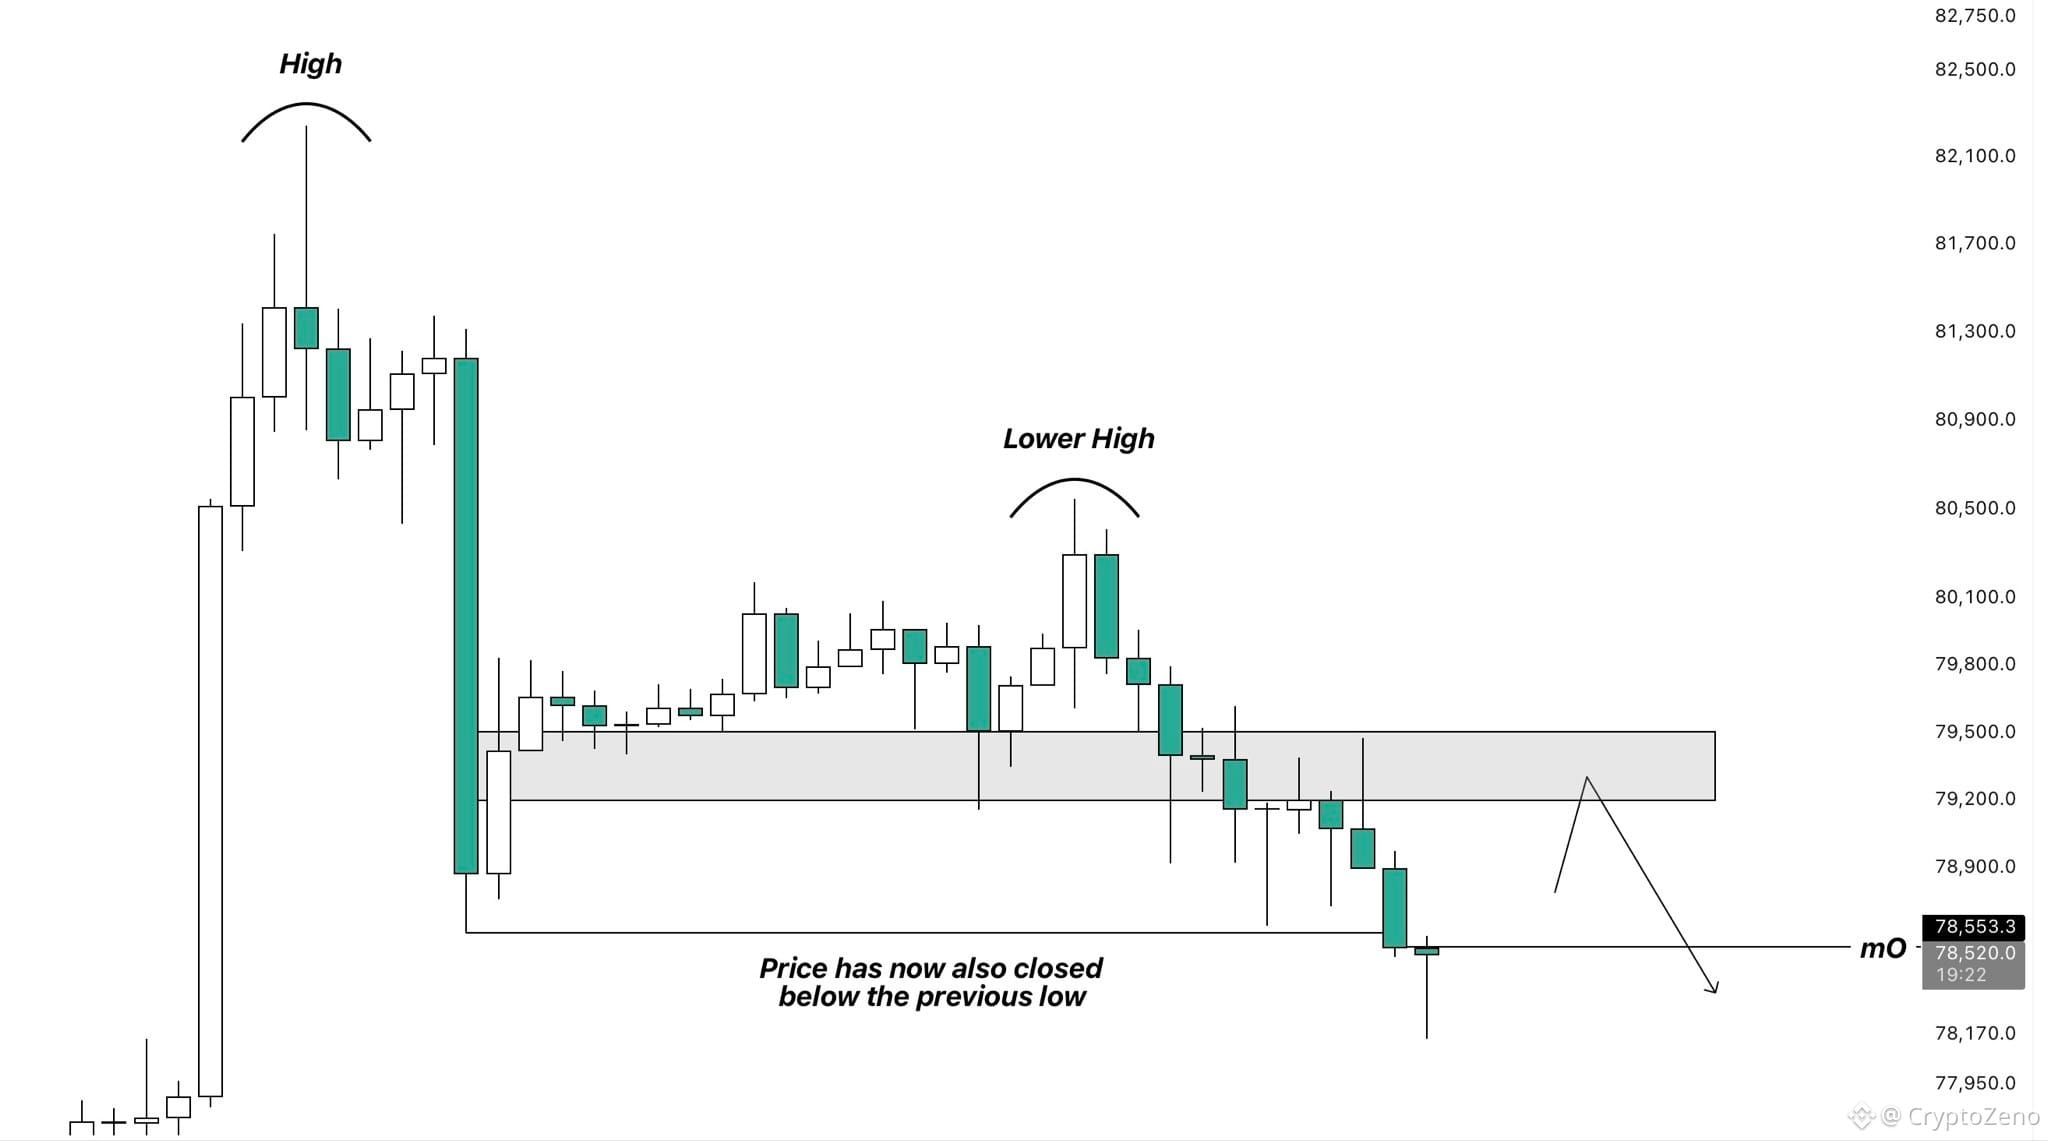
Price has now printed both a lower high and a lower low, while also losing the monthly open.
The EMAs are also all sitting above price again, which could provide additional dynamic resistance.
What I’m looking for next is a retest of the resistance area around $79.5K, where several bearish confluences line up.
If price pushes into that area and gets rejected, I believe another continuation to the downside toward $77K is likely.
Price has now printed both a lower high and a lower low, while also losing the monthly open.
The EMAs are also all sitting above price again, which could provide additional dynamic resistance.
What I’m looking for next is a retest of the resistance area around $79.5K, where several bearish confluences line up.
If price pushes into that area and gets rejected, I believe another continuation to the downside toward $77K is likely.
Heavy wallet/exchange activity, extreme leverage, but spot side is genuinely strong too. $SOPH
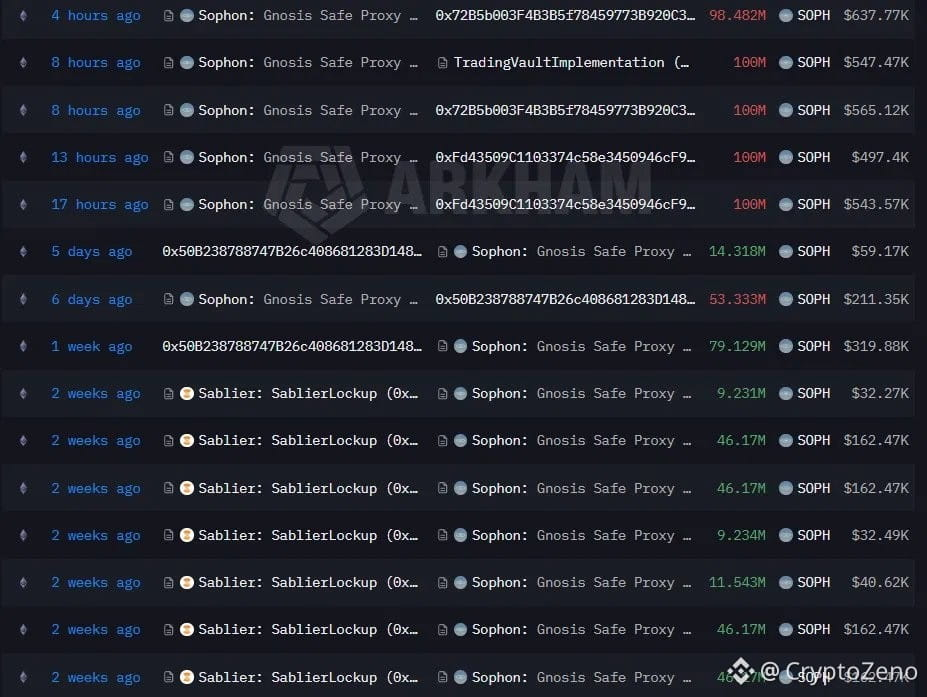
Two separate sources show up in the data. One is the Sophon team's Gnosis Safe wallet, four back-to-back transfers over the last 4-17 hours (roughly $2.2M combined) sent to exchanges. The other is the Sablier vesting contract, regular transfers to exchanges that started 2 weeks ago and are still ongoing.
These tokens aren't just flowing one-way into exchanges, they're also moving exchange to exchange. Could be liquidity management, or a distribution process where the actual sell venue hasn't been settled yet.
Leverage is extreme, but the spot side isn't thin. OI at 118.6% of mcap, a book bigger than the market cap itself. OI is up 368.4% in 24h. But spot volume is $155.05M, roughly 7x the $21.33M market cap, a genuinely strong number. Futures at 7.3x spot is actually measured for an OI/mcap ratio this stretched, because spot is participating heavily too.
Funding is negative, the crowd is short and paying for it. Top trader positions at 0.89, nearly the same direction as the crowd, no real split here.
$4.16M liquidated in 24h, a large number.
This isn't a hollow move purely inflated by leverage, there's real spot participation underneath it. But the ongoing supply pressure from vesting/team wallets, plus OI expanding this fast, keeps the structure fragile.
Two separate sources show up in the data. One is the Sophon team's Gnosis Safe wallet, four back-to-back transfers over the last 4-17 hours (roughly $2.2M combined) sent to exchanges. The other is the Sablier vesting contract, regular transfers to exchanges that started 2 weeks ago and are still ongoing.
These tokens aren't just flowing one-way into exchanges, they're also moving exchange to exchange. Could be liquidity management, or a distribution process where the actual sell venue hasn't been settled yet.
Leverage is extreme, but the spot side isn't thin. OI at 118.6% of mcap, a book bigger than the market cap itself. OI is up 368.4% in 24h. But spot volume is $155.05M, roughly 7x the $21.33M market cap, a genuinely strong number. Futures at 7.3x spot is actually measured for an OI/mcap ratio this stretched, because spot is participating heavily too.
Funding is negative, the crowd is short and paying for it. Top trader positions at 0.89, nearly the same direction as the crowd, no real split here.
$4.16M liquidated in 24h, a large number.
This isn't a hollow move purely inflated by leverage, there's real spot participation underneath it. But the ongoing supply pressure from vesting/team wallets, plus OI expanding this fast, keeps the structure fragile.
$AERO update: yesterday's thesis played out, LAPTOP launches tomorrow, and there's a sell wall waiting above.
Yesterday we talked about LAPTOP's launch on Base potentially bringing volume to Aerodrome. Price was around 0.53 when that news broke, it's at 0.6345 now, up 18.64% in 24h.
Structure stays healthy: OI at 3.7% of mcap, futures at 4.1x spot, both within range. L/S at 1.87, the crowd is clearly long. Top trader positions at 1.83, nearly the same direction as the crowd, no real split, but everyone's on the same side.
Taker at 0.86, slightly seller-leaning, worth noting with price climbing.
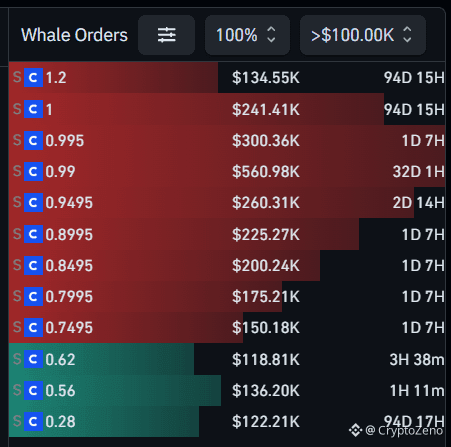
Whale orders show two layers. Above (0.75-1.2 range), there are stacked sell walls, the largest at 0.99 for $560.98K, most aged between 1 and 94 days. Below (0.28-0.62 range), there are buy orders, the freshest at 0.62 placed 3 hours ago for $118.81K, the closest support to current price.
One day out from launch, the thesis has held up so far. But those sell walls above, especially the 0.75-0.99 band, form real resistance, whether tomorrow's LAPTOP volume is enough to clear them is the real question.
Yesterday we talked about LAPTOP's launch on Base potentially bringing volume to Aerodrome. Price was around 0.53 when that news broke, it's at 0.6345 now, up 18.64% in 24h.
Structure stays healthy: OI at 3.7% of mcap, futures at 4.1x spot, both within range. L/S at 1.87, the crowd is clearly long. Top trader positions at 1.83, nearly the same direction as the crowd, no real split, but everyone's on the same side.
Taker at 0.86, slightly seller-leaning, worth noting with price climbing.
Whale orders show two layers. Above (0.75-1.2 range), there are stacked sell walls, the largest at 0.99 for $560.98K, most aged between 1 and 94 days. Below (0.28-0.62 range), there are buy orders, the freshest at 0.62 placed 3 hours ago for $118.81K, the closest support to current price.
One day out from launch, the thesis has held up so far. But those sell walls above, especially the 0.75-0.99 band, form real resistance, whether tomorrow's LAPTOP volume is enough to clear them is the real question.
$BTC The amount of people waiting for new lows is absurd.
Most got front-run expecting the bear market bottom in October.
Price will likely revisit the 76–69K area, which will be the next best area to bid.
The goal isn't to catch the exact bottom of this higher low. It's to catch the next major move, which I believe will be to the upside.
Don't make the same mistake by lowering your targets when price visits the bid box.
Most got front-run expecting the bear market bottom in October.
Price will likely revisit the 76–69K area, which will be the next best area to bid.
The goal isn't to catch the exact bottom of this higher low. It's to catch the next major move, which I believe will be to the upside.
Don't make the same mistake by lowering your targets when price visits the bid box.
Log in to explore more content