
Bluechip
8.5k Posts

Bluechip
 Square Verified+
Frequent Trader
5.5 Years
25 Following
66.5K+ Followers
92.3K+ Liked
Posts
All
Quotes
Videos
Live
PINNED
🚨 THE ALPHA BOARD – FOUNDERS ACCESS 🚨
After multiple requests from some followers, I’ve decided to open something private.
What I share publicly is only a fraction of the full picture.
The market is a game of liquidity, timing, and understanding.
Most people always arrive… too late.
Today, I’m officially opening The Alpha Board, a private group built for those who want to see the move before it happens, not after.
Inside, you’ll get:
• Advanced market analysis ($BTC , Stocks, macro)
• Key liquidity zones & forward scenarios
• Smart money flow breakdowns
• Clear market structure insights
• Direct access + a serious community
This is NOT a signals group.
This is where you build a real edge.
If you’re tired of:
- following the crowd
- entering too late
- not understanding why the market moves
Then this is exactly for you.
Founder one-time access: $39
Limited spots available
Scan the QR code or click on the link to join instantly
This post will be auto-deleted in 15 days
The market doesn’t reward the fastest.
It rewards the most prepared.
The Alpha Board link
#BTC #crypto #trading #smartmoney #BinanceSquare
After multiple requests from some followers, I’ve decided to open something private.
What I share publicly is only a fraction of the full picture.
The market is a game of liquidity, timing, and understanding.
Most people always arrive… too late.
Today, I’m officially opening The Alpha Board, a private group built for those who want to see the move before it happens, not after.
Inside, you’ll get:
• Advanced market analysis ($BTC , Stocks, macro)
• Key liquidity zones & forward scenarios
• Smart money flow breakdowns
• Clear market structure insights
• Direct access + a serious community
This is NOT a signals group.
This is where you build a real edge.
If you’re tired of:
- following the crowd
- entering too late
- not understanding why the market moves
Then this is exactly for you.
Founder one-time access: $39
Limited spots available
Scan the QR code or click on the link to join instantly
This post will be auto-deleted in 15 days
The market doesn’t reward the fastest.
It rewards the most prepared.
The Alpha Board link
#BTC #crypto #trading #smartmoney #BinanceSquare
PINNED
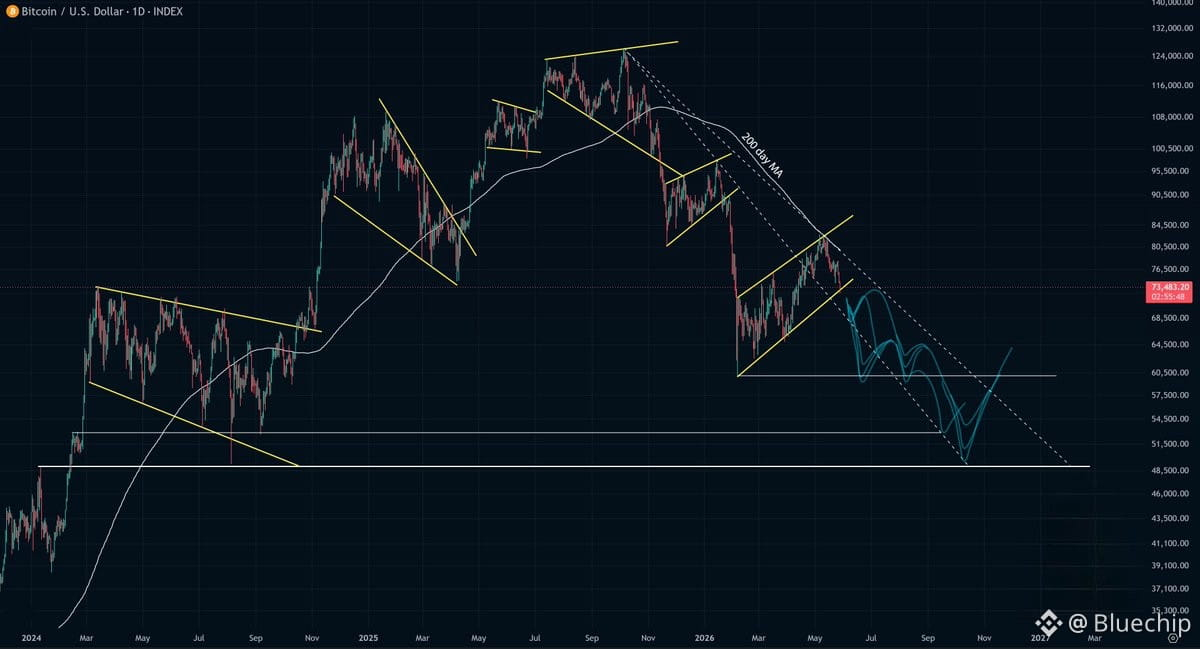
$BTC squiggles
Here's a rough visualization of how I see the most likely scenarios playing out. If you average them, you'll get a feel for the broad concept I have. I can absolutely be wrong, but it's my take on things currently.
Note that I give the diagonal (dotted) trend lines some importance in controlling the price movements as well as the horizontal support levels.
This falls in alignment with my other post on the odds I give these Bitcoin scenarios.
Here's a rough visualization of how I see the most likely scenarios playing out. If you average them, you'll get a feel for the broad concept I have. I can absolutely be wrong, but it's my take on things currently.
Note that I give the diagonal (dotted) trend lines some importance in controlling the price movements as well as the horizontal support levels.
This falls in alignment with my other post on the odds I give these Bitcoin scenarios.
$BTC
While price keeps moving slightly higher, I’ve been getting more haters.
But if price drops, they suddenly disappear.
It’s interesting how some people behave.
And if we fall back into the red zones, I’ll probably become that annoying old bear again 😁
While price keeps moving slightly higher, I’ve been getting more haters.
But if price drops, they suddenly disappear.
It’s interesting how some people behave.
And if we fall back into the red zones, I’ll probably become that annoying old bear again 😁
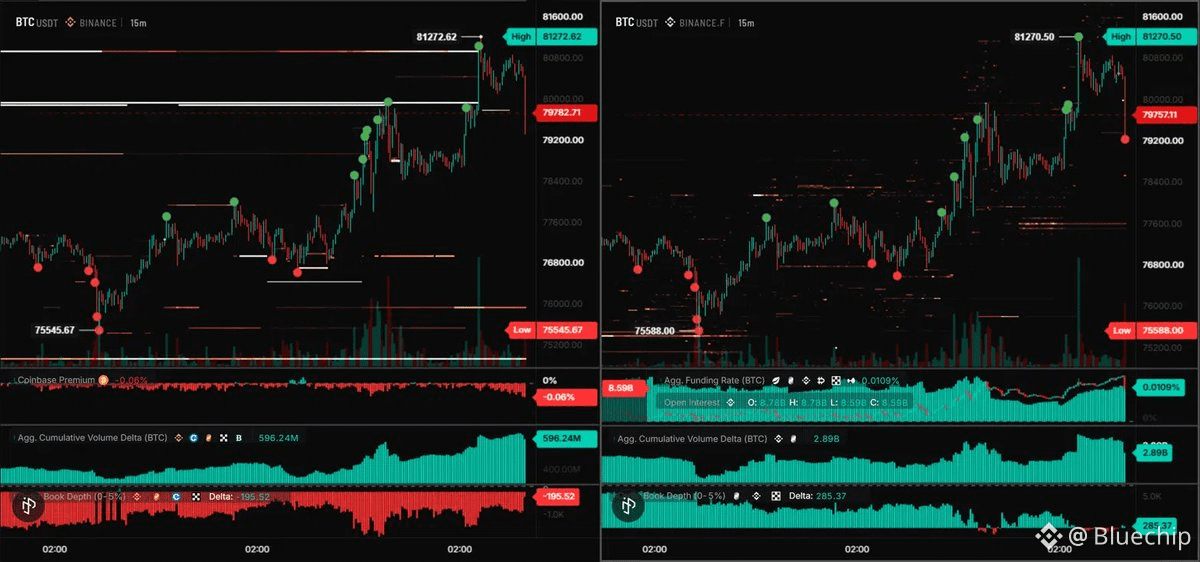
$BTC gave back 1.49K from 81K, and Open Interest dropped with it.
- Open Interest (Binance Futures): 8.78B -> 8.59B, longs unwound as price fell
- CVD: spot 596.24M, perp 2.89B, both down from the prior push, net selling
- Coinbase Premium: -0.06%, still negative
- Order Book Depth (0-5%): spot -195.52, perp +285.37, perp flipped bid-heavy
Falling OI into falling price means longs unwinding, not fresh shorts. Perp book turning bid-heavy suggests the flush is getting absorbed. Coinbase Premium staying negative means no spot confirmation yet.
This is a leverage flush. OI dropping on the way down is usually healthy, but premium needs to flip positive before calling a local bottom.
Does this OI flush mark the low, or is more length left to unwind?
- Open Interest (Binance Futures): 8.78B -> 8.59B, longs unwound as price fell
- CVD: spot 596.24M, perp 2.89B, both down from the prior push, net selling
- Coinbase Premium: -0.06%, still negative
- Order Book Depth (0-5%): spot -195.52, perp +285.37, perp flipped bid-heavy
Falling OI into falling price means longs unwinding, not fresh shorts. Perp book turning bid-heavy suggests the flush is getting absorbed. Coinbase Premium staying negative means no spot confirmation yet.
This is a leverage flush. OI dropping on the way down is usually healthy, but premium needs to flip positive before calling a local bottom.
Does this OI flush mark the low, or is more length left to unwind?
$BTC
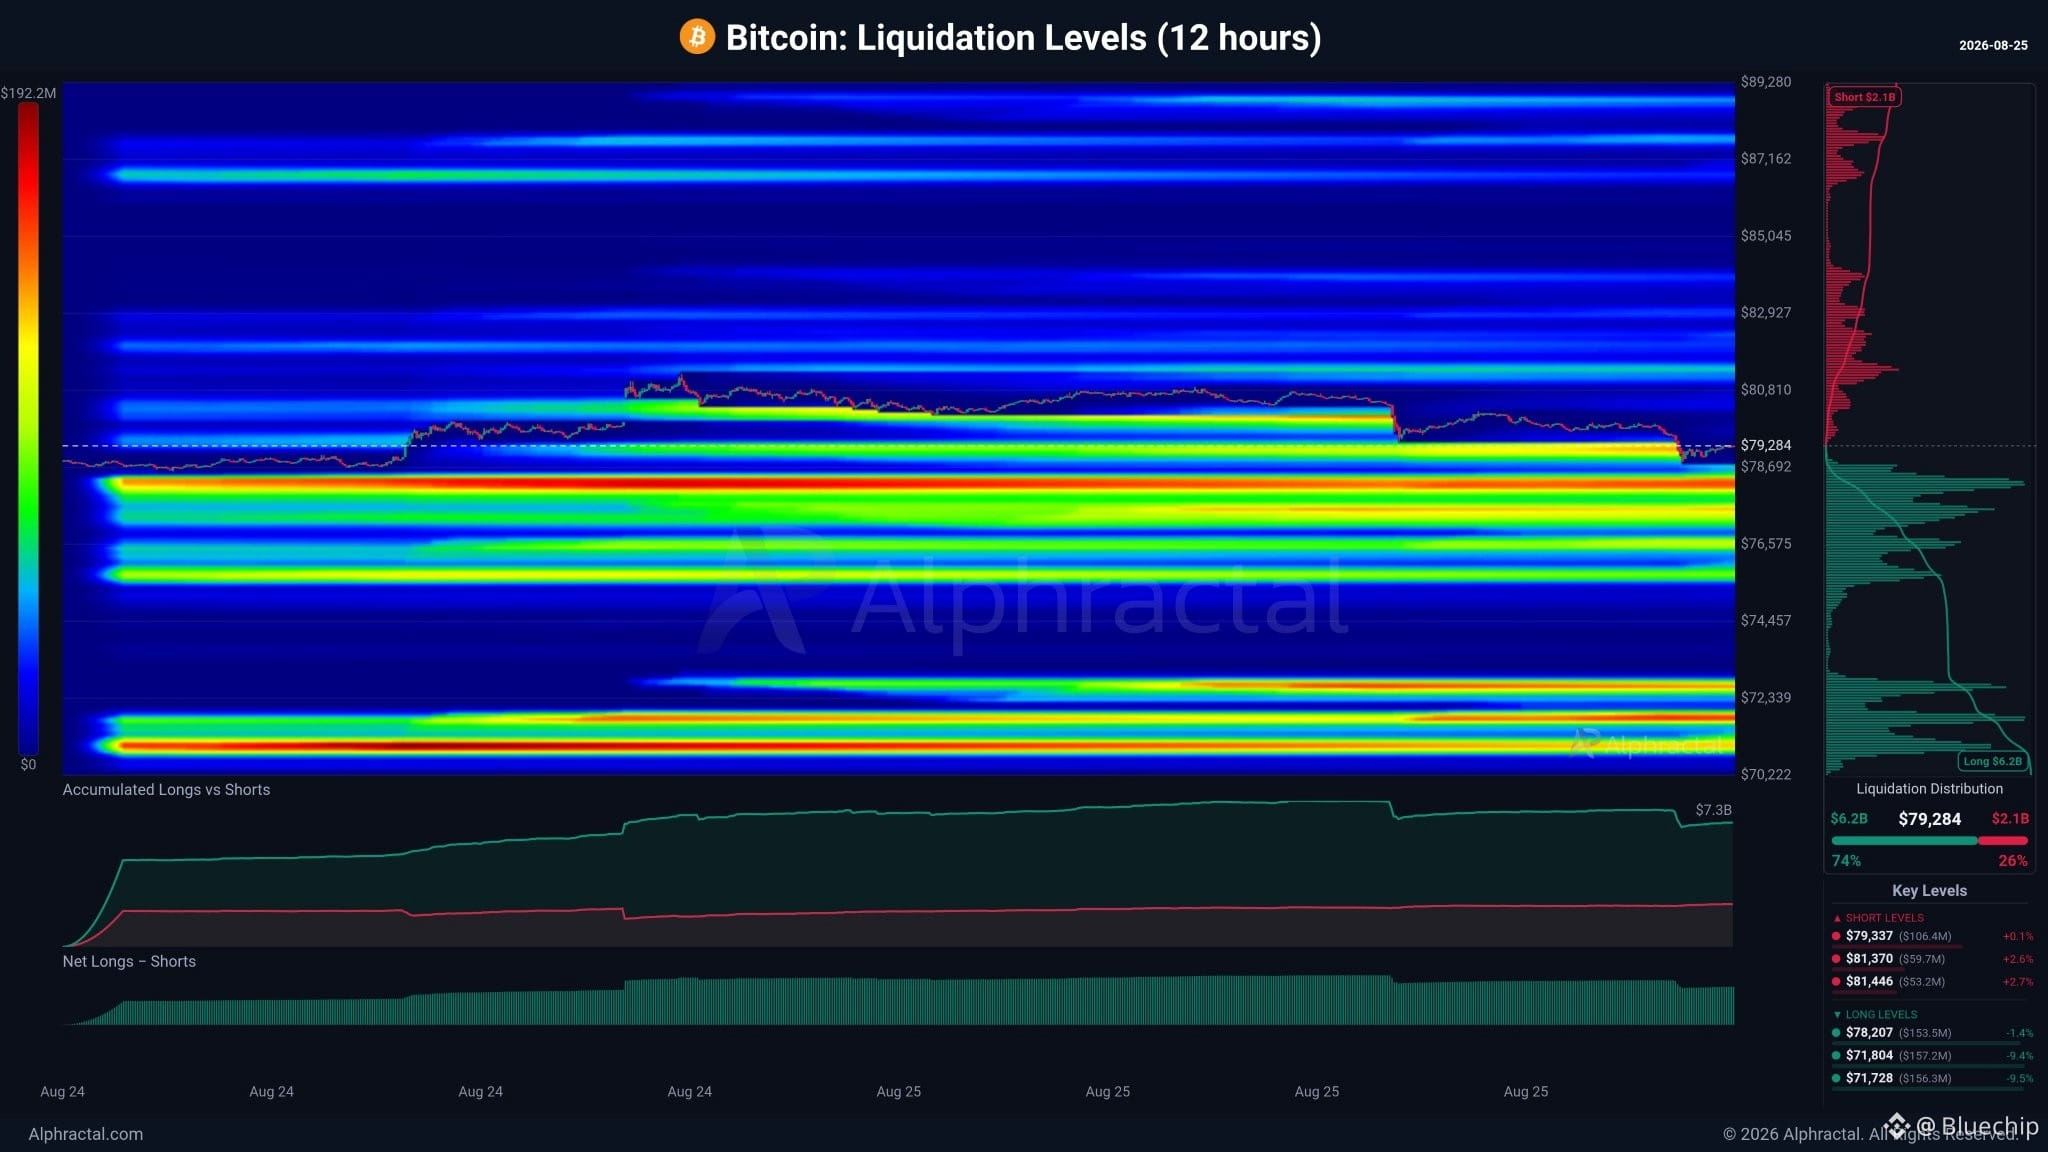
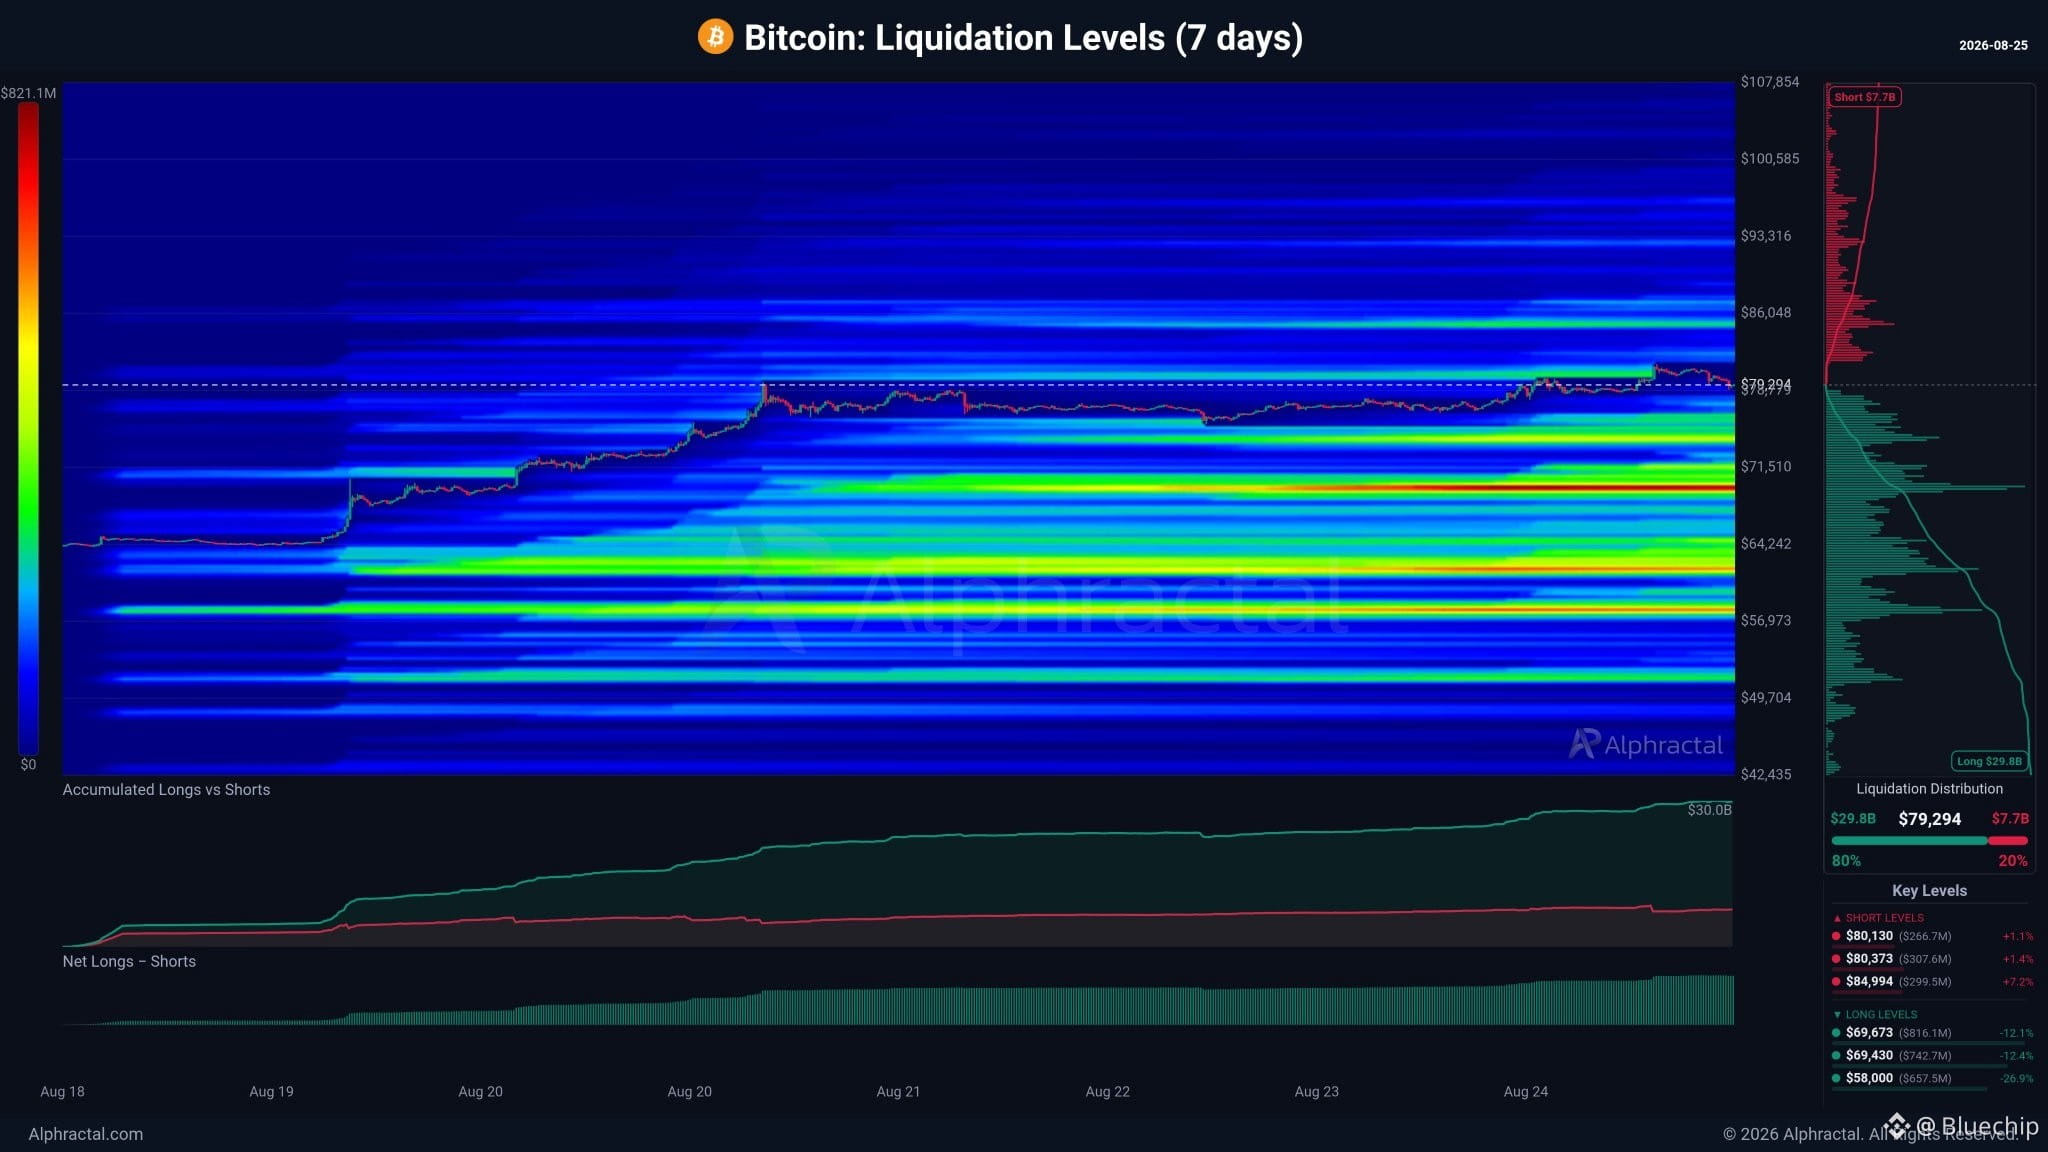
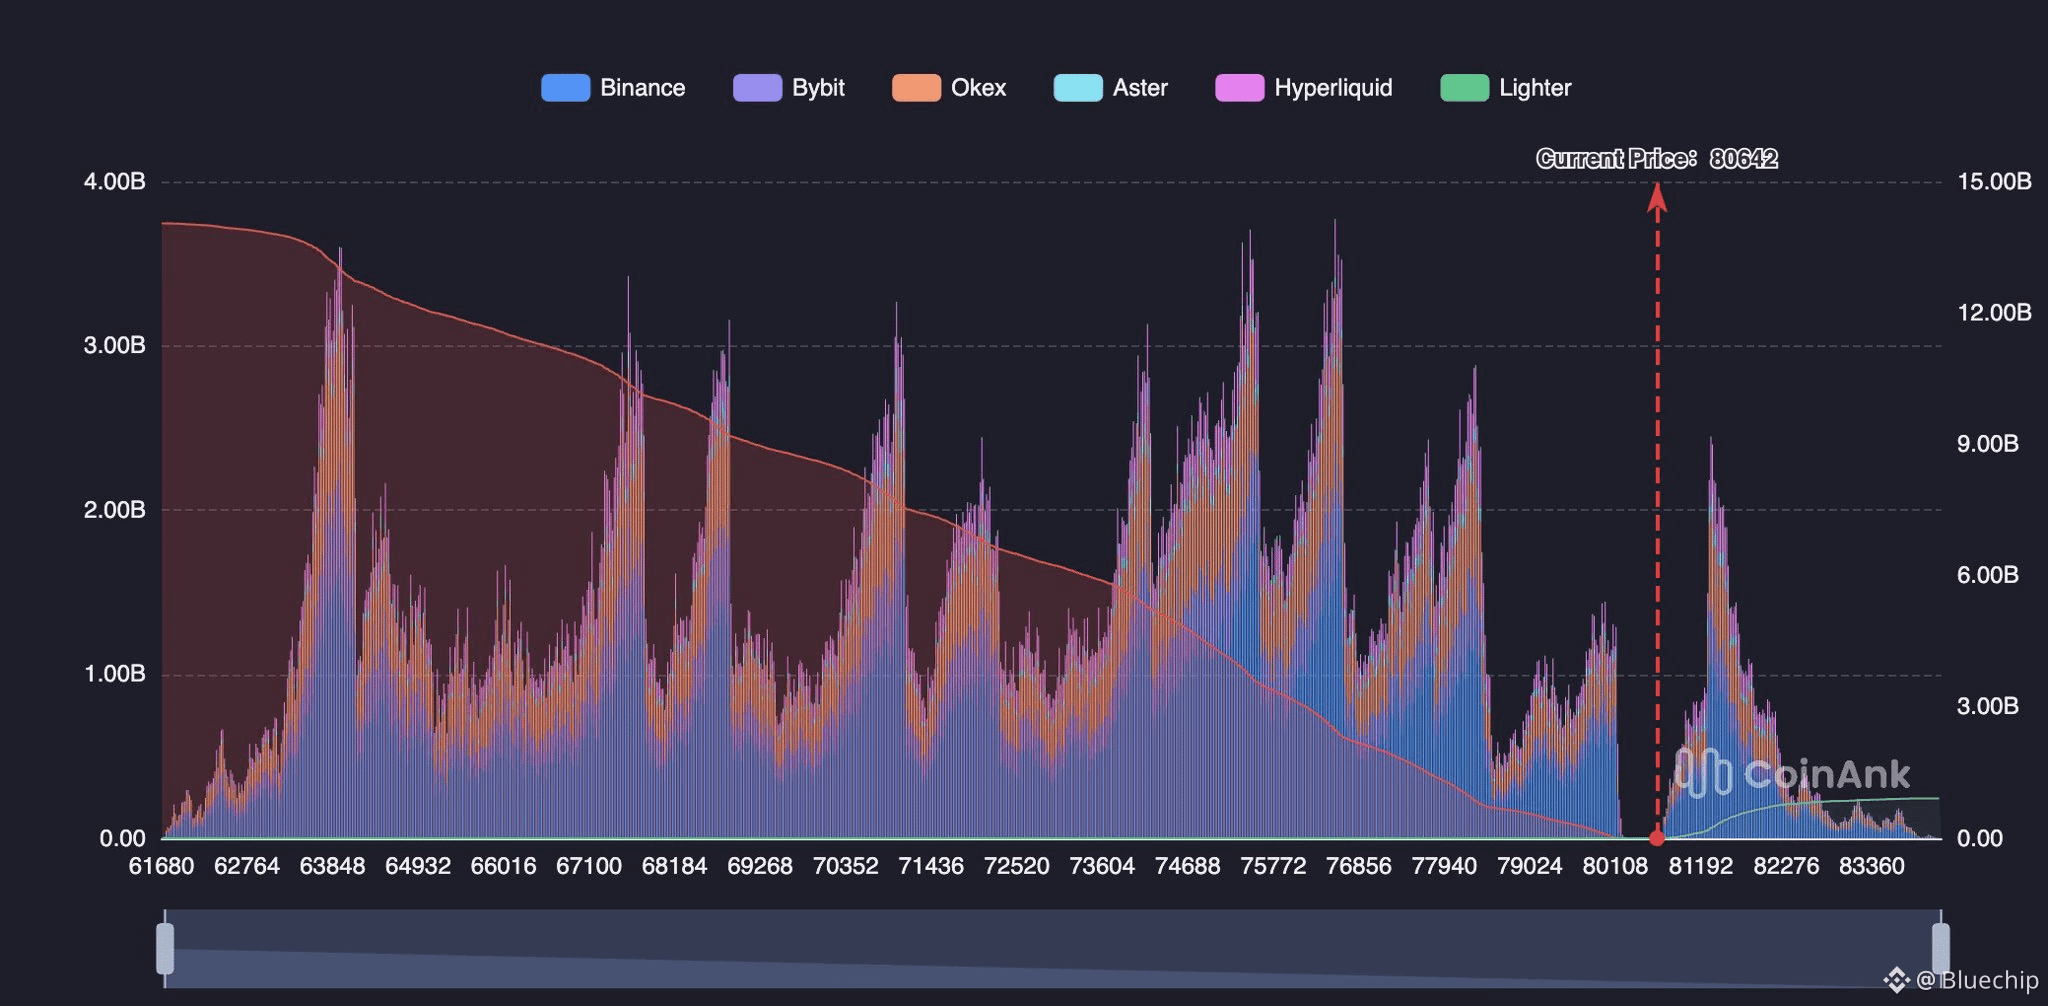
There is approximately $9 billion in liquidity around the $82.000 region
If this area is taken aggressively, the upper liquidity will be cleared, making the lower liquidity zones much more relevant targets.
There is approximately $9 billion in liquidity around the $82.000 region
If this area is taken aggressively, the upper liquidity will be cleared, making the lower liquidity zones much more relevant targets.
Bluechip
·
--
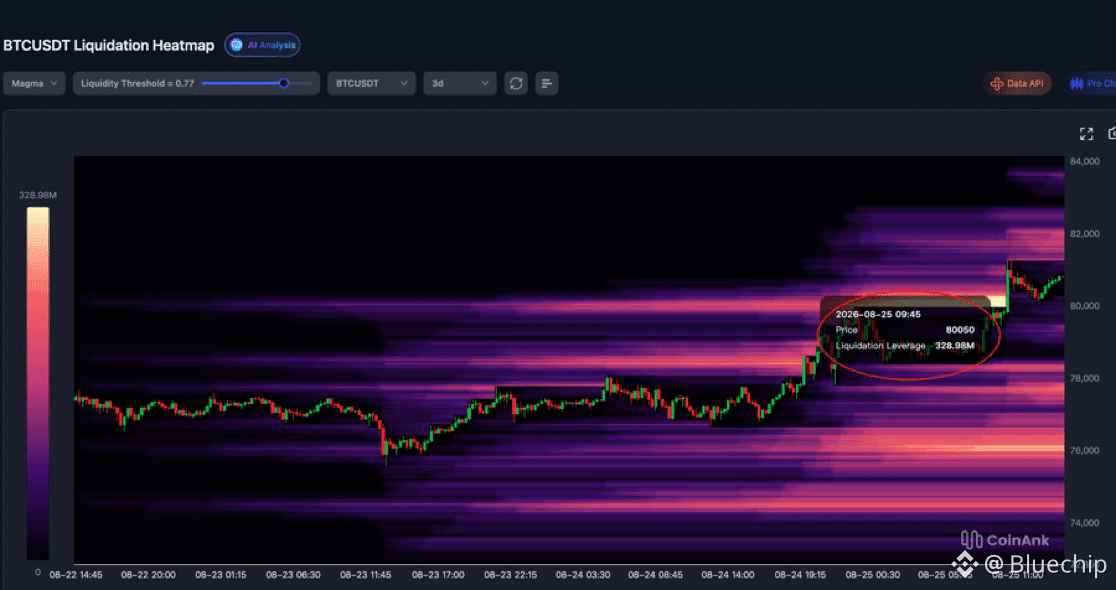
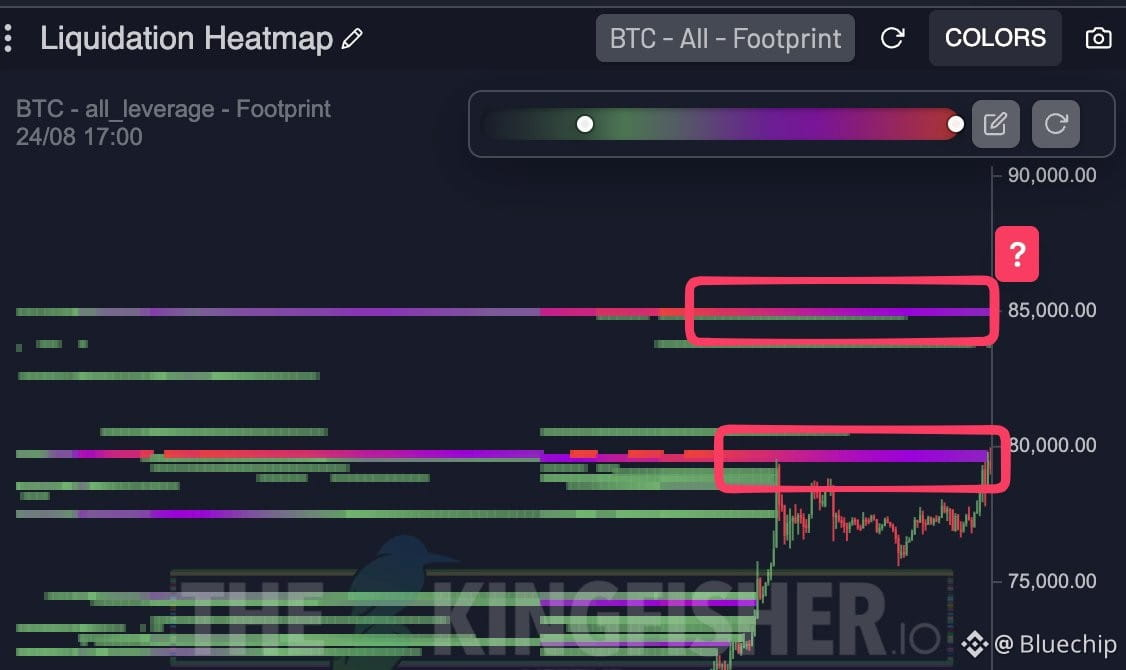
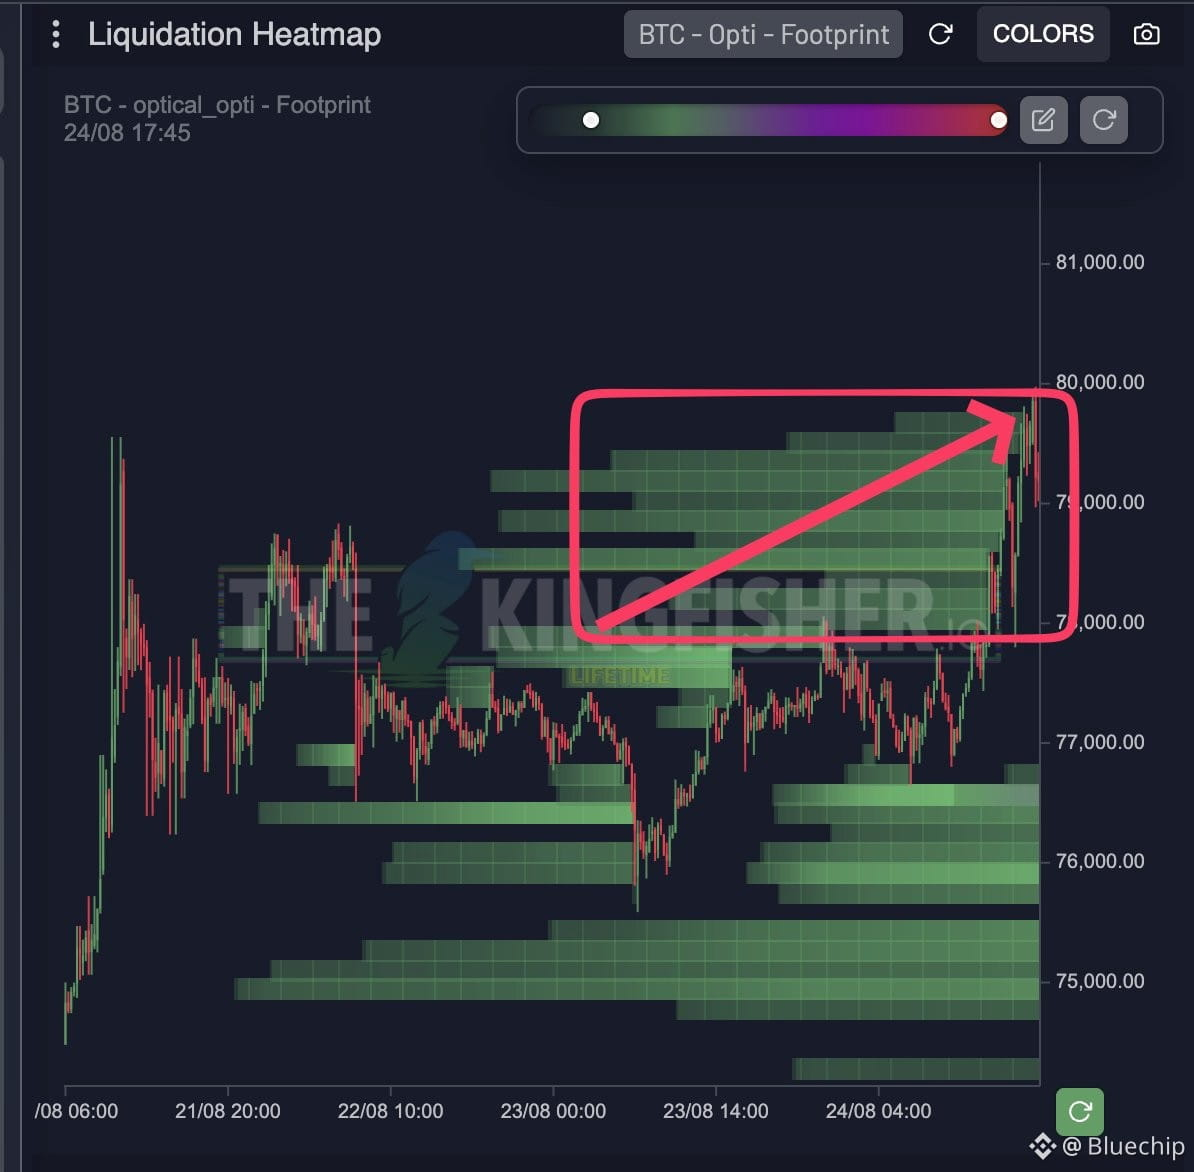
$BTC Liquidation Heatmap
BTC has broken through the highest-intensity liquidation zone on the 3-day heatmap.
The peak leverage in that area reached approximately $328.98M. Price has now pushed above this dense cluster and continues higher.
With the major liquidity pocket cleared, short-side pressure in that zone has been absorbed.
BTC has broken through the highest-intensity liquidation zone on the 3-day heatmap.
The peak leverage in that area reached approximately $328.98M. Price has now pushed above this dense cluster and continues higher.
With the major liquidity pocket cleared, short-side pressure in that zone has been absorbed.
$BTC Liquidation Heatmap
BTC has broken through the highest-intensity liquidation zone on the 3-day heatmap.
The peak leverage in that area reached approximately $328.98M. Price has now pushed above this dense cluster and continues higher.
With the major liquidity pocket cleared, short-side pressure in that zone has been absorbed.
BTC has broken through the highest-intensity liquidation zone on the 3-day heatmap.
The peak leverage in that area reached approximately $328.98M. Price has now pushed above this dense cluster and continues higher.
With the major liquidity pocket cleared, short-side pressure in that zone has been absorbed.
$BTC
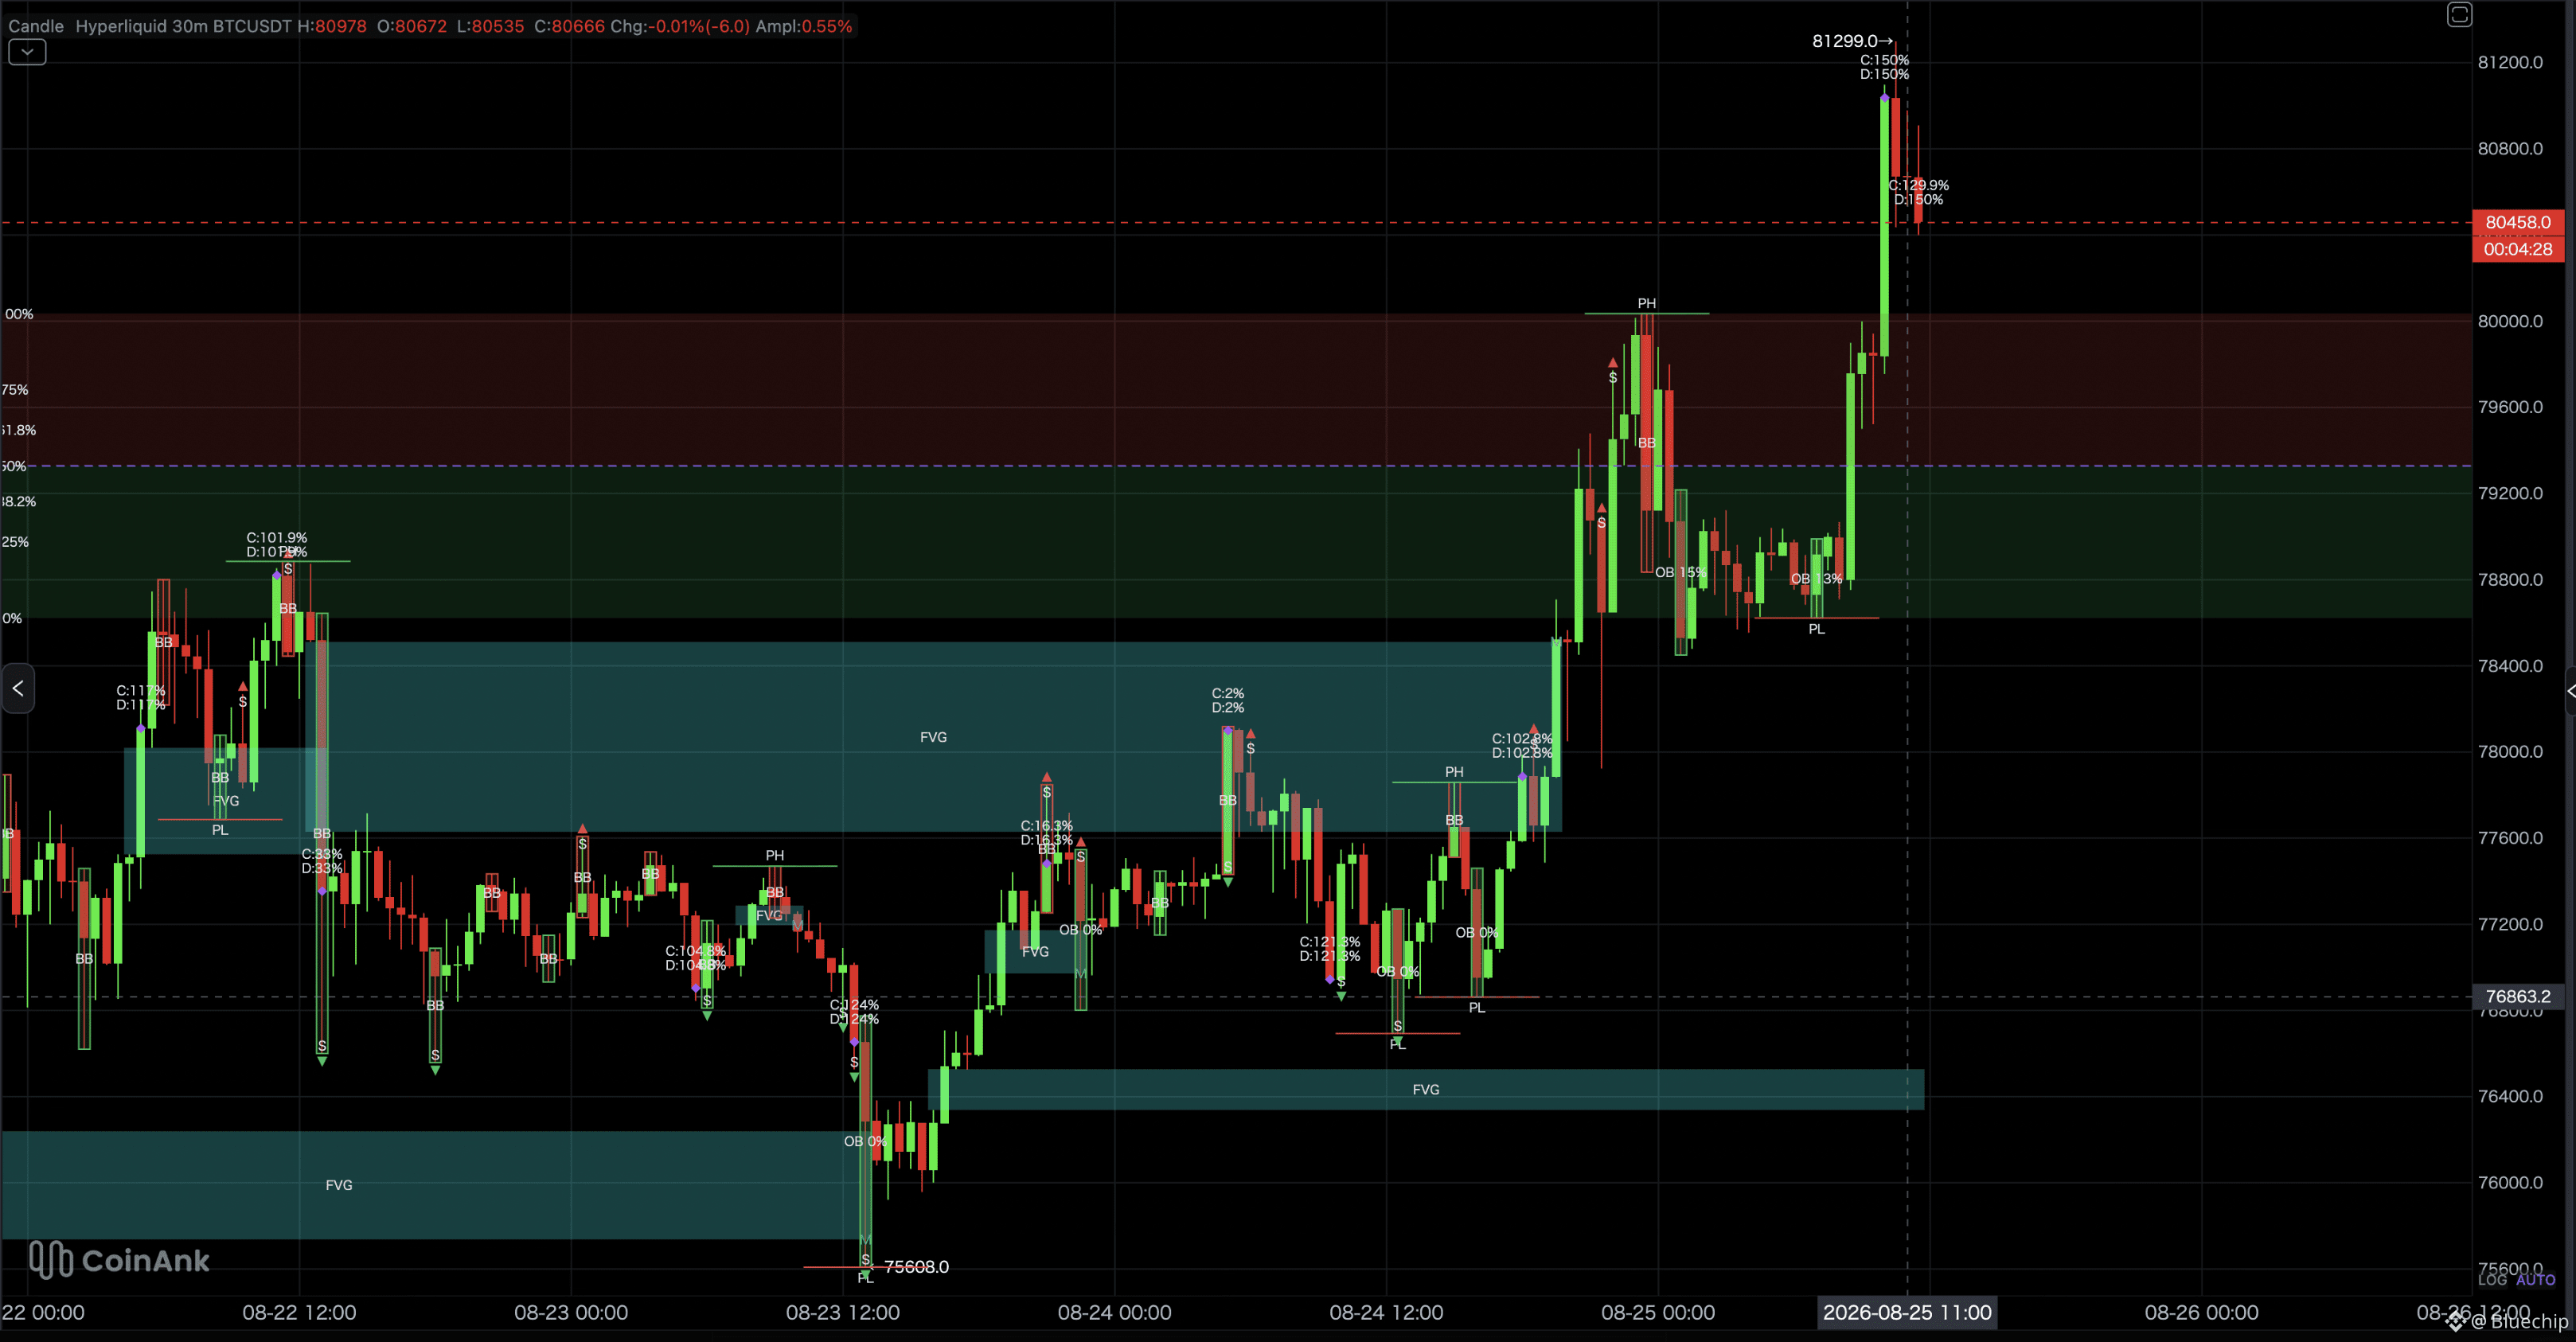
After several days of continuous gains, BTC has forcefully broken through $80,000.
Price surged to a high of $81,299 and is currently holding firm around $80,458. This is not a weak probe it’s a decisive breakout with strong bullish momentum and clear structural support from Order Blocks and FVG zones.
The market has shifted. $80k is no longer resistance it’s now a launching pad! for some!!
Bitcoin's next move would be a bearish scenario!!!
After several days of continuous gains, BTC has forcefully broken through $80,000.
Price surged to a high of $81,299 and is currently holding firm around $80,458. This is not a weak probe it’s a decisive breakout with strong bullish momentum and clear structural support from Order Blocks and FVG zones.
The market has shifted. $80k is no longer resistance it’s now a launching pad! for some!!
Bitcoin's next move would be a bearish scenario!!!
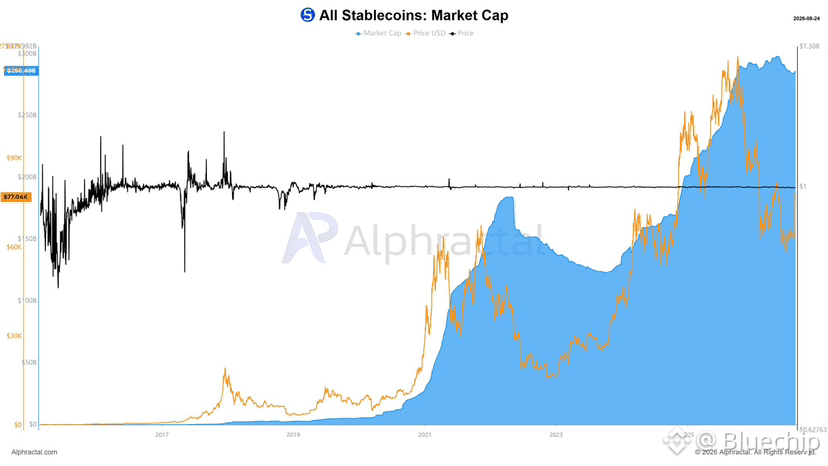
The total market cap of all stablecoins is no longer rising as it did before, similar to what happened toward the end of 2022.
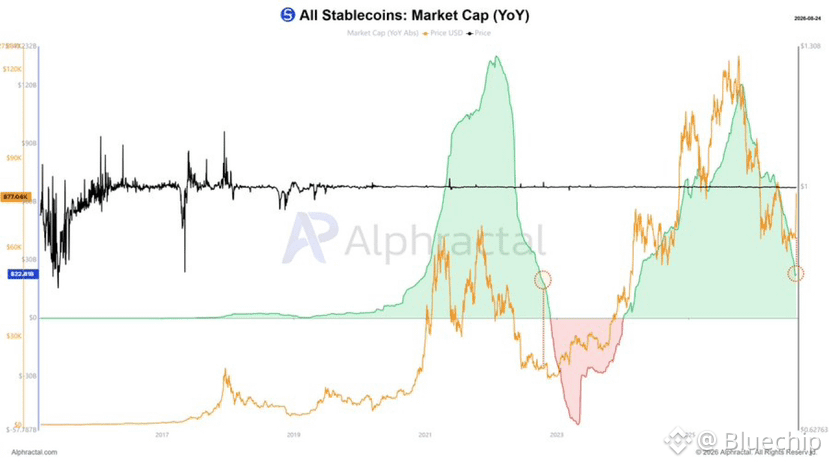
Its annual growth rate is also moving toward negative territory, again showing similarities to 2022.
Stablecoins are one of the main liquidity engines of the crypto market. They need to be on everyone’s radar.
Its annual growth rate is also moving toward negative territory, again showing similarities to 2022.
Stablecoins are one of the main liquidity engines of the crypto market. They need to be on everyone’s radar.
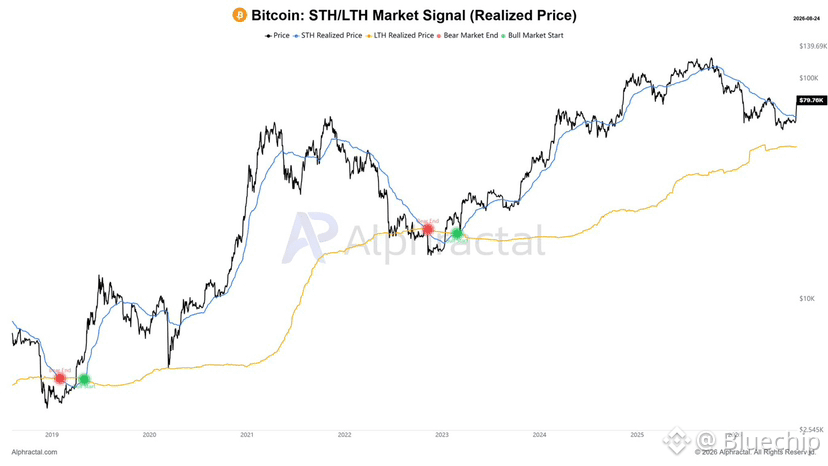
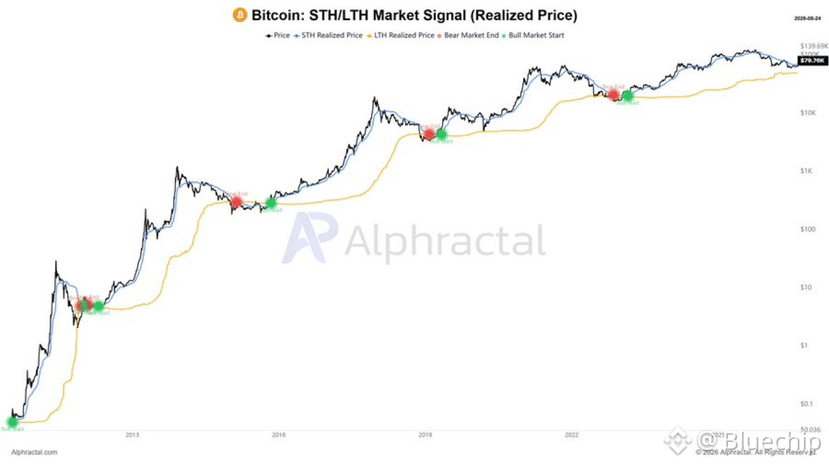
Will this on-chain signal fail this time?
Maybe not. It may simply be too early to jump to conclusions.
Historically, the STH/LTH Realized Price structure has been extremely useful in identifying major $BTC market transitions.
Right now, we are in an interesting zone, but confirmation is still missing.
I believe the next few weeks could give us the real answer.
Maybe not. It may simply be too early to jump to conclusions.
Historically, the STH/LTH Realized Price structure has been extremely useful in identifying major $BTC market transitions.
Right now, we are in an interesting zone, but confirmation is still missing.
I believe the next few weeks could give us the real answer.
$BTC
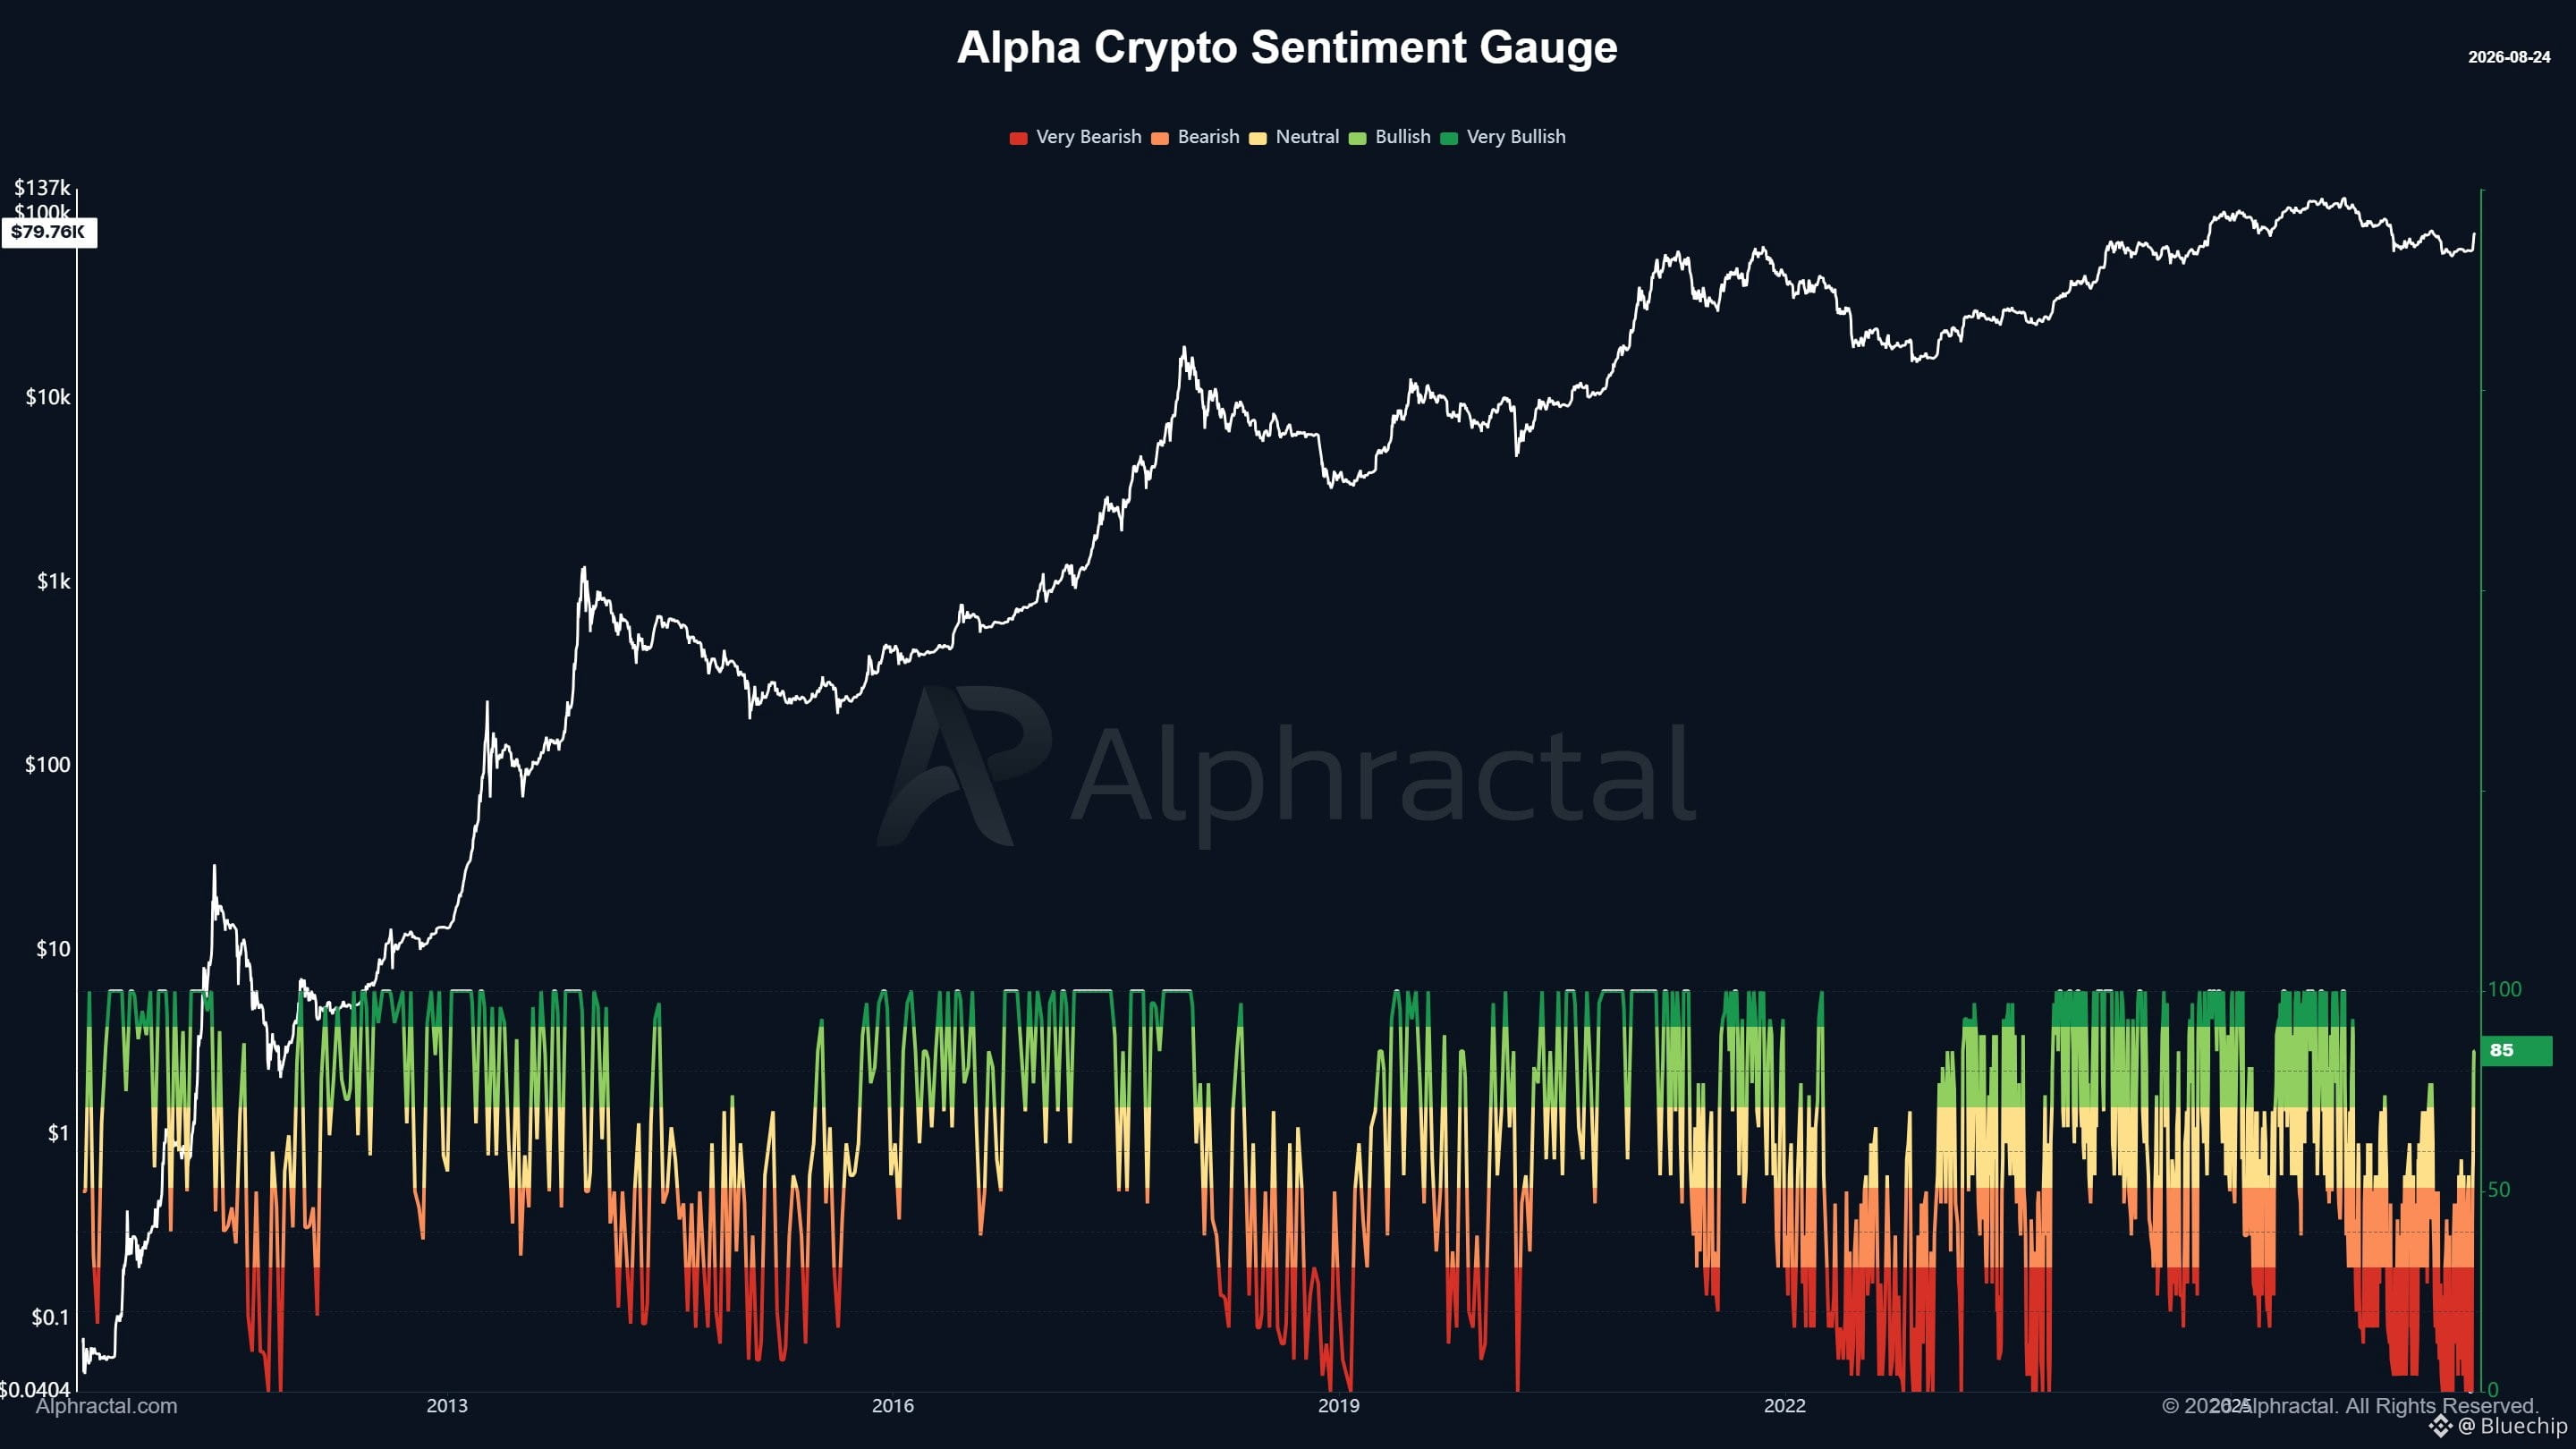
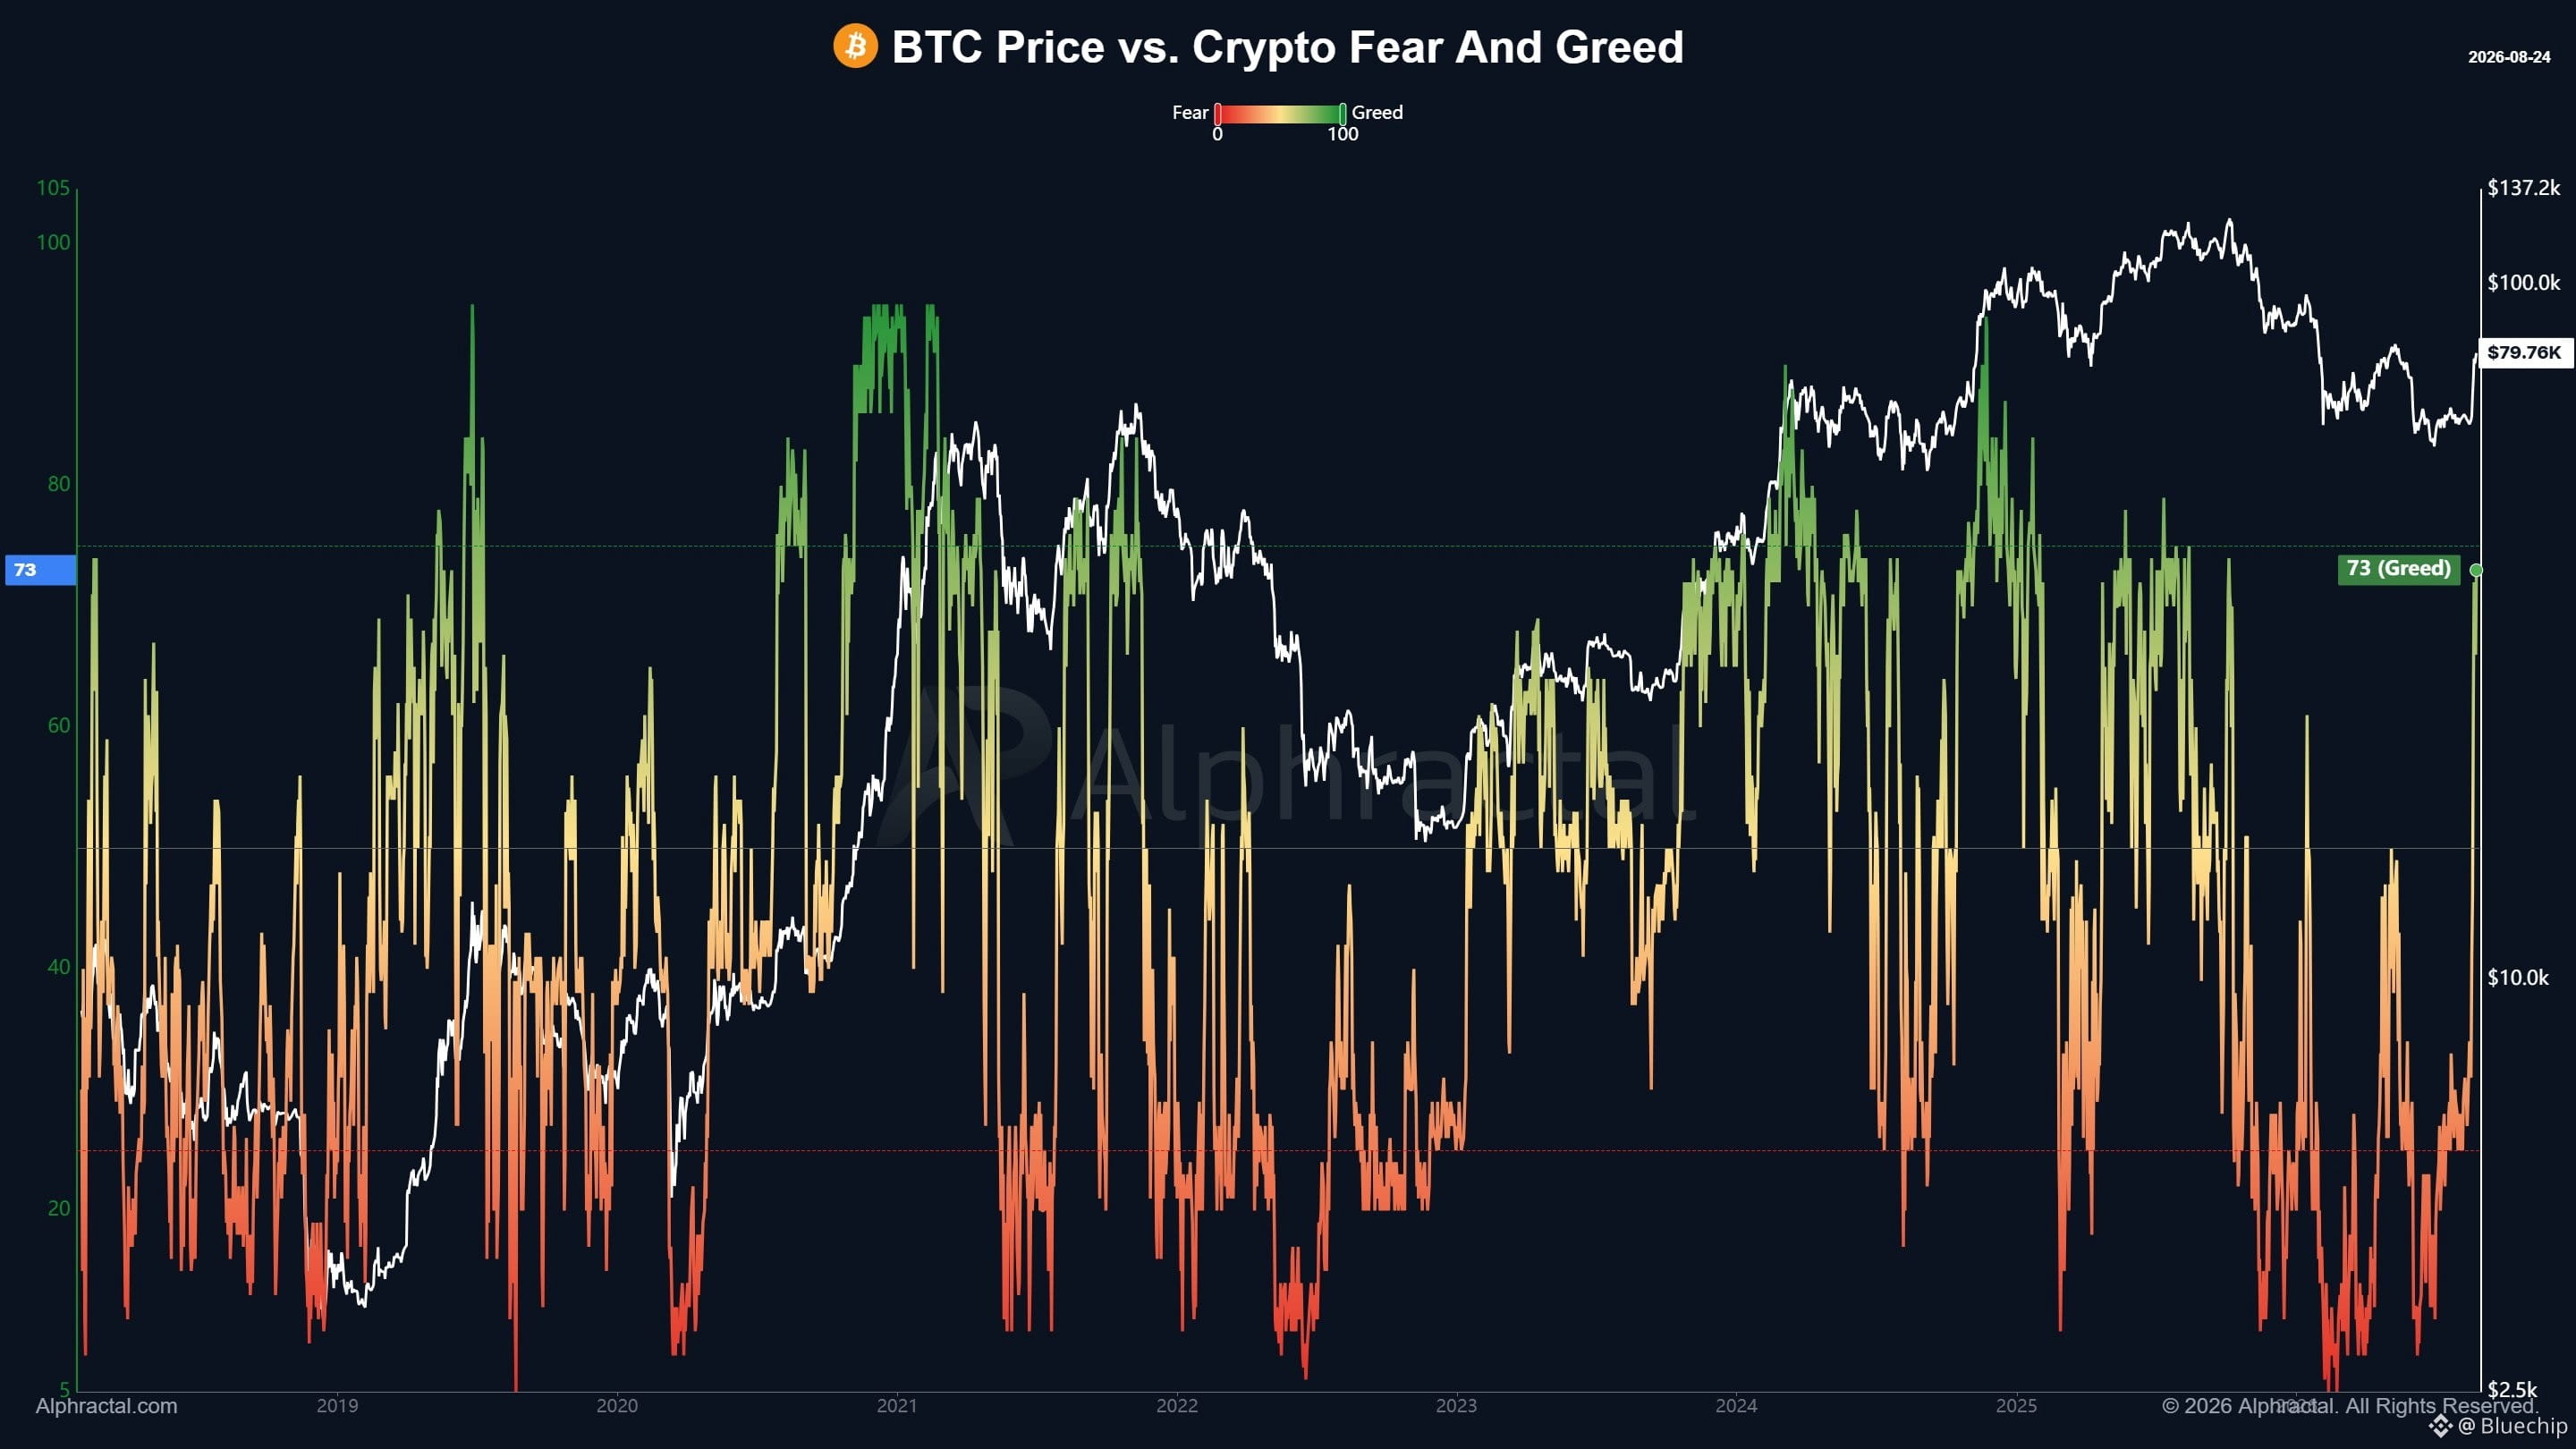
Sentiment turns bullish again on both the Crypto Fear & Greed Index and the Alpha Crypto Sentiment Gauge.
Risk or opportunity for you?
Sentiment turns bullish again on both the Crypto Fear & Greed Index and the Alpha Crypto Sentiment Gauge.
Risk or opportunity for you?
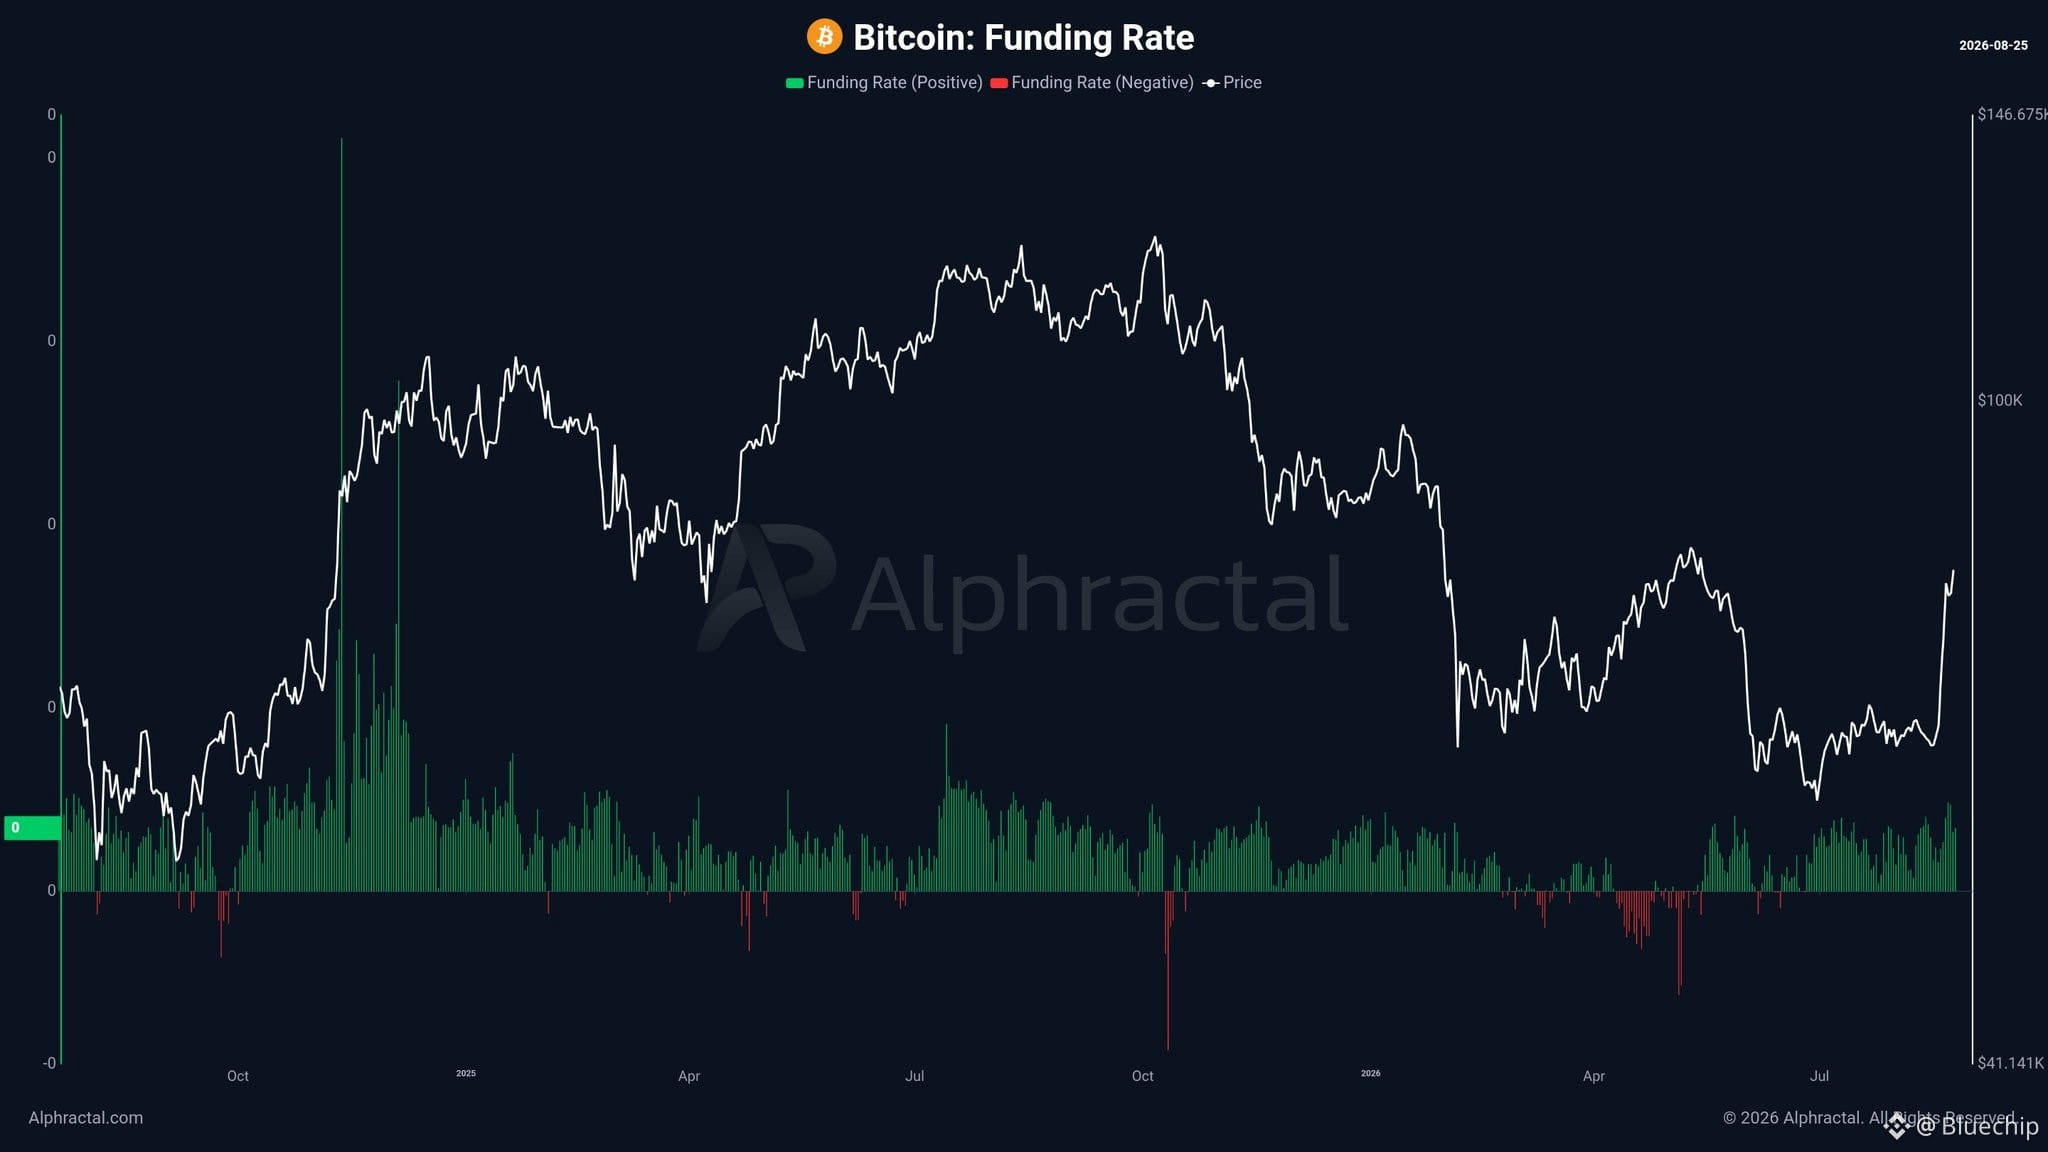
Getting rich in crypto is becoming increasingly difficult, not because there are fewer opportunities, but because derivatives and leverage have been normalized as if they were suitable for everyone.
They are not.
Leveraged trading requires intelligence, context awareness, fast reactions, and the ability to interpret multiple signals at the same time. Price alone is not enough. You need to understand liquidity, Open Interest, funding, positioning, liquidations, order flow, whale behavior, volatility, and structural market changes in real time.
And even with all that data available, there is still another challenge: turning data into decisions.
Many tools today show you information. Very few actually help traders understand what is happening, identify risk before the move, and react quickly when market conditions change.
You may be making money on your Long or Short right now and still not have a real edge. Leveraged trading should not be about clicking faster. It should be about thinking better, reacting faster, and making better decisions.
Better data, better intelligence, more powerful insights, and faster decisions.
$BTC
And we are only getting started.
They are not.
Leveraged trading requires intelligence, context awareness, fast reactions, and the ability to interpret multiple signals at the same time. Price alone is not enough. You need to understand liquidity, Open Interest, funding, positioning, liquidations, order flow, whale behavior, volatility, and structural market changes in real time.
And even with all that data available, there is still another challenge: turning data into decisions.
Many tools today show you information. Very few actually help traders understand what is happening, identify risk before the move, and react quickly when market conditions change.
You may be making money on your Long or Short right now and still not have a real edge. Leveraged trading should not be about clicking faster. It should be about thinking better, reacting faster, and making better decisions.
Better data, better intelligence, more powerful insights, and faster decisions.
$BTC
And we are only getting started.
Monday morning market update:
Stocks are starting the week a little heavy while crypto continues to show strength. S&P 500 and Nasdaq futures are lower this morning with rising yields, geopolitical headlines and a big week of catalysts keeping risk appetite in check.
Bitcoin is holding around $77K after its strongest weekly performance in quite a while, while ETH has pushed back toward $2,500 after a huge ~30% weekly rally. Crypto finally has some momentum again and the most promising signs in a long long time. The question is whether buyers can turn this into something sustained rather than another relief rally. I'll assume yes until proven otherwise given we have not seen this type of market confidence in months and months.
Big things I'm watching this week:
• NVDA earnings Wednesday. Probably the biggest individual stock catalyst for the entire market.
• PCE inflation + updated Q2 GDP Wednesday.
• Fed Chair Warsh speaking at Jackson Hole later this week.
• Whether BTC can hold the breakout and keep building above the $75K-$77K area.
• Can altcoins continue to show strength and hold key supports providing full confidence to the market
We've got a lot of potential volatility packed into the next few days.
Don't get so excited about one green candle that you forget the bigger picture. Trade the levels. Manage risk. Let the market prove itself.
Good morning, Happy Monday 🤝
Stocks are starting the week a little heavy while crypto continues to show strength. S&P 500 and Nasdaq futures are lower this morning with rising yields, geopolitical headlines and a big week of catalysts keeping risk appetite in check.
Bitcoin is holding around $77K after its strongest weekly performance in quite a while, while ETH has pushed back toward $2,500 after a huge ~30% weekly rally. Crypto finally has some momentum again and the most promising signs in a long long time. The question is whether buyers can turn this into something sustained rather than another relief rally. I'll assume yes until proven otherwise given we have not seen this type of market confidence in months and months.
Big things I'm watching this week:
• NVDA earnings Wednesday. Probably the biggest individual stock catalyst for the entire market.
• PCE inflation + updated Q2 GDP Wednesday.
• Fed Chair Warsh speaking at Jackson Hole later this week.
• Whether BTC can hold the breakout and keep building above the $75K-$77K area.
• Can altcoins continue to show strength and hold key supports providing full confidence to the market
We've got a lot of potential volatility packed into the next few days.
Don't get so excited about one green candle that you forget the bigger picture. Trade the levels. Manage risk. Let the market prove itself.
Good morning, Happy Monday 🤝
$BTC
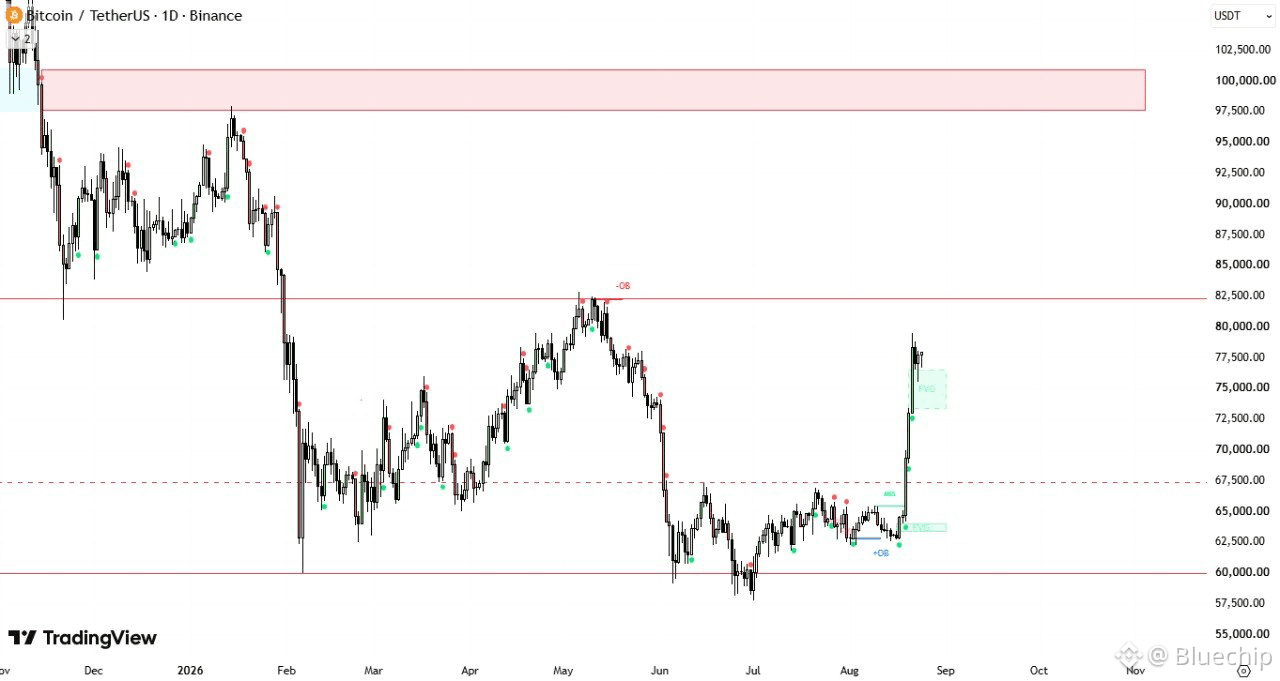
Price is approaching the 82.5K OB but hasn’t tested it yet
Still trading inside the broader range until that level is reached and confirmed, no bullish HTF trend confirmation.
Above 82.5K, next liquidity sits at 97.5K-100K, the major supply zone from last cycle’s high.
67.5K is the level to watch on the downside, previous resistance, now flipped support after the MSS.
As long as price holds above it, structure stays bullish and the range play is still valid.
Entry: pullback into the 72K FVG offers the best risk-reward for longs, invalidated below 67.5K.
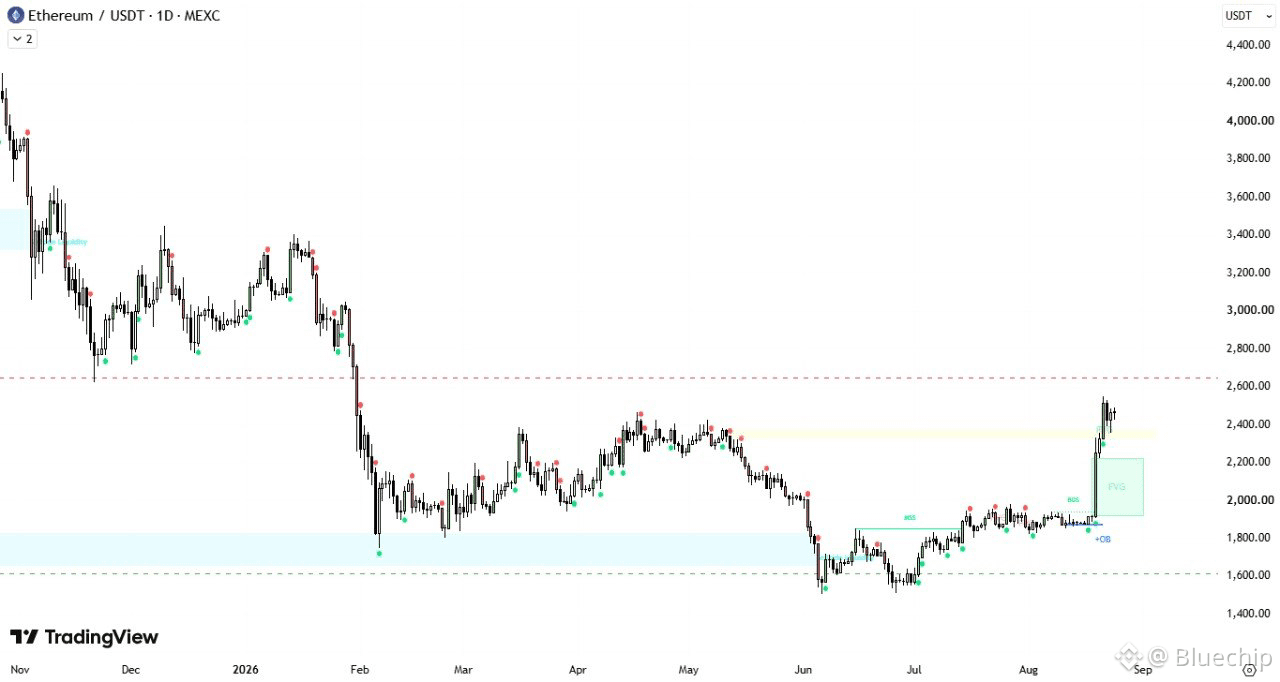
$ETH
Clean breakout out of the multi-month range, reclaimed the 1.8K-2K OB and ran straight through the FVG.
2.6K is the level that matters now, prior range high, untested since the drop.
Above it, ETH confirms trend continuation.
1.8K is the line in the sand. Holding above keeps this bullish, losing it on a daily close puts us back in range-bound territory.
Entry: pullback into the 2K FVG is the cleanest long setup, invalidated below 1.8K.
Price is approaching the 82.5K OB but hasn’t tested it yet
Still trading inside the broader range until that level is reached and confirmed, no bullish HTF trend confirmation.
Above 82.5K, next liquidity sits at 97.5K-100K, the major supply zone from last cycle’s high.
67.5K is the level to watch on the downside, previous resistance, now flipped support after the MSS.
As long as price holds above it, structure stays bullish and the range play is still valid.
Entry: pullback into the 72K FVG offers the best risk-reward for longs, invalidated below 67.5K.
$ETH
Clean breakout out of the multi-month range, reclaimed the 1.8K-2K OB and ran straight through the FVG.
2.6K is the level that matters now, prior range high, untested since the drop.
Above it, ETH confirms trend continuation.
1.8K is the line in the sand. Holding above keeps this bullish, losing it on a daily close puts us back in range-bound territory.
Entry: pullback into the 2K FVG is the cleanest long setup, invalidated below 1.8K.
$BTC records largest weekly gain since March 2023, surging over 23%
Bluechip
·
--
$BTC 90 min away from a beautiful weekly candle
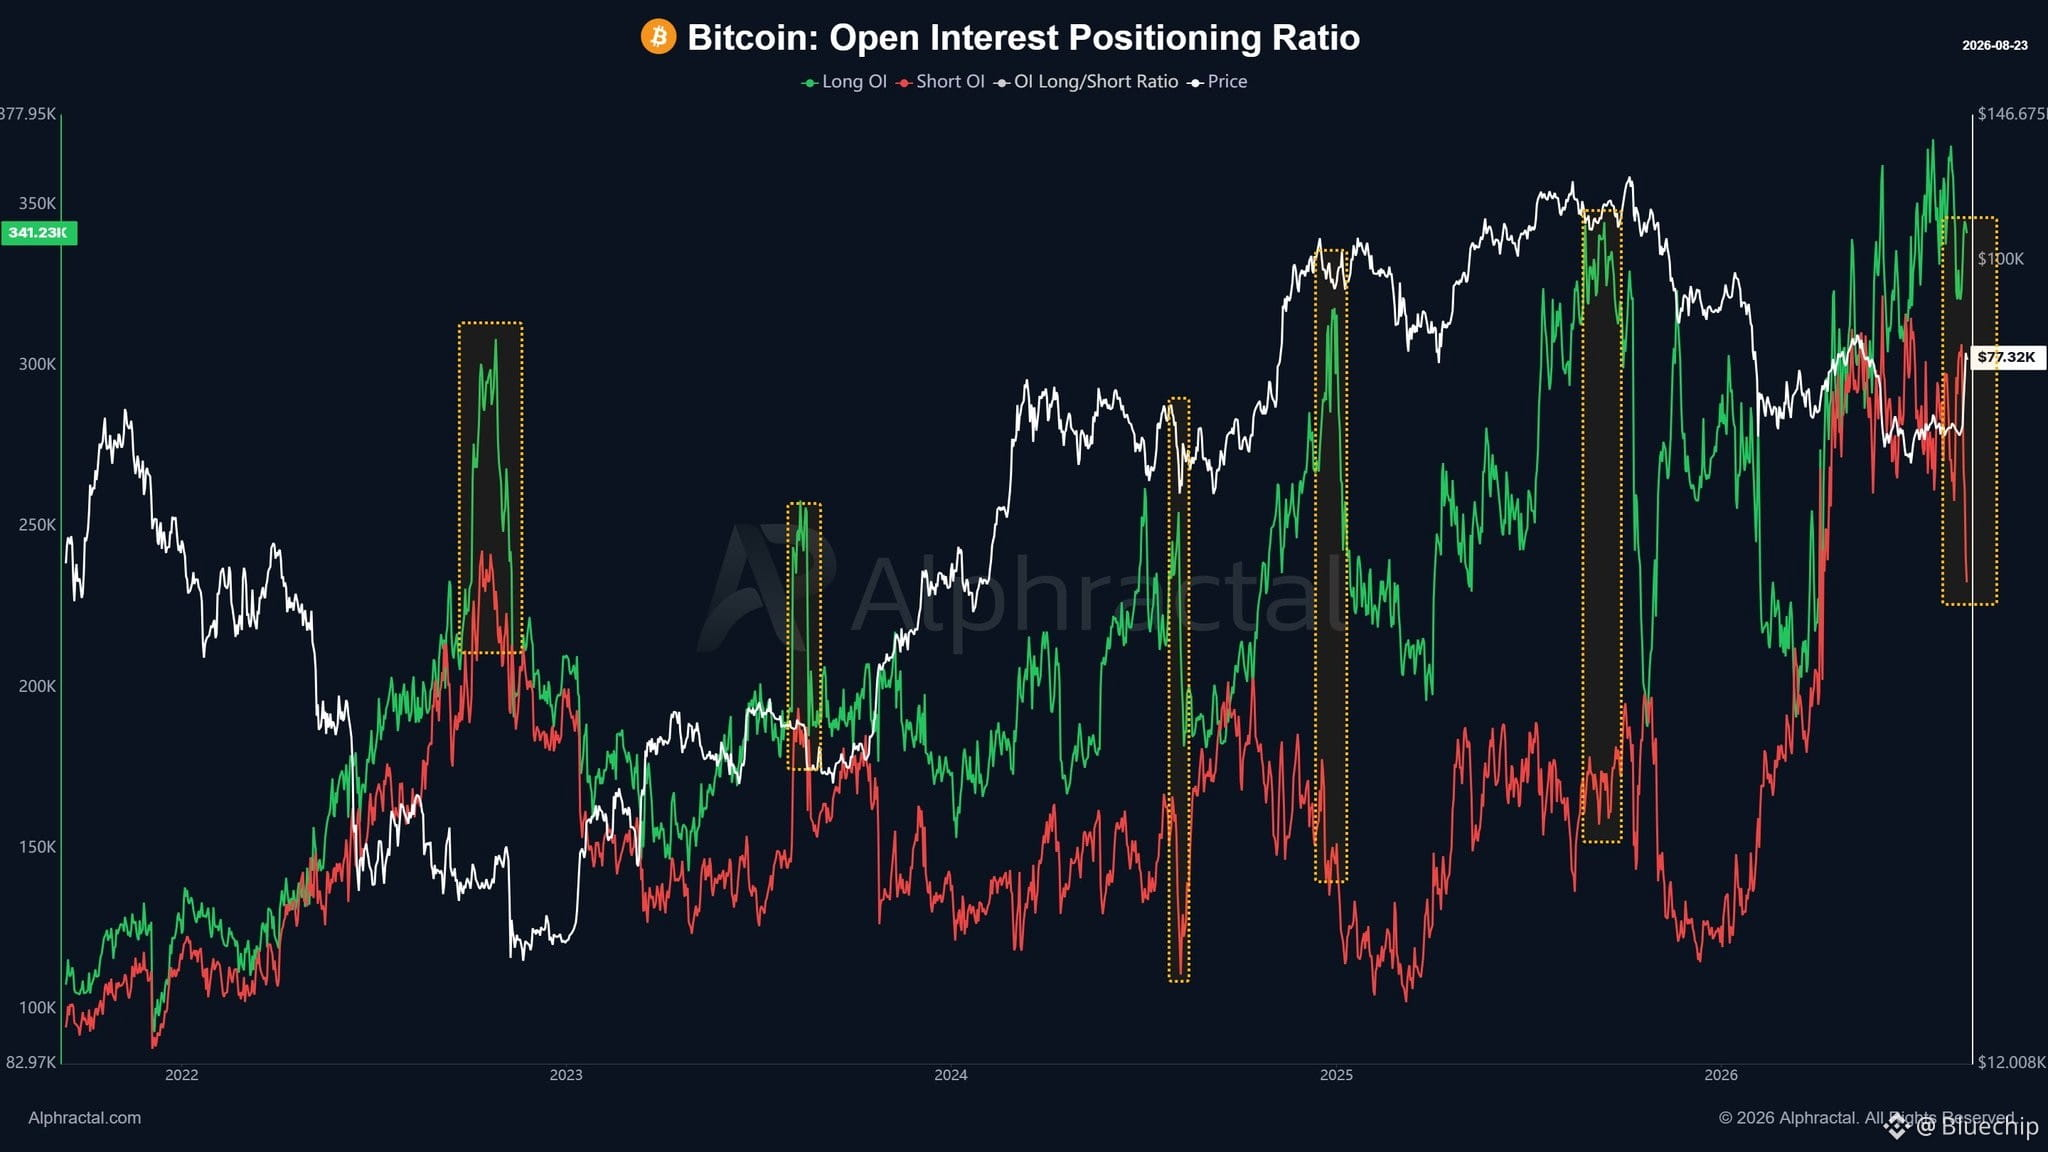
A new risk signal is emerging for Bitcoin, and another wave of long liquidations could happen at some point.
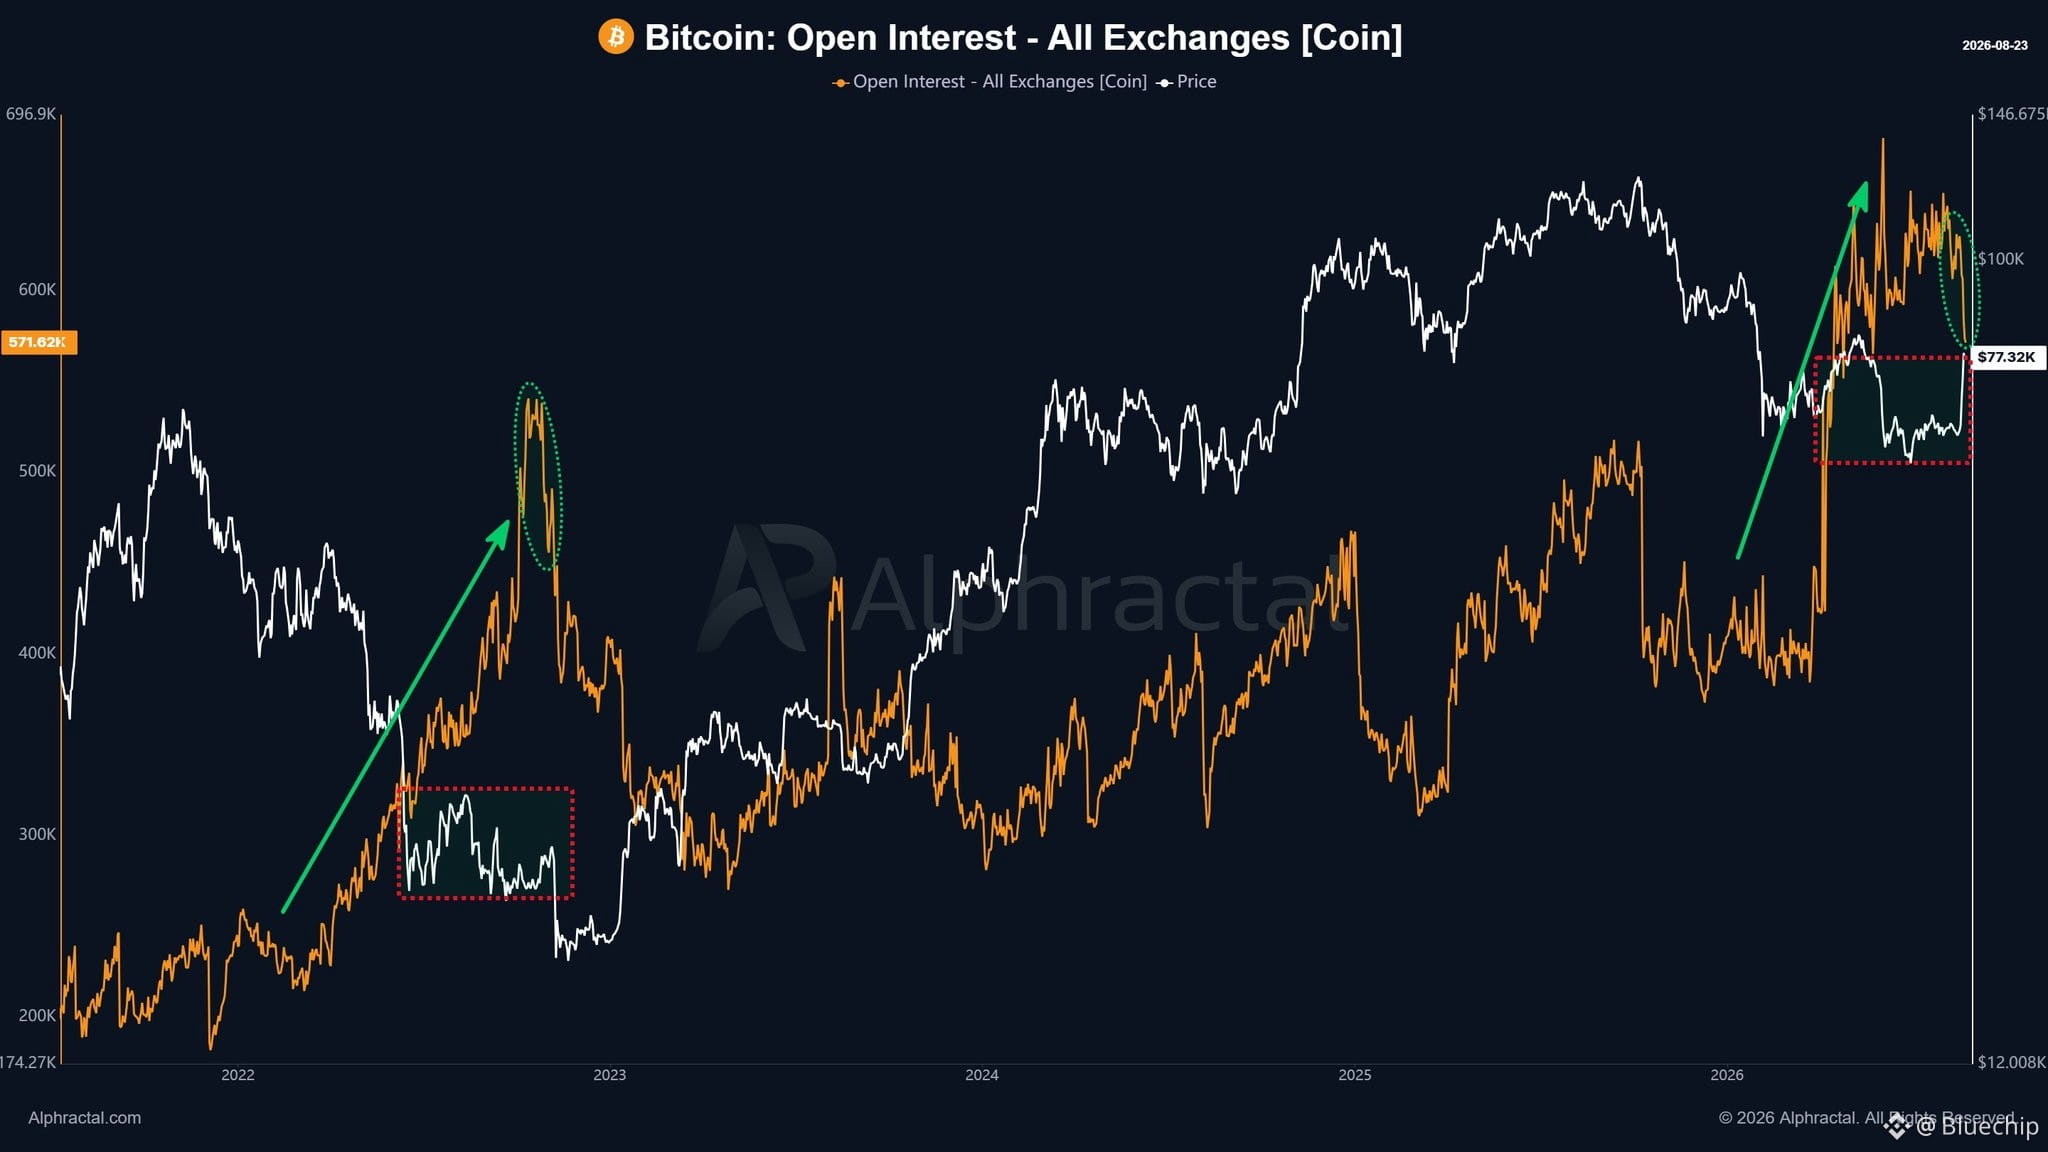
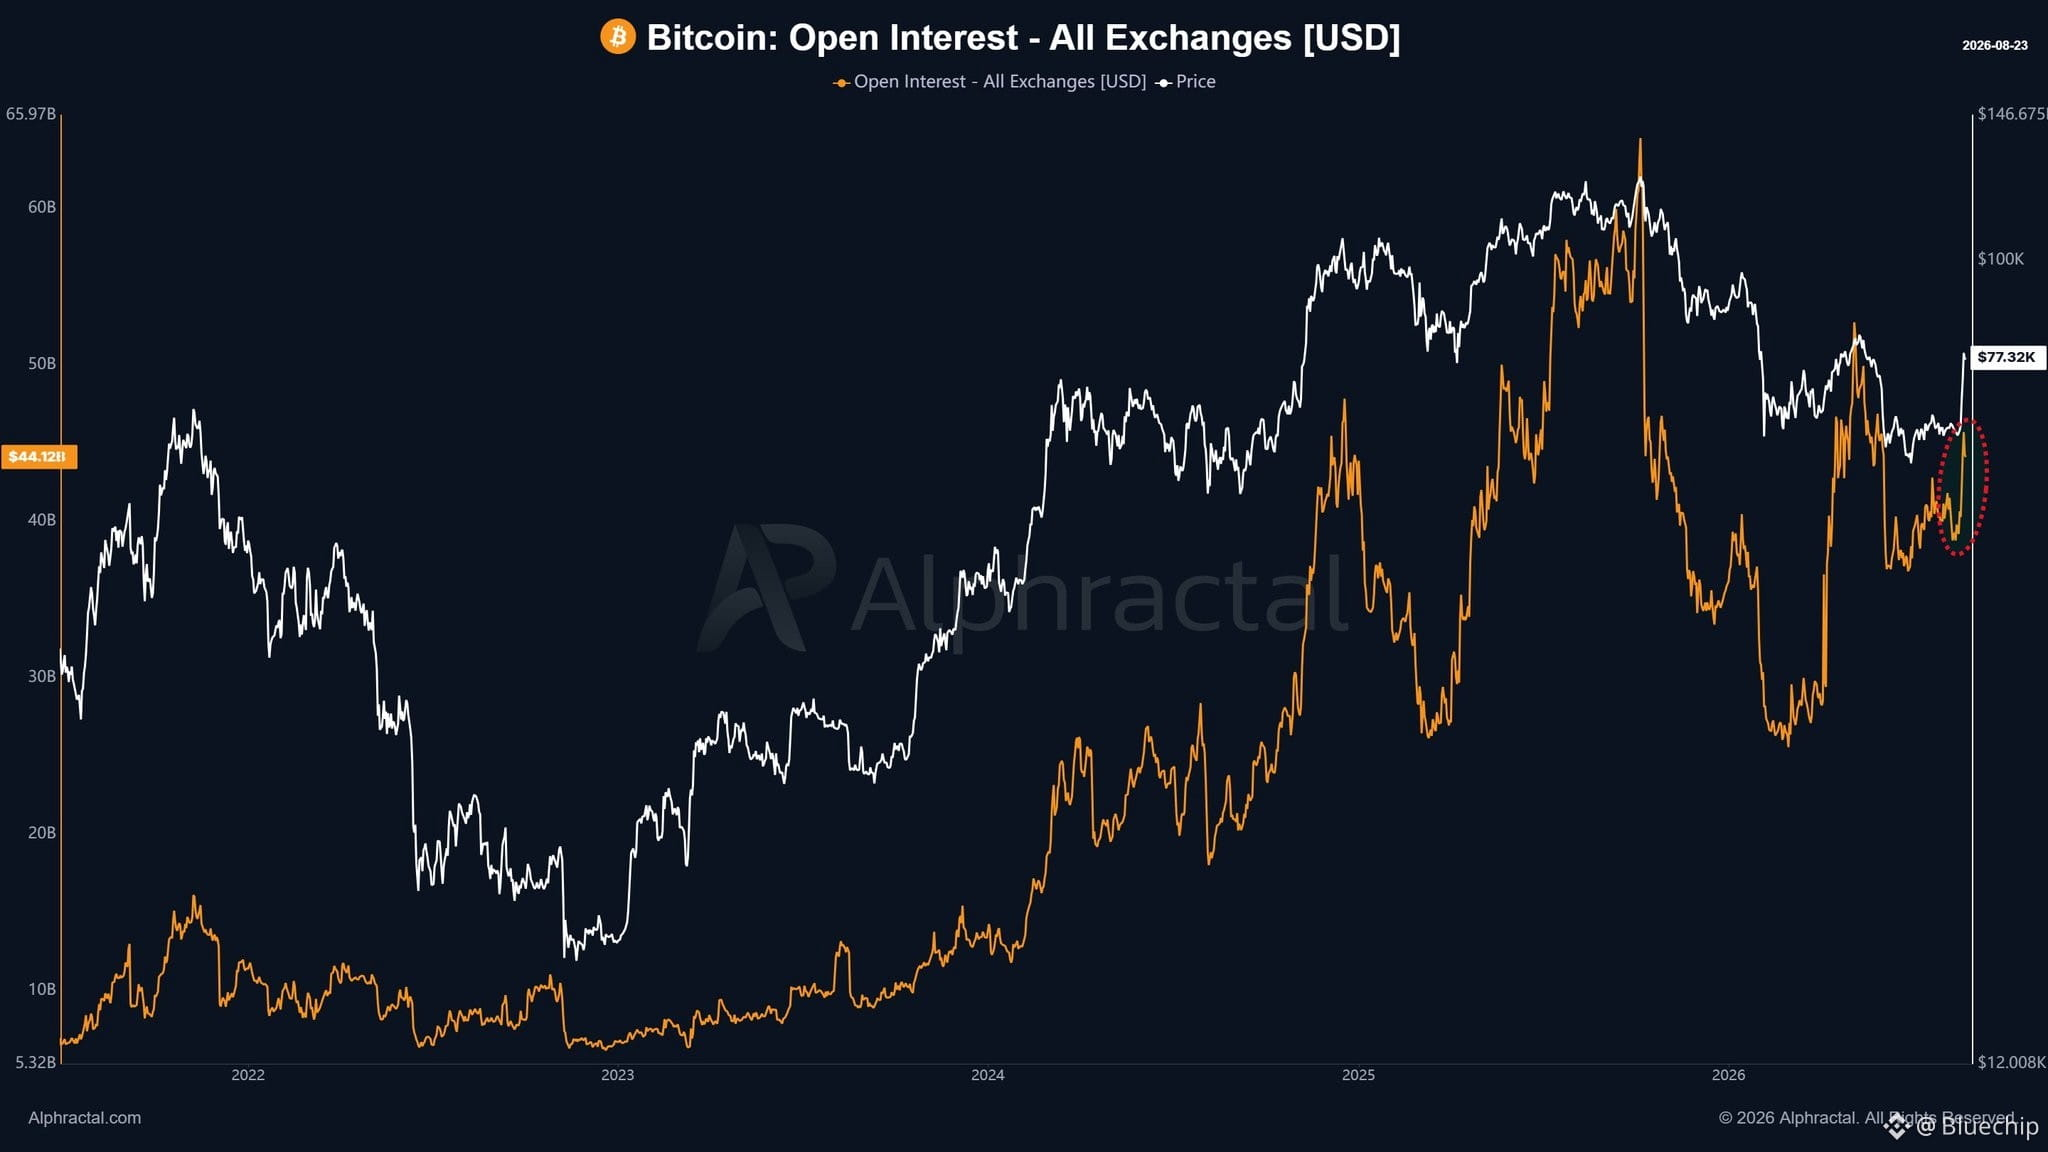
First, look at Open Interest.
In USD terms, Open Interest has increased. But when measured in BTC, it has actually declined. Something similar happened in 2022, about one month before the FTX crash.
At that time, a large number of leveraged positions had been opened because almost nobody expected the FTX collapse.
In 2026, Open Interest also surged, showing a significant increase in leveraged positions opened while Bitcoin was trading around $60,000 to $70,000.
The recent decline in BTC denominated Open Interest is strongly related to shorts. Many short positions were liquidated, while others were forced to close as the price moved sharply higher.
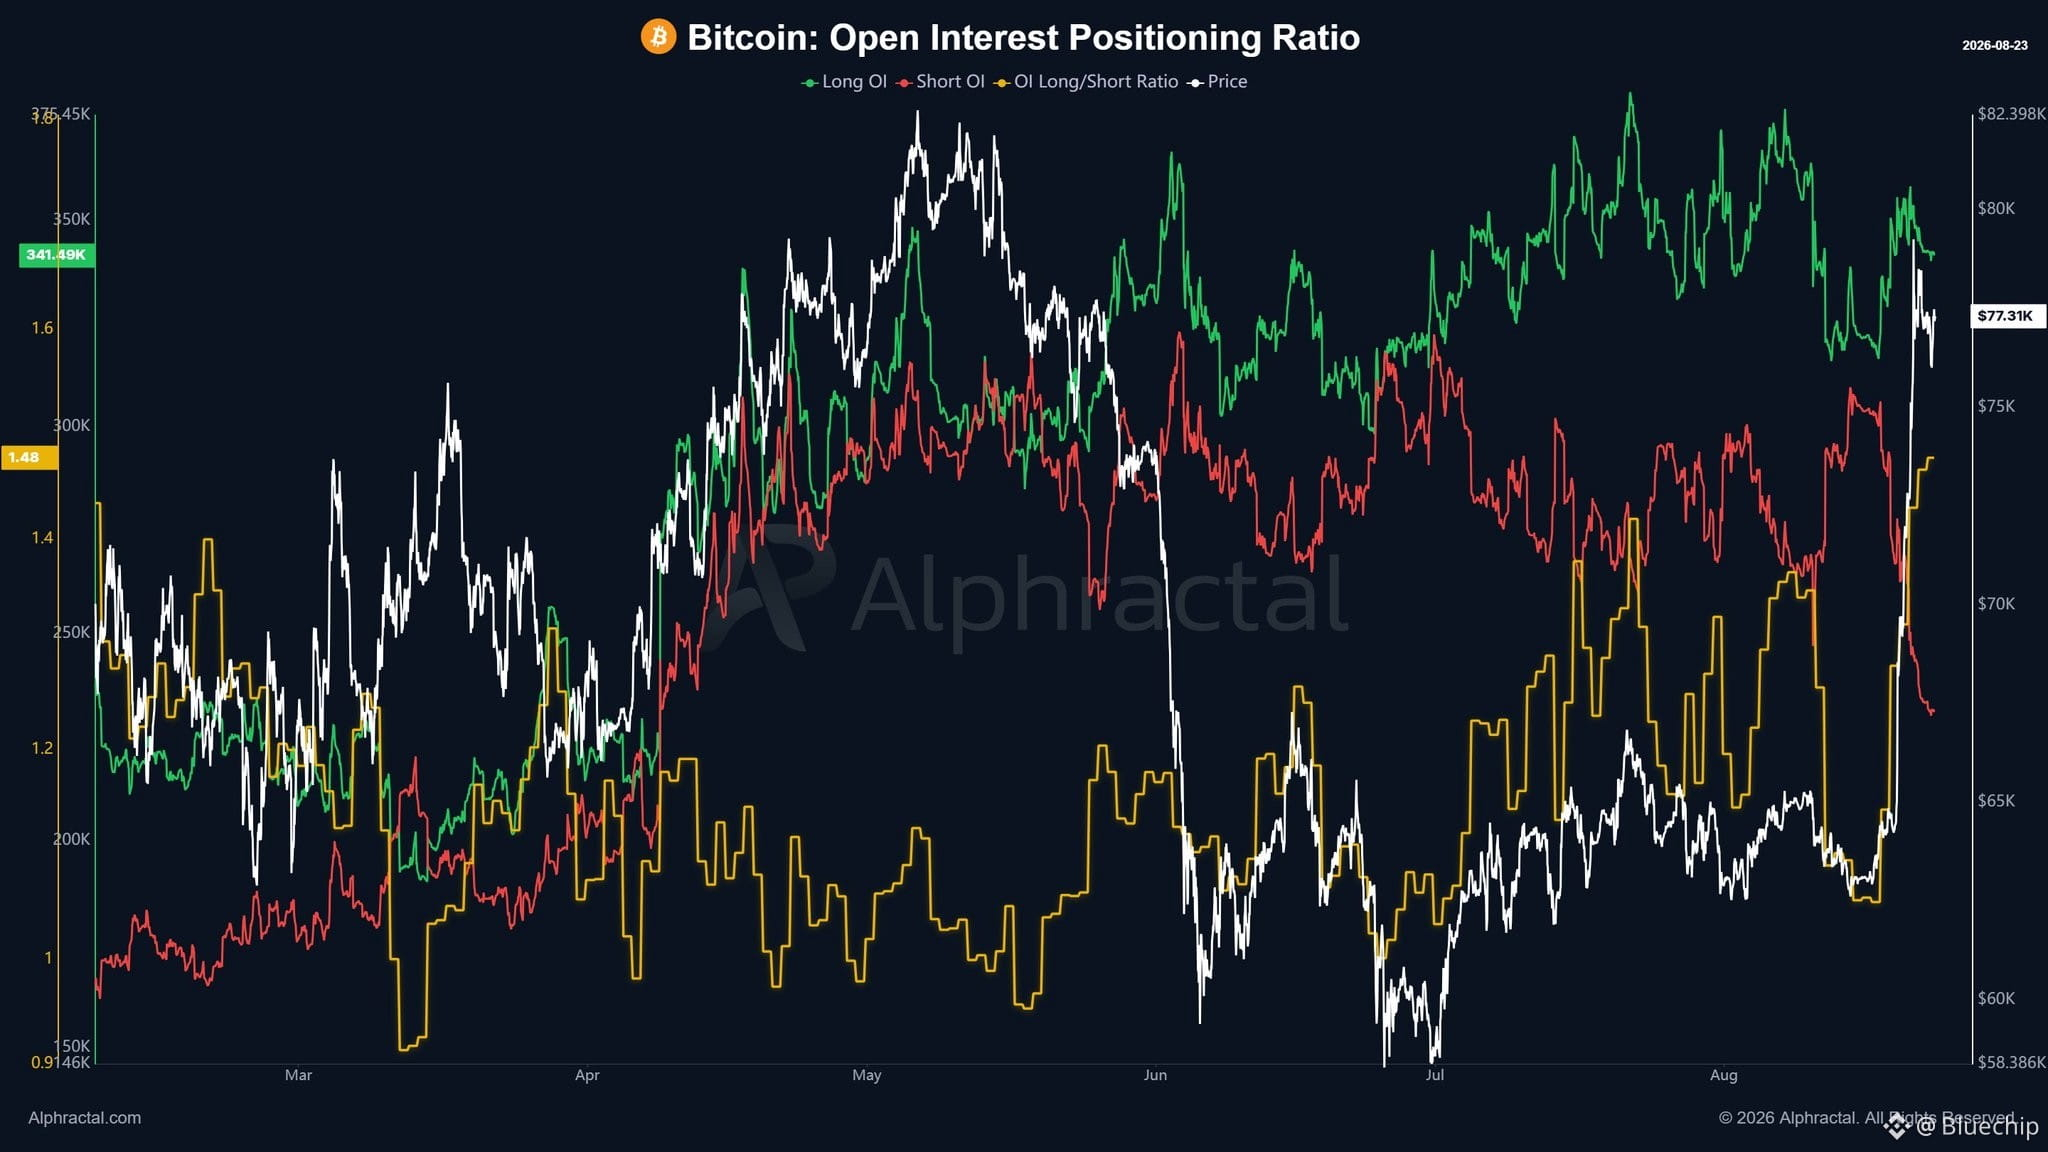
But now the gap between long and short positioning has become very large.
There are currently around 342K BTC in longs versus 233K BTC in shorts.
Historically, imbalances this large have often been followed by sharp downside moves not long afterward. This may partially explain some of the major liquidation events we have seen in the past, including the FTX crash, August 2023, August 2024, January 2025, and the period shortly before Bitcoin reached its all time high.
I am not saying Bitcoin must dump just to support a bearish bias.
I am simply describing what the actual data is showing.
The gap between longs and shorts can still increase, and if it does, the risk factor also increases. Consequently, the probability of a sharp liquidation event also becomes higher.
From a risk perspective, the better time to enter a long position was near $60K, not now with Bitcoin approaching $80K.
Around $60K, the imbalance between longs and shorts was much smaller. Today, that imbalance is considerably larger.
History shows that extreme positioning imbalances often lead to higher volatility and large liquidation events.
The best thing to do now is simply watch the data closely.
First, look at Open Interest.
In USD terms, Open Interest has increased. But when measured in BTC, it has actually declined. Something similar happened in 2022, about one month before the FTX crash.
At that time, a large number of leveraged positions had been opened because almost nobody expected the FTX collapse.
In 2026, Open Interest also surged, showing a significant increase in leveraged positions opened while Bitcoin was trading around $60,000 to $70,000.
The recent decline in BTC denominated Open Interest is strongly related to shorts. Many short positions were liquidated, while others were forced to close as the price moved sharply higher.
But now the gap between long and short positioning has become very large.
There are currently around 342K BTC in longs versus 233K BTC in shorts.
Historically, imbalances this large have often been followed by sharp downside moves not long afterward. This may partially explain some of the major liquidation events we have seen in the past, including the FTX crash, August 2023, August 2024, January 2025, and the period shortly before Bitcoin reached its all time high.
I am not saying Bitcoin must dump just to support a bearish bias.
I am simply describing what the actual data is showing.
The gap between longs and shorts can still increase, and if it does, the risk factor also increases. Consequently, the probability of a sharp liquidation event also becomes higher.
From a risk perspective, the better time to enter a long position was near $60K, not now with Bitcoin approaching $80K.
Around $60K, the imbalance between longs and shorts was much smaller. Today, that imbalance is considerably larger.
History shows that extreme positioning imbalances often lead to higher volatility and large liquidation events.
The best thing to do now is simply watch the data closely.
$BTC
Is this leverage or real demand?
Open interest at $45.2B and rising. $59.4M of long liquidations cleared in 24h against $12.4M on shorts. Buy-side aggressive volume above sell-side, but not consistently across timeframes. Exchange reserves climbing in dollar terms.
Verdict: bullish but fragile. Price can push higher if the shorts above get squeezed, but leverage is doing most of the work not spot demand.
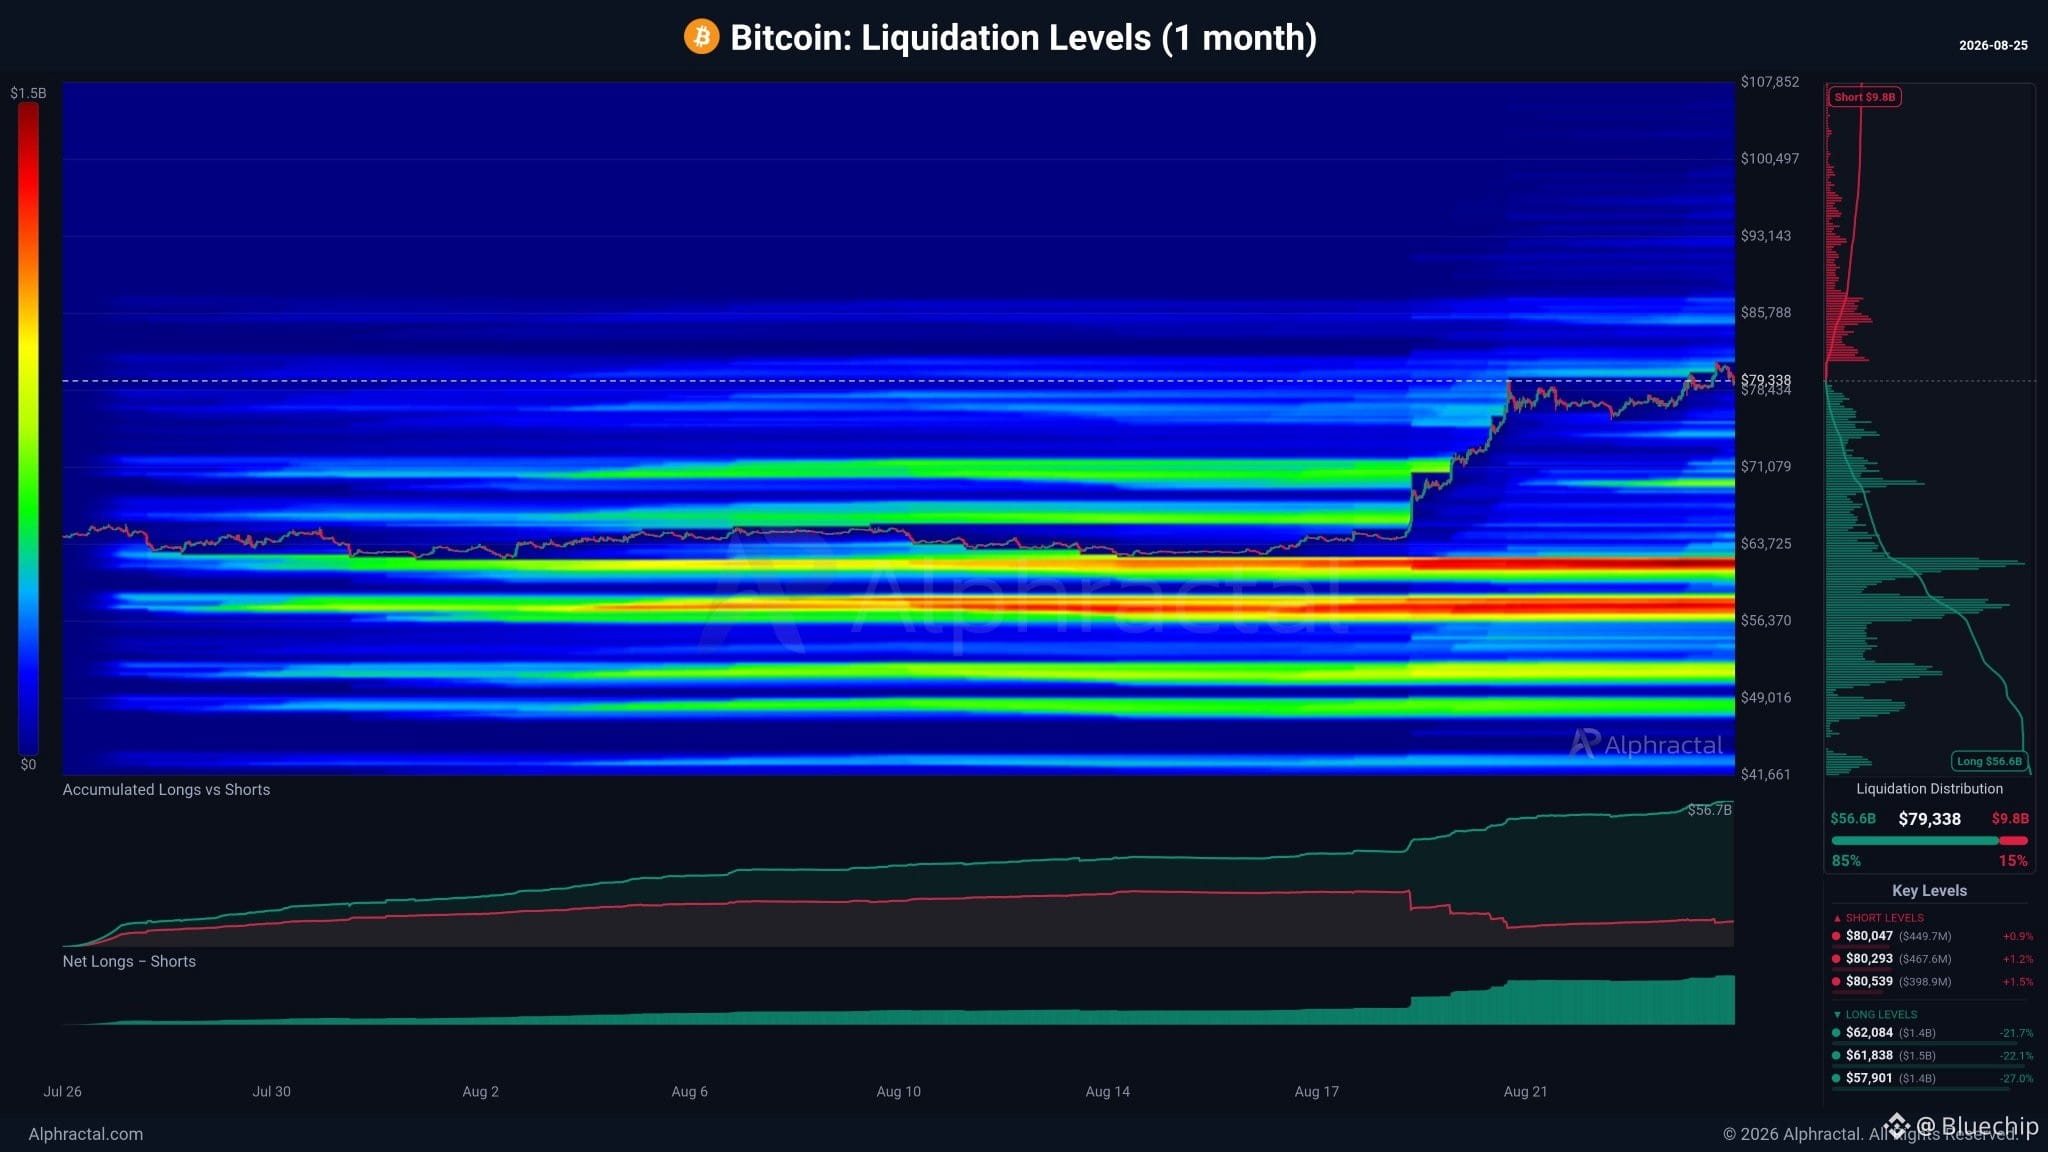
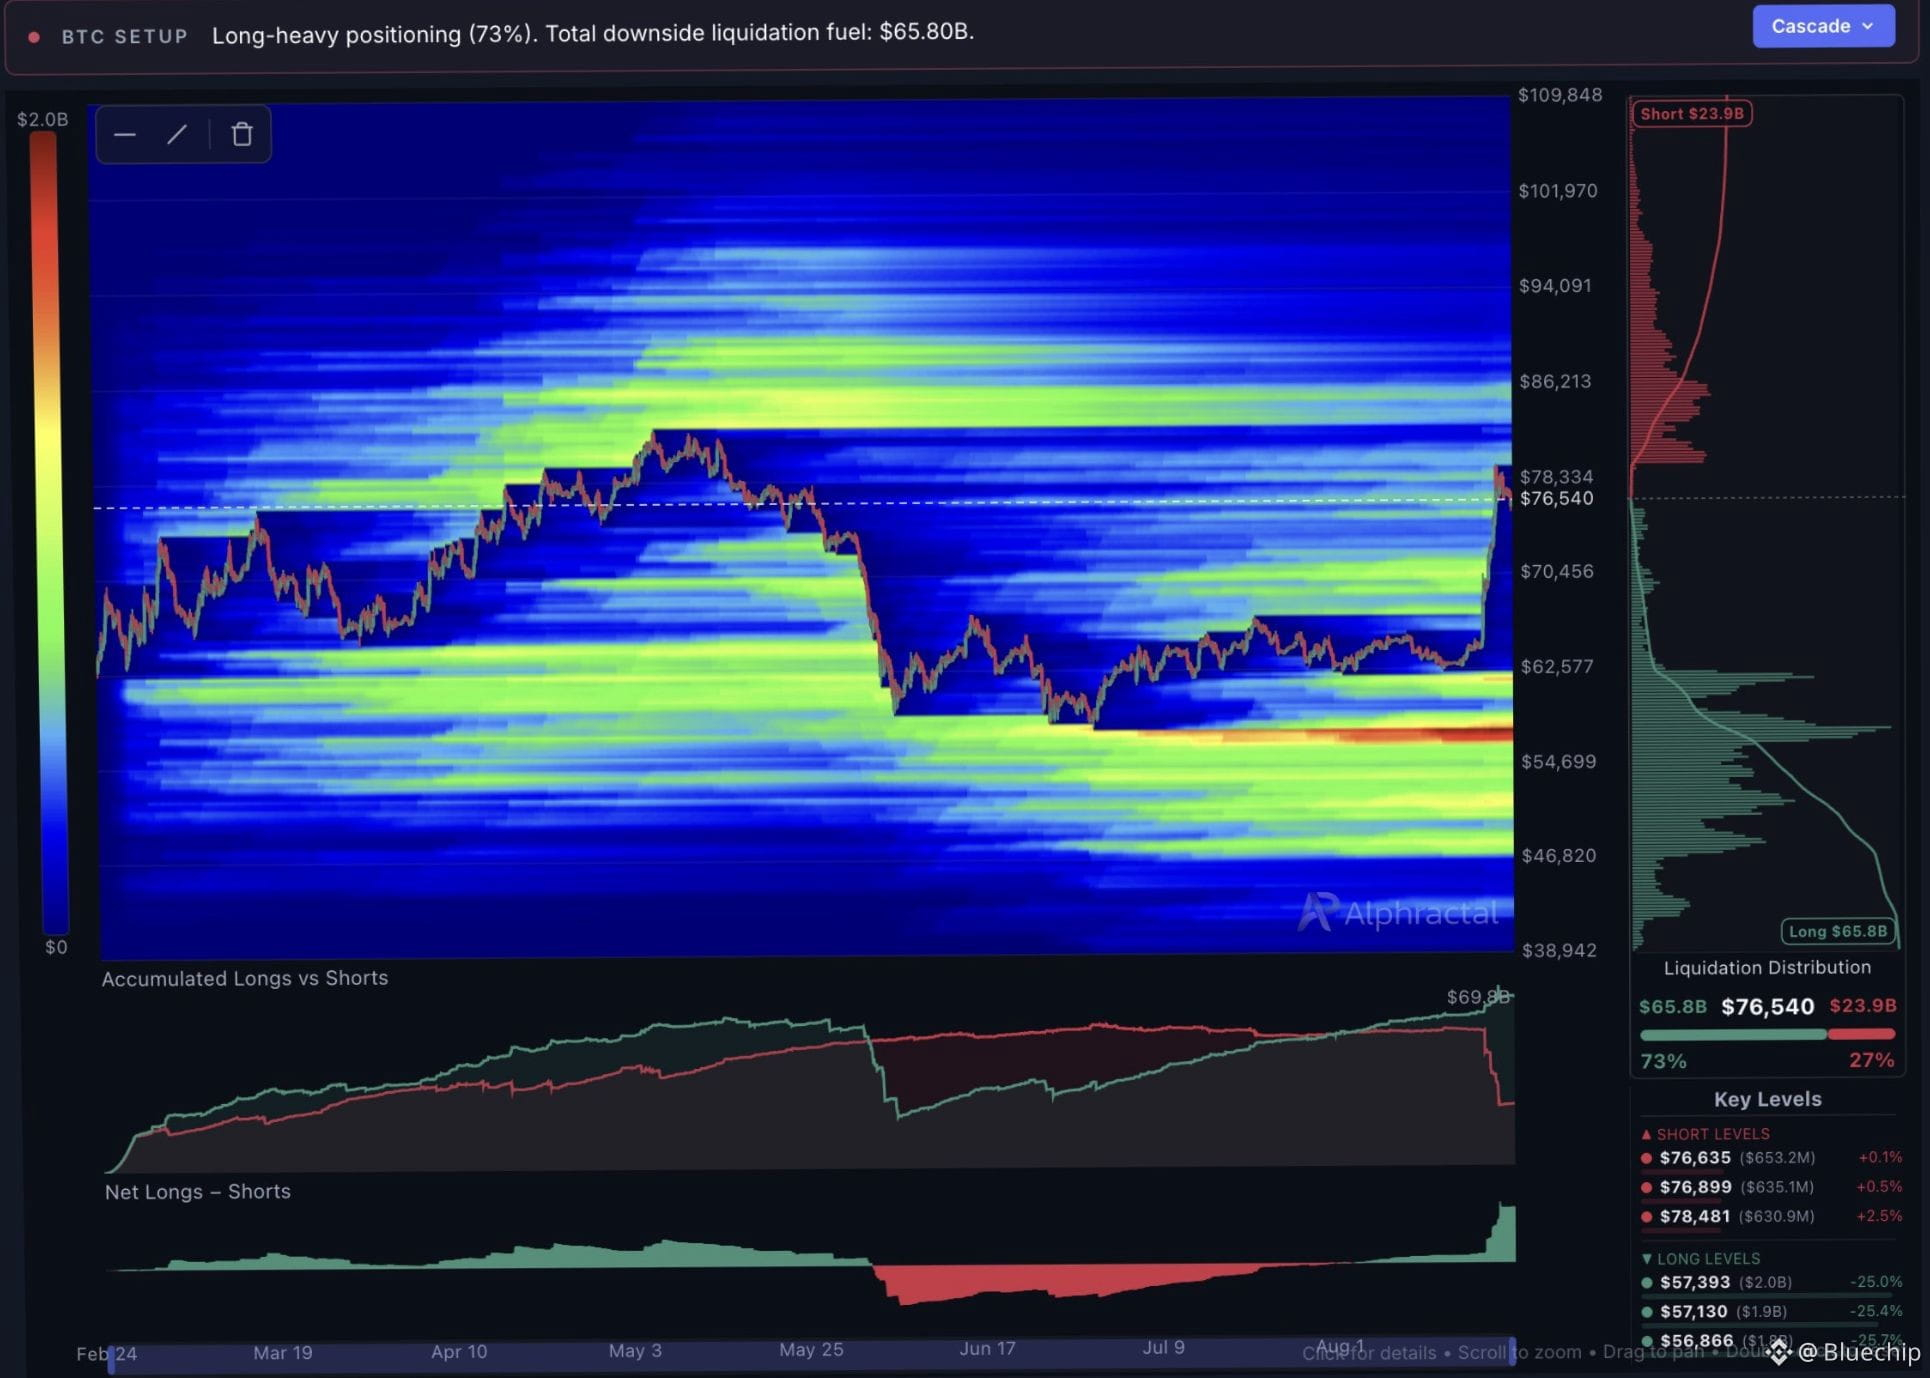
The map underneath says the same thing. Positioning is 73% long, with $65.80B of downside liquidation fuel against $23.9B above.
Is this leverage or real demand?
Open interest at $45.2B and rising. $59.4M of long liquidations cleared in 24h against $12.4M on shorts. Buy-side aggressive volume above sell-side, but not consistently across timeframes. Exchange reserves climbing in dollar terms.
Verdict: bullish but fragile. Price can push higher if the shorts above get squeezed, but leverage is doing most of the work not spot demand.
The map underneath says the same thing. Positioning is 73% long, with $65.80B of downside liquidation fuel against $23.9B above.
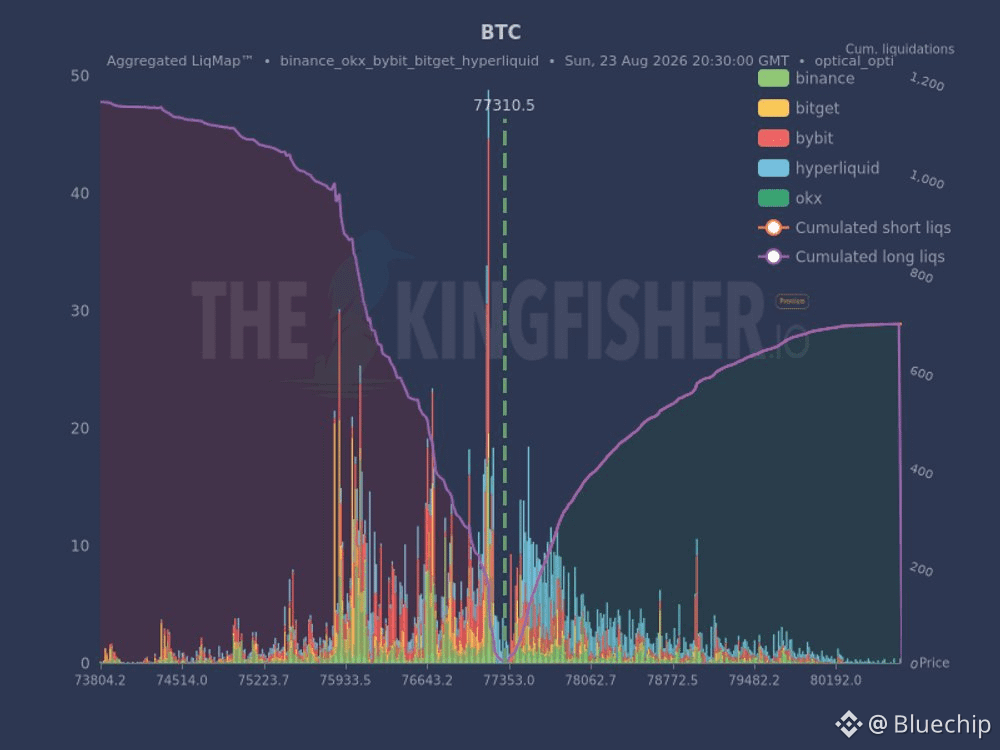
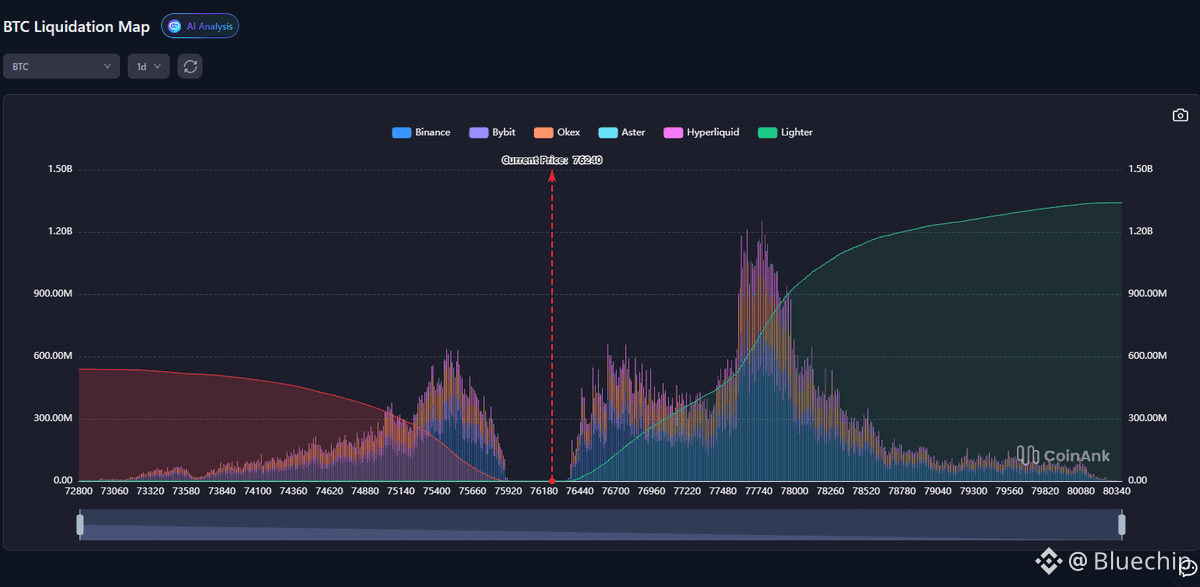
$BTC has formed a polarized liquidation zone around $76,240, with the peak size of short liquidations above significantly suppressing the lower side.
Short Liquidation Risk:
The concentrated area is between $77,480 and $78,000, with a single liquidation peak exceeding $1.20 B.
The cumulative short liquidation leverage curve shows a sharp upward trend.
Long Liquidation Risk:
The concentrated area is between $75,000 and $75,660, with a local peak of approximately $600 M.
The overall long liquidation scale is far lower than the concentrated liquidation zone above.
An extremely large amount of short leveraged positions has accumulated on the right side; an upward break above $77,000 could easily trigger a large-scale short squeeze and a chain of liquidations.
Short Liquidation Risk:
The concentrated area is between $77,480 and $78,000, with a single liquidation peak exceeding $1.20 B.
The cumulative short liquidation leverage curve shows a sharp upward trend.
Long Liquidation Risk:
The concentrated area is between $75,000 and $75,660, with a local peak of approximately $600 M.
The overall long liquidation scale is far lower than the concentrated liquidation zone above.
An extremely large amount of short leveraged positions has accumulated on the right side; an upward break above $77,000 could easily trigger a large-scale short squeeze and a chain of liquidations.
Log in to explore more content