
Bitcoinworld
69k Posts

Bitcoinworld
 Square Verified+
Report
Block User
BitcoinWorld is a leading media publication bringing the latest happenings in the Blockchain and Crypto Space.

#BinanceTurns7

Excellence Award (Market Buzz)

Creator of the Year
2 Following
100.6K+ Followers
287.3K+ Liked
4 Badges
Posts
All
Videos
Live
·
--

Article
EDGE Markets Partners With Splash Sports to Bring 24/7 Banking to the $21 Million NFL Survivor Co...BitcoinWorldEDGE Markets Partners with Splash Sports to Bring 24/7 Banking to the $21 Million NFL Survivor Contest
Powered by EDGE Connect, Splash Sports players now have access to 24/7/365 fund movement, daily deposit limits of up to $1 million as they compete for Splash Sports’ $21 million guaranteed NFL Survivor contest
NEW YORK, Sept. 9, 2026 /PRNewswire/ — EDGE Markets, a financial services company purpose-built for prediction markets, gaming, and crypto, today announced a partnership with Splash Sports, the leading skill-based social sports gaming platform, to facilitate Splash’s marquee $21 million NFL survivor contest.
The agreement brings EDGE Connect, a private closed-loop settlement network, to the Splash Sports platform. This enables eligible EDGE Boost customers to fund their Splash Sports accounts with up to $1 million a day. Beyond its marquee $21 million NFL Survivor contest, Splash Sports runs contests at a range of price points, including a $3 million guaranteed contest and entries as low as $5, giving players multiple ways to compete.
Traditional account funding methods can involve lower transaction limits, processing delays and fees, which are particularly inconvenient for players moving money on nights, weekends and around Sunday kickoffs. EDGE Boost gives eligible Splash Sports users daily deposit limits of up to $1 million, real-time fund movement and a dedicated account that separates gaming capital from everyday finances. That speed matters most in Splash Sports’ 2026 NFL Survivor contest, which carries a $21 million guaranteed prize contest, a $1,000 fee per entry and up to 150 entries per player, with a new marketplace for buying and selling entry stakes and Team Entries for groups, both of which can require players to move money quickly all season.
“Capital should move on the player’s schedule, not the banks,” said Seni Thomas, Founder and CEO of EDGE Markets. “Splash Sports players are entering more lineups, trading stakes and racing Sunday deadlines, and EDGE gets them there with up to a million dollars a day, immediately.”
Splash Sports is seeing that same demand for speed from its own players. Entries are piling up ahead of the September 13 deadline. The new Marketplace and Team Entries features mean players are moving money in and out of the contest throughout the season, not just once at sign-up.
“Our players are managing more entries and more moving pieces than ever, especially with the Marketplace and Team Entries we launched this season,” said TJ Ross, Co-Founder and Co-CEO of Splash Sports. “Our players shouldn’t have to wait on their bank to keep playing. EDGE Markets makes sure the money moves just as fast as everything else we’ve built.”
This partnership builds on momentum following EDGE Markets’ recently announced partnerships with Kalshi, Polymarket and ProphetX, making Splash Sports the latest platform to adopt EDGE Connect. EDGE Markets recently closed a $29 million Series A round led by CoinFund, with participation from Indicator Ventures, Mantis VC, Stepstone Group and Bullpen Capital, to accelerate its buildout across prediction markets and gaming. Since launching EDGE Boost, the company has processed more than $2 billion in transactions.
About EDGE MarketsEDGE Markets is a U.S. financial services company that empowers users with financial transparency, supporting emerging verticals such as betting, gaming and casinos. Its original product, EDGE Boost, is the first responsible financial platform for smart bettors. It is the first betting-only debit card account that is FDIC and/or NCUA deposit insurance up to $10,000,000 or more through Cross River Bank, Member FDIC, and Participating Institutions.1
About Splash SportsSplash Sports is the leading skill-based social sports gaming platform, enabling friends and communities to compete for real money. Founded in 2021, the company has since acquired and integrated RunYourPool and OfficeFootballPool. Splash Sports operates across 35-plus states and Canada with more than 2 million active users. The company is backed by Dream Ventures, Accomplice, Boston Seed Capital, Elysian Park Ventures and Velvet Sea Ventures.
Media ContactsJustine Sacco / justine@edgemarkets.ioEdgemarkets@greenbrier.partners Andrew Bard / splashsports@dkcnews.com
Deposit accounts are held at Cross River Bank, Member FDIC, and are insured up to $250,000 per depositor. Through our relationship with IntraFi® Network Deposits℠, funds may be eligible for additional FDIC insurance coverage by being distributed across participating network banks, up to $10,000,000 in aggregate for consumer accounts enrolled in the applicable program. FDIC insurance coverage is subject to applicable terms and conditions, including account structure, account ownership categories and regulatory requirements. The EDGE Boost Visa® Debit Card is issued by Cross River Bank, Member FDIC, pursuant to a license from Visa U.S.A. Inc., and is not available to all residents of U.S. territories. Account limits and other applicable terms are described in our Terms of Service and Cardholder Agreement and CRB Account Agreement.
This post EDGE Markets Partners with Splash Sports to Bring 24/7 Banking to the $21 Million NFL Survivor Contest first appeared on BitcoinWorld.
EDGE Markets Partners With Splash Sports to Bring 24/7 Banking to the $21 Million NFL Survivor Co...
BitcoinWorldEDGE Markets Partners with Splash Sports to Bring 24/7 Banking to the $21 Million NFL Survivor Contest
Powered by EDGE Connect, Splash Sports players now have access to 24/7/365 fund movement, daily deposit limits of up to $1 million as they compete for Splash Sports’ $21 million guaranteed NFL Survivor contest
NEW YORK, Sept. 9, 2026 /PRNewswire/ — EDGE Markets, a financial services company purpose-built for prediction markets, gaming, and crypto, today announced a partnership with Splash Sports, the leading skill-based social sports gaming platform, to facilitate Splash’s marquee $21 million NFL survivor contest.
The agreement brings EDGE Connect, a private closed-loop settlement network, to the Splash Sports platform. This enables eligible EDGE Boost customers to fund their Splash Sports accounts with up to $1 million a day. Beyond its marquee $21 million NFL Survivor contest, Splash Sports runs contests at a range of price points, including a $3 million guaranteed contest and entries as low as $5, giving players multiple ways to compete.
Traditional account funding methods can involve lower transaction limits, processing delays and fees, which are particularly inconvenient for players moving money on nights, weekends and around Sunday kickoffs. EDGE Boost gives eligible Splash Sports users daily deposit limits of up to $1 million, real-time fund movement and a dedicated account that separates gaming capital from everyday finances. That speed matters most in Splash Sports’ 2026 NFL Survivor contest, which carries a $21 million guaranteed prize contest, a $1,000 fee per entry and up to 150 entries per player, with a new marketplace for buying and selling entry stakes and Team Entries for groups, both of which can require players to move money quickly all season.
“Capital should move on the player’s schedule, not the banks,” said Seni Thomas, Founder and CEO of EDGE Markets. “Splash Sports players are entering more lineups, trading stakes and racing Sunday deadlines, and EDGE gets them there with up to a million dollars a day, immediately.”
Splash Sports is seeing that same demand for speed from its own players. Entries are piling up ahead of the September 13 deadline. The new Marketplace and Team Entries features mean players are moving money in and out of the contest throughout the season, not just once at sign-up.
“Our players are managing more entries and more moving pieces than ever, especially with the Marketplace and Team Entries we launched this season,” said TJ Ross, Co-Founder and Co-CEO of Splash Sports. “Our players shouldn’t have to wait on their bank to keep playing. EDGE Markets makes sure the money moves just as fast as everything else we’ve built.”
This partnership builds on momentum following EDGE Markets’ recently announced partnerships with Kalshi, Polymarket and ProphetX, making Splash Sports the latest platform to adopt EDGE Connect. EDGE Markets recently closed a $29 million Series A round led by CoinFund, with participation from Indicator Ventures, Mantis VC, Stepstone Group and Bullpen Capital, to accelerate its buildout across prediction markets and gaming. Since launching EDGE Boost, the company has processed more than $2 billion in transactions.
About EDGE MarketsEDGE Markets is a U.S. financial services company that empowers users with financial transparency, supporting emerging verticals such as betting, gaming and casinos. Its original product, EDGE Boost, is the first responsible financial platform for smart bettors. It is the first betting-only debit card account that is FDIC and/or NCUA deposit insurance up to $10,000,000 or more through Cross River Bank, Member FDIC, and Participating Institutions.1
About Splash SportsSplash Sports is the leading skill-based social sports gaming platform, enabling friends and communities to compete for real money. Founded in 2021, the company has since acquired and integrated RunYourPool and OfficeFootballPool. Splash Sports operates across 35-plus states and Canada with more than 2 million active users. The company is backed by Dream Ventures, Accomplice, Boston Seed Capital, Elysian Park Ventures and Velvet Sea Ventures.
Media ContactsJustine Sacco / justine@edgemarkets.ioEdgemarkets@greenbrier.partners Andrew Bard / splashsports@dkcnews.com
Deposit accounts are held at Cross River Bank, Member FDIC, and are insured up to $250,000 per depositor. Through our relationship with IntraFi® Network Deposits℠, funds may be eligible for additional FDIC insurance coverage by being distributed across participating network banks, up to $10,000,000 in aggregate for consumer accounts enrolled in the applicable program. FDIC insurance coverage is subject to applicable terms and conditions, including account structure, account ownership categories and regulatory requirements. The EDGE Boost Visa® Debit Card is issued by Cross River Bank, Member FDIC, pursuant to a license from Visa U.S.A. Inc., and is not available to all residents of U.S. territories. Account limits and other applicable terms are described in our Terms of Service and Cardholder Agreement and CRB Account Agreement.
This post EDGE Markets Partners with Splash Sports to Bring 24/7 Banking to the $21 Million NFL Survivor Contest first appeared on BitcoinWorld.
Powered by EDGE Connect, Splash Sports players now have access to 24/7/365 fund movement, daily deposit limits of up to $1 million as they compete for Splash Sports’ $21 million guaranteed NFL Survivor contest
NEW YORK, Sept. 9, 2026 /PRNewswire/ — EDGE Markets, a financial services company purpose-built for prediction markets, gaming, and crypto, today announced a partnership with Splash Sports, the leading skill-based social sports gaming platform, to facilitate Splash’s marquee $21 million NFL survivor contest.
The agreement brings EDGE Connect, a private closed-loop settlement network, to the Splash Sports platform. This enables eligible EDGE Boost customers to fund their Splash Sports accounts with up to $1 million a day. Beyond its marquee $21 million NFL Survivor contest, Splash Sports runs contests at a range of price points, including a $3 million guaranteed contest and entries as low as $5, giving players multiple ways to compete.
Traditional account funding methods can involve lower transaction limits, processing delays and fees, which are particularly inconvenient for players moving money on nights, weekends and around Sunday kickoffs. EDGE Boost gives eligible Splash Sports users daily deposit limits of up to $1 million, real-time fund movement and a dedicated account that separates gaming capital from everyday finances. That speed matters most in Splash Sports’ 2026 NFL Survivor contest, which carries a $21 million guaranteed prize contest, a $1,000 fee per entry and up to 150 entries per player, with a new marketplace for buying and selling entry stakes and Team Entries for groups, both of which can require players to move money quickly all season.
“Capital should move on the player’s schedule, not the banks,” said Seni Thomas, Founder and CEO of EDGE Markets. “Splash Sports players are entering more lineups, trading stakes and racing Sunday deadlines, and EDGE gets them there with up to a million dollars a day, immediately.”
Splash Sports is seeing that same demand for speed from its own players. Entries are piling up ahead of the September 13 deadline. The new Marketplace and Team Entries features mean players are moving money in and out of the contest throughout the season, not just once at sign-up.
“Our players are managing more entries and more moving pieces than ever, especially with the Marketplace and Team Entries we launched this season,” said TJ Ross, Co-Founder and Co-CEO of Splash Sports. “Our players shouldn’t have to wait on their bank to keep playing. EDGE Markets makes sure the money moves just as fast as everything else we’ve built.”
This partnership builds on momentum following EDGE Markets’ recently announced partnerships with Kalshi, Polymarket and ProphetX, making Splash Sports the latest platform to adopt EDGE Connect. EDGE Markets recently closed a $29 million Series A round led by CoinFund, with participation from Indicator Ventures, Mantis VC, Stepstone Group and Bullpen Capital, to accelerate its buildout across prediction markets and gaming. Since launching EDGE Boost, the company has processed more than $2 billion in transactions.
About EDGE MarketsEDGE Markets is a U.S. financial services company that empowers users with financial transparency, supporting emerging verticals such as betting, gaming and casinos. Its original product, EDGE Boost, is the first responsible financial platform for smart bettors. It is the first betting-only debit card account that is FDIC and/or NCUA deposit insurance up to $10,000,000 or more through Cross River Bank, Member FDIC, and Participating Institutions.1
About Splash SportsSplash Sports is the leading skill-based social sports gaming platform, enabling friends and communities to compete for real money. Founded in 2021, the company has since acquired and integrated RunYourPool and OfficeFootballPool. Splash Sports operates across 35-plus states and Canada with more than 2 million active users. The company is backed by Dream Ventures, Accomplice, Boston Seed Capital, Elysian Park Ventures and Velvet Sea Ventures.
Media ContactsJustine Sacco / justine@edgemarkets.ioEdgemarkets@greenbrier.partners Andrew Bard / splashsports@dkcnews.com
Deposit accounts are held at Cross River Bank, Member FDIC, and are insured up to $250,000 per depositor. Through our relationship with IntraFi® Network Deposits℠, funds may be eligible for additional FDIC insurance coverage by being distributed across participating network banks, up to $10,000,000 in aggregate for consumer accounts enrolled in the applicable program. FDIC insurance coverage is subject to applicable terms and conditions, including account structure, account ownership categories and regulatory requirements. The EDGE Boost Visa® Debit Card is issued by Cross River Bank, Member FDIC, pursuant to a license from Visa U.S.A. Inc., and is not available to all residents of U.S. territories. Account limits and other applicable terms are described in our Terms of Service and Cardholder Agreement and CRB Account Agreement.
This post EDGE Markets Partners with Splash Sports to Bring 24/7 Banking to the $21 Million NFL Survivor Contest first appeared on BitcoinWorld.
97
·
--
Article
Alarming Hyperliquid Hack: $738,600 USDC Drained From User AccountBitcoinWorldAlarming Hyperliquid Hack: $738,600 USDC Drained From User Account
Key Takeaways
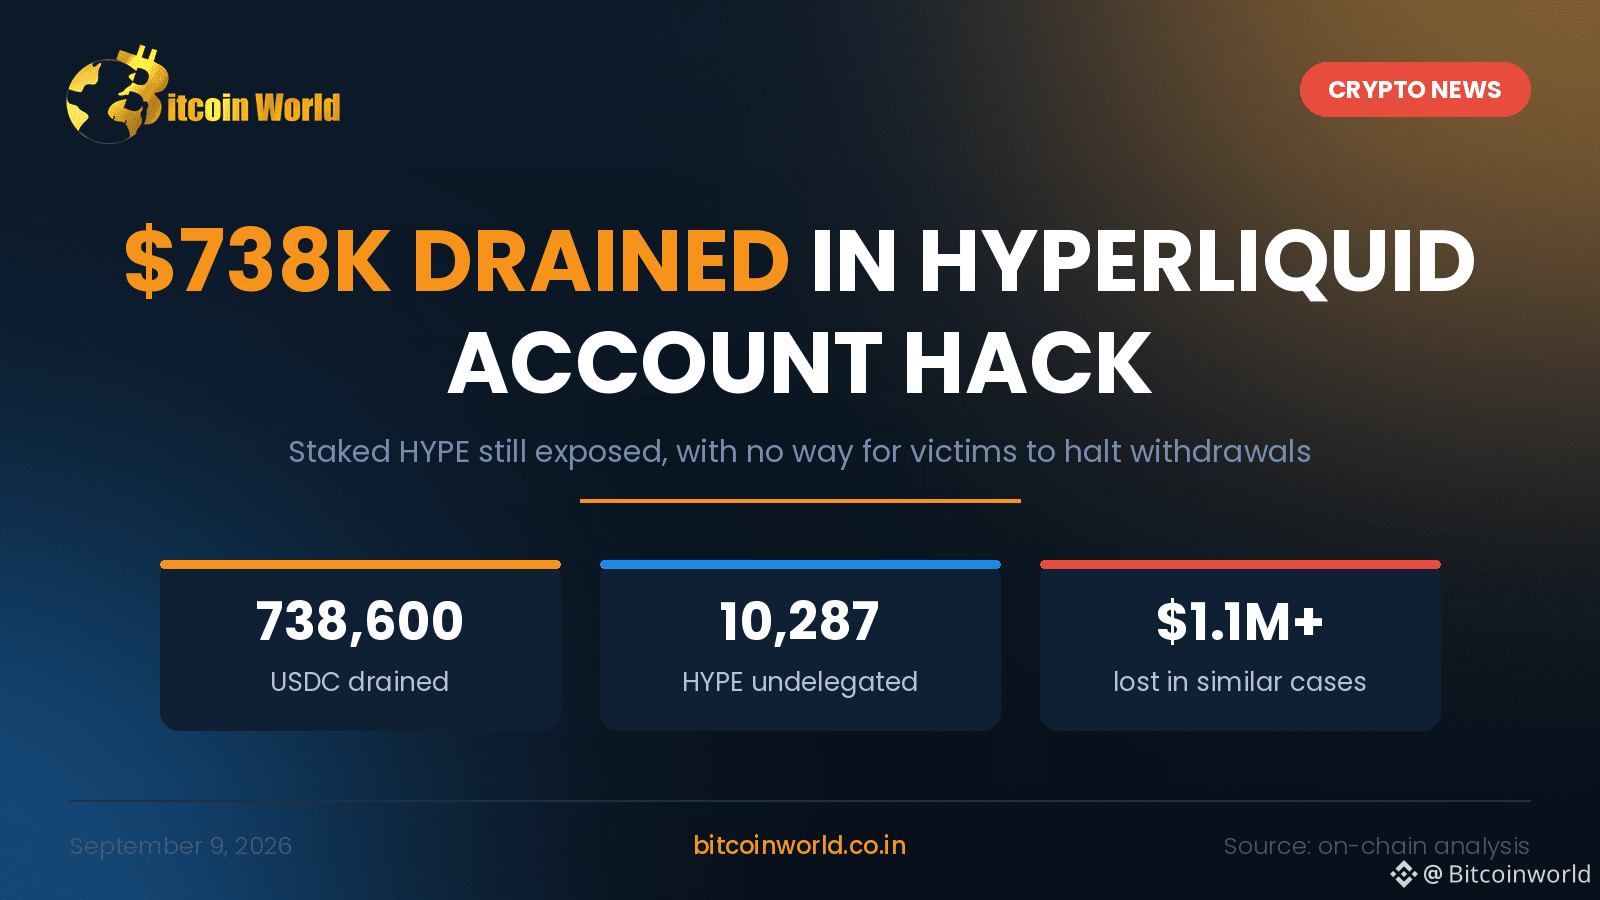
A Hyperliquid user account was compromised on September 9, drained of roughly 738,600 USDC, with 10,287 HYPE forcibly undelegated.
Tracing shows the stolen stablecoins moved through Circle’s CCTP bridge and split across at least five hops before touching a Bitget-linked deposit address.
The staked HYPE has not entered the withdrawal queue yet, meaning the theft is only partially complete.
Two comparable cases handled recently ended the same way, pushing cumulative losses in this pattern past $1.1 million.
The Real Story Is Not the Theft. It Is the Seven Days Nobody Can Use.
Account takeovers happen weekly in crypto. What makes this one worth your attention is the part that has not happened yet.
When the attacker took control of 0x5b6d236e39a4723a8f79db93cfd1af4d228f9c60, the liquid balance went first, as it always does. The 10,287 HYPE sitting in staking is a different problem. Hyperliquid’s unstaking flow imposes a seven-day waiting period before a cWithdraw releases funds. On paper, that is a full week of warning. In practice, the victim can do absolutely nothing with it. There is no user-triggered pause, no freeze, no recovery path. The owner watches a countdown they cannot stop.
Timeline
Compromise: Unauthorized access to the account, most likely through a leaked private key or an approved signing agent.
Immediate drain: ~738,600 USDC transferred out.
Undelegation: 10,287 HYPE pulled out of delegation, positioning it for withdrawal.
Laundering: Funds routed via Circle’s CCTP bridge, then fragmented into tranches of roughly 443K, 450K, 147.5K, 147.8K and 50K across a chain of intermediary wallets.
Off-ramp: A portion lands at an address attributed to Bitget.
Now: HYPE remains in the staking balance, withdrawal not yet initiated.
What an Analyst Sees Here
The CCTP hop is deliberate. Native burn-and-mint transfers produce cleaner, harder-to-cluster flows than wrapped bridge assets, and the rapid fan-out into unequal amounts is textbook peel-chain behaviour designed to defeat automated tracing thresholds. The speed to a centralised exchange also tells you something: the attacker is betting on beating the compliance desk’s response window, not on sophisticated obfuscation.
The structural issue is that Hyperliquid inherits self-custody’s absolutism while offering an exchange-grade product. Ethereum’s smart accounts have had social recovery and guardian modules for years. A perps venue holding delegated stake has no equivalent.
What Comes Next
The proposal now on the table is an opt-in Guardian: a pre-configured party that can temporarily halt cWithdraw, transfers, agent approvals and multisig changes, but can never move funds. Holds expire automatically. Replacement requires a timelock and validator-governed review, recorded on-chain.
Expect pushback on censorship grounds, and expect it to be raised anyway once the fourth victim appears.
Conclusion
This is not a protocol exploit. Hyperliquid’s code did exactly what it was written to do. That is precisely the problem: a week-long delay that only benefits the thief is a design gap, not a security feature. Until account-level recovery becomes standard, every staked balance on a high-value venue is a one-key-away loss.
This post Alarming Hyperliquid Hack: $738,600 USDC Drained From User Account first appeared on BitcoinWorld.
Alarming Hyperliquid Hack: $738,600 USDC Drained From User Account
BitcoinWorldAlarming Hyperliquid Hack: $738,600 USDC Drained From User Account
Key Takeaways
A Hyperliquid user account was compromised on September 9, drained of roughly 738,600 USDC, with 10,287 HYPE forcibly undelegated.
Tracing shows the stolen stablecoins moved through Circle’s CCTP bridge and split across at least five hops before touching a Bitget-linked deposit address.
The staked HYPE has not entered the withdrawal queue yet, meaning the theft is only partially complete.
Two comparable cases handled recently ended the same way, pushing cumulative losses in this pattern past $1.1 million.
The Real Story Is Not the Theft. It Is the Seven Days Nobody Can Use.
Account takeovers happen weekly in crypto. What makes this one worth your attention is the part that has not happened yet.
When the attacker took control of 0x5b6d236e39a4723a8f79db93cfd1af4d228f9c60, the liquid balance went first, as it always does. The 10,287 HYPE sitting in staking is a different problem. Hyperliquid’s unstaking flow imposes a seven-day waiting period before a cWithdraw releases funds. On paper, that is a full week of warning. In practice, the victim can do absolutely nothing with it. There is no user-triggered pause, no freeze, no recovery path. The owner watches a countdown they cannot stop.
Timeline
Compromise: Unauthorized access to the account, most likely through a leaked private key or an approved signing agent.
Immediate drain: ~738,600 USDC transferred out.
Undelegation: 10,287 HYPE pulled out of delegation, positioning it for withdrawal.
Laundering: Funds routed via Circle’s CCTP bridge, then fragmented into tranches of roughly 443K, 450K, 147.5K, 147.8K and 50K across a chain of intermediary wallets.
Off-ramp: A portion lands at an address attributed to Bitget.
Now: HYPE remains in the staking balance, withdrawal not yet initiated.
What an Analyst Sees Here
The CCTP hop is deliberate. Native burn-and-mint transfers produce cleaner, harder-to-cluster flows than wrapped bridge assets, and the rapid fan-out into unequal amounts is textbook peel-chain behaviour designed to defeat automated tracing thresholds. The speed to a centralised exchange also tells you something: the attacker is betting on beating the compliance desk’s response window, not on sophisticated obfuscation.
The structural issue is that Hyperliquid inherits self-custody’s absolutism while offering an exchange-grade product. Ethereum’s smart accounts have had social recovery and guardian modules for years. A perps venue holding delegated stake has no equivalent.
What Comes Next
The proposal now on the table is an opt-in Guardian: a pre-configured party that can temporarily halt cWithdraw, transfers, agent approvals and multisig changes, but can never move funds. Holds expire automatically. Replacement requires a timelock and validator-governed review, recorded on-chain.
Expect pushback on censorship grounds, and expect it to be raised anyway once the fourth victim appears.
Conclusion
This is not a protocol exploit. Hyperliquid’s code did exactly what it was written to do. That is precisely the problem: a week-long delay that only benefits the thief is a design gap, not a security feature. Until account-level recovery becomes standard, every staked balance on a high-value venue is a one-key-away loss.
This post Alarming Hyperliquid Hack: $738,600 USDC Drained From User Account first appeared on BitcoinWorld.
Key Takeaways
A Hyperliquid user account was compromised on September 9, drained of roughly 738,600 USDC, with 10,287 HYPE forcibly undelegated.
Tracing shows the stolen stablecoins moved through Circle’s CCTP bridge and split across at least five hops before touching a Bitget-linked deposit address.
The staked HYPE has not entered the withdrawal queue yet, meaning the theft is only partially complete.
Two comparable cases handled recently ended the same way, pushing cumulative losses in this pattern past $1.1 million.
The Real Story Is Not the Theft. It Is the Seven Days Nobody Can Use.
Account takeovers happen weekly in crypto. What makes this one worth your attention is the part that has not happened yet.
When the attacker took control of 0x5b6d236e39a4723a8f79db93cfd1af4d228f9c60, the liquid balance went first, as it always does. The 10,287 HYPE sitting in staking is a different problem. Hyperliquid’s unstaking flow imposes a seven-day waiting period before a cWithdraw releases funds. On paper, that is a full week of warning. In practice, the victim can do absolutely nothing with it. There is no user-triggered pause, no freeze, no recovery path. The owner watches a countdown they cannot stop.
Timeline
Compromise: Unauthorized access to the account, most likely through a leaked private key or an approved signing agent.
Immediate drain: ~738,600 USDC transferred out.
Undelegation: 10,287 HYPE pulled out of delegation, positioning it for withdrawal.
Laundering: Funds routed via Circle’s CCTP bridge, then fragmented into tranches of roughly 443K, 450K, 147.5K, 147.8K and 50K across a chain of intermediary wallets.
Off-ramp: A portion lands at an address attributed to Bitget.
Now: HYPE remains in the staking balance, withdrawal not yet initiated.
What an Analyst Sees Here
The CCTP hop is deliberate. Native burn-and-mint transfers produce cleaner, harder-to-cluster flows than wrapped bridge assets, and the rapid fan-out into unequal amounts is textbook peel-chain behaviour designed to defeat automated tracing thresholds. The speed to a centralised exchange also tells you something: the attacker is betting on beating the compliance desk’s response window, not on sophisticated obfuscation.
The structural issue is that Hyperliquid inherits self-custody’s absolutism while offering an exchange-grade product. Ethereum’s smart accounts have had social recovery and guardian modules for years. A perps venue holding delegated stake has no equivalent.
What Comes Next
The proposal now on the table is an opt-in Guardian: a pre-configured party that can temporarily halt cWithdraw, transfers, agent approvals and multisig changes, but can never move funds. Holds expire automatically. Replacement requires a timelock and validator-governed review, recorded on-chain.
Expect pushback on censorship grounds, and expect it to be raised anyway once the fourth victim appears.
Conclusion
This is not a protocol exploit. Hyperliquid’s code did exactly what it was written to do. That is precisely the problem: a week-long delay that only benefits the thief is a design gap, not a security feature. Until account-level recovery becomes standard, every staked balance on a high-value venue is a one-key-away loss.
This post Alarming Hyperliquid Hack: $738,600 USDC Drained From User Account first appeared on BitcoinWorld.
1
437
·
--
Article
Germany’s Crypto Tax-Free Rule Is Coming to an EndBitcoinWorldGermany’s Crypto Tax-Free Rule Is Coming to an End
Key Takeaways
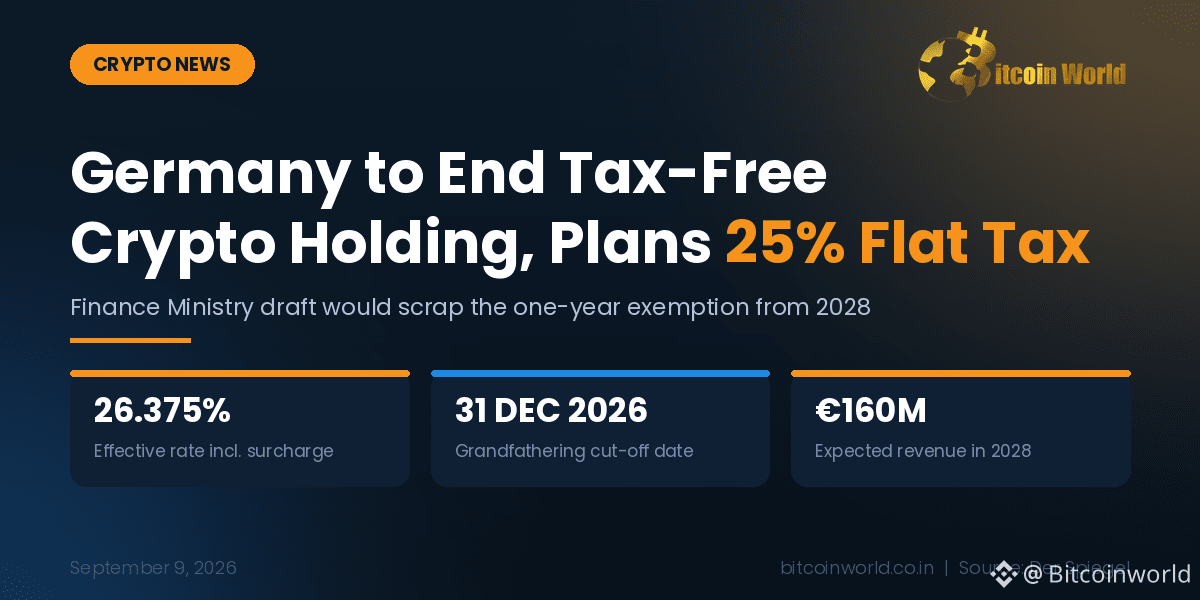
Germany’s Finance Ministry has circulated a draft bill that would scrap the one-year tax-free holding rule and tax crypto gains as capital income from 2028.
The headline says 25%. The real number is 26.375% once the solidarity surcharge is added – closer to 28% with church tax.
The draft grandfathers anything bought on or before December 31, 2026. Buy before New Year’s Eve and the old rules still apply.
Expected revenue: €160 million in 2028, rising to about €350 million by 2031. Against a federal budget north of €555 billion.
For years, Germany had one line in its tax code that quietly made it one of the best places in the developed world to hold Bitcoin. Section 23 of the Income Tax Act treats crypto as a private asset, not a security. Hold it for more than twelve months, sell it, pay nothing. No cap, no tapering, no conditions.
That line is now on the chopping block.
What’s Actually in the Draft
Der Spiegel obtained a working draft from the Federal Ministry of Finance that would move crypto out of Section 23 and into Section 20 – the bucket that holds interest, dividends and stock gains. Once there, gains face the Abgeltungsteuer, Germany’s flat withholding tax on capital income.
The rate everyone is quoting is 25%. That’s the base. Add the 5.5% solidarity surcharge levied on the tax itself and you get 26.375%. Church tax, where applicable, pushes the effective burden toward 28% depending on the federal state.
Two things soften the blow. The €1,000 personal allowance survives. And – genuinely useful – crypto gains and losses could be offset against gains and losses from stocks and other securities. Under the current Section 23 regime, crypto losses can only be netted against other private disposals, which is a far narrower box. Anyone whose personal rate sits below 25% can also request a Günstigerprüfung, an assessment that applies the lower personal rate instead.
The cut-off matters most. As the draft stands, assets acquired on or before December 31, 2026 stay under the old rules. Hold twelve months, sell tax-free. Only crypto bought after that date falls into the new regime.
The Timeline
April 2025 – The SPD pushes to scrap the holding period during coalition negotiations, and wants the flat rate raised to 30%. CDU/CSU blocks it.
May 2025 – The proposal is dropped from the coalition agreement that brings the Merz government to power.
April 29, 2026 – Finance Minister Lars Klingbeil, now SPD chair, revives the plan under new framing, tied to a package meant to raise €2 billion and tighten enforcement against financial crime.
Early July 2026 – A budget draft includes removal of the holding period. Cabinet approves the key points paper.
July 13, 2026 – The working draft of the Annual Tax Act 2026 contains nothing on crypto. Nothing legally binding exists yet.
September 9, 2026 – Der Spiegel reports the ministerial draft bill. For the first time there are numbers, a rate, and a cut-off date. It enters interdepartmental consultation.
Ahead – Cabinet approval, three Bundestag readings, the Bundesrat, then the Federal Law Gazette. Any of those stages can change the rate, the cut-off, or kill it entirely.
The Number That Doesn’t Add Up
Here is the part worth sitting with. The ministry projects €160 million in 2028 from this measure. Germany’s federal budget runs past €555 billion.
That is roughly 0.03% of spending. Even at the 2031 figure of €350 million, it barely registers.
Germany is not doing this because it needs the money. €160 million doesn’t fix anything. It’s doing this because the exemption became politically awkward – a rule that let one asset class walk away untaxed while wage earners paid up to 45%. The SPD has framed it as parity, and on paper, parity is a fair argument. Crypto now gets treated exactly like stocks, with the same rate and the same loss-offsetting rights.
But parity cuts both ways. Germany’s holding period wasn’t an accident or an oversight. It was a genuine competitive differentiator, one of the few things that made German exchanges and German-resident traders distinct in Europe. Trading that for a rounding error is a choice, not a necessity.
Conclusion
Nothing is law yet. A ministerial draft in interdepartmental consultation is several long steps from the Federal Law Gazette, and this exact proposal has already died once, in 2025.
This post Germany’s Crypto Tax-Free Rule Is Coming to an End first appeared on BitcoinWorld.
Germany’s Crypto Tax-Free Rule Is Coming to an End
BitcoinWorldGermany’s Crypto Tax-Free Rule Is Coming to an End
Key Takeaways
Germany’s Finance Ministry has circulated a draft bill that would scrap the one-year tax-free holding rule and tax crypto gains as capital income from 2028.
The headline says 25%. The real number is 26.375% once the solidarity surcharge is added – closer to 28% with church tax.
The draft grandfathers anything bought on or before December 31, 2026. Buy before New Year’s Eve and the old rules still apply.
Expected revenue: €160 million in 2028, rising to about €350 million by 2031. Against a federal budget north of €555 billion.
For years, Germany had one line in its tax code that quietly made it one of the best places in the developed world to hold Bitcoin. Section 23 of the Income Tax Act treats crypto as a private asset, not a security. Hold it for more than twelve months, sell it, pay nothing. No cap, no tapering, no conditions.
That line is now on the chopping block.
What’s Actually in the Draft
Der Spiegel obtained a working draft from the Federal Ministry of Finance that would move crypto out of Section 23 and into Section 20 – the bucket that holds interest, dividends and stock gains. Once there, gains face the Abgeltungsteuer, Germany’s flat withholding tax on capital income.
The rate everyone is quoting is 25%. That’s the base. Add the 5.5% solidarity surcharge levied on the tax itself and you get 26.375%. Church tax, where applicable, pushes the effective burden toward 28% depending on the federal state.
Two things soften the blow. The €1,000 personal allowance survives. And – genuinely useful – crypto gains and losses could be offset against gains and losses from stocks and other securities. Under the current Section 23 regime, crypto losses can only be netted against other private disposals, which is a far narrower box. Anyone whose personal rate sits below 25% can also request a Günstigerprüfung, an assessment that applies the lower personal rate instead.
The cut-off matters most. As the draft stands, assets acquired on or before December 31, 2026 stay under the old rules. Hold twelve months, sell tax-free. Only crypto bought after that date falls into the new regime.
The Timeline
April 2025 – The SPD pushes to scrap the holding period during coalition negotiations, and wants the flat rate raised to 30%. CDU/CSU blocks it.
May 2025 – The proposal is dropped from the coalition agreement that brings the Merz government to power.
April 29, 2026 – Finance Minister Lars Klingbeil, now SPD chair, revives the plan under new framing, tied to a package meant to raise €2 billion and tighten enforcement against financial crime.
Early July 2026 – A budget draft includes removal of the holding period. Cabinet approves the key points paper.
July 13, 2026 – The working draft of the Annual Tax Act 2026 contains nothing on crypto. Nothing legally binding exists yet.
September 9, 2026 – Der Spiegel reports the ministerial draft bill. For the first time there are numbers, a rate, and a cut-off date. It enters interdepartmental consultation.
Ahead – Cabinet approval, three Bundestag readings, the Bundesrat, then the Federal Law Gazette. Any of those stages can change the rate, the cut-off, or kill it entirely.
The Number That Doesn’t Add Up
Here is the part worth sitting with. The ministry projects €160 million in 2028 from this measure. Germany’s federal budget runs past €555 billion.
That is roughly 0.03% of spending. Even at the 2031 figure of €350 million, it barely registers.
Germany is not doing this because it needs the money. €160 million doesn’t fix anything. It’s doing this because the exemption became politically awkward – a rule that let one asset class walk away untaxed while wage earners paid up to 45%. The SPD has framed it as parity, and on paper, parity is a fair argument. Crypto now gets treated exactly like stocks, with the same rate and the same loss-offsetting rights.
But parity cuts both ways. Germany’s holding period wasn’t an accident or an oversight. It was a genuine competitive differentiator, one of the few things that made German exchanges and German-resident traders distinct in Europe. Trading that for a rounding error is a choice, not a necessity.
Conclusion
Nothing is law yet. A ministerial draft in interdepartmental consultation is several long steps from the Federal Law Gazette, and this exact proposal has already died once, in 2025.
This post Germany’s Crypto Tax-Free Rule Is Coming to an End first appeared on BitcoinWorld.
Key Takeaways
Germany’s Finance Ministry has circulated a draft bill that would scrap the one-year tax-free holding rule and tax crypto gains as capital income from 2028.
The headline says 25%. The real number is 26.375% once the solidarity surcharge is added – closer to 28% with church tax.
The draft grandfathers anything bought on or before December 31, 2026. Buy before New Year’s Eve and the old rules still apply.
Expected revenue: €160 million in 2028, rising to about €350 million by 2031. Against a federal budget north of €555 billion.
For years, Germany had one line in its tax code that quietly made it one of the best places in the developed world to hold Bitcoin. Section 23 of the Income Tax Act treats crypto as a private asset, not a security. Hold it for more than twelve months, sell it, pay nothing. No cap, no tapering, no conditions.
That line is now on the chopping block.
What’s Actually in the Draft
Der Spiegel obtained a working draft from the Federal Ministry of Finance that would move crypto out of Section 23 and into Section 20 – the bucket that holds interest, dividends and stock gains. Once there, gains face the Abgeltungsteuer, Germany’s flat withholding tax on capital income.
The rate everyone is quoting is 25%. That’s the base. Add the 5.5% solidarity surcharge levied on the tax itself and you get 26.375%. Church tax, where applicable, pushes the effective burden toward 28% depending on the federal state.
Two things soften the blow. The €1,000 personal allowance survives. And – genuinely useful – crypto gains and losses could be offset against gains and losses from stocks and other securities. Under the current Section 23 regime, crypto losses can only be netted against other private disposals, which is a far narrower box. Anyone whose personal rate sits below 25% can also request a Günstigerprüfung, an assessment that applies the lower personal rate instead.
The cut-off matters most. As the draft stands, assets acquired on or before December 31, 2026 stay under the old rules. Hold twelve months, sell tax-free. Only crypto bought after that date falls into the new regime.
The Timeline
April 2025 – The SPD pushes to scrap the holding period during coalition negotiations, and wants the flat rate raised to 30%. CDU/CSU blocks it.
May 2025 – The proposal is dropped from the coalition agreement that brings the Merz government to power.
April 29, 2026 – Finance Minister Lars Klingbeil, now SPD chair, revives the plan under new framing, tied to a package meant to raise €2 billion and tighten enforcement against financial crime.
Early July 2026 – A budget draft includes removal of the holding period. Cabinet approves the key points paper.
July 13, 2026 – The working draft of the Annual Tax Act 2026 contains nothing on crypto. Nothing legally binding exists yet.
September 9, 2026 – Der Spiegel reports the ministerial draft bill. For the first time there are numbers, a rate, and a cut-off date. It enters interdepartmental consultation.
Ahead – Cabinet approval, three Bundestag readings, the Bundesrat, then the Federal Law Gazette. Any of those stages can change the rate, the cut-off, or kill it entirely.
The Number That Doesn’t Add Up
Here is the part worth sitting with. The ministry projects €160 million in 2028 from this measure. Germany’s federal budget runs past €555 billion.
That is roughly 0.03% of spending. Even at the 2031 figure of €350 million, it barely registers.
Germany is not doing this because it needs the money. €160 million doesn’t fix anything. It’s doing this because the exemption became politically awkward – a rule that let one asset class walk away untaxed while wage earners paid up to 45%. The SPD has framed it as parity, and on paper, parity is a fair argument. Crypto now gets treated exactly like stocks, with the same rate and the same loss-offsetting rights.
But parity cuts both ways. Germany’s holding period wasn’t an accident or an oversight. It was a genuine competitive differentiator, one of the few things that made German exchanges and German-resident traders distinct in Europe. Trading that for a rounding error is a choice, not a necessity.
Conclusion
Nothing is law yet. A ministerial draft in interdepartmental consultation is several long steps from the Federal Law Gazette, and this exact proposal has already died once, in 2025.
This post Germany’s Crypto Tax-Free Rule Is Coming to an End first appeared on BitcoinWorld.
51
·
--

Article
PinGo Hit By Second Cyberattack – and Nobody Ever Explained the First OneBitcoinWorldPinGo Hit by Second Cyberattack – and Nobody Ever Explained the First One
Key Takeaways
PinGo, the AI + DePIN project on the TON network, has confirmed another cyberattack. Some stolen tokens have already been sold into the market by the attacker.
The team says it consolidated and isolated its remaining on-chain assets. It has not disclosed the loss size, the attack vector, or whether user funds were touched.
PINGO’s daily volume sits near $15,000. On a book that thin, even a small dump does real damage – the dollar figure may end up mattering less than the liquidity.
The most important word in PinGo’s statement is “another.”
On September 9, 2026, the project told its community it had suffered a fresh cyberattack. It said it moved fast, pulled the remaining on-chain assets together, and locked them away. Internal response procedures are running. Details on the scale of the losses, it said, are coming soon.
That is a reasonable first hour. It is not an answer.
A Second Hack Is a Different Kind of Problem
One breach can happen to anyone. A clever attacker, a missed bug, a bad afternoon. A second breach at the same project usually means one of two things: the original entry point was never closed, or the team never worked out how the attacker got in to begin with.
Here’s what makes it worse. There is no public record of PinGo’s first incident. No PeckShield log, no SlowMist entry, no detailed post-mortem you can pull up and read. The team’s own statement is the only acknowledgement that it happened at all.
If a project can be breached without the market noticing, the next breach isn’t a surprise. It’s a sequel.
The Timeline
2024–early 2025 – PinGo launches as the first AI + DePIN project on TON, pitching a marketplace that turns idle computing power into a resource for training AI models.
September 2025 – PINGO runs a pre-listing Kickstarter on MEXC, with 120,000 PINGO and 30,000 USDT in airdrops. The token reaches retail. Listings follow on Gate, CoinEx and Bitget Wallet.
April 2026 – PinGo announces a partnership with Manadia to add a distributed compute layer, pushing further into decentralised AI infrastructure.
First attack – date not publicly confirmed. No loss figure, no cause, no independent reporting. It exists only as a reference in PinGo’s own words.
September 9, 2026 – Second attack confirmed. Assets isolated. Attacker already selling. Full details promised.
How Much Was Lost?
Nobody has said. No security firm has published a number.
What the market data tells us is arguably more useful for holders. PINGO’s market cap sits somewhere around $6 million to $7.5 million. The token trades roughly 93% below its all-time high of $0.4025. Daily volume is around $15,000–$16,000 on CoinGecko, and price feeds across trackers currently disagree – anywhere from $0.02 to $0.06 – which suggests stale or thin data.
That last point is the one that matters. When an attacker sells into a book this shallow, the dollar value of the theft becomes almost irrelevant. Even a modest dump moves the price hard. Retail holders absorb that regardless of what the team eventually recovers.
The Pattern Behind It
PinGo isn’t an outlier. It’s a symptom of how crypto security broke this year.
CertiK’s Hack3d report counted $1.31 billion stolen across 344 on-chain incidents in the first half of 2026. The two largest heists – KelpDAO at $291 million and Drift Protocol at $285 million, roughly $577 million combined – never touched a line of audited contract code. Compromised accounts now cause more than half of all DeFi attacks by incident count, overtaking smart contract exploits for the first time.
Across the industry’s entire history, about 40% of the $16.69 billion ever stolen traces back to compromised private keys, not clever code.
That reframes PinGo’s response. “We isolated the assets” only helps if the problem was where the money sat. If the entry point was a leaked deployment key or a phished developer, then moving funds to a fresh wallet fixes nothing. The vulnerability still has a laptop and a login.
Conclusion
PinGo did the right things in the first hour – move fast, contain, communicate. What it still hasn’t done is explain how this happened twice, or what happened the first time at all.
Until a proper post-mortem lands, “secure isolation” is a phrase, not a fix. And in a year where over a billion dollars walked out through stolen keys rather than broken code, the question isn’t whether the assets are somewhere safer. It’s whether the person holding them is.
This post PinGo Hit by Second Cyberattack – and Nobody Ever Explained the First One first appeared on BitcoinWorld.
PinGo Hit By Second Cyberattack – and Nobody Ever Explained the First One
BitcoinWorldPinGo Hit by Second Cyberattack – and Nobody Ever Explained the First One
Key Takeaways
PinGo, the AI + DePIN project on the TON network, has confirmed another cyberattack. Some stolen tokens have already been sold into the market by the attacker.
The team says it consolidated and isolated its remaining on-chain assets. It has not disclosed the loss size, the attack vector, or whether user funds were touched.
PINGO’s daily volume sits near $15,000. On a book that thin, even a small dump does real damage – the dollar figure may end up mattering less than the liquidity.
The most important word in PinGo’s statement is “another.”
On September 9, 2026, the project told its community it had suffered a fresh cyberattack. It said it moved fast, pulled the remaining on-chain assets together, and locked them away. Internal response procedures are running. Details on the scale of the losses, it said, are coming soon.
That is a reasonable first hour. It is not an answer.
A Second Hack Is a Different Kind of Problem
One breach can happen to anyone. A clever attacker, a missed bug, a bad afternoon. A second breach at the same project usually means one of two things: the original entry point was never closed, or the team never worked out how the attacker got in to begin with.
Here’s what makes it worse. There is no public record of PinGo’s first incident. No PeckShield log, no SlowMist entry, no detailed post-mortem you can pull up and read. The team’s own statement is the only acknowledgement that it happened at all.
If a project can be breached without the market noticing, the next breach isn’t a surprise. It’s a sequel.
The Timeline
2024–early 2025 – PinGo launches as the first AI + DePIN project on TON, pitching a marketplace that turns idle computing power into a resource for training AI models.
September 2025 – PINGO runs a pre-listing Kickstarter on MEXC, with 120,000 PINGO and 30,000 USDT in airdrops. The token reaches retail. Listings follow on Gate, CoinEx and Bitget Wallet.
April 2026 – PinGo announces a partnership with Manadia to add a distributed compute layer, pushing further into decentralised AI infrastructure.
First attack – date not publicly confirmed. No loss figure, no cause, no independent reporting. It exists only as a reference in PinGo’s own words.
September 9, 2026 – Second attack confirmed. Assets isolated. Attacker already selling. Full details promised.
How Much Was Lost?
Nobody has said. No security firm has published a number.
What the market data tells us is arguably more useful for holders. PINGO’s market cap sits somewhere around $6 million to $7.5 million. The token trades roughly 93% below its all-time high of $0.4025. Daily volume is around $15,000–$16,000 on CoinGecko, and price feeds across trackers currently disagree – anywhere from $0.02 to $0.06 – which suggests stale or thin data.
That last point is the one that matters. When an attacker sells into a book this shallow, the dollar value of the theft becomes almost irrelevant. Even a modest dump moves the price hard. Retail holders absorb that regardless of what the team eventually recovers.
The Pattern Behind It
PinGo isn’t an outlier. It’s a symptom of how crypto security broke this year.
CertiK’s Hack3d report counted $1.31 billion stolen across 344 on-chain incidents in the first half of 2026. The two largest heists – KelpDAO at $291 million and Drift Protocol at $285 million, roughly $577 million combined – never touched a line of audited contract code. Compromised accounts now cause more than half of all DeFi attacks by incident count, overtaking smart contract exploits for the first time.
Across the industry’s entire history, about 40% of the $16.69 billion ever stolen traces back to compromised private keys, not clever code.
That reframes PinGo’s response. “We isolated the assets” only helps if the problem was where the money sat. If the entry point was a leaked deployment key or a phished developer, then moving funds to a fresh wallet fixes nothing. The vulnerability still has a laptop and a login.
Conclusion
PinGo did the right things in the first hour – move fast, contain, communicate. What it still hasn’t done is explain how this happened twice, or what happened the first time at all.
Until a proper post-mortem lands, “secure isolation” is a phrase, not a fix. And in a year where over a billion dollars walked out through stolen keys rather than broken code, the question isn’t whether the assets are somewhere safer. It’s whether the person holding them is.
This post PinGo Hit by Second Cyberattack – and Nobody Ever Explained the First One first appeared on BitcoinWorld.
Key Takeaways
PinGo, the AI + DePIN project on the TON network, has confirmed another cyberattack. Some stolen tokens have already been sold into the market by the attacker.
The team says it consolidated and isolated its remaining on-chain assets. It has not disclosed the loss size, the attack vector, or whether user funds were touched.
PINGO’s daily volume sits near $15,000. On a book that thin, even a small dump does real damage – the dollar figure may end up mattering less than the liquidity.
The most important word in PinGo’s statement is “another.”
On September 9, 2026, the project told its community it had suffered a fresh cyberattack. It said it moved fast, pulled the remaining on-chain assets together, and locked them away. Internal response procedures are running. Details on the scale of the losses, it said, are coming soon.
That is a reasonable first hour. It is not an answer.
A Second Hack Is a Different Kind of Problem
One breach can happen to anyone. A clever attacker, a missed bug, a bad afternoon. A second breach at the same project usually means one of two things: the original entry point was never closed, or the team never worked out how the attacker got in to begin with.
Here’s what makes it worse. There is no public record of PinGo’s first incident. No PeckShield log, no SlowMist entry, no detailed post-mortem you can pull up and read. The team’s own statement is the only acknowledgement that it happened at all.
If a project can be breached without the market noticing, the next breach isn’t a surprise. It’s a sequel.
The Timeline
2024–early 2025 – PinGo launches as the first AI + DePIN project on TON, pitching a marketplace that turns idle computing power into a resource for training AI models.
September 2025 – PINGO runs a pre-listing Kickstarter on MEXC, with 120,000 PINGO and 30,000 USDT in airdrops. The token reaches retail. Listings follow on Gate, CoinEx and Bitget Wallet.
April 2026 – PinGo announces a partnership with Manadia to add a distributed compute layer, pushing further into decentralised AI infrastructure.
First attack – date not publicly confirmed. No loss figure, no cause, no independent reporting. It exists only as a reference in PinGo’s own words.
September 9, 2026 – Second attack confirmed. Assets isolated. Attacker already selling. Full details promised.
How Much Was Lost?
Nobody has said. No security firm has published a number.
What the market data tells us is arguably more useful for holders. PINGO’s market cap sits somewhere around $6 million to $7.5 million. The token trades roughly 93% below its all-time high of $0.4025. Daily volume is around $15,000–$16,000 on CoinGecko, and price feeds across trackers currently disagree – anywhere from $0.02 to $0.06 – which suggests stale or thin data.
That last point is the one that matters. When an attacker sells into a book this shallow, the dollar value of the theft becomes almost irrelevant. Even a modest dump moves the price hard. Retail holders absorb that regardless of what the team eventually recovers.
The Pattern Behind It
PinGo isn’t an outlier. It’s a symptom of how crypto security broke this year.
CertiK’s Hack3d report counted $1.31 billion stolen across 344 on-chain incidents in the first half of 2026. The two largest heists – KelpDAO at $291 million and Drift Protocol at $285 million, roughly $577 million combined – never touched a line of audited contract code. Compromised accounts now cause more than half of all DeFi attacks by incident count, overtaking smart contract exploits for the first time.
Across the industry’s entire history, about 40% of the $16.69 billion ever stolen traces back to compromised private keys, not clever code.
That reframes PinGo’s response. “We isolated the assets” only helps if the problem was where the money sat. If the entry point was a leaked deployment key or a phished developer, then moving funds to a fresh wallet fixes nothing. The vulnerability still has a laptop and a login.
Conclusion
PinGo did the right things in the first hour – move fast, contain, communicate. What it still hasn’t done is explain how this happened twice, or what happened the first time at all.
Until a proper post-mortem lands, “secure isolation” is a phrase, not a fix. And in a year where over a billion dollars walked out through stolen keys rather than broken code, the question isn’t whether the assets are somewhere safer. It’s whether the person holding them is.
This post PinGo Hit by Second Cyberattack – and Nobody Ever Explained the First One first appeared on BitcoinWorld.
75
·
--
Article
Why September 16 Matters So Much to India’s Crypto CommunityBitcoinWorldWhy September 16 Matters So Much to India’s Crypto Community
Key Takeaways
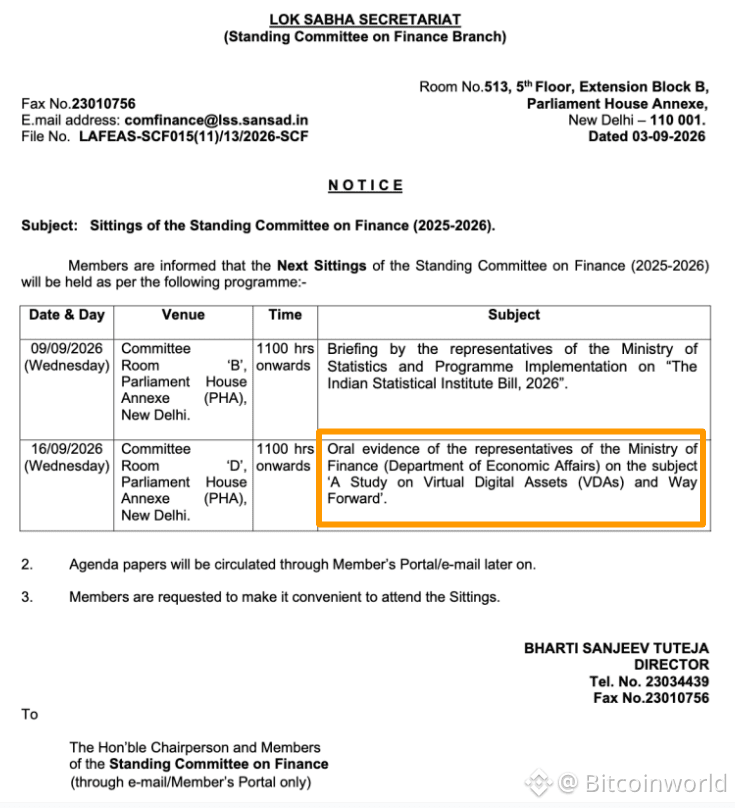
The Finance Ministry’s Department of Economic Affairs (DEA) will appear before the Parliamentary Standing Committee on Finance on September 16, 2026, at 11 AM, Committee Room D, Parliament House Annexe.
About 91.5% of India’s crypto trading volume in FY2024-25 went to offshore exchanges. Only 8.5% stayed home.
No new law is coming out of this meeting. What we’re actually waiting for is a name – who regulates crypto, and what crypto legally is.
Everyone is calling September 16 a “big clarity moment.” Let’s be honest about what it really is. The DEA is going to sit in front of MPs and explain a tax system that has been running for four years – one that collected less money than expected and pushed most of the market somewhere the taxman can’t reach.
The numbers say it plainly. When 91.5% of trading happens abroad and only 8.5% stays on FIU-registered Indian exchanges, the 1% TDS didn’t fail. It worked too well as a deterrent. It was supposed to create a paper trail. Instead, people simply went where no trail gets created.
The Full Timeline
April 2018 – RBI tells banks to cut off crypto firms. Exchanges struggle to survive.
March 2020 – Supreme Court strikes down the RBI circular. Banking access returns.
July 1, 2022 – Section 115BBH (30% flat tax) and Section 194S (1% TDS) kick in. No loss set-off allowed.
March 2023 – VDA service providers brought under PMLA anti-money-laundering rules.
2024 – FIU acts against unregistered offshore platforms. Several later register and continue serving Indians.
August 14, 2024 – Standing Committee formally takes up “A Study on Virtual Digital Assets (VDAs) and Way Forward.”
Through 2025-26 – Exchanges (Binance, WazirX, ZebPay, CoinDCX, CoinSwitch, Coinbase), FIU, CBDT, MCA and IFSCA all depose. By mid-2026, 54 VDA providers are FIU-registered.
May 20, 2026 – Committee Chairman Bhartruhari Mahtab calls the outflow of thousands of crores “very alarming.”
July 2, 2026 – RBI and ICAI depose. RBI stays opposed to legal status. ICAI pushes for proper accounting and legal clarity.
August 20, 2026 – Lok Sabha Secretariat notice: the August 27 DEA sitting “stands CANCELLED.” No new date.
September 3, 2026 – Fresh notice fixes the DEA hearing for September 16.
What X Is Saying
The industry conversation is mostly happening on X, not in press releases. Worth following:
Bharat Web3 Association – the loudest voice asking for TDS to drop to 0.01% and loss set-off to be allowed.
Sumit Gupta, CoinDCX CEO – his post on India ranking #1 in grassroots adoption sums up the industry’s core argument: users are here, the rules aren’t.
The Part Nobody Wants To Own
The real problem isn’t tax. It’s turf. Until someone says clearly whether a token is a security, a commodity, or its own thing, no regulator has to take charge. SEBI, RBI and the ministry all quietly benefit from the confusion.
The committee’s own idea – an interim setup run through Self-Regulatory Organisations under a designated regulator – tells you everything. Governments suggest SROs when they want supervision without doing the hard work of writing a law. It’s a placeholder. And placeholders in Indian finance tend to stick around for years.
Conclusion
India built the enforcement machinery first and never got around to the definitions. The 91.5% figure is the receipt for that choice. September 16 won’t fix it. But it will tell us whether the government has finally accepted the bill.
This post Why September 16 Matters So Much to India’s Crypto Community first appeared on BitcoinWorld.
Why September 16 Matters So Much to India’s Crypto Community
BitcoinWorldWhy September 16 Matters So Much to India’s Crypto Community
Key Takeaways
The Finance Ministry’s Department of Economic Affairs (DEA) will appear before the Parliamentary Standing Committee on Finance on September 16, 2026, at 11 AM, Committee Room D, Parliament House Annexe.
About 91.5% of India’s crypto trading volume in FY2024-25 went to offshore exchanges. Only 8.5% stayed home.
No new law is coming out of this meeting. What we’re actually waiting for is a name – who regulates crypto, and what crypto legally is.
Everyone is calling September 16 a “big clarity moment.” Let’s be honest about what it really is. The DEA is going to sit in front of MPs and explain a tax system that has been running for four years – one that collected less money than expected and pushed most of the market somewhere the taxman can’t reach.
The numbers say it plainly. When 91.5% of trading happens abroad and only 8.5% stays on FIU-registered Indian exchanges, the 1% TDS didn’t fail. It worked too well as a deterrent. It was supposed to create a paper trail. Instead, people simply went where no trail gets created.
The Full Timeline
April 2018 – RBI tells banks to cut off crypto firms. Exchanges struggle to survive.
March 2020 – Supreme Court strikes down the RBI circular. Banking access returns.
July 1, 2022 – Section 115BBH (30% flat tax) and Section 194S (1% TDS) kick in. No loss set-off allowed.
March 2023 – VDA service providers brought under PMLA anti-money-laundering rules.
2024 – FIU acts against unregistered offshore platforms. Several later register and continue serving Indians.
August 14, 2024 – Standing Committee formally takes up “A Study on Virtual Digital Assets (VDAs) and Way Forward.”
Through 2025-26 – Exchanges (Binance, WazirX, ZebPay, CoinDCX, CoinSwitch, Coinbase), FIU, CBDT, MCA and IFSCA all depose. By mid-2026, 54 VDA providers are FIU-registered.
May 20, 2026 – Committee Chairman Bhartruhari Mahtab calls the outflow of thousands of crores “very alarming.”
July 2, 2026 – RBI and ICAI depose. RBI stays opposed to legal status. ICAI pushes for proper accounting and legal clarity.
August 20, 2026 – Lok Sabha Secretariat notice: the August 27 DEA sitting “stands CANCELLED.” No new date.
September 3, 2026 – Fresh notice fixes the DEA hearing for September 16.
What X Is Saying
The industry conversation is mostly happening on X, not in press releases. Worth following:
Bharat Web3 Association – the loudest voice asking for TDS to drop to 0.01% and loss set-off to be allowed.
Sumit Gupta, CoinDCX CEO – his post on India ranking #1 in grassroots adoption sums up the industry’s core argument: users are here, the rules aren’t.
The Part Nobody Wants To Own
The real problem isn’t tax. It’s turf. Until someone says clearly whether a token is a security, a commodity, or its own thing, no regulator has to take charge. SEBI, RBI and the ministry all quietly benefit from the confusion.
The committee’s own idea – an interim setup run through Self-Regulatory Organisations under a designated regulator – tells you everything. Governments suggest SROs when they want supervision without doing the hard work of writing a law. It’s a placeholder. And placeholders in Indian finance tend to stick around for years.
Conclusion
India built the enforcement machinery first and never got around to the definitions. The 91.5% figure is the receipt for that choice. September 16 won’t fix it. But it will tell us whether the government has finally accepted the bill.
This post Why September 16 Matters So Much to India’s Crypto Community first appeared on BitcoinWorld.
Key Takeaways
The Finance Ministry’s Department of Economic Affairs (DEA) will appear before the Parliamentary Standing Committee on Finance on September 16, 2026, at 11 AM, Committee Room D, Parliament House Annexe.
About 91.5% of India’s crypto trading volume in FY2024-25 went to offshore exchanges. Only 8.5% stayed home.
No new law is coming out of this meeting. What we’re actually waiting for is a name – who regulates crypto, and what crypto legally is.
Everyone is calling September 16 a “big clarity moment.” Let’s be honest about what it really is. The DEA is going to sit in front of MPs and explain a tax system that has been running for four years – one that collected less money than expected and pushed most of the market somewhere the taxman can’t reach.
The numbers say it plainly. When 91.5% of trading happens abroad and only 8.5% stays on FIU-registered Indian exchanges, the 1% TDS didn’t fail. It worked too well as a deterrent. It was supposed to create a paper trail. Instead, people simply went where no trail gets created.
The Full Timeline
April 2018 – RBI tells banks to cut off crypto firms. Exchanges struggle to survive.
March 2020 – Supreme Court strikes down the RBI circular. Banking access returns.
July 1, 2022 – Section 115BBH (30% flat tax) and Section 194S (1% TDS) kick in. No loss set-off allowed.
March 2023 – VDA service providers brought under PMLA anti-money-laundering rules.
2024 – FIU acts against unregistered offshore platforms. Several later register and continue serving Indians.
August 14, 2024 – Standing Committee formally takes up “A Study on Virtual Digital Assets (VDAs) and Way Forward.”
Through 2025-26 – Exchanges (Binance, WazirX, ZebPay, CoinDCX, CoinSwitch, Coinbase), FIU, CBDT, MCA and IFSCA all depose. By mid-2026, 54 VDA providers are FIU-registered.
May 20, 2026 – Committee Chairman Bhartruhari Mahtab calls the outflow of thousands of crores “very alarming.”
July 2, 2026 – RBI and ICAI depose. RBI stays opposed to legal status. ICAI pushes for proper accounting and legal clarity.
August 20, 2026 – Lok Sabha Secretariat notice: the August 27 DEA sitting “stands CANCELLED.” No new date.
September 3, 2026 – Fresh notice fixes the DEA hearing for September 16.
What X Is Saying
The industry conversation is mostly happening on X, not in press releases. Worth following:
Bharat Web3 Association – the loudest voice asking for TDS to drop to 0.01% and loss set-off to be allowed.
Sumit Gupta, CoinDCX CEO – his post on India ranking #1 in grassroots adoption sums up the industry’s core argument: users are here, the rules aren’t.
The Part Nobody Wants To Own
The real problem isn’t tax. It’s turf. Until someone says clearly whether a token is a security, a commodity, or its own thing, no regulator has to take charge. SEBI, RBI and the ministry all quietly benefit from the confusion.
The committee’s own idea – an interim setup run through Self-Regulatory Organisations under a designated regulator – tells you everything. Governments suggest SROs when they want supervision without doing the hard work of writing a law. It’s a placeholder. And placeholders in Indian finance tend to stick around for years.
Conclusion
India built the enforcement machinery first and never got around to the definitions. The 91.5% figure is the receipt for that choice. September 16 won’t fix it. But it will tell us whether the government has finally accepted the bill.
This post Why September 16 Matters So Much to India’s Crypto Community first appeared on BitcoinWorld.
95
·
--
Article
FIU-IND Has Served Non-compliance Notices on 15 OffshoreBitcoinWorldFIU-IND has served non-compliance notices on 15 offshore
Key takeaways
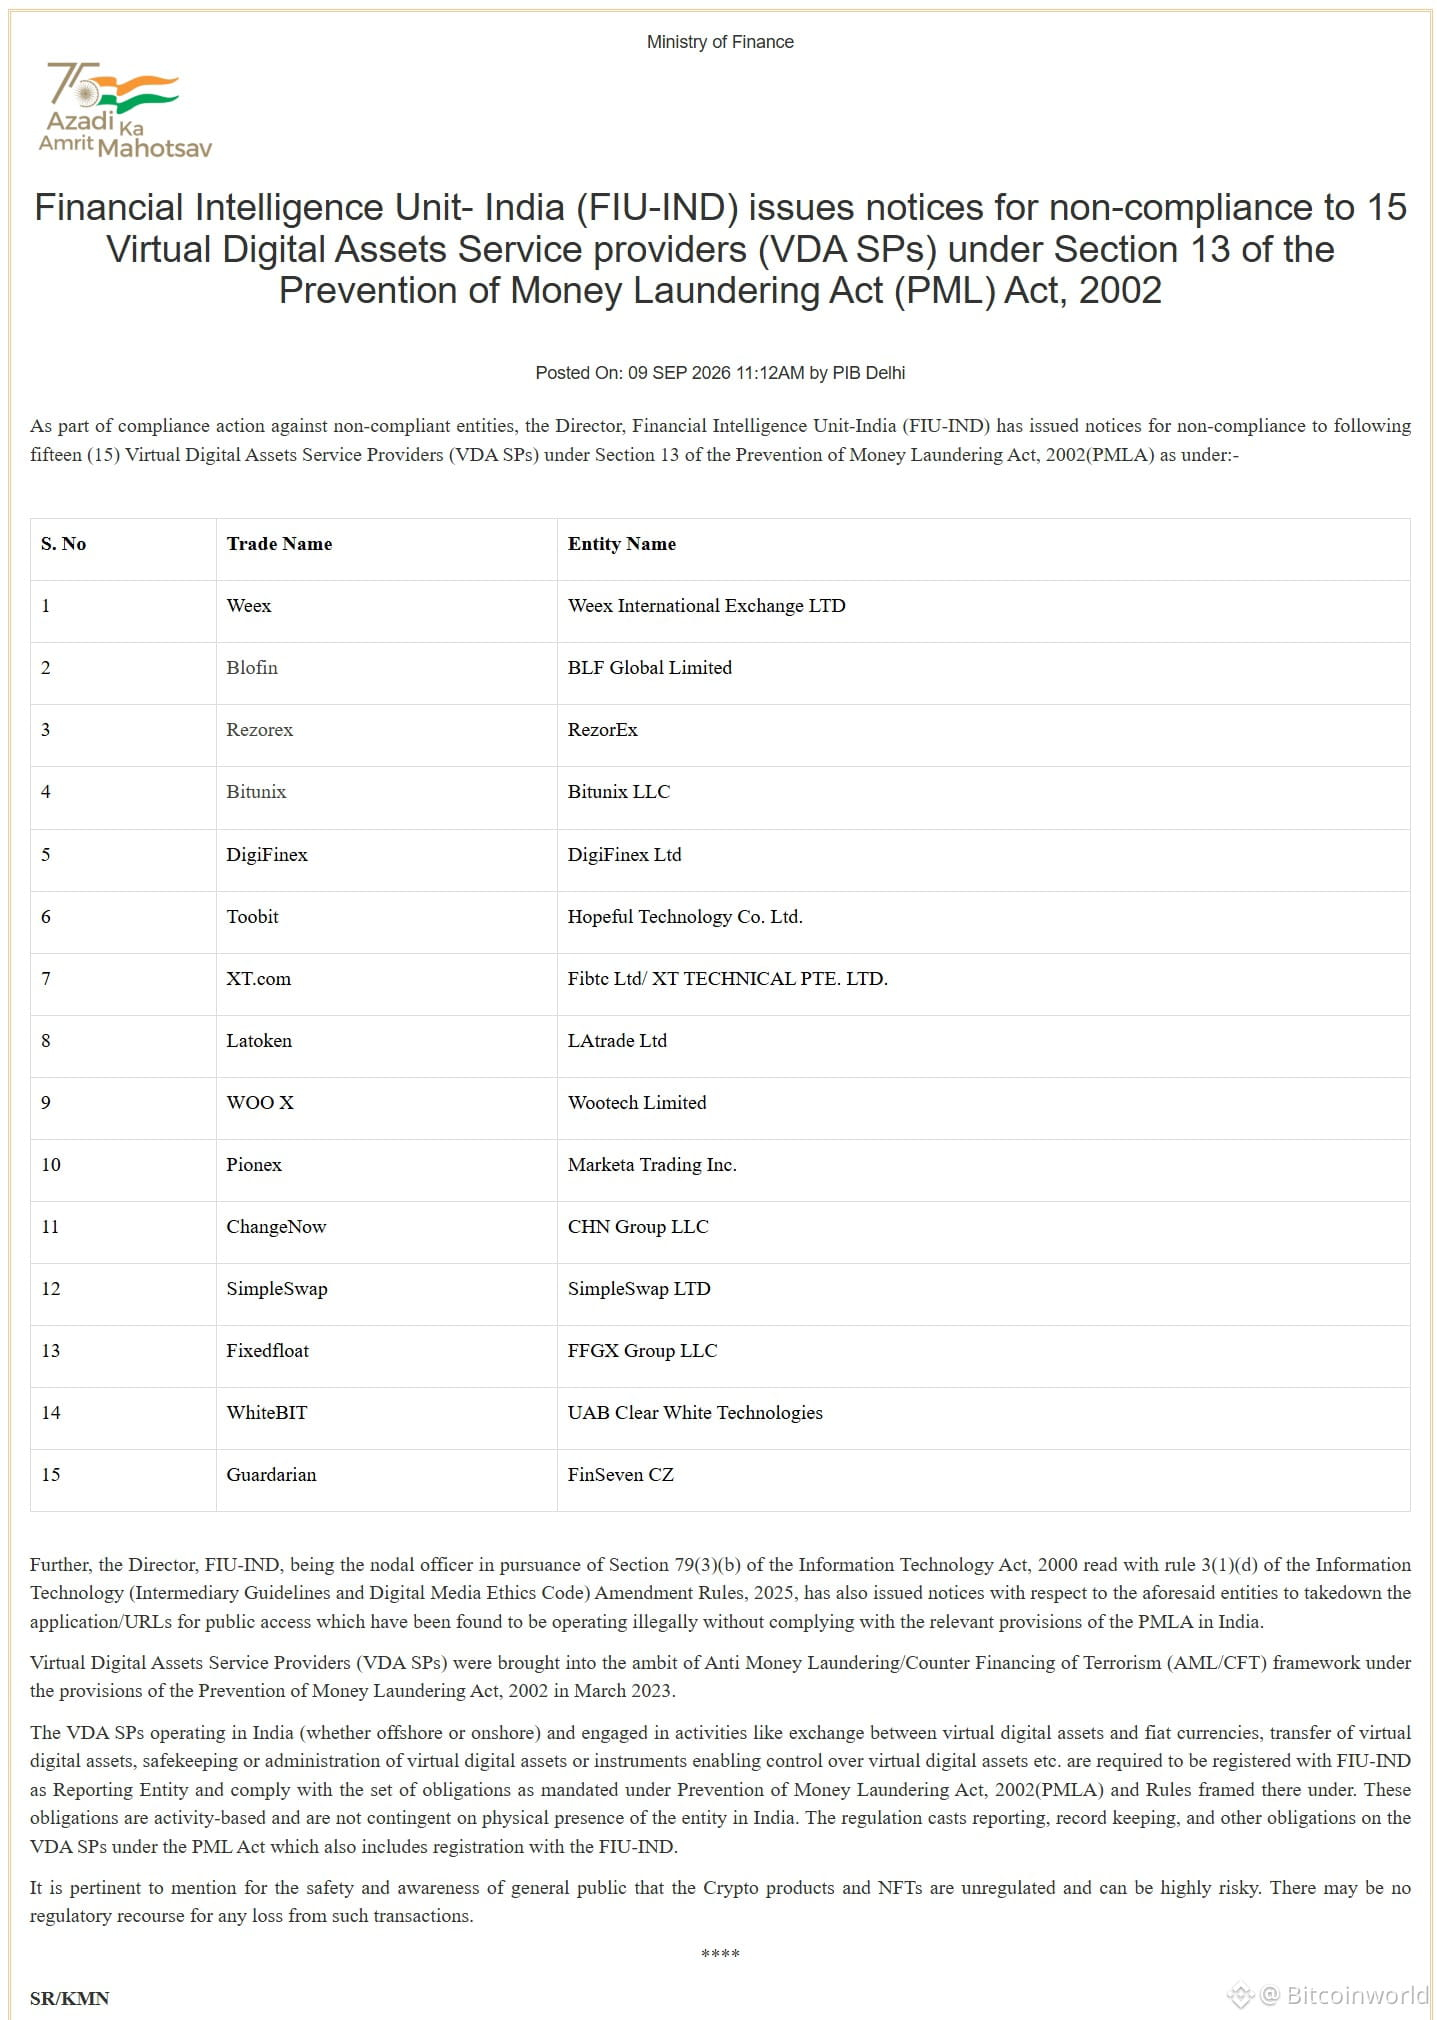
FIU-IND has served non-compliance notices on 15 offshore VDA service providers under Section 13 of the PMLA, alongside takedown notices under Section 79(3)(b) of the IT Act.
The list is unusual: alongside derivatives venues sit instant-swap and no-account conversion tools – ChangeNOW, SimpleSwap, FixedFloat, Guardarian.
India’s compliance test is activity-based. No office, no employees, no servers in India – still a reporting entity.
Expect app-store delistings and DNS-level blocks as the enforcement follow-through, as happened in 2024.
List Of Exchanges Are:
The previous sweeps read like a who’s-who of global exchanges. This one reads like a laundering-flow diagram.
Weex, Bitunix, Blofin, Toobit, XT.com, WOO X, Pionex and DigiFinex are recognisable trading venues, many of them high-leverage perpetuals platforms popular with Indian retail traders who found domestic options too slow or too taxed. But ChangeNOW, SimpleSwap, FixedFloat and Guardarian are not exchanges in the usual sense. They are conversion rails – swap one asset for another, often without an account, sometimes without meaningful KYC, and move on. Blockchain forensics firms have repeatedly traced funds from thefts and scam operations through exactly this category of service.
Reading the list that way, FIU-IND is no longer just policing where Indians trade. It is policing where stolen and defrauded rupees exit.
How we got here
March 2023 – VDA service providers are pulled into the PMLA’s AML/CFT perimeter. Registration becomes mandatory for exchange, transfer and custody activity.
December 2023 – Show-cause notices go to nine offshore exchanges, including Binance and KuCoin.
January 2024 – Apple and Google pull the non-compliant apps in India; URLs get blocked.
2024–25 – Binance and KuCoin pay penalties and register. Compliance, it turns out, is cheaper than exclusion.
September–October 2025 – A second wave hits 25 offshore platforms.
September 2026 – This round of 15, with takedown notices issued in parallel rather than months later.
The expert read
Two things stand out. First, the takedown notice arriving at the same time as the Section 13 notice is a procedural tightening – the 2024 gap gave platforms months to warn users and migrate them. Second, the registered-entity count keeps climbing, which is the actual policy objective. India is not trying to end offshore access; it is converting offshore operators into reporting entities that file suspicious transaction reports.
What comes next
Blocking is porous. VPN usage will absorb some of this, and peer-to-peer and self-custodial routes absorb the rest. The real consequence is liquidity migration toward registered platforms and a thinner, riskier grey market for everyone who stays offshore.
Conclusion
India has settled into a pattern: no ban, no embrace, just relentless perimeter enforcement. For platforms, the calculation is now simple – register, or get delisted and watch a competitor take the users. For traders, the finance ministry’s warning stands unchanged. Unregulated means no recourse.
This post FIU-IND has served non-compliance notices on 15 offshore first appeared on BitcoinWorld.
FIU-IND Has Served Non-compliance Notices on 15 Offshore
BitcoinWorldFIU-IND has served non-compliance notices on 15 offshore
Key takeaways
FIU-IND has served non-compliance notices on 15 offshore VDA service providers under Section 13 of the PMLA, alongside takedown notices under Section 79(3)(b) of the IT Act.
The list is unusual: alongside derivatives venues sit instant-swap and no-account conversion tools – ChangeNOW, SimpleSwap, FixedFloat, Guardarian.
India’s compliance test is activity-based. No office, no employees, no servers in India – still a reporting entity.
Expect app-store delistings and DNS-level blocks as the enforcement follow-through, as happened in 2024.
List Of Exchanges Are:
The previous sweeps read like a who’s-who of global exchanges. This one reads like a laundering-flow diagram.
Weex, Bitunix, Blofin, Toobit, XT.com, WOO X, Pionex and DigiFinex are recognisable trading venues, many of them high-leverage perpetuals platforms popular with Indian retail traders who found domestic options too slow or too taxed. But ChangeNOW, SimpleSwap, FixedFloat and Guardarian are not exchanges in the usual sense. They are conversion rails – swap one asset for another, often without an account, sometimes without meaningful KYC, and move on. Blockchain forensics firms have repeatedly traced funds from thefts and scam operations through exactly this category of service.
Reading the list that way, FIU-IND is no longer just policing where Indians trade. It is policing where stolen and defrauded rupees exit.
How we got here
March 2023 – VDA service providers are pulled into the PMLA’s AML/CFT perimeter. Registration becomes mandatory for exchange, transfer and custody activity.
December 2023 – Show-cause notices go to nine offshore exchanges, including Binance and KuCoin.
January 2024 – Apple and Google pull the non-compliant apps in India; URLs get blocked.
2024–25 – Binance and KuCoin pay penalties and register. Compliance, it turns out, is cheaper than exclusion.
September–October 2025 – A second wave hits 25 offshore platforms.
September 2026 – This round of 15, with takedown notices issued in parallel rather than months later.
The expert read
Two things stand out. First, the takedown notice arriving at the same time as the Section 13 notice is a procedural tightening – the 2024 gap gave platforms months to warn users and migrate them. Second, the registered-entity count keeps climbing, which is the actual policy objective. India is not trying to end offshore access; it is converting offshore operators into reporting entities that file suspicious transaction reports.
What comes next
Blocking is porous. VPN usage will absorb some of this, and peer-to-peer and self-custodial routes absorb the rest. The real consequence is liquidity migration toward registered platforms and a thinner, riskier grey market for everyone who stays offshore.
Conclusion
India has settled into a pattern: no ban, no embrace, just relentless perimeter enforcement. For platforms, the calculation is now simple – register, or get delisted and watch a competitor take the users. For traders, the finance ministry’s warning stands unchanged. Unregulated means no recourse.
This post FIU-IND has served non-compliance notices on 15 offshore first appeared on BitcoinWorld.
Key takeaways
FIU-IND has served non-compliance notices on 15 offshore VDA service providers under Section 13 of the PMLA, alongside takedown notices under Section 79(3)(b) of the IT Act.
The list is unusual: alongside derivatives venues sit instant-swap and no-account conversion tools – ChangeNOW, SimpleSwap, FixedFloat, Guardarian.
India’s compliance test is activity-based. No office, no employees, no servers in India – still a reporting entity.
Expect app-store delistings and DNS-level blocks as the enforcement follow-through, as happened in 2024.
List Of Exchanges Are:
The previous sweeps read like a who’s-who of global exchanges. This one reads like a laundering-flow diagram.
Weex, Bitunix, Blofin, Toobit, XT.com, WOO X, Pionex and DigiFinex are recognisable trading venues, many of them high-leverage perpetuals platforms popular with Indian retail traders who found domestic options too slow or too taxed. But ChangeNOW, SimpleSwap, FixedFloat and Guardarian are not exchanges in the usual sense. They are conversion rails – swap one asset for another, often without an account, sometimes without meaningful KYC, and move on. Blockchain forensics firms have repeatedly traced funds from thefts and scam operations through exactly this category of service.
Reading the list that way, FIU-IND is no longer just policing where Indians trade. It is policing where stolen and defrauded rupees exit.
How we got here
March 2023 – VDA service providers are pulled into the PMLA’s AML/CFT perimeter. Registration becomes mandatory for exchange, transfer and custody activity.
December 2023 – Show-cause notices go to nine offshore exchanges, including Binance and KuCoin.
January 2024 – Apple and Google pull the non-compliant apps in India; URLs get blocked.
2024–25 – Binance and KuCoin pay penalties and register. Compliance, it turns out, is cheaper than exclusion.
September–October 2025 – A second wave hits 25 offshore platforms.
September 2026 – This round of 15, with takedown notices issued in parallel rather than months later.
The expert read
Two things stand out. First, the takedown notice arriving at the same time as the Section 13 notice is a procedural tightening – the 2024 gap gave platforms months to warn users and migrate them. Second, the registered-entity count keeps climbing, which is the actual policy objective. India is not trying to end offshore access; it is converting offshore operators into reporting entities that file suspicious transaction reports.
What comes next
Blocking is porous. VPN usage will absorb some of this, and peer-to-peer and self-custodial routes absorb the rest. The real consequence is liquidity migration toward registered platforms and a thinner, riskier grey market for everyone who stays offshore.
Conclusion
India has settled into a pattern: no ban, no embrace, just relentless perimeter enforcement. For platforms, the calculation is now simple – register, or get delisted and watch a competitor take the users. For traders, the finance ministry’s warning stands unchanged. Unregulated means no recourse.
This post FIU-IND has served non-compliance notices on 15 offshore first appeared on BitcoinWorld.
32
·
--

Article
Polkadot Tries Again: Why DotUSD Is a Second Chance, Not a New IdeaBitcoinWorldPolkadot Tries Again: Why dotUSD Is a Second Chance, Not a New Idea
Key takeaways
Referendum 1944 proposes dotUSD, a protocol-owned stablecoin, and is running at roughly 97.5% approval on OpenGov’s Root track.
This is Polkadot’s third attempt at native stable liquidity, following Acala’s aUSD collapse in 2022 and the stalled pUSD proposal in 2025.
The rollout is deliberately staged: USDT-backed issuance first, DOT collateral vaults and liquidations only in phase two.
Treasury commitment is $5 million, split between minting reserves and a dotUSD pair on Asset Hub.
DOT gained 42.5% on the week, but the real test is adoption after the vote, not the vote itself.
Polkadot is not launching a stablecoin because stablecoins are fashionable. It is launching one because the last attempt in its orbit failed badly enough to leave a scar – and the network has spent four years living with the consequences.
Referendum 1944, titled “dotUSD: A Native Stablecoin for Polkadot,” went on-chain Monday at 11:49 a.m. ET and sits on OpenGov’s Root track, reserved for decisions that touch the protocol itself. Support is close to unanimous: roughly 2.3 million DOT in favor against under 60,000 opposed, about 97.5% approval. DOT responded with a 16.7% single-day move and a 42.5% weekly gain, the strongest among the fifty largest tokens.
The part most coverage skips
This is Polkadot’s third pass at the problem. Acala’s aUSD collapsed in 2022 after an exploit minted billions of unbacked tokens, and the fallout effectively removed native stable liquidity from the ecosystem. In 2025, a proposal called pUSD – built on Acala’s Honzon stack – cleared 75% support but stalled amid community objections about who would build it and who would supervise risk. Gavin Wood had already laid out his conditions publicly: full DOT collateralization, governance control by Polkadot itself, and DAI-grade security assumptions.
dotUSD reads as a direct answer to those objections. The design borrows from Liquity v2 rather than Honzon, and the rollout is deliberately staged. Phase one issues dotUSD against a capped USDT-backed buffer – no oracles, no liquidation engine, no DOT price dependency. Only in phase two do DOT vaults, real-time price feeds, and liquidations arrive. The treasury commitment is modest by design: $2.5 million in USDT for minting and $2.5 million in DOT seeding a dotUSD pair on Asset Hub.
Why the sequencing matters more than the peg
Overcollateralized CDP stablecoins fail in a predictable way. Collateral drops, liquidations queue up, thin exchange liquidity turns orderly unwinding into a cascade, and the peg breaks before the mechanism can respond. By deferring DOT collateral until liquidity exists and the machinery has been tested, Polkadot avoids the exact failure mode that killed its predecessor. A stability pool absorbs liquidated positions instead of dumping collateral into open markets.
There is a reflexive economic story too, and traders clearly noticed it. Every dollar of dotUSD minted in phase two locks up more than a dollar of DOT, converting stablecoin demand into structural demand for the collateral asset. That mechanism is real, but it only activates in phase two – and only if anyone actually wants to hold dotUSD.
The harder question
Sovereignty is the strategic case: if Tether or Circle ever restricted access on Polkadot, the ecosystem currently has no fallback. That argument is sound. Adoption is the unsolved part. Native stablecoins do not win on ideology; they win on liquidity depth, integrations, and yield. Polkadot’s DeFi footprint remains small, and $5 million buys a beginning, not a market.
Conclusion
The vote will pass. The interesting period starts afterward, when dotUSD has to earn usage rather than approval – and when phase two decides whether Polkadot learned the right lesson from aUSD or merely rewrote it.
This post Polkadot Tries Again: Why dotUSD Is a Second Chance, Not a New Idea first appeared on BitcoinWorld.
Polkadot Tries Again: Why DotUSD Is a Second Chance, Not a New Idea
BitcoinWorldPolkadot Tries Again: Why dotUSD Is a Second Chance, Not a New Idea
Key takeaways
Referendum 1944 proposes dotUSD, a protocol-owned stablecoin, and is running at roughly 97.5% approval on OpenGov’s Root track.
This is Polkadot’s third attempt at native stable liquidity, following Acala’s aUSD collapse in 2022 and the stalled pUSD proposal in 2025.
The rollout is deliberately staged: USDT-backed issuance first, DOT collateral vaults and liquidations only in phase two.
Treasury commitment is $5 million, split between minting reserves and a dotUSD pair on Asset Hub.
DOT gained 42.5% on the week, but the real test is adoption after the vote, not the vote itself.
Polkadot is not launching a stablecoin because stablecoins are fashionable. It is launching one because the last attempt in its orbit failed badly enough to leave a scar – and the network has spent four years living with the consequences.
Referendum 1944, titled “dotUSD: A Native Stablecoin for Polkadot,” went on-chain Monday at 11:49 a.m. ET and sits on OpenGov’s Root track, reserved for decisions that touch the protocol itself. Support is close to unanimous: roughly 2.3 million DOT in favor against under 60,000 opposed, about 97.5% approval. DOT responded with a 16.7% single-day move and a 42.5% weekly gain, the strongest among the fifty largest tokens.
The part most coverage skips
This is Polkadot’s third pass at the problem. Acala’s aUSD collapsed in 2022 after an exploit minted billions of unbacked tokens, and the fallout effectively removed native stable liquidity from the ecosystem. In 2025, a proposal called pUSD – built on Acala’s Honzon stack – cleared 75% support but stalled amid community objections about who would build it and who would supervise risk. Gavin Wood had already laid out his conditions publicly: full DOT collateralization, governance control by Polkadot itself, and DAI-grade security assumptions.
dotUSD reads as a direct answer to those objections. The design borrows from Liquity v2 rather than Honzon, and the rollout is deliberately staged. Phase one issues dotUSD against a capped USDT-backed buffer – no oracles, no liquidation engine, no DOT price dependency. Only in phase two do DOT vaults, real-time price feeds, and liquidations arrive. The treasury commitment is modest by design: $2.5 million in USDT for minting and $2.5 million in DOT seeding a dotUSD pair on Asset Hub.
Why the sequencing matters more than the peg
Overcollateralized CDP stablecoins fail in a predictable way. Collateral drops, liquidations queue up, thin exchange liquidity turns orderly unwinding into a cascade, and the peg breaks before the mechanism can respond. By deferring DOT collateral until liquidity exists and the machinery has been tested, Polkadot avoids the exact failure mode that killed its predecessor. A stability pool absorbs liquidated positions instead of dumping collateral into open markets.
There is a reflexive economic story too, and traders clearly noticed it. Every dollar of dotUSD minted in phase two locks up more than a dollar of DOT, converting stablecoin demand into structural demand for the collateral asset. That mechanism is real, but it only activates in phase two – and only if anyone actually wants to hold dotUSD.
The harder question
Sovereignty is the strategic case: if Tether or Circle ever restricted access on Polkadot, the ecosystem currently has no fallback. That argument is sound. Adoption is the unsolved part. Native stablecoins do not win on ideology; they win on liquidity depth, integrations, and yield. Polkadot’s DeFi footprint remains small, and $5 million buys a beginning, not a market.
Conclusion
The vote will pass. The interesting period starts afterward, when dotUSD has to earn usage rather than approval – and when phase two decides whether Polkadot learned the right lesson from aUSD or merely rewrote it.
This post Polkadot Tries Again: Why dotUSD Is a Second Chance, Not a New Idea first appeared on BitcoinWorld.
Key takeaways
Referendum 1944 proposes dotUSD, a protocol-owned stablecoin, and is running at roughly 97.5% approval on OpenGov’s Root track.
This is Polkadot’s third attempt at native stable liquidity, following Acala’s aUSD collapse in 2022 and the stalled pUSD proposal in 2025.
The rollout is deliberately staged: USDT-backed issuance first, DOT collateral vaults and liquidations only in phase two.
Treasury commitment is $5 million, split between minting reserves and a dotUSD pair on Asset Hub.
DOT gained 42.5% on the week, but the real test is adoption after the vote, not the vote itself.
Polkadot is not launching a stablecoin because stablecoins are fashionable. It is launching one because the last attempt in its orbit failed badly enough to leave a scar – and the network has spent four years living with the consequences.
Referendum 1944, titled “dotUSD: A Native Stablecoin for Polkadot,” went on-chain Monday at 11:49 a.m. ET and sits on OpenGov’s Root track, reserved for decisions that touch the protocol itself. Support is close to unanimous: roughly 2.3 million DOT in favor against under 60,000 opposed, about 97.5% approval. DOT responded with a 16.7% single-day move and a 42.5% weekly gain, the strongest among the fifty largest tokens.
The part most coverage skips
This is Polkadot’s third pass at the problem. Acala’s aUSD collapsed in 2022 after an exploit minted billions of unbacked tokens, and the fallout effectively removed native stable liquidity from the ecosystem. In 2025, a proposal called pUSD – built on Acala’s Honzon stack – cleared 75% support but stalled amid community objections about who would build it and who would supervise risk. Gavin Wood had already laid out his conditions publicly: full DOT collateralization, governance control by Polkadot itself, and DAI-grade security assumptions.
dotUSD reads as a direct answer to those objections. The design borrows from Liquity v2 rather than Honzon, and the rollout is deliberately staged. Phase one issues dotUSD against a capped USDT-backed buffer – no oracles, no liquidation engine, no DOT price dependency. Only in phase two do DOT vaults, real-time price feeds, and liquidations arrive. The treasury commitment is modest by design: $2.5 million in USDT for minting and $2.5 million in DOT seeding a dotUSD pair on Asset Hub.
Why the sequencing matters more than the peg
Overcollateralized CDP stablecoins fail in a predictable way. Collateral drops, liquidations queue up, thin exchange liquidity turns orderly unwinding into a cascade, and the peg breaks before the mechanism can respond. By deferring DOT collateral until liquidity exists and the machinery has been tested, Polkadot avoids the exact failure mode that killed its predecessor. A stability pool absorbs liquidated positions instead of dumping collateral into open markets.
There is a reflexive economic story too, and traders clearly noticed it. Every dollar of dotUSD minted in phase two locks up more than a dollar of DOT, converting stablecoin demand into structural demand for the collateral asset. That mechanism is real, but it only activates in phase two – and only if anyone actually wants to hold dotUSD.
The harder question
Sovereignty is the strategic case: if Tether or Circle ever restricted access on Polkadot, the ecosystem currently has no fallback. That argument is sound. Adoption is the unsolved part. Native stablecoins do not win on ideology; they win on liquidity depth, integrations, and yield. Polkadot’s DeFi footprint remains small, and $5 million buys a beginning, not a market.
Conclusion
The vote will pass. The interesting period starts afterward, when dotUSD has to earn usage rather than approval – and when phase two decides whether Polkadot learned the right lesson from aUSD or merely rewrote it.
This post Polkadot Tries Again: Why dotUSD Is a Second Chance, Not a New Idea first appeared on BitcoinWorld.
1
414
·
--

Article
Gemini’s Singapore Unit Now Holds a Full Major Payment Institution (MPI) LicenceBitcoinWorldGemini’s Singapore unit now holds a full Major Payment Institution (MPI) licence
Key Takeaways
Gemini’s Singapore unit now holds a full Major Payment Institution (MPI) licence, roughly 23 months after receiving in-principle approval.
The licence removes transaction-volume caps but pulls Gemini into a heavier supervisory regime covering AML, tech risk and reporting.
Singapore’s approval queue is slow by design — and that slowness is becoming the region’s competitive filter.
The Real Story Isn’t the Licence. It’s the Wait.
Most coverage of Gemini’s Singapore approval will read like a press release. The more interesting number is the calendar.
MAS issued in-principle approval in October 2024. Final authorisation arrived this week. Nearly two years passed between “yes, in principle” and “yes.” For an exchange with a US public listing, an established institutional book and a decade of operating history, that is a long time to sit in a regulatory waiting room – and it tells you more about Singapore’s posture than any policy speech.
Timeline
2020 – Gemini begins serving Singapore customers, initially through its US entity under an exemption.
October 2024 – MAS grants in-principle approval for an MPI licence covering digital payment tokens and cross-border transfers.
April 2025 – Customers are migrated from Gemini Trust Company into the locally incorporated Gemini Digital Payments Singapore while the application matures.
September 9, 2026 – Full MPI licence granted.
What Changes Operationally
The headline benefit is structural. MPI holders operate without the transaction-volume ceilings that constrain standard payment institutions – which matters enormously for an exchange whose Singapore business skews institutional. Volume caps are a ceiling on ambition; removing them turns Singapore from a compliance outpost into a viable booking centre.
The trade-off is supervisory weight. MAS applies broader obligations to MPIs precisely because scale creates larger risk, with continuing requirements around anti-money laundering, customer due diligence, technology risk and regulatory reporting. This is not a licence you win once. It is one you re-earn quarterly.
Why It Matters Beyond Gemini
Singapore has quietly assembled a short, curated list. Coinbase, Crypto.com, OKX, Bitstamp and Cumberland already hold MPI authorisation – and the roster is notable for who isn’t on it. MAS has been deliberate about the distinction between locally licensed firms and offshore platforms that merely happen to be reachable from a Singapore IP address.
That distinction is the strategic point. Global scale confers nothing locally. For years, exchanges arbitraged jurisdictional ambiguity across Asia. Singapore has made that arbitrage expensive by making the licence slow, costly and revocable.
Looking Forward
Expect the licensed cohort to consolidate rather than expand. Approvals of this weight function as moats – each one raises the credible-entry cost for the next applicant, and Hong Kong, Japan and the UAE are converging on similar architecture.
Conclusion
Gemini’s licence is a milestone, but the durable signal is Singapore’s willingness to make firms wait two years for legitimacy. In a sector built on speed, the jurisdictions setting the terms are the ones refusing to hurry.
This post Gemini’s Singapore unit now holds a full Major Payment Institution (MPI) licence first appeared on BitcoinWorld.
Gemini’s Singapore Unit Now Holds a Full Major Payment Institution (MPI) Licence
BitcoinWorldGemini’s Singapore unit now holds a full Major Payment Institution (MPI) licence
Key Takeaways
Gemini’s Singapore unit now holds a full Major Payment Institution (MPI) licence, roughly 23 months after receiving in-principle approval.
The licence removes transaction-volume caps but pulls Gemini into a heavier supervisory regime covering AML, tech risk and reporting.
Singapore’s approval queue is slow by design — and that slowness is becoming the region’s competitive filter.
The Real Story Isn’t the Licence. It’s the Wait.
Most coverage of Gemini’s Singapore approval will read like a press release. The more interesting number is the calendar.
MAS issued in-principle approval in October 2024. Final authorisation arrived this week. Nearly two years passed between “yes, in principle” and “yes.” For an exchange with a US public listing, an established institutional book and a decade of operating history, that is a long time to sit in a regulatory waiting room – and it tells you more about Singapore’s posture than any policy speech.
Timeline
2020 – Gemini begins serving Singapore customers, initially through its US entity under an exemption.
October 2024 – MAS grants in-principle approval for an MPI licence covering digital payment tokens and cross-border transfers.
April 2025 – Customers are migrated from Gemini Trust Company into the locally incorporated Gemini Digital Payments Singapore while the application matures.
September 9, 2026 – Full MPI licence granted.
What Changes Operationally
The headline benefit is structural. MPI holders operate without the transaction-volume ceilings that constrain standard payment institutions – which matters enormously for an exchange whose Singapore business skews institutional. Volume caps are a ceiling on ambition; removing them turns Singapore from a compliance outpost into a viable booking centre.
The trade-off is supervisory weight. MAS applies broader obligations to MPIs precisely because scale creates larger risk, with continuing requirements around anti-money laundering, customer due diligence, technology risk and regulatory reporting. This is not a licence you win once. It is one you re-earn quarterly.
Why It Matters Beyond Gemini
Singapore has quietly assembled a short, curated list. Coinbase, Crypto.com, OKX, Bitstamp and Cumberland already hold MPI authorisation – and the roster is notable for who isn’t on it. MAS has been deliberate about the distinction between locally licensed firms and offshore platforms that merely happen to be reachable from a Singapore IP address.
That distinction is the strategic point. Global scale confers nothing locally. For years, exchanges arbitraged jurisdictional ambiguity across Asia. Singapore has made that arbitrage expensive by making the licence slow, costly and revocable.
Looking Forward
Expect the licensed cohort to consolidate rather than expand. Approvals of this weight function as moats – each one raises the credible-entry cost for the next applicant, and Hong Kong, Japan and the UAE are converging on similar architecture.
Conclusion
Gemini’s licence is a milestone, but the durable signal is Singapore’s willingness to make firms wait two years for legitimacy. In a sector built on speed, the jurisdictions setting the terms are the ones refusing to hurry.
This post Gemini’s Singapore unit now holds a full Major Payment Institution (MPI) licence first appeared on BitcoinWorld.
Key Takeaways
Gemini’s Singapore unit now holds a full Major Payment Institution (MPI) licence, roughly 23 months after receiving in-principle approval.
The licence removes transaction-volume caps but pulls Gemini into a heavier supervisory regime covering AML, tech risk and reporting.
Singapore’s approval queue is slow by design — and that slowness is becoming the region’s competitive filter.
The Real Story Isn’t the Licence. It’s the Wait.
Most coverage of Gemini’s Singapore approval will read like a press release. The more interesting number is the calendar.
MAS issued in-principle approval in October 2024. Final authorisation arrived this week. Nearly two years passed between “yes, in principle” and “yes.” For an exchange with a US public listing, an established institutional book and a decade of operating history, that is a long time to sit in a regulatory waiting room – and it tells you more about Singapore’s posture than any policy speech.
Timeline
2020 – Gemini begins serving Singapore customers, initially through its US entity under an exemption.
October 2024 – MAS grants in-principle approval for an MPI licence covering digital payment tokens and cross-border transfers.
April 2025 – Customers are migrated from Gemini Trust Company into the locally incorporated Gemini Digital Payments Singapore while the application matures.
September 9, 2026 – Full MPI licence granted.
What Changes Operationally
The headline benefit is structural. MPI holders operate without the transaction-volume ceilings that constrain standard payment institutions – which matters enormously for an exchange whose Singapore business skews institutional. Volume caps are a ceiling on ambition; removing them turns Singapore from a compliance outpost into a viable booking centre.
The trade-off is supervisory weight. MAS applies broader obligations to MPIs precisely because scale creates larger risk, with continuing requirements around anti-money laundering, customer due diligence, technology risk and regulatory reporting. This is not a licence you win once. It is one you re-earn quarterly.
Why It Matters Beyond Gemini
Singapore has quietly assembled a short, curated list. Coinbase, Crypto.com, OKX, Bitstamp and Cumberland already hold MPI authorisation – and the roster is notable for who isn’t on it. MAS has been deliberate about the distinction between locally licensed firms and offshore platforms that merely happen to be reachable from a Singapore IP address.
That distinction is the strategic point. Global scale confers nothing locally. For years, exchanges arbitraged jurisdictional ambiguity across Asia. Singapore has made that arbitrage expensive by making the licence slow, costly and revocable.
Looking Forward
Expect the licensed cohort to consolidate rather than expand. Approvals of this weight function as moats – each one raises the credible-entry cost for the next applicant, and Hong Kong, Japan and the UAE are converging on similar architecture.
Conclusion
Gemini’s licence is a milestone, but the durable signal is Singapore’s willingness to make firms wait two years for legitimacy. In a sector built on speed, the jurisdictions setting the terms are the ones refusing to hurry.
This post Gemini’s Singapore unit now holds a full Major Payment Institution (MPI) licence first appeared on BitcoinWorld.
142
·
--

Article
Want to Buy a Private Jet? Now You Can Pay in BitcoinBitcoinWorldWant to Buy a Private Jet? Now You Can Pay in Bitcoin
There’s a small but meaningful difference between accepting Bitcoin and pricing in Bitcoin. Almost every “we take crypto” headline of the past decade has been the first thing wearing the costume of the second. A dealership, a developer, a luxury broker announces BTC payments, then quietly routes the coins through a payment processor that converts to dollars before the wire clears. The dollar stayed the unit of account. Bitcoin was just a rail.
Grant Cardone’s private jet listing is interesting because it flips that arrangement, at least on paper. The asking price is 1,025 BTC. Not “$80 million, payable in Bitcoin.” The coin count is the number. The dollar figure is whatever the market says it is on the day someone signs. That distinction is the entire story, and it’s worth more attention than the aircraft itself.
Let’s do a math
Start with the math. Bitcoin has been trading around $78,500 at the time of wrtiting this article, which puts 1,025 coins at roughly $80.5 million. The aircraft is a 2024 Bombardier Global 7500, an ultra-long-range machine that seats up to 17 and sits at the top of the business jet food chain. When this same tail number surfaced earlier in the year, it was being described as a $75 million jet, listed on Controller with a low airframe time and light usage history.
So the BTC-denominated ask lands above where the cash conversation was sitting seven months ago. On a lightly used but no longer new airframe, in a preowned large-cabin market that has cooled considerably from its 2022 frenzy, that is an ambitious number. Global 7500 inventory has loosened. Buyers at this tier have options, brokers, and appraisers who do not care what asset class the seller is emotionally attached to.
Which tells you something: the coin count is not a discount mechanism. It’s a positioning statement.
The backstory matters more than the listing
This jet has been on and off the market before, and the circumstances were not subtle. In February, minutes after Bitcoin slipped below $70,000, Cardone posted that he had to say goodbye to “the love of my life,” describing the aircraft in listing-copy detail and pointing followers to Controller. Bitcoin had shed more than 20% in a month at that point, well off its October 2025 peak above $126,000.
Critics read that as forced selling. The counter-reading, which Cardone’s camp pushed hard, was capital reallocation: dump a depreciating, maintenance-heavy asset and redirect the capital toward a scarce one.
The second reading has some support in the record. Cardone Capital has been buying through the drawdown, crossing 2,700 BTC with Bitcoin near $59,000, funded through rental cash flow rather than debt or equity raises, with a stated goal of 3,000 BTC this year and 10,000 long term. He has also attached himself to an oddly precise year-end target of $189,425, defending the specificity on the grounds that Bitcoin never lands on round numbers.
Whatever you make of the price target, the balance sheet behavior is consistent. A man converting hard assets into BTC on a schedule pricing his last big toy in BTC is at least internally coherent.
Can someone buy Jet with Bitcoin in todays world?
Here’s where enthusiasm meets the aviation transaction stack, and the aviation transaction stack usually wins.
A jet sale of this size is not a checkout page. There’s a letter of intent, a deposit into escrow, a pre-purchase inspection at an authorized service center that can take two to four weeks and routinely surfaces six-figure discrepancies, delivery conditions, engine and airframe program transfers, and a closing coordinated through the FAA registry in Oklahoma City. On aircraft with international exposure there’s a Cape Town Convention filing and an IDERA to unwind. Title and lien searches take days. Nothing about this moves at block speed.
Now overlay Bitcoin. Escrow agents in aviation are set up to hold dollars in segregated accounts under state trust rules. Very few are equipped to custody eight figures of BTC through a 45-day close with price volatility running. Someone has to eat the delta. If BTC drops 15% during inspection, does the buyer top up the coins or does the seller absorb it? That single clause is where most crypto-denominated deals collapse, and it’s why “priced in BTC, settled in dollars at signing” is the compromise nearly everyone lands on.
Then there’s tax. In the United States, spending Bitcoin is a disposal. A buyer sending 1,025 coins acquired at a lower basis realizes capital gains on the full spread, immediately, in a year with no offsetting loss harvest unless they’ve planned for it. For an early holder, the tax bill on the transaction could exceed what a comparable financed purchase would cost in interest. On the sell side, an aircraft that has been depreciated aggressively carries recapture exposure, so the seller has his own reasons to care about how proceeds are characterized.
Add AML. Compliance officers at title companies and banks are not thrilled by an eight-figure inbound crypto transfer. Source-of-funds documentation, Travel Rule data, and chain analytics screening are all now standard for transfers of this size through any regulated venue.
None of this makes the deal impossible. It makes it slow, lawyered, and far more likely to settle in fiat than the headline suggests.
What comes next
The more consequential trend sitting behind this story isn’t jets. It’s the slow migration of high-value asset settlement toward digital rails, and the growing likelihood that stablecoins rather than Bitcoin end up doing that work. A tokenized dollar settles instantly, doesn’t move 8% during due diligence, and doesn’t trigger a taxable disposal. If aircraft, yachts, and commercial real estate start closing on-chain over the next few years, they will almost certainly close in USDC and its regulated cousins, with Bitcoin remaining the reserve asset people hold rather than the medium they spend.
That’s the quiet irony. Listings like this one are framed as proof that Bitcoin is becoming money, but the friction they expose is exactly the argument for why it probably won’t be the transactional layer. Good collateral and good currency are different jobs.
Conclusion
A 1,025 BTC price tag on a Global 7500 is a well-constructed piece of theater with a real question buried inside it. The listing costs nothing to make and delivers enormous attention. The close is where the claim gets tested, and the close involves escrow agents, tax counsel, an inspection facility, and a compliance department, none of which are ideologically motivated.
Watch for three things: whether the transaction documents denominate in BTC or dollars, whether an escrow agent takes custody of actual coins, and whether the settled price at closing matches the 1,025 figure or gets renegotiated against a dollar benchmark. If all three land on the Bitcoin side, that’s a genuine milestone worth writing about. If they don’t, this was a very effective advertisement for a fund that buys Bitcoin with rent money, and the dollar remains the language everyone still thinks in.
This post Want to Buy a Private Jet? Now You Can Pay in Bitcoin first appeared on BitcoinWorld.
Want to Buy a Private Jet? Now You Can Pay in Bitcoin
BitcoinWorldWant to Buy a Private Jet? Now You Can Pay in Bitcoin
There’s a small but meaningful difference between accepting Bitcoin and pricing in Bitcoin. Almost every “we take crypto” headline of the past decade has been the first thing wearing the costume of the second. A dealership, a developer, a luxury broker announces BTC payments, then quietly routes the coins through a payment processor that converts to dollars before the wire clears. The dollar stayed the unit of account. Bitcoin was just a rail.
Grant Cardone’s private jet listing is interesting because it flips that arrangement, at least on paper. The asking price is 1,025 BTC. Not “$80 million, payable in Bitcoin.” The coin count is the number. The dollar figure is whatever the market says it is on the day someone signs. That distinction is the entire story, and it’s worth more attention than the aircraft itself.
Let’s do a math
Start with the math. Bitcoin has been trading around $78,500 at the time of wrtiting this article, which puts 1,025 coins at roughly $80.5 million. The aircraft is a 2024 Bombardier Global 7500, an ultra-long-range machine that seats up to 17 and sits at the top of the business jet food chain. When this same tail number surfaced earlier in the year, it was being described as a $75 million jet, listed on Controller with a low airframe time and light usage history.
So the BTC-denominated ask lands above where the cash conversation was sitting seven months ago. On a lightly used but no longer new airframe, in a preowned large-cabin market that has cooled considerably from its 2022 frenzy, that is an ambitious number. Global 7500 inventory has loosened. Buyers at this tier have options, brokers, and appraisers who do not care what asset class the seller is emotionally attached to.
Which tells you something: the coin count is not a discount mechanism. It’s a positioning statement.
The backstory matters more than the listing
This jet has been on and off the market before, and the circumstances were not subtle. In February, minutes after Bitcoin slipped below $70,000, Cardone posted that he had to say goodbye to “the love of my life,” describing the aircraft in listing-copy detail and pointing followers to Controller. Bitcoin had shed more than 20% in a month at that point, well off its October 2025 peak above $126,000.
Critics read that as forced selling. The counter-reading, which Cardone’s camp pushed hard, was capital reallocation: dump a depreciating, maintenance-heavy asset and redirect the capital toward a scarce one.
The second reading has some support in the record. Cardone Capital has been buying through the drawdown, crossing 2,700 BTC with Bitcoin near $59,000, funded through rental cash flow rather than debt or equity raises, with a stated goal of 3,000 BTC this year and 10,000 long term. He has also attached himself to an oddly precise year-end target of $189,425, defending the specificity on the grounds that Bitcoin never lands on round numbers.
Whatever you make of the price target, the balance sheet behavior is consistent. A man converting hard assets into BTC on a schedule pricing his last big toy in BTC is at least internally coherent.
Can someone buy Jet with Bitcoin in todays world?
Here’s where enthusiasm meets the aviation transaction stack, and the aviation transaction stack usually wins.
A jet sale of this size is not a checkout page. There’s a letter of intent, a deposit into escrow, a pre-purchase inspection at an authorized service center that can take two to four weeks and routinely surfaces six-figure discrepancies, delivery conditions, engine and airframe program transfers, and a closing coordinated through the FAA registry in Oklahoma City. On aircraft with international exposure there’s a Cape Town Convention filing and an IDERA to unwind. Title and lien searches take days. Nothing about this moves at block speed.
Now overlay Bitcoin. Escrow agents in aviation are set up to hold dollars in segregated accounts under state trust rules. Very few are equipped to custody eight figures of BTC through a 45-day close with price volatility running. Someone has to eat the delta. If BTC drops 15% during inspection, does the buyer top up the coins or does the seller absorb it? That single clause is where most crypto-denominated deals collapse, and it’s why “priced in BTC, settled in dollars at signing” is the compromise nearly everyone lands on.
Then there’s tax. In the United States, spending Bitcoin is a disposal. A buyer sending 1,025 coins acquired at a lower basis realizes capital gains on the full spread, immediately, in a year with no offsetting loss harvest unless they’ve planned for it. For an early holder, the tax bill on the transaction could exceed what a comparable financed purchase would cost in interest. On the sell side, an aircraft that has been depreciated aggressively carries recapture exposure, so the seller has his own reasons to care about how proceeds are characterized.
Add AML. Compliance officers at title companies and banks are not thrilled by an eight-figure inbound crypto transfer. Source-of-funds documentation, Travel Rule data, and chain analytics screening are all now standard for transfers of this size through any regulated venue.
None of this makes the deal impossible. It makes it slow, lawyered, and far more likely to settle in fiat than the headline suggests.
What comes next
The more consequential trend sitting behind this story isn’t jets. It’s the slow migration of high-value asset settlement toward digital rails, and the growing likelihood that stablecoins rather than Bitcoin end up doing that work. A tokenized dollar settles instantly, doesn’t move 8% during due diligence, and doesn’t trigger a taxable disposal. If aircraft, yachts, and commercial real estate start closing on-chain over the next few years, they will almost certainly close in USDC and its regulated cousins, with Bitcoin remaining the reserve asset people hold rather than the medium they spend.
That’s the quiet irony. Listings like this one are framed as proof that Bitcoin is becoming money, but the friction they expose is exactly the argument for why it probably won’t be the transactional layer. Good collateral and good currency are different jobs.
Conclusion
A 1,025 BTC price tag on a Global 7500 is a well-constructed piece of theater with a real question buried inside it. The listing costs nothing to make and delivers enormous attention. The close is where the claim gets tested, and the close involves escrow agents, tax counsel, an inspection facility, and a compliance department, none of which are ideologically motivated.
Watch for three things: whether the transaction documents denominate in BTC or dollars, whether an escrow agent takes custody of actual coins, and whether the settled price at closing matches the 1,025 figure or gets renegotiated against a dollar benchmark. If all three land on the Bitcoin side, that’s a genuine milestone worth writing about. If they don’t, this was a very effective advertisement for a fund that buys Bitcoin with rent money, and the dollar remains the language everyone still thinks in.
This post Want to Buy a Private Jet? Now You Can Pay in Bitcoin first appeared on BitcoinWorld.
There’s a small but meaningful difference between accepting Bitcoin and pricing in Bitcoin. Almost every “we take crypto” headline of the past decade has been the first thing wearing the costume of the second. A dealership, a developer, a luxury broker announces BTC payments, then quietly routes the coins through a payment processor that converts to dollars before the wire clears. The dollar stayed the unit of account. Bitcoin was just a rail.
Grant Cardone’s private jet listing is interesting because it flips that arrangement, at least on paper. The asking price is 1,025 BTC. Not “$80 million, payable in Bitcoin.” The coin count is the number. The dollar figure is whatever the market says it is on the day someone signs. That distinction is the entire story, and it’s worth more attention than the aircraft itself.
Let’s do a math
Start with the math. Bitcoin has been trading around $78,500 at the time of wrtiting this article, which puts 1,025 coins at roughly $80.5 million. The aircraft is a 2024 Bombardier Global 7500, an ultra-long-range machine that seats up to 17 and sits at the top of the business jet food chain. When this same tail number surfaced earlier in the year, it was being described as a $75 million jet, listed on Controller with a low airframe time and light usage history.
So the BTC-denominated ask lands above where the cash conversation was sitting seven months ago. On a lightly used but no longer new airframe, in a preowned large-cabin market that has cooled considerably from its 2022 frenzy, that is an ambitious number. Global 7500 inventory has loosened. Buyers at this tier have options, brokers, and appraisers who do not care what asset class the seller is emotionally attached to.
Which tells you something: the coin count is not a discount mechanism. It’s a positioning statement.
The backstory matters more than the listing
This jet has been on and off the market before, and the circumstances were not subtle. In February, minutes after Bitcoin slipped below $70,000, Cardone posted that he had to say goodbye to “the love of my life,” describing the aircraft in listing-copy detail and pointing followers to Controller. Bitcoin had shed more than 20% in a month at that point, well off its October 2025 peak above $126,000.
Critics read that as forced selling. The counter-reading, which Cardone’s camp pushed hard, was capital reallocation: dump a depreciating, maintenance-heavy asset and redirect the capital toward a scarce one.
The second reading has some support in the record. Cardone Capital has been buying through the drawdown, crossing 2,700 BTC with Bitcoin near $59,000, funded through rental cash flow rather than debt or equity raises, with a stated goal of 3,000 BTC this year and 10,000 long term. He has also attached himself to an oddly precise year-end target of $189,425, defending the specificity on the grounds that Bitcoin never lands on round numbers.
Whatever you make of the price target, the balance sheet behavior is consistent. A man converting hard assets into BTC on a schedule pricing his last big toy in BTC is at least internally coherent.
Can someone buy Jet with Bitcoin in todays world?
Here’s where enthusiasm meets the aviation transaction stack, and the aviation transaction stack usually wins.
A jet sale of this size is not a checkout page. There’s a letter of intent, a deposit into escrow, a pre-purchase inspection at an authorized service center that can take two to four weeks and routinely surfaces six-figure discrepancies, delivery conditions, engine and airframe program transfers, and a closing coordinated through the FAA registry in Oklahoma City. On aircraft with international exposure there’s a Cape Town Convention filing and an IDERA to unwind. Title and lien searches take days. Nothing about this moves at block speed.
Now overlay Bitcoin. Escrow agents in aviation are set up to hold dollars in segregated accounts under state trust rules. Very few are equipped to custody eight figures of BTC through a 45-day close with price volatility running. Someone has to eat the delta. If BTC drops 15% during inspection, does the buyer top up the coins or does the seller absorb it? That single clause is where most crypto-denominated deals collapse, and it’s why “priced in BTC, settled in dollars at signing” is the compromise nearly everyone lands on.
Then there’s tax. In the United States, spending Bitcoin is a disposal. A buyer sending 1,025 coins acquired at a lower basis realizes capital gains on the full spread, immediately, in a year with no offsetting loss harvest unless they’ve planned for it. For an early holder, the tax bill on the transaction could exceed what a comparable financed purchase would cost in interest. On the sell side, an aircraft that has been depreciated aggressively carries recapture exposure, so the seller has his own reasons to care about how proceeds are characterized.
Add AML. Compliance officers at title companies and banks are not thrilled by an eight-figure inbound crypto transfer. Source-of-funds documentation, Travel Rule data, and chain analytics screening are all now standard for transfers of this size through any regulated venue.
None of this makes the deal impossible. It makes it slow, lawyered, and far more likely to settle in fiat than the headline suggests.
What comes next
The more consequential trend sitting behind this story isn’t jets. It’s the slow migration of high-value asset settlement toward digital rails, and the growing likelihood that stablecoins rather than Bitcoin end up doing that work. A tokenized dollar settles instantly, doesn’t move 8% during due diligence, and doesn’t trigger a taxable disposal. If aircraft, yachts, and commercial real estate start closing on-chain over the next few years, they will almost certainly close in USDC and its regulated cousins, with Bitcoin remaining the reserve asset people hold rather than the medium they spend.
That’s the quiet irony. Listings like this one are framed as proof that Bitcoin is becoming money, but the friction they expose is exactly the argument for why it probably won’t be the transactional layer. Good collateral and good currency are different jobs.
Conclusion
A 1,025 BTC price tag on a Global 7500 is a well-constructed piece of theater with a real question buried inside it. The listing costs nothing to make and delivers enormous attention. The close is where the claim gets tested, and the close involves escrow agents, tax counsel, an inspection facility, and a compliance department, none of which are ideologically motivated.
Watch for three things: whether the transaction documents denominate in BTC or dollars, whether an escrow agent takes custody of actual coins, and whether the settled price at closing matches the 1,025 figure or gets renegotiated against a dollar benchmark. If all three land on the Bitcoin side, that’s a genuine milestone worth writing about. If they don’t, this was a very effective advertisement for a fund that buys Bitcoin with rent money, and the dollar remains the language everyone still thinks in.
This post Want to Buy a Private Jet? Now You Can Pay in Bitcoin first appeared on BitcoinWorld.
222
·
--
Article
Rain Expands Global Payouts to More Than 80 Countries in 50 CurrenciesBitcoinWorldRain Expands Global Payouts to More than 80 Countries in 50 Currencies
Payouts build on Rain’s existing money movement technology, which enables partners to offer virtual accounts, onramps, and offramps and give users even more ways to spend stablecoins
Key facts
Rain’s expanded global payouts capability broadens its money movement technology.
Rain’s partners can now support payouts to more than 80 countries in 50 currencies from stablecoins, with expansion to 95 countries and more than 60 currencies by the end of the year.
Global payouts support business-to-business (B2B), business-to-consumer (B2C), consumer-to-consumer (C2C), and consumer-to-business (C2B) transactions, whether a partner is sending funds to their own account or to someone else’s.
Global payouts are available now for select beta partners, with broader availability expected by the end of the year.
NEW YORK, Sept. 8, 2026 /PRNewswire/ — Rain, the enterprise-grade infrastructure for stablecoin payments, announced today an expansion of its global money movement technology platform, enabling partners to send payouts to more than 80 countries in 50 currencies, and plans to reach 95 countries and more than 60 currencies by the end of the year. The expanded capability gives Rain’s partners one way to pay others in the currency they actually use, from a single stablecoin balance. It supports business-to-business (B2B), business-to-consumer (B2C), consumer-to-consumer (C2C), and consumer-to-business (C2B) payouts, whether a partner is sending funds to their own account or to someone else’s.
Rain’s partners can now support payouts to more than 80 countries in 50 currencies from stablecoins.
Rain’s global payouts capability closes the last-mile gap for stablecoins by connecting onchain infrastructure with legacy rails. Partners fund payouts directly from the stablecoin balances they already hold, and Rain orchestrates the conversion of stablecoins to local currency through licensed partners.
Stablecoin cards were Rain’s original answer to making stablecoins spendable in the real world. The purchase is authorized like any other card transaction at the point of sale, but behind the scenes, Rain settles with the card networks in stablecoins, while the merchant gets paid in fiat. But card transactions represent just one way users want to use their stablecoins. A business in Bogotá still needs to pay a supplier in Lisbon. A contractor in Buenos Aires still needs pesos to pay their landlord for rent.
An expansion across pay-ins and payouts
Virtual accounts already let partners move money between fiat and stablecoins, covering both pay-ins and payouts. Rain’s global payouts extend the payout side of that stack to local currencies and local rails in more than 80 countries.
Together, the two capabilities mean a partner can bring pesos onchain through a virtual account in Mexico, hold them as stablecoins, and separately initiate a payout to a vendor in Argentina. Once the payout is initiated, a licensed partner would deliver Argentine pesos to the recipient’s bank account.
“Partners don’t want to stitch together several vendors every time they need to pay someone in a new country,” said Charles Yoo-Naut, CTO and co-founder of Rain. “They want one platform that powers the whole flow of funds, from stablecoins to local currency, wherever that money needs to land. Rain’s global payouts product is the next step in building that platform.”
Built for how partners actually move money
Rain built global payouts around the flows its partners already need it for:
Neobanks can offer money movement and payments services to their own consumer or business customers, without building and maintaining local banking relationships in every market themselves.
Marketplaces can pay a global base of sellers and drivers in their local currencies from a single stablecoin balance instead of prefunding an account in every country they operate in.
Contractor platforms can distribute payments to freelancers across borders, regardless of where they live.
Businesses can pay suppliers abroad from their onchain balance without requiring that vendor to accept stablecoins.
Settlement time depends on the rail and the destination. Many corridors settle in real time, others take up to two business days.
Rolling out now
Global payouts is live today with a select group of beta partners, and will roll out more broadly across Rain’s partner base over the coming months. Interested partners can work with their Account Manager to join the beta program and interested prospects can contact Partnerships at sales@rain.xyz.
Frequently Asked Questions
Question: What are global payouts?Answer: Global payouts are the latest capability in Rain’s global money movement product suite. It lets partners send money to recipients in more than 80 countries and 50 currencies, landing as local currency in the recipient’s own bank account, with plans to reach 95 countries and more than 60 currencies by the end of the year. The capability covers business-to-business (B2B), business-to-consumer (B2C), consumer-to-consumer (C2C), and consumer-to-business (C2B) payouts, whether a partner is sending funds to their own account or to someone else’s. Global payouts is live today with a select group of Rain partners and will expand to new partners over the coming months.
Question: What kinds of payments does Rain global payouts support?Answer: Rain supports business-to-business, business-to-consumer, consumer-to-consumer, and consumer-to-business payouts. Common use cases include marketplace seller payouts, contractor payments, consumer payments, and supplier or vendor payments.
Question: Does Rain offer more than stablecoin cards?Answer: Yes. Rain enables card issuing, rewards, embedded wallets, virtual accounts, and on/offramps via one platform. Expanding global payout capabilities means partners get the convenience of a single stack, with the flexibility and modularity to use only the pieces they need underneath it.
Question: What are Rain’s money movement capabilities?Answer: Rain provides a full suite of money movement technology, enabling partners to access global payouts, onramps and offramps, and virtual accounts in several currencies. Virtual accounts already support both pay-ins and payouts, moving money between fiat and stablecoins in multiple currencies. Global payouts expands the payout side of that stack specifically, extending Rain’s reach to local-currency payouts across more than 80 countries through local payment rails.
Question: Who are global payouts built for?Answer: Partners with a global base of recipients to pay: marketplaces paying sellers and drivers, contractor platforms hiring across borders, businesses paying suppliers and vendors abroad, and neobanks offering money movement services to their own consumer or business customers.
About Rain
Rain is the global stablecoin payments platform for enterprises, neobanks, platforms, developers, and AI agents. Our technology allows partners to move, store, and use stablecoins instantly and compliantly through global payment cards, rewards, on/offramps, stablecoin and fiat wallets, and cross-border rails. As both a Visa and Mastercard Principal Member, Rain issues cards that work at more than 175 million merchant locations in over 200 countries and territories. Built natively for stablecoins and trusted by more than 100 organizations worldwide, Rain delivers secure, scalable infrastructure that makes money move freely and instantly around the world. Learn more at https://www.rain.xyz/.
Media Contact:Joseph GalloCommunications Director, Rainjoseph@rain.xyz
SOURCE Rain
This post Rain Expands Global Payouts to More than 80 Countries in 50 Currencies first appeared on BitcoinWorld.
Rain Expands Global Payouts to More Than 80 Countries in 50 Currencies
BitcoinWorldRain Expands Global Payouts to More than 80 Countries in 50 Currencies
Payouts build on Rain’s existing money movement technology, which enables partners to offer virtual accounts, onramps, and offramps and give users even more ways to spend stablecoins
Key facts
Rain’s expanded global payouts capability broadens its money movement technology.
Rain’s partners can now support payouts to more than 80 countries in 50 currencies from stablecoins, with expansion to 95 countries and more than 60 currencies by the end of the year.
Global payouts support business-to-business (B2B), business-to-consumer (B2C), consumer-to-consumer (C2C), and consumer-to-business (C2B) transactions, whether a partner is sending funds to their own account or to someone else’s.
Global payouts are available now for select beta partners, with broader availability expected by the end of the year.
NEW YORK, Sept. 8, 2026 /PRNewswire/ — Rain, the enterprise-grade infrastructure for stablecoin payments, announced today an expansion of its global money movement technology platform, enabling partners to send payouts to more than 80 countries in 50 currencies, and plans to reach 95 countries and more than 60 currencies by the end of the year. The expanded capability gives Rain’s partners one way to pay others in the currency they actually use, from a single stablecoin balance. It supports business-to-business (B2B), business-to-consumer (B2C), consumer-to-consumer (C2C), and consumer-to-business (C2B) payouts, whether a partner is sending funds to their own account or to someone else’s.
Rain’s partners can now support payouts to more than 80 countries in 50 currencies from stablecoins.
Rain’s global payouts capability closes the last-mile gap for stablecoins by connecting onchain infrastructure with legacy rails. Partners fund payouts directly from the stablecoin balances they already hold, and Rain orchestrates the conversion of stablecoins to local currency through licensed partners.
Stablecoin cards were Rain’s original answer to making stablecoins spendable in the real world. The purchase is authorized like any other card transaction at the point of sale, but behind the scenes, Rain settles with the card networks in stablecoins, while the merchant gets paid in fiat. But card transactions represent just one way users want to use their stablecoins. A business in Bogotá still needs to pay a supplier in Lisbon. A contractor in Buenos Aires still needs pesos to pay their landlord for rent.
An expansion across pay-ins and payouts
Virtual accounts already let partners move money between fiat and stablecoins, covering both pay-ins and payouts. Rain’s global payouts extend the payout side of that stack to local currencies and local rails in more than 80 countries.
Together, the two capabilities mean a partner can bring pesos onchain through a virtual account in Mexico, hold them as stablecoins, and separately initiate a payout to a vendor in Argentina. Once the payout is initiated, a licensed partner would deliver Argentine pesos to the recipient’s bank account.
“Partners don’t want to stitch together several vendors every time they need to pay someone in a new country,” said Charles Yoo-Naut, CTO and co-founder of Rain. “They want one platform that powers the whole flow of funds, from stablecoins to local currency, wherever that money needs to land. Rain’s global payouts product is the next step in building that platform.”
Built for how partners actually move money
Rain built global payouts around the flows its partners already need it for:
Neobanks can offer money movement and payments services to their own consumer or business customers, without building and maintaining local banking relationships in every market themselves.
Marketplaces can pay a global base of sellers and drivers in their local currencies from a single stablecoin balance instead of prefunding an account in every country they operate in.
Contractor platforms can distribute payments to freelancers across borders, regardless of where they live.
Businesses can pay suppliers abroad from their onchain balance without requiring that vendor to accept stablecoins.
Settlement time depends on the rail and the destination. Many corridors settle in real time, others take up to two business days.
Rolling out now
Global payouts is live today with a select group of beta partners, and will roll out more broadly across Rain’s partner base over the coming months. Interested partners can work with their Account Manager to join the beta program and interested prospects can contact Partnerships at sales@rain.xyz.
Frequently Asked Questions
Question: What are global payouts?Answer: Global payouts are the latest capability in Rain’s global money movement product suite. It lets partners send money to recipients in more than 80 countries and 50 currencies, landing as local currency in the recipient’s own bank account, with plans to reach 95 countries and more than 60 currencies by the end of the year. The capability covers business-to-business (B2B), business-to-consumer (B2C), consumer-to-consumer (C2C), and consumer-to-business (C2B) payouts, whether a partner is sending funds to their own account or to someone else’s. Global payouts is live today with a select group of Rain partners and will expand to new partners over the coming months.
Question: What kinds of payments does Rain global payouts support?Answer: Rain supports business-to-business, business-to-consumer, consumer-to-consumer, and consumer-to-business payouts. Common use cases include marketplace seller payouts, contractor payments, consumer payments, and supplier or vendor payments.
Question: Does Rain offer more than stablecoin cards?Answer: Yes. Rain enables card issuing, rewards, embedded wallets, virtual accounts, and on/offramps via one platform. Expanding global payout capabilities means partners get the convenience of a single stack, with the flexibility and modularity to use only the pieces they need underneath it.
Question: What are Rain’s money movement capabilities?Answer: Rain provides a full suite of money movement technology, enabling partners to access global payouts, onramps and offramps, and virtual accounts in several currencies. Virtual accounts already support both pay-ins and payouts, moving money between fiat and stablecoins in multiple currencies. Global payouts expands the payout side of that stack specifically, extending Rain’s reach to local-currency payouts across more than 80 countries through local payment rails.
Question: Who are global payouts built for?Answer: Partners with a global base of recipients to pay: marketplaces paying sellers and drivers, contractor platforms hiring across borders, businesses paying suppliers and vendors abroad, and neobanks offering money movement services to their own consumer or business customers.
About Rain
Rain is the global stablecoin payments platform for enterprises, neobanks, platforms, developers, and AI agents. Our technology allows partners to move, store, and use stablecoins instantly and compliantly through global payment cards, rewards, on/offramps, stablecoin and fiat wallets, and cross-border rails. As both a Visa and Mastercard Principal Member, Rain issues cards that work at more than 175 million merchant locations in over 200 countries and territories. Built natively for stablecoins and trusted by more than 100 organizations worldwide, Rain delivers secure, scalable infrastructure that makes money move freely and instantly around the world. Learn more at https://www.rain.xyz/.
Media Contact:Joseph GalloCommunications Director, Rainjoseph@rain.xyz
SOURCE Rain
This post Rain Expands Global Payouts to More than 80 Countries in 50 Currencies first appeared on BitcoinWorld.
Payouts build on Rain’s existing money movement technology, which enables partners to offer virtual accounts, onramps, and offramps and give users even more ways to spend stablecoins
Key facts
Rain’s expanded global payouts capability broadens its money movement technology.
Rain’s partners can now support payouts to more than 80 countries in 50 currencies from stablecoins, with expansion to 95 countries and more than 60 currencies by the end of the year.
Global payouts support business-to-business (B2B), business-to-consumer (B2C), consumer-to-consumer (C2C), and consumer-to-business (C2B) transactions, whether a partner is sending funds to their own account or to someone else’s.
Global payouts are available now for select beta partners, with broader availability expected by the end of the year.
NEW YORK, Sept. 8, 2026 /PRNewswire/ — Rain, the enterprise-grade infrastructure for stablecoin payments, announced today an expansion of its global money movement technology platform, enabling partners to send payouts to more than 80 countries in 50 currencies, and plans to reach 95 countries and more than 60 currencies by the end of the year. The expanded capability gives Rain’s partners one way to pay others in the currency they actually use, from a single stablecoin balance. It supports business-to-business (B2B), business-to-consumer (B2C), consumer-to-consumer (C2C), and consumer-to-business (C2B) payouts, whether a partner is sending funds to their own account or to someone else’s.
Rain’s partners can now support payouts to more than 80 countries in 50 currencies from stablecoins.
Rain’s global payouts capability closes the last-mile gap for stablecoins by connecting onchain infrastructure with legacy rails. Partners fund payouts directly from the stablecoin balances they already hold, and Rain orchestrates the conversion of stablecoins to local currency through licensed partners.
Stablecoin cards were Rain’s original answer to making stablecoins spendable in the real world. The purchase is authorized like any other card transaction at the point of sale, but behind the scenes, Rain settles with the card networks in stablecoins, while the merchant gets paid in fiat. But card transactions represent just one way users want to use their stablecoins. A business in Bogotá still needs to pay a supplier in Lisbon. A contractor in Buenos Aires still needs pesos to pay their landlord for rent.
An expansion across pay-ins and payouts
Virtual accounts already let partners move money between fiat and stablecoins, covering both pay-ins and payouts. Rain’s global payouts extend the payout side of that stack to local currencies and local rails in more than 80 countries.
Together, the two capabilities mean a partner can bring pesos onchain through a virtual account in Mexico, hold them as stablecoins, and separately initiate a payout to a vendor in Argentina. Once the payout is initiated, a licensed partner would deliver Argentine pesos to the recipient’s bank account.
“Partners don’t want to stitch together several vendors every time they need to pay someone in a new country,” said Charles Yoo-Naut, CTO and co-founder of Rain. “They want one platform that powers the whole flow of funds, from stablecoins to local currency, wherever that money needs to land. Rain’s global payouts product is the next step in building that platform.”
Built for how partners actually move money
Rain built global payouts around the flows its partners already need it for:
Neobanks can offer money movement and payments services to their own consumer or business customers, without building and maintaining local banking relationships in every market themselves.
Marketplaces can pay a global base of sellers and drivers in their local currencies from a single stablecoin balance instead of prefunding an account in every country they operate in.
Contractor platforms can distribute payments to freelancers across borders, regardless of where they live.
Businesses can pay suppliers abroad from their onchain balance without requiring that vendor to accept stablecoins.
Settlement time depends on the rail and the destination. Many corridors settle in real time, others take up to two business days.
Rolling out now
Global payouts is live today with a select group of beta partners, and will roll out more broadly across Rain’s partner base over the coming months. Interested partners can work with their Account Manager to join the beta program and interested prospects can contact Partnerships at sales@rain.xyz.
Frequently Asked Questions
Question: What are global payouts?Answer: Global payouts are the latest capability in Rain’s global money movement product suite. It lets partners send money to recipients in more than 80 countries and 50 currencies, landing as local currency in the recipient’s own bank account, with plans to reach 95 countries and more than 60 currencies by the end of the year. The capability covers business-to-business (B2B), business-to-consumer (B2C), consumer-to-consumer (C2C), and consumer-to-business (C2B) payouts, whether a partner is sending funds to their own account or to someone else’s. Global payouts is live today with a select group of Rain partners and will expand to new partners over the coming months.
Question: What kinds of payments does Rain global payouts support?Answer: Rain supports business-to-business, business-to-consumer, consumer-to-consumer, and consumer-to-business payouts. Common use cases include marketplace seller payouts, contractor payments, consumer payments, and supplier or vendor payments.
Question: Does Rain offer more than stablecoin cards?Answer: Yes. Rain enables card issuing, rewards, embedded wallets, virtual accounts, and on/offramps via one platform. Expanding global payout capabilities means partners get the convenience of a single stack, with the flexibility and modularity to use only the pieces they need underneath it.
Question: What are Rain’s money movement capabilities?Answer: Rain provides a full suite of money movement technology, enabling partners to access global payouts, onramps and offramps, and virtual accounts in several currencies. Virtual accounts already support both pay-ins and payouts, moving money between fiat and stablecoins in multiple currencies. Global payouts expands the payout side of that stack specifically, extending Rain’s reach to local-currency payouts across more than 80 countries through local payment rails.
Question: Who are global payouts built for?Answer: Partners with a global base of recipients to pay: marketplaces paying sellers and drivers, contractor platforms hiring across borders, businesses paying suppliers and vendors abroad, and neobanks offering money movement services to their own consumer or business customers.
About Rain
Rain is the global stablecoin payments platform for enterprises, neobanks, platforms, developers, and AI agents. Our technology allows partners to move, store, and use stablecoins instantly and compliantly through global payment cards, rewards, on/offramps, stablecoin and fiat wallets, and cross-border rails. As both a Visa and Mastercard Principal Member, Rain issues cards that work at more than 175 million merchant locations in over 200 countries and territories. Built natively for stablecoins and trusted by more than 100 organizations worldwide, Rain delivers secure, scalable infrastructure that makes money move freely and instantly around the world. Learn more at https://www.rain.xyz/.
Media Contact:Joseph GalloCommunications Director, Rainjoseph@rain.xyz
SOURCE Rain
This post Rain Expands Global Payouts to More than 80 Countries in 50 Currencies first appeared on BitcoinWorld.
152
·
--

Article
Pitch Fest Bali 2026 Wraps: ObsessionDB Wins, 13 Startups Pitch to a Room of Leading VCsBitcoinWorldPitch Fest Bali 2026 Wraps: ObsessionDB Wins, 13 Startups Pitch to a Room of Leading VCs
DeltaV-presented, invite-only Web3 demo day drew a VC panel spanning SC Ventures, TBV, Ape Ventures, Yellow, Cicada, and Kosmos Ventures, with $100K+ in prizes, credits, and support on the line. Held August 19 in Jimbaran, Bali, the day before Coinfest Asia.
BALI, INDONESIA. [ Release Date ]. Luvon Labs and SpedaxAI wrapped Pitch Fest Bali 2026 on August 19, an invite-only Web3 demo day presented by DeltaV and held at Dewata Padel in Jimbaran, the day before Coinfest Asia. Thirteen curated startups pitched live to a panel of leading venture investors, competing for a prize pool of more than $100,000 in prizes, credits, and support.
The room delivered on what it promised. Founders, funds, and exchanges spent the day in a curated space built for real conversations instead of conference-floor noise, and the read since has been consistent: attendees and partners have called it one of the most ROI-driven side events of Coinfest Asia week.
ObsessionDB Takes the Win
After thirteen live pitches, ObsessionDB took first place, and in a fitting turn, one of the event’s own infrastructure sponsors backed the room, then won it. ObsessionDB is fully managed ClickHouse, the same engine, queries, and tools teams already know, delivering sub-second queries at any scale without any infrastructure to run themselves.
Provvypay placed second. The startup runs a unified payment infrastructure connecting Stripe and Hedera with automated accounting, giving businesses a real-time view of their commercial position before it hits the books.
MOI placed third. MOI is building the participant layer for AI agents, giving every human or agent persistent, on-chain, portable identity and authority in computation, so agents can be monitored, scoped, and revoked in real time.
A Judging Panel That Showed Up
Founders pitched to a panel that included Alexis Sirkia (Co-Founder and Captain, Yellow), Tobias Bauer (Co-Founder and General Partner, TBV), Maxim Moris (Co-Founder and CEO, Cicada), Sheridan Hammond (Founder, Kosmos Ventures), Daria Chernozub (Global Adoption Head and SEA Lead, Dash), Alex Toh (Lead, Funds Management, SC Ventures by Standard Chartered), and Ardi Wicaksono (Head of Blockchain and Web3 Investment, Hilton Tech Fund). Trive Digital, Spores Network, and CoinSwitch Ventures were also in the room as attending VCs.
Partners Behind the Day
Pitch Fest Bali 2026 was presented by DeltaV as title sponsor, with Golden Grid, ObsessionDB, Kenomic, hashlock, [H.E.], and humaneffort on board as sponsors. BrandPR served as PR partner, and Dewata Padel hosted the day as venue partner. WEEX joined as a notable attending exchange, and the event was amplified by more than 50 media and community partners across the region.
EV-GO also joined as a partner. EV-GO is the first real-world utility project backed by EV-READY and ID Opentech, Indonesia’s largest EV group, with more than 1 million vehicle-to-EV conversion quotas already secured and a battery infrastructure build-out worth over $1 billion.
Backerstage Capital came on as an event partner. The team runs closed, founder-and-investor events across crypto, ten so far across six countries, with their next stop being the Founder x VC Summit in Singapore this October during Token2049 week.
In Their Words
“The pitches were the easy part,” said Anubhav Tomar, Co-Founder of Luvon Labs. “What made the day work was the room itself. Watching one of our own sponsors pitch their way to the win says everything about what we built here.”
What’s Next
Bali is the first stop in a planned series of curated demo days across major global crypto hubs, with editions targeted for Singapore, Mumbai, and London. Partners who came in early on Bali get a head start on a platform built to grow across several markets.
About Luvon Labs
Luvon Labs is a full-stack venture partner for Web3 founders, working end-to-end from build to raise. The studio ships the entire stack, brand and UX, smart contracts in Solidity and Rust, AI agents, mobile apps, and the infrastructure that keeps products live and scaling, then stays in the room through go-to-market and fundraising, backed by a global investor network built over years in the ecosystem. To date, Luvon Labs has shipped 50+ products for 30+ clients across 15+ countries, spanning BNB Chain, EVM, and Solana. Guided by its philosophy, Build With Intent, Luvon treats every team it works with as a long-term relationship, not a one-off engagement. More at luvonlabs.com.
About SpedaxAI
SpedaxAI is a no-code AI creation studio that lets businesses and creators build, deploy, and monetize autonomous AI agents in minutes. It combines enterprise-grade AI models with Web3 infrastructure, so users can embed custom agents across platforms or mint them as ownable, royalty-earning digital assets. More at spedaxai.com.
About BrandPR
BrandPR is a specialized PR and marketing agency partnering with Luvon Labs to empower AI and Web3 brands worldwide. Since 2022, BrandPR has helped crypto, blockchain, and AI clients gain exposure through top-tier media coverage and community-building. More at brandpr.io.About Golden Grid
Golden Grid is an on-chain pixel lottery where players claim a block on a living grid with original pixel art or a logo, connect their wallet, and take a shot at crypto, NFTs, and rewards from a prize pool that grows as more players join. Built around the lore of Ratoshi and the Syndicate, the platform runs on one rule: luck must circulate. More at goldengrid.xyz.
About HashLock
Hashlock is the industry leading blockchain cybersecurity and smart contract auditing firm. We specialise in manual analysis led security research, securing billions of dollars in digital assets, with clients ranging from innovative web3 startups to global blockchain enterprises.More at https://hashlock.com/
About Kenomic
Kenomic is an AI-powered platform built for the entire token lifecycle, guiding founders through design, validation, launch, and post-launch management in one place. Its conversational AI agent, Keni, turns a plain project description into a launch-ready tokenomics model, backed by a digital-twin simulation engine that stress-tests the design across millions of market scenarios and a Kenomic Score that measures resilience before launch. Kenomic then deploys audit-grade smart contracts across 9 chains and keeps managing vesting, staking, airdrops, and treasury long after launch day. More at kenomic.ai.
Media and Partnership Contact
Anubhav Tomar, Co-Founder, Luvon Labs
Email: anubhav@luvonlabs.com
Telegram: @anubhavcfx
Web: Luvonlabs.com
This post Pitch Fest Bali 2026 Wraps: ObsessionDB Wins, 13 Startups Pitch to a Room of Leading VCs first appeared on BitcoinWorld.
Pitch Fest Bali 2026 Wraps: ObsessionDB Wins, 13 Startups Pitch to a Room of Leading VCs
BitcoinWorldPitch Fest Bali 2026 Wraps: ObsessionDB Wins, 13 Startups Pitch to a Room of Leading VCs
DeltaV-presented, invite-only Web3 demo day drew a VC panel spanning SC Ventures, TBV, Ape Ventures, Yellow, Cicada, and Kosmos Ventures, with $100K+ in prizes, credits, and support on the line. Held August 19 in Jimbaran, Bali, the day before Coinfest Asia.
BALI, INDONESIA. [ Release Date ]. Luvon Labs and SpedaxAI wrapped Pitch Fest Bali 2026 on August 19, an invite-only Web3 demo day presented by DeltaV and held at Dewata Padel in Jimbaran, the day before Coinfest Asia. Thirteen curated startups pitched live to a panel of leading venture investors, competing for a prize pool of more than $100,000 in prizes, credits, and support.
The room delivered on what it promised. Founders, funds, and exchanges spent the day in a curated space built for real conversations instead of conference-floor noise, and the read since has been consistent: attendees and partners have called it one of the most ROI-driven side events of Coinfest Asia week.
ObsessionDB Takes the Win
After thirteen live pitches, ObsessionDB took first place, and in a fitting turn, one of the event’s own infrastructure sponsors backed the room, then won it. ObsessionDB is fully managed ClickHouse, the same engine, queries, and tools teams already know, delivering sub-second queries at any scale without any infrastructure to run themselves.
Provvypay placed second. The startup runs a unified payment infrastructure connecting Stripe and Hedera with automated accounting, giving businesses a real-time view of their commercial position before it hits the books.
MOI placed third. MOI is building the participant layer for AI agents, giving every human or agent persistent, on-chain, portable identity and authority in computation, so agents can be monitored, scoped, and revoked in real time.
A Judging Panel That Showed Up
Founders pitched to a panel that included Alexis Sirkia (Co-Founder and Captain, Yellow), Tobias Bauer (Co-Founder and General Partner, TBV), Maxim Moris (Co-Founder and CEO, Cicada), Sheridan Hammond (Founder, Kosmos Ventures), Daria Chernozub (Global Adoption Head and SEA Lead, Dash), Alex Toh (Lead, Funds Management, SC Ventures by Standard Chartered), and Ardi Wicaksono (Head of Blockchain and Web3 Investment, Hilton Tech Fund). Trive Digital, Spores Network, and CoinSwitch Ventures were also in the room as attending VCs.
Partners Behind the Day
Pitch Fest Bali 2026 was presented by DeltaV as title sponsor, with Golden Grid, ObsessionDB, Kenomic, hashlock, [H.E.], and humaneffort on board as sponsors. BrandPR served as PR partner, and Dewata Padel hosted the day as venue partner. WEEX joined as a notable attending exchange, and the event was amplified by more than 50 media and community partners across the region.
EV-GO also joined as a partner. EV-GO is the first real-world utility project backed by EV-READY and ID Opentech, Indonesia’s largest EV group, with more than 1 million vehicle-to-EV conversion quotas already secured and a battery infrastructure build-out worth over $1 billion.
Backerstage Capital came on as an event partner. The team runs closed, founder-and-investor events across crypto, ten so far across six countries, with their next stop being the Founder x VC Summit in Singapore this October during Token2049 week.
In Their Words
“The pitches were the easy part,” said Anubhav Tomar, Co-Founder of Luvon Labs. “What made the day work was the room itself. Watching one of our own sponsors pitch their way to the win says everything about what we built here.”
What’s Next
Bali is the first stop in a planned series of curated demo days across major global crypto hubs, with editions targeted for Singapore, Mumbai, and London. Partners who came in early on Bali get a head start on a platform built to grow across several markets.
About Luvon Labs
Luvon Labs is a full-stack venture partner for Web3 founders, working end-to-end from build to raise. The studio ships the entire stack, brand and UX, smart contracts in Solidity and Rust, AI agents, mobile apps, and the infrastructure that keeps products live and scaling, then stays in the room through go-to-market and fundraising, backed by a global investor network built over years in the ecosystem. To date, Luvon Labs has shipped 50+ products for 30+ clients across 15+ countries, spanning BNB Chain, EVM, and Solana. Guided by its philosophy, Build With Intent, Luvon treats every team it works with as a long-term relationship, not a one-off engagement. More at luvonlabs.com.
About SpedaxAI
SpedaxAI is a no-code AI creation studio that lets businesses and creators build, deploy, and monetize autonomous AI agents in minutes. It combines enterprise-grade AI models with Web3 infrastructure, so users can embed custom agents across platforms or mint them as ownable, royalty-earning digital assets. More at spedaxai.com.
About BrandPR
BrandPR is a specialized PR and marketing agency partnering with Luvon Labs to empower AI and Web3 brands worldwide. Since 2022, BrandPR has helped crypto, blockchain, and AI clients gain exposure through top-tier media coverage and community-building. More at brandpr.io.About Golden Grid
Golden Grid is an on-chain pixel lottery where players claim a block on a living grid with original pixel art or a logo, connect their wallet, and take a shot at crypto, NFTs, and rewards from a prize pool that grows as more players join. Built around the lore of Ratoshi and the Syndicate, the platform runs on one rule: luck must circulate. More at goldengrid.xyz.
About HashLock
Hashlock is the industry leading blockchain cybersecurity and smart contract auditing firm. We specialise in manual analysis led security research, securing billions of dollars in digital assets, with clients ranging from innovative web3 startups to global blockchain enterprises.More at https://hashlock.com/
About Kenomic
Kenomic is an AI-powered platform built for the entire token lifecycle, guiding founders through design, validation, launch, and post-launch management in one place. Its conversational AI agent, Keni, turns a plain project description into a launch-ready tokenomics model, backed by a digital-twin simulation engine that stress-tests the design across millions of market scenarios and a Kenomic Score that measures resilience before launch. Kenomic then deploys audit-grade smart contracts across 9 chains and keeps managing vesting, staking, airdrops, and treasury long after launch day. More at kenomic.ai.
Media and Partnership Contact
Anubhav Tomar, Co-Founder, Luvon Labs
Email: anubhav@luvonlabs.com
Telegram: @anubhavcfx
Web: Luvonlabs.com
This post Pitch Fest Bali 2026 Wraps: ObsessionDB Wins, 13 Startups Pitch to a Room of Leading VCs first appeared on BitcoinWorld.
DeltaV-presented, invite-only Web3 demo day drew a VC panel spanning SC Ventures, TBV, Ape Ventures, Yellow, Cicada, and Kosmos Ventures, with $100K+ in prizes, credits, and support on the line. Held August 19 in Jimbaran, Bali, the day before Coinfest Asia.
BALI, INDONESIA. [ Release Date ]. Luvon Labs and SpedaxAI wrapped Pitch Fest Bali 2026 on August 19, an invite-only Web3 demo day presented by DeltaV and held at Dewata Padel in Jimbaran, the day before Coinfest Asia. Thirteen curated startups pitched live to a panel of leading venture investors, competing for a prize pool of more than $100,000 in prizes, credits, and support.
The room delivered on what it promised. Founders, funds, and exchanges spent the day in a curated space built for real conversations instead of conference-floor noise, and the read since has been consistent: attendees and partners have called it one of the most ROI-driven side events of Coinfest Asia week.
ObsessionDB Takes the Win
After thirteen live pitches, ObsessionDB took first place, and in a fitting turn, one of the event’s own infrastructure sponsors backed the room, then won it. ObsessionDB is fully managed ClickHouse, the same engine, queries, and tools teams already know, delivering sub-second queries at any scale without any infrastructure to run themselves.
Provvypay placed second. The startup runs a unified payment infrastructure connecting Stripe and Hedera with automated accounting, giving businesses a real-time view of their commercial position before it hits the books.
MOI placed third. MOI is building the participant layer for AI agents, giving every human or agent persistent, on-chain, portable identity and authority in computation, so agents can be monitored, scoped, and revoked in real time.
A Judging Panel That Showed Up
Founders pitched to a panel that included Alexis Sirkia (Co-Founder and Captain, Yellow), Tobias Bauer (Co-Founder and General Partner, TBV), Maxim Moris (Co-Founder and CEO, Cicada), Sheridan Hammond (Founder, Kosmos Ventures), Daria Chernozub (Global Adoption Head and SEA Lead, Dash), Alex Toh (Lead, Funds Management, SC Ventures by Standard Chartered), and Ardi Wicaksono (Head of Blockchain and Web3 Investment, Hilton Tech Fund). Trive Digital, Spores Network, and CoinSwitch Ventures were also in the room as attending VCs.
Partners Behind the Day
Pitch Fest Bali 2026 was presented by DeltaV as title sponsor, with Golden Grid, ObsessionDB, Kenomic, hashlock, [H.E.], and humaneffort on board as sponsors. BrandPR served as PR partner, and Dewata Padel hosted the day as venue partner. WEEX joined as a notable attending exchange, and the event was amplified by more than 50 media and community partners across the region.
EV-GO also joined as a partner. EV-GO is the first real-world utility project backed by EV-READY and ID Opentech, Indonesia’s largest EV group, with more than 1 million vehicle-to-EV conversion quotas already secured and a battery infrastructure build-out worth over $1 billion.
Backerstage Capital came on as an event partner. The team runs closed, founder-and-investor events across crypto, ten so far across six countries, with their next stop being the Founder x VC Summit in Singapore this October during Token2049 week.
In Their Words
“The pitches were the easy part,” said Anubhav Tomar, Co-Founder of Luvon Labs. “What made the day work was the room itself. Watching one of our own sponsors pitch their way to the win says everything about what we built here.”
What’s Next
Bali is the first stop in a planned series of curated demo days across major global crypto hubs, with editions targeted for Singapore, Mumbai, and London. Partners who came in early on Bali get a head start on a platform built to grow across several markets.
About Luvon Labs
Luvon Labs is a full-stack venture partner for Web3 founders, working end-to-end from build to raise. The studio ships the entire stack, brand and UX, smart contracts in Solidity and Rust, AI agents, mobile apps, and the infrastructure that keeps products live and scaling, then stays in the room through go-to-market and fundraising, backed by a global investor network built over years in the ecosystem. To date, Luvon Labs has shipped 50+ products for 30+ clients across 15+ countries, spanning BNB Chain, EVM, and Solana. Guided by its philosophy, Build With Intent, Luvon treats every team it works with as a long-term relationship, not a one-off engagement. More at luvonlabs.com.
About SpedaxAI
SpedaxAI is a no-code AI creation studio that lets businesses and creators build, deploy, and monetize autonomous AI agents in minutes. It combines enterprise-grade AI models with Web3 infrastructure, so users can embed custom agents across platforms or mint them as ownable, royalty-earning digital assets. More at spedaxai.com.
About BrandPR
BrandPR is a specialized PR and marketing agency partnering with Luvon Labs to empower AI and Web3 brands worldwide. Since 2022, BrandPR has helped crypto, blockchain, and AI clients gain exposure through top-tier media coverage and community-building. More at brandpr.io.About Golden Grid
Golden Grid is an on-chain pixel lottery where players claim a block on a living grid with original pixel art or a logo, connect their wallet, and take a shot at crypto, NFTs, and rewards from a prize pool that grows as more players join. Built around the lore of Ratoshi and the Syndicate, the platform runs on one rule: luck must circulate. More at goldengrid.xyz.
About HashLock
Hashlock is the industry leading blockchain cybersecurity and smart contract auditing firm. We specialise in manual analysis led security research, securing billions of dollars in digital assets, with clients ranging from innovative web3 startups to global blockchain enterprises.More at https://hashlock.com/
About Kenomic
Kenomic is an AI-powered platform built for the entire token lifecycle, guiding founders through design, validation, launch, and post-launch management in one place. Its conversational AI agent, Keni, turns a plain project description into a launch-ready tokenomics model, backed by a digital-twin simulation engine that stress-tests the design across millions of market scenarios and a Kenomic Score that measures resilience before launch. Kenomic then deploys audit-grade smart contracts across 9 chains and keeps managing vesting, staking, airdrops, and treasury long after launch day. More at kenomic.ai.
Media and Partnership Contact
Anubhav Tomar, Co-Founder, Luvon Labs
Email: anubhav@luvonlabs.com
Telegram: @anubhavcfx
Web: Luvonlabs.com
This post Pitch Fest Bali 2026 Wraps: ObsessionDB Wins, 13 Startups Pitch to a Room of Leading VCs first appeared on BitcoinWorld.
126
·
--

Article
Spain’s Biggest Crypto Exchange Just Told the Government: We’re Not Just a Trading App AnymoreBitcoinWorldSpain’s Biggest Crypto Exchange Just Told the Government: We’re Not Just a Trading App Anymore
There’s a version of this story that reads as a minor corporate announcement – a Spanish exchange formalizes some compliance work it was already doing, gives it a name, and issues a press release. That’s technically what happened. But look at Bit2Me’s broader trajectory over the past year, and the launch of Bit2Shield looks less like a compliance footnote and more like the clearest signal yet of where Europe’s most successful retail crypto platforms are actually trying to go: away from being an app people use to buy Bitcoin, and toward being the infrastructure that banks, courts, and police departments quietly depend on.
What Bit2Shield Actually Does
The new unit – structured as a separate Spanish legal entity called Cryptoshield SL – is built to support four distinct functions for authorities: tracing crypto assets tied to criminal activity, providing secure cold-wallet custody for seized funds, arranging court-ordered sales of confiscated assets, and conducting fraud investigations including fund-origin verification. It also offers training for police officers, judges, and bank compliance staff – an acknowledgment that a meaningful bottleneck in crypto crime enforcement isn’t just technical capability, it’s that most judges and investigators simply haven’t been trained to understand how blockchain forensics actually works.
Crucially, Bit2Me has structured Bit2Shield to sit outside the European Union’s Markets in Crypto-Assets regulation, positioning it as an investigative and forensic service rather than a crypto-asset service provider. That’s a deliberate legal choice, not an oversight – any actual conversion of seized crypto into euros will continue running through Bitcoinforme S.L., Bit2Me’s separately authorized entity under Spain’s securities regulator. Splitting the investigative and forensic work from the fiat-conversion function lets Bit2Me offer government-facing services without those services needing to clear the same regulatory bar as its consumer exchange business – a structural move that other exchanges eyeing similar government contracts will likely study closely.
This Formalizes Work That Was Already Quietly Happening
Bit2Shield isn’t Bit2Me’s first attempt at this kind of work – it’s the formalization of a pipeline the company built informally over the past year. In 2025, Bit2Me processed roughly €1.5 million in seized cryptocurrency on behalf of Interpol, Europol, and Spanish national police, using blockchain analytics firm Chainalysis to trace the funds before converting the proceeds into euros for delivery to government accounts. That earlier arrangement effectively made Bit2Me a crypto liquidator for the Spanish state – a role broadly analogous to the U.S. Marshals Service’s well-established relationship with Coinbase, which has handled forfeited crypto for American law enforcement for years.
What’s changed with Bit2Shield is scale and permanence. Rather than continuing to run this as an ad hoc service layered on top of its retail exchange operations, Bit2Me has built dedicated legal and organizational infrastructure specifically for government and judicial clients – cold-storage custody requiring multiple signatures for seized assets, a formal training curriculum, and a standing capability to support investigations rather than responding case-by-case. That’s the difference between a company that occasionally helps the police and a company that has decided helping the police is a genuine, ongoing line of business.
Why This Fits a Much Bigger Strategic Pivot
Bit2Shield makes more sense once you place it inside Bit2Me’s broader transformation over the past two years. The company’s trading volume grew roughly eightfold between 2023 and 2025, reaching €5.3 billion, but the more telling shift has been in who the company is building for. Bit2Me became the first platform in Spain to secure a Crypto-Asset Service Provider authorization under MiCA – the EU’s new comprehensive crypto framework – reportedly investing around €2.5 million and roughly 3,000 hours of work to get there. That license, along with backing from an unusually institutional roster of investors – Bankinter, Unicaja, Cecabank, Telefónica, and stablecoin issuer Tether among them – has positioned Bit2Me less as a scrappy retail platform competing for individual traders and more as regulated financial infrastructure that traditional banks are willing to build on top of rather than compete against.
That’s a meaningfully different business model than the one most people associate with crypto exchanges. Banks joining Bit2Me’s cap table aren’t primarily betting on retail trading fees – they’re betting that Bit2Me becomes the compliant, licensed layer through which they can offer crypto-adjacent services to their own customers without building that capability from scratch. Bit2Shield extends that same logic to a different institutional customer: instead of banks outsourcing crypto infrastructure to Bit2Me, it’s law enforcement and courts outsourcing crypto forensics and asset handling.
The Structural Problem This Is Actually Solving
It’s worth understanding why this kind of service is genuinely necessary rather than just a business opportunity. Police departments and courts across Europe generally weren’t built with the expertise, licensing, or technical infrastructure to trace blockchain transactions, securely custody seized digital assets pending a judicial process, or convert those assets into fiat without exposing the government to custody risk or market volatility during a lengthy legal proceeding. A seized wallet of Bitcoin sitting in a government evidence room isn’t like seized cash – it requires active technical management, multi-signature security protocols, and market timing decisions that most law enforcement agencies simply aren’t equipped to handle in-house.
This gap has already produced a range of public-private partnership models across the industry – the T3 Financial Crime Unit, a consortium involving Tron, Tether, and blockchain analytics firm TRM Labs, has assisted Spanish authorities including the Guardia Civil in freezing well over a hundred million dollars tied to organized financial crime networks, illustrating how normalized this kind of collaboration between crypto-native firms and law enforcement has become. Bit2Shield fits squarely into that trend, but with a distinguishing feature: it’s coming from Spain’s own dominant domestic exchange, not an international consortium – giving it a home-field advantage in relationships with Spanish courts and police that foreign firms would need years to build.
What This Means for Crypto Crime Victims and the Broader Ecosystem
There’s a practical upside here that extends beyond Bit2Me’s business interests. Spain’s central bank has been explicit that blockchain transactions generally can’t be reversed once completed – a structural reality that makes crypto fraud uniquely difficult to remedy compared to traditional bank fraud, where a bank can sometimes claw back a fraudulent transfer. What a service like Bit2Shield can realistically offer isn’t reversal, but faster identification: if stolen or fraudulently obtained funds move through an identifiable, licensed provider, that provider can freeze the receiving account or flag the wallet address before the funds move further into obscurity. That’s a meaningfully narrower promise than “getting your money back,” but it’s a genuine capability that most victims of crypto fraud currently have no reliable access to, since most police departments lack the in-house tools to trace funds quickly enough to matter.
For the broader industry, Bit2Shield adds to a growing body of evidence that the divide between “crypto” and “law enforcement” is closing faster than the popular narrative of an adversarial relationship between crypto and regulators would suggest. Major exchanges increasingly see cooperation with authorities not as a regulatory burden to be minimized, but as a service line that legitimizes their broader business and, not incidentally, gives them a formal seat at the table when future crypto regulation gets written.
Conclusion
Bit2Shield’s launch won’t generate the kind of headlines that a market crash or a major hack does, but it’s a more revealing signal about where the crypto industry’s most successful regulated players are actually headed. Bit2Me isn’t betting its future primarily on more people opening retail trading accounts – it’s betting on becoming indispensable infrastructure for the institutions that increasingly determine whether crypto succeeds as a legitimate part of the financial system: banks that need a compliant partner, and governments that need help doing what blockchain forensics increasingly makes possible but most public agencies still can’t do on their own. That’s a quieter ambition than building the next big trading platform, but arguably a more durable one.
This post Spain’s Biggest Crypto Exchange Just Told the Government: We’re Not Just a Trading App Anymore first appeared on BitcoinWorld.
Spain’s Biggest Crypto Exchange Just Told the Government: We’re Not Just a Trading App Anymore
BitcoinWorldSpain’s Biggest Crypto Exchange Just Told the Government: We’re Not Just a Trading App Anymore
There’s a version of this story that reads as a minor corporate announcement – a Spanish exchange formalizes some compliance work it was already doing, gives it a name, and issues a press release. That’s technically what happened. But look at Bit2Me’s broader trajectory over the past year, and the launch of Bit2Shield looks less like a compliance footnote and more like the clearest signal yet of where Europe’s most successful retail crypto platforms are actually trying to go: away from being an app people use to buy Bitcoin, and toward being the infrastructure that banks, courts, and police departments quietly depend on.
What Bit2Shield Actually Does
The new unit – structured as a separate Spanish legal entity called Cryptoshield SL – is built to support four distinct functions for authorities: tracing crypto assets tied to criminal activity, providing secure cold-wallet custody for seized funds, arranging court-ordered sales of confiscated assets, and conducting fraud investigations including fund-origin verification. It also offers training for police officers, judges, and bank compliance staff – an acknowledgment that a meaningful bottleneck in crypto crime enforcement isn’t just technical capability, it’s that most judges and investigators simply haven’t been trained to understand how blockchain forensics actually works.
Crucially, Bit2Me has structured Bit2Shield to sit outside the European Union’s Markets in Crypto-Assets regulation, positioning it as an investigative and forensic service rather than a crypto-asset service provider. That’s a deliberate legal choice, not an oversight – any actual conversion of seized crypto into euros will continue running through Bitcoinforme S.L., Bit2Me’s separately authorized entity under Spain’s securities regulator. Splitting the investigative and forensic work from the fiat-conversion function lets Bit2Me offer government-facing services without those services needing to clear the same regulatory bar as its consumer exchange business – a structural move that other exchanges eyeing similar government contracts will likely study closely.
This Formalizes Work That Was Already Quietly Happening
Bit2Shield isn’t Bit2Me’s first attempt at this kind of work – it’s the formalization of a pipeline the company built informally over the past year. In 2025, Bit2Me processed roughly €1.5 million in seized cryptocurrency on behalf of Interpol, Europol, and Spanish national police, using blockchain analytics firm Chainalysis to trace the funds before converting the proceeds into euros for delivery to government accounts. That earlier arrangement effectively made Bit2Me a crypto liquidator for the Spanish state – a role broadly analogous to the U.S. Marshals Service’s well-established relationship with Coinbase, which has handled forfeited crypto for American law enforcement for years.
What’s changed with Bit2Shield is scale and permanence. Rather than continuing to run this as an ad hoc service layered on top of its retail exchange operations, Bit2Me has built dedicated legal and organizational infrastructure specifically for government and judicial clients – cold-storage custody requiring multiple signatures for seized assets, a formal training curriculum, and a standing capability to support investigations rather than responding case-by-case. That’s the difference between a company that occasionally helps the police and a company that has decided helping the police is a genuine, ongoing line of business.
Why This Fits a Much Bigger Strategic Pivot
Bit2Shield makes more sense once you place it inside Bit2Me’s broader transformation over the past two years. The company’s trading volume grew roughly eightfold between 2023 and 2025, reaching €5.3 billion, but the more telling shift has been in who the company is building for. Bit2Me became the first platform in Spain to secure a Crypto-Asset Service Provider authorization under MiCA – the EU’s new comprehensive crypto framework – reportedly investing around €2.5 million and roughly 3,000 hours of work to get there. That license, along with backing from an unusually institutional roster of investors – Bankinter, Unicaja, Cecabank, Telefónica, and stablecoin issuer Tether among them – has positioned Bit2Me less as a scrappy retail platform competing for individual traders and more as regulated financial infrastructure that traditional banks are willing to build on top of rather than compete against.
That’s a meaningfully different business model than the one most people associate with crypto exchanges. Banks joining Bit2Me’s cap table aren’t primarily betting on retail trading fees – they’re betting that Bit2Me becomes the compliant, licensed layer through which they can offer crypto-adjacent services to their own customers without building that capability from scratch. Bit2Shield extends that same logic to a different institutional customer: instead of banks outsourcing crypto infrastructure to Bit2Me, it’s law enforcement and courts outsourcing crypto forensics and asset handling.
The Structural Problem This Is Actually Solving
It’s worth understanding why this kind of service is genuinely necessary rather than just a business opportunity. Police departments and courts across Europe generally weren’t built with the expertise, licensing, or technical infrastructure to trace blockchain transactions, securely custody seized digital assets pending a judicial process, or convert those assets into fiat without exposing the government to custody risk or market volatility during a lengthy legal proceeding. A seized wallet of Bitcoin sitting in a government evidence room isn’t like seized cash – it requires active technical management, multi-signature security protocols, and market timing decisions that most law enforcement agencies simply aren’t equipped to handle in-house.
This gap has already produced a range of public-private partnership models across the industry – the T3 Financial Crime Unit, a consortium involving Tron, Tether, and blockchain analytics firm TRM Labs, has assisted Spanish authorities including the Guardia Civil in freezing well over a hundred million dollars tied to organized financial crime networks, illustrating how normalized this kind of collaboration between crypto-native firms and law enforcement has become. Bit2Shield fits squarely into that trend, but with a distinguishing feature: it’s coming from Spain’s own dominant domestic exchange, not an international consortium – giving it a home-field advantage in relationships with Spanish courts and police that foreign firms would need years to build.
What This Means for Crypto Crime Victims and the Broader Ecosystem
There’s a practical upside here that extends beyond Bit2Me’s business interests. Spain’s central bank has been explicit that blockchain transactions generally can’t be reversed once completed – a structural reality that makes crypto fraud uniquely difficult to remedy compared to traditional bank fraud, where a bank can sometimes claw back a fraudulent transfer. What a service like Bit2Shield can realistically offer isn’t reversal, but faster identification: if stolen or fraudulently obtained funds move through an identifiable, licensed provider, that provider can freeze the receiving account or flag the wallet address before the funds move further into obscurity. That’s a meaningfully narrower promise than “getting your money back,” but it’s a genuine capability that most victims of crypto fraud currently have no reliable access to, since most police departments lack the in-house tools to trace funds quickly enough to matter.
For the broader industry, Bit2Shield adds to a growing body of evidence that the divide between “crypto” and “law enforcement” is closing faster than the popular narrative of an adversarial relationship between crypto and regulators would suggest. Major exchanges increasingly see cooperation with authorities not as a regulatory burden to be minimized, but as a service line that legitimizes their broader business and, not incidentally, gives them a formal seat at the table when future crypto regulation gets written.
Conclusion
Bit2Shield’s launch won’t generate the kind of headlines that a market crash or a major hack does, but it’s a more revealing signal about where the crypto industry’s most successful regulated players are actually headed. Bit2Me isn’t betting its future primarily on more people opening retail trading accounts – it’s betting on becoming indispensable infrastructure for the institutions that increasingly determine whether crypto succeeds as a legitimate part of the financial system: banks that need a compliant partner, and governments that need help doing what blockchain forensics increasingly makes possible but most public agencies still can’t do on their own. That’s a quieter ambition than building the next big trading platform, but arguably a more durable one.
This post Spain’s Biggest Crypto Exchange Just Told the Government: We’re Not Just a Trading App Anymore first appeared on BitcoinWorld.
There’s a version of this story that reads as a minor corporate announcement – a Spanish exchange formalizes some compliance work it was already doing, gives it a name, and issues a press release. That’s technically what happened. But look at Bit2Me’s broader trajectory over the past year, and the launch of Bit2Shield looks less like a compliance footnote and more like the clearest signal yet of where Europe’s most successful retail crypto platforms are actually trying to go: away from being an app people use to buy Bitcoin, and toward being the infrastructure that banks, courts, and police departments quietly depend on.
What Bit2Shield Actually Does
The new unit – structured as a separate Spanish legal entity called Cryptoshield SL – is built to support four distinct functions for authorities: tracing crypto assets tied to criminal activity, providing secure cold-wallet custody for seized funds, arranging court-ordered sales of confiscated assets, and conducting fraud investigations including fund-origin verification. It also offers training for police officers, judges, and bank compliance staff – an acknowledgment that a meaningful bottleneck in crypto crime enforcement isn’t just technical capability, it’s that most judges and investigators simply haven’t been trained to understand how blockchain forensics actually works.
Crucially, Bit2Me has structured Bit2Shield to sit outside the European Union’s Markets in Crypto-Assets regulation, positioning it as an investigative and forensic service rather than a crypto-asset service provider. That’s a deliberate legal choice, not an oversight – any actual conversion of seized crypto into euros will continue running through Bitcoinforme S.L., Bit2Me’s separately authorized entity under Spain’s securities regulator. Splitting the investigative and forensic work from the fiat-conversion function lets Bit2Me offer government-facing services without those services needing to clear the same regulatory bar as its consumer exchange business – a structural move that other exchanges eyeing similar government contracts will likely study closely.
This Formalizes Work That Was Already Quietly Happening
Bit2Shield isn’t Bit2Me’s first attempt at this kind of work – it’s the formalization of a pipeline the company built informally over the past year. In 2025, Bit2Me processed roughly €1.5 million in seized cryptocurrency on behalf of Interpol, Europol, and Spanish national police, using blockchain analytics firm Chainalysis to trace the funds before converting the proceeds into euros for delivery to government accounts. That earlier arrangement effectively made Bit2Me a crypto liquidator for the Spanish state – a role broadly analogous to the U.S. Marshals Service’s well-established relationship with Coinbase, which has handled forfeited crypto for American law enforcement for years.
What’s changed with Bit2Shield is scale and permanence. Rather than continuing to run this as an ad hoc service layered on top of its retail exchange operations, Bit2Me has built dedicated legal and organizational infrastructure specifically for government and judicial clients – cold-storage custody requiring multiple signatures for seized assets, a formal training curriculum, and a standing capability to support investigations rather than responding case-by-case. That’s the difference between a company that occasionally helps the police and a company that has decided helping the police is a genuine, ongoing line of business.
Why This Fits a Much Bigger Strategic Pivot
Bit2Shield makes more sense once you place it inside Bit2Me’s broader transformation over the past two years. The company’s trading volume grew roughly eightfold between 2023 and 2025, reaching €5.3 billion, but the more telling shift has been in who the company is building for. Bit2Me became the first platform in Spain to secure a Crypto-Asset Service Provider authorization under MiCA – the EU’s new comprehensive crypto framework – reportedly investing around €2.5 million and roughly 3,000 hours of work to get there. That license, along with backing from an unusually institutional roster of investors – Bankinter, Unicaja, Cecabank, Telefónica, and stablecoin issuer Tether among them – has positioned Bit2Me less as a scrappy retail platform competing for individual traders and more as regulated financial infrastructure that traditional banks are willing to build on top of rather than compete against.
That’s a meaningfully different business model than the one most people associate with crypto exchanges. Banks joining Bit2Me’s cap table aren’t primarily betting on retail trading fees – they’re betting that Bit2Me becomes the compliant, licensed layer through which they can offer crypto-adjacent services to their own customers without building that capability from scratch. Bit2Shield extends that same logic to a different institutional customer: instead of banks outsourcing crypto infrastructure to Bit2Me, it’s law enforcement and courts outsourcing crypto forensics and asset handling.
The Structural Problem This Is Actually Solving
It’s worth understanding why this kind of service is genuinely necessary rather than just a business opportunity. Police departments and courts across Europe generally weren’t built with the expertise, licensing, or technical infrastructure to trace blockchain transactions, securely custody seized digital assets pending a judicial process, or convert those assets into fiat without exposing the government to custody risk or market volatility during a lengthy legal proceeding. A seized wallet of Bitcoin sitting in a government evidence room isn’t like seized cash – it requires active technical management, multi-signature security protocols, and market timing decisions that most law enforcement agencies simply aren’t equipped to handle in-house.
This gap has already produced a range of public-private partnership models across the industry – the T3 Financial Crime Unit, a consortium involving Tron, Tether, and blockchain analytics firm TRM Labs, has assisted Spanish authorities including the Guardia Civil in freezing well over a hundred million dollars tied to organized financial crime networks, illustrating how normalized this kind of collaboration between crypto-native firms and law enforcement has become. Bit2Shield fits squarely into that trend, but with a distinguishing feature: it’s coming from Spain’s own dominant domestic exchange, not an international consortium – giving it a home-field advantage in relationships with Spanish courts and police that foreign firms would need years to build.
What This Means for Crypto Crime Victims and the Broader Ecosystem
There’s a practical upside here that extends beyond Bit2Me’s business interests. Spain’s central bank has been explicit that blockchain transactions generally can’t be reversed once completed – a structural reality that makes crypto fraud uniquely difficult to remedy compared to traditional bank fraud, where a bank can sometimes claw back a fraudulent transfer. What a service like Bit2Shield can realistically offer isn’t reversal, but faster identification: if stolen or fraudulently obtained funds move through an identifiable, licensed provider, that provider can freeze the receiving account or flag the wallet address before the funds move further into obscurity. That’s a meaningfully narrower promise than “getting your money back,” but it’s a genuine capability that most victims of crypto fraud currently have no reliable access to, since most police departments lack the in-house tools to trace funds quickly enough to matter.
For the broader industry, Bit2Shield adds to a growing body of evidence that the divide between “crypto” and “law enforcement” is closing faster than the popular narrative of an adversarial relationship between crypto and regulators would suggest. Major exchanges increasingly see cooperation with authorities not as a regulatory burden to be minimized, but as a service line that legitimizes their broader business and, not incidentally, gives them a formal seat at the table when future crypto regulation gets written.
Conclusion
Bit2Shield’s launch won’t generate the kind of headlines that a market crash or a major hack does, but it’s a more revealing signal about where the crypto industry’s most successful regulated players are actually headed. Bit2Me isn’t betting its future primarily on more people opening retail trading accounts – it’s betting on becoming indispensable infrastructure for the institutions that increasingly determine whether crypto succeeds as a legitimate part of the financial system: banks that need a compliant partner, and governments that need help doing what blockchain forensics increasingly makes possible but most public agencies still can’t do on their own. That’s a quieter ambition than building the next big trading platform, but arguably a more durable one.
This post Spain’s Biggest Crypto Exchange Just Told the Government: We’re Not Just a Trading App Anymore first appeared on BitcoinWorld.
2
1
75
·
--
Article
Artprice News: D-12 | 18th LYON BIENNALE – CONTEMPORARY ARTBitcoinWorldArtprice News: D-12 | 18th LYON BIENNALE – CONTEMPORARY ART
17 & 18 SEPTEMBER FOR PROFESSIONALS, OPEN TO ALL FROM 19 SEPTEMBER
PARIS, Sept. 7, 2026 /PRNewswire/ — Twelve days before opening to the public, the 18th Lyon Biennale – Contemporary Art is preparing to welcome artists, contemporary art professionals, collectors, institutions and members of the international art community for two professional preview days, on Thursday 17 and Friday 18 September 2026.
Then, from Saturday 19 September, the Biennale will open its doors to everyone for nearly three months of exhibitions across 11 venues in Lyon and its metropolitan area, until 13 December 2026.
18th Lyon Biennale Contemporary Art 18th Lyon Biennale Contemporary Art – 09.19 – 12.13.26 To pass from one dream to another 17 & 18 SEPTEMBER – TWO DAYS DEDICATED TO CONTEMPORARY ART PROFESSIONALS
Ahead of its public opening, the Biennale de Lyon invites the French and international art community to two professional preview days offering an exclusive first look at its 18th edition.
Artists, curators, gallerists, directors of museums and art centres, collectors, and professionals working in cultural institutions, production, mediation, communications and research are invited to join us in Lyon on 17 and 18 September.
Professional accreditation includes:
exclusive access to the exhibition venues during the professional preview days on 17 and 18 September;
access to the opening reception of the 18th Lyon Biennale – Contemporary Art, on Friday 18 September at Les Grandes Locos;
access to all Biennale venues during the first two days of the public opening, on 19 and 20 September.
Accreditation is personal and mandatory for access to the professional preview days. Applications are open through Wednesday 16 September 2026 inclusive.
Apply for professional accreditation: https://www.labiennaledelyon.com/espaceprofessionnel/accreditation-faq
Professional Days programme: https://www.labiennaledelyon.com/espaceprofessionnel/journees-professionnelles-programme?compact=1
Meetings, conversations with artists, opportunities for exchange and professional events will punctuate these two days. The programme notably includes international encounters and networking sessions at Les Grandes Locos, as well as a series of conversations bringing together artists and professionals from different international art scenes.
Professional Office contact
pros@labiennaledelyon.com +33 (0)4 27 46 65 67
FROM 19 SEPTEMBER – THE BIENNALE OPENS TO EVERYONE
From Saturday 19 September to Sunday 13 December 2026, the 18th Lyon Biennale – Contemporary Art invites audiences to discover a new artistic map of Lyon and its metropolitan area.
Entitled “Passer d’un rêve à l’autre / To pass from one dream to another“, this 18th edition is under the artistic direction of Isabelle Bertolotti and curated by Catherine Nichols.
Inspired by Lyon’s traboules — passageways that lead through courtyards and buildings, connecting one space to another — the Biennale explores the ways in which we can move from one mode of perception to another and, perhaps, from one collective dream to another.
Drawing on the history of Lyon as a city of trade, production, circulation and exchange, this edition examines the economies that organise our lives: the ways in which human and more-than-human beings acquire, transform, share and circulate the material and immaterial resources that enable them to live.
11 VENUES TO EXPERIENCE THE CITY DIFFERENTLY
With 120 artists and 11 exhibition venues, this year’s Biennale extends far beyond a traditional museum itinerary. Cultural institutions, heritage sites, former industrial spaces, public spaces and places of transit form a geography to be discovered across the city and metropolitan area:
Les Grandes Locos
Musée d’art contemporain de Lyon – macLYON
Musée des Tissus et des Arts décoratifs
Traboules des pentes de la Croix-Rousse
Jardin du Musée des Beaux-Arts
IAC – Institut d’art contemporain / Frac Rhône-Alpes
Musée des Confluences
Fondation Bullukian
Parking LPA Saint-Antoine
Metro Line B – Gare Part-Dieu station
Cour des Loges, A Radisson Collection Hotel
Three venues form the principal anchors of this edition: Les Grandes Locos, macLYON and the Musée des Tissus et des Arts décoratifs.
At Les Grandes Locos, the industrial scale of the site resonates with questions of production, transformation, extraction and circulation. At macLYON, the exhibition explores more closely the conditions of existence, life and death, inheritance and debt. At the Musée des Tissus, the works examine forms of relationship, care and exchange.
Around these three major hubs, the Biennale spreads throughout the city, taking over artistic institutions, heritage sites and everyday spaces alike.
LYON: A CITY-WIDE ARTISTIC EXPERIENCE
For nearly three months, the Biennale invites audiences to see Lyon differently.
Entering a museum, walking through a traboule, encountering an artwork in a former railway-industrial site, a garden, a car park or a metro station: the itinerary turns the city itself into one of the territories of the exhibition.
With this 18th edition, the Biennale de Lyon reaffirms more strongly than ever its mission: to make contemporary art an experience of encounter, circulation and sharing, open to everyone.
PRACTICAL INFORMATION
18th Lyon Biennale – Contemporary Art: “Passer d’un rêve à l’autre / To pass from one dream to another”
Artistic Director: Isabelle Bertolotti
Guest Curator: Catherine Nichols
General Director, Biennale de Lyon: Cécile Bourgeat
Professional Preview Days: 17 & 18 September 2026
Opening reception: 18 September 2026 at 6:30 pm, by invitation
Public opening: 19 September 2026
Exhibition: 19 September to 13 December 2026
11 exhibition venues in Lyon and its metropolitan area 120 artists
400 works
Professional accreditation open through 16 September 2026 inclusive.
Public ticketing: advance sales until 18 September, with the Biennale Pass available for €20 instead of €25.
Biennale de Lyonhttps://www.labiennaledelyon.com
Images: [https://imgpublic.artprice.com/img/wp/sites/11/2026/07/img1-BAC26_VISUEL_V.jpg] [https://imgpublic.artprice.com/img/wp/sites/11/2026/07/img2-BIENNALE_LYON_BAC26_BLOC-MARQUE_EN_DATES.jpg] [https://imgpublic.artprice.com/img/wp/sites/11/2026/07/LOGO-labiennaledelyon.jpg]
ANOTHER PASSAGE OPENS
Alongside its long-standing commitment to the Lyon Biennale, Artprice opens another passage — this time through language. Dialogue Between a Thinker and AI, thierry Ehrmann’s 1,800-page open-access RAW typescript, places memory, art, humanism and artificial intelligence into circulation. Not a product to consume, but a text to enter, explore and share. The Codex is yours: https://www.dialoguebetweenathinkerandai.com/en/
About:
Artprice by Artmarket and La Demeure du Chaos/Abode of Chaos are partnering with the 18th Lyon Biennale, curated by Catherine Nichols and under the artistic direction of Isabelle Bertolotti.
This collaboration brings together two major players in the art world, both deeply rooted in Lyon while maintaining a strong international outlook. For more than forty years, the Lyon Biennale has supported the evolution of contemporary art and helped establish the Lyon metropolitan area as a leading platform for artists, art professionals, and audiences from around the world. Artprice, the global leader in art market information, has for many decades documented the transformations of the international art scene and the careers of the artists who shape it.
Contact: Thierry Ehrmann, ir@artmarket.com
This post Artprice News: D-12 | 18th LYON BIENNALE – CONTEMPORARY ART first appeared on BitcoinWorld.
Artprice News: D-12 | 18th LYON BIENNALE – CONTEMPORARY ART
BitcoinWorldArtprice News: D-12 | 18th LYON BIENNALE – CONTEMPORARY ART
17 & 18 SEPTEMBER FOR PROFESSIONALS, OPEN TO ALL FROM 19 SEPTEMBER
PARIS, Sept. 7, 2026 /PRNewswire/ — Twelve days before opening to the public, the 18th Lyon Biennale – Contemporary Art is preparing to welcome artists, contemporary art professionals, collectors, institutions and members of the international art community for two professional preview days, on Thursday 17 and Friday 18 September 2026.
Then, from Saturday 19 September, the Biennale will open its doors to everyone for nearly three months of exhibitions across 11 venues in Lyon and its metropolitan area, until 13 December 2026.
18th Lyon Biennale Contemporary Art 18th Lyon Biennale Contemporary Art – 09.19 – 12.13.26 To pass from one dream to another 17 & 18 SEPTEMBER – TWO DAYS DEDICATED TO CONTEMPORARY ART PROFESSIONALS
Ahead of its public opening, the Biennale de Lyon invites the French and international art community to two professional preview days offering an exclusive first look at its 18th edition.
Artists, curators, gallerists, directors of museums and art centres, collectors, and professionals working in cultural institutions, production, mediation, communications and research are invited to join us in Lyon on 17 and 18 September.
Professional accreditation includes:
exclusive access to the exhibition venues during the professional preview days on 17 and 18 September;
access to the opening reception of the 18th Lyon Biennale – Contemporary Art, on Friday 18 September at Les Grandes Locos;
access to all Biennale venues during the first two days of the public opening, on 19 and 20 September.
Accreditation is personal and mandatory for access to the professional preview days. Applications are open through Wednesday 16 September 2026 inclusive.
Apply for professional accreditation: https://www.labiennaledelyon.com/espaceprofessionnel/accreditation-faq
Professional Days programme: https://www.labiennaledelyon.com/espaceprofessionnel/journees-professionnelles-programme?compact=1
Meetings, conversations with artists, opportunities for exchange and professional events will punctuate these two days. The programme notably includes international encounters and networking sessions at Les Grandes Locos, as well as a series of conversations bringing together artists and professionals from different international art scenes.
Professional Office contact
pros@labiennaledelyon.com +33 (0)4 27 46 65 67
FROM 19 SEPTEMBER – THE BIENNALE OPENS TO EVERYONE
From Saturday 19 September to Sunday 13 December 2026, the 18th Lyon Biennale – Contemporary Art invites audiences to discover a new artistic map of Lyon and its metropolitan area.
Entitled “Passer d’un rêve à l’autre / To pass from one dream to another“, this 18th edition is under the artistic direction of Isabelle Bertolotti and curated by Catherine Nichols.
Inspired by Lyon’s traboules — passageways that lead through courtyards and buildings, connecting one space to another — the Biennale explores the ways in which we can move from one mode of perception to another and, perhaps, from one collective dream to another.
Drawing on the history of Lyon as a city of trade, production, circulation and exchange, this edition examines the economies that organise our lives: the ways in which human and more-than-human beings acquire, transform, share and circulate the material and immaterial resources that enable them to live.
11 VENUES TO EXPERIENCE THE CITY DIFFERENTLY
With 120 artists and 11 exhibition venues, this year’s Biennale extends far beyond a traditional museum itinerary. Cultural institutions, heritage sites, former industrial spaces, public spaces and places of transit form a geography to be discovered across the city and metropolitan area:
Les Grandes Locos
Musée d’art contemporain de Lyon – macLYON
Musée des Tissus et des Arts décoratifs
Traboules des pentes de la Croix-Rousse
Jardin du Musée des Beaux-Arts
IAC – Institut d’art contemporain / Frac Rhône-Alpes
Musée des Confluences
Fondation Bullukian
Parking LPA Saint-Antoine
Metro Line B – Gare Part-Dieu station
Cour des Loges, A Radisson Collection Hotel
Three venues form the principal anchors of this edition: Les Grandes Locos, macLYON and the Musée des Tissus et des Arts décoratifs.
At Les Grandes Locos, the industrial scale of the site resonates with questions of production, transformation, extraction and circulation. At macLYON, the exhibition explores more closely the conditions of existence, life and death, inheritance and debt. At the Musée des Tissus, the works examine forms of relationship, care and exchange.
Around these three major hubs, the Biennale spreads throughout the city, taking over artistic institutions, heritage sites and everyday spaces alike.
LYON: A CITY-WIDE ARTISTIC EXPERIENCE
For nearly three months, the Biennale invites audiences to see Lyon differently.
Entering a museum, walking through a traboule, encountering an artwork in a former railway-industrial site, a garden, a car park or a metro station: the itinerary turns the city itself into one of the territories of the exhibition.
With this 18th edition, the Biennale de Lyon reaffirms more strongly than ever its mission: to make contemporary art an experience of encounter, circulation and sharing, open to everyone.
PRACTICAL INFORMATION
18th Lyon Biennale – Contemporary Art: “Passer d’un rêve à l’autre / To pass from one dream to another”
Artistic Director: Isabelle Bertolotti
Guest Curator: Catherine Nichols
General Director, Biennale de Lyon: Cécile Bourgeat
Professional Preview Days: 17 & 18 September 2026
Opening reception: 18 September 2026 at 6:30 pm, by invitation
Public opening: 19 September 2026
Exhibition: 19 September to 13 December 2026
11 exhibition venues in Lyon and its metropolitan area 120 artists
400 works
Professional accreditation open through 16 September 2026 inclusive.
Public ticketing: advance sales until 18 September, with the Biennale Pass available for €20 instead of €25.
Biennale de Lyonhttps://www.labiennaledelyon.com
Images: [https://imgpublic.artprice.com/img/wp/sites/11/2026/07/img1-BAC26_VISUEL_V.jpg] [https://imgpublic.artprice.com/img/wp/sites/11/2026/07/img2-BIENNALE_LYON_BAC26_BLOC-MARQUE_EN_DATES.jpg] [https://imgpublic.artprice.com/img/wp/sites/11/2026/07/LOGO-labiennaledelyon.jpg]
ANOTHER PASSAGE OPENS
Alongside its long-standing commitment to the Lyon Biennale, Artprice opens another passage — this time through language. Dialogue Between a Thinker and AI, thierry Ehrmann’s 1,800-page open-access RAW typescript, places memory, art, humanism and artificial intelligence into circulation. Not a product to consume, but a text to enter, explore and share. The Codex is yours: https://www.dialoguebetweenathinkerandai.com/en/
About:
Artprice by Artmarket and La Demeure du Chaos/Abode of Chaos are partnering with the 18th Lyon Biennale, curated by Catherine Nichols and under the artistic direction of Isabelle Bertolotti.
This collaboration brings together two major players in the art world, both deeply rooted in Lyon while maintaining a strong international outlook. For more than forty years, the Lyon Biennale has supported the evolution of contemporary art and helped establish the Lyon metropolitan area as a leading platform for artists, art professionals, and audiences from around the world. Artprice, the global leader in art market information, has for many decades documented the transformations of the international art scene and the careers of the artists who shape it.
Contact: Thierry Ehrmann, ir@artmarket.com
This post Artprice News: D-12 | 18th LYON BIENNALE – CONTEMPORARY ART first appeared on BitcoinWorld.
17 & 18 SEPTEMBER FOR PROFESSIONALS, OPEN TO ALL FROM 19 SEPTEMBER
PARIS, Sept. 7, 2026 /PRNewswire/ — Twelve days before opening to the public, the 18th Lyon Biennale – Contemporary Art is preparing to welcome artists, contemporary art professionals, collectors, institutions and members of the international art community for two professional preview days, on Thursday 17 and Friday 18 September 2026.
Then, from Saturday 19 September, the Biennale will open its doors to everyone for nearly three months of exhibitions across 11 venues in Lyon and its metropolitan area, until 13 December 2026.
18th Lyon Biennale Contemporary Art 18th Lyon Biennale Contemporary Art – 09.19 – 12.13.26 To pass from one dream to another 17 & 18 SEPTEMBER – TWO DAYS DEDICATED TO CONTEMPORARY ART PROFESSIONALS
Ahead of its public opening, the Biennale de Lyon invites the French and international art community to two professional preview days offering an exclusive first look at its 18th edition.
Artists, curators, gallerists, directors of museums and art centres, collectors, and professionals working in cultural institutions, production, mediation, communications and research are invited to join us in Lyon on 17 and 18 September.
Professional accreditation includes:
exclusive access to the exhibition venues during the professional preview days on 17 and 18 September;
access to the opening reception of the 18th Lyon Biennale – Contemporary Art, on Friday 18 September at Les Grandes Locos;
access to all Biennale venues during the first two days of the public opening, on 19 and 20 September.
Accreditation is personal and mandatory for access to the professional preview days. Applications are open through Wednesday 16 September 2026 inclusive.
Apply for professional accreditation: https://www.labiennaledelyon.com/espaceprofessionnel/accreditation-faq
Professional Days programme: https://www.labiennaledelyon.com/espaceprofessionnel/journees-professionnelles-programme?compact=1
Meetings, conversations with artists, opportunities for exchange and professional events will punctuate these two days. The programme notably includes international encounters and networking sessions at Les Grandes Locos, as well as a series of conversations bringing together artists and professionals from different international art scenes.
Professional Office contact
pros@labiennaledelyon.com +33 (0)4 27 46 65 67
FROM 19 SEPTEMBER – THE BIENNALE OPENS TO EVERYONE
From Saturday 19 September to Sunday 13 December 2026, the 18th Lyon Biennale – Contemporary Art invites audiences to discover a new artistic map of Lyon and its metropolitan area.
Entitled “Passer d’un rêve à l’autre / To pass from one dream to another“, this 18th edition is under the artistic direction of Isabelle Bertolotti and curated by Catherine Nichols.
Inspired by Lyon’s traboules — passageways that lead through courtyards and buildings, connecting one space to another — the Biennale explores the ways in which we can move from one mode of perception to another and, perhaps, from one collective dream to another.
Drawing on the history of Lyon as a city of trade, production, circulation and exchange, this edition examines the economies that organise our lives: the ways in which human and more-than-human beings acquire, transform, share and circulate the material and immaterial resources that enable them to live.
11 VENUES TO EXPERIENCE THE CITY DIFFERENTLY
With 120 artists and 11 exhibition venues, this year’s Biennale extends far beyond a traditional museum itinerary. Cultural institutions, heritage sites, former industrial spaces, public spaces and places of transit form a geography to be discovered across the city and metropolitan area:
Les Grandes Locos
Musée d’art contemporain de Lyon – macLYON
Musée des Tissus et des Arts décoratifs
Traboules des pentes de la Croix-Rousse
Jardin du Musée des Beaux-Arts
IAC – Institut d’art contemporain / Frac Rhône-Alpes
Musée des Confluences
Fondation Bullukian
Parking LPA Saint-Antoine
Metro Line B – Gare Part-Dieu station
Cour des Loges, A Radisson Collection Hotel
Three venues form the principal anchors of this edition: Les Grandes Locos, macLYON and the Musée des Tissus et des Arts décoratifs.
At Les Grandes Locos, the industrial scale of the site resonates with questions of production, transformation, extraction and circulation. At macLYON, the exhibition explores more closely the conditions of existence, life and death, inheritance and debt. At the Musée des Tissus, the works examine forms of relationship, care and exchange.
Around these three major hubs, the Biennale spreads throughout the city, taking over artistic institutions, heritage sites and everyday spaces alike.
LYON: A CITY-WIDE ARTISTIC EXPERIENCE
For nearly three months, the Biennale invites audiences to see Lyon differently.
Entering a museum, walking through a traboule, encountering an artwork in a former railway-industrial site, a garden, a car park or a metro station: the itinerary turns the city itself into one of the territories of the exhibition.
With this 18th edition, the Biennale de Lyon reaffirms more strongly than ever its mission: to make contemporary art an experience of encounter, circulation and sharing, open to everyone.
PRACTICAL INFORMATION
18th Lyon Biennale – Contemporary Art: “Passer d’un rêve à l’autre / To pass from one dream to another”
Artistic Director: Isabelle Bertolotti
Guest Curator: Catherine Nichols
General Director, Biennale de Lyon: Cécile Bourgeat
Professional Preview Days: 17 & 18 September 2026
Opening reception: 18 September 2026 at 6:30 pm, by invitation
Public opening: 19 September 2026
Exhibition: 19 September to 13 December 2026
11 exhibition venues in Lyon and its metropolitan area 120 artists
400 works
Professional accreditation open through 16 September 2026 inclusive.
Public ticketing: advance sales until 18 September, with the Biennale Pass available for €20 instead of €25.
Biennale de Lyonhttps://www.labiennaledelyon.com
Images: [https://imgpublic.artprice.com/img/wp/sites/11/2026/07/img1-BAC26_VISUEL_V.jpg] [https://imgpublic.artprice.com/img/wp/sites/11/2026/07/img2-BIENNALE_LYON_BAC26_BLOC-MARQUE_EN_DATES.jpg] [https://imgpublic.artprice.com/img/wp/sites/11/2026/07/LOGO-labiennaledelyon.jpg]
ANOTHER PASSAGE OPENS
Alongside its long-standing commitment to the Lyon Biennale, Artprice opens another passage — this time through language. Dialogue Between a Thinker and AI, thierry Ehrmann’s 1,800-page open-access RAW typescript, places memory, art, humanism and artificial intelligence into circulation. Not a product to consume, but a text to enter, explore and share. The Codex is yours: https://www.dialoguebetweenathinkerandai.com/en/
About:
Artprice by Artmarket and La Demeure du Chaos/Abode of Chaos are partnering with the 18th Lyon Biennale, curated by Catherine Nichols and under the artistic direction of Isabelle Bertolotti.
This collaboration brings together two major players in the art world, both deeply rooted in Lyon while maintaining a strong international outlook. For more than forty years, the Lyon Biennale has supported the evolution of contemporary art and helped establish the Lyon metropolitan area as a leading platform for artists, art professionals, and audiences from around the world. Artprice, the global leader in art market information, has for many decades documented the transformations of the international art scene and the careers of the artists who shape it.
Contact: Thierry Ehrmann, ir@artmarket.com
This post Artprice News: D-12 | 18th LYON BIENNALE – CONTEMPORARY ART first appeared on BitcoinWorld.
199
·
--

Article
Sweden Built a Green Bitcoin Hub on Cheap Hydropower. Now It’s Auditing Its Way Through It.BitcoinWorldSweden Built a Green Bitcoin Hub on Cheap Hydropower. Now It’s Auditing Its Way Through It.
Boden isn’t a place most people outside the crypto industry could locate on a map, but for the better part of a decade it’s been quietly important to it. A small city in Sweden’s far north, sitting close to some of the cheapest, cleanest hydroelectric power in Europe, Boden became a magnet for industrial-scale Bitcoin mining precisely because of what it offered: abundant renewable electricity, a cold climate that cuts cooling costs, and – until recently – a tax regime that treated data centers generously. That last ingredient is now the thing unraveling around several of the companies that built their business there.
Sweden’s tax agency, Skatteverket, has hit six Boden-based crypto mining companies with roughly 540 million kronor – about $56.5 million – in back taxes and penalties, the latest and largest chapter in a crackdown that’s been building for years and shows no sign of slowing down.
The Trick Wasn’t Hiding the Mining. It Was Mislabeling It.
The core allegation here isn’t that these companies mined cryptocurrency in secret – mining Bitcoin at industrial scale in a small Swedish city isn’t exactly a covert operation; it requires warehouses full of specialized hardware, enormous power connections, and cooling infrastructure that’s hard to disguise as anything else. The allegation is narrower and, in some ways, more damning: that the companies structured their contracts and corporate arrangements specifically to make mining activity look, on paper, like ordinary data processing – the kind of generic computing service that qualifies for tax treatment Sweden extends to data centers doing conventional cloud or hosting work.
Patrik Lillqvist, the tax agency’s head of intelligence, put the underlying complaint in stark terms, characterizing what happened as effectively taking from the broader tax base that funds public services. That framing matters, because it captures why Swedish authorities have pursued this so aggressively rather than treating it as a routine disagreement over classification. The tax benefits at issue exist for a policy reason – encouraging genuine data-processing and computing investment in Sweden’s north – and if mining operations were claiming those benefits through disguised contracts, the agency’s position is that they weren’t bending an ambiguous rule, they were exploiting one under false pretenses.
This Is the Fourth Round, Not the First
What’s easy to miss in a headline about a single $56.5 million enforcement action is that this is part of a multi-year, expanding pattern rather than an isolated event. The current action stems from a 2024-2026 industry-wide audit that examined nine cryptocurrency companies nationwide, finding more than $50 million in unpaid taxes and penalties, with the six Boden operations accounting for the overwhelming majority of that total. That audit itself followed an earlier, broader investigation covering 2020 to 2023, in which Swedish authorities examined 21 data center operators and found systemic evidence of mining activity concealed as VAT-liable computing services – an effort that resulted in roughly 990 million kronor, or about $91 million, in tax adjustments across that earlier period.
Put the two audit waves together and the picture is of Skatteverket treating this as a sustained, structural problem in Sweden’s northern data center industry, not a one-off scandal. The original push traces back to 2024 reporting from Swedish public broadcaster SVT Norrbotten, which estimated cryptocurrency operations had defrauded the Swedish government of roughly $100 million, with the activity heavily concentrated in Boden specifically – 13 of the 18 companies targeted in the tax agency’s broader four-year investigation were based there. Boden wasn’t just where some of this happened. It was the epicenter of it.
One Company’s Bad Week Illustrates the Stakes
Among the firms caught in the latest enforcement wave is Bikupan Datacenter, which operates facilities in Boden and the nearby town of Robertsfors and serves as the Swedish arm of Hive Digital Technologies, a publicly traded crypto mining company. The tax bill has been serious enough to force the company into financial restructuring after it was unable to meet its liabilities outright, with an appeal now pending before Sweden’s Supreme Administrative Court.
The company’s own defense is worth noting because it illustrates exactly the kind of definitional fight at the heart of this entire crackdown. Hive’s Swedish country manager has pushed back on the tax agency’s characterization, arguing that the actual mining computations are carried out by external, independent mining pools rather than by the Swedish entity itself, and that what the company sells is computing capacity – power that could be used for AI workloads just as easily as mining. That’s not a throwaway detail. It’s the exact argument the entire Swedish data center industry is now having with its tax authority: where, precisely, does “selling computing capacity” end and “operating a mining business dressed up as computing capacity” begin, and who gets to make that call – the company structuring the contract, or the tax agency examining what the hardware actually did.
A Bigger, Uglier Case Is Running in Parallel
This Boden enforcement action doesn’t exist in isolation. Just weeks earlier, a separate and considerably more serious investigation became public when authorities searched company-related premises in Frankfurt as well as Boden and the nearby city of Luleå, arresting four people in connection with suspected large-scale VAT fraud estimated at more than €100 million – tied to Northern Data’s Swedish operations, including subsidiaries with deep roots in Bitcoin mining. Unlike the civil tax-adjustment cases, that investigation involves a criminal probe, arrests, and dramatically higher estimated losses to the Swedish treasury. Northern Data has said it was surprised by the escalation and believes authorities misunderstood how its GPU cloud offering and legacy mining operations are actually structured, and has stated it’s cooperating with the investigation.
The proximity of these cases – geographically in the same small cluster of northern Swedish cities, and conceptually in the same underlying question of whether crypto mining was mislabeled as legitimate computing to dodge tax obligations – suggests Swedish authorities have identified a genuine pattern across the industry’s northern footprint, not a handful of unrelated bad actors. When multiple independent operators in the same small region are found using structurally similar arrangements to claim the same category of tax benefit, that starts to look less like coincidence and more like an open industry practice that had simply gone unchallenged until Skatteverket built the analytical capacity to unpick it.
The AI Pivot Just Made Everything More Complicated
There’s a twist that makes this moment particularly consequential for the industry rather than just historically interesting: many of these same Boden-area mining operations have been actively converting their infrastructure toward AI computing as crypto mining margins have compressed and AI compute demand has surged. That pivot, in principle, should make the tax question easier – selling AI cloud capacity typically involves a real contract, an identifiable paying customer, and a clearly defined computing service, which fits more naturally into conventional VAT treatment than crypto mining’s more ambiguous economics, where there’s often no direct customer at all, just a mining pool distributing block rewards.
But Swedish authorities have made clear that relabeling infrastructure as AI-focused doesn’t automatically resolve the underlying scrutiny. Tax officials can still examine what the hardware actually did during the period in question, who genuinely controlled the operation, and whether the contractual paperwork matches the real economic activity – meaning companies mid-transition from mining to AI face continued exposure for their historical mining-era activity even as their forward-looking business model shifts toward something the tax system treats more favorably. For an industry racing to reposition itself around the AI boom, unresolved tax liability from its crypto-mining past is turning into a genuine drag on that transition, not a closed chapter.
Why This Should Matter Beyond Sweden
Sweden isn’t unique in having attracted crypto mining operations with cheap renewable power and favorable industrial tax treatment – Iceland, Norway, and parts of Canada have all played a similar role at different points. What makes Sweden’s crackdown notable is the sophistication and duration of the enforcement effort: a multi-year, industry-wide audit process, escalating enforcement waves, a parallel criminal investigation, and a tax authority willing to keep pursuing appeals through the country’s highest administrative court rather than settling quietly. That’s a meaningful signal to any jurisdiction currently hosting crypto mining operations under similarly generous data-center tax regimes: the gap between “how a company describes its business for tax purposes” and “what its hardware actually does” is exactly the kind of gap tax authorities are getting better equipped to close, especially as mining’s public reporting requirements, energy consumption data, and blockchain-level transparency make the underlying activity harder to obscure than traditional tax avoidance schemes typically are.
There’s also a broader European regulatory dimension worth noting: Sweden’s approach to withholding tax refunds for foreign contractors, a related but separate piece of its tax enforcement posture, is currently being challenged before the European Commission as a potential barrier to cross-border services, with Sweden having submitted its defense and the case still pending. That’s a reminder that Sweden’s aggressive posture toward data center and mining taxation isn’t happening in a vacuum – it’s part of a broader tightening of how the country treats an industry it once actively courted for its clean-energy credentials, and that tightening is itself now subject to scrutiny at the EU level.
Conclusion
Boden’s rise as a crypto mining hub was built on a straightforward value proposition: cheap, green power and a tax framework that rewarded data center investment. What’s playing out now is the other side of that bargain – a tax authority that spent years building the audit capacity to determine whether companies were actually earning those benefits honestly, and increasingly concluding that many weren’t. Whether this specific $56.5 million action holds up through Bikupan’s pending Supreme Court appeal, or whether other Boden operators face similar bills as Skatteverket’s multi-year audit process continues, the larger pattern is already clear: the era of crypto miners in Sweden benefiting from ambiguity about what their hardware was actually doing appears to be closing, right as the same operators are trying to pivot their business model toward an AI boom that hasn’t yet decided whether it wants to inherit their tax problems along with their power contracts.
This post Sweden Built a Green Bitcoin Hub on Cheap Hydropower. Now It’s Auditing Its Way Through It. first appeared on BitcoinWorld.
Sweden Built a Green Bitcoin Hub on Cheap Hydropower. Now It’s Auditing Its Way Through It.
BitcoinWorldSweden Built a Green Bitcoin Hub on Cheap Hydropower. Now It’s Auditing Its Way Through It.
Boden isn’t a place most people outside the crypto industry could locate on a map, but for the better part of a decade it’s been quietly important to it. A small city in Sweden’s far north, sitting close to some of the cheapest, cleanest hydroelectric power in Europe, Boden became a magnet for industrial-scale Bitcoin mining precisely because of what it offered: abundant renewable electricity, a cold climate that cuts cooling costs, and – until recently – a tax regime that treated data centers generously. That last ingredient is now the thing unraveling around several of the companies that built their business there.
Sweden’s tax agency, Skatteverket, has hit six Boden-based crypto mining companies with roughly 540 million kronor – about $56.5 million – in back taxes and penalties, the latest and largest chapter in a crackdown that’s been building for years and shows no sign of slowing down.
The Trick Wasn’t Hiding the Mining. It Was Mislabeling It.
The core allegation here isn’t that these companies mined cryptocurrency in secret – mining Bitcoin at industrial scale in a small Swedish city isn’t exactly a covert operation; it requires warehouses full of specialized hardware, enormous power connections, and cooling infrastructure that’s hard to disguise as anything else. The allegation is narrower and, in some ways, more damning: that the companies structured their contracts and corporate arrangements specifically to make mining activity look, on paper, like ordinary data processing – the kind of generic computing service that qualifies for tax treatment Sweden extends to data centers doing conventional cloud or hosting work.
Patrik Lillqvist, the tax agency’s head of intelligence, put the underlying complaint in stark terms, characterizing what happened as effectively taking from the broader tax base that funds public services. That framing matters, because it captures why Swedish authorities have pursued this so aggressively rather than treating it as a routine disagreement over classification. The tax benefits at issue exist for a policy reason – encouraging genuine data-processing and computing investment in Sweden’s north – and if mining operations were claiming those benefits through disguised contracts, the agency’s position is that they weren’t bending an ambiguous rule, they were exploiting one under false pretenses.
This Is the Fourth Round, Not the First
What’s easy to miss in a headline about a single $56.5 million enforcement action is that this is part of a multi-year, expanding pattern rather than an isolated event. The current action stems from a 2024-2026 industry-wide audit that examined nine cryptocurrency companies nationwide, finding more than $50 million in unpaid taxes and penalties, with the six Boden operations accounting for the overwhelming majority of that total. That audit itself followed an earlier, broader investigation covering 2020 to 2023, in which Swedish authorities examined 21 data center operators and found systemic evidence of mining activity concealed as VAT-liable computing services – an effort that resulted in roughly 990 million kronor, or about $91 million, in tax adjustments across that earlier period.
Put the two audit waves together and the picture is of Skatteverket treating this as a sustained, structural problem in Sweden’s northern data center industry, not a one-off scandal. The original push traces back to 2024 reporting from Swedish public broadcaster SVT Norrbotten, which estimated cryptocurrency operations had defrauded the Swedish government of roughly $100 million, with the activity heavily concentrated in Boden specifically – 13 of the 18 companies targeted in the tax agency’s broader four-year investigation were based there. Boden wasn’t just where some of this happened. It was the epicenter of it.
One Company’s Bad Week Illustrates the Stakes
Among the firms caught in the latest enforcement wave is Bikupan Datacenter, which operates facilities in Boden and the nearby town of Robertsfors and serves as the Swedish arm of Hive Digital Technologies, a publicly traded crypto mining company. The tax bill has been serious enough to force the company into financial restructuring after it was unable to meet its liabilities outright, with an appeal now pending before Sweden’s Supreme Administrative Court.
The company’s own defense is worth noting because it illustrates exactly the kind of definitional fight at the heart of this entire crackdown. Hive’s Swedish country manager has pushed back on the tax agency’s characterization, arguing that the actual mining computations are carried out by external, independent mining pools rather than by the Swedish entity itself, and that what the company sells is computing capacity – power that could be used for AI workloads just as easily as mining. That’s not a throwaway detail. It’s the exact argument the entire Swedish data center industry is now having with its tax authority: where, precisely, does “selling computing capacity” end and “operating a mining business dressed up as computing capacity” begin, and who gets to make that call – the company structuring the contract, or the tax agency examining what the hardware actually did.
A Bigger, Uglier Case Is Running in Parallel
This Boden enforcement action doesn’t exist in isolation. Just weeks earlier, a separate and considerably more serious investigation became public when authorities searched company-related premises in Frankfurt as well as Boden and the nearby city of Luleå, arresting four people in connection with suspected large-scale VAT fraud estimated at more than €100 million – tied to Northern Data’s Swedish operations, including subsidiaries with deep roots in Bitcoin mining. Unlike the civil tax-adjustment cases, that investigation involves a criminal probe, arrests, and dramatically higher estimated losses to the Swedish treasury. Northern Data has said it was surprised by the escalation and believes authorities misunderstood how its GPU cloud offering and legacy mining operations are actually structured, and has stated it’s cooperating with the investigation.
The proximity of these cases – geographically in the same small cluster of northern Swedish cities, and conceptually in the same underlying question of whether crypto mining was mislabeled as legitimate computing to dodge tax obligations – suggests Swedish authorities have identified a genuine pattern across the industry’s northern footprint, not a handful of unrelated bad actors. When multiple independent operators in the same small region are found using structurally similar arrangements to claim the same category of tax benefit, that starts to look less like coincidence and more like an open industry practice that had simply gone unchallenged until Skatteverket built the analytical capacity to unpick it.
The AI Pivot Just Made Everything More Complicated
There’s a twist that makes this moment particularly consequential for the industry rather than just historically interesting: many of these same Boden-area mining operations have been actively converting their infrastructure toward AI computing as crypto mining margins have compressed and AI compute demand has surged. That pivot, in principle, should make the tax question easier – selling AI cloud capacity typically involves a real contract, an identifiable paying customer, and a clearly defined computing service, which fits more naturally into conventional VAT treatment than crypto mining’s more ambiguous economics, where there’s often no direct customer at all, just a mining pool distributing block rewards.
But Swedish authorities have made clear that relabeling infrastructure as AI-focused doesn’t automatically resolve the underlying scrutiny. Tax officials can still examine what the hardware actually did during the period in question, who genuinely controlled the operation, and whether the contractual paperwork matches the real economic activity – meaning companies mid-transition from mining to AI face continued exposure for their historical mining-era activity even as their forward-looking business model shifts toward something the tax system treats more favorably. For an industry racing to reposition itself around the AI boom, unresolved tax liability from its crypto-mining past is turning into a genuine drag on that transition, not a closed chapter.
Why This Should Matter Beyond Sweden
Sweden isn’t unique in having attracted crypto mining operations with cheap renewable power and favorable industrial tax treatment – Iceland, Norway, and parts of Canada have all played a similar role at different points. What makes Sweden’s crackdown notable is the sophistication and duration of the enforcement effort: a multi-year, industry-wide audit process, escalating enforcement waves, a parallel criminal investigation, and a tax authority willing to keep pursuing appeals through the country’s highest administrative court rather than settling quietly. That’s a meaningful signal to any jurisdiction currently hosting crypto mining operations under similarly generous data-center tax regimes: the gap between “how a company describes its business for tax purposes” and “what its hardware actually does” is exactly the kind of gap tax authorities are getting better equipped to close, especially as mining’s public reporting requirements, energy consumption data, and blockchain-level transparency make the underlying activity harder to obscure than traditional tax avoidance schemes typically are.
There’s also a broader European regulatory dimension worth noting: Sweden’s approach to withholding tax refunds for foreign contractors, a related but separate piece of its tax enforcement posture, is currently being challenged before the European Commission as a potential barrier to cross-border services, with Sweden having submitted its defense and the case still pending. That’s a reminder that Sweden’s aggressive posture toward data center and mining taxation isn’t happening in a vacuum – it’s part of a broader tightening of how the country treats an industry it once actively courted for its clean-energy credentials, and that tightening is itself now subject to scrutiny at the EU level.
Conclusion
Boden’s rise as a crypto mining hub was built on a straightforward value proposition: cheap, green power and a tax framework that rewarded data center investment. What’s playing out now is the other side of that bargain – a tax authority that spent years building the audit capacity to determine whether companies were actually earning those benefits honestly, and increasingly concluding that many weren’t. Whether this specific $56.5 million action holds up through Bikupan’s pending Supreme Court appeal, or whether other Boden operators face similar bills as Skatteverket’s multi-year audit process continues, the larger pattern is already clear: the era of crypto miners in Sweden benefiting from ambiguity about what their hardware was actually doing appears to be closing, right as the same operators are trying to pivot their business model toward an AI boom that hasn’t yet decided whether it wants to inherit their tax problems along with their power contracts.
This post Sweden Built a Green Bitcoin Hub on Cheap Hydropower. Now It’s Auditing Its Way Through It. first appeared on BitcoinWorld.
Boden isn’t a place most people outside the crypto industry could locate on a map, but for the better part of a decade it’s been quietly important to it. A small city in Sweden’s far north, sitting close to some of the cheapest, cleanest hydroelectric power in Europe, Boden became a magnet for industrial-scale Bitcoin mining precisely because of what it offered: abundant renewable electricity, a cold climate that cuts cooling costs, and – until recently – a tax regime that treated data centers generously. That last ingredient is now the thing unraveling around several of the companies that built their business there.
Sweden’s tax agency, Skatteverket, has hit six Boden-based crypto mining companies with roughly 540 million kronor – about $56.5 million – in back taxes and penalties, the latest and largest chapter in a crackdown that’s been building for years and shows no sign of slowing down.
The Trick Wasn’t Hiding the Mining. It Was Mislabeling It.
The core allegation here isn’t that these companies mined cryptocurrency in secret – mining Bitcoin at industrial scale in a small Swedish city isn’t exactly a covert operation; it requires warehouses full of specialized hardware, enormous power connections, and cooling infrastructure that’s hard to disguise as anything else. The allegation is narrower and, in some ways, more damning: that the companies structured their contracts and corporate arrangements specifically to make mining activity look, on paper, like ordinary data processing – the kind of generic computing service that qualifies for tax treatment Sweden extends to data centers doing conventional cloud or hosting work.
Patrik Lillqvist, the tax agency’s head of intelligence, put the underlying complaint in stark terms, characterizing what happened as effectively taking from the broader tax base that funds public services. That framing matters, because it captures why Swedish authorities have pursued this so aggressively rather than treating it as a routine disagreement over classification. The tax benefits at issue exist for a policy reason – encouraging genuine data-processing and computing investment in Sweden’s north – and if mining operations were claiming those benefits through disguised contracts, the agency’s position is that they weren’t bending an ambiguous rule, they were exploiting one under false pretenses.
This Is the Fourth Round, Not the First
What’s easy to miss in a headline about a single $56.5 million enforcement action is that this is part of a multi-year, expanding pattern rather than an isolated event. The current action stems from a 2024-2026 industry-wide audit that examined nine cryptocurrency companies nationwide, finding more than $50 million in unpaid taxes and penalties, with the six Boden operations accounting for the overwhelming majority of that total. That audit itself followed an earlier, broader investigation covering 2020 to 2023, in which Swedish authorities examined 21 data center operators and found systemic evidence of mining activity concealed as VAT-liable computing services – an effort that resulted in roughly 990 million kronor, or about $91 million, in tax adjustments across that earlier period.
Put the two audit waves together and the picture is of Skatteverket treating this as a sustained, structural problem in Sweden’s northern data center industry, not a one-off scandal. The original push traces back to 2024 reporting from Swedish public broadcaster SVT Norrbotten, which estimated cryptocurrency operations had defrauded the Swedish government of roughly $100 million, with the activity heavily concentrated in Boden specifically – 13 of the 18 companies targeted in the tax agency’s broader four-year investigation were based there. Boden wasn’t just where some of this happened. It was the epicenter of it.
One Company’s Bad Week Illustrates the Stakes
Among the firms caught in the latest enforcement wave is Bikupan Datacenter, which operates facilities in Boden and the nearby town of Robertsfors and serves as the Swedish arm of Hive Digital Technologies, a publicly traded crypto mining company. The tax bill has been serious enough to force the company into financial restructuring after it was unable to meet its liabilities outright, with an appeal now pending before Sweden’s Supreme Administrative Court.
The company’s own defense is worth noting because it illustrates exactly the kind of definitional fight at the heart of this entire crackdown. Hive’s Swedish country manager has pushed back on the tax agency’s characterization, arguing that the actual mining computations are carried out by external, independent mining pools rather than by the Swedish entity itself, and that what the company sells is computing capacity – power that could be used for AI workloads just as easily as mining. That’s not a throwaway detail. It’s the exact argument the entire Swedish data center industry is now having with its tax authority: where, precisely, does “selling computing capacity” end and “operating a mining business dressed up as computing capacity” begin, and who gets to make that call – the company structuring the contract, or the tax agency examining what the hardware actually did.
A Bigger, Uglier Case Is Running in Parallel
This Boden enforcement action doesn’t exist in isolation. Just weeks earlier, a separate and considerably more serious investigation became public when authorities searched company-related premises in Frankfurt as well as Boden and the nearby city of Luleå, arresting four people in connection with suspected large-scale VAT fraud estimated at more than €100 million – tied to Northern Data’s Swedish operations, including subsidiaries with deep roots in Bitcoin mining. Unlike the civil tax-adjustment cases, that investigation involves a criminal probe, arrests, and dramatically higher estimated losses to the Swedish treasury. Northern Data has said it was surprised by the escalation and believes authorities misunderstood how its GPU cloud offering and legacy mining operations are actually structured, and has stated it’s cooperating with the investigation.
The proximity of these cases – geographically in the same small cluster of northern Swedish cities, and conceptually in the same underlying question of whether crypto mining was mislabeled as legitimate computing to dodge tax obligations – suggests Swedish authorities have identified a genuine pattern across the industry’s northern footprint, not a handful of unrelated bad actors. When multiple independent operators in the same small region are found using structurally similar arrangements to claim the same category of tax benefit, that starts to look less like coincidence and more like an open industry practice that had simply gone unchallenged until Skatteverket built the analytical capacity to unpick it.
The AI Pivot Just Made Everything More Complicated
There’s a twist that makes this moment particularly consequential for the industry rather than just historically interesting: many of these same Boden-area mining operations have been actively converting their infrastructure toward AI computing as crypto mining margins have compressed and AI compute demand has surged. That pivot, in principle, should make the tax question easier – selling AI cloud capacity typically involves a real contract, an identifiable paying customer, and a clearly defined computing service, which fits more naturally into conventional VAT treatment than crypto mining’s more ambiguous economics, where there’s often no direct customer at all, just a mining pool distributing block rewards.
But Swedish authorities have made clear that relabeling infrastructure as AI-focused doesn’t automatically resolve the underlying scrutiny. Tax officials can still examine what the hardware actually did during the period in question, who genuinely controlled the operation, and whether the contractual paperwork matches the real economic activity – meaning companies mid-transition from mining to AI face continued exposure for their historical mining-era activity even as their forward-looking business model shifts toward something the tax system treats more favorably. For an industry racing to reposition itself around the AI boom, unresolved tax liability from its crypto-mining past is turning into a genuine drag on that transition, not a closed chapter.
Why This Should Matter Beyond Sweden
Sweden isn’t unique in having attracted crypto mining operations with cheap renewable power and favorable industrial tax treatment – Iceland, Norway, and parts of Canada have all played a similar role at different points. What makes Sweden’s crackdown notable is the sophistication and duration of the enforcement effort: a multi-year, industry-wide audit process, escalating enforcement waves, a parallel criminal investigation, and a tax authority willing to keep pursuing appeals through the country’s highest administrative court rather than settling quietly. That’s a meaningful signal to any jurisdiction currently hosting crypto mining operations under similarly generous data-center tax regimes: the gap between “how a company describes its business for tax purposes” and “what its hardware actually does” is exactly the kind of gap tax authorities are getting better equipped to close, especially as mining’s public reporting requirements, energy consumption data, and blockchain-level transparency make the underlying activity harder to obscure than traditional tax avoidance schemes typically are.
There’s also a broader European regulatory dimension worth noting: Sweden’s approach to withholding tax refunds for foreign contractors, a related but separate piece of its tax enforcement posture, is currently being challenged before the European Commission as a potential barrier to cross-border services, with Sweden having submitted its defense and the case still pending. That’s a reminder that Sweden’s aggressive posture toward data center and mining taxation isn’t happening in a vacuum – it’s part of a broader tightening of how the country treats an industry it once actively courted for its clean-energy credentials, and that tightening is itself now subject to scrutiny at the EU level.
Conclusion
Boden’s rise as a crypto mining hub was built on a straightforward value proposition: cheap, green power and a tax framework that rewarded data center investment. What’s playing out now is the other side of that bargain – a tax authority that spent years building the audit capacity to determine whether companies were actually earning those benefits honestly, and increasingly concluding that many weren’t. Whether this specific $56.5 million action holds up through Bikupan’s pending Supreme Court appeal, or whether other Boden operators face similar bills as Skatteverket’s multi-year audit process continues, the larger pattern is already clear: the era of crypto miners in Sweden benefiting from ambiguity about what their hardware was actually doing appears to be closing, right as the same operators are trying to pivot their business model toward an AI boom that hasn’t yet decided whether it wants to inherit their tax problems along with their power contracts.
This post Sweden Built a Green Bitcoin Hub on Cheap Hydropower. Now It’s Auditing Its Way Through It. first appeared on BitcoinWorld.
38
·
--

Article
The $1.3 Million Burn Nobody Approved Yesterday – Because It Runs ItselfBitcoinWorldThe $1.3 Million Burn Nobody Approved Yesterday – Because It Runs Itself
Most token burns in crypto are events. A team announces one, schedules it, live-streams the transaction, and treats it as a marketing moment designed to generate a headline and a temporary price bump. Hyperliquid’s latest burn – 15,350 HYPE, worth about $1.32 million, destroyed over the past 24 hours – isn’t that kind of event at all. Nobody at Hyperliquid decided to do this yesterday. Nobody will decide to do it again tomorrow. It happens automatically, continuously, every single day, whether anyone is paying attention or not – and that mechanical, boring consistency is precisely what makes it one of the more interesting tokenomics experiments running in crypto right now.
The Machine Behind the Number
The burn mechanism driving this figure is Hyperliquid’s Assistance Fund, an automated, on-chain system that takes a large share – reportedly 97% to 99% depending on the fee category – of the protocol’s trading fee revenue and uses it to buy HYPE tokens directly on the open market, continuously, with no human approval required for any individual purchase. Every token the Fund buys gets burned: permanently destroyed, removed from both circulating and total supply, unrecoverable by design.
That last part matters more than it might initially seem. For over a year, the Assistance Fund’s accumulated tokens sat at a system address that had no private key attached to it – meaning, in principle, those tokens were inaccessible rather than formally destroyed, a technical distinction that mattered to careful observers even if the practical effect looked identical. Hyperliquid closed that ambiguity in December 2025, when validators held a formal governance vote – passing with roughly 85% of staked weight in favor – to permanently recognize the Fund’s holdings as burned and to commit, as a matter of validator consensus, against ever approving a protocol upgrade that could restore access to that address. That vote transformed what had been a practical inaccessibility into something closer to an irreversible protocol-level commitment, and it’s been independently corroborated in securities filings from Hyperliquid Strategies, the Nasdaq-listed entity with exposure to HYPE, which explicitly states the tokens are burnt and permanently removed from circulation.
Why $1.32 Million in One Day Is Actually Unremarkable – In a Good Way
Framed as a single headline number, $1.32 million sounds like a notable one-off event. In context, it’s closer to an ordinary day. Cumulative burns through this mechanism had already reached roughly 48.42 million HYPE by September 6, worth more than $4 billion at recent prices, and daily burns have been running in a fairly consistent range – reports from the preceding day put the figure at $830,000, and averages over recent months have hovered around $1 million per day, scaling up or down directly with how much trading volume the platform generates. This latest 24-hour figure at $86.17 average burn price is simply the next entry in a pattern that’s been running, uninterrupted, for well over a year.
That consistency is the actual story, more than any single day’s total. A marketing-driven burn event happens once and generates attention once. A mechanism that’s quietly destroyed nearly 5% of a token’s entire maximum supply through routine, automated daily operation – without ever needing a press release to justify it – is a fundamentally different kind of tokenomics claim, and one that’s much harder to fake or manufacture for a headline.
The Part Worth Understanding Even If You Don’t Trade HYPE
It’s worth being precise about what this burn mechanism actually is and isn’t, because the language around “buybacks” and “burns” in crypto often borrows equity-market vocabulary in ways that can mislead. HYPE is not company stock. Holding it doesn’t confer a legal claim on Hyperliquid Labs’ revenue, and the burn doesn’t distribute cash to holders the way a dividend would. What the mechanism actually does is narrower but still economically meaningful: it mechanically converts a portion of the platform’s real trading activity into permanent supply reduction, without requiring anyone to believe in an abstract growth story. As long as people trade on Hyperliquid and pay fees, tokens keep getting removed from circulation – the demand for HYPE created by this mechanism is a direct byproduct of platform usage, not speculative sentiment layered on top of it.
That structural link between usage and supply reduction is what analysts have pointed to as unusually aggressive by industry standards. The Assistance Fund’s buyback rate has been estimated at roughly 7% of HYPE’s market capitalization on an annualized basis – a multiple reportedly four to five times higher than comparable large-cap crypto burn or buyback mechanisms, including Ethereum’s fee-burn model, BNB’s quarterly burns, or Solana’s priority-fee burn. Hyperliquid and Pump.fun together have reportedly accounted for the vast majority of all tracked token buyback activity across the entire crypto industry in 2026, which says as much about how unusual this scale of continuous, revenue-funded burning still is as it does about either individual project.
What This Does and Doesn’t Tell You About HYPE’s Price
It would be a mistake to read a steady burn rate as a guarantee of rising prices, and it’s worth resisting that temptation even though the mechanism has coincided with strong performance – HYPE has gained more than 50% since a mid-August breakout, reaching an all-time high above $88 and holding above $80 through several token unlock events that might otherwise have pressured the price downward. The burn mechanism creates structural demand and reduces available supply, but supply reduction alone doesn’t determine price; it interacts with everything else affecting demand, including broader market sentiment, competitive dynamics among perpetuals exchanges, and the platform’s own trading volume trends, which is itself the variable the burn depends on rather than something the burn independently drives.
There’s a useful comparison worth drawing out here: a token unlock on September 6 released 9.92 million HYPE into circulation – new supply that, in isolation, should create selling pressure. The Assistance Fund’s cumulative burn of 48.42 million tokens outweighs that single unlock by roughly five to one, which is part of why HYPE has shown resilience through unlock events that have historically pressured other tokens lower. But that comparison also reveals the mechanism’s real limit: it competes with new supply entering circulation, it doesn’t eliminate that supply, and its effectiveness scales directly with trading volume – a slowdown in platform activity would mechanically slow the burn rate in exactly the way it has scaled up during periods of high volume.
The Bigger Question This Raises for Crypto Tokenomics Generally
Hyperliquid’s model is being watched closely across the industry precisely because it represents a genuinely different answer to a question most crypto protocols have struggled with: how does a token capture value from the platform’s actual business activity, rather than relying purely on speculative demand or artificial scarcity mechanics disconnected from real usage? Fee-funded, automated, permanently-destroyed buybacks are a comparatively clean answer – transparent, verifiable on-chain by anyone, and directly tied to a metric (trading fee revenue) that reflects genuine platform adoption rather than token-specific hype.
Whether other protocols can replicate this at similar scale depends heavily on whether they generate comparable fee revenue in the first place – Hyperliquid’s position as one of the dominant decentralized perpetuals exchanges gives it a fee base most competing protocols simply don’t have. That’s worth remembering before assuming this model is easily copied elsewhere in the industry: the mechanism is elegant, but it’s only as powerful as the trading volume feeding it.
Conclusion
A $1.32 million burn in a single day is, by itself, a fairly small data point – interesting mostly as confirmation that a well-established mechanism continues operating as designed. The more significant fact is what it’s part of: a system that has now permanently destroyed nearly 5% of HYPE’s total possible supply through pure automated mechanics, funded entirely by real trading activity, with no marketing calendar and no discretionary human decision behind any individual transaction. That’s a different kind of tokenomics story than crypto is used to telling – less about a single dramatic announcement, more about whether a protocol can keep generating enough genuine economic activity to keep the machine running. So far, it has, day after day, largely without anyone needing to make a case for why it should continue.
This post The $1.3 Million Burn Nobody Approved Yesterday – Because It Runs Itself first appeared on BitcoinWorld.
The $1.3 Million Burn Nobody Approved Yesterday – Because It Runs Itself
BitcoinWorldThe $1.3 Million Burn Nobody Approved Yesterday – Because It Runs Itself
Most token burns in crypto are events. A team announces one, schedules it, live-streams the transaction, and treats it as a marketing moment designed to generate a headline and a temporary price bump. Hyperliquid’s latest burn – 15,350 HYPE, worth about $1.32 million, destroyed over the past 24 hours – isn’t that kind of event at all. Nobody at Hyperliquid decided to do this yesterday. Nobody will decide to do it again tomorrow. It happens automatically, continuously, every single day, whether anyone is paying attention or not – and that mechanical, boring consistency is precisely what makes it one of the more interesting tokenomics experiments running in crypto right now.
The Machine Behind the Number
The burn mechanism driving this figure is Hyperliquid’s Assistance Fund, an automated, on-chain system that takes a large share – reportedly 97% to 99% depending on the fee category – of the protocol’s trading fee revenue and uses it to buy HYPE tokens directly on the open market, continuously, with no human approval required for any individual purchase. Every token the Fund buys gets burned: permanently destroyed, removed from both circulating and total supply, unrecoverable by design.
That last part matters more than it might initially seem. For over a year, the Assistance Fund’s accumulated tokens sat at a system address that had no private key attached to it – meaning, in principle, those tokens were inaccessible rather than formally destroyed, a technical distinction that mattered to careful observers even if the practical effect looked identical. Hyperliquid closed that ambiguity in December 2025, when validators held a formal governance vote – passing with roughly 85% of staked weight in favor – to permanently recognize the Fund’s holdings as burned and to commit, as a matter of validator consensus, against ever approving a protocol upgrade that could restore access to that address. That vote transformed what had been a practical inaccessibility into something closer to an irreversible protocol-level commitment, and it’s been independently corroborated in securities filings from Hyperliquid Strategies, the Nasdaq-listed entity with exposure to HYPE, which explicitly states the tokens are burnt and permanently removed from circulation.
Why $1.32 Million in One Day Is Actually Unremarkable – In a Good Way
Framed as a single headline number, $1.32 million sounds like a notable one-off event. In context, it’s closer to an ordinary day. Cumulative burns through this mechanism had already reached roughly 48.42 million HYPE by September 6, worth more than $4 billion at recent prices, and daily burns have been running in a fairly consistent range – reports from the preceding day put the figure at $830,000, and averages over recent months have hovered around $1 million per day, scaling up or down directly with how much trading volume the platform generates. This latest 24-hour figure at $86.17 average burn price is simply the next entry in a pattern that’s been running, uninterrupted, for well over a year.
That consistency is the actual story, more than any single day’s total. A marketing-driven burn event happens once and generates attention once. A mechanism that’s quietly destroyed nearly 5% of a token’s entire maximum supply through routine, automated daily operation – without ever needing a press release to justify it – is a fundamentally different kind of tokenomics claim, and one that’s much harder to fake or manufacture for a headline.
The Part Worth Understanding Even If You Don’t Trade HYPE
It’s worth being precise about what this burn mechanism actually is and isn’t, because the language around “buybacks” and “burns” in crypto often borrows equity-market vocabulary in ways that can mislead. HYPE is not company stock. Holding it doesn’t confer a legal claim on Hyperliquid Labs’ revenue, and the burn doesn’t distribute cash to holders the way a dividend would. What the mechanism actually does is narrower but still economically meaningful: it mechanically converts a portion of the platform’s real trading activity into permanent supply reduction, without requiring anyone to believe in an abstract growth story. As long as people trade on Hyperliquid and pay fees, tokens keep getting removed from circulation – the demand for HYPE created by this mechanism is a direct byproduct of platform usage, not speculative sentiment layered on top of it.
That structural link between usage and supply reduction is what analysts have pointed to as unusually aggressive by industry standards. The Assistance Fund’s buyback rate has been estimated at roughly 7% of HYPE’s market capitalization on an annualized basis – a multiple reportedly four to five times higher than comparable large-cap crypto burn or buyback mechanisms, including Ethereum’s fee-burn model, BNB’s quarterly burns, or Solana’s priority-fee burn. Hyperliquid and Pump.fun together have reportedly accounted for the vast majority of all tracked token buyback activity across the entire crypto industry in 2026, which says as much about how unusual this scale of continuous, revenue-funded burning still is as it does about either individual project.
What This Does and Doesn’t Tell You About HYPE’s Price
It would be a mistake to read a steady burn rate as a guarantee of rising prices, and it’s worth resisting that temptation even though the mechanism has coincided with strong performance – HYPE has gained more than 50% since a mid-August breakout, reaching an all-time high above $88 and holding above $80 through several token unlock events that might otherwise have pressured the price downward. The burn mechanism creates structural demand and reduces available supply, but supply reduction alone doesn’t determine price; it interacts with everything else affecting demand, including broader market sentiment, competitive dynamics among perpetuals exchanges, and the platform’s own trading volume trends, which is itself the variable the burn depends on rather than something the burn independently drives.
There’s a useful comparison worth drawing out here: a token unlock on September 6 released 9.92 million HYPE into circulation – new supply that, in isolation, should create selling pressure. The Assistance Fund’s cumulative burn of 48.42 million tokens outweighs that single unlock by roughly five to one, which is part of why HYPE has shown resilience through unlock events that have historically pressured other tokens lower. But that comparison also reveals the mechanism’s real limit: it competes with new supply entering circulation, it doesn’t eliminate that supply, and its effectiveness scales directly with trading volume – a slowdown in platform activity would mechanically slow the burn rate in exactly the way it has scaled up during periods of high volume.
The Bigger Question This Raises for Crypto Tokenomics Generally
Hyperliquid’s model is being watched closely across the industry precisely because it represents a genuinely different answer to a question most crypto protocols have struggled with: how does a token capture value from the platform’s actual business activity, rather than relying purely on speculative demand or artificial scarcity mechanics disconnected from real usage? Fee-funded, automated, permanently-destroyed buybacks are a comparatively clean answer – transparent, verifiable on-chain by anyone, and directly tied to a metric (trading fee revenue) that reflects genuine platform adoption rather than token-specific hype.
Whether other protocols can replicate this at similar scale depends heavily on whether they generate comparable fee revenue in the first place – Hyperliquid’s position as one of the dominant decentralized perpetuals exchanges gives it a fee base most competing protocols simply don’t have. That’s worth remembering before assuming this model is easily copied elsewhere in the industry: the mechanism is elegant, but it’s only as powerful as the trading volume feeding it.
Conclusion
A $1.32 million burn in a single day is, by itself, a fairly small data point – interesting mostly as confirmation that a well-established mechanism continues operating as designed. The more significant fact is what it’s part of: a system that has now permanently destroyed nearly 5% of HYPE’s total possible supply through pure automated mechanics, funded entirely by real trading activity, with no marketing calendar and no discretionary human decision behind any individual transaction. That’s a different kind of tokenomics story than crypto is used to telling – less about a single dramatic announcement, more about whether a protocol can keep generating enough genuine economic activity to keep the machine running. So far, it has, day after day, largely without anyone needing to make a case for why it should continue.
This post The $1.3 Million Burn Nobody Approved Yesterday – Because It Runs Itself first appeared on BitcoinWorld.
Most token burns in crypto are events. A team announces one, schedules it, live-streams the transaction, and treats it as a marketing moment designed to generate a headline and a temporary price bump. Hyperliquid’s latest burn – 15,350 HYPE, worth about $1.32 million, destroyed over the past 24 hours – isn’t that kind of event at all. Nobody at Hyperliquid decided to do this yesterday. Nobody will decide to do it again tomorrow. It happens automatically, continuously, every single day, whether anyone is paying attention or not – and that mechanical, boring consistency is precisely what makes it one of the more interesting tokenomics experiments running in crypto right now.
The Machine Behind the Number
The burn mechanism driving this figure is Hyperliquid’s Assistance Fund, an automated, on-chain system that takes a large share – reportedly 97% to 99% depending on the fee category – of the protocol’s trading fee revenue and uses it to buy HYPE tokens directly on the open market, continuously, with no human approval required for any individual purchase. Every token the Fund buys gets burned: permanently destroyed, removed from both circulating and total supply, unrecoverable by design.
That last part matters more than it might initially seem. For over a year, the Assistance Fund’s accumulated tokens sat at a system address that had no private key attached to it – meaning, in principle, those tokens were inaccessible rather than formally destroyed, a technical distinction that mattered to careful observers even if the practical effect looked identical. Hyperliquid closed that ambiguity in December 2025, when validators held a formal governance vote – passing with roughly 85% of staked weight in favor – to permanently recognize the Fund’s holdings as burned and to commit, as a matter of validator consensus, against ever approving a protocol upgrade that could restore access to that address. That vote transformed what had been a practical inaccessibility into something closer to an irreversible protocol-level commitment, and it’s been independently corroborated in securities filings from Hyperliquid Strategies, the Nasdaq-listed entity with exposure to HYPE, which explicitly states the tokens are burnt and permanently removed from circulation.
Why $1.32 Million in One Day Is Actually Unremarkable – In a Good Way
Framed as a single headline number, $1.32 million sounds like a notable one-off event. In context, it’s closer to an ordinary day. Cumulative burns through this mechanism had already reached roughly 48.42 million HYPE by September 6, worth more than $4 billion at recent prices, and daily burns have been running in a fairly consistent range – reports from the preceding day put the figure at $830,000, and averages over recent months have hovered around $1 million per day, scaling up or down directly with how much trading volume the platform generates. This latest 24-hour figure at $86.17 average burn price is simply the next entry in a pattern that’s been running, uninterrupted, for well over a year.
That consistency is the actual story, more than any single day’s total. A marketing-driven burn event happens once and generates attention once. A mechanism that’s quietly destroyed nearly 5% of a token’s entire maximum supply through routine, automated daily operation – without ever needing a press release to justify it – is a fundamentally different kind of tokenomics claim, and one that’s much harder to fake or manufacture for a headline.
The Part Worth Understanding Even If You Don’t Trade HYPE
It’s worth being precise about what this burn mechanism actually is and isn’t, because the language around “buybacks” and “burns” in crypto often borrows equity-market vocabulary in ways that can mislead. HYPE is not company stock. Holding it doesn’t confer a legal claim on Hyperliquid Labs’ revenue, and the burn doesn’t distribute cash to holders the way a dividend would. What the mechanism actually does is narrower but still economically meaningful: it mechanically converts a portion of the platform’s real trading activity into permanent supply reduction, without requiring anyone to believe in an abstract growth story. As long as people trade on Hyperliquid and pay fees, tokens keep getting removed from circulation – the demand for HYPE created by this mechanism is a direct byproduct of platform usage, not speculative sentiment layered on top of it.
That structural link between usage and supply reduction is what analysts have pointed to as unusually aggressive by industry standards. The Assistance Fund’s buyback rate has been estimated at roughly 7% of HYPE’s market capitalization on an annualized basis – a multiple reportedly four to five times higher than comparable large-cap crypto burn or buyback mechanisms, including Ethereum’s fee-burn model, BNB’s quarterly burns, or Solana’s priority-fee burn. Hyperliquid and Pump.fun together have reportedly accounted for the vast majority of all tracked token buyback activity across the entire crypto industry in 2026, which says as much about how unusual this scale of continuous, revenue-funded burning still is as it does about either individual project.
What This Does and Doesn’t Tell You About HYPE’s Price
It would be a mistake to read a steady burn rate as a guarantee of rising prices, and it’s worth resisting that temptation even though the mechanism has coincided with strong performance – HYPE has gained more than 50% since a mid-August breakout, reaching an all-time high above $88 and holding above $80 through several token unlock events that might otherwise have pressured the price downward. The burn mechanism creates structural demand and reduces available supply, but supply reduction alone doesn’t determine price; it interacts with everything else affecting demand, including broader market sentiment, competitive dynamics among perpetuals exchanges, and the platform’s own trading volume trends, which is itself the variable the burn depends on rather than something the burn independently drives.
There’s a useful comparison worth drawing out here: a token unlock on September 6 released 9.92 million HYPE into circulation – new supply that, in isolation, should create selling pressure. The Assistance Fund’s cumulative burn of 48.42 million tokens outweighs that single unlock by roughly five to one, which is part of why HYPE has shown resilience through unlock events that have historically pressured other tokens lower. But that comparison also reveals the mechanism’s real limit: it competes with new supply entering circulation, it doesn’t eliminate that supply, and its effectiveness scales directly with trading volume – a slowdown in platform activity would mechanically slow the burn rate in exactly the way it has scaled up during periods of high volume.
The Bigger Question This Raises for Crypto Tokenomics Generally
Hyperliquid’s model is being watched closely across the industry precisely because it represents a genuinely different answer to a question most crypto protocols have struggled with: how does a token capture value from the platform’s actual business activity, rather than relying purely on speculative demand or artificial scarcity mechanics disconnected from real usage? Fee-funded, automated, permanently-destroyed buybacks are a comparatively clean answer – transparent, verifiable on-chain by anyone, and directly tied to a metric (trading fee revenue) that reflects genuine platform adoption rather than token-specific hype.
Whether other protocols can replicate this at similar scale depends heavily on whether they generate comparable fee revenue in the first place – Hyperliquid’s position as one of the dominant decentralized perpetuals exchanges gives it a fee base most competing protocols simply don’t have. That’s worth remembering before assuming this model is easily copied elsewhere in the industry: the mechanism is elegant, but it’s only as powerful as the trading volume feeding it.
Conclusion
A $1.32 million burn in a single day is, by itself, a fairly small data point – interesting mostly as confirmation that a well-established mechanism continues operating as designed. The more significant fact is what it’s part of: a system that has now permanently destroyed nearly 5% of HYPE’s total possible supply through pure automated mechanics, funded entirely by real trading activity, with no marketing calendar and no discretionary human decision behind any individual transaction. That’s a different kind of tokenomics story than crypto is used to telling – less about a single dramatic announcement, more about whether a protocol can keep generating enough genuine economic activity to keep the machine running. So far, it has, day after day, largely without anyone needing to make a case for why it should continue.
This post The $1.3 Million Burn Nobody Approved Yesterday – Because It Runs Itself first appeared on BitcoinWorld.
263
·
--

Article
The Weekend Bank Transfer Just Happened. That’s the Whole Point.BitcoinWorldThe Weekend Bank Transfer Just Happened. That’s the Whole Point.
For most of banking history, “the weekend” has functioned as an invisible tax on global commerce – not a fee anyone sees on a statement, but a real cost paid in idle capital, delayed shipments, and treasurers staring at a screen on a Friday afternoon wondering whether a payment will clear before Monday morning or sit frozen until the following week. On September 5, DBS and Citi quietly made that tax a little less inevitable, moving U.S. dollars between Singapore and New York on a Saturday, settled in minutes, through a system that didn’t exist eighteen months ago.
It’s a small transaction by dollar volume – neither bank has disclosed the amount – but it’s a meaningful marker of something bigger happening beneath the surface of global finance: the institution that has run the plumbing of international banking for half a century is rebuilding that plumbing on blockchain rails, and doing it specifically because it has no other choice.
Why Weekends Are a Real Problem, Not a Minor Inconvenience
It’s worth being concrete about what “up to two business days” actually costs a business. A company moving dollars from Singapore to the U.S. that misses Friday’s processing window doesn’t just wait a couple of extra days out of mild annoyance – it means working capital sits frozen precisely when a company might need it most: to fund a supplier payment, cover a payroll run, or capture a time-sensitive trading opportunity. For businesses that operate genuinely around the clock – e-commerce platforms, digital services, anything with customers and suppliers spread across time zones that don’t share a business calendar – the traditional correspondent banking system’s adherence to Monday-through-Friday, 9-to-5 local hours has always been a mismatch between how banks work and how modern commerce actually runs.
DBS has pointed to a specific number that frames why this matters at scale: Asia’s outbound cross-border payments are projected to reach $24 trillion by 2033. Even a modest percentage of that volume moving to genuinely real-time settlement represents an enormous unlock of capital efficiency – money that currently sits idle in transit becoming money that’s actually working.
What Actually Happened, Technically
The transaction ran on something called the Swift Digital Ledger – a blockchain-based settlement layer that SWIFT, the messaging cooperative that effectively every bank on earth relies on to communicate payment instructions, built in partnership with blockchain infrastructure firm ConsenSys on Linea, an Ethereum layer-2 network. The design is deliberately conservative in one important respect: it doesn’t replace the existing banking system’s final settlement infrastructure. Instead, it uses shared blockchain infrastructure to record and validate “tokenized deposits” – essentially, digital representations of ordinary commercial bank money that stays on each bank’s own balance sheet – allowing payment commitments to move and settle continuously, including overnight and on weekends, before final settlement squares up through conventional real-time gross settlement systems once normal banking hours resume.
That architecture matters more than it might sound. SWIFT isn’t building a cryptocurrency, and it isn’t asking banks to hold anything resembling a stablecoin. It’s using blockchain as a coordination and settlement-recording layer while keeping the underlying money itself inside the regulated banking system – a hybrid approach clearly designed to capture the speed benefits of blockchain rails without asking banks or regulators to accept the custody and reserve-backing questions that come with actual crypto-asset exposure.
This Is Part of a Bigger, Faster-Moving Pilot Than the Single Transaction Suggests
The DBS-Citi transaction wasn’t an isolated experiment – it’s one data point in a rapidly expanding proof-of-concept that SWIFT launched with more than 30 major banks after unveiling the ledger project in September 2025. The pilot, running as a controlled program from July through December 2026, already has real transaction history behind it: HSBC and Standard Chartered completed the first live interbank transfer on the ledger, and just three days before the DBS-Citi weekend transaction, Citi itself went live with First Abu Dhabi Bank and OCBC in Singapore – extending the network’s live footprint into the Middle East and Southeast Asia within the same week. UOB is reportedly expected to run equivalent transactions with Citi later in September as well.
That pace is worth sitting with. In the space of roughly a week, this pilot moved from a single interbank proof point to live transactions spanning three continents and, with the DBS-Citi settlement, an entirely new capability – weekend processing – that none of the earlier transactions reportedly demonstrated. Pilots that move that quickly from region to region and capability to capability tend to be signaling something about institutional appetite, not just technical readiness: the participating banks clearly want this infrastructure working and are pushing to demonstrate breadth quickly, likely with an eye toward what comes after the pilot period ends in December.
The Part of the Story That’s Really About Stablecoins
It would be a mistake to read this purely as a banking-efficiency story without acknowledging the competitive pressure driving it. SWIFT’s blockchain ledger project has been explicitly framed, including by SWIFT itself, as a response to the growing traction of stablecoins and crypto-native payment rails – a category that has spent the last several years demonstrating exactly the kind of always-on, borderless settlement that traditional correspondent banking has structurally struggled to match. Stablecoins already move dollar-denominated value around the clock, across borders, without waiting for a New York clearing window to open on Monday morning. That’s a real threat to SWIFT’s core relevance: if businesses and even banks themselves find it easier to settle in USDT or USDC than to wait on traditional correspondent banking rails, the decades of institutional lock-in that make SWIFT indispensable start to erode.
Seen that way, the DBS-Citi weekend transaction isn’t just a technical milestone – it’s a competitive countermove. SWIFT and its 30-plus bank partners are essentially racing to prove that the regulated banking system can deliver the always-on settlement experience that stablecoins offer, without requiring anyone to actually hold or trust a privately issued digital dollar token outside the banking system. If they succeed, the argument for businesses to route dollar liquidity through stablecoin rails instead of banks gets meaningfully weaker.
Why Citi and DBS Specifically Were Positioned to Move First
Neither bank arrived at this milestone from a standing start. Citi has been building toward always-on dollar settlement for years – its Token Services platform already processes roughly $1 billion in transactions weekly, and the bank integrated that platform with its 24/7 USD Clearing network (which connects over 250 banks across more than 40 markets) back in September 2025, specifically to enable round-the-clock multibank payments for institutional clients. DBS launched its own Token Services platform in 2024. The weekend settlement, in other words, wasn’t a leap into unfamiliar territory for either institution – it was the convergence of parallel infrastructure investments each bank had already been making independently, now connected through SWIFT’s shared ledger to work across institutions rather than just within each bank’s own client network.
That matters for judging how quickly this capability could scale beyond a pilot. The hardest part of building always-on settlement infrastructure – the internal tokenization platforms, the operational processes for managing digital deposit representations – is largely already built at both banks. What SWIFT’s ledger adds is the interoperability layer that lets that infrastructure talk to other banks’ equivalent systems, which is precisely the kind of network-effect problem SWIFT has spent decades solving for traditional payment messaging.
What to Watch Between Now and December
The proof-of-concept phase runs through the end of 2026, and a few things will determine whether this becomes genuine infrastructure rather than an impressive but contained pilot. Transaction volumes and values need to scale – neither the DBS-Citi transaction nor Citi’s FAB and OCBC transactions have disclosed dollar amounts, which is typical for early pilot activity but will need to change before anyone can assess real commercial traction. The list of participating banks and currencies will likely keep expanding; a dollar-only, 30-bank pilot is meaningfully different from a multi-currency system spanning the hundreds of institutions SWIFT’s existing messaging network already reaches. And regulators, particularly in jurisdictions like the U.S. and Singapore that have been relatively open to institutional blockchain experimentation, will be watching closely for how this framework handles the eventual transition from controlled pilot to commercial availability – including questions about liability, dispute resolution, and cross-border regulatory coordination that a live production system will need to answer in ways a pilot doesn’t.
Conclusion
A single weekend payment between Singapore and New York won’t by itself change how global finance works. But it’s a genuinely useful signal of where the largest, most conservative institutions in banking believe the industry is heading – and how seriously they’re taking the competitive threat posed by crypto-native alternatives that have already proven people want money that moves on their schedule, not the bank’s. SWIFT spent fifty years making sure every bank on earth could talk to every other bank. What DBS and Citi just demonstrated is that the same institution is now racing to make sure those banks can also move money to each other on a Saturday – and that race exists because, for the first time in SWIFT’s history, waiting until Monday is no longer something the market is willing to accept as simply how banking works.
This post The Weekend Bank Transfer Just Happened. That’s the Whole Point. first appeared on BitcoinWorld.
The Weekend Bank Transfer Just Happened. That’s the Whole Point.
BitcoinWorldThe Weekend Bank Transfer Just Happened. That’s the Whole Point.
For most of banking history, “the weekend” has functioned as an invisible tax on global commerce – not a fee anyone sees on a statement, but a real cost paid in idle capital, delayed shipments, and treasurers staring at a screen on a Friday afternoon wondering whether a payment will clear before Monday morning or sit frozen until the following week. On September 5, DBS and Citi quietly made that tax a little less inevitable, moving U.S. dollars between Singapore and New York on a Saturday, settled in minutes, through a system that didn’t exist eighteen months ago.
It’s a small transaction by dollar volume – neither bank has disclosed the amount – but it’s a meaningful marker of something bigger happening beneath the surface of global finance: the institution that has run the plumbing of international banking for half a century is rebuilding that plumbing on blockchain rails, and doing it specifically because it has no other choice.
Why Weekends Are a Real Problem, Not a Minor Inconvenience
It’s worth being concrete about what “up to two business days” actually costs a business. A company moving dollars from Singapore to the U.S. that misses Friday’s processing window doesn’t just wait a couple of extra days out of mild annoyance – it means working capital sits frozen precisely when a company might need it most: to fund a supplier payment, cover a payroll run, or capture a time-sensitive trading opportunity. For businesses that operate genuinely around the clock – e-commerce platforms, digital services, anything with customers and suppliers spread across time zones that don’t share a business calendar – the traditional correspondent banking system’s adherence to Monday-through-Friday, 9-to-5 local hours has always been a mismatch between how banks work and how modern commerce actually runs.
DBS has pointed to a specific number that frames why this matters at scale: Asia’s outbound cross-border payments are projected to reach $24 trillion by 2033. Even a modest percentage of that volume moving to genuinely real-time settlement represents an enormous unlock of capital efficiency – money that currently sits idle in transit becoming money that’s actually working.
What Actually Happened, Technically
The transaction ran on something called the Swift Digital Ledger – a blockchain-based settlement layer that SWIFT, the messaging cooperative that effectively every bank on earth relies on to communicate payment instructions, built in partnership with blockchain infrastructure firm ConsenSys on Linea, an Ethereum layer-2 network. The design is deliberately conservative in one important respect: it doesn’t replace the existing banking system’s final settlement infrastructure. Instead, it uses shared blockchain infrastructure to record and validate “tokenized deposits” – essentially, digital representations of ordinary commercial bank money that stays on each bank’s own balance sheet – allowing payment commitments to move and settle continuously, including overnight and on weekends, before final settlement squares up through conventional real-time gross settlement systems once normal banking hours resume.
That architecture matters more than it might sound. SWIFT isn’t building a cryptocurrency, and it isn’t asking banks to hold anything resembling a stablecoin. It’s using blockchain as a coordination and settlement-recording layer while keeping the underlying money itself inside the regulated banking system – a hybrid approach clearly designed to capture the speed benefits of blockchain rails without asking banks or regulators to accept the custody and reserve-backing questions that come with actual crypto-asset exposure.
This Is Part of a Bigger, Faster-Moving Pilot Than the Single Transaction Suggests
The DBS-Citi transaction wasn’t an isolated experiment – it’s one data point in a rapidly expanding proof-of-concept that SWIFT launched with more than 30 major banks after unveiling the ledger project in September 2025. The pilot, running as a controlled program from July through December 2026, already has real transaction history behind it: HSBC and Standard Chartered completed the first live interbank transfer on the ledger, and just three days before the DBS-Citi weekend transaction, Citi itself went live with First Abu Dhabi Bank and OCBC in Singapore – extending the network’s live footprint into the Middle East and Southeast Asia within the same week. UOB is reportedly expected to run equivalent transactions with Citi later in September as well.
That pace is worth sitting with. In the space of roughly a week, this pilot moved from a single interbank proof point to live transactions spanning three continents and, with the DBS-Citi settlement, an entirely new capability – weekend processing – that none of the earlier transactions reportedly demonstrated. Pilots that move that quickly from region to region and capability to capability tend to be signaling something about institutional appetite, not just technical readiness: the participating banks clearly want this infrastructure working and are pushing to demonstrate breadth quickly, likely with an eye toward what comes after the pilot period ends in December.
The Part of the Story That’s Really About Stablecoins
It would be a mistake to read this purely as a banking-efficiency story without acknowledging the competitive pressure driving it. SWIFT’s blockchain ledger project has been explicitly framed, including by SWIFT itself, as a response to the growing traction of stablecoins and crypto-native payment rails – a category that has spent the last several years demonstrating exactly the kind of always-on, borderless settlement that traditional correspondent banking has structurally struggled to match. Stablecoins already move dollar-denominated value around the clock, across borders, without waiting for a New York clearing window to open on Monday morning. That’s a real threat to SWIFT’s core relevance: if businesses and even banks themselves find it easier to settle in USDT or USDC than to wait on traditional correspondent banking rails, the decades of institutional lock-in that make SWIFT indispensable start to erode.
Seen that way, the DBS-Citi weekend transaction isn’t just a technical milestone – it’s a competitive countermove. SWIFT and its 30-plus bank partners are essentially racing to prove that the regulated banking system can deliver the always-on settlement experience that stablecoins offer, without requiring anyone to actually hold or trust a privately issued digital dollar token outside the banking system. If they succeed, the argument for businesses to route dollar liquidity through stablecoin rails instead of banks gets meaningfully weaker.
Why Citi and DBS Specifically Were Positioned to Move First
Neither bank arrived at this milestone from a standing start. Citi has been building toward always-on dollar settlement for years – its Token Services platform already processes roughly $1 billion in transactions weekly, and the bank integrated that platform with its 24/7 USD Clearing network (which connects over 250 banks across more than 40 markets) back in September 2025, specifically to enable round-the-clock multibank payments for institutional clients. DBS launched its own Token Services platform in 2024. The weekend settlement, in other words, wasn’t a leap into unfamiliar territory for either institution – it was the convergence of parallel infrastructure investments each bank had already been making independently, now connected through SWIFT’s shared ledger to work across institutions rather than just within each bank’s own client network.
That matters for judging how quickly this capability could scale beyond a pilot. The hardest part of building always-on settlement infrastructure – the internal tokenization platforms, the operational processes for managing digital deposit representations – is largely already built at both banks. What SWIFT’s ledger adds is the interoperability layer that lets that infrastructure talk to other banks’ equivalent systems, which is precisely the kind of network-effect problem SWIFT has spent decades solving for traditional payment messaging.
What to Watch Between Now and December
The proof-of-concept phase runs through the end of 2026, and a few things will determine whether this becomes genuine infrastructure rather than an impressive but contained pilot. Transaction volumes and values need to scale – neither the DBS-Citi transaction nor Citi’s FAB and OCBC transactions have disclosed dollar amounts, which is typical for early pilot activity but will need to change before anyone can assess real commercial traction. The list of participating banks and currencies will likely keep expanding; a dollar-only, 30-bank pilot is meaningfully different from a multi-currency system spanning the hundreds of institutions SWIFT’s existing messaging network already reaches. And regulators, particularly in jurisdictions like the U.S. and Singapore that have been relatively open to institutional blockchain experimentation, will be watching closely for how this framework handles the eventual transition from controlled pilot to commercial availability – including questions about liability, dispute resolution, and cross-border regulatory coordination that a live production system will need to answer in ways a pilot doesn’t.
Conclusion
A single weekend payment between Singapore and New York won’t by itself change how global finance works. But it’s a genuinely useful signal of where the largest, most conservative institutions in banking believe the industry is heading – and how seriously they’re taking the competitive threat posed by crypto-native alternatives that have already proven people want money that moves on their schedule, not the bank’s. SWIFT spent fifty years making sure every bank on earth could talk to every other bank. What DBS and Citi just demonstrated is that the same institution is now racing to make sure those banks can also move money to each other on a Saturday – and that race exists because, for the first time in SWIFT’s history, waiting until Monday is no longer something the market is willing to accept as simply how banking works.
This post The Weekend Bank Transfer Just Happened. That’s the Whole Point. first appeared on BitcoinWorld.
For most of banking history, “the weekend” has functioned as an invisible tax on global commerce – not a fee anyone sees on a statement, but a real cost paid in idle capital, delayed shipments, and treasurers staring at a screen on a Friday afternoon wondering whether a payment will clear before Monday morning or sit frozen until the following week. On September 5, DBS and Citi quietly made that tax a little less inevitable, moving U.S. dollars between Singapore and New York on a Saturday, settled in minutes, through a system that didn’t exist eighteen months ago.
It’s a small transaction by dollar volume – neither bank has disclosed the amount – but it’s a meaningful marker of something bigger happening beneath the surface of global finance: the institution that has run the plumbing of international banking for half a century is rebuilding that plumbing on blockchain rails, and doing it specifically because it has no other choice.
Why Weekends Are a Real Problem, Not a Minor Inconvenience
It’s worth being concrete about what “up to two business days” actually costs a business. A company moving dollars from Singapore to the U.S. that misses Friday’s processing window doesn’t just wait a couple of extra days out of mild annoyance – it means working capital sits frozen precisely when a company might need it most: to fund a supplier payment, cover a payroll run, or capture a time-sensitive trading opportunity. For businesses that operate genuinely around the clock – e-commerce platforms, digital services, anything with customers and suppliers spread across time zones that don’t share a business calendar – the traditional correspondent banking system’s adherence to Monday-through-Friday, 9-to-5 local hours has always been a mismatch between how banks work and how modern commerce actually runs.
DBS has pointed to a specific number that frames why this matters at scale: Asia’s outbound cross-border payments are projected to reach $24 trillion by 2033. Even a modest percentage of that volume moving to genuinely real-time settlement represents an enormous unlock of capital efficiency – money that currently sits idle in transit becoming money that’s actually working.
What Actually Happened, Technically
The transaction ran on something called the Swift Digital Ledger – a blockchain-based settlement layer that SWIFT, the messaging cooperative that effectively every bank on earth relies on to communicate payment instructions, built in partnership with blockchain infrastructure firm ConsenSys on Linea, an Ethereum layer-2 network. The design is deliberately conservative in one important respect: it doesn’t replace the existing banking system’s final settlement infrastructure. Instead, it uses shared blockchain infrastructure to record and validate “tokenized deposits” – essentially, digital representations of ordinary commercial bank money that stays on each bank’s own balance sheet – allowing payment commitments to move and settle continuously, including overnight and on weekends, before final settlement squares up through conventional real-time gross settlement systems once normal banking hours resume.
That architecture matters more than it might sound. SWIFT isn’t building a cryptocurrency, and it isn’t asking banks to hold anything resembling a stablecoin. It’s using blockchain as a coordination and settlement-recording layer while keeping the underlying money itself inside the regulated banking system – a hybrid approach clearly designed to capture the speed benefits of blockchain rails without asking banks or regulators to accept the custody and reserve-backing questions that come with actual crypto-asset exposure.
This Is Part of a Bigger, Faster-Moving Pilot Than the Single Transaction Suggests
The DBS-Citi transaction wasn’t an isolated experiment – it’s one data point in a rapidly expanding proof-of-concept that SWIFT launched with more than 30 major banks after unveiling the ledger project in September 2025. The pilot, running as a controlled program from July through December 2026, already has real transaction history behind it: HSBC and Standard Chartered completed the first live interbank transfer on the ledger, and just three days before the DBS-Citi weekend transaction, Citi itself went live with First Abu Dhabi Bank and OCBC in Singapore – extending the network’s live footprint into the Middle East and Southeast Asia within the same week. UOB is reportedly expected to run equivalent transactions with Citi later in September as well.
That pace is worth sitting with. In the space of roughly a week, this pilot moved from a single interbank proof point to live transactions spanning three continents and, with the DBS-Citi settlement, an entirely new capability – weekend processing – that none of the earlier transactions reportedly demonstrated. Pilots that move that quickly from region to region and capability to capability tend to be signaling something about institutional appetite, not just technical readiness: the participating banks clearly want this infrastructure working and are pushing to demonstrate breadth quickly, likely with an eye toward what comes after the pilot period ends in December.
The Part of the Story That’s Really About Stablecoins
It would be a mistake to read this purely as a banking-efficiency story without acknowledging the competitive pressure driving it. SWIFT’s blockchain ledger project has been explicitly framed, including by SWIFT itself, as a response to the growing traction of stablecoins and crypto-native payment rails – a category that has spent the last several years demonstrating exactly the kind of always-on, borderless settlement that traditional correspondent banking has structurally struggled to match. Stablecoins already move dollar-denominated value around the clock, across borders, without waiting for a New York clearing window to open on Monday morning. That’s a real threat to SWIFT’s core relevance: if businesses and even banks themselves find it easier to settle in USDT or USDC than to wait on traditional correspondent banking rails, the decades of institutional lock-in that make SWIFT indispensable start to erode.
Seen that way, the DBS-Citi weekend transaction isn’t just a technical milestone – it’s a competitive countermove. SWIFT and its 30-plus bank partners are essentially racing to prove that the regulated banking system can deliver the always-on settlement experience that stablecoins offer, without requiring anyone to actually hold or trust a privately issued digital dollar token outside the banking system. If they succeed, the argument for businesses to route dollar liquidity through stablecoin rails instead of banks gets meaningfully weaker.
Why Citi and DBS Specifically Were Positioned to Move First
Neither bank arrived at this milestone from a standing start. Citi has been building toward always-on dollar settlement for years – its Token Services platform already processes roughly $1 billion in transactions weekly, and the bank integrated that platform with its 24/7 USD Clearing network (which connects over 250 banks across more than 40 markets) back in September 2025, specifically to enable round-the-clock multibank payments for institutional clients. DBS launched its own Token Services platform in 2024. The weekend settlement, in other words, wasn’t a leap into unfamiliar territory for either institution – it was the convergence of parallel infrastructure investments each bank had already been making independently, now connected through SWIFT’s shared ledger to work across institutions rather than just within each bank’s own client network.
That matters for judging how quickly this capability could scale beyond a pilot. The hardest part of building always-on settlement infrastructure – the internal tokenization platforms, the operational processes for managing digital deposit representations – is largely already built at both banks. What SWIFT’s ledger adds is the interoperability layer that lets that infrastructure talk to other banks’ equivalent systems, which is precisely the kind of network-effect problem SWIFT has spent decades solving for traditional payment messaging.
What to Watch Between Now and December
The proof-of-concept phase runs through the end of 2026, and a few things will determine whether this becomes genuine infrastructure rather than an impressive but contained pilot. Transaction volumes and values need to scale – neither the DBS-Citi transaction nor Citi’s FAB and OCBC transactions have disclosed dollar amounts, which is typical for early pilot activity but will need to change before anyone can assess real commercial traction. The list of participating banks and currencies will likely keep expanding; a dollar-only, 30-bank pilot is meaningfully different from a multi-currency system spanning the hundreds of institutions SWIFT’s existing messaging network already reaches. And regulators, particularly in jurisdictions like the U.S. and Singapore that have been relatively open to institutional blockchain experimentation, will be watching closely for how this framework handles the eventual transition from controlled pilot to commercial availability – including questions about liability, dispute resolution, and cross-border regulatory coordination that a live production system will need to answer in ways a pilot doesn’t.
Conclusion
A single weekend payment between Singapore and New York won’t by itself change how global finance works. But it’s a genuinely useful signal of where the largest, most conservative institutions in banking believe the industry is heading – and how seriously they’re taking the competitive threat posed by crypto-native alternatives that have already proven people want money that moves on their schedule, not the bank’s. SWIFT spent fifty years making sure every bank on earth could talk to every other bank. What DBS and Citi just demonstrated is that the same institution is now racing to make sure those banks can also move money to each other on a Saturday – and that race exists because, for the first time in SWIFT’s history, waiting until Monday is no longer something the market is willing to accept as simply how banking works.
This post The Weekend Bank Transfer Just Happened. That’s the Whole Point. first appeared on BitcoinWorld.
217
·
--

Article
Same Country, Two Rulebooks: Why Korean Crypto Exchanges Can’t Compete on Marketing the Way Broke...BitcoinWorldSame Country, Two Rulebooks: Why Korean Crypto Exchanges Can’t Compete on Marketing the Way Brokerages Can
Ask a Korean securities firm to run a promotion and the playbook is well-worn: cash bonuses for opening a non-face-to-face account, discounted trading fees for a limited window, referral incentives that get customers to bring in friends. Ask a Korean crypto exchange to do the same thing, and the process looks nothing alike – pre-clearance of the advertising itself, internal controls specifically governing how economic benefits are offered, and mandatory advance disclosure once a perk crosses a certain value threshold. Same country, same regulator overseeing both industries in different capacities, two fundamentally different sets of rules for what looks, on the surface, like the same basic business activity: getting customers in the door.
That gap is now drawing genuine fairness scrutiny, and it’s worth understanding both why the asymmetry exists and why simply calling it “unfair” oversimplifies a more complicated regulatory story.
The Asymmetry Isn’t an Oversight – It’s a Product of Timing and Trauma
Korea’s securities industry has operated under the Capital Markets Act framework for decades, built up through incremental regulation, court rulings, and industry self-regulation that has had time to settle into a stable, well-understood equilibrium. Crypto exchanges, by contrast, only came under a comprehensive statutory framework with the Virtual Asset User Protection Act, which took full effect in July 2024 – barely two years old as a regulatory regime, and built explicitly in the shadow of a string of domestic and international failures: the Terra-Luna collapse, FTX’s implosion, and a steady drumbeat of exchange hacks and insider-trading scandals that made Korean regulators acutely sensitive to anything resembling customer manipulation or unfair inducement.
That context matters for understanding why the rules landed where they did. Securities promotion rules evolved in an environment where the core product – regulated securities, cleared through established exchanges with decades of market-structure safeguards – was treated as a known quantity. Crypto promotion rules were written into a framework explicitly designed to prevent a repeat of scenarios where exchanges used aggressive incentives, questionable token listings, or opaque fee structures to lure retail investors into products regulators still didn’t fully trust to behave predictably. The stricter promotional controls aren’t an accident of drafting – they’re a direct response to a genuinely different recent track record.
What the Rules Actually Require, and Why They Bite Harder Than They Look
The specific mechanisms cited – prior advertising review, internal controls on economic benefits, advance disclosure above a certain threshold – sound like ordinary compliance boilerplate until you consider what they mean operationally for a marketing team trying to compete for customers in real time. A securities firm that wants to run a same-day cash promotion tied to a market event can generally do so within its existing compliance framework. A crypto exchange wanting to run an equivalent promotion has to build in lead time for review, structure the offer to satisfy internal control requirements around what counts as an “economic benefit,” and potentially disclose the promotion’s terms and scale in advance – all of which slows down exactly the kind of fast-moving, opportunistic marketing that tends to be most effective at acquiring new users in a competitive market.
This isn’t a minor administrative inconvenience. Customer acquisition in retail finance is often won or lost on speed and simplicity – being able to react to a competitor’s promotion, a market rally, or a cultural moment within days rather than weeks. A compliance process built around prior review and advance disclosure structurally advantages incumbents who already have large user bases and reduces the ability of smaller or newer exchanges to compete aggressively for market share through promotional spending, the same lever securities firms use routinely.
The Fairness Argument Has Real Teeth – But So Does the Counterargument
The case for narrowing this gap is straightforward: if regulators consider crypto exchanges legitimate, licensed financial businesses – which the Virtual Asset User Protection Act’s very existence implies – then subjecting them to meaningfully stricter promotional constraints than functionally similar financial intermediaries starts to look less like prudent risk management and more like an unstated policy preference for keeping the crypto industry smaller and slower-growing than it might otherwise be. Exchange operators can reasonably ask why a cash bonus for opening an account should trigger fundamentally different scrutiny depending on whether the account holds equities or Bitcoin, especially as Korea’s own policy direction – corporate crypto access, tokenized securities, an eventual spot ETF pathway – increasingly treats digital assets as a mainstream, integrated part of the financial system rather than a separate, quarantined category.
But the counterargument isn’t trivial either. Securities products, for all their complexity, trade on regulated exchanges with market-maker obligations, established price-discovery mechanisms, and decades of investor-protection case law. Crypto markets, even in Korea’s relatively mature regulatory environment, still exhibit more extreme volatility, thinner liquidity in smaller-cap tokens, and a shorter history of enforcement precedent for what constitutes manipulative promotional practice. Regulators weighing whether to relax crypto promotion rules to match securities rules have to weigh that against a genuine question: does the underlying market structure actually support the same light-touch promotional environment, or would loosening the rules simply recreate the aggressive, incentive-driven customer acquisition dynamics that contributed to past blowups in crypto markets specifically?
Why This Debate Is Surfacing Now, Not Two Years Ago
The timing here isn’t incidental. This fairness argument is gaining traction precisely as South Korea has spent much of 2025 and 2026 systematically dismantling other barriers between crypto and traditional finance – lifting the nine-year ban on corporate crypto investment, opening a legal pathway for tokenized securities, moving toward spot crypto ETFs, and discussing a formal market-making regime for digital assets to bring crypto trading structure closer in line with equity markets. Each of those moves has implicitly argued that crypto deserves treatment increasingly comparable to traditional securities. Once that principle is established in one area, it becomes harder to justify leaving promotional rules as a conspicuous exception – which is likely exactly the inconsistency industry voices are now pointing to.
There’s also a structural piece still hanging over this entire conversation: Korea’s broader Digital Asset Basic Act, meant to establish a comprehensive framework covering everything from market structure to promotional conduct, has faced repeated delays. Promotional rules currently sit within the narrower Virtual Asset User Protection Act, drafted quickly in a post-collapse environment focused primarily on custody safety and fraud prevention – not necessarily optimized for the competitive marketing questions the industry is raising now. A more comprehensive framework, if and when it arrives, would be a natural moment to actually reconcile this gap rather than patch it piecemeal.
What a Fix Would Actually Look Like
If regulators do move to narrow this gap, the more likely path isn’t a wholesale deregulation of crypto promotions to match securities rules outright – that would be a hard sell given the industry’s more recent history of blowups. A more plausible middle path would tier promotional requirements to the specific product or exchange risk profile: lighter review processes for well-established assets on regulated exchanges with strong track records, continued heavier scrutiny for newer or smaller-cap tokens where manipulation risk remains genuinely higher. That kind of graduated approach would let regulators address the fairness complaint without abandoning the investor-protection rationale that justified the stricter rules in the first place.
It’s also worth watching whether South Korea’s self-regulatory exchange body, which coordinates standards across the major domestic platforms, plays a role here – industry-led standards bodies have historically been where Korean crypto policy gets pre-negotiated before formal rulemaking catches up, and a coordinated industry position could accelerate whatever regulatory response eventually emerges.
Conclusion
The gap between how securities firms and crypto exchanges can market to customers isn’t an arbitrary inconsistency – it’s a direct legacy of when each rulebook was written and what crisis, if any, prompted it. But legacies don’t automatically stay justified forever, especially as Korea’s broader policy direction keeps treating crypto as an increasingly normal part of the regulated financial system in every other respect. Whether this fairness debate results in real change will likely come down to whether regulators believe crypto markets have matured enough operationally to handle the same promotional freedom securities firms enjoy – or whether the industry’s more turbulent recent history still justifies keeping the leash shorter, even as everything else about how crypto is regulated in Korea continues to converge with traditional finance.
This post Same Country, Two Rulebooks: Why Korean Crypto Exchanges Can’t Compete on Marketing the Way Brokerages Can first appeared on BitcoinWorld.
Same Country, Two Rulebooks: Why Korean Crypto Exchanges Can’t Compete on Marketing the Way Broke...
BitcoinWorldSame Country, Two Rulebooks: Why Korean Crypto Exchanges Can’t Compete on Marketing the Way Brokerages Can
Ask a Korean securities firm to run a promotion and the playbook is well-worn: cash bonuses for opening a non-face-to-face account, discounted trading fees for a limited window, referral incentives that get customers to bring in friends. Ask a Korean crypto exchange to do the same thing, and the process looks nothing alike – pre-clearance of the advertising itself, internal controls specifically governing how economic benefits are offered, and mandatory advance disclosure once a perk crosses a certain value threshold. Same country, same regulator overseeing both industries in different capacities, two fundamentally different sets of rules for what looks, on the surface, like the same basic business activity: getting customers in the door.
That gap is now drawing genuine fairness scrutiny, and it’s worth understanding both why the asymmetry exists and why simply calling it “unfair” oversimplifies a more complicated regulatory story.
The Asymmetry Isn’t an Oversight – It’s a Product of Timing and Trauma
Korea’s securities industry has operated under the Capital Markets Act framework for decades, built up through incremental regulation, court rulings, and industry self-regulation that has had time to settle into a stable, well-understood equilibrium. Crypto exchanges, by contrast, only came under a comprehensive statutory framework with the Virtual Asset User Protection Act, which took full effect in July 2024 – barely two years old as a regulatory regime, and built explicitly in the shadow of a string of domestic and international failures: the Terra-Luna collapse, FTX’s implosion, and a steady drumbeat of exchange hacks and insider-trading scandals that made Korean regulators acutely sensitive to anything resembling customer manipulation or unfair inducement.
That context matters for understanding why the rules landed where they did. Securities promotion rules evolved in an environment where the core product – regulated securities, cleared through established exchanges with decades of market-structure safeguards – was treated as a known quantity. Crypto promotion rules were written into a framework explicitly designed to prevent a repeat of scenarios where exchanges used aggressive incentives, questionable token listings, or opaque fee structures to lure retail investors into products regulators still didn’t fully trust to behave predictably. The stricter promotional controls aren’t an accident of drafting – they’re a direct response to a genuinely different recent track record.
What the Rules Actually Require, and Why They Bite Harder Than They Look
The specific mechanisms cited – prior advertising review, internal controls on economic benefits, advance disclosure above a certain threshold – sound like ordinary compliance boilerplate until you consider what they mean operationally for a marketing team trying to compete for customers in real time. A securities firm that wants to run a same-day cash promotion tied to a market event can generally do so within its existing compliance framework. A crypto exchange wanting to run an equivalent promotion has to build in lead time for review, structure the offer to satisfy internal control requirements around what counts as an “economic benefit,” and potentially disclose the promotion’s terms and scale in advance – all of which slows down exactly the kind of fast-moving, opportunistic marketing that tends to be most effective at acquiring new users in a competitive market.
This isn’t a minor administrative inconvenience. Customer acquisition in retail finance is often won or lost on speed and simplicity – being able to react to a competitor’s promotion, a market rally, or a cultural moment within days rather than weeks. A compliance process built around prior review and advance disclosure structurally advantages incumbents who already have large user bases and reduces the ability of smaller or newer exchanges to compete aggressively for market share through promotional spending, the same lever securities firms use routinely.
The Fairness Argument Has Real Teeth – But So Does the Counterargument
The case for narrowing this gap is straightforward: if regulators consider crypto exchanges legitimate, licensed financial businesses – which the Virtual Asset User Protection Act’s very existence implies – then subjecting them to meaningfully stricter promotional constraints than functionally similar financial intermediaries starts to look less like prudent risk management and more like an unstated policy preference for keeping the crypto industry smaller and slower-growing than it might otherwise be. Exchange operators can reasonably ask why a cash bonus for opening an account should trigger fundamentally different scrutiny depending on whether the account holds equities or Bitcoin, especially as Korea’s own policy direction – corporate crypto access, tokenized securities, an eventual spot ETF pathway – increasingly treats digital assets as a mainstream, integrated part of the financial system rather than a separate, quarantined category.
But the counterargument isn’t trivial either. Securities products, for all their complexity, trade on regulated exchanges with market-maker obligations, established price-discovery mechanisms, and decades of investor-protection case law. Crypto markets, even in Korea’s relatively mature regulatory environment, still exhibit more extreme volatility, thinner liquidity in smaller-cap tokens, and a shorter history of enforcement precedent for what constitutes manipulative promotional practice. Regulators weighing whether to relax crypto promotion rules to match securities rules have to weigh that against a genuine question: does the underlying market structure actually support the same light-touch promotional environment, or would loosening the rules simply recreate the aggressive, incentive-driven customer acquisition dynamics that contributed to past blowups in crypto markets specifically?
Why This Debate Is Surfacing Now, Not Two Years Ago
The timing here isn’t incidental. This fairness argument is gaining traction precisely as South Korea has spent much of 2025 and 2026 systematically dismantling other barriers between crypto and traditional finance – lifting the nine-year ban on corporate crypto investment, opening a legal pathway for tokenized securities, moving toward spot crypto ETFs, and discussing a formal market-making regime for digital assets to bring crypto trading structure closer in line with equity markets. Each of those moves has implicitly argued that crypto deserves treatment increasingly comparable to traditional securities. Once that principle is established in one area, it becomes harder to justify leaving promotional rules as a conspicuous exception – which is likely exactly the inconsistency industry voices are now pointing to.
There’s also a structural piece still hanging over this entire conversation: Korea’s broader Digital Asset Basic Act, meant to establish a comprehensive framework covering everything from market structure to promotional conduct, has faced repeated delays. Promotional rules currently sit within the narrower Virtual Asset User Protection Act, drafted quickly in a post-collapse environment focused primarily on custody safety and fraud prevention – not necessarily optimized for the competitive marketing questions the industry is raising now. A more comprehensive framework, if and when it arrives, would be a natural moment to actually reconcile this gap rather than patch it piecemeal.
What a Fix Would Actually Look Like
If regulators do move to narrow this gap, the more likely path isn’t a wholesale deregulation of crypto promotions to match securities rules outright – that would be a hard sell given the industry’s more recent history of blowups. A more plausible middle path would tier promotional requirements to the specific product or exchange risk profile: lighter review processes for well-established assets on regulated exchanges with strong track records, continued heavier scrutiny for newer or smaller-cap tokens where manipulation risk remains genuinely higher. That kind of graduated approach would let regulators address the fairness complaint without abandoning the investor-protection rationale that justified the stricter rules in the first place.
It’s also worth watching whether South Korea’s self-regulatory exchange body, which coordinates standards across the major domestic platforms, plays a role here – industry-led standards bodies have historically been where Korean crypto policy gets pre-negotiated before formal rulemaking catches up, and a coordinated industry position could accelerate whatever regulatory response eventually emerges.
Conclusion
The gap between how securities firms and crypto exchanges can market to customers isn’t an arbitrary inconsistency – it’s a direct legacy of when each rulebook was written and what crisis, if any, prompted it. But legacies don’t automatically stay justified forever, especially as Korea’s broader policy direction keeps treating crypto as an increasingly normal part of the regulated financial system in every other respect. Whether this fairness debate results in real change will likely come down to whether regulators believe crypto markets have matured enough operationally to handle the same promotional freedom securities firms enjoy – or whether the industry’s more turbulent recent history still justifies keeping the leash shorter, even as everything else about how crypto is regulated in Korea continues to converge with traditional finance.
This post Same Country, Two Rulebooks: Why Korean Crypto Exchanges Can’t Compete on Marketing the Way Brokerages Can first appeared on BitcoinWorld.
Ask a Korean securities firm to run a promotion and the playbook is well-worn: cash bonuses for opening a non-face-to-face account, discounted trading fees for a limited window, referral incentives that get customers to bring in friends. Ask a Korean crypto exchange to do the same thing, and the process looks nothing alike – pre-clearance of the advertising itself, internal controls specifically governing how economic benefits are offered, and mandatory advance disclosure once a perk crosses a certain value threshold. Same country, same regulator overseeing both industries in different capacities, two fundamentally different sets of rules for what looks, on the surface, like the same basic business activity: getting customers in the door.
That gap is now drawing genuine fairness scrutiny, and it’s worth understanding both why the asymmetry exists and why simply calling it “unfair” oversimplifies a more complicated regulatory story.
The Asymmetry Isn’t an Oversight – It’s a Product of Timing and Trauma
Korea’s securities industry has operated under the Capital Markets Act framework for decades, built up through incremental regulation, court rulings, and industry self-regulation that has had time to settle into a stable, well-understood equilibrium. Crypto exchanges, by contrast, only came under a comprehensive statutory framework with the Virtual Asset User Protection Act, which took full effect in July 2024 – barely two years old as a regulatory regime, and built explicitly in the shadow of a string of domestic and international failures: the Terra-Luna collapse, FTX’s implosion, and a steady drumbeat of exchange hacks and insider-trading scandals that made Korean regulators acutely sensitive to anything resembling customer manipulation or unfair inducement.
That context matters for understanding why the rules landed where they did. Securities promotion rules evolved in an environment where the core product – regulated securities, cleared through established exchanges with decades of market-structure safeguards – was treated as a known quantity. Crypto promotion rules were written into a framework explicitly designed to prevent a repeat of scenarios where exchanges used aggressive incentives, questionable token listings, or opaque fee structures to lure retail investors into products regulators still didn’t fully trust to behave predictably. The stricter promotional controls aren’t an accident of drafting – they’re a direct response to a genuinely different recent track record.
What the Rules Actually Require, and Why They Bite Harder Than They Look
The specific mechanisms cited – prior advertising review, internal controls on economic benefits, advance disclosure above a certain threshold – sound like ordinary compliance boilerplate until you consider what they mean operationally for a marketing team trying to compete for customers in real time. A securities firm that wants to run a same-day cash promotion tied to a market event can generally do so within its existing compliance framework. A crypto exchange wanting to run an equivalent promotion has to build in lead time for review, structure the offer to satisfy internal control requirements around what counts as an “economic benefit,” and potentially disclose the promotion’s terms and scale in advance – all of which slows down exactly the kind of fast-moving, opportunistic marketing that tends to be most effective at acquiring new users in a competitive market.
This isn’t a minor administrative inconvenience. Customer acquisition in retail finance is often won or lost on speed and simplicity – being able to react to a competitor’s promotion, a market rally, or a cultural moment within days rather than weeks. A compliance process built around prior review and advance disclosure structurally advantages incumbents who already have large user bases and reduces the ability of smaller or newer exchanges to compete aggressively for market share through promotional spending, the same lever securities firms use routinely.
The Fairness Argument Has Real Teeth – But So Does the Counterargument
The case for narrowing this gap is straightforward: if regulators consider crypto exchanges legitimate, licensed financial businesses – which the Virtual Asset User Protection Act’s very existence implies – then subjecting them to meaningfully stricter promotional constraints than functionally similar financial intermediaries starts to look less like prudent risk management and more like an unstated policy preference for keeping the crypto industry smaller and slower-growing than it might otherwise be. Exchange operators can reasonably ask why a cash bonus for opening an account should trigger fundamentally different scrutiny depending on whether the account holds equities or Bitcoin, especially as Korea’s own policy direction – corporate crypto access, tokenized securities, an eventual spot ETF pathway – increasingly treats digital assets as a mainstream, integrated part of the financial system rather than a separate, quarantined category.
But the counterargument isn’t trivial either. Securities products, for all their complexity, trade on regulated exchanges with market-maker obligations, established price-discovery mechanisms, and decades of investor-protection case law. Crypto markets, even in Korea’s relatively mature regulatory environment, still exhibit more extreme volatility, thinner liquidity in smaller-cap tokens, and a shorter history of enforcement precedent for what constitutes manipulative promotional practice. Regulators weighing whether to relax crypto promotion rules to match securities rules have to weigh that against a genuine question: does the underlying market structure actually support the same light-touch promotional environment, or would loosening the rules simply recreate the aggressive, incentive-driven customer acquisition dynamics that contributed to past blowups in crypto markets specifically?
Why This Debate Is Surfacing Now, Not Two Years Ago
The timing here isn’t incidental. This fairness argument is gaining traction precisely as South Korea has spent much of 2025 and 2026 systematically dismantling other barriers between crypto and traditional finance – lifting the nine-year ban on corporate crypto investment, opening a legal pathway for tokenized securities, moving toward spot crypto ETFs, and discussing a formal market-making regime for digital assets to bring crypto trading structure closer in line with equity markets. Each of those moves has implicitly argued that crypto deserves treatment increasingly comparable to traditional securities. Once that principle is established in one area, it becomes harder to justify leaving promotional rules as a conspicuous exception – which is likely exactly the inconsistency industry voices are now pointing to.
There’s also a structural piece still hanging over this entire conversation: Korea’s broader Digital Asset Basic Act, meant to establish a comprehensive framework covering everything from market structure to promotional conduct, has faced repeated delays. Promotional rules currently sit within the narrower Virtual Asset User Protection Act, drafted quickly in a post-collapse environment focused primarily on custody safety and fraud prevention – not necessarily optimized for the competitive marketing questions the industry is raising now. A more comprehensive framework, if and when it arrives, would be a natural moment to actually reconcile this gap rather than patch it piecemeal.
What a Fix Would Actually Look Like
If regulators do move to narrow this gap, the more likely path isn’t a wholesale deregulation of crypto promotions to match securities rules outright – that would be a hard sell given the industry’s more recent history of blowups. A more plausible middle path would tier promotional requirements to the specific product or exchange risk profile: lighter review processes for well-established assets on regulated exchanges with strong track records, continued heavier scrutiny for newer or smaller-cap tokens where manipulation risk remains genuinely higher. That kind of graduated approach would let regulators address the fairness complaint without abandoning the investor-protection rationale that justified the stricter rules in the first place.
It’s also worth watching whether South Korea’s self-regulatory exchange body, which coordinates standards across the major domestic platforms, plays a role here – industry-led standards bodies have historically been where Korean crypto policy gets pre-negotiated before formal rulemaking catches up, and a coordinated industry position could accelerate whatever regulatory response eventually emerges.
Conclusion
The gap between how securities firms and crypto exchanges can market to customers isn’t an arbitrary inconsistency – it’s a direct legacy of when each rulebook was written and what crisis, if any, prompted it. But legacies don’t automatically stay justified forever, especially as Korea’s broader policy direction keeps treating crypto as an increasingly normal part of the regulated financial system in every other respect. Whether this fairness debate results in real change will likely come down to whether regulators believe crypto markets have matured enough operationally to handle the same promotional freedom securities firms enjoy – or whether the industry’s more turbulent recent history still justifies keeping the leash shorter, even as everything else about how crypto is regulated in Korea continues to converge with traditional finance.
This post Same Country, Two Rulebooks: Why Korean Crypto Exchanges Can’t Compete on Marketing the Way Brokerages Can first appeared on BitcoinWorld.
73
·
--

Article
The Slow Death of “Risk-Free”: Why Wall Street’s Bitcoin Bulls Have Stopped Talking About PriceBitcoinWorldThe Slow Death of “Risk-Free”: Why Wall Street’s Bitcoin Bulls Have Stopped Talking About Price
For most of Bitcoin’s history, the loudest arguments in its favor were about price – how high it could go, how many multiples of gold it could capture, how early you still were. What’s changed in the last year, and what surfaced again this weekend in comments from Bitwise CEO Hunter Horsley, is that the more interesting argument coming out of crypto’s institutional wing isn’t about price appreciation at all. It’s about what happens to the asset that’s supposed to have no risk in the first place: the U.S. Treasury bond.
Horsley’s prediction – that capital will migrate out of Treasuries and into Bitcoin and gold over the next decade – landed alongside a related, more provocative claim from Bitcoin commentator Fred Krueger, who argued China could fully exit its Treasury holdings within seven years and replace them with gold. Taken together, the two statements aren’t really a crypto story. They’re a story about what happens when the safest asset in the global financial system stops being treated as safe.
Horsley Has Been Building This Argument for a Year
This isn’t a one-off hot take. Horsley has spent much of the past year publicly reframing what Bitcoin actually competes with. Back in June, he argued that Bitcoin’s real rival wasn’t gold – both, he said, function as apolitical stores of value that sit outside any government’s direct control – but rather sovereign debt instruments like U.S. Treasuries and UK gilts, which he called “the ultimate political stores of value” precisely because their worth is tied to the fiscal and monetary decisions of the governments that issue them. Around the same time, he pointed out that Bitcoin’s opportunity isn’t limited to challenging gold’s roughly $16 trillion market; it’s challenging the far larger, $30 trillion-plus Treasury market that has traditionally been the default parking spot for capital seeking safety.
That distinction matters more than it might first appear. Gold and Bitcoin, in Horsley’s framing, are assets nobody can print more of or default on. Treasuries are promises – backed by a government’s ability and willingness to tax, borrow, and pay. When confidence in that promise wavers, even slightly, the entire logic of holding a “risk-free” asset at scale starts to erode. And confidence has been wavering. Rising deficits, an expanding federal debt load, and questions about long-term fiscal discipline have all fed a narrative – one Horsley is far from alone in pushing – that the traditional 60/40 portfolio model, built for four decades of falling interest rates, wasn’t designed for an era of sustained fiscal expansion and currency debasement concerns.
The China Variable Makes This Concrete, Not Theoretical
Krueger’s claim about China dumping its Treasury holdings entirely over seven years sounds extreme in isolation, but it’s an extrapolation of a trend that’s already well documented, not a hypothetical. China’s Treasury holdings have fallen substantially over the past several years – from roughly $1.1 trillion in 2021 to a fraction of that today – while its central bank has been steadily adding to its gold reserves. Chinese officials and analysts have been fairly explicit about the strategic logic: after watching the U.S. and its allies freeze Russian dollar-denominated reserves following the invasion of Ukraine, Beijing has treated large-scale dollar exposure as a geopolitical vulnerability rather than just a financial position. Diversifying into gold, an asset that can’t be frozen by a foreign government’s sanctions regime, is a hedge against exactly that kind of exposure.
What Krueger adds to the picture is an endpoint and a timeline – full exit within seven years – which is a much stronger claim than “continued gradual diversification.” Whether or not the specific timeline proves accurate, the direction of travel lines up with a broader de-dollarization theme that central banks well beyond China have been quietly acting on, with global gold purchases by sovereign buyers running at historically elevated levels for several years running.
Why This Matters Beyond Crypto Twitter
It’s tempting to file this under the usual genre of crypto executives talking their own book – Horsley runs a firm that manages Bitcoin ETFs, so of course he wants people to believe capital is rotating into the asset his products are built around. That skepticism is fair and worth keeping in mind. But the underlying macro question he’s pointing at is one that mainstream fixed-income strategists have been asking with increasing seriousness, independent of any crypto angle: who actually buys the next several trillion dollars of U.S. debt, at what yield, if the traditional buyer base – foreign central banks, in particular – keeps shrinking?
That’s not an abstract question. The Treasury market is the deepest, most liquid market in the world, and it’s the benchmark against which nearly every other asset gets priced, from mortgage rates to corporate borrowing costs. If a meaningful share of the historical buyer base – sovereign wealth funds, foreign central banks, even domestic pension allocators reconsidering their duration exposure – genuinely begins rotating a portion of reserves into non-sovereign stores of value, the effect isn’t limited to Bitcoin’s price chart. It shows up in Treasury yields, in the cost of financing the federal deficit, and eventually in the interest rate every borrower in the economy pays.
The Counterargument Nobody on Crypto Twitter Likes to Engage With
It’s worth being honest about the size mismatch here. The Treasury market is measured in the tens of trillions of dollars. Bitcoin’s total market capitalization, even after years of institutional inflows and ETF adoption, remains a small fraction of that. For Bitcoin to meaningfully “absorb” Treasury outflows at any scale, either its price would need to rise dramatically to accommodate new capital without becoming even more concentrated in a handful of large holders, or the rotation would need to happen gradually enough that liquidity and volatility concerns don’t overwhelm the thesis before it plays out. Gold, for all the recent enthusiasm, faces its own supply constraint in the opposite direction – Horsley himself has previously noted that keeping gold prices merely stable requires absorbing hundreds of billions of dollars in new mined and recycled supply every year, a very different dynamic than Bitcoin’s fixed and shrinking issuance schedule.
There’s also a structural reason large, risk-averse institutional allocators – pension funds, insurance companies, central banks managing reserves for liquidity rather than appreciation – have historically favored Treasuries over volatile alternatives: predictability. Bitcoin’s price swings, even after years of maturation, remain far larger than anything in the sovereign debt market. A decade-long rotation thesis has to account for whether the institutions actually capable of moving trillions of dollars are willing to underwrite that volatility, or whether the shift Horsley describes ends up concentrated among a narrower set of more risk-tolerant allocators – sovereign wealth funds, corporate treasuries, and crypto-native asset managers – rather than the broad base of capital that currently anchors the Treasury market.
What to Actually Watch Over the Next Few Years
If this thesis is going to show up anywhere first, it won’t be in Bitcoin’s spot price – that’s too noisy and too influenced by short-term speculation to be a reliable signal. The more useful indicators are structural: continued data on foreign central bank Treasury holdings, particularly China’s, released monthly by the U.S. Treasury Department; the pace of central bank gold purchases globally, which the World Gold Council tracks and reports quarterly; and, on the Bitcoin side, whether institutional allocation continues shifting from short-term trading vehicles toward long-duration holding structures, corporate treasury allocations, and sovereign wealth fund positions – the kind of “sticky” capital that would actually indicate a genuine store-of-value rotation rather than speculative flow.
Congressional action matters here too, in a way that connects to the broader crypto policy conversation playing out in Washington right now. A clearer U.S. regulatory framework for digital assets would remove one of the larger institutional hesitations around allocating meaningfully to Bitcoin, potentially accelerating exactly the kind of rotation Horsley is describing – while continued regulatory ambiguity would likely keep the most risk-averse pools of capital on the sidelines regardless of how compelling the macro argument sounds.
Conclusion
Strip away the specific numbers and timelines, which are inherently speculative a decade out, and what Horsley and Krueger are really describing is a crisis of confidence in the idea that any single government’s debt can serve as the world’s default safe asset indefinitely. That’s a much bigger claim than “Bitcoin will go up,” and it’s one worth evaluating on its own terms rather than dismissing as promotional noise from people who profit if it’s true. Whether the destination for that lost confidence ends up being Bitcoin, gold, some combination of the two, or something not yet built, the more durable story here isn’t about which asset wins. It’s about how much longer the world can treat U.S. sovereign debt as risk-free while the fiscal picture backing that promise keeps getting harder to ignore.
This post The Slow Death of “Risk-Free”: Why Wall Street’s Bitcoin Bulls Have Stopped Talking About Price first appeared on BitcoinWorld.
The Slow Death of “Risk-Free”: Why Wall Street’s Bitcoin Bulls Have Stopped Talking About Price
BitcoinWorldThe Slow Death of “Risk-Free”: Why Wall Street’s Bitcoin Bulls Have Stopped Talking About Price
For most of Bitcoin’s history, the loudest arguments in its favor were about price – how high it could go, how many multiples of gold it could capture, how early you still were. What’s changed in the last year, and what surfaced again this weekend in comments from Bitwise CEO Hunter Horsley, is that the more interesting argument coming out of crypto’s institutional wing isn’t about price appreciation at all. It’s about what happens to the asset that’s supposed to have no risk in the first place: the U.S. Treasury bond.
Horsley’s prediction – that capital will migrate out of Treasuries and into Bitcoin and gold over the next decade – landed alongside a related, more provocative claim from Bitcoin commentator Fred Krueger, who argued China could fully exit its Treasury holdings within seven years and replace them with gold. Taken together, the two statements aren’t really a crypto story. They’re a story about what happens when the safest asset in the global financial system stops being treated as safe.
Horsley Has Been Building This Argument for a Year
This isn’t a one-off hot take. Horsley has spent much of the past year publicly reframing what Bitcoin actually competes with. Back in June, he argued that Bitcoin’s real rival wasn’t gold – both, he said, function as apolitical stores of value that sit outside any government’s direct control – but rather sovereign debt instruments like U.S. Treasuries and UK gilts, which he called “the ultimate political stores of value” precisely because their worth is tied to the fiscal and monetary decisions of the governments that issue them. Around the same time, he pointed out that Bitcoin’s opportunity isn’t limited to challenging gold’s roughly $16 trillion market; it’s challenging the far larger, $30 trillion-plus Treasury market that has traditionally been the default parking spot for capital seeking safety.
That distinction matters more than it might first appear. Gold and Bitcoin, in Horsley’s framing, are assets nobody can print more of or default on. Treasuries are promises – backed by a government’s ability and willingness to tax, borrow, and pay. When confidence in that promise wavers, even slightly, the entire logic of holding a “risk-free” asset at scale starts to erode. And confidence has been wavering. Rising deficits, an expanding federal debt load, and questions about long-term fiscal discipline have all fed a narrative – one Horsley is far from alone in pushing – that the traditional 60/40 portfolio model, built for four decades of falling interest rates, wasn’t designed for an era of sustained fiscal expansion and currency debasement concerns.
The China Variable Makes This Concrete, Not Theoretical
Krueger’s claim about China dumping its Treasury holdings entirely over seven years sounds extreme in isolation, but it’s an extrapolation of a trend that’s already well documented, not a hypothetical. China’s Treasury holdings have fallen substantially over the past several years – from roughly $1.1 trillion in 2021 to a fraction of that today – while its central bank has been steadily adding to its gold reserves. Chinese officials and analysts have been fairly explicit about the strategic logic: after watching the U.S. and its allies freeze Russian dollar-denominated reserves following the invasion of Ukraine, Beijing has treated large-scale dollar exposure as a geopolitical vulnerability rather than just a financial position. Diversifying into gold, an asset that can’t be frozen by a foreign government’s sanctions regime, is a hedge against exactly that kind of exposure.
What Krueger adds to the picture is an endpoint and a timeline – full exit within seven years – which is a much stronger claim than “continued gradual diversification.” Whether or not the specific timeline proves accurate, the direction of travel lines up with a broader de-dollarization theme that central banks well beyond China have been quietly acting on, with global gold purchases by sovereign buyers running at historically elevated levels for several years running.
Why This Matters Beyond Crypto Twitter
It’s tempting to file this under the usual genre of crypto executives talking their own book – Horsley runs a firm that manages Bitcoin ETFs, so of course he wants people to believe capital is rotating into the asset his products are built around. That skepticism is fair and worth keeping in mind. But the underlying macro question he’s pointing at is one that mainstream fixed-income strategists have been asking with increasing seriousness, independent of any crypto angle: who actually buys the next several trillion dollars of U.S. debt, at what yield, if the traditional buyer base – foreign central banks, in particular – keeps shrinking?
That’s not an abstract question. The Treasury market is the deepest, most liquid market in the world, and it’s the benchmark against which nearly every other asset gets priced, from mortgage rates to corporate borrowing costs. If a meaningful share of the historical buyer base – sovereign wealth funds, foreign central banks, even domestic pension allocators reconsidering their duration exposure – genuinely begins rotating a portion of reserves into non-sovereign stores of value, the effect isn’t limited to Bitcoin’s price chart. It shows up in Treasury yields, in the cost of financing the federal deficit, and eventually in the interest rate every borrower in the economy pays.
The Counterargument Nobody on Crypto Twitter Likes to Engage With
It’s worth being honest about the size mismatch here. The Treasury market is measured in the tens of trillions of dollars. Bitcoin’s total market capitalization, even after years of institutional inflows and ETF adoption, remains a small fraction of that. For Bitcoin to meaningfully “absorb” Treasury outflows at any scale, either its price would need to rise dramatically to accommodate new capital without becoming even more concentrated in a handful of large holders, or the rotation would need to happen gradually enough that liquidity and volatility concerns don’t overwhelm the thesis before it plays out. Gold, for all the recent enthusiasm, faces its own supply constraint in the opposite direction – Horsley himself has previously noted that keeping gold prices merely stable requires absorbing hundreds of billions of dollars in new mined and recycled supply every year, a very different dynamic than Bitcoin’s fixed and shrinking issuance schedule.
There’s also a structural reason large, risk-averse institutional allocators – pension funds, insurance companies, central banks managing reserves for liquidity rather than appreciation – have historically favored Treasuries over volatile alternatives: predictability. Bitcoin’s price swings, even after years of maturation, remain far larger than anything in the sovereign debt market. A decade-long rotation thesis has to account for whether the institutions actually capable of moving trillions of dollars are willing to underwrite that volatility, or whether the shift Horsley describes ends up concentrated among a narrower set of more risk-tolerant allocators – sovereign wealth funds, corporate treasuries, and crypto-native asset managers – rather than the broad base of capital that currently anchors the Treasury market.
What to Actually Watch Over the Next Few Years
If this thesis is going to show up anywhere first, it won’t be in Bitcoin’s spot price – that’s too noisy and too influenced by short-term speculation to be a reliable signal. The more useful indicators are structural: continued data on foreign central bank Treasury holdings, particularly China’s, released monthly by the U.S. Treasury Department; the pace of central bank gold purchases globally, which the World Gold Council tracks and reports quarterly; and, on the Bitcoin side, whether institutional allocation continues shifting from short-term trading vehicles toward long-duration holding structures, corporate treasury allocations, and sovereign wealth fund positions – the kind of “sticky” capital that would actually indicate a genuine store-of-value rotation rather than speculative flow.
Congressional action matters here too, in a way that connects to the broader crypto policy conversation playing out in Washington right now. A clearer U.S. regulatory framework for digital assets would remove one of the larger institutional hesitations around allocating meaningfully to Bitcoin, potentially accelerating exactly the kind of rotation Horsley is describing – while continued regulatory ambiguity would likely keep the most risk-averse pools of capital on the sidelines regardless of how compelling the macro argument sounds.
Conclusion
Strip away the specific numbers and timelines, which are inherently speculative a decade out, and what Horsley and Krueger are really describing is a crisis of confidence in the idea that any single government’s debt can serve as the world’s default safe asset indefinitely. That’s a much bigger claim than “Bitcoin will go up,” and it’s one worth evaluating on its own terms rather than dismissing as promotional noise from people who profit if it’s true. Whether the destination for that lost confidence ends up being Bitcoin, gold, some combination of the two, or something not yet built, the more durable story here isn’t about which asset wins. It’s about how much longer the world can treat U.S. sovereign debt as risk-free while the fiscal picture backing that promise keeps getting harder to ignore.
This post The Slow Death of “Risk-Free”: Why Wall Street’s Bitcoin Bulls Have Stopped Talking About Price first appeared on BitcoinWorld.
For most of Bitcoin’s history, the loudest arguments in its favor were about price – how high it could go, how many multiples of gold it could capture, how early you still were. What’s changed in the last year, and what surfaced again this weekend in comments from Bitwise CEO Hunter Horsley, is that the more interesting argument coming out of crypto’s institutional wing isn’t about price appreciation at all. It’s about what happens to the asset that’s supposed to have no risk in the first place: the U.S. Treasury bond.
Horsley’s prediction – that capital will migrate out of Treasuries and into Bitcoin and gold over the next decade – landed alongside a related, more provocative claim from Bitcoin commentator Fred Krueger, who argued China could fully exit its Treasury holdings within seven years and replace them with gold. Taken together, the two statements aren’t really a crypto story. They’re a story about what happens when the safest asset in the global financial system stops being treated as safe.
Horsley Has Been Building This Argument for a Year
This isn’t a one-off hot take. Horsley has spent much of the past year publicly reframing what Bitcoin actually competes with. Back in June, he argued that Bitcoin’s real rival wasn’t gold – both, he said, function as apolitical stores of value that sit outside any government’s direct control – but rather sovereign debt instruments like U.S. Treasuries and UK gilts, which he called “the ultimate political stores of value” precisely because their worth is tied to the fiscal and monetary decisions of the governments that issue them. Around the same time, he pointed out that Bitcoin’s opportunity isn’t limited to challenging gold’s roughly $16 trillion market; it’s challenging the far larger, $30 trillion-plus Treasury market that has traditionally been the default parking spot for capital seeking safety.
That distinction matters more than it might first appear. Gold and Bitcoin, in Horsley’s framing, are assets nobody can print more of or default on. Treasuries are promises – backed by a government’s ability and willingness to tax, borrow, and pay. When confidence in that promise wavers, even slightly, the entire logic of holding a “risk-free” asset at scale starts to erode. And confidence has been wavering. Rising deficits, an expanding federal debt load, and questions about long-term fiscal discipline have all fed a narrative – one Horsley is far from alone in pushing – that the traditional 60/40 portfolio model, built for four decades of falling interest rates, wasn’t designed for an era of sustained fiscal expansion and currency debasement concerns.
The China Variable Makes This Concrete, Not Theoretical
Krueger’s claim about China dumping its Treasury holdings entirely over seven years sounds extreme in isolation, but it’s an extrapolation of a trend that’s already well documented, not a hypothetical. China’s Treasury holdings have fallen substantially over the past several years – from roughly $1.1 trillion in 2021 to a fraction of that today – while its central bank has been steadily adding to its gold reserves. Chinese officials and analysts have been fairly explicit about the strategic logic: after watching the U.S. and its allies freeze Russian dollar-denominated reserves following the invasion of Ukraine, Beijing has treated large-scale dollar exposure as a geopolitical vulnerability rather than just a financial position. Diversifying into gold, an asset that can’t be frozen by a foreign government’s sanctions regime, is a hedge against exactly that kind of exposure.
What Krueger adds to the picture is an endpoint and a timeline – full exit within seven years – which is a much stronger claim than “continued gradual diversification.” Whether or not the specific timeline proves accurate, the direction of travel lines up with a broader de-dollarization theme that central banks well beyond China have been quietly acting on, with global gold purchases by sovereign buyers running at historically elevated levels for several years running.
Why This Matters Beyond Crypto Twitter
It’s tempting to file this under the usual genre of crypto executives talking their own book – Horsley runs a firm that manages Bitcoin ETFs, so of course he wants people to believe capital is rotating into the asset his products are built around. That skepticism is fair and worth keeping in mind. But the underlying macro question he’s pointing at is one that mainstream fixed-income strategists have been asking with increasing seriousness, independent of any crypto angle: who actually buys the next several trillion dollars of U.S. debt, at what yield, if the traditional buyer base – foreign central banks, in particular – keeps shrinking?
That’s not an abstract question. The Treasury market is the deepest, most liquid market in the world, and it’s the benchmark against which nearly every other asset gets priced, from mortgage rates to corporate borrowing costs. If a meaningful share of the historical buyer base – sovereign wealth funds, foreign central banks, even domestic pension allocators reconsidering their duration exposure – genuinely begins rotating a portion of reserves into non-sovereign stores of value, the effect isn’t limited to Bitcoin’s price chart. It shows up in Treasury yields, in the cost of financing the federal deficit, and eventually in the interest rate every borrower in the economy pays.
The Counterargument Nobody on Crypto Twitter Likes to Engage With
It’s worth being honest about the size mismatch here. The Treasury market is measured in the tens of trillions of dollars. Bitcoin’s total market capitalization, even after years of institutional inflows and ETF adoption, remains a small fraction of that. For Bitcoin to meaningfully “absorb” Treasury outflows at any scale, either its price would need to rise dramatically to accommodate new capital without becoming even more concentrated in a handful of large holders, or the rotation would need to happen gradually enough that liquidity and volatility concerns don’t overwhelm the thesis before it plays out. Gold, for all the recent enthusiasm, faces its own supply constraint in the opposite direction – Horsley himself has previously noted that keeping gold prices merely stable requires absorbing hundreds of billions of dollars in new mined and recycled supply every year, a very different dynamic than Bitcoin’s fixed and shrinking issuance schedule.
There’s also a structural reason large, risk-averse institutional allocators – pension funds, insurance companies, central banks managing reserves for liquidity rather than appreciation – have historically favored Treasuries over volatile alternatives: predictability. Bitcoin’s price swings, even after years of maturation, remain far larger than anything in the sovereign debt market. A decade-long rotation thesis has to account for whether the institutions actually capable of moving trillions of dollars are willing to underwrite that volatility, or whether the shift Horsley describes ends up concentrated among a narrower set of more risk-tolerant allocators – sovereign wealth funds, corporate treasuries, and crypto-native asset managers – rather than the broad base of capital that currently anchors the Treasury market.
What to Actually Watch Over the Next Few Years
If this thesis is going to show up anywhere first, it won’t be in Bitcoin’s spot price – that’s too noisy and too influenced by short-term speculation to be a reliable signal. The more useful indicators are structural: continued data on foreign central bank Treasury holdings, particularly China’s, released monthly by the U.S. Treasury Department; the pace of central bank gold purchases globally, which the World Gold Council tracks and reports quarterly; and, on the Bitcoin side, whether institutional allocation continues shifting from short-term trading vehicles toward long-duration holding structures, corporate treasury allocations, and sovereign wealth fund positions – the kind of “sticky” capital that would actually indicate a genuine store-of-value rotation rather than speculative flow.
Congressional action matters here too, in a way that connects to the broader crypto policy conversation playing out in Washington right now. A clearer U.S. regulatory framework for digital assets would remove one of the larger institutional hesitations around allocating meaningfully to Bitcoin, potentially accelerating exactly the kind of rotation Horsley is describing – while continued regulatory ambiguity would likely keep the most risk-averse pools of capital on the sidelines regardless of how compelling the macro argument sounds.
Conclusion
Strip away the specific numbers and timelines, which are inherently speculative a decade out, and what Horsley and Krueger are really describing is a crisis of confidence in the idea that any single government’s debt can serve as the world’s default safe asset indefinitely. That’s a much bigger claim than “Bitcoin will go up,” and it’s one worth evaluating on its own terms rather than dismissing as promotional noise from people who profit if it’s true. Whether the destination for that lost confidence ends up being Bitcoin, gold, some combination of the two, or something not yet built, the more durable story here isn’t about which asset wins. It’s about how much longer the world can treat U.S. sovereign debt as risk-free while the fiscal picture backing that promise keeps getting harder to ignore.
This post The Slow Death of “Risk-Free”: Why Wall Street’s Bitcoin Bulls Have Stopped Talking About Price first appeared on BitcoinWorld.
235
·
--
Article
When “White Hat” Meets $320 Million: What the Liquid Network Drain Really Tells Us About Bitcoin’...BitcoinWorldWhen “White Hat” Meets $320 Million: What the Liquid Network Drain Really Tells Us About Bitcoin’s Bridge Problem
There’s a particular kind of unease that spreads through the crypto world when a bridge goes quiet. Not a hack in the traditional sense – no phishing link, no leaked seed phrase – but a system that simply stops working while everyone tries to figure out what just happened to the money. That’s the situation Blockstream and its Liquid Network found themselves in this weekend, after roughly 4,000 bitcoin – about $320 million – moved out of the network’s federation reserves in a single transaction, leaving the sidechain paused and its users staring at frozen balances.
The people who took the funds left a message on-chain: they’re “white hats.” They want to talk. Blockstream, for its part, says none of its keys were stolen. Both things can be true, and that’s exactly what makes this incident worth slowing down on, rather than treating it as just another line in crypto’s long ledger of exploits.
What Actually Happened, Without the Jargon
Liquid Network is what’s known as a federated sidechain – a parallel rail built on top of Bitcoin that lets institutions and exchanges move value faster and more privately than they could on the base layer. To do that, it needs its own bitcoin reserves, locked up and controlled by a group of trusted parties called the federation. When someone wants to convert their Liquid-based bitcoin (LBTC) back into real, on-chain BTC, that request goes through an authorization mechanism – in this case, a specific key tied to SideSwap, Blockstream’s trading platform, known as a Peg-out Authorization Key, or PAK.
That’s the part worth sitting with: the withdrawal didn’t require stealing a private key or breaking into a wallet. It appears to have exploited a flaw in the underlying accounting logic of Elements, the software framework Liquid runs on – the kind of bug that lets someone mint claims to bitcoin that shouldn’t exist, then cash them out through a process that looks, to the system, entirely legitimate. The federation’s own security infrastructure signed off on the transaction because, as far as the code was concerned, everything checked out.
That’s a fundamentally different – and in some ways more unsettling – category of failure than a stolen key. A stolen key is a story about a person or an institution failing to protect a secret. A logic bug in the settlement layer is a story about the system itself containing an assumption that turned out to be wrong. You can rotate a key. You can’t always predict which of your assumptions will break.
Why “White Hat” Doesn’t Settle the Question
The label matters less than people think it does. Anyone can write “we are whitehats, contact us on chain” into a transaction. It costs nothing and it changes the immediate optics enormously – a “white hat” story invites patience; a “hacker” story invites panic and law enforcement. But intent isn’t something you can verify from a block explorer. It’s something that gets proven, if at all, by what happens next: whether the funds actually come back, whether a bug bounty negotiation follows, or whether the coins sit untouched for months while lawyers and investigators get involved.
There’s a well-worn pattern in decentralized finance where attackers drain a protocol, then rebrand themselves as security researchers the moment the takedown risk becomes uncomfortable – Poly Network in 2021 is the reference case most people in the industry still cite, where roughly $600 million was returned after the attacker claimed altruistic motives. Sometimes that framing is genuine. Sometimes it’s a negotiating tactic dressed up as ethics. Right now, with roughly 95% of Liquid’s bitcoin reserves sitting in an address controlled by someone else, that distinction isn’t academic – it determines whether LBTC holders across multiple exchanges get made whole.
The Part That Should Worry the Industry More Than the Dollar Figure
$320 million is a serious number, but Bitcoin-adjacent hacks have gone bigger – Ronin lost over $600 million, Bybit lost roughly $1.5 billion earlier in 2025. What makes this incident distinct is where it happened. Liquid isn’t a speculative DeFi protocol running unaudited smart contracts on a testnet mentality. It’s infrastructure. Exchanges use it. Institutional desks use it precisely because it’s supposed to be the boring, dependable option – a federated model that trades some decentralization for speed and predictability, built by one of the more technically respected teams in the Bitcoin ecosystem.
That’s the uncomfortable lesson here: federated and “permissioned” bridge designs are often pitched as safer than fully permissionless bridges because a known, accountable group of signers controls the funds. But this event suggests the vulnerability surface isn’t really about who holds the keys – it’s about whether the software the keys are attached to correctly enforces the rules it claims to enforce. A federation of honest, competent signers can still sign a fraudulent transaction if the system tells them it’s valid. Trust in the people doesn’t fix a flaw in the code they’re relying on.
For anyone holding LBTC, or for any exchange listing it, that reframes the risk calculus. The question isn’t just “do I trust Blockstream,” it’s “do I trust every dependency in the stack that determines what counts as a legitimate peg-out.”
The Immediate Fallout
Blockstream moved quickly to contain the damage – bridge nodes disabled, new transaction submission blocked, exchanges notified to freeze LBTC deposits and withdrawals. That’s the correct triage response, and it likely prevented a chaotic run where people scrambled to pull LBTC before reserves ran out entirely. But it also means, for now, that everyone holding LBTC is stuck. They can’t redeem it, can’t move it, can’t do much beyond watching the federation’s on-chain messages to the attacker and hoping for a resolution.
Other assets issued on Liquid – including tethered stablecoins and various real-world-asset tokens – reportedly weren’t touched, which suggests the exploit was narrowly targeted at the bitcoin peg-out mechanism rather than the sidechain’s broader asset-issuance infrastructure. That’s a meaningful distinction operationally, even if it offers little comfort to LBTC holders specifically.
What Comes Next, Realistically
A few plausible paths open up from here, and they’re worth naming honestly rather than assuming the best case.
The optimistic scenario: negotiations succeed, the attacker genuinely wanted to expose the bug rather than profit from it, some or all of the funds get returned (possibly minus a bug bounty), and Blockstream patches the Elements vulnerability before relaunching. This has happened before in the industry, and Blockstream’s technical reputation gives it a real shot at negotiating in good faith.
The less comfortable scenario: the funds don’t come back, or only partially do, and Liquid has to figure out how to make LBTC holders whole using resources beyond the drained reserve – assuming it can or will. That would be a serious reputational and possibly legal reckoning for a network that markets itself to institutional users on the promise of reliability.
Either way, expect three things in the coming weeks: a detailed post-mortem from Blockstream once the immediate crisis is resolved, renewed scrutiny of other federated and multisig bridge designs across the industry for similar consensus-layer bugs, and a harder conversation among exchanges about how much operational trust they extend to any sidechain – federated or otherwise – that sits between their users and their actual bitcoin.
The Bigger Picture
Bitcoin’s base layer remains, by design, slow to change and extremely difficult to break – that’s the entire point of its conservatism. But almost everything built on top of it to make it faster or more flexible – sidechains, bridges, wrapped assets – necessarily reintroduces the kind of software complexity, and therefore the kind of risk, that the base layer was built to avoid. Liquid isn’t the first bridge to learn this lesson, and it won’t be the last. What’s notable is that it happened to one of the more established, professionally run examples of the category, which should recalibrate how much comfort anyone takes from a project’s pedigree alone.
Conclusion
The Liquid Network incident isn’t really a story about a hack, or even really about $320 million. It’s a story about the gap between how secure a system appears – audited code, known federation members, years of uptime – and how secure it actually is once its underlying assumptions get tested by someone motivated enough to look for the seam. Whether the people behind this withdrawal turn out to be good-faith researchers or something else, the outcome that matters most has already happened: a system built on trust just proved that trust in people isn’t the same thing as trust in the code those people depend on. That’s the lesson every bridge operator, every exchange, and every institutional bitcoin holder should be taking from this, regardless of how the negotiation with Liquid’s “white hats” ultimately ends.
This post When “White Hat” Meets $320 Million: What the Liquid Network Drain Really Tells Us About Bitcoin’s Bridge Problem first appeared on BitcoinWorld.
When “White Hat” Meets $320 Million: What the Liquid Network Drain Really Tells Us About Bitcoin’...
BitcoinWorldWhen “White Hat” Meets $320 Million: What the Liquid Network Drain Really Tells Us About Bitcoin’s Bridge Problem
There’s a particular kind of unease that spreads through the crypto world when a bridge goes quiet. Not a hack in the traditional sense – no phishing link, no leaked seed phrase – but a system that simply stops working while everyone tries to figure out what just happened to the money. That’s the situation Blockstream and its Liquid Network found themselves in this weekend, after roughly 4,000 bitcoin – about $320 million – moved out of the network’s federation reserves in a single transaction, leaving the sidechain paused and its users staring at frozen balances.
The people who took the funds left a message on-chain: they’re “white hats.” They want to talk. Blockstream, for its part, says none of its keys were stolen. Both things can be true, and that’s exactly what makes this incident worth slowing down on, rather than treating it as just another line in crypto’s long ledger of exploits.
What Actually Happened, Without the Jargon
Liquid Network is what’s known as a federated sidechain – a parallel rail built on top of Bitcoin that lets institutions and exchanges move value faster and more privately than they could on the base layer. To do that, it needs its own bitcoin reserves, locked up and controlled by a group of trusted parties called the federation. When someone wants to convert their Liquid-based bitcoin (LBTC) back into real, on-chain BTC, that request goes through an authorization mechanism – in this case, a specific key tied to SideSwap, Blockstream’s trading platform, known as a Peg-out Authorization Key, or PAK.
That’s the part worth sitting with: the withdrawal didn’t require stealing a private key or breaking into a wallet. It appears to have exploited a flaw in the underlying accounting logic of Elements, the software framework Liquid runs on – the kind of bug that lets someone mint claims to bitcoin that shouldn’t exist, then cash them out through a process that looks, to the system, entirely legitimate. The federation’s own security infrastructure signed off on the transaction because, as far as the code was concerned, everything checked out.
That’s a fundamentally different – and in some ways more unsettling – category of failure than a stolen key. A stolen key is a story about a person or an institution failing to protect a secret. A logic bug in the settlement layer is a story about the system itself containing an assumption that turned out to be wrong. You can rotate a key. You can’t always predict which of your assumptions will break.
Why “White Hat” Doesn’t Settle the Question
The label matters less than people think it does. Anyone can write “we are whitehats, contact us on chain” into a transaction. It costs nothing and it changes the immediate optics enormously – a “white hat” story invites patience; a “hacker” story invites panic and law enforcement. But intent isn’t something you can verify from a block explorer. It’s something that gets proven, if at all, by what happens next: whether the funds actually come back, whether a bug bounty negotiation follows, or whether the coins sit untouched for months while lawyers and investigators get involved.
There’s a well-worn pattern in decentralized finance where attackers drain a protocol, then rebrand themselves as security researchers the moment the takedown risk becomes uncomfortable – Poly Network in 2021 is the reference case most people in the industry still cite, where roughly $600 million was returned after the attacker claimed altruistic motives. Sometimes that framing is genuine. Sometimes it’s a negotiating tactic dressed up as ethics. Right now, with roughly 95% of Liquid’s bitcoin reserves sitting in an address controlled by someone else, that distinction isn’t academic – it determines whether LBTC holders across multiple exchanges get made whole.
The Part That Should Worry the Industry More Than the Dollar Figure
$320 million is a serious number, but Bitcoin-adjacent hacks have gone bigger – Ronin lost over $600 million, Bybit lost roughly $1.5 billion earlier in 2025. What makes this incident distinct is where it happened. Liquid isn’t a speculative DeFi protocol running unaudited smart contracts on a testnet mentality. It’s infrastructure. Exchanges use it. Institutional desks use it precisely because it’s supposed to be the boring, dependable option – a federated model that trades some decentralization for speed and predictability, built by one of the more technically respected teams in the Bitcoin ecosystem.
That’s the uncomfortable lesson here: federated and “permissioned” bridge designs are often pitched as safer than fully permissionless bridges because a known, accountable group of signers controls the funds. But this event suggests the vulnerability surface isn’t really about who holds the keys – it’s about whether the software the keys are attached to correctly enforces the rules it claims to enforce. A federation of honest, competent signers can still sign a fraudulent transaction if the system tells them it’s valid. Trust in the people doesn’t fix a flaw in the code they’re relying on.
For anyone holding LBTC, or for any exchange listing it, that reframes the risk calculus. The question isn’t just “do I trust Blockstream,” it’s “do I trust every dependency in the stack that determines what counts as a legitimate peg-out.”
The Immediate Fallout
Blockstream moved quickly to contain the damage – bridge nodes disabled, new transaction submission blocked, exchanges notified to freeze LBTC deposits and withdrawals. That’s the correct triage response, and it likely prevented a chaotic run where people scrambled to pull LBTC before reserves ran out entirely. But it also means, for now, that everyone holding LBTC is stuck. They can’t redeem it, can’t move it, can’t do much beyond watching the federation’s on-chain messages to the attacker and hoping for a resolution.
Other assets issued on Liquid – including tethered stablecoins and various real-world-asset tokens – reportedly weren’t touched, which suggests the exploit was narrowly targeted at the bitcoin peg-out mechanism rather than the sidechain’s broader asset-issuance infrastructure. That’s a meaningful distinction operationally, even if it offers little comfort to LBTC holders specifically.
What Comes Next, Realistically
A few plausible paths open up from here, and they’re worth naming honestly rather than assuming the best case.
The optimistic scenario: negotiations succeed, the attacker genuinely wanted to expose the bug rather than profit from it, some or all of the funds get returned (possibly minus a bug bounty), and Blockstream patches the Elements vulnerability before relaunching. This has happened before in the industry, and Blockstream’s technical reputation gives it a real shot at negotiating in good faith.
The less comfortable scenario: the funds don’t come back, or only partially do, and Liquid has to figure out how to make LBTC holders whole using resources beyond the drained reserve – assuming it can or will. That would be a serious reputational and possibly legal reckoning for a network that markets itself to institutional users on the promise of reliability.
Either way, expect three things in the coming weeks: a detailed post-mortem from Blockstream once the immediate crisis is resolved, renewed scrutiny of other federated and multisig bridge designs across the industry for similar consensus-layer bugs, and a harder conversation among exchanges about how much operational trust they extend to any sidechain – federated or otherwise – that sits between their users and their actual bitcoin.
The Bigger Picture
Bitcoin’s base layer remains, by design, slow to change and extremely difficult to break – that’s the entire point of its conservatism. But almost everything built on top of it to make it faster or more flexible – sidechains, bridges, wrapped assets – necessarily reintroduces the kind of software complexity, and therefore the kind of risk, that the base layer was built to avoid. Liquid isn’t the first bridge to learn this lesson, and it won’t be the last. What’s notable is that it happened to one of the more established, professionally run examples of the category, which should recalibrate how much comfort anyone takes from a project’s pedigree alone.
Conclusion
The Liquid Network incident isn’t really a story about a hack, or even really about $320 million. It’s a story about the gap between how secure a system appears – audited code, known federation members, years of uptime – and how secure it actually is once its underlying assumptions get tested by someone motivated enough to look for the seam. Whether the people behind this withdrawal turn out to be good-faith researchers or something else, the outcome that matters most has already happened: a system built on trust just proved that trust in people isn’t the same thing as trust in the code those people depend on. That’s the lesson every bridge operator, every exchange, and every institutional bitcoin holder should be taking from this, regardless of how the negotiation with Liquid’s “white hats” ultimately ends.
This post When “White Hat” Meets $320 Million: What the Liquid Network Drain Really Tells Us About Bitcoin’s Bridge Problem first appeared on BitcoinWorld.
There’s a particular kind of unease that spreads through the crypto world when a bridge goes quiet. Not a hack in the traditional sense – no phishing link, no leaked seed phrase – but a system that simply stops working while everyone tries to figure out what just happened to the money. That’s the situation Blockstream and its Liquid Network found themselves in this weekend, after roughly 4,000 bitcoin – about $320 million – moved out of the network’s federation reserves in a single transaction, leaving the sidechain paused and its users staring at frozen balances.
The people who took the funds left a message on-chain: they’re “white hats.” They want to talk. Blockstream, for its part, says none of its keys were stolen. Both things can be true, and that’s exactly what makes this incident worth slowing down on, rather than treating it as just another line in crypto’s long ledger of exploits.
What Actually Happened, Without the Jargon
Liquid Network is what’s known as a federated sidechain – a parallel rail built on top of Bitcoin that lets institutions and exchanges move value faster and more privately than they could on the base layer. To do that, it needs its own bitcoin reserves, locked up and controlled by a group of trusted parties called the federation. When someone wants to convert their Liquid-based bitcoin (LBTC) back into real, on-chain BTC, that request goes through an authorization mechanism – in this case, a specific key tied to SideSwap, Blockstream’s trading platform, known as a Peg-out Authorization Key, or PAK.
That’s the part worth sitting with: the withdrawal didn’t require stealing a private key or breaking into a wallet. It appears to have exploited a flaw in the underlying accounting logic of Elements, the software framework Liquid runs on – the kind of bug that lets someone mint claims to bitcoin that shouldn’t exist, then cash them out through a process that looks, to the system, entirely legitimate. The federation’s own security infrastructure signed off on the transaction because, as far as the code was concerned, everything checked out.
That’s a fundamentally different – and in some ways more unsettling – category of failure than a stolen key. A stolen key is a story about a person or an institution failing to protect a secret. A logic bug in the settlement layer is a story about the system itself containing an assumption that turned out to be wrong. You can rotate a key. You can’t always predict which of your assumptions will break.
Why “White Hat” Doesn’t Settle the Question
The label matters less than people think it does. Anyone can write “we are whitehats, contact us on chain” into a transaction. It costs nothing and it changes the immediate optics enormously – a “white hat” story invites patience; a “hacker” story invites panic and law enforcement. But intent isn’t something you can verify from a block explorer. It’s something that gets proven, if at all, by what happens next: whether the funds actually come back, whether a bug bounty negotiation follows, or whether the coins sit untouched for months while lawyers and investigators get involved.
There’s a well-worn pattern in decentralized finance where attackers drain a protocol, then rebrand themselves as security researchers the moment the takedown risk becomes uncomfortable – Poly Network in 2021 is the reference case most people in the industry still cite, where roughly $600 million was returned after the attacker claimed altruistic motives. Sometimes that framing is genuine. Sometimes it’s a negotiating tactic dressed up as ethics. Right now, with roughly 95% of Liquid’s bitcoin reserves sitting in an address controlled by someone else, that distinction isn’t academic – it determines whether LBTC holders across multiple exchanges get made whole.
The Part That Should Worry the Industry More Than the Dollar Figure
$320 million is a serious number, but Bitcoin-adjacent hacks have gone bigger – Ronin lost over $600 million, Bybit lost roughly $1.5 billion earlier in 2025. What makes this incident distinct is where it happened. Liquid isn’t a speculative DeFi protocol running unaudited smart contracts on a testnet mentality. It’s infrastructure. Exchanges use it. Institutional desks use it precisely because it’s supposed to be the boring, dependable option – a federated model that trades some decentralization for speed and predictability, built by one of the more technically respected teams in the Bitcoin ecosystem.
That’s the uncomfortable lesson here: federated and “permissioned” bridge designs are often pitched as safer than fully permissionless bridges because a known, accountable group of signers controls the funds. But this event suggests the vulnerability surface isn’t really about who holds the keys – it’s about whether the software the keys are attached to correctly enforces the rules it claims to enforce. A federation of honest, competent signers can still sign a fraudulent transaction if the system tells them it’s valid. Trust in the people doesn’t fix a flaw in the code they’re relying on.
For anyone holding LBTC, or for any exchange listing it, that reframes the risk calculus. The question isn’t just “do I trust Blockstream,” it’s “do I trust every dependency in the stack that determines what counts as a legitimate peg-out.”
The Immediate Fallout
Blockstream moved quickly to contain the damage – bridge nodes disabled, new transaction submission blocked, exchanges notified to freeze LBTC deposits and withdrawals. That’s the correct triage response, and it likely prevented a chaotic run where people scrambled to pull LBTC before reserves ran out entirely. But it also means, for now, that everyone holding LBTC is stuck. They can’t redeem it, can’t move it, can’t do much beyond watching the federation’s on-chain messages to the attacker and hoping for a resolution.
Other assets issued on Liquid – including tethered stablecoins and various real-world-asset tokens – reportedly weren’t touched, which suggests the exploit was narrowly targeted at the bitcoin peg-out mechanism rather than the sidechain’s broader asset-issuance infrastructure. That’s a meaningful distinction operationally, even if it offers little comfort to LBTC holders specifically.
What Comes Next, Realistically
A few plausible paths open up from here, and they’re worth naming honestly rather than assuming the best case.
The optimistic scenario: negotiations succeed, the attacker genuinely wanted to expose the bug rather than profit from it, some or all of the funds get returned (possibly minus a bug bounty), and Blockstream patches the Elements vulnerability before relaunching. This has happened before in the industry, and Blockstream’s technical reputation gives it a real shot at negotiating in good faith.
The less comfortable scenario: the funds don’t come back, or only partially do, and Liquid has to figure out how to make LBTC holders whole using resources beyond the drained reserve – assuming it can or will. That would be a serious reputational and possibly legal reckoning for a network that markets itself to institutional users on the promise of reliability.
Either way, expect three things in the coming weeks: a detailed post-mortem from Blockstream once the immediate crisis is resolved, renewed scrutiny of other federated and multisig bridge designs across the industry for similar consensus-layer bugs, and a harder conversation among exchanges about how much operational trust they extend to any sidechain – federated or otherwise – that sits between their users and their actual bitcoin.
The Bigger Picture
Bitcoin’s base layer remains, by design, slow to change and extremely difficult to break – that’s the entire point of its conservatism. But almost everything built on top of it to make it faster or more flexible – sidechains, bridges, wrapped assets – necessarily reintroduces the kind of software complexity, and therefore the kind of risk, that the base layer was built to avoid. Liquid isn’t the first bridge to learn this lesson, and it won’t be the last. What’s notable is that it happened to one of the more established, professionally run examples of the category, which should recalibrate how much comfort anyone takes from a project’s pedigree alone.
Conclusion
The Liquid Network incident isn’t really a story about a hack, or even really about $320 million. It’s a story about the gap between how secure a system appears – audited code, known federation members, years of uptime – and how secure it actually is once its underlying assumptions get tested by someone motivated enough to look for the seam. Whether the people behind this withdrawal turn out to be good-faith researchers or something else, the outcome that matters most has already happened: a system built on trust just proved that trust in people isn’t the same thing as trust in the code those people depend on. That’s the lesson every bridge operator, every exchange, and every institutional bitcoin holder should be taking from this, regardless of how the negotiation with Liquid’s “white hats” ultimately ends.
This post When “White Hat” Meets $320 Million: What the Liquid Network Drain Really Tells Us About Bitcoin’s Bridge Problem first appeared on BitcoinWorld.
125
·
--
Article
The Real Deadline Isn’t September 15. It’s the Calendar Itself.BitcoinWorldThe Real Deadline Isn’t September 15. It’s the Calendar Itself.
Washington has a way of turning arithmetic into drama, and Senator Cynthia Lummis has just done exactly that with the CLARITY Act. Her warning that a failed vote could push comprehensive crypto market-structure legislation off the table until 2030 sounds, on first read, like the kind of urgency-manufacturing that lawmakers deploy whenever they need colleagues to feel a deadline breathing down their necks. But look past the rhetoric and the math actually holds up – which is what makes this moment worth understanding rather than just reacting to.
What’s Actually on the Calendar September 15
At 2:15 p.m. on Tuesday, the Senate will hold a cloture vote on the motion to proceed to H.R. 3633, the Digital Asset Market Clarity Act. Strip away the procedural language and it comes down to this: can 60 senators agree to even start debating the bill. Not pass it. Not amend it. Just open the floor to formal consideration.
That distinction gets lost in a lot of the coverage, and it shouldn’t. Republicans control 53 seats, which means at least seven Democrats or independents need to cross over for the motion to clear, assuming full party unity on the GOP side – itself not guaranteed given the bill’s contested provisions on stablecoin yield and decentralized finance oversight. If cloture succeeds, the bill moves to floor debate and amendments, with a genuine passage vote still to come after that. If it fails, the bill doesn’t die outright, but it effectively stalls with the legislative calendar working against any second attempt.
Why “2030” Isn’t Hyperbole
Lummis’s argument isn’t really about crypto policy specifics – it’s about how Congress works. Fewer than eight months remain in the current Congress’s term. Any bill that doesn’t cross the finish line before a new Congress is sworn in dies with the old one; there’s no carryover. A new Congress means reintroducing the bill from scratch, rebuilding committee support, and – critically – hoping the chamber’s political composition still favors the same regulatory approach. Given how volatile control of the Senate has been in recent cycles, that’s not a small assumption to bank a multi-billion-dollar industry’s regulatory certainty on.
This is the part that gets underappreciated in crypto commentary, which tends to focus on price action and adoption metrics rather than legislative mechanics. A missed window in Congress isn’t a delay measured in months. It’s a delay measured in election cycles. If the CLARITY Act fails now and Republicans lose their trifecta or their Senate majority in the 2026 midterms, the entire framework could need to be renegotiated with a different set of political incentives – or shelved indefinitely if crypto policy stops being a legislative priority at all. Lummis’s 2030 estimate is essentially a bet on how many congressional terms it typically takes for a stalled, politically contested bill to resurface with enough momentum to pass – and that’s not an unreasonable read of how Washington actually functions.
The Bill Has Already Survived a Gauntlet
What makes the stakes feel higher is how much groundwork has already gone into H.R. 3633. The House passed its version back in July 2025 with a lopsided 294-134 vote – genuine bipartisan support, not a party-line squeaker. The Senate Banking Committee advanced it 15-9. It survived a markup process that saw roughly 130 amendments filed and absorbed pushback in the form of about 8,000 opposition letters from the banking industry, which has its own reasons to be wary of a regulatory framework that could make crypto rails more competitive with traditional deposit and payment infrastructure.
Even some unlikely opposition has softened. The National Sheriffs’ Association, which had previously raised concerns likely tied to law enforcement and anti-money-laundering considerations, moved to a neutral position on September 6 – one less organized stakeholder actively working against the bill heading into the vote. That’s a meaningful signal. Bills don’t survive this many rounds of amendment and lobbying pressure by accident; something has kept it alive, and that something is a genuine, if fragile, coalition of interests that want regulatory clarity more than they want to keep fighting about the details.
What the Bill Would Actually Settle
It’s worth remembering what’s actually at stake substantively, because “market structure” is abstract enough to gloss over. The core fight the CLARITY Act tries to resolve is jurisdictional: which digital assets fall under the SEC’s securities framework, and which belong under the CFTC’s commodities framework. That sounds like inside-baseball regulatory turf war, but it has real consequences for anyone building or investing in crypto in the United States. Right now, that boundary is largely defined by SEC enforcement actions rather than statute – a “regulate by lawsuit” approach that leaves founders, exchanges, and investors guessing about which rules apply until a court says otherwise, sometimes years after a product has already launched.
A statutory framework would replace that guesswork with actual rules: clear registration pathways, defined disclosure requirements, and – notably – restrictions on how stablecoin issuers can offer yield, an area regulators have flagged as functionally resembling unregulated bank deposits. SEC Chair Paul Atkins has already signaled the agency is structurally ready to implement the bill the moment Congress acts, which suggests the regulatory apparatus, not just the political will, is primed for this to move fast if it clears the Senate.
Reading Between the Lines of Lummis’s Push
There’s a pattern worth noticing in how aggressively pro-crypto lawmakers have leaned into deadline framing over the past year. It’s not just Lummis – former White House crypto adviser David Sacks and SEC leadership have all used similar “act now or lose the window” language in recent weeks. That kind of coordinated urgency usually means insiders believe the coalition currently holding together is more fragile than it looks from the outside, and that letting the vote slip risks losing votes rather than gaining them over time.
There’s also a quieter subplot worth watching: reports suggest that filling the CFTC’s vacant commissioner seats has become an informal negotiating chip tied to the bill’s progress. If accurate, that means the vote isn’t purely about crypto policy on its own merits – it’s tangled up with broader personnel and political horse-trading at the White House level, the kind of dynamic that can derail otherwise-popular legislation for reasons that have nothing to do with its actual text.
What Happens After September 15, Either Way
If cloture passes, the bill moves toward a floor vote likely in late September, though “floor vote” still means further amendment fights over the most contested provisions – DeFi treatment and stablecoin yield restrictions chief among them. Passage isn’t guaranteed even then, but it becomes far more likely once formal debate opens, since procedural obstruction becomes harder to sustain politically the closer a bill gets to a final vote.
If cloture fails, expect the immediate crypto-market reaction to be muted rather than dramatic – prediction markets have already priced in fairly low odds for the bill’s near-term passage, hovering in the high-teens to low-twenties percent range, which suggests traders aren’t expecting a clean win regardless of the rhetoric. But the longer-term effect would be a continuation of the status quo that the industry has spent years complaining about: enforcement-driven regulation, an SEC that can define the rules of the game unilaterally through litigation, and continued uncertainty that pushes some crypto activity and capital toward jurisdictions with clearer rules, including parts of Europe and Asia that have already implemented comprehensive frameworks.
Conclusion
Strip away the political theater and Lummis’s warning is really a statement about how legislative windows work, not a prediction about crypto’s future. Bills like this don’t fail and quietly try again next session – they fail and wait for the next alignment of political will, committee leadership, and electoral outcomes, which can easily take years rather than months. Whether or not September 15 produces the 60 votes needed to move forward, the vote itself has become a useful stress test for something bigger than crypto policy: how much genuine, durable coalition exists in Washington for treating digital assets as a settled part of the financial system, rather than a recurring fight to be relitigated every time the political winds shift. That answer will matter to builders and investors long after this particular news cycle fades.
This post The Real Deadline Isn’t September 15. It’s the Calendar Itself. first appeared on BitcoinWorld.
The Real Deadline Isn’t September 15. It’s the Calendar Itself.
BitcoinWorldThe Real Deadline Isn’t September 15. It’s the Calendar Itself.
Washington has a way of turning arithmetic into drama, and Senator Cynthia Lummis has just done exactly that with the CLARITY Act. Her warning that a failed vote could push comprehensive crypto market-structure legislation off the table until 2030 sounds, on first read, like the kind of urgency-manufacturing that lawmakers deploy whenever they need colleagues to feel a deadline breathing down their necks. But look past the rhetoric and the math actually holds up – which is what makes this moment worth understanding rather than just reacting to.
What’s Actually on the Calendar September 15
At 2:15 p.m. on Tuesday, the Senate will hold a cloture vote on the motion to proceed to H.R. 3633, the Digital Asset Market Clarity Act. Strip away the procedural language and it comes down to this: can 60 senators agree to even start debating the bill. Not pass it. Not amend it. Just open the floor to formal consideration.
That distinction gets lost in a lot of the coverage, and it shouldn’t. Republicans control 53 seats, which means at least seven Democrats or independents need to cross over for the motion to clear, assuming full party unity on the GOP side – itself not guaranteed given the bill’s contested provisions on stablecoin yield and decentralized finance oversight. If cloture succeeds, the bill moves to floor debate and amendments, with a genuine passage vote still to come after that. If it fails, the bill doesn’t die outright, but it effectively stalls with the legislative calendar working against any second attempt.
Why “2030” Isn’t Hyperbole
Lummis’s argument isn’t really about crypto policy specifics – it’s about how Congress works. Fewer than eight months remain in the current Congress’s term. Any bill that doesn’t cross the finish line before a new Congress is sworn in dies with the old one; there’s no carryover. A new Congress means reintroducing the bill from scratch, rebuilding committee support, and – critically – hoping the chamber’s political composition still favors the same regulatory approach. Given how volatile control of the Senate has been in recent cycles, that’s not a small assumption to bank a multi-billion-dollar industry’s regulatory certainty on.
This is the part that gets underappreciated in crypto commentary, which tends to focus on price action and adoption metrics rather than legislative mechanics. A missed window in Congress isn’t a delay measured in months. It’s a delay measured in election cycles. If the CLARITY Act fails now and Republicans lose their trifecta or their Senate majority in the 2026 midterms, the entire framework could need to be renegotiated with a different set of political incentives – or shelved indefinitely if crypto policy stops being a legislative priority at all. Lummis’s 2030 estimate is essentially a bet on how many congressional terms it typically takes for a stalled, politically contested bill to resurface with enough momentum to pass – and that’s not an unreasonable read of how Washington actually functions.
The Bill Has Already Survived a Gauntlet
What makes the stakes feel higher is how much groundwork has already gone into H.R. 3633. The House passed its version back in July 2025 with a lopsided 294-134 vote – genuine bipartisan support, not a party-line squeaker. The Senate Banking Committee advanced it 15-9. It survived a markup process that saw roughly 130 amendments filed and absorbed pushback in the form of about 8,000 opposition letters from the banking industry, which has its own reasons to be wary of a regulatory framework that could make crypto rails more competitive with traditional deposit and payment infrastructure.
Even some unlikely opposition has softened. The National Sheriffs’ Association, which had previously raised concerns likely tied to law enforcement and anti-money-laundering considerations, moved to a neutral position on September 6 – one less organized stakeholder actively working against the bill heading into the vote. That’s a meaningful signal. Bills don’t survive this many rounds of amendment and lobbying pressure by accident; something has kept it alive, and that something is a genuine, if fragile, coalition of interests that want regulatory clarity more than they want to keep fighting about the details.
What the Bill Would Actually Settle
It’s worth remembering what’s actually at stake substantively, because “market structure” is abstract enough to gloss over. The core fight the CLARITY Act tries to resolve is jurisdictional: which digital assets fall under the SEC’s securities framework, and which belong under the CFTC’s commodities framework. That sounds like inside-baseball regulatory turf war, but it has real consequences for anyone building or investing in crypto in the United States. Right now, that boundary is largely defined by SEC enforcement actions rather than statute – a “regulate by lawsuit” approach that leaves founders, exchanges, and investors guessing about which rules apply until a court says otherwise, sometimes years after a product has already launched.
A statutory framework would replace that guesswork with actual rules: clear registration pathways, defined disclosure requirements, and – notably – restrictions on how stablecoin issuers can offer yield, an area regulators have flagged as functionally resembling unregulated bank deposits. SEC Chair Paul Atkins has already signaled the agency is structurally ready to implement the bill the moment Congress acts, which suggests the regulatory apparatus, not just the political will, is primed for this to move fast if it clears the Senate.
Reading Between the Lines of Lummis’s Push
There’s a pattern worth noticing in how aggressively pro-crypto lawmakers have leaned into deadline framing over the past year. It’s not just Lummis – former White House crypto adviser David Sacks and SEC leadership have all used similar “act now or lose the window” language in recent weeks. That kind of coordinated urgency usually means insiders believe the coalition currently holding together is more fragile than it looks from the outside, and that letting the vote slip risks losing votes rather than gaining them over time.
There’s also a quieter subplot worth watching: reports suggest that filling the CFTC’s vacant commissioner seats has become an informal negotiating chip tied to the bill’s progress. If accurate, that means the vote isn’t purely about crypto policy on its own merits – it’s tangled up with broader personnel and political horse-trading at the White House level, the kind of dynamic that can derail otherwise-popular legislation for reasons that have nothing to do with its actual text.
What Happens After September 15, Either Way
If cloture passes, the bill moves toward a floor vote likely in late September, though “floor vote” still means further amendment fights over the most contested provisions – DeFi treatment and stablecoin yield restrictions chief among them. Passage isn’t guaranteed even then, but it becomes far more likely once formal debate opens, since procedural obstruction becomes harder to sustain politically the closer a bill gets to a final vote.
If cloture fails, expect the immediate crypto-market reaction to be muted rather than dramatic – prediction markets have already priced in fairly low odds for the bill’s near-term passage, hovering in the high-teens to low-twenties percent range, which suggests traders aren’t expecting a clean win regardless of the rhetoric. But the longer-term effect would be a continuation of the status quo that the industry has spent years complaining about: enforcement-driven regulation, an SEC that can define the rules of the game unilaterally through litigation, and continued uncertainty that pushes some crypto activity and capital toward jurisdictions with clearer rules, including parts of Europe and Asia that have already implemented comprehensive frameworks.
Conclusion
Strip away the political theater and Lummis’s warning is really a statement about how legislative windows work, not a prediction about crypto’s future. Bills like this don’t fail and quietly try again next session – they fail and wait for the next alignment of political will, committee leadership, and electoral outcomes, which can easily take years rather than months. Whether or not September 15 produces the 60 votes needed to move forward, the vote itself has become a useful stress test for something bigger than crypto policy: how much genuine, durable coalition exists in Washington for treating digital assets as a settled part of the financial system, rather than a recurring fight to be relitigated every time the political winds shift. That answer will matter to builders and investors long after this particular news cycle fades.
This post The Real Deadline Isn’t September 15. It’s the Calendar Itself. first appeared on BitcoinWorld.
Washington has a way of turning arithmetic into drama, and Senator Cynthia Lummis has just done exactly that with the CLARITY Act. Her warning that a failed vote could push comprehensive crypto market-structure legislation off the table until 2030 sounds, on first read, like the kind of urgency-manufacturing that lawmakers deploy whenever they need colleagues to feel a deadline breathing down their necks. But look past the rhetoric and the math actually holds up – which is what makes this moment worth understanding rather than just reacting to.
What’s Actually on the Calendar September 15
At 2:15 p.m. on Tuesday, the Senate will hold a cloture vote on the motion to proceed to H.R. 3633, the Digital Asset Market Clarity Act. Strip away the procedural language and it comes down to this: can 60 senators agree to even start debating the bill. Not pass it. Not amend it. Just open the floor to formal consideration.
That distinction gets lost in a lot of the coverage, and it shouldn’t. Republicans control 53 seats, which means at least seven Democrats or independents need to cross over for the motion to clear, assuming full party unity on the GOP side – itself not guaranteed given the bill’s contested provisions on stablecoin yield and decentralized finance oversight. If cloture succeeds, the bill moves to floor debate and amendments, with a genuine passage vote still to come after that. If it fails, the bill doesn’t die outright, but it effectively stalls with the legislative calendar working against any second attempt.
Why “2030” Isn’t Hyperbole
Lummis’s argument isn’t really about crypto policy specifics – it’s about how Congress works. Fewer than eight months remain in the current Congress’s term. Any bill that doesn’t cross the finish line before a new Congress is sworn in dies with the old one; there’s no carryover. A new Congress means reintroducing the bill from scratch, rebuilding committee support, and – critically – hoping the chamber’s political composition still favors the same regulatory approach. Given how volatile control of the Senate has been in recent cycles, that’s not a small assumption to bank a multi-billion-dollar industry’s regulatory certainty on.
This is the part that gets underappreciated in crypto commentary, which tends to focus on price action and adoption metrics rather than legislative mechanics. A missed window in Congress isn’t a delay measured in months. It’s a delay measured in election cycles. If the CLARITY Act fails now and Republicans lose their trifecta or their Senate majority in the 2026 midterms, the entire framework could need to be renegotiated with a different set of political incentives – or shelved indefinitely if crypto policy stops being a legislative priority at all. Lummis’s 2030 estimate is essentially a bet on how many congressional terms it typically takes for a stalled, politically contested bill to resurface with enough momentum to pass – and that’s not an unreasonable read of how Washington actually functions.
The Bill Has Already Survived a Gauntlet
What makes the stakes feel higher is how much groundwork has already gone into H.R. 3633. The House passed its version back in July 2025 with a lopsided 294-134 vote – genuine bipartisan support, not a party-line squeaker. The Senate Banking Committee advanced it 15-9. It survived a markup process that saw roughly 130 amendments filed and absorbed pushback in the form of about 8,000 opposition letters from the banking industry, which has its own reasons to be wary of a regulatory framework that could make crypto rails more competitive with traditional deposit and payment infrastructure.
Even some unlikely opposition has softened. The National Sheriffs’ Association, which had previously raised concerns likely tied to law enforcement and anti-money-laundering considerations, moved to a neutral position on September 6 – one less organized stakeholder actively working against the bill heading into the vote. That’s a meaningful signal. Bills don’t survive this many rounds of amendment and lobbying pressure by accident; something has kept it alive, and that something is a genuine, if fragile, coalition of interests that want regulatory clarity more than they want to keep fighting about the details.
What the Bill Would Actually Settle
It’s worth remembering what’s actually at stake substantively, because “market structure” is abstract enough to gloss over. The core fight the CLARITY Act tries to resolve is jurisdictional: which digital assets fall under the SEC’s securities framework, and which belong under the CFTC’s commodities framework. That sounds like inside-baseball regulatory turf war, but it has real consequences for anyone building or investing in crypto in the United States. Right now, that boundary is largely defined by SEC enforcement actions rather than statute – a “regulate by lawsuit” approach that leaves founders, exchanges, and investors guessing about which rules apply until a court says otherwise, sometimes years after a product has already launched.
A statutory framework would replace that guesswork with actual rules: clear registration pathways, defined disclosure requirements, and – notably – restrictions on how stablecoin issuers can offer yield, an area regulators have flagged as functionally resembling unregulated bank deposits. SEC Chair Paul Atkins has already signaled the agency is structurally ready to implement the bill the moment Congress acts, which suggests the regulatory apparatus, not just the political will, is primed for this to move fast if it clears the Senate.
Reading Between the Lines of Lummis’s Push
There’s a pattern worth noticing in how aggressively pro-crypto lawmakers have leaned into deadline framing over the past year. It’s not just Lummis – former White House crypto adviser David Sacks and SEC leadership have all used similar “act now or lose the window” language in recent weeks. That kind of coordinated urgency usually means insiders believe the coalition currently holding together is more fragile than it looks from the outside, and that letting the vote slip risks losing votes rather than gaining them over time.
There’s also a quieter subplot worth watching: reports suggest that filling the CFTC’s vacant commissioner seats has become an informal negotiating chip tied to the bill’s progress. If accurate, that means the vote isn’t purely about crypto policy on its own merits – it’s tangled up with broader personnel and political horse-trading at the White House level, the kind of dynamic that can derail otherwise-popular legislation for reasons that have nothing to do with its actual text.
What Happens After September 15, Either Way
If cloture passes, the bill moves toward a floor vote likely in late September, though “floor vote” still means further amendment fights over the most contested provisions – DeFi treatment and stablecoin yield restrictions chief among them. Passage isn’t guaranteed even then, but it becomes far more likely once formal debate opens, since procedural obstruction becomes harder to sustain politically the closer a bill gets to a final vote.
If cloture fails, expect the immediate crypto-market reaction to be muted rather than dramatic – prediction markets have already priced in fairly low odds for the bill’s near-term passage, hovering in the high-teens to low-twenties percent range, which suggests traders aren’t expecting a clean win regardless of the rhetoric. But the longer-term effect would be a continuation of the status quo that the industry has spent years complaining about: enforcement-driven regulation, an SEC that can define the rules of the game unilaterally through litigation, and continued uncertainty that pushes some crypto activity and capital toward jurisdictions with clearer rules, including parts of Europe and Asia that have already implemented comprehensive frameworks.
Conclusion
Strip away the political theater and Lummis’s warning is really a statement about how legislative windows work, not a prediction about crypto’s future. Bills like this don’t fail and quietly try again next session – they fail and wait for the next alignment of political will, committee leadership, and electoral outcomes, which can easily take years rather than months. Whether or not September 15 produces the 60 votes needed to move forward, the vote itself has become a useful stress test for something bigger than crypto policy: how much genuine, durable coalition exists in Washington for treating digital assets as a settled part of the financial system, rather than a recurring fight to be relitigated every time the political winds shift. That answer will matter to builders and investors long after this particular news cycle fades.
This post The Real Deadline Isn’t September 15. It’s the Calendar Itself. first appeared on BitcoinWorld.
2
293
Log in to explore more content
Join global crypto users on Binance Square
⚡️ Get latest and useful information about crypto.
💬 Trusted by the world’s largest crypto exchange.
👍 Discover real insights from verified creators.
Email / Phone number
Trending Topics
AppleDebutsFoldablePhone
24,900 views
516 Discussing
Apple just dropped the foldable iPhone — and the market is paying attention. This isn't just another product cycle; it's a new product category, a new CEO on stage, and a $1,999 price tag that pushes $AAPL further into ultra-premium territory. Foldables are the narrative, and Apple is now the headline.
#appledebutsfoldablephone #EUExtendsCentralContactPointToCASPs #US10YTreasuryYieldHitsHighestSinceNov2023 #BrentCrudeTops$100 #USTreasuryToBuyBackUpTo$6BLongDatedDebt
KimHotbae
·2 Likes
·2.7k views
TSMCAugustRevenueUp53.3%YoY
61 views
35 Discussing
IranSaysReadyToEscalateWarWithUS
2,580 views
96 Discussing