

Crypto Star 11
474 ໂພສ

Crypto Star 11
ລາຍງານ
ບລັອກຜູ້ໃຊ້
On a mission to help as many people as possible achieve financial freedom
258 ກໍາລັງຕິດຕາມ
258 ຜູ້ຕິດຕາມ
217 Liked
ໂພສ
ທັງໝົດ
ວົງຢືມ
ວີດີໂອ
ປັກໝຸດ
$SOL is ready for big move 🚀
I am expecting SOL can move toward $300 to $500. SOL have great potential and I am keeping my eyes on this coin.
The SOL bull run is now very close 🔥
I think this can be one of the coins that give a very strong move in the coming months.
Keep SOL on your watchlist and be ready for the move 🚀🐺
$SOL #BullRunTips

10
18
18.9k
ປັກໝຸດ
$SOL & $ZEC buyers in the next few months.
$SOL & $ZEC buyers in the next few months.
2
1
5
2.2k
$ZEC TO $10K–$15K? THE NEXT CRYPTO GIANT? 👀🐂
📊 ZEC Fundamentals: 🔹 Max Supply: 21 Million ZEC 🔹 Market Cap: ~$20.6 Billion 🔹 Privacy-focused blockchain powered by zero-knowledge cryptography. 🔹 Bitcoin-like scarcity with a fixed maximum supply. 🔹 Growing interest in financial privacy could drive future adoption.
📈 The monthly and weekly charts are showing strong potential to the upside.
🎯 My long-term target: $10,000–$15,000!
Imagine what could happen if ZEC captures a much larger share of the crypto market during the next bull run. 🔥
👀 Can ZEC outperform ETH and BNB?
#ZEC #Zcash #Crypto 🚀

209

2015 - You missed $ETH
2016 - You missed $ZEC
2017 - You missed $BNB
2018 - You missed $UNI
2019 - You missed $LINK
2020 - You missed $AAVE
2021 - You missed $SOL
2022 - You missed $ARB
2023 - You missed $SUI
2024 - You missed $PUMP
2025 - You missed $HYPE
2026 - What opportunity are you NOT letting slip away? 👀🚀
#Crypto #Altcoins #Bitcoin
83
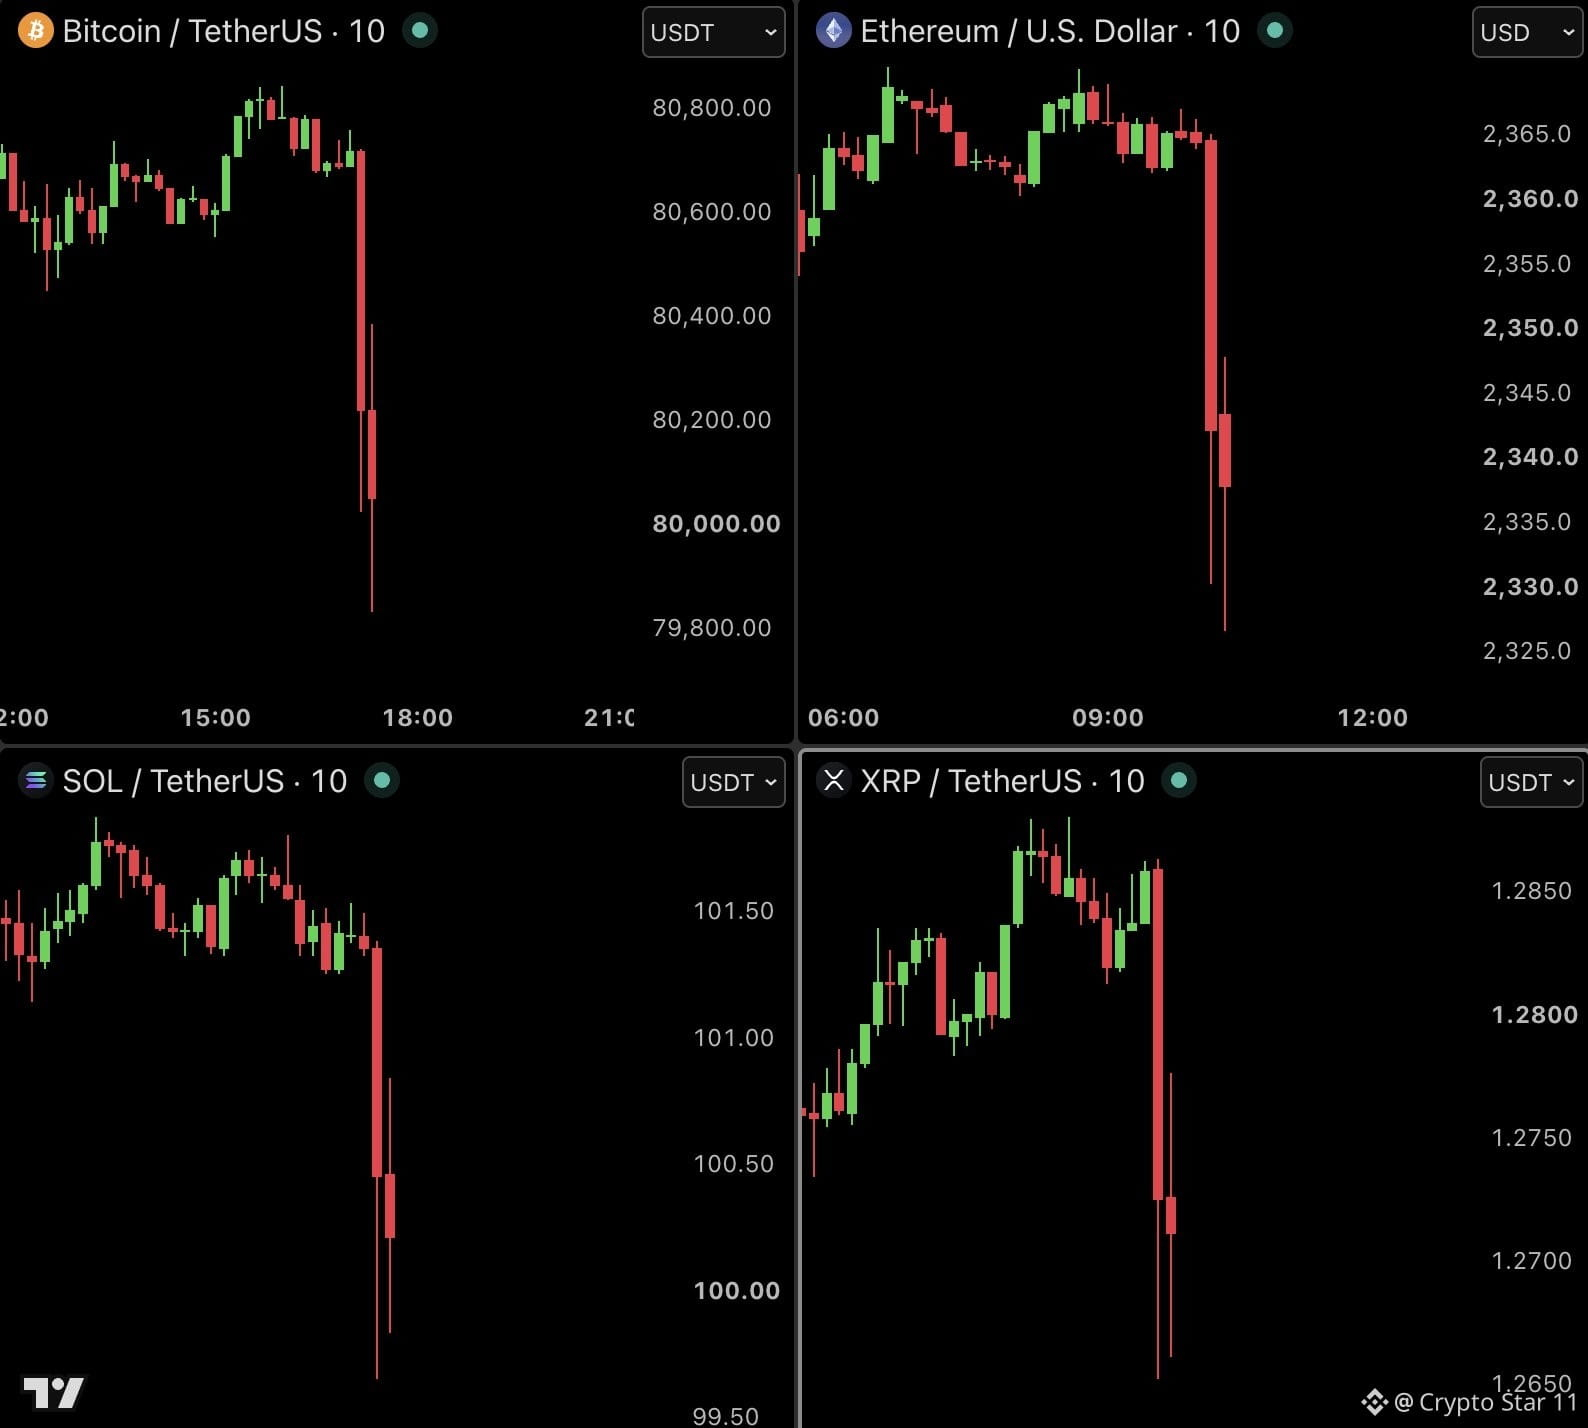
TRUMP CONFIRMED THAT ALL $XRP HOLDERS ARE GOING TO BE RICH!
If you hold 5000+ XRP today... you might already be a millionaire you just don't realize it yet." Don't hold in cold wallet!
XRP going to the Moon! Once $XRP breaks through $4, expect a massive surge towards a $1,000-$10,000 XRP price range which is now a REAL possibility!!
#Trump #XRP #Bullrun
If you hold 5000+ XRP today... you might already be a millionaire you just don't realize it yet." Don't hold in cold wallet!
XRP going to the Moon! Once $XRP breaks through $4, expect a massive surge towards a $1,000-$10,000 XRP price range which is now a REAL possibility!!
#Trump #XRP #Bullrun


6
7
5.2k
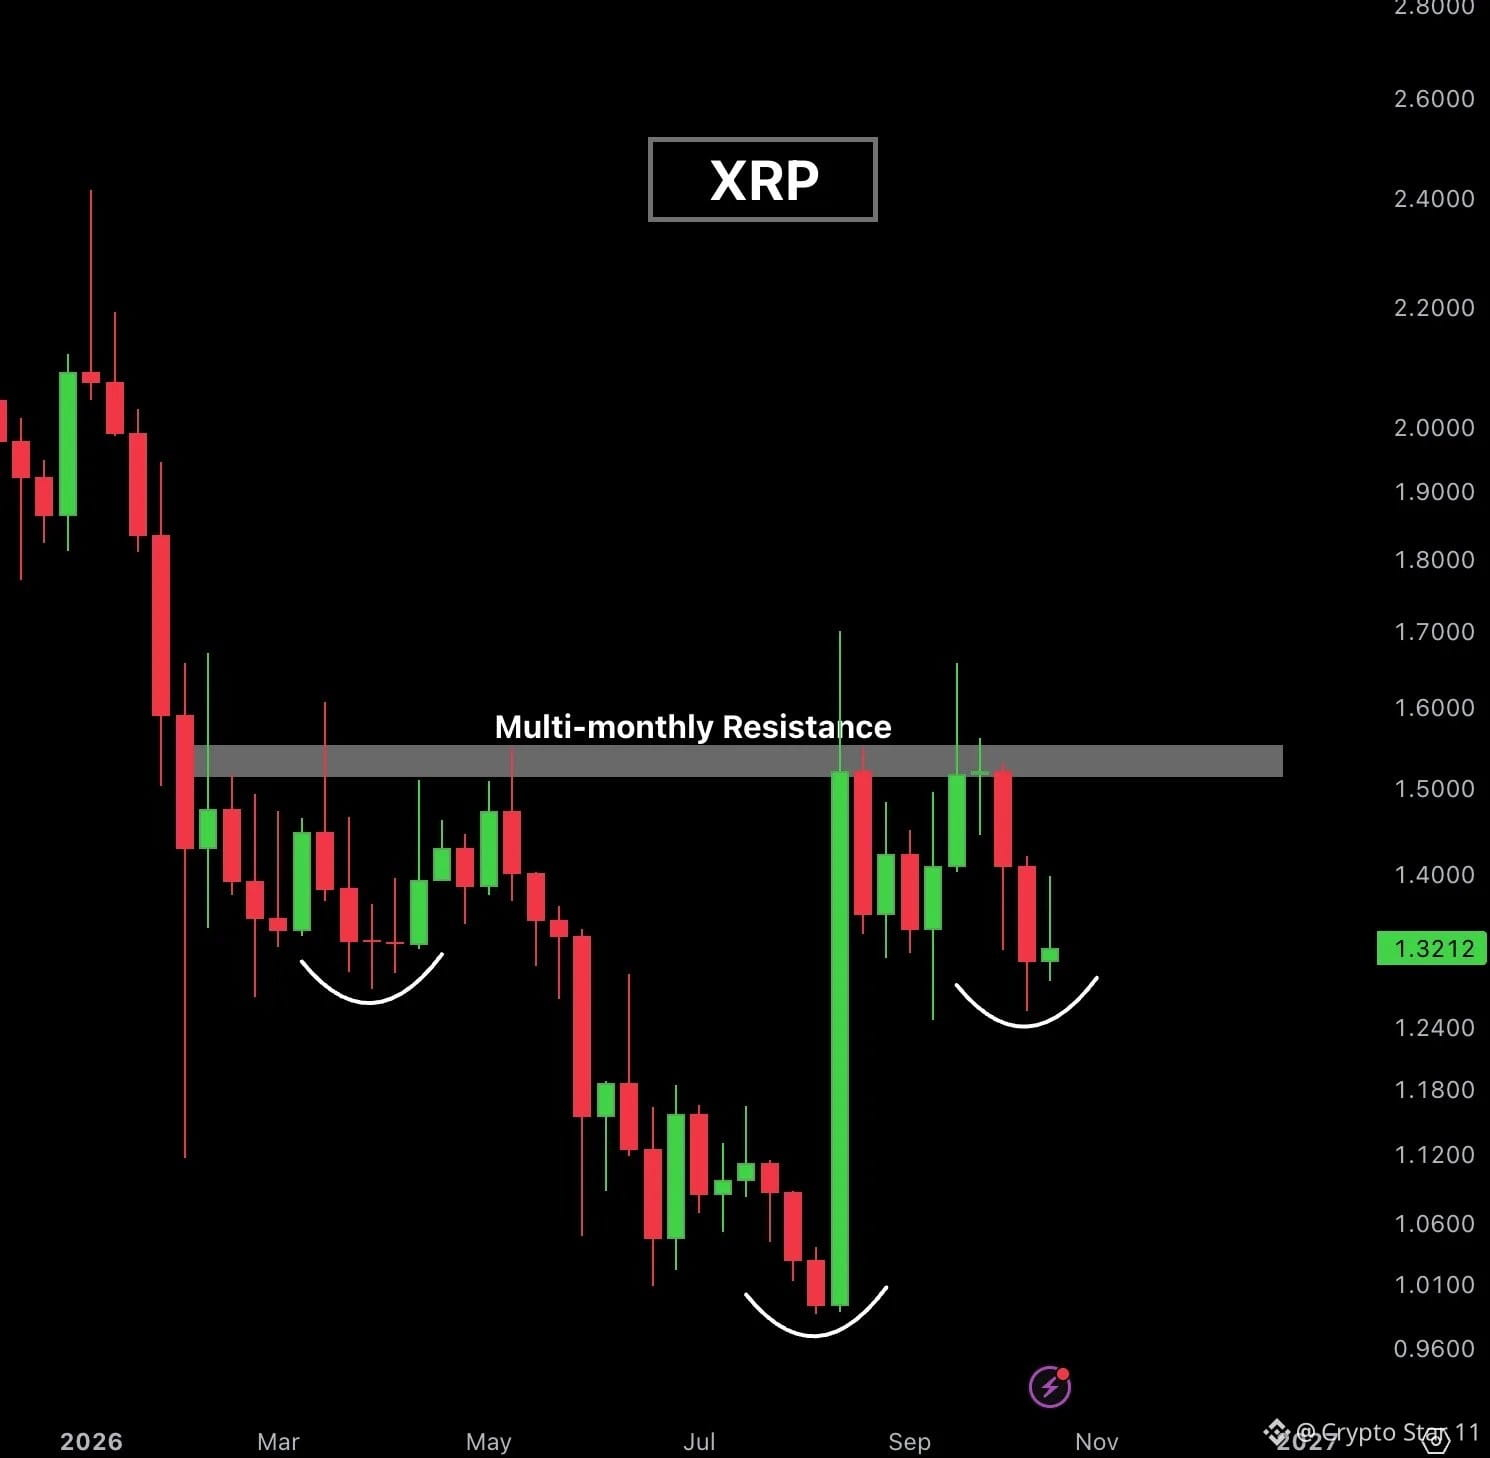
$XRP has been consolidating below this major resistance for months. 👀
The longer it stays below this level, the more important the breakout becomes.
🔥 Once bulls finally break through and hold above this resistance, $2 could be the next major target.
Patience is key. Let's see when XRP makes its move. 🚀
The longer it stays below this level, the more important the breakout becomes.
🔥 Once bulls finally break through and hold above this resistance, $2 could be the next major target.
Patience is key. Let's see when XRP makes its move. 🚀
411
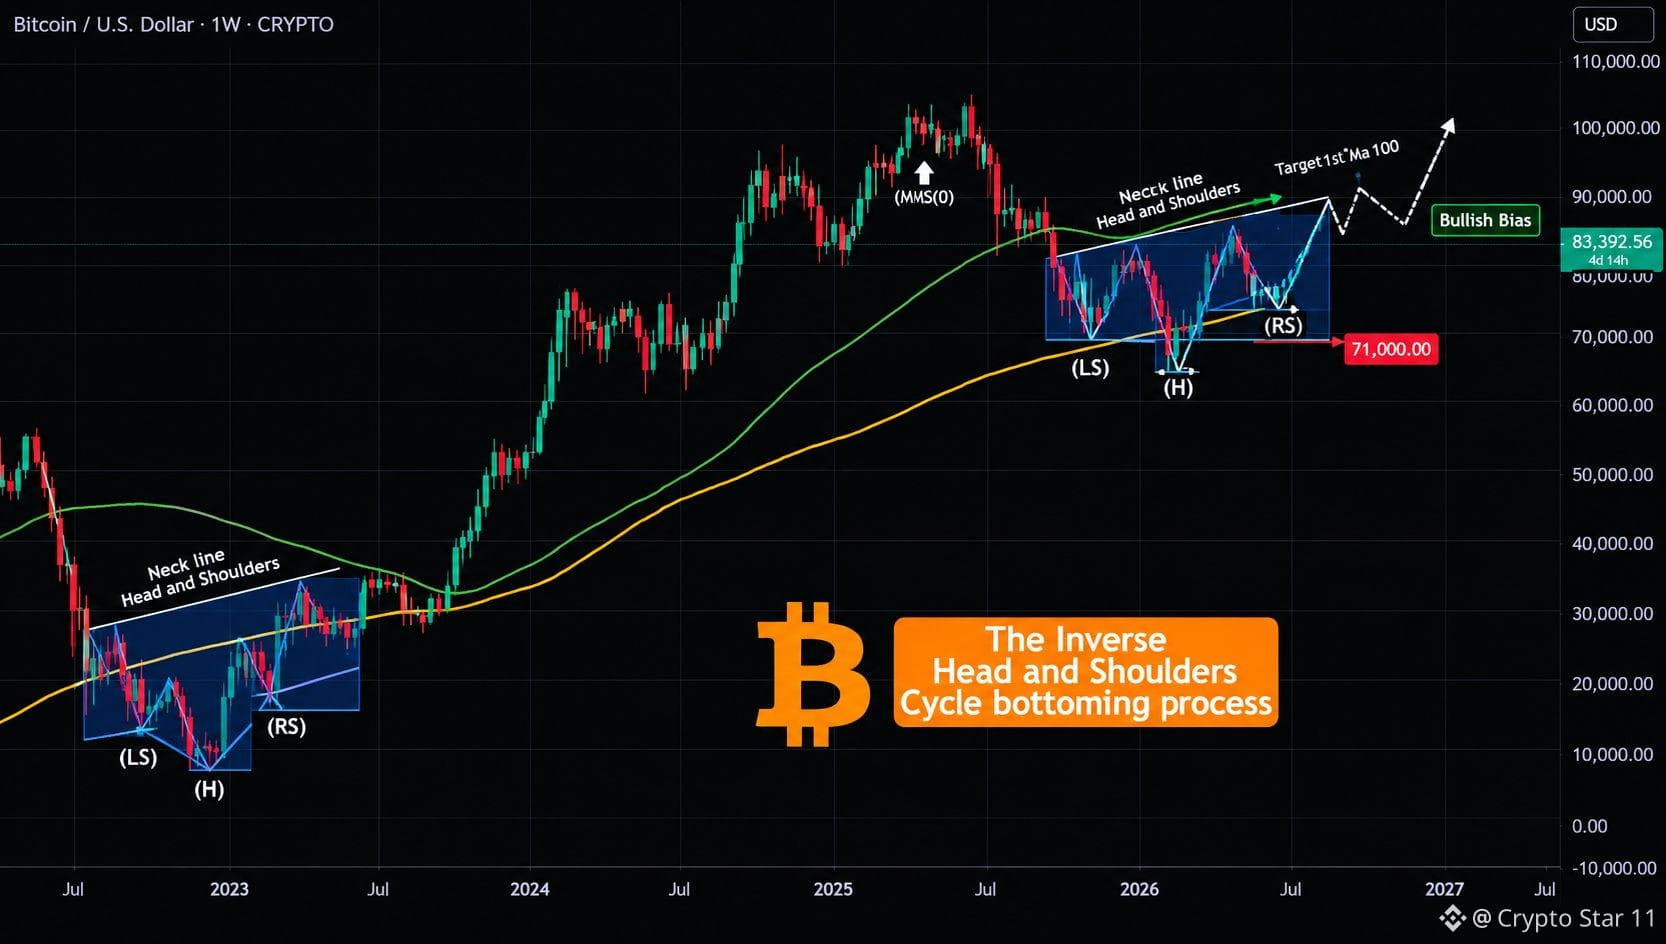
Bitcoin (BTCUSD) has been following closely the late 2022 – early 2023 cycle-bottoming process, which formed an Inverse Head and Shoulders (IH&S) pattern that transitioned the market from a bear to a bull cycle.
This time, the 1W MA100 (green trendline) appears to be acting as resistance, potentially pushing BTC lower to complete the Right Shoulder (RS) of the IH&S pattern.
In 2023, BTC formed a Higher Low near the 0.5 Fibonacci retracement level. The bearish move began after a daily candle closed below the 1D MA50 (black trendline).
If BTC closes below the 1D MA50, we could see a test of the 0.5 Fib level around $71,000. A further drop toward the 1W MA200 near $68,000 cannot be ruled out.
Could this pullback complete the IH&S pattern and trigger a new long-term uptrend toward and beyond $100,000?
What’s your view? Share your thoughts in the comments! 📊
87
$DOT — $100 IN THE NEXT BULL RUN? 🚀
📊 $DOT may be setting up for a potential reversal after sweeping sell-side liquidity.
🔥 Bullish targets to watch: 🎯 $10 → $20 → $30 → $100
💎 Why watch Polkadot? 🔹 Cross-chain interoperability 🔹 Web3 infrastructure 🔹 Parachain ecosystem 🔹 Potential upside in a strong altcoin bull run
👀 Keep $DOT on your radar. Watch for bullish confirmation before making any move.
⚠️ These are speculative targets, NOT guaranteed prices. Always manage your risk.
🐺 Stay alert!
#DOT #Polkadot #Crypto #Altcoins
141
58
$BTC — TWO MAJOR LIQUIDITY CLUSTERS ABOVE! 🎯
Bitcoin has two key liquidity targets to the upside:
📍 $84,500
📍 $87,500
If BTC secures a weekly close above $83K, expect price to target these liquidity zones.
#bitcion
$BTC — TWO MAJOR LIQUIDITY CLUSTERS ABOVE! 🎯
Bitcoin has two key liquidity targets to the upside:
📍 $84,500
📍 $87,500
If BTC secures a weekly close above $83K, expect price to target these liquidity zones.
#bitcion
Bitcoin has two key liquidity targets to the upside:
📍 $84,500
📍 $87,500
If BTC secures a weekly close above $83K, expect price to target these liquidity zones.
#bitcion
86
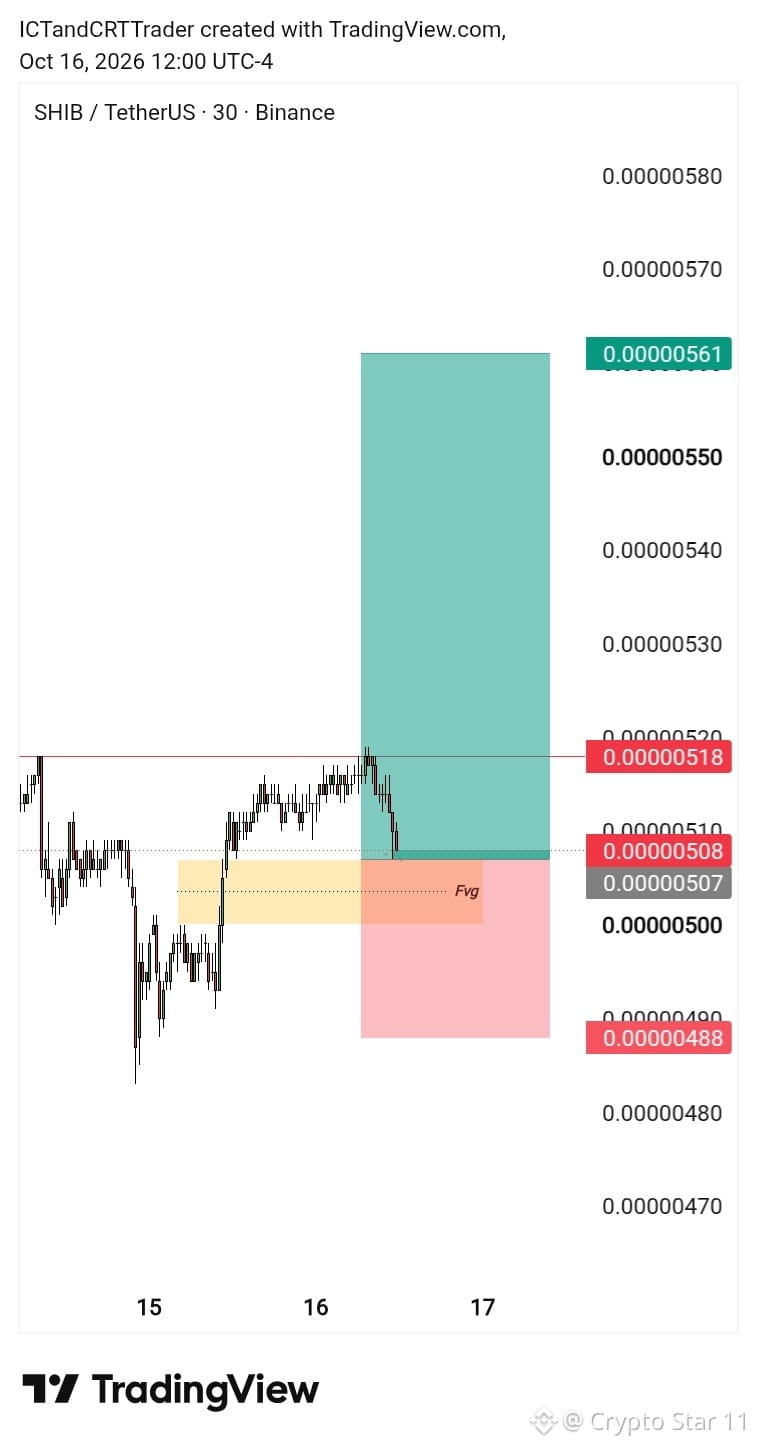
🐺 $ZECUSDT — LONG SETUP 🚦📈
🟢 Entry: 1181
🎯 TP1: 1300
🎯 TP2: 1450
🎯 TP3: 1600
🎯 TP4: 1700
🛑 Stop Loss: 1070
🐺 $ZECUSDT — LONG SETUP 🚦📈
🟢 Entry: 1181
🎯 TP1: 1300
🎯 TP2: 1450
🎯 TP3: 1600
🎯 TP4: 1700
🛑 Stop Loss: 1070
🟢 Entry: 1181
🎯 TP1: 1300
🎯 TP2: 1450
🎯 TP3: 1600
🎯 TP4: 1700
🛑 Stop Loss: 1070
86

ບົດຄວາມ
BITCOIN AT A CRITICAL BREAKOUT ZONE! 🚨 $BTCUSD — BIG MOVE LOADING?Bitcoin (BTCUSD) is consolidating around 83,392 after a sharp decline from higher levels. Price is currently moving within a defined range, with repeated reactions between the upper resistance area around 83,700-84,100 and the lower support zone near 80,550-80,850. The market remains indecisive, making the next breakout or breakdown important for determining the short-term direction.
The highlighted support zone is a key area to monitor. If sellers maintain control and price breaks below support, further downside could develop. However, if buyers defend the zone and momentum improves, Bitcoin could attempt a recovery toward the upper boundary of the range.
Key Support Zone: 80,550-80,850
Resistance Area: 83,700-84,100
Current Price Area: 83,392
Timeframe: 2H
Technical Structure
1. Support Zone - 80,550-80,850:
This region represents an important support area where buyers previously stepped in. Holding above this zone could help Bitcoin maintain its consolidation structure. A decisive breakdown below support would increase bearish pressure.
2. Resistance Area - 83,700-84,100:
The upper boundary is acting as a key barrier, with price showing repeated reactions around this region. A clean breakout and sustained hold above resistance could strengthen the bullish outlook.
3. Price Consolidation:
BTCUSD is trading within a broad range following its previous decline. Repeated rejections and recoveries suggest that neither buyers nor sellers have established clear control. A confirmed move outside the range could provide a stronger directional signal.
4. Moving Averages:
Price is trading near the moving averages, reflecting short-term indecision. A sustained move above these levels could support recovery, while renewed selling pressure may bring the lower support zone back into focus.
Possible Scenarios
Bullish Scenario:
If BTCUSD breaks above the 83,700-84,100 resistance area and holds, further upside may develop. Confirmation is needed before considering a sustained bullish continuation.
Bearish Scenario:
If price faces another rejection from resistance and breaks below the 80,550-80,850 support zone, selling pressure could increase and expose Bitcoin to further downside.
Bitcoin remains in a consolidation phase, with resistance limiting upside and the lower support zone providing an important reference for buyers. The next confirmed breakout or breakdown will be crucial in determining the market's short-term direction.
BITCOIN AT A CRITICAL BREAKOUT ZONE! 🚨 $BTCUSD — BIG MOVE LOADING?
Bitcoin (BTCUSD) is consolidating around 83,392 after a sharp decline from higher levels. Price is currently moving within a defined range, with repeated reactions between the upper resistance area around 83,700-84,100 and the lower support zone near 80,550-80,850. The market remains indecisive, making the next breakout or breakdown important for determining the short-term direction.
The highlighted support zone is a key area to monitor. If sellers maintain control and price breaks below support, further downside could develop. However, if buyers defend the zone and momentum improves, Bitcoin could attempt a recovery toward the upper boundary of the range.
Key Support Zone: 80,550-80,850
Resistance Area: 83,700-84,100
Current Price Area: 83,392
Timeframe: 2H
Technical Structure
1. Support Zone - 80,550-80,850:
This region represents an important support area where buyers previously stepped in. Holding above this zone could help Bitcoin maintain its consolidation structure. A decisive breakdown below support would increase bearish pressure.
2. Resistance Area - 83,700-84,100:
The upper boundary is acting as a key barrier, with price showing repeated reactions around this region. A clean breakout and sustained hold above resistance could strengthen the bullish outlook.
3. Price Consolidation:
BTCUSD is trading within a broad range following its previous decline. Repeated rejections and recoveries suggest that neither buyers nor sellers have established clear control. A confirmed move outside the range could provide a stronger directional signal.
4. Moving Averages:
Price is trading near the moving averages, reflecting short-term indecision. A sustained move above these levels could support recovery, while renewed selling pressure may bring the lower support zone back into focus.
Possible Scenarios
Bullish Scenario:
If BTCUSD breaks above the 83,700-84,100 resistance area and holds, further upside may develop. Confirmation is needed before considering a sustained bullish continuation.
Bearish Scenario:
If price faces another rejection from resistance and breaks below the 80,550-80,850 support zone, selling pressure could increase and expose Bitcoin to further downside.
Bitcoin remains in a consolidation phase, with resistance limiting upside and the lower support zone providing an important reference for buyers. The next confirmed breakout or breakdown will be crucial in determining the market's short-term direction.
66
ETH: Buyers Defend $2,500 as the Next Rally Setup Builds
On all timeframes, ETH is in a clear uptrend.
Currently, ETH is moving down as part of a larger corrective move.
You can look to buy ETH near 2400 - 2450 before the price moves back up. So, wait for this downward correction to end first.
On the downside, we can see that ETH has already stalled multiple times near 2400, thus increasing the chances of the upward move happening again.
Upward targets:
2575
2640
2760
You can find more details on the chart.
Thank you!

364
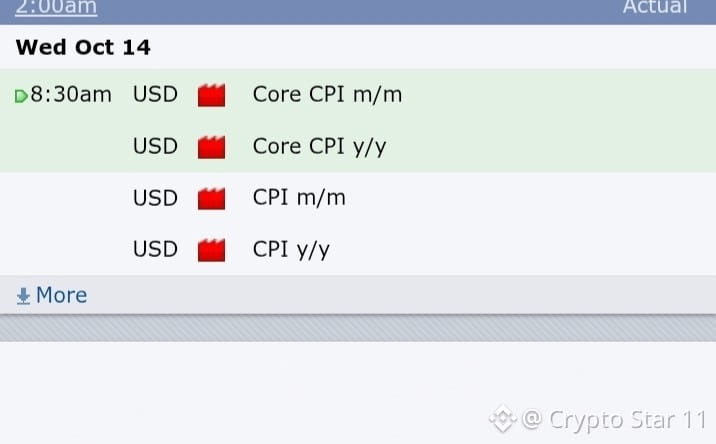
🚨 CPI Today, TRADERS! 📊
Expect high volatility and fast moves. ⚡ Don’t rush into trades—wait for confirmation and follow your plan.
🐺 Protect your capital. Stay patient. Trade smart. ❤️
🚨 CPI Today, TRADERS! 📊
Expect high volatility and fast moves. ⚡ Don’t rush into trades—wait for confirmation and follow your plan.
🐺 Protect your capital. Stay patient. Trade smart. ❤️
Expect high volatility and fast moves. ⚡ Don’t rush into trades—wait for confirmation and follow your plan.
🐺 Protect your capital. Stay patient. Trade smart. ❤️
56
BITCOIN Bull Cycle Target Zone:
$160-180k
Bitcoin (BTCUSD) on its past three Bull Cycles it has always topped on a 9-year Higher Highs trend-line, dating back to December 2017. At the same time, the last two Cycle Tops formed 1430 days after the previous one.
Based on these, assuming the current BTC Bull Cycle follows roughly the last two, we can expect a Profit Taking Zone within the $160000-$180000 range before the Bull Cycles touches the Higher Highs trend-line again.
Do you agree, you think it will be higher or lower? Feel free to let us know in the comments section below!
#bitcion #Bullrun

1
579
ບົດຄວາມ
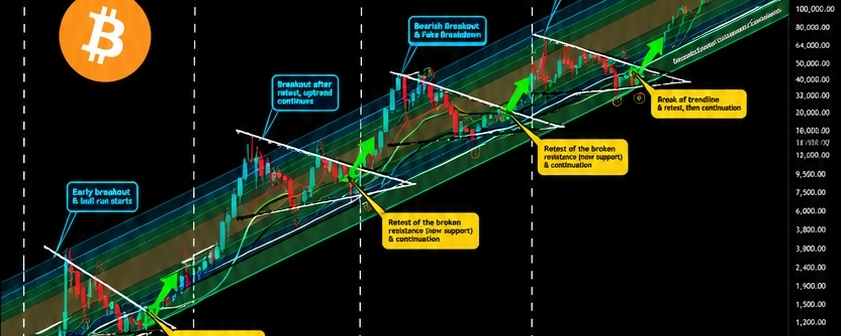
BITCOIN: The 4th Major Bullish Triangle Pattern Is Taking Shape! 🚀📈Hello Community,
welcome to my new analysis of BITCOIN and its underlying historical bullish triangle developments. BITCOIN, in the current state of the market, is trading in a decisive development as the sentiment switches from bearish to bullish, since BITCOIN has bounced heavily in the range. This dynamic aligns with the major formation pattern I have spotted in BITCOIN. In my analysis, I identified the key signs to consider.
When looking at my chart, we can see how BITCOIN trades in this gigantic historical ascending channel formation. With the several bounces off the historical bullish accumulation channel, there is a major historical uptrend ongoing. These bounces were always supported by the several bullish triangle formations seen in my chart. BITCOIN is forming the same triangle formation once again, completing the wave count and bouncing off the boundary.
In past patterns, the most important trigger point of BITCOIN going from a breakout into a full bull market was always confirmed when BITCOIN bounced above the 50-WMA, as it can be seen in my chart. This was also the point at which the bullish acceleration continued to bounce within the orange middle channel of the broader ascending channel. BITCOIN recently bounced above the 50-WMA, which is the confirmation step for the next uptrend developments to follow through.
In this manner, thank you a lot for watching! Support is highly appreciated.
BITCOIN: The 4th Major Bullish Triangle Pattern Is Taking Shape! 🚀📈
Hello Community,
welcome to my new analysis of BITCOIN and its underlying historical bullish triangle developments. BITCOIN, in the current state of the market, is trading in a decisive development as the sentiment switches from bearish to bullish, since BITCOIN has bounced heavily in the range. This dynamic aligns with the major formation pattern I have spotted in BITCOIN. In my analysis, I identified the key signs to consider.
When looking at my chart, we can see how BITCOIN trades in this gigantic historical ascending channel formation. With the several bounces off the historical bullish accumulation channel, there is a major historical uptrend ongoing. These bounces were always supported by the several bullish triangle formations seen in my chart. BITCOIN is forming the same triangle formation once again, completing the wave count and bouncing off the boundary.
In past patterns, the most important trigger point of BITCOIN going from a breakout into a full bull market was always confirmed when BITCOIN bounced above the 50-WMA, as it can be seen in my chart. This was also the point at which the bullish acceleration continued to bounce within the orange middle channel of the broader ascending channel. BITCOIN recently bounced above the 50-WMA, which is the confirmation step for the next uptrend developments to follow through.
In this manner, thank you a lot for watching! Support is highly appreciated.
111
67
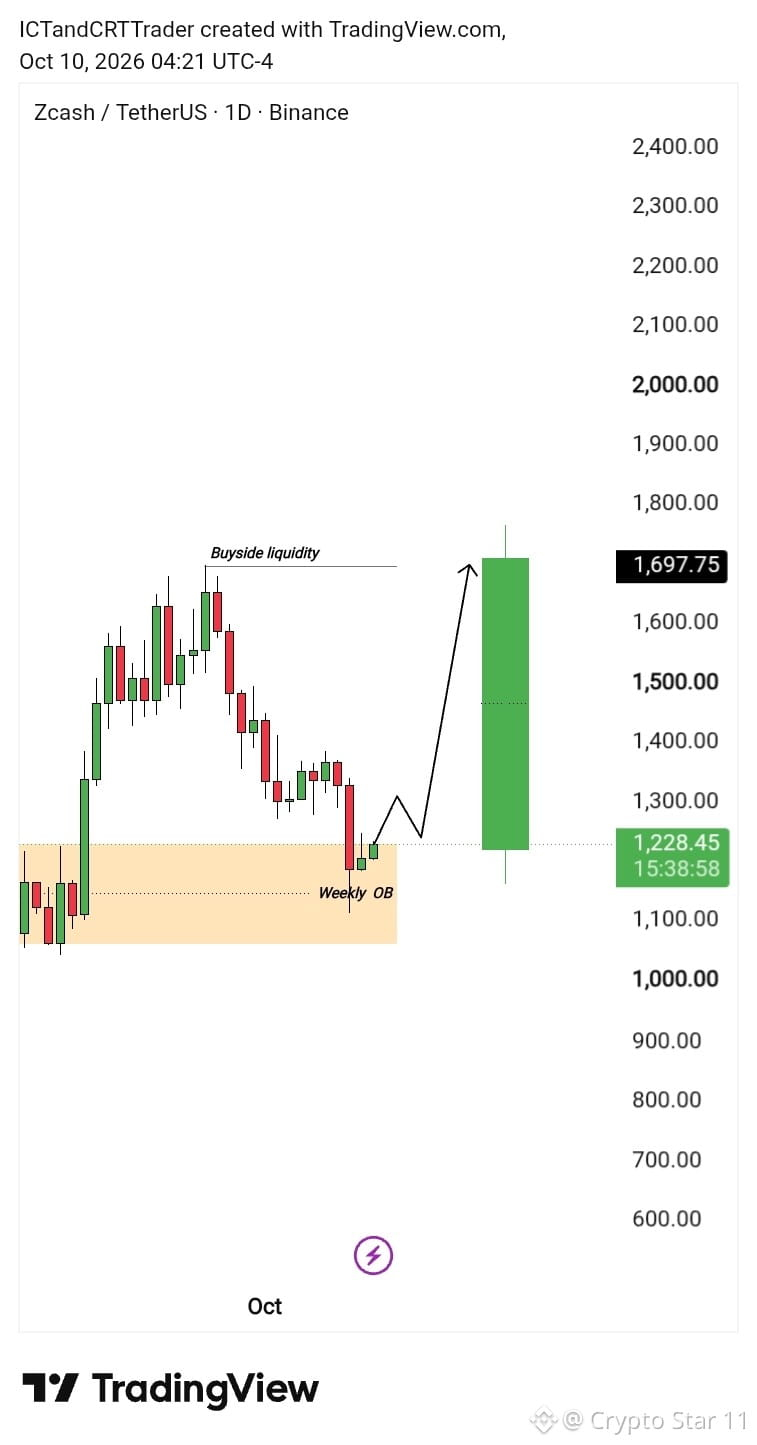
$ZECUSDT — Bearish Move May Be Over 👀
I'm watching ZEC for a potential bullish move from the Weekly Institutional Order Block (OB). 🐂
This is a key area to watch for buyers, but confirmation is important before any entry.
⚠️ Avoid rushing into shorts. Watch price action around this zone.
#ZECUSD
$ZECUSDT — Bearish Move May Be Over 👀
I'm watching ZEC for a potential bullish move from the Weekly Institutional Order Block (OB). 🐂
This is a key area to watch for buyers, but confirmation is important before any entry.
⚠️ Avoid rushing into shorts. Watch price action around this zone.
#ZECUSD
I'm watching ZEC for a potential bullish move from the Weekly Institutional Order Block (OB). 🐂
This is a key area to watch for buyers, but confirmation is important before any entry.
⚠️ Avoid rushing into shorts. Watch price action around this zone.
#ZECUSD
226
ເຂົ້າສູ່ລະບົບເພື່ອສຳຫຼວດເນື້ອຫາເພີ່ມເຕີມ
ເຂົ້າຮ່ວມກຸ່ມຜູ້ໃຊ້ຄຣິບໂຕທົ່ວໂລກໃນ Binance Square.
⚡️ ໄດ້ຮັບຂໍ້ມູນຫຼ້າສຸດ ແລະ ທີ່ມີປະໂຫຍດກ່ຽວກັບຄຣິບໂຕ.
💬 ໄດ້ຮັບຄວາມໄວ້ວາງໃຈຈາກຕະຫຼາດແລກປ່ຽນຄຣິບໂຕທີ່ໃຫຍ່ທີ່ສຸດໃນໂລກ.
👍 ຄົ້ນຫາຂໍ້ມູນເຊີງເລິກທີ່ແທ້ຈາກນັກສ້າງທີ່ໄດ້ຮັບການຢືນຢັນ.
ອີເມວ / ເບີໂທລະສັບ
ຫົວຂໍ້ທີ່ກໍາລັງນິຍົມ
BinancePick
2.6M ຄັ້ງທີ່ເບິ່ງ
142,481 ກຳລັງສົນທະນາ
Join #EarningsSeason: Predict Earnings on Binance Pick, Share Your Take on Binance Square!
Binance Square Official
·402 ຖືກໃຈ
·338.7k ຄັ້ງທີ່ເບິ່ງ
EarningsSeason
5M ຄັ້ງທີ່ເບິ່ງ
24,468 ກຳລັງສົນທະນາ
SouthKoreaReportedlyWeighsFourthCryptoTaxDelay
0 ຄັ້ງທີ່ເບິ່ງ
0 ກຳລັງສົນທະນາ