
Siyam3678
3.6k ໂພສ

Siyam3678
ລາຍງານ
ບລັອກຜູ້ໃຊ້
🐳 Crypto Whale Tracker | 📊 Daily Market Analysis & Insights | 🚀 Spot & Futures Trading Tips | Helping you grow your portfolio safely.
ຜູ້ຊື້ຂາຍປະຈໍາ
7.4 ເດືອນ
28 ກໍາລັງຕິດຕາມ
161 ຜູ້ຕິດຕາມ
590 Liked
ໂພສ
ທັງໝົດ
ວົງຢືມ
ຖ່າຍທອດສົດ
·
--
ສັນຍານກະທິງ
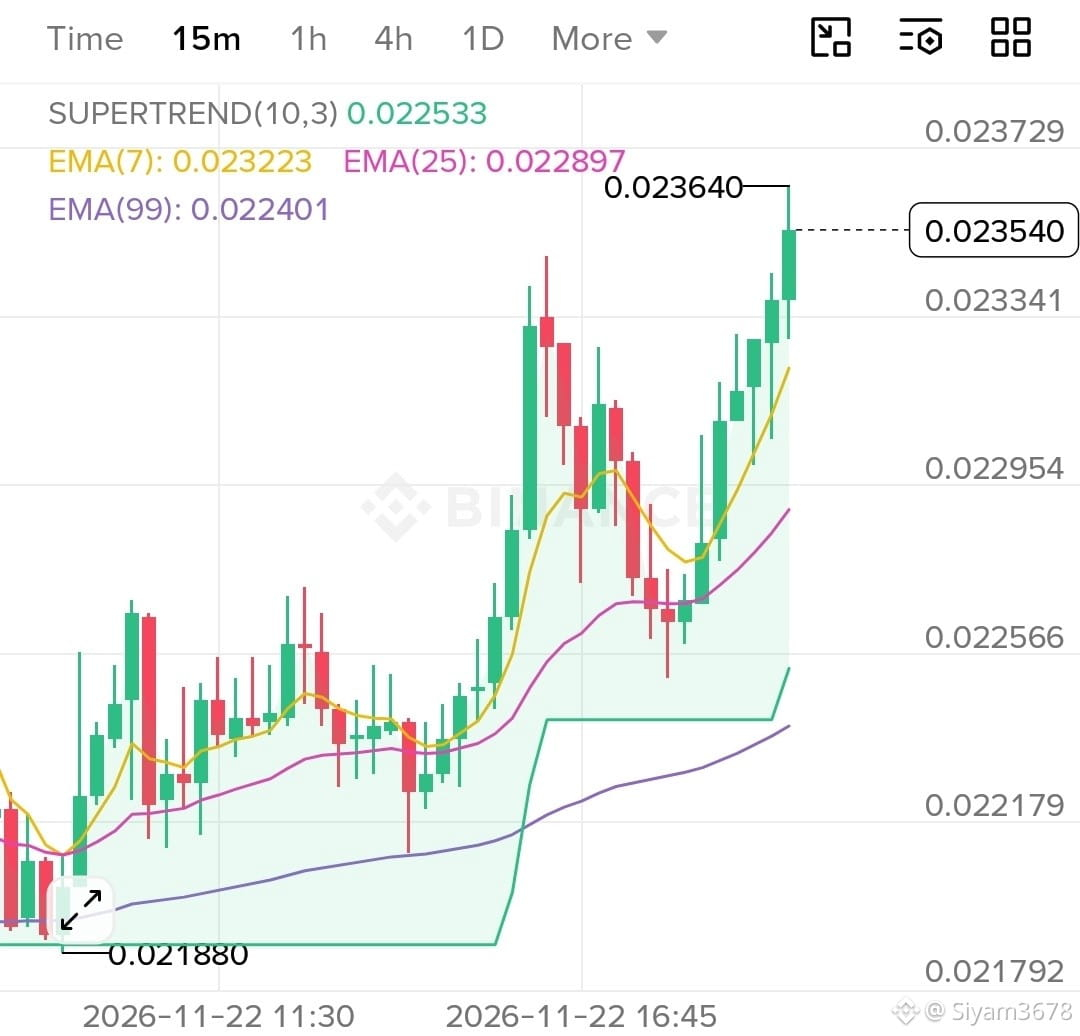
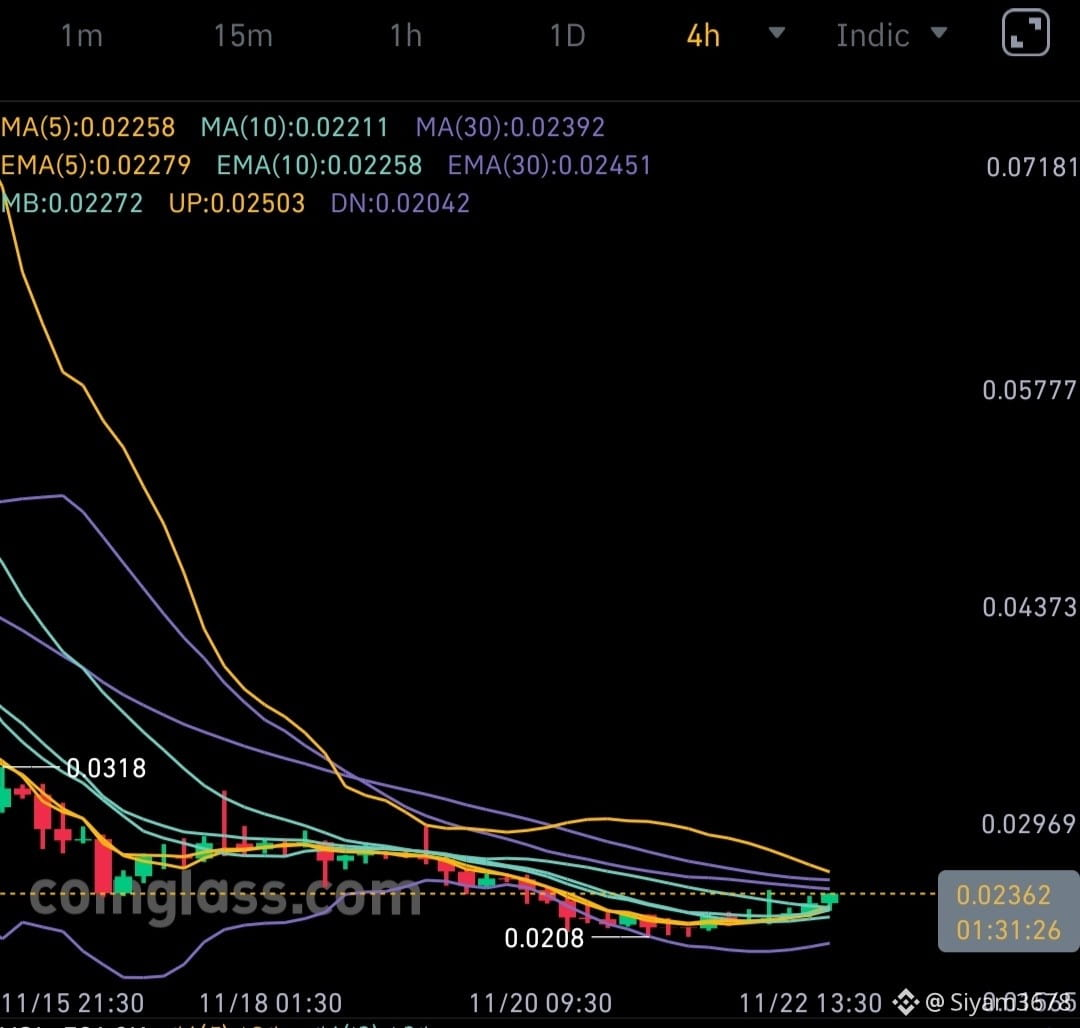
🟢 $AGT The squeeze candle just swept the breakout high and reclaimed the mid-band on expanding volume, and price is now knocking on the 0.0245 EMA shelf where the entire downtrend gets tested.
{future}(AGTUSDT)
🟢 $AGT The squeeze candle just swept the breakout high and reclaimed the mid-band on expanding volume, and price is now knocking on the 0.0245 EMA shelf where the entire downtrend gets tested.
1
199
·
--
ສັນຍານກະທິງ
🟢 $XAU Buyers are quietly defending the base above the flush low while sellers keep capping every rally at the 3,579 mid-band shelf, and the coil between those two lines is getting tighter by the session. The way dips keep getting bought into the EMA cluster tells me this range is being accumulated, not distributed — I'd rather own the range low than chase the break.
Are you fading rallies or buying dips until this coil resolves?
{future}(XAUUSDT)
🟢 $XAU Buyers are quietly defending the base above the flush low while sellers keep capping every rally at the 3,579 mid-band shelf, and the coil between those two lines is getting tighter by the session. The way dips keep getting bought into the EMA cluster tells me this range is being accumulated, not distributed — I'd rather own the range low than chase the break.
Are you fading rallies or buying dips until this coil resolves?
Are you fading rallies or buying dips until this coil resolves?
1
128
·
--
ສັນຍານກະທິງ
🟢 $NIGHT Price has ripped straight into the 0.0478 supply zone where the last two rallies died, so this tag deserves respect, not chase entries. My plan is simple: wait for a higher-low hold on the pullback or a clean reclaim above the old high before joining the trend.
{future}(NIGHTUSDT)
🟢 $NIGHT Price has ripped straight into the 0.0478 supply zone where the last two rallies died, so this tag deserves respect, not chase entries. My plan is simple: wait for a higher-low hold on the pullback or a clean reclaim above the old high before joining the trend.
1
126
·
--
ສັນຍານກະທິງ
🟢 $SOXL
The bounce off the capitulation low just reclaimed the short-term EMA shelf and is grinding into the 24h high, with the lower-timeframe Supertrend flipped green and volume expanding on the impulse. I'm not buying the tag of the high itself — I want a flush back into the reclaimed shelf or a clean break above it, nothing in between.
Watch Zone: 33.30 - 33.60
Invalidation: 30.85
{future}(SOXLUSDT)
🟢 $SOXL
The bounce off the capitulation low just reclaimed the short-term EMA shelf and is grinding into the 24h high, with the lower-timeframe Supertrend flipped green and volume expanding on the impulse. I'm not buying the tag of the high itself — I want a flush back into the reclaimed shelf or a clean break above it, nothing in between.
Watch Zone: 33.30 - 33.60
Invalidation: 30.85
The bounce off the capitulation low just reclaimed the short-term EMA shelf and is grinding into the 24h high, with the lower-timeframe Supertrend flipped green and volume expanding on the impulse. I'm not buying the tag of the high itself — I want a flush back into the reclaimed shelf or a clean break above it, nothing in between.
Watch Zone: 33.30 - 33.60
Invalidation: 30.85
1
234
·
--
ສັນຍານກະທິງ
🟢 $ANT Price is stacking higher lows above the crash low and just reclaimed the short-term EMA shelf, pressing into the 91.85 mid-band where the last two rallies got sold. I want a clean 4H close above that band before trusting the squeeze — until then this is just a base building under resistance.
Key 4H Levels: Resistance 92.25 | Support 87.00
{future}(ANTUSDT)
🟢 $ANT Price is stacking higher lows above the crash low and just reclaimed the short-term EMA shelf, pressing into the 91.85 mid-band where the last two rallies got sold. I want a clean 4H close above that band before trusting the squeeze — until then this is just a base building under resistance.
Key 4H Levels: Resistance 92.25 | Support 87.00
Key 4H Levels: Resistance 92.25 | Support 87.00
1
196
·
--
ສັນຍານກະທິງ
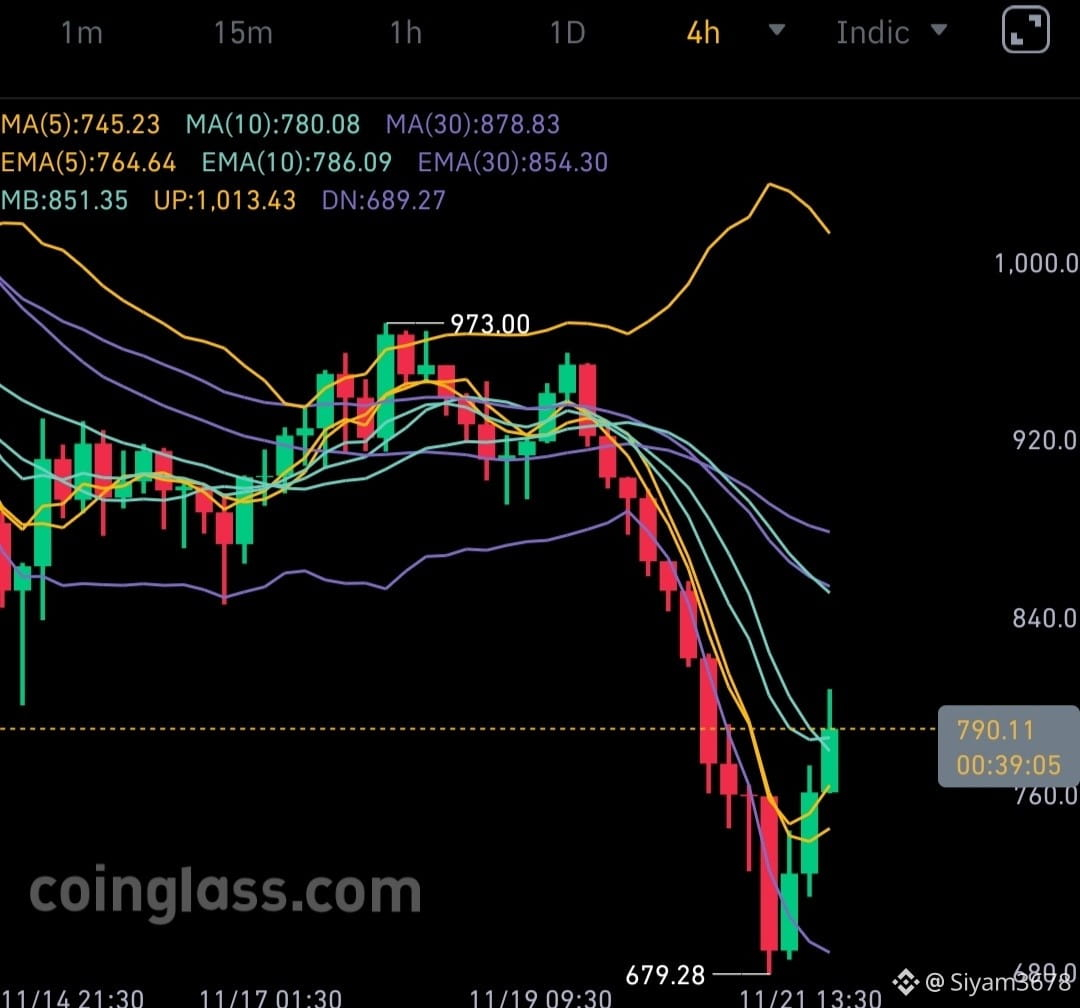
🟢 $ZEC The bounce off the double-bottom flush reclaimed the short-term EMA shelf on the lower timeframe, and price is now coiling under the round-number handle with the higher-timeframe Supertrend acting as the magnet above. I'd rather load the dip into the 780 shelf than chase the squeeze candle, since a successful retest there is what separates a clean reversal from a dead-cat bounce.
Entry: 778.00 | SL: 748.00 | Targets: 810.00 - 844.00 - 880.00
Are you loading the retest or waiting for a breakout close?
{future}(ZECUSDT)
🟢 $ZEC The bounce off the double-bottom flush reclaimed the short-term EMA shelf on the lower timeframe, and price is now coiling under the round-number handle with the higher-timeframe Supertrend acting as the magnet above. I'd rather load the dip into the 780 shelf than chase the squeeze candle, since a successful retest there is what separates a clean reversal from a dead-cat bounce.
Entry: 778.00 | SL: 748.00 | Targets: 810.00 - 844.00 - 880.00
Are you loading the retest or waiting for a breakout close?
Entry: 778.00 | SL: 748.00 | Targets: 810.00 - 844.00 - 880.00
Are you loading the retest or waiting for a breakout close?
1
388
·
--
ສັນຍານກະທິງ
🟢 $PIEVERSE This ramp is a pure short-squeeze ladder riding the upper band, and chasing green candles this stretched is how retail becomes exit liquidity. I'm letting price cool back into the reclaimed EMA shelf near 3.50 before even thinking about longs — if it never tags my zone, I miss the move, not my capital.
{future}(PIEVERSEUSDT)
🟢 $PIEVERSE This ramp is a pure short-squeeze ladder riding the upper band, and chasing green candles this stretched is how retail becomes exit liquidity. I'm letting price cool back into the reclaimed EMA shelf near 3.50 before even thinking about longs — if it never tags my zone, I miss the move, not my capital.
2
906
·
--
ສັນຍານກະທິງ
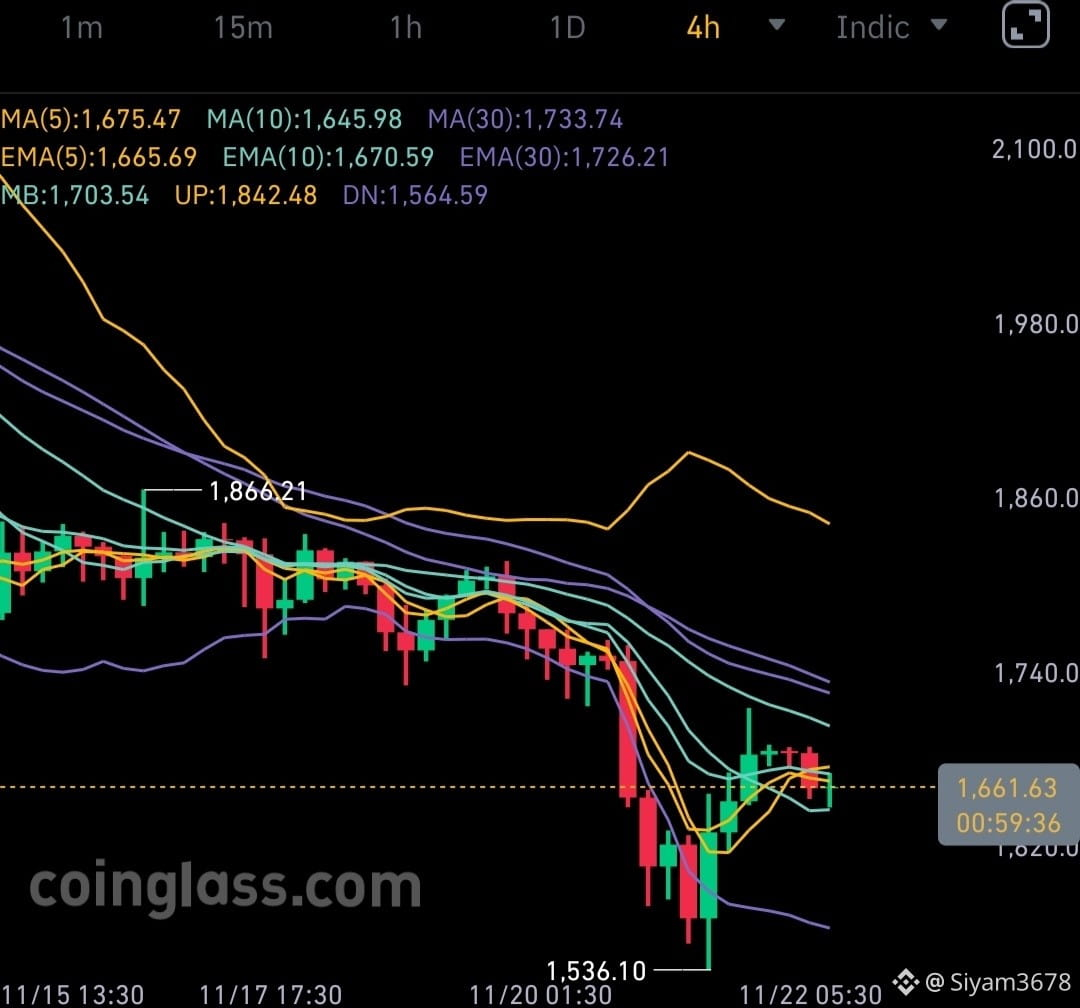
🟢 $ETH
Buyers are defending the higher low carved near 1,650 above the capitulation wick, and as long as that shelf holds, a continuation leg into the bearish Supertrend around 1,740 stays on the table. If sellers instead slice back through the bounce low, the entire relief rally invalidates and price revisits the flush zone. Personally, I'm treating this consolidation as coil, not distribution — I want volume expanding on the breakout candle before adding longs.
🟢 $ETH
Buyers are defending the higher low carved near 1,650 above the capitulation wick, and as long as that shelf holds, a continuation leg into the bearish Supertrend around 1,740 stays on the table. If sellers instead slice back through the bounce low, the entire relief rally invalidates and price revisits the flush zone. Personally, I'm treating this consolidation as coil, not distribution — I want volume expanding on the breakout candle before adding longs.
Buyers are defending the higher low carved near 1,650 above the capitulation wick, and as long as that shelf holds, a continuation leg into the bearish Supertrend around 1,740 stays on the table. If sellers instead slice back through the bounce low, the entire relief rally invalidates and price revisits the flush zone. Personally, I'm treating this consolidation as coil, not distribution — I want volume expanding on the breakout candle before adding longs.
1
234
·
--
ສັນຍານກະທິງ
🟢 $MMT
• Trend: Higher-timeframe Supertrend still green with price holding above the long-term EMA shelf despite the deep pullback from the blow-off top
• Momentum: Oversold RSI curling up as the bounce prints higher lows on fading sell volume
• Plan: I'm letting price retest the reclaimed short-term averages near 0.2060 before longing the squeeze
🟢 $MMT
• Trend: Higher-timeframe Supertrend still green with price holding above the long-term EMA shelf despite the deep pullback from the blow-off top
• Momentum: Oversold RSI curling up as the bounce prints higher lows on fading sell volume
• Plan: I'm letting price retest the reclaimed short-term averages near 0.2060 before longing the squeeze
• Trend: Higher-timeframe Supertrend still green with price holding above the long-term EMA shelf despite the deep pullback from the blow-off top
• Momentum: Oversold RSI curling up as the bounce prints higher lows on fading sell volume
• Plan: I'm letting price retest the reclaimed short-term averages near 0.2060 before longing the squeeze
2
677
·
--
ສັນຍານກະທິງ
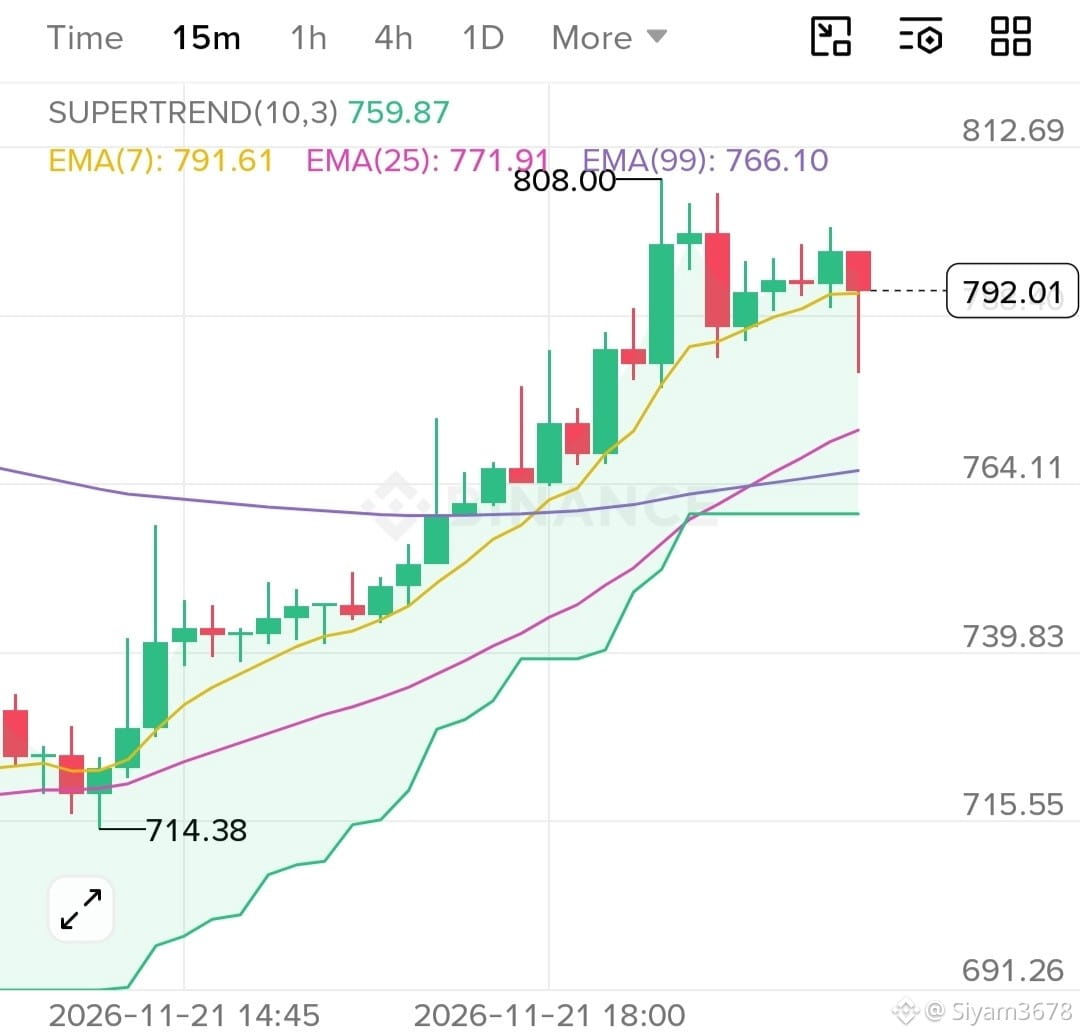
🟢 $ZEC
Entry: 772.00
SL: 735.00
Targets: 812.00 - 843.00 - 878.00
Why: The bounce off the capitulation low reclaimed the short-term EMAs on expanding green volume, with the lower-timeframe Supertrend still green while price coils under the round-number handle.
Risk: The higher-timeframe Supertrend and EMA shelf overhead around the mid-800s still cap rallies, so I'm only arming longs on a dip into the demand zone, not chasing stretched candles.
🟢 $ZEC
Entry: 772.00
SL: 735.00
Targets: 812.00 - 843.00 - 878.00
Why: The bounce off the capitulation low reclaimed the short-term EMAs on expanding green volume, with the lower-timeframe Supertrend still green while price coils under the round-number handle.
Risk: The higher-timeframe Supertrend and EMA shelf overhead around the mid-800s still cap rallies, so I'm only arming longs on a dip into the demand zone, not chasing stretched candles.
Entry: 772.00
SL: 735.00
Targets: 812.00 - 843.00 - 878.00
Why: The bounce off the capitulation low reclaimed the short-term EMAs on expanding green volume, with the lower-timeframe Supertrend still green while price coils under the round-number handle.
Risk: The higher-timeframe Supertrend and EMA shelf overhead around the mid-800s still cap rallies, so I'm only arming longs on a dip into the demand zone, not chasing stretched candles.
2
498
·
--
ສັນຍານກະທິງ
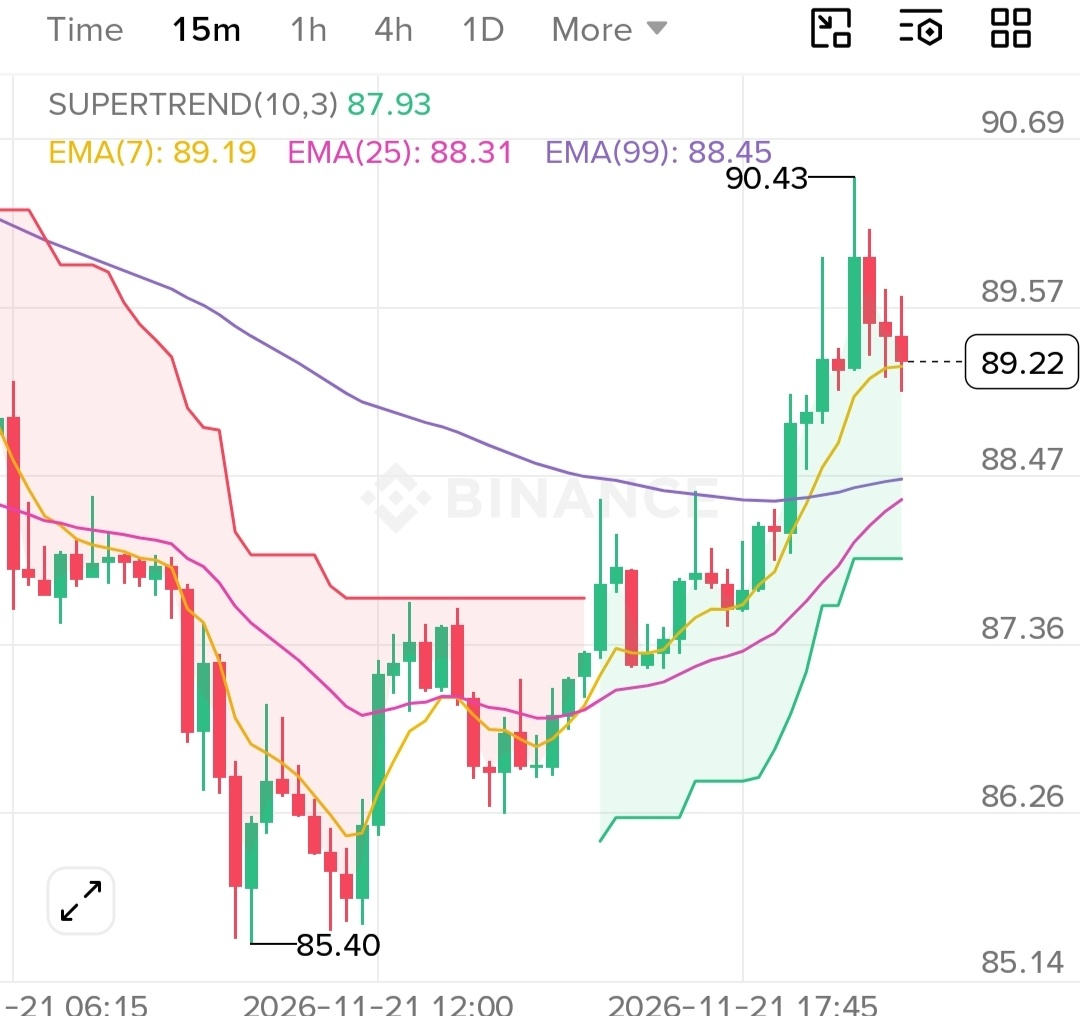
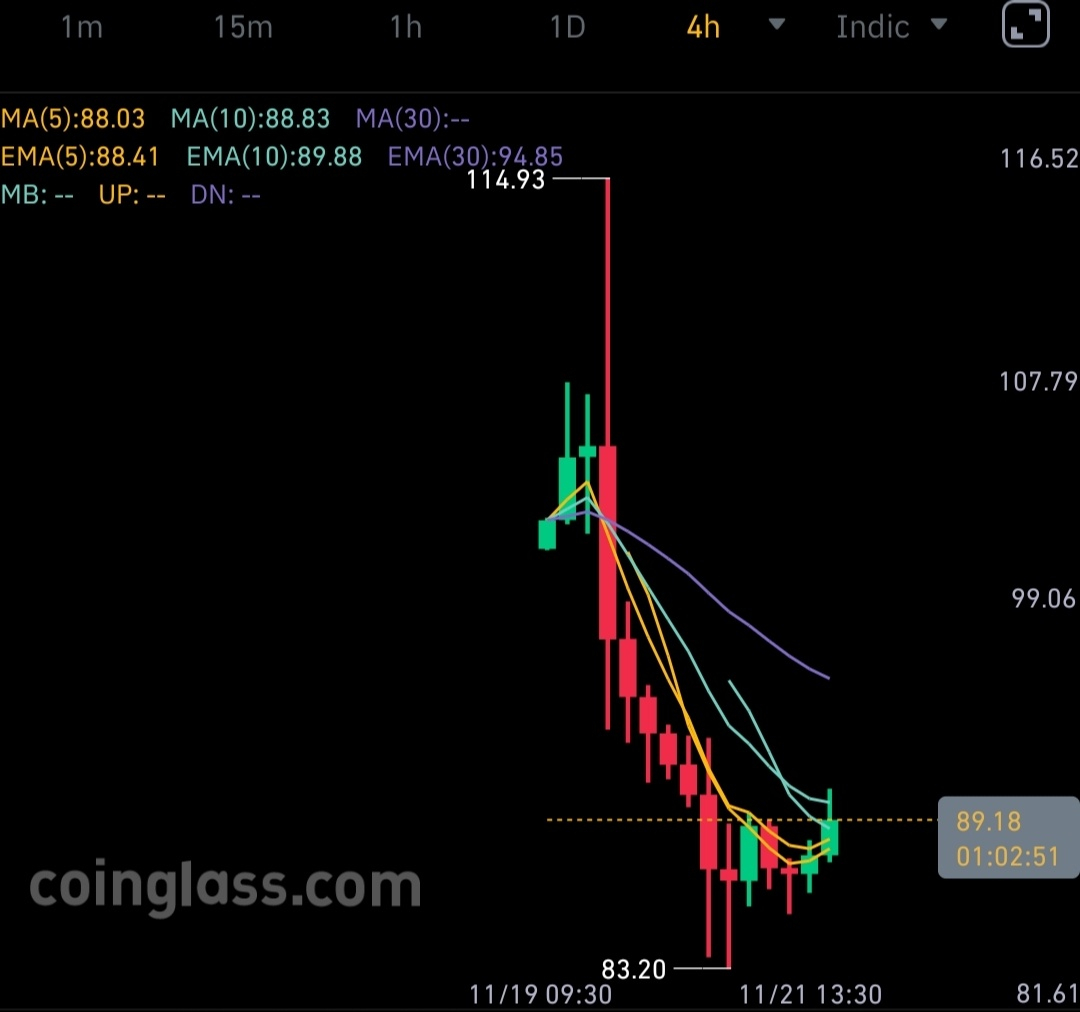
🟢 $ANT The flush to 83.20 swept the entire breakout liquidity before price printed a clean higher-low sequence, reclaiming the short-term EMAs and flipping the lower-timeframe Supertrend green. I'm not chasing the vertical bounce candle here; I want a dip back toward the reclaimed midpoint around 88.5 before committing longs, since the bearish higher-timeframe Supertrend overhead still acts as the magnet for this relief rally.
Trade Setup
Entry: 88.50
Stop-Loss: 82.40
Targets: 96.50 - 100.00 - 104.00
Control your risk and leverage.
#ANT #AI #CryptoTrading #BinanceSquare
#CanBTCReboundAfterFallingBelow60K?
{future}(ANTUSDT)
🟢 $ANT The flush to 83.20 swept the entire breakout liquidity before price printed a clean higher-low sequence, reclaiming the short-term EMAs and flipping the lower-timeframe Supertrend green. I'm not chasing the vertical bounce candle here; I want a dip back toward the reclaimed midpoint around 88.5 before committing longs, since the bearish higher-timeframe Supertrend overhead still acts as the magnet for this relief rally.
Trade Setup
Entry: 88.50
Stop-Loss: 82.40
Targets: 96.50 - 100.00 - 104.00
Control your risk and leverage.
#ANT #AI #CryptoTrading #BinanceSquare
#CanBTCReboundAfterFallingBelow60K?
Trade Setup
Entry: 88.50
Stop-Loss: 82.40
Targets: 96.50 - 100.00 - 104.00
Control your risk and leverage.
#ANT #AI #CryptoTrading #BinanceSquare
#CanBTCReboundAfterFallingBelow60K?
1
660
·
--
ສັນຍານກະທິງ
🟢 $SOL The flush to 64.83 printed a clear exhaustion wick, and price has since reclaimed the short-term averages with the lower-timeframe Supertrend flipping green on rising green volume. I'm treating this as a relief rally rather than a full reversal for now — I'd only add length on a clean hold above the reclaimed shelf, keeping the rising short-term trend line as invalidation.
Key 4H Levels: Resistance 69.70 | Support 64.80
#sol
🟢 $SOL The flush to 64.83 printed a clear exhaustion wick, and price has since reclaimed the short-term averages with the lower-timeframe Supertrend flipping green on rising green volume. I'm treating this as a relief rally rather than a full reversal for now — I'd only add length on a clean hold above the reclaimed shelf, keeping the rising short-term trend line as invalidation.
Key 4H Levels: Resistance 69.70 | Support 64.80
#sol
Key 4H Levels: Resistance 69.70 | Support 64.80
#sol
1
113
·
--
ສັນຍານໝີ
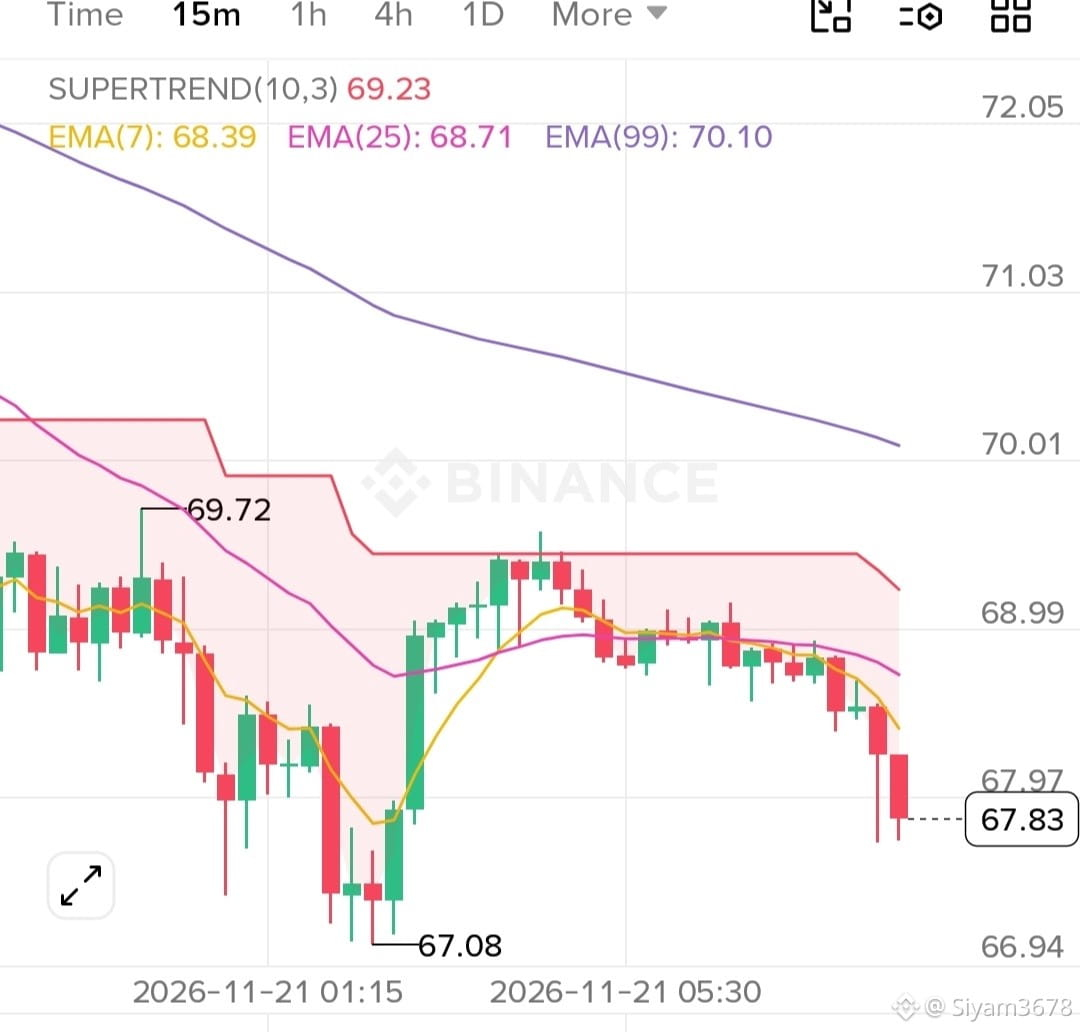
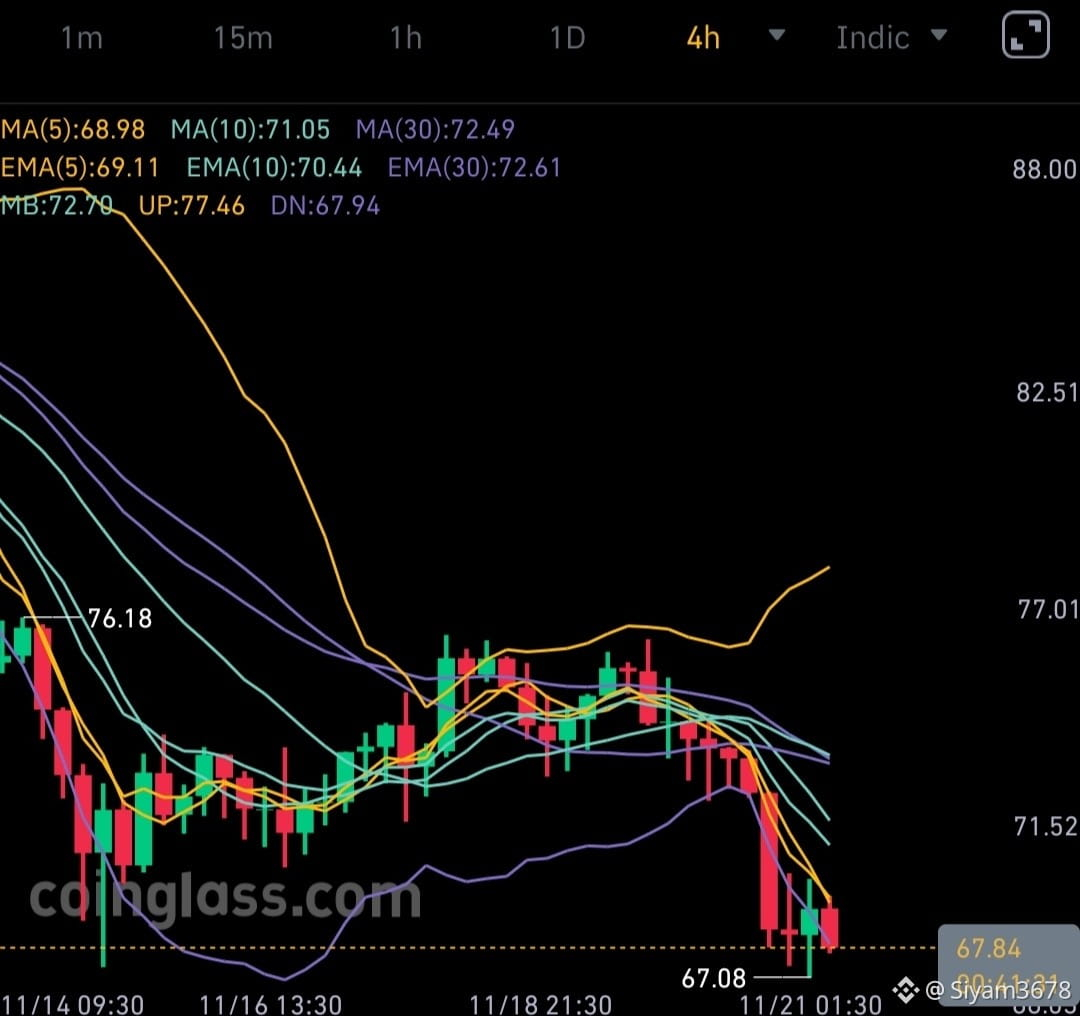
🔴 $SOL The range floor gave way on heavy red volume, sending price slicing through every moving average and outside the lower Bollinger band while the higher-timeframe Supertrend stays firmly red. With RSI this stretched to the downside I won't chase the breakdown candle; I'd rather let a relief rally fail beneath the broken shelf and the declining short-term averages before adding shorts. Until price reclaims the broken shelf above the fresh 67.08 low, lower highs keep stacking and the pressure stays down.
Trade Setup
Entry: 69.20 - 69.80
Stop-Loss: 72.60
Targets: 66.30 - 63.90 - 60.80
Control your risk and leverage.
#SOL #Altcoins #CryptoTrading #GlobalStocksFaceLongestLosingStreakSince2023 #GaoTengBitcoinETFListsOnHKEX
{future}(SOLUSDT)
🔴 $SOL The range floor gave way on heavy red volume, sending price slicing through every moving average and outside the lower Bollinger band while the higher-timeframe Supertrend stays firmly red. With RSI this stretched to the downside I won't chase the breakdown candle; I'd rather let a relief rally fail beneath the broken shelf and the declining short-term averages before adding shorts. Until price reclaims the broken shelf above the fresh 67.08 low, lower highs keep stacking and the pressure stays down.
Trade Setup
Entry: 69.20 - 69.80
Stop-Loss: 72.60
Targets: 66.30 - 63.90 - 60.80
Control your risk and leverage.
#SOL #Altcoins #CryptoTrading #GlobalStocksFaceLongestLosingStreakSince2023 #GaoTengBitcoinETFListsOnHKEX
Trade Setup
Entry: 69.20 - 69.80
Stop-Loss: 72.60
Targets: 66.30 - 63.90 - 60.80
Control your risk and leverage.
#SOL #Altcoins #CryptoTrading #GlobalStocksFaceLongestLosingStreakSince2023 #GaoTengBitcoinETFListsOnHKEX
1
197
·
--
ສັນຍານກະທິງ
🟢 $BTW The higher-timeframe reversal is holding up nicely, with price still riding above the rising Supertrend and short-term EMAs on the 4H chart despite this sharp lower-timeframe washout. The fast RSI down here is already flushed to oversold right at the rising support shelf near 0.602, so I'd rather watch for a base to form or for a reclaim of the falling short-term averages than knife-catch mid-drop. As long as the higher-low structure holds, this pullback looks like fuel for another leg up in the recovery trend.
#NvidiaBoardReportedlySplitOverHuang’sReturn #CanGTA6'sLaunchLiftTTWOShares? #BlackRockBitcoinETFRecordsLargestDailyOutflow #LedgerProbesTamperedWalletsInBerlinAndDubai #BTW
{future}(BTWUSDT)
🟢 $BTW The higher-timeframe reversal is holding up nicely, with price still riding above the rising Supertrend and short-term EMAs on the 4H chart despite this sharp lower-timeframe washout. The fast RSI down here is already flushed to oversold right at the rising support shelf near 0.602, so I'd rather watch for a base to form or for a reclaim of the falling short-term averages than knife-catch mid-drop. As long as the higher-low structure holds, this pullback looks like fuel for another leg up in the recovery trend.
#NvidiaBoardReportedlySplitOverHuang’sReturn #CanGTA6'sLaunchLiftTTWOShares? #BlackRockBitcoinETFRecordsLargestDailyOutflow #LedgerProbesTamperedWalletsInBerlinAndDubai #BTW
#NvidiaBoardReportedlySplitOverHuang’sReturn #CanGTA6'sLaunchLiftTTWOShares? #BlackRockBitcoinETFRecordsLargestDailyOutflow #LedgerProbesTamperedWalletsInBerlinAndDubai #BTW
1
67
·
--
ສັນຍານໝີ
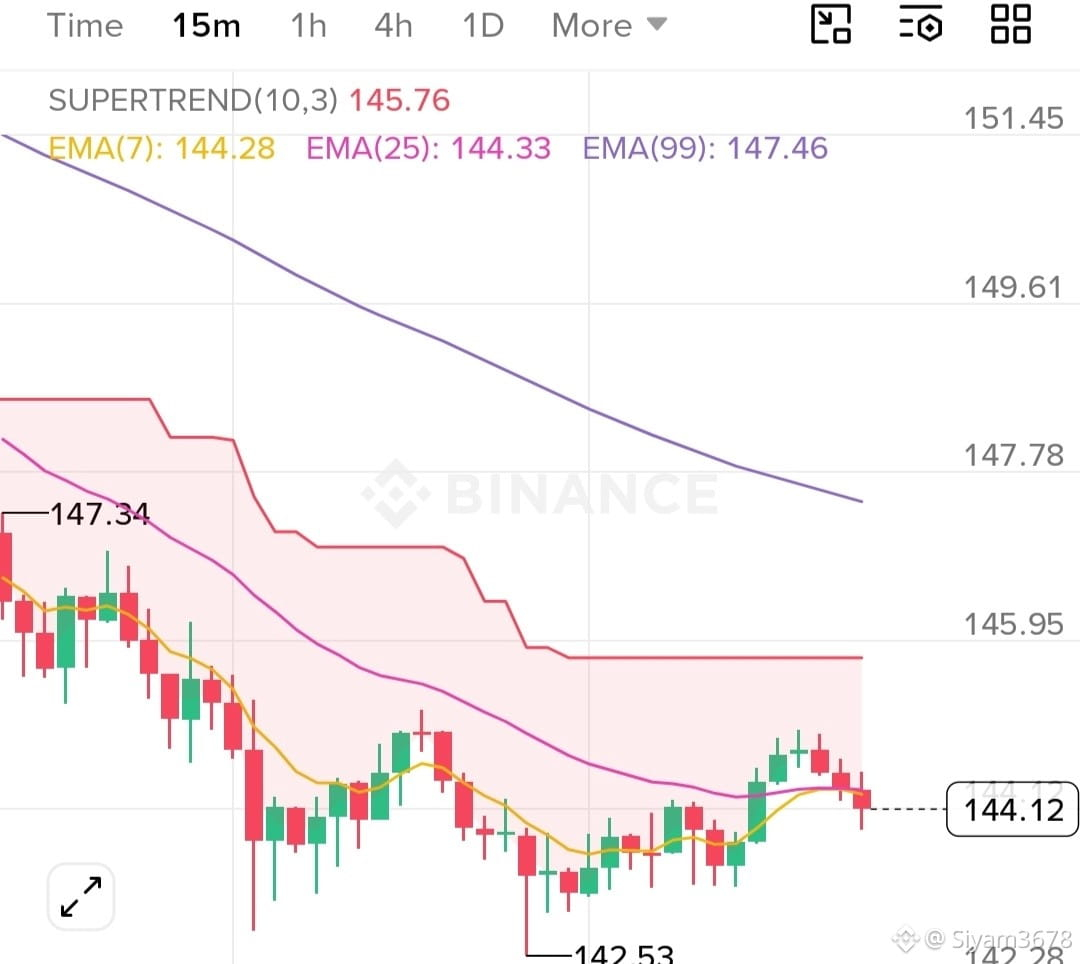
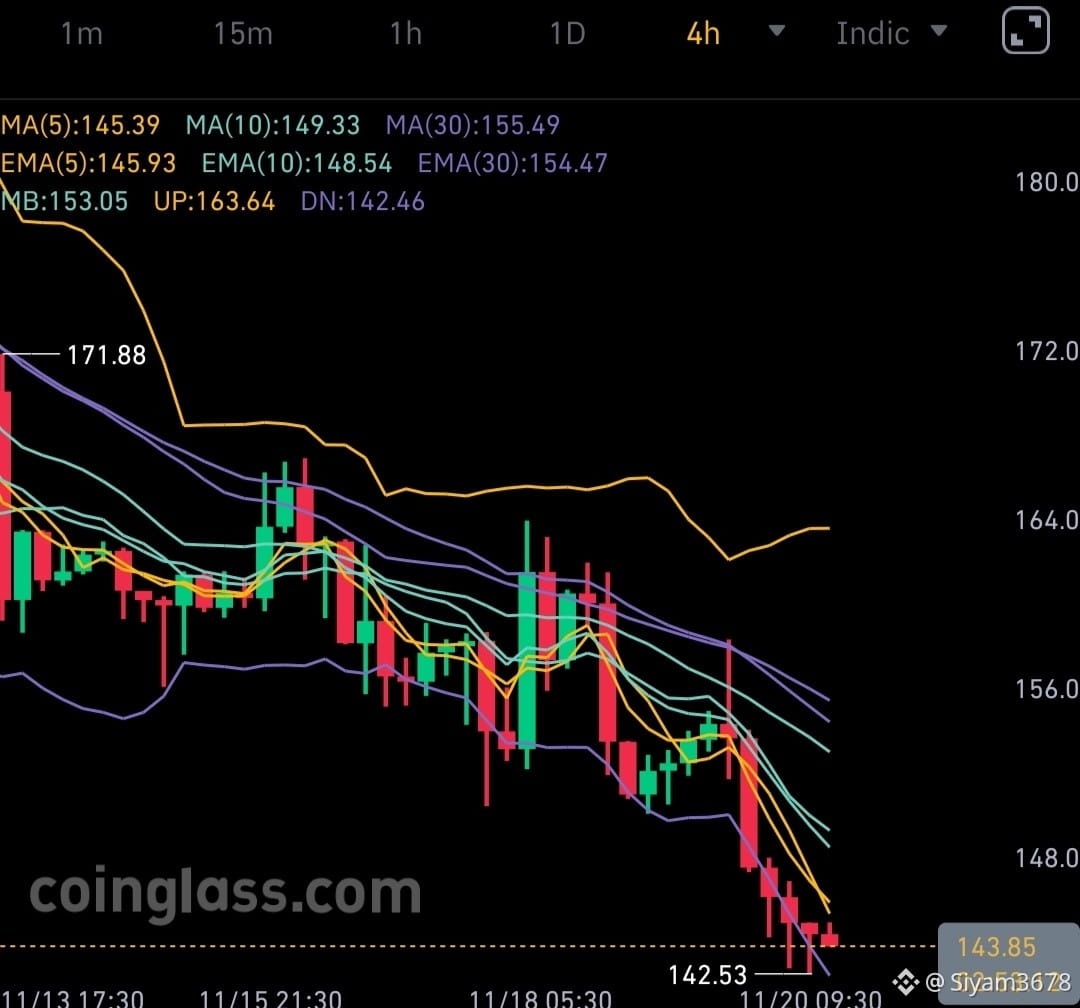
🔴 $NVDA Price is hugging the lower Bollinger band in a clean stair-step decline, printing lower highs and lower lows beneath every descending average and the red higher-timeframe Supertrend. The momentum gauge is already deeply oversold on this timeframe, so I'm not chasing shorts into the band support; a relief bounce that fails beneath the declining average cluster around 147 is the only setup I care about.
Key 4H Levels: Resistance 147.50 | Support 142.50
#NvidiaBoardReportedlySplitOverHuang’sReturn #CanGTA6'sLaunchLiftTTWOShares? #BlackRockBitcoinETFRecordsLargestDailyOutflow #LedgerProbesTamperedWalletsInBerlinAndDubai #NVDA
{future}(NVDAUSDT)
🔴 $NVDA Price is hugging the lower Bollinger band in a clean stair-step decline, printing lower highs and lower lows beneath every descending average and the red higher-timeframe Supertrend. The momentum gauge is already deeply oversold on this timeframe, so I'm not chasing shorts into the band support; a relief bounce that fails beneath the declining average cluster around 147 is the only setup I care about.
Key 4H Levels: Resistance 147.50 | Support 142.50
#NvidiaBoardReportedlySplitOverHuang’sReturn #CanGTA6'sLaunchLiftTTWOShares? #BlackRockBitcoinETFRecordsLargestDailyOutflow #LedgerProbesTamperedWalletsInBerlinAndDubai #NVDA
Key 4H Levels: Resistance 147.50 | Support 142.50
#NvidiaBoardReportedlySplitOverHuang’sReturn #CanGTA6'sLaunchLiftTTWOShares? #BlackRockBitcoinETFRecordsLargestDailyOutflow #LedgerProbesTamperedWalletsInBerlinAndDubai #NVDA
1
64
·
--
ສັນຍານໝີ
🔴 $SOL The recovery attempt since the range low printed a lower high near 75.60 and keeps stalling at the converging moving-average cluster overhead, with price now back below the mid-Bollinger band while the higher-timeframe Supertrend stays red. I'm not selling into the lower-band support either, so I'd rather watch a weak rally tag that average cluster and print a rejection wick before committing to the downside.
Entry: 73.30 - 73.80
#SolanaStrong #NvidiaBoardReportedlySplitOverHuang’sReturn #CanGTA6'sLaunchLiftTTWOShares? #13FInstitutionsBitcoinSpotETPHoldingsHitRecord #MASToUpgradeSGDTestnetToSGDigitalLedger
{future}(SOLUSDT)
🔴 $SOL The recovery attempt since the range low printed a lower high near 75.60 and keeps stalling at the converging moving-average cluster overhead, with price now back below the mid-Bollinger band while the higher-timeframe Supertrend stays red. I'm not selling into the lower-band support either, so I'd rather watch a weak rally tag that average cluster and print a rejection wick before committing to the downside.
Entry: 73.30 - 73.80
#SolanaStrong #NvidiaBoardReportedlySplitOverHuang’sReturn #CanGTA6'sLaunchLiftTTWOShares? #13FInstitutionsBitcoinSpotETPHoldingsHitRecord #MASToUpgradeSGDTestnetToSGDigitalLedger
Entry: 73.30 - 73.80
#SolanaStrong #NvidiaBoardReportedlySplitOverHuang’sReturn #CanGTA6'sLaunchLiftTTWOShares? #13FInstitutionsBitcoinSpotETPHoldingsHitRecord #MASToUpgradeSGDTestnetToSGDigitalLedger
1
103
·
--
ສັນຍານໝີ
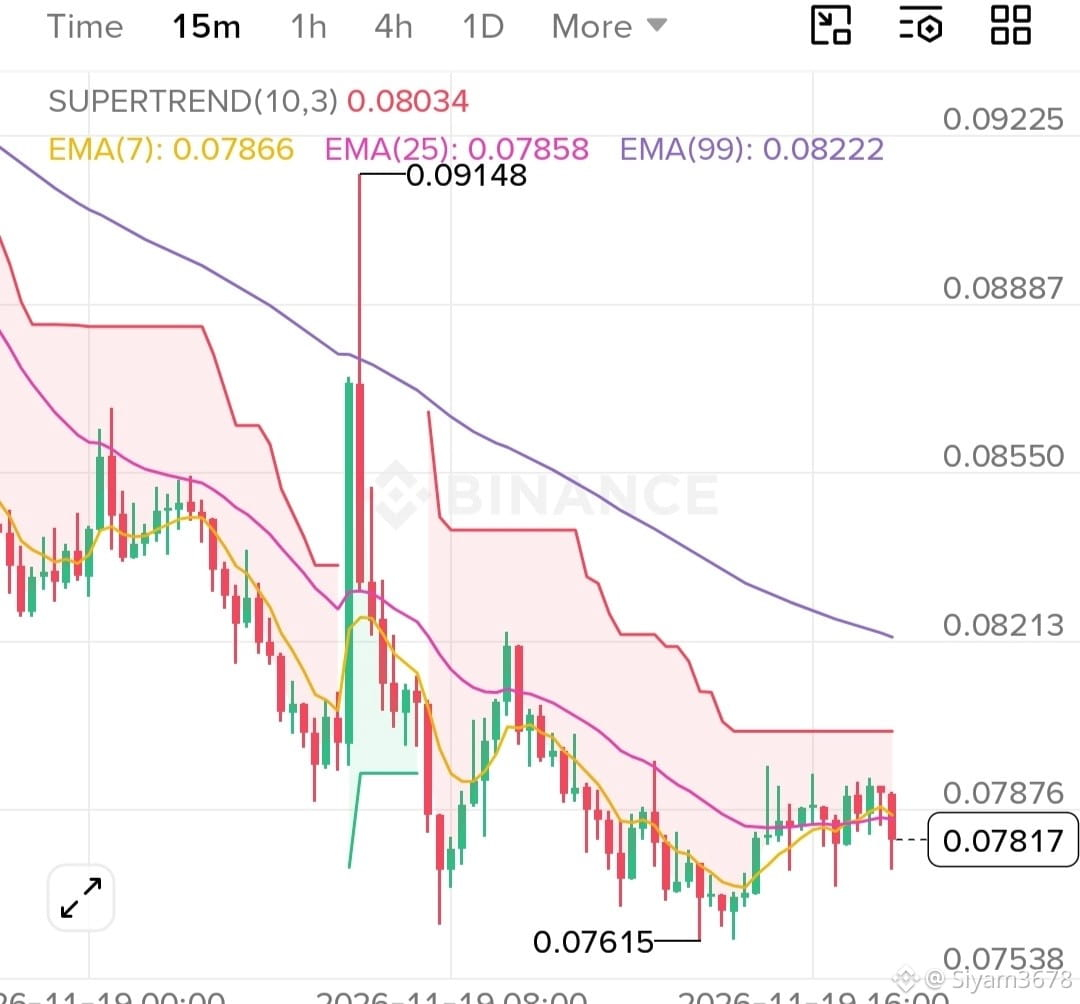
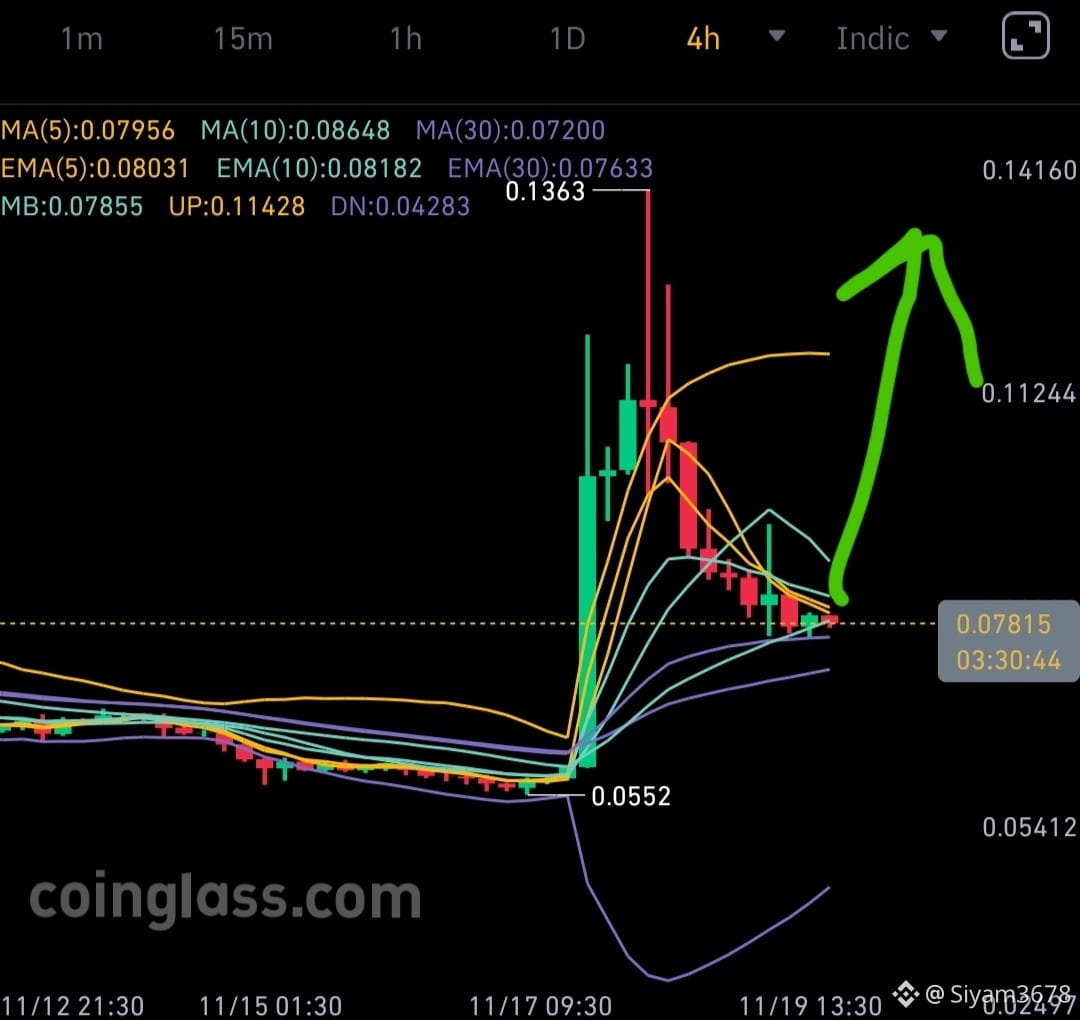
🔴 $BREV The parabolic spike has been fully retraced into a descending channel, with price pinned below the falling Supertrend and short-term averages on the lower timeframe while every bounce prints lower highs. I don't like shorting right into the slow-moving average support just below, so I'd rather wait for a fade up into the descending trend resistance to stall before joining the sellers. A decisive loss of the 0.07615 swing low would open the door back toward the original launch base.
Trade Setup
Entry: 0.0810 - 0.0820
Stop-Loss: 0.0925
Targets: 0.0690 - 0.0620 - 0.0560
Control your risk and leverage.
#BREV #Altcoins #BTCRemainsUnderPressureAfterHawkishFOMCMinutes #NvidiaBoardReportedlySplitOverHuang’sReturn #CanGTA6'sLaunchLiftTTWOShares?
{future}(BREVUSDT)
🔴 $BREV The parabolic spike has been fully retraced into a descending channel, with price pinned below the falling Supertrend and short-term averages on the lower timeframe while every bounce prints lower highs. I don't like shorting right into the slow-moving average support just below, so I'd rather wait for a fade up into the descending trend resistance to stall before joining the sellers. A decisive loss of the 0.07615 swing low would open the door back toward the original launch base.
Trade Setup
Entry: 0.0810 - 0.0820
Stop-Loss: 0.0925
Targets: 0.0690 - 0.0620 - 0.0560
Control your risk and leverage.
#BREV #Altcoins #BTCRemainsUnderPressureAfterHawkishFOMCMinutes #NvidiaBoardReportedlySplitOverHuang’sReturn #CanGTA6'sLaunchLiftTTWOShares?
Trade Setup
Entry: 0.0810 - 0.0820
Stop-Loss: 0.0925
Targets: 0.0690 - 0.0620 - 0.0560
Control your risk and leverage.
#BREV #Altcoins #BTCRemainsUnderPressureAfterHawkishFOMCMinutes #NvidiaBoardReportedlySplitOverHuang’sReturn #CanGTA6'sLaunchLiftTTWOShares?
1
61
·
--
ສັນຍານກະທິງ
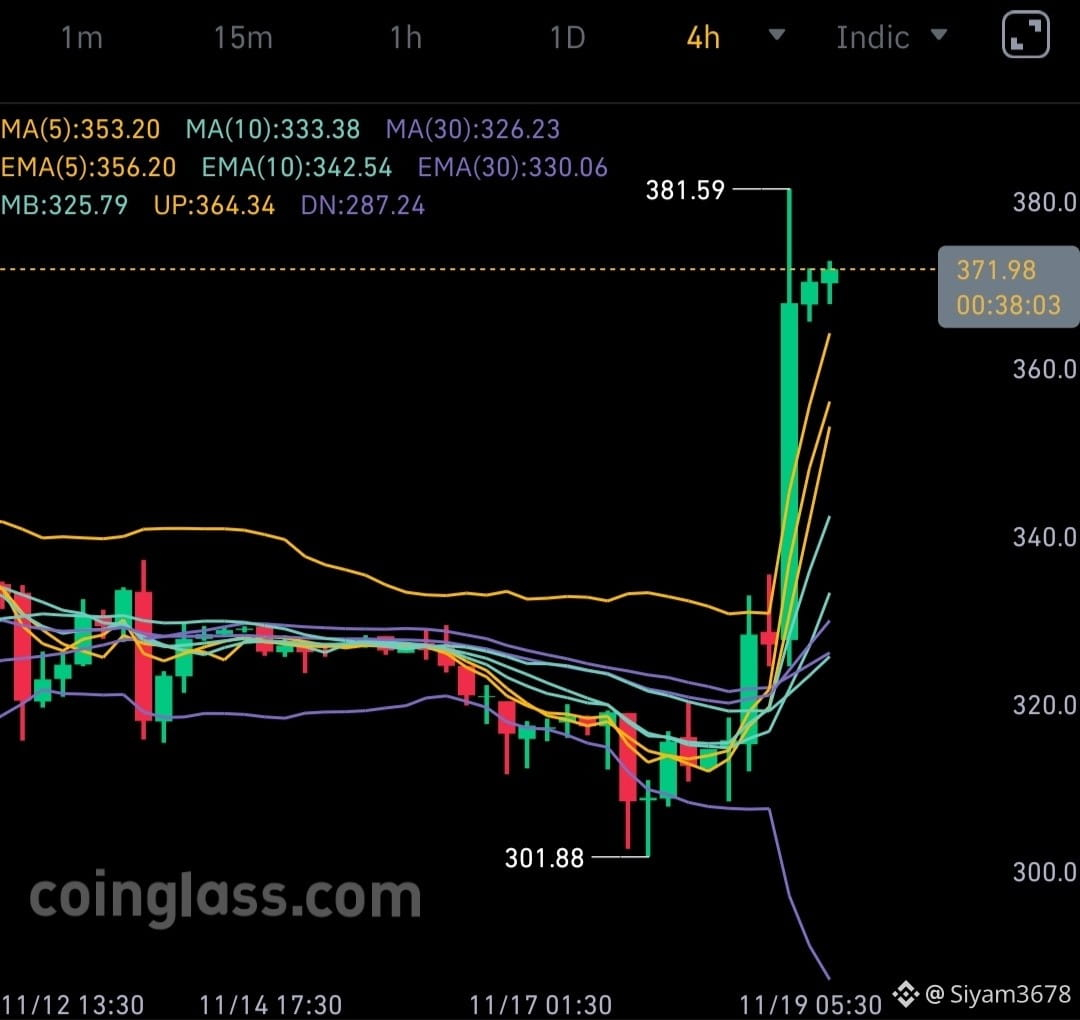
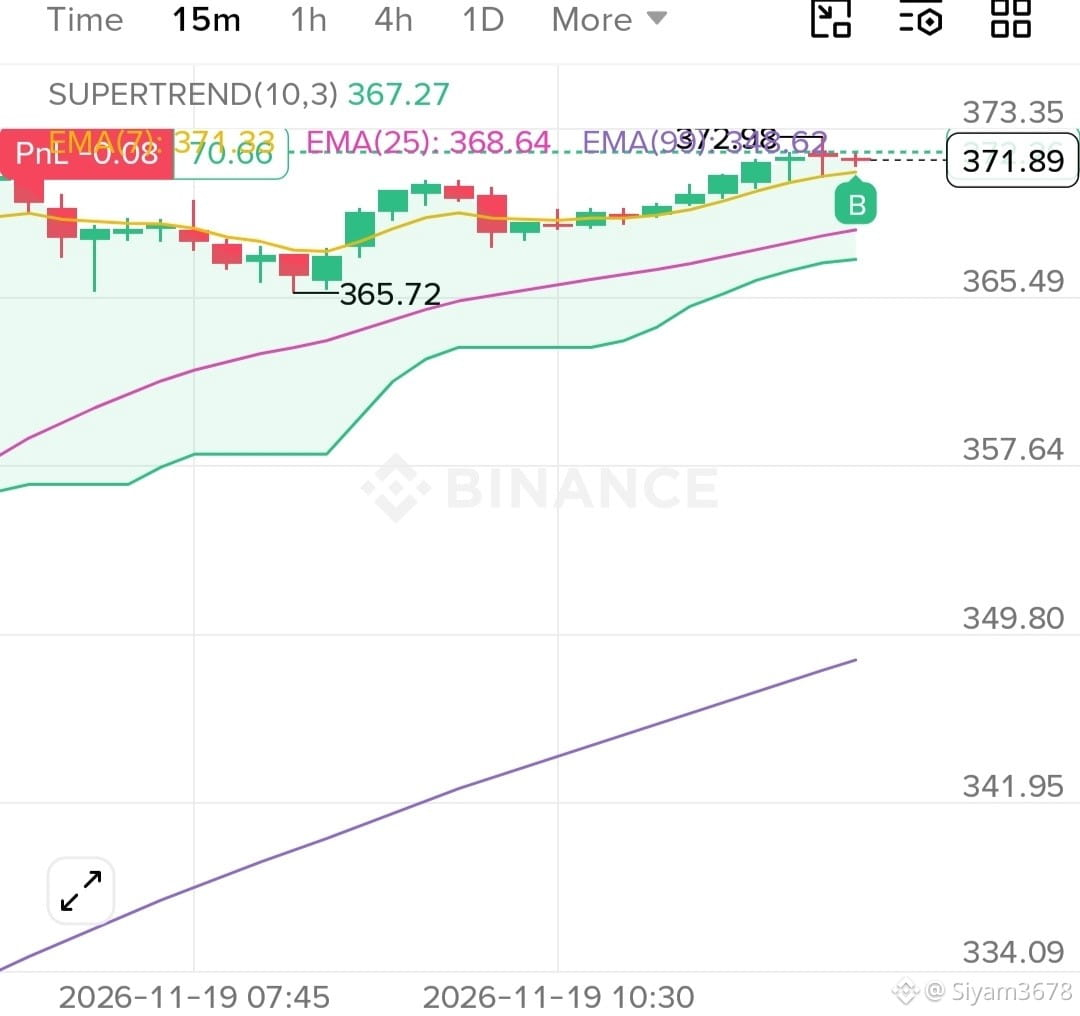
🟢 $PANW Price exploded out of its basing range on a huge volume-backed green candle, reclaiming every moving average and flipping the Supertrend bullish on both timeframes while riding above the upper Bollinger band. With the higher-timeframe RSI glued deep in overbought territory I am in no hurry to chase this squeeze; I would rather watch price consolidate above the reclaimed range top and print a higher low before joining the trend. As long as the rising short-term averages hold as support, the path of least resistance stays up toward a fresh attempt at the 381.59 high.
#BTCRemainsUnderPressureAfterHawkishFOMCMinutes #NvidiaBoardReportedlySplitOverHuang’sReturn #SouthKoreaPlansToLet3500ListedFirmsBuyBitcoin #FOMCMinutesHighlightAIDebtRisks #FedMinutesShowAlmostAllOfficialsExpectMoreHikes
🟢 $PANW Price exploded out of its basing range on a huge volume-backed green candle, reclaiming every moving average and flipping the Supertrend bullish on both timeframes while riding above the upper Bollinger band. With the higher-timeframe RSI glued deep in overbought territory I am in no hurry to chase this squeeze; I would rather watch price consolidate above the reclaimed range top and print a higher low before joining the trend. As long as the rising short-term averages hold as support, the path of least resistance stays up toward a fresh attempt at the 381.59 high.
#BTCRemainsUnderPressureAfterHawkishFOMCMinutes #NvidiaBoardReportedlySplitOverHuang’sReturn #SouthKoreaPlansToLet3500ListedFirmsBuyBitcoin #FOMCMinutesHighlightAIDebtRisks #FedMinutesShowAlmostAllOfficialsExpectMoreHikes
#BTCRemainsUnderPressureAfterHawkishFOMCMinutes #NvidiaBoardReportedlySplitOverHuang’sReturn #SouthKoreaPlansToLet3500ListedFirmsBuyBitcoin #FOMCMinutesHighlightAIDebtRisks #FedMinutesShowAlmostAllOfficialsExpectMoreHikes
1
54
·
--
ສັນຍານກະທິງ
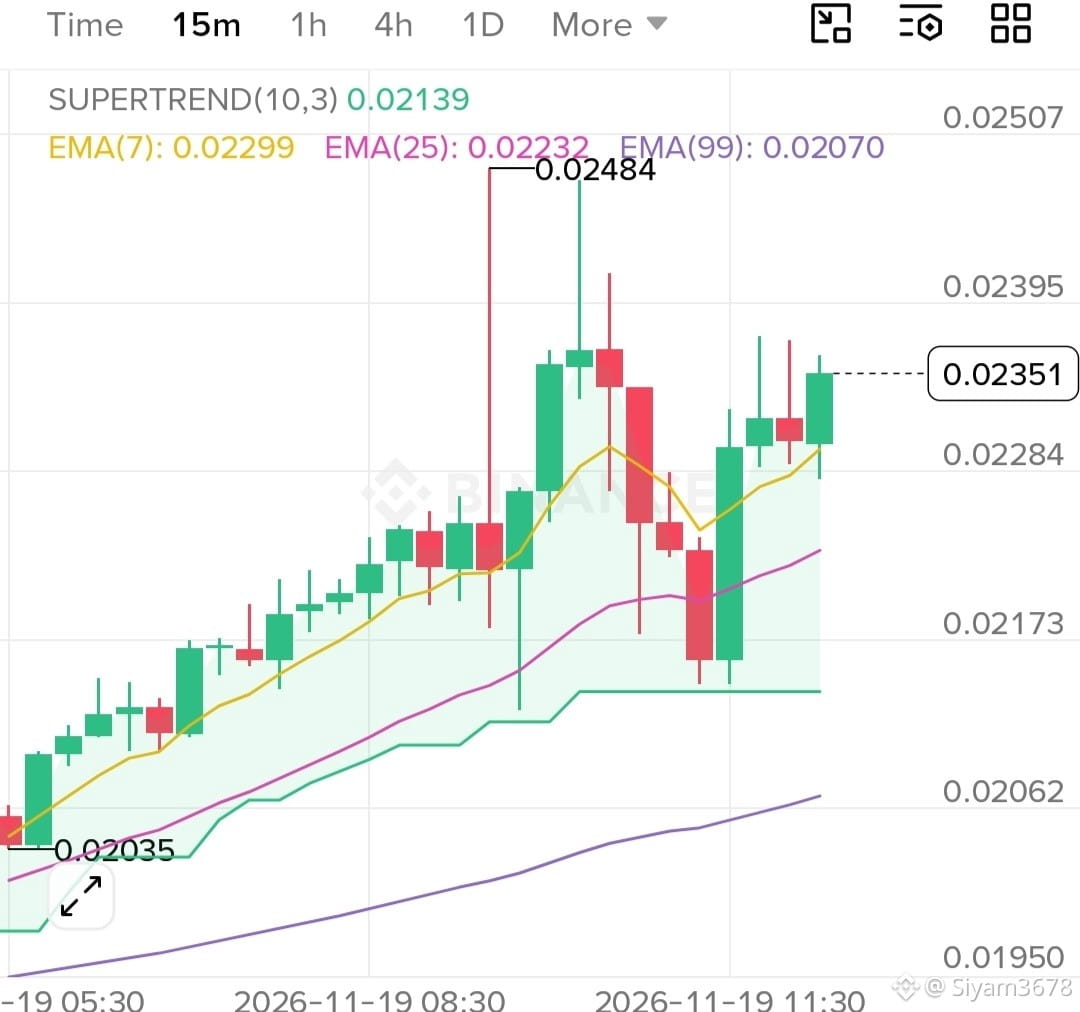
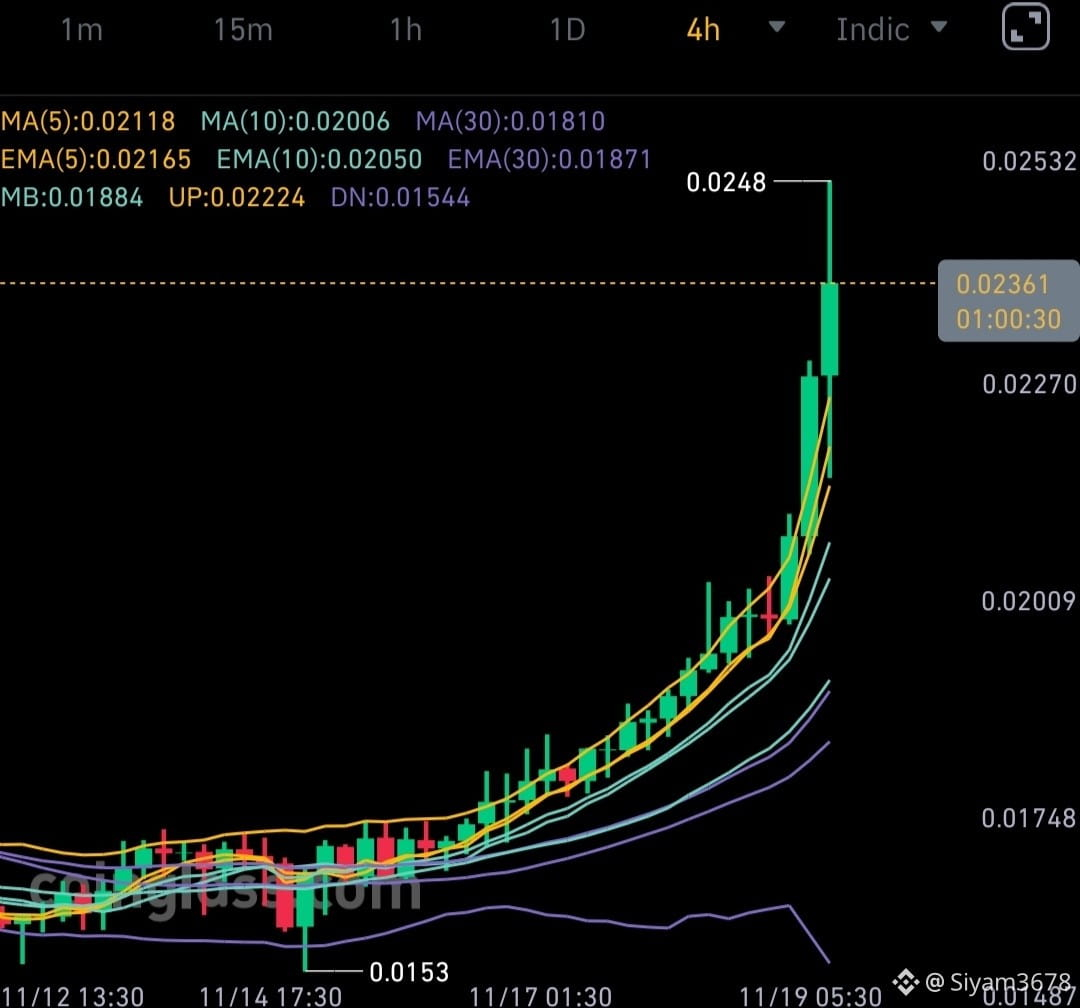
🟢 $SENT Price is climbing a parabolic staircase above every rising average and the bullish Supertrend on both timeframes, with each dip getting absorbed almost instantly by aggressive green volume. The higher-timeframe RSI is stretched deep into overbought territory, so I'd rather let this vertical leg cool and join on an orderly tag of the rising short-term average than pay full price mid-candle.
Entry: 0.02110 - 0.02150
#BTCRemainsUnderPressureAfterHawkishFOMCMinutes #NvidiaBoardReportedlySplitOverHuang’sReturn #FOMCMinutesHighlightAIDebtRisks #SouthKoreaPlansToLet3500ListedFirmsBuyBitcoin #CanGTA6'sLaunchLiftTTWOShares?
{future}(SENTUSDT)
🟢 $SENT Price is climbing a parabolic staircase above every rising average and the bullish Supertrend on both timeframes, with each dip getting absorbed almost instantly by aggressive green volume. The higher-timeframe RSI is stretched deep into overbought territory, so I'd rather let this vertical leg cool and join on an orderly tag of the rising short-term average than pay full price mid-candle.
Entry: 0.02110 - 0.02150
#BTCRemainsUnderPressureAfterHawkishFOMCMinutes #NvidiaBoardReportedlySplitOverHuang’sReturn #FOMCMinutesHighlightAIDebtRisks #SouthKoreaPlansToLet3500ListedFirmsBuyBitcoin #CanGTA6'sLaunchLiftTTWOShares?
Entry: 0.02110 - 0.02150
#BTCRemainsUnderPressureAfterHawkishFOMCMinutes #NvidiaBoardReportedlySplitOverHuang’sReturn #FOMCMinutesHighlightAIDebtRisks #SouthKoreaPlansToLet3500ListedFirmsBuyBitcoin #CanGTA6'sLaunchLiftTTWOShares?
1
87
·
--
ສັນຍານໝີ
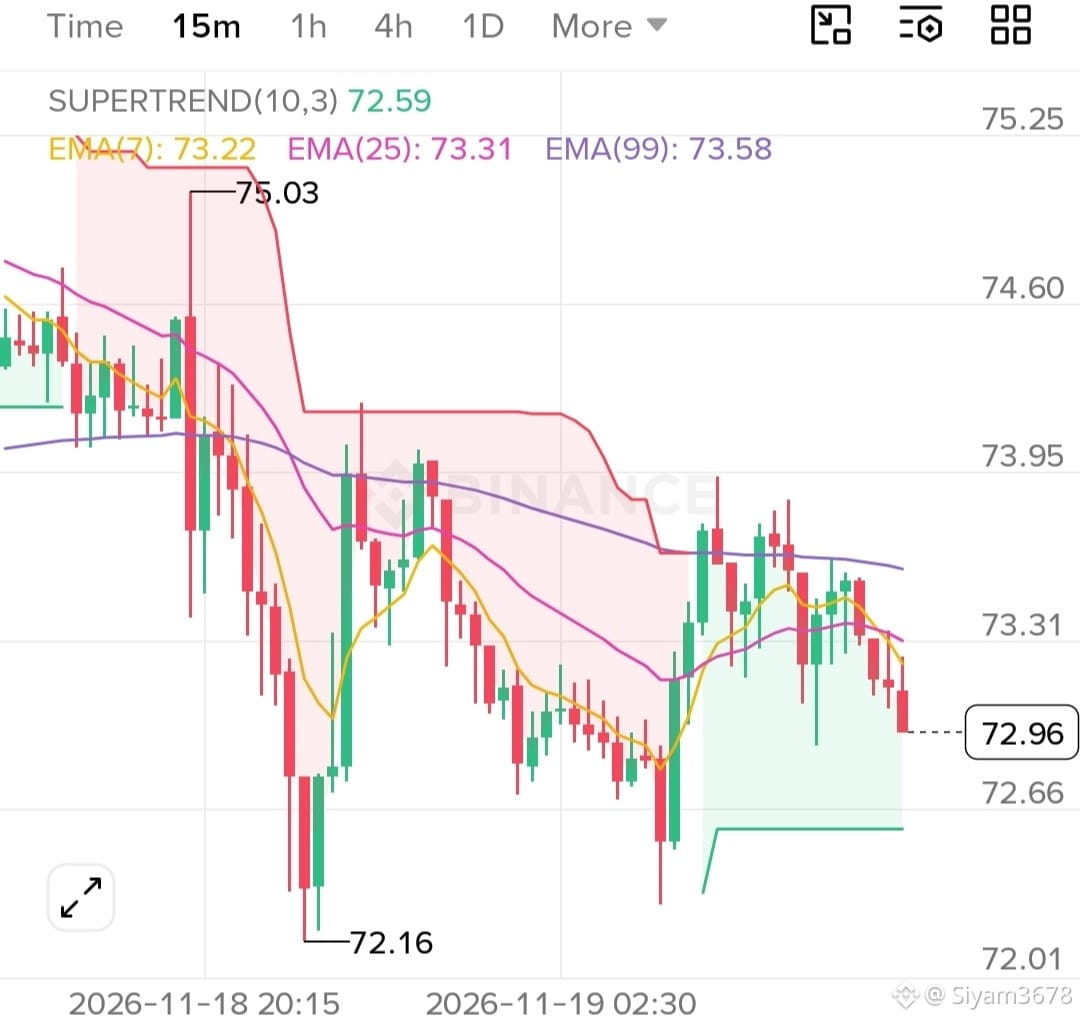
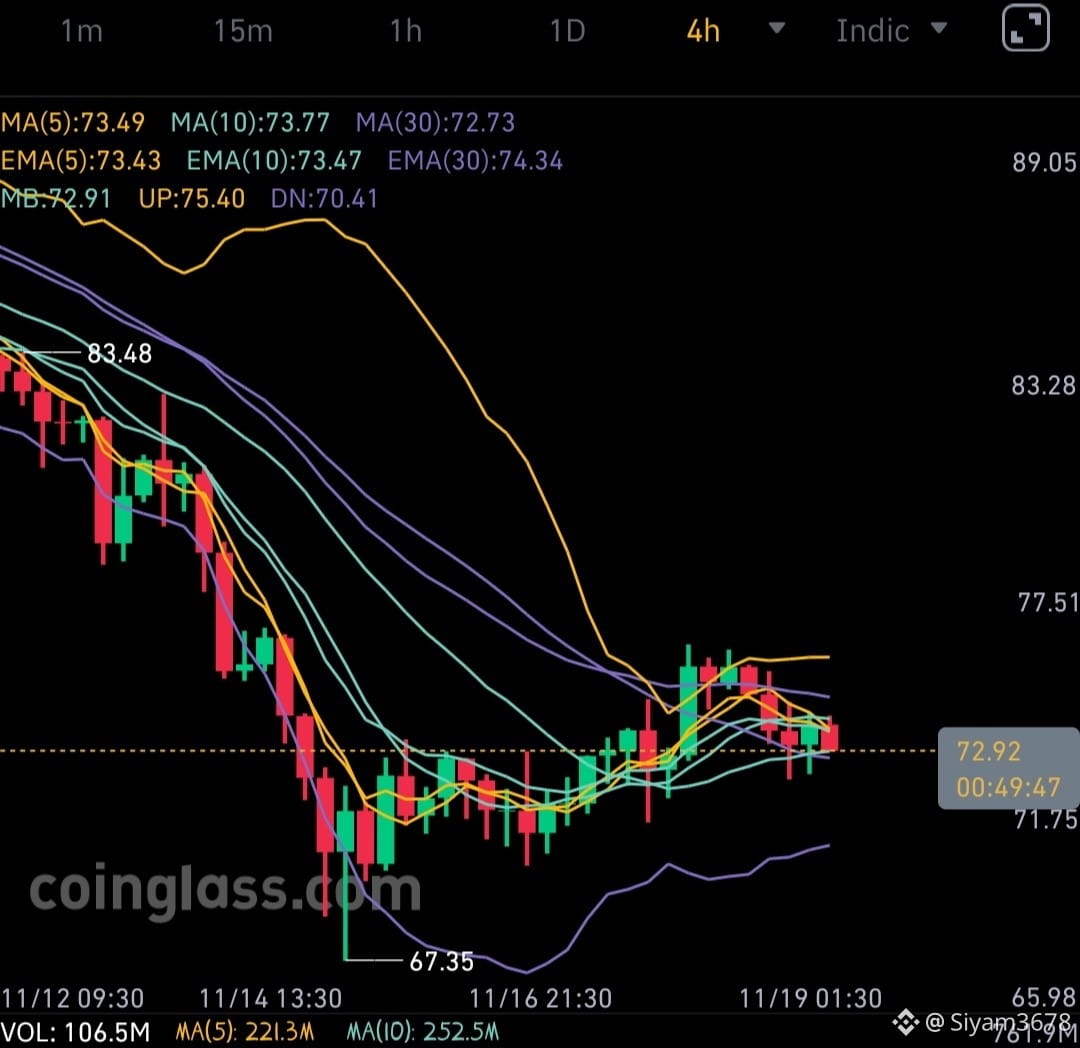
🔴 $SOL The rebound off the swing low stalled hard at the upper Bollinger band near 75.60, and price has since slipped back below the converging short-term moving averages with the higher-timeframe Supertrend still firmly red overhead. I'm not chasing this fade into mid-band support myself; I'd rather watch for a weak rally into that declining average cluster to fail before joining sellers toward the lower band.
Key 4H Levels: Resistance 75.60 | Support 67.35
#BTCRemainsUnderPressureAfterHawkishFOMCMinutes #NvidiaBoardReportedlySplitOverHuang’sReturn #SouthKoreaPlansToLet3500ListedFirmsBuyBitcoin #FOMCMinutesHighlightAIDebtRisks #CanGTA6'sLaunchLiftTTWOShares?
🔴 $SOL The rebound off the swing low stalled hard at the upper Bollinger band near 75.60, and price has since slipped back below the converging short-term moving averages with the higher-timeframe Supertrend still firmly red overhead. I'm not chasing this fade into mid-band support myself; I'd rather watch for a weak rally into that declining average cluster to fail before joining sellers toward the lower band.
Key 4H Levels: Resistance 75.60 | Support 67.35
#BTCRemainsUnderPressureAfterHawkishFOMCMinutes #NvidiaBoardReportedlySplitOverHuang’sReturn #SouthKoreaPlansToLet3500ListedFirmsBuyBitcoin #FOMCMinutesHighlightAIDebtRisks #CanGTA6'sLaunchLiftTTWOShares?
Key 4H Levels: Resistance 75.60 | Support 67.35
#BTCRemainsUnderPressureAfterHawkishFOMCMinutes #NvidiaBoardReportedlySplitOverHuang’sReturn #SouthKoreaPlansToLet3500ListedFirmsBuyBitcoin #FOMCMinutesHighlightAIDebtRisks #CanGTA6'sLaunchLiftTTWOShares?
1
115
ເຂົ້າສູ່ລະບົບເພື່ອສຳຫຼວດເນື້ອຫາເພີ່ມເຕີມ
ເຂົ້າຮ່ວມກຸ່ມຜູ້ໃຊ້ຄຣິບໂຕທົ່ວໂລກໃນ Binance Square.
⚡️ ໄດ້ຮັບຂໍ້ມູນຫຼ້າສຸດ ແລະ ທີ່ມີປະໂຫຍດກ່ຽວກັບຄຣິບໂຕ.
💬 ໄດ້ຮັບຄວາມໄວ້ວາງໃຈຈາກຕະຫຼາດແລກປ່ຽນຄຣິບໂຕທີ່ໃຫຍ່ທີ່ສຸດໃນໂລກ.
👍 ຄົ້ນຫາຂໍ້ມູນເຊີງເລິກທີ່ແທ້ຈາກນັກສ້າງທີ່ໄດ້ຮັບການຢືນຢັນ.
ອີເມວ / ເບີໂທລະສັບ
ຫົວຂໍ້ທີ່ກໍາລັງນິຍົມ
BTCReboundsAbove$60KAmidWhaleDipBuying
74,830 ຄັ້ງທີ່ເບິ່ງ
349 ກຳລັງສົນທະນາ
Abraxas Capital, Other Whales Buy the BTC Dip as Bitcoin Briefly Reclaims $60,000
Binance News
·35 ຖືກໃຈ
·77k ຄັ້ງທີ່ເບິ່ງ
SolanaSets2027RoadmapToDoubleComputeCapacity
59,204 ຄັ້ງທີ່ເບິ່ງ
1,016 ກຳລັງສົນທະນາ
CaliforniaNvidiaProbeExaminesPotentialCriminalViolations
15,851 ຄັ້ງທີ່ເບິ່ງ
139 ກຳລັງສົນທະນາ