
Toee Tett
70 ໂພສ

Toee Tett
ລາຍງານ
ບລັອກຜູ້ໃຊ້
Market Analysis and Crypto News , Binance Square
13 ກໍາລັງຕິດຕາມ
12 ຜູ້ຕິດຕາມ
22 Liked
ໂພສ
·
--

ບົດຄວາມ
Can PEPE really up to 1$?#PEPE: Can It Really Bounce Back to $1? 🐸🚀
Is the $1 dream still alive for #PEPE, or is it just another meme-coin fantasy? Let's look at the market from a technical and fundamental perspective.
📊 1. #PEPE – A Possible Recovery?
As of November 22, #PEPE is trading around 0.00000343 USDT, with a 24-hour gain of approximately 3.63%.
However, the daily chart still shows a bearish structure.
🔎 Key technical indicators:
RSI (14): 30.8 – Near oversold territory.
Immediate Support: 0.00000325
Immediate Resistance: 0.00000354
MACD: Bearish momentum.
A daily close above 0.00000354 could be an early sign of recovery. However, losing 0.00000325 may expose the price to further downside.
📌 2. What About #SHIB and #BTTC?
The meme-coin market isn't just about #PEPE.
🐕 #SHIB: Trading around 0.00000361 USDT, with RSI near 26.0. This suggests oversold conditions, but its overall daily trend remains bearish. Bulls need to reclaim 0.00000376 to strengthen the recovery scenario.
🐵 #BTTC: Trading around 0.00000031 USDT, with RSI near 27.0. The immediate resistance is around 0.00000032, while support sits near 0.00000030.
Both tokens are showing signs of oversold conditions, but oversold doesn't automatically mean a bullish reversal.
🚀 3. Can #PEPE Actually Reach $1?
Here's the reality check.
At its current price, #PEPE would need an astronomical increase of roughly 290,000 times to reach $1.
Its enormous circulating supply makes a $1 valuation extremely difficult to justify under today's market structure.
A strong recovery, new liquidity, increased adoption, major exchange activity, and a sustained bull market could create opportunities for significant upside.
But $1? That's an entirely different level of speculation.
🦁 My Final Thoughts
I believe the more important question right now isn't whether #PEPE can reach $1.
It's whether buyers can regain control, break key resistance levels, and establish a sustainable bullish trend.
Watch volume, RSI, MACD, Bitcoin's direction, and overall market sentiment before making any decisions.
🐸 Meme coins can surprise everyone, but smart traders never ignore risk.
What do you think?
Can #PEPE eventually reach $0.01, $0.10, or even $1? Or is that just a dream?
Let's discuss in the comments! 👇
⚠️ Disclaimer: This post is for educational and informational purposes only. It is not financial advice or a recommendation to buy, sell, or hold any cryptocurrency. Crypto markets are highly volatile. Always Do Your Own Research (DYOR) and manage your risk before making any investment decisions.
#BinanceSquare #CryptoAnalysis #TechnicalAnalysis #MemeCoins #CryptoMarket #Trading
Can PEPE really up to 1$?
#PEPE: Can It Really Bounce Back to $1? 🐸🚀
Is the $1 dream still alive for #PEPE, or is it just another meme-coin fantasy? Let's look at the market from a technical and fundamental perspective.
📊 1. #PEPE – A Possible Recovery?
As of November 22, #PEPE is trading around 0.00000343 USDT, with a 24-hour gain of approximately 3.63%.
However, the daily chart still shows a bearish structure.
🔎 Key technical indicators:
RSI (14): 30.8 – Near oversold territory.
Immediate Support: 0.00000325
Immediate Resistance: 0.00000354
MACD: Bearish momentum.
A daily close above 0.00000354 could be an early sign of recovery. However, losing 0.00000325 may expose the price to further downside.
📌 2. What About #SHIB and #BTTC?
The meme-coin market isn't just about #PEPE.
🐕 #SHIB: Trading around 0.00000361 USDT, with RSI near 26.0. This suggests oversold conditions, but its overall daily trend remains bearish. Bulls need to reclaim 0.00000376 to strengthen the recovery scenario.
🐵 #BTTC: Trading around 0.00000031 USDT, with RSI near 27.0. The immediate resistance is around 0.00000032, while support sits near 0.00000030.
Both tokens are showing signs of oversold conditions, but oversold doesn't automatically mean a bullish reversal.
🚀 3. Can #PEPE Actually Reach $1?
Here's the reality check.
At its current price, #PEPE would need an astronomical increase of roughly 290,000 times to reach $1.
Its enormous circulating supply makes a $1 valuation extremely difficult to justify under today's market structure.
A strong recovery, new liquidity, increased adoption, major exchange activity, and a sustained bull market could create opportunities for significant upside.
But $1? That's an entirely different level of speculation.
🦁 My Final Thoughts
I believe the more important question right now isn't whether #PEPE can reach $1.
It's whether buyers can regain control, break key resistance levels, and establish a sustainable bullish trend.
Watch volume, RSI, MACD, Bitcoin's direction, and overall market sentiment before making any decisions.
🐸 Meme coins can surprise everyone, but smart traders never ignore risk.
What do you think?
Can #PEPE eventually reach $0.01, $0.10, or even $1? Or is that just a dream?
Let's discuss in the comments! 👇
⚠️ Disclaimer: This post is for educational and informational purposes only. It is not financial advice or a recommendation to buy, sell, or hold any cryptocurrency. Crypto markets are highly volatile. Always Do Your Own Research (DYOR) and manage your risk before making any investment decisions.
#BinanceSquare #CryptoAnalysis #TechnicalAnalysis #MemeCoins #CryptoMarket #Trading
Is the $1 dream still alive for #PEPE, or is it just another meme-coin fantasy? Let's look at the market from a technical and fundamental perspective.
📊 1. #PEPE – A Possible Recovery?
As of November 22, #PEPE is trading around 0.00000343 USDT, with a 24-hour gain of approximately 3.63%.
However, the daily chart still shows a bearish structure.
🔎 Key technical indicators:
RSI (14): 30.8 – Near oversold territory.
Immediate Support: 0.00000325
Immediate Resistance: 0.00000354
MACD: Bearish momentum.
A daily close above 0.00000354 could be an early sign of recovery. However, losing 0.00000325 may expose the price to further downside.
📌 2. What About #SHIB and #BTTC?
The meme-coin market isn't just about #PEPE.
🐕 #SHIB: Trading around 0.00000361 USDT, with RSI near 26.0. This suggests oversold conditions, but its overall daily trend remains bearish. Bulls need to reclaim 0.00000376 to strengthen the recovery scenario.
🐵 #BTTC: Trading around 0.00000031 USDT, with RSI near 27.0. The immediate resistance is around 0.00000032, while support sits near 0.00000030.
Both tokens are showing signs of oversold conditions, but oversold doesn't automatically mean a bullish reversal.
🚀 3. Can #PEPE Actually Reach $1?
Here's the reality check.
At its current price, #PEPE would need an astronomical increase of roughly 290,000 times to reach $1.
Its enormous circulating supply makes a $1 valuation extremely difficult to justify under today's market structure.
A strong recovery, new liquidity, increased adoption, major exchange activity, and a sustained bull market could create opportunities for significant upside.
But $1? That's an entirely different level of speculation.
🦁 My Final Thoughts
I believe the more important question right now isn't whether #PEPE can reach $1.
It's whether buyers can regain control, break key resistance levels, and establish a sustainable bullish trend.
Watch volume, RSI, MACD, Bitcoin's direction, and overall market sentiment before making any decisions.
🐸 Meme coins can surprise everyone, but smart traders never ignore risk.
What do you think?
Can #PEPE eventually reach $0.01, $0.10, or even $1? Or is that just a dream?
Let's discuss in the comments! 👇
⚠️ Disclaimer: This post is for educational and informational purposes only. It is not financial advice or a recommendation to buy, sell, or hold any cryptocurrency. Crypto markets are highly volatile. Always Do Your Own Research (DYOR) and manage your risk before making any investment decisions.
#BinanceSquare #CryptoAnalysis #TechnicalAnalysis #MemeCoins #CryptoMarket #Trading
176
·
--

ບົດຄວາມ
$BNB Market Analysis#BNB Rebounds Toward $550 — Short-Term Relief or Bigger Recovery?
After dipping down toward the $503.75 area on the chart and sliding from higher ranges over the past weeks, BNB/USDT has staged a solid bounce to around $549.49 (+4.35% over 24h), pushing right up against the $551.13 24h high. On the 15m chart, price is trading above key moving averages and testing the upper Bollinger Band, showing short-term bullish momentum — though broader multi-week/monthly performance remains in corrective territory.
Technical & Chart Snapshot (BNB/USDT)
Current Price & 24h Range: Trading near $549.49, with a 24h high of $551.13, a 24h low of $522.87, and 24h volume around 60.67M USDT (111,799.70 BNB).
Moving Averages & Bollinger Bands (15m): Price sits above MA(7) ~$546.28, MA(25) ~$541.80, and MA(99) ~$543.15, while hovering right around the BOLL Upper Band (~$548.90) compared to the middle band (~$541.88) and lower band (~$534.87).
Broader Context vs. Short-Term Bounce: While today shows green momentum (+0.48% today / +4.35% 24h), longer timeframes still reflect deeper drawdowns (-6.33% 7D, -24.62% 30D), and order book sentiment leans buyer-heavy (~66.51% vs. ~33.49% on the displayed bar).
Key Levels & What to Watch
Immediate Resistance ($551–$565): Watch whether #BNB can break and hold cleanly above the $551.13–$551.82 zone toward the next chart mark near $565.15, or face short-term profit-taking/rejection near the upper band.
Intraday Support ($541–$546): Holding above MA(7) / MA(25) / MA(99) and the Bollinger mid-band keeps short-term structure constructive.
Deeper Pullback Zones ($535 / $523): If momentum fades, $534.87 (lower band) and the 24h low around $522.87 are key areas to watch for buyer reaction.
Short-term momentum on #BNB looks constructive as price tests the $550–$551 area, but confirming a sustained trend shift requires clean follow-through above resistance and healthy volume rather than overextended spikes.
#BNB #BNBUSDT #CryptoAnalysis #MarketUpdate #BinanceSquare
$BNB $BTC $SOL
Disclaimer: This post is for informational and educational purposes only and does not constitute financial, investment, or trading advice. Cryptocurrency trading involves substantial risk and volatility. Always do your own research (DYOR) and manage your risk carefully.
$BNB Market Analysis
#BNB Rebounds Toward $550 — Short-Term Relief or Bigger Recovery?
After dipping down toward the $503.75 area on the chart and sliding from higher ranges over the past weeks, BNB/USDT has staged a solid bounce to around $549.49 (+4.35% over 24h), pushing right up against the $551.13 24h high. On the 15m chart, price is trading above key moving averages and testing the upper Bollinger Band, showing short-term bullish momentum — though broader multi-week/monthly performance remains in corrective territory.
Technical & Chart Snapshot (BNB/USDT)
Current Price & 24h Range: Trading near $549.49, with a 24h high of $551.13, a 24h low of $522.87, and 24h volume around 60.67M USDT (111,799.70 BNB).
Moving Averages & Bollinger Bands (15m): Price sits above MA(7) ~$546.28, MA(25) ~$541.80, and MA(99) ~$543.15, while hovering right around the BOLL Upper Band (~$548.90) compared to the middle band (~$541.88) and lower band (~$534.87).
Broader Context vs. Short-Term Bounce: While today shows green momentum (+0.48% today / +4.35% 24h), longer timeframes still reflect deeper drawdowns (-6.33% 7D, -24.62% 30D), and order book sentiment leans buyer-heavy (~66.51% vs. ~33.49% on the displayed bar).
Key Levels & What to Watch
Immediate Resistance ($551–$565): Watch whether #BNB can break and hold cleanly above the $551.13–$551.82 zone toward the next chart mark near $565.15, or face short-term profit-taking/rejection near the upper band.
Intraday Support ($541–$546): Holding above MA(7) / MA(25) / MA(99) and the Bollinger mid-band keeps short-term structure constructive.
Deeper Pullback Zones ($535 / $523): If momentum fades, $534.87 (lower band) and the 24h low around $522.87 are key areas to watch for buyer reaction.
Short-term momentum on #BNB looks constructive as price tests the $550–$551 area, but confirming a sustained trend shift requires clean follow-through above resistance and healthy volume rather than overextended spikes.
#BNB #BNBUSDT #CryptoAnalysis #MarketUpdate #BinanceSquare
$BNB $BTC $SOL
Disclaimer: This post is for informational and educational purposes only and does not constitute financial, investment, or trading advice. Cryptocurrency trading involves substantial risk and volatility. Always do your own research (DYOR) and manage your risk carefully.
After dipping down toward the $503.75 area on the chart and sliding from higher ranges over the past weeks, BNB/USDT has staged a solid bounce to around $549.49 (+4.35% over 24h), pushing right up against the $551.13 24h high. On the 15m chart, price is trading above key moving averages and testing the upper Bollinger Band, showing short-term bullish momentum — though broader multi-week/monthly performance remains in corrective territory.
Technical & Chart Snapshot (BNB/USDT)
Current Price & 24h Range: Trading near $549.49, with a 24h high of $551.13, a 24h low of $522.87, and 24h volume around 60.67M USDT (111,799.70 BNB).
Moving Averages & Bollinger Bands (15m): Price sits above MA(7) ~$546.28, MA(25) ~$541.80, and MA(99) ~$543.15, while hovering right around the BOLL Upper Band (~$548.90) compared to the middle band (~$541.88) and lower band (~$534.87).
Broader Context vs. Short-Term Bounce: While today shows green momentum (+0.48% today / +4.35% 24h), longer timeframes still reflect deeper drawdowns (-6.33% 7D, -24.62% 30D), and order book sentiment leans buyer-heavy (~66.51% vs. ~33.49% on the displayed bar).
Key Levels & What to Watch
Immediate Resistance ($551–$565): Watch whether #BNB can break and hold cleanly above the $551.13–$551.82 zone toward the next chart mark near $565.15, or face short-term profit-taking/rejection near the upper band.
Intraday Support ($541–$546): Holding above MA(7) / MA(25) / MA(99) and the Bollinger mid-band keeps short-term structure constructive.
Deeper Pullback Zones ($535 / $523): If momentum fades, $534.87 (lower band) and the 24h low around $522.87 are key areas to watch for buyer reaction.
Short-term momentum on #BNB looks constructive as price tests the $550–$551 area, but confirming a sustained trend shift requires clean follow-through above resistance and healthy volume rather than overextended spikes.
#BNB #BNBUSDT #CryptoAnalysis #MarketUpdate #BinanceSquare
$BNB $BTC $SOL
Disclaimer: This post is for informational and educational purposes only and does not constitute financial, investment, or trading advice. Cryptocurrency trading involves substantial risk and volatility. Always do your own research (DYOR) and manage your risk carefully.
2
1
416
·
--
BTC is Under 60k Again.
What do you think?
$BTC $BNB $DOGE
{future}(BTCUSDT)
{spot}(BNBUSDT)
{future}(DOGEUSDT)
BTC is Under 60k Again.
What do you think?
$BTC $BNB $DOGE
What do you think?
$BTC $BNB $DOGE
Back to 65k
Still 60k as Yesterday
Going Down to 55k
9 ມື້ທີ່ຍັງເຫຼືອ
453
·
--
ບົດຄວາມ
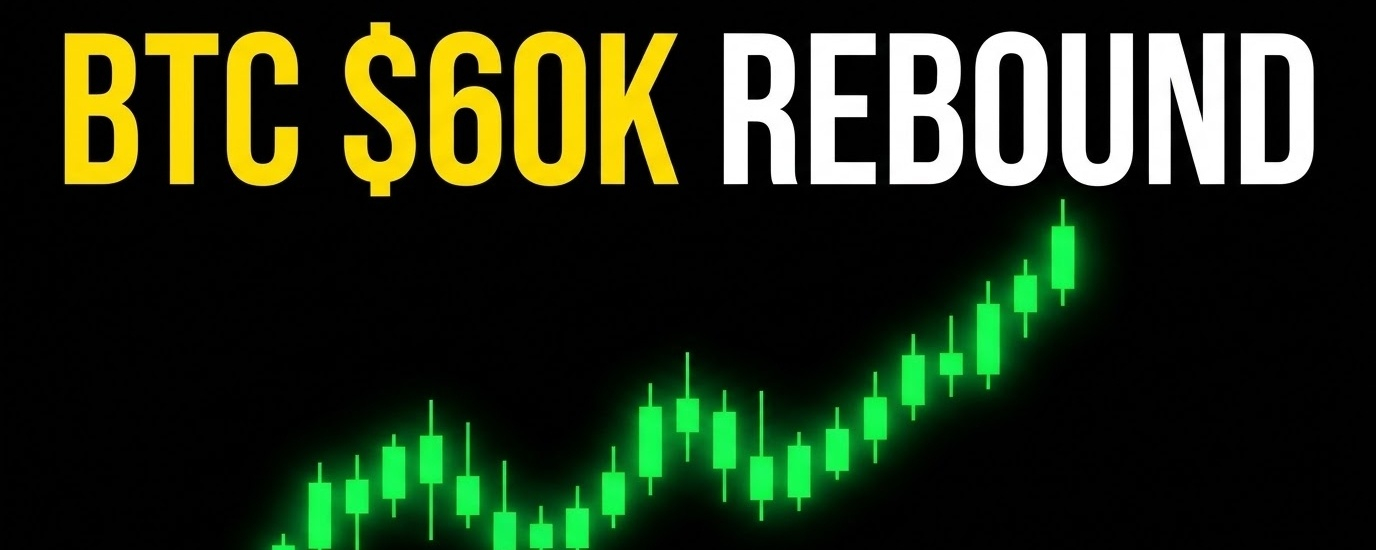
Bitcoin Rebounds to 60k ⬆Bitcoin Rebounds to 60k & Altcoins Follow — Is This the End of the Downtrend?
After sliding below $57,000 during a sharp sell-off, #BTC has staged a rebound back above $60,000 — pulling major altcoins higher alongside it. #ETH has recovered toward the $1,700 level, #BNB bounced back to $550, and #SOL climbed back to $70. While synchronized green across major caps brings welcome relief, calling a full market bottom right away may be premature.
Market Structure & Altcoin Follow-Through
Relief Bounce vs. Trend Reversal: Following heavy liquidations and steep downward momentum, this broad recovery across #BTC, #ETH, #BNB, and #SOL looks primarily like a technical reaction and short-covering bounce rather than a confirmed structural shift.
Altcoin Beta Reaction: Major Layer-1s are responding quickly to #BTC stabilizing above $60,000 — with #SOL rebounding to $70, #BNB reclaiming $550, and #ETH testing $1,700. However, altcoin strength remains heavily dependent on whether #BTC can hold its ground; if #BTC loses $60,000 again, altcoins typically face sharper pullbacks.
Overhead Resistance: Key breakdown zones sit just above current prices — around $62,000–$64,000 for #BTC, $1,800+ for #ETH, $580+ for #BNB, and $75+ for #SOL. Without strong spot buying volume, rallies into overhead supply risk stalling.
What to Watch Next
Holding Key Reclaimed Levels: Sustained daily closes above $60,000 for #BTC alongside #ETH holding $1,700, #BNB holding $550, and #SOL defending $70.
Higher Low Formation: Seeing buyers step in on the next dip to form higher lows on lower timeframes instead of giving back the entire bounce.
Spot Volume & Sentiment: Watching for genuine spot demand rather than leverage-driven squeezes.
Reclaiming $60k and sparking a broader altcoin bounce across #ETH, #BNB, and #SOL is an encouraging first step, but a true trend reversal requires sustained follow-through and market structure confirmation.
#BTC #ETH #BNB #SOL #CryptoAnalysis #MarketUpdate #Altcoins
Disclaimer: This post is for informational and educational purposes only and does not constitute financial, investment, or trading advice. Cryptocurrency markets are highly volatile and carry significant risk. Always do your own research (DYOR) and manage your risk accordingly.
Bitcoin Rebounds to 60k ⬆
Bitcoin Rebounds to 60k & Altcoins Follow — Is This the End of the Downtrend?
After sliding below $57,000 during a sharp sell-off, #BTC has staged a rebound back above $60,000 — pulling major altcoins higher alongside it. #ETH has recovered toward the $1,700 level, #BNB bounced back to $550, and #SOL climbed back to $70. While synchronized green across major caps brings welcome relief, calling a full market bottom right away may be premature.
Market Structure & Altcoin Follow-Through
Relief Bounce vs. Trend Reversal: Following heavy liquidations and steep downward momentum, this broad recovery across #BTC, #ETH, #BNB, and #SOL looks primarily like a technical reaction and short-covering bounce rather than a confirmed structural shift.
Altcoin Beta Reaction: Major Layer-1s are responding quickly to #BTC stabilizing above $60,000 — with #SOL rebounding to $70, #BNB reclaiming $550, and #ETH testing $1,700. However, altcoin strength remains heavily dependent on whether #BTC can hold its ground; if #BTC loses $60,000 again, altcoins typically face sharper pullbacks.
Overhead Resistance: Key breakdown zones sit just above current prices — around $62,000–$64,000 for #BTC, $1,800+ for #ETH, $580+ for #BNB, and $75+ for #SOL. Without strong spot buying volume, rallies into overhead supply risk stalling.
What to Watch Next
Holding Key Reclaimed Levels: Sustained daily closes above $60,000 for #BTC alongside #ETH holding $1,700, #BNB holding $550, and #SOL defending $70.
Higher Low Formation: Seeing buyers step in on the next dip to form higher lows on lower timeframes instead of giving back the entire bounce.
Spot Volume & Sentiment: Watching for genuine spot demand rather than leverage-driven squeezes.
Reclaiming $60k and sparking a broader altcoin bounce across #ETH, #BNB, and #SOL is an encouraging first step, but a true trend reversal requires sustained follow-through and market structure confirmation.
#BTC #ETH #BNB #SOL #CryptoAnalysis #MarketUpdate #Altcoins
Disclaimer: This post is for informational and educational purposes only and does not constitute financial, investment, or trading advice. Cryptocurrency markets are highly volatile and carry significant risk. Always do your own research (DYOR) and manage your risk accordingly.
After sliding below $57,000 during a sharp sell-off, #BTC has staged a rebound back above $60,000 — pulling major altcoins higher alongside it. #ETH has recovered toward the $1,700 level, #BNB bounced back to $550, and #SOL climbed back to $70. While synchronized green across major caps brings welcome relief, calling a full market bottom right away may be premature.
Market Structure & Altcoin Follow-Through
Relief Bounce vs. Trend Reversal: Following heavy liquidations and steep downward momentum, this broad recovery across #BTC, #ETH, #BNB, and #SOL looks primarily like a technical reaction and short-covering bounce rather than a confirmed structural shift.
Altcoin Beta Reaction: Major Layer-1s are responding quickly to #BTC stabilizing above $60,000 — with #SOL rebounding to $70, #BNB reclaiming $550, and #ETH testing $1,700. However, altcoin strength remains heavily dependent on whether #BTC can hold its ground; if #BTC loses $60,000 again, altcoins typically face sharper pullbacks.
Overhead Resistance: Key breakdown zones sit just above current prices — around $62,000–$64,000 for #BTC, $1,800+ for #ETH, $580+ for #BNB, and $75+ for #SOL. Without strong spot buying volume, rallies into overhead supply risk stalling.
What to Watch Next
Holding Key Reclaimed Levels: Sustained daily closes above $60,000 for #BTC alongside #ETH holding $1,700, #BNB holding $550, and #SOL defending $70.
Higher Low Formation: Seeing buyers step in on the next dip to form higher lows on lower timeframes instead of giving back the entire bounce.
Spot Volume & Sentiment: Watching for genuine spot demand rather than leverage-driven squeezes.
Reclaiming $60k and sparking a broader altcoin bounce across #ETH, #BNB, and #SOL is an encouraging first step, but a true trend reversal requires sustained follow-through and market structure confirmation.
#BTC #ETH #BNB #SOL #CryptoAnalysis #MarketUpdate #Altcoins
Disclaimer: This post is for informational and educational purposes only and does not constitute financial, investment, or trading advice. Cryptocurrency markets are highly volatile and carry significant risk. Always do your own research (DYOR) and manage your risk accordingly.
71
·
--
ສັນຍານໝີ
cool
69%
not cool
31%
36 ຄະແນນສຽງ • ປິດລົງຄະແນນສຽງ
3
645
·
--
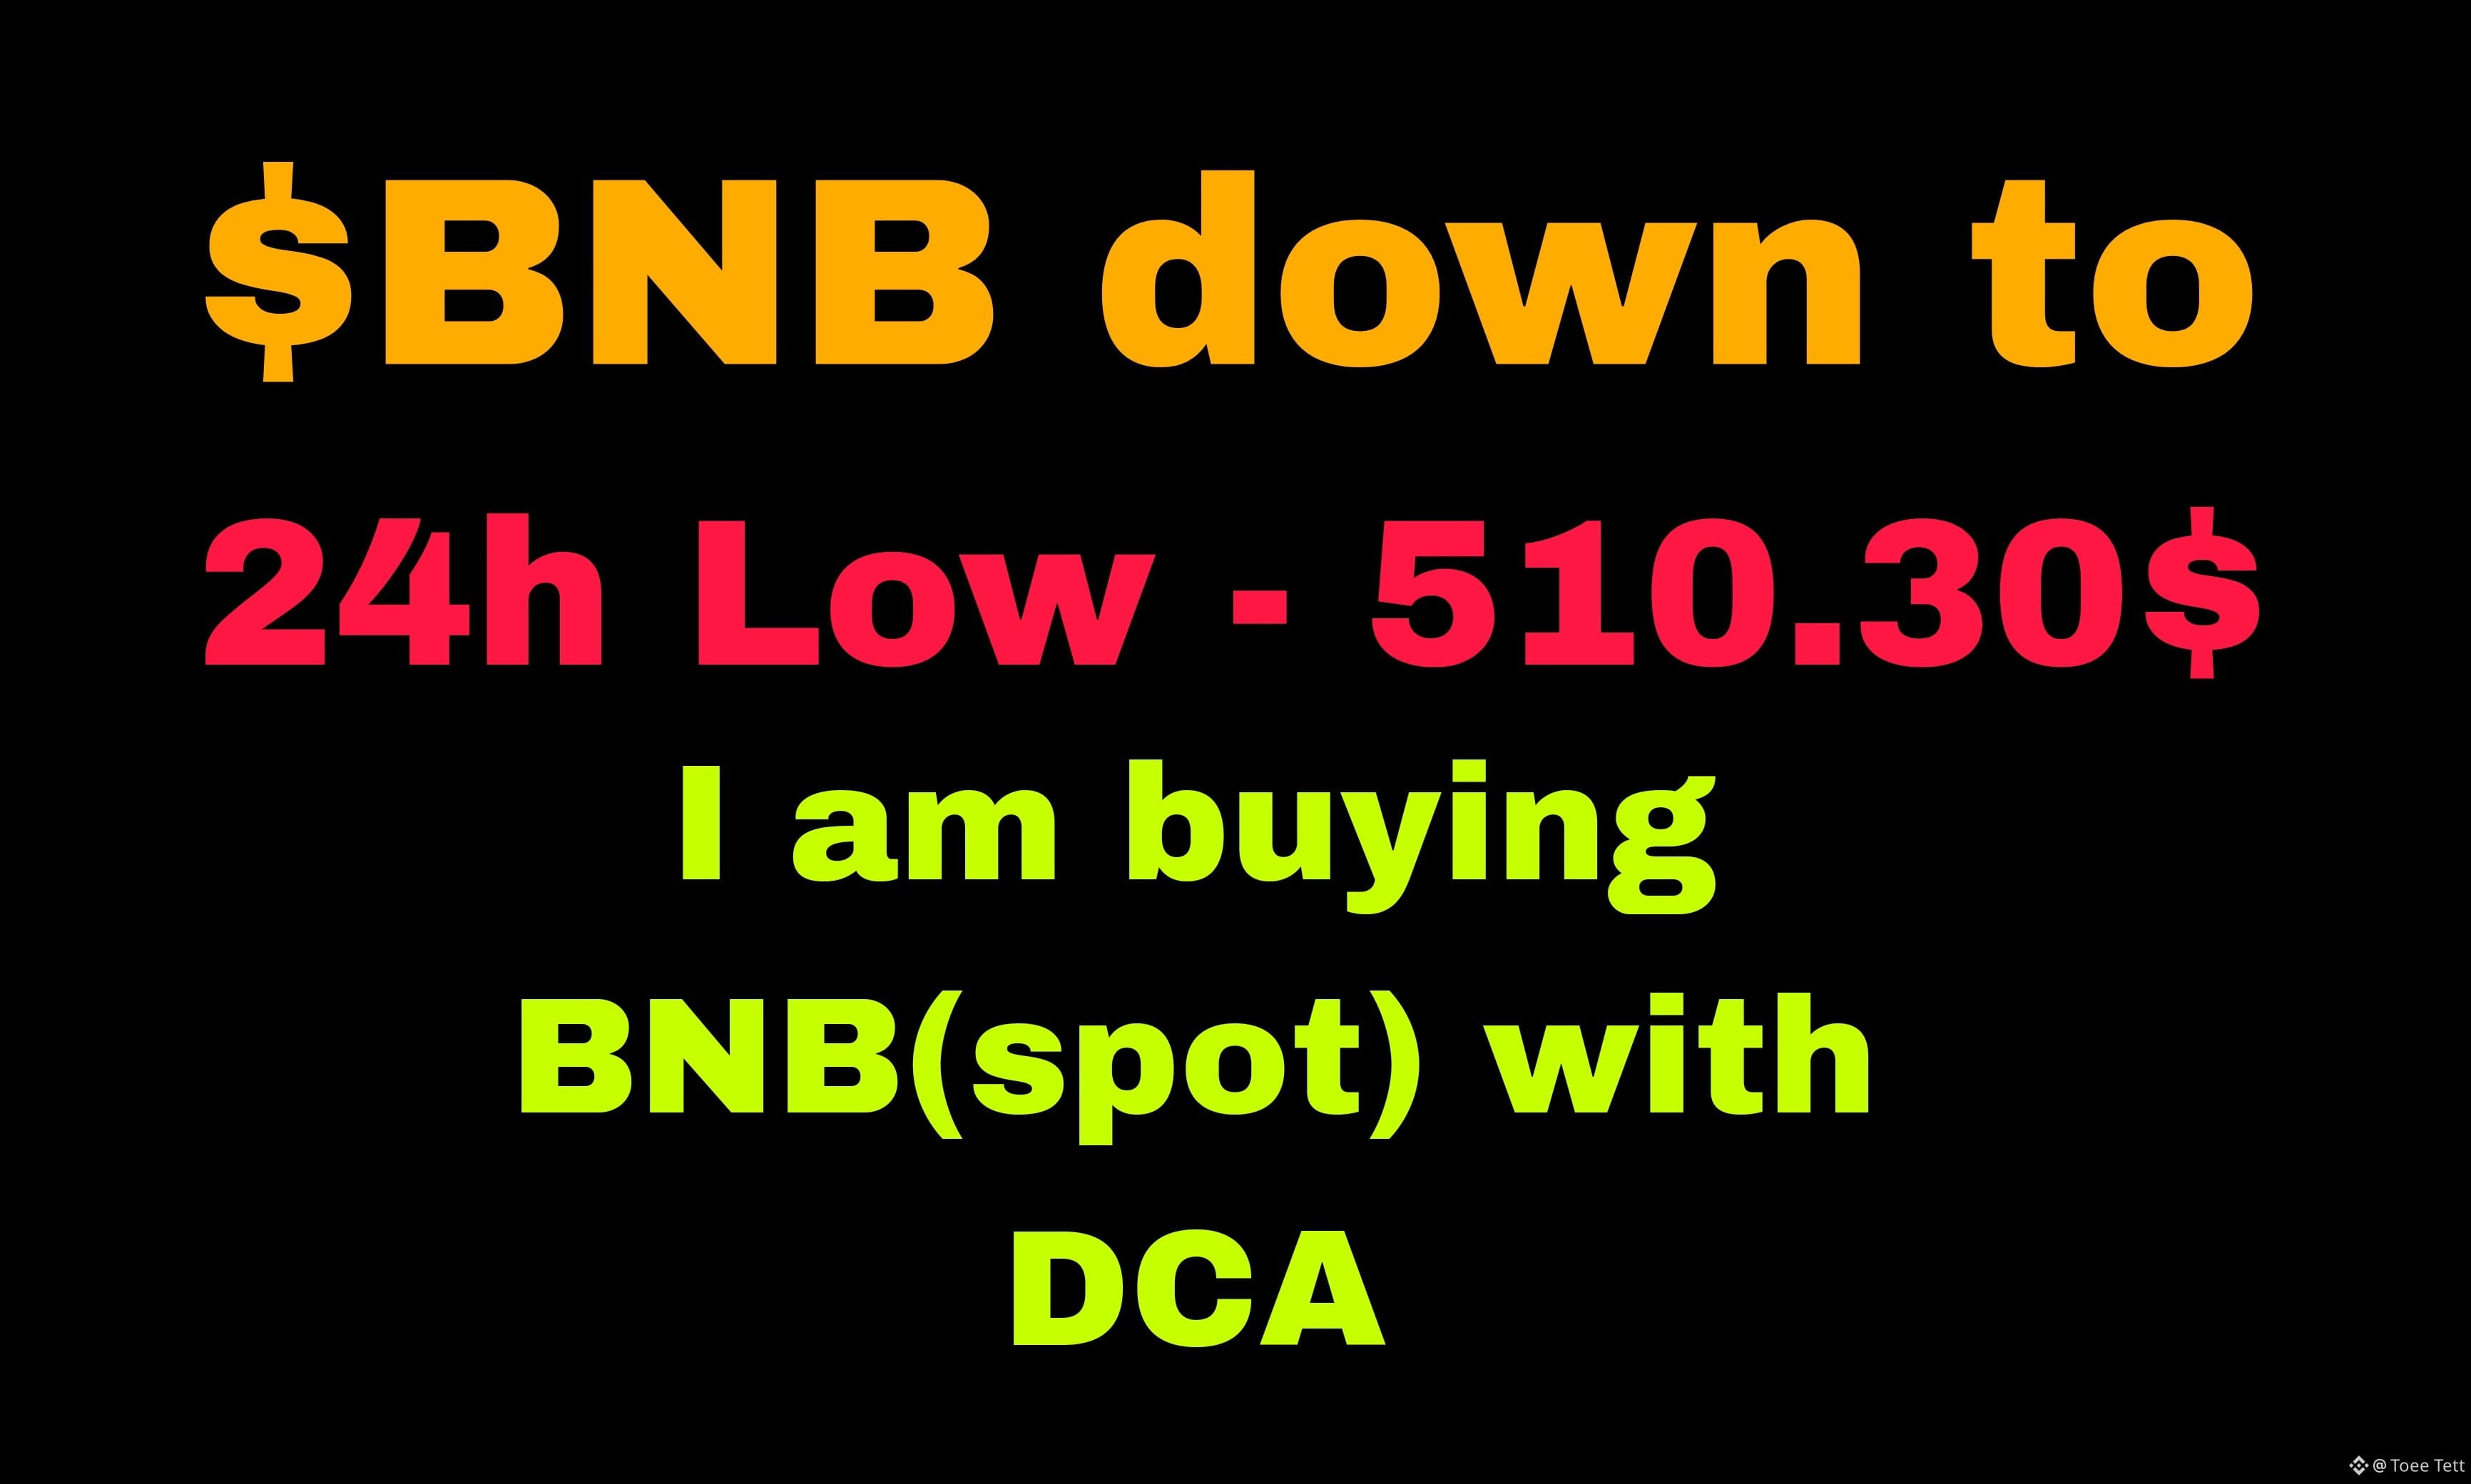
$BNB hit 510.30$ as 24h low.
What's next ❓
I am buying BNB with DCA Strategy on spot,
What do you think❓❓
Let me know your some thoughts on today's market. $BTC $ETH
$BNB hit 510.30$ as 24h low.
What's next ❓
I am buying BNB with DCA Strategy on spot,
What do you think❓❓
Let me know your some thoughts on today's market. $BTC $ETH
What's next ❓
I am buying BNB with DCA Strategy on spot,
What do you think❓❓
Let me know your some thoughts on today's market. $BTC $ETH
128
·
--
What ???? I already hold them at Very Higher Price 😖😖
$BNB $BTC $SOL
{spot}(BNBUSDT)
{spot}(BTCUSDT)
{spot}(SOLUSDT)
What ???? I already hold them at Very Higher Price 😖😖
$BNB $BTC $SOL
$BNB $BTC $SOL
BNB 500$, SOL 60$,BTC55000$ ?
77%
BNB 580$, SOL 80$,BTC62000$ ?
12%
BNB 530$,SOL 72$,BTC 5900$ ?
11%
56 ຄະແນນສຽງ • ປິດລົງຄະແນນສຽງ
1.4k
·
--
1000LUNC Or LUNC
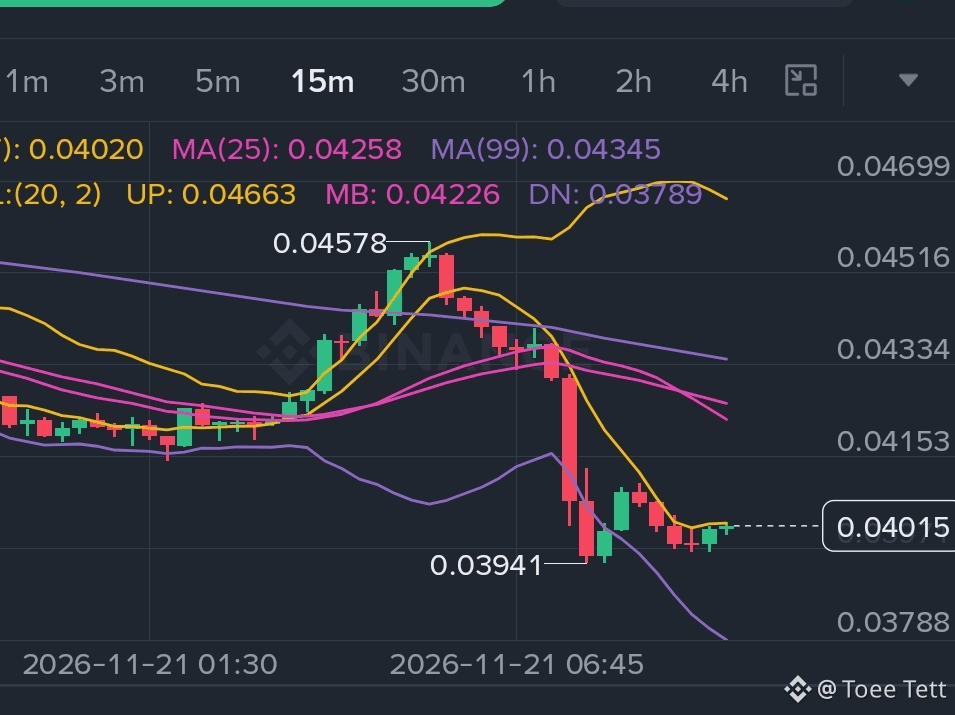
Price Action & Trend: After climbing to 0.04578, price experienced a steep bearish breakdown down to 0.03941, followed by a quick rebound into a tight 0.03941–0.04150 range. Because MA(7) < MA(25) < MA(99) and price is below the Bollinger middle band (0.04226), the broader short-term structure on this 15m view remains bearish-to-range-bound unless buyers reclaim higher levels.
Key Levels to Watch:
Support: 0.04010–0.04011 (order book bid cluster), then 0.03941 (recent swing low), followed by the lower Bollinger Band around 0.03789.
Resistance: 0.04020 (MA(7)), 0.04153 (chart tick/range area), and 0.04226–0.04258 (Bollinger mid-band and MA(25)).
.
Risk & Execution Notes
20x Leverage on a Volatile Mover: Down -11.23% on the day, a ~5% adverse move against a 20x position equals a 100% move on margin before fees. Using Isolated margin caps the loss at the allocated margin for that specific position, though slippage and rapid wicks are common during high volatility.
Funding & Order Placement: The negative funding rate (-0.10196%) slightly favors longs at funding settlement, while the order book currently shows heavier ask/sell weight (61.30%). Also note that Avbl is 0.00 USDT, so funds would need to be transferred to the USDⓈ-M Futures wallet before an order can fill.
Disclaimers‼️: This is not a financial advice , Just for informational purpose. Do your Own Research. And Make decision by yourself.
(This is technical/market observation for educational purposes, not financial advice.)
Are you looking to trade a bounce off the 0.03941–0.04010 support zone, or waiting for a breakdown/retest confirmation?
$LUNC $ZEC $BCH
{spot}(LUNCUSDT)
{spot}(BTCUSDT)
#1000LUNC/USDT #LUNC✅ #Market_Update #technicalanalyst #BinanceSquareTalks
1000LUNC Or LUNC
Price Action & Trend: After climbing to 0.04578, price experienced a steep bearish breakdown down to 0.03941, followed by a quick rebound into a tight 0.03941–0.04150 range. Because MA(7) < MA(25) < MA(99) and price is below the Bollinger middle band (0.04226), the broader short-term structure on this 15m view remains bearish-to-range-bound unless buyers reclaim higher levels.
Key Levels to Watch:
Support: 0.04010–0.04011 (order book bid cluster), then 0.03941 (recent swing low), followed by the lower Bollinger Band around 0.03789.
Resistance: 0.04020 (MA(7)), 0.04153 (chart tick/range area), and 0.04226–0.04258 (Bollinger mid-band and MA(25)).
.
Risk & Execution Notes
20x Leverage on a Volatile Mover: Down -11.23% on the day, a ~5% adverse move against a 20x position equals a 100% move on margin before fees. Using Isolated margin caps the loss at the allocated margin for that specific position, though slippage and rapid wicks are common during high volatility.
Funding & Order Placement: The negative funding rate (-0.10196%) slightly favors longs at funding settlement, while the order book currently shows heavier ask/sell weight (61.30%). Also note that Avbl is 0.00 USDT, so funds would need to be transferred to the USDⓈ-M Futures wallet before an order can fill.
Disclaimers‼️: This is not a financial advice , Just for informational purpose. Do your Own Research. And Make decision by yourself.
(This is technical/market observation for educational purposes, not financial advice.)
Are you looking to trade a bounce off the 0.03941–0.04010 support zone, or waiting for a breakdown/retest confirmation?
$LUNC $ZEC $BCH
#1000LUNC/USDT #LUNC✅ #Market_Update #technicalanalyst #BinanceSquareTalks
Price Action & Trend: After climbing to 0.04578, price experienced a steep bearish breakdown down to 0.03941, followed by a quick rebound into a tight 0.03941–0.04150 range. Because MA(7) < MA(25) < MA(99) and price is below the Bollinger middle band (0.04226), the broader short-term structure on this 15m view remains bearish-to-range-bound unless buyers reclaim higher levels.
Key Levels to Watch:
Support: 0.04010–0.04011 (order book bid cluster), then 0.03941 (recent swing low), followed by the lower Bollinger Band around 0.03789.
Resistance: 0.04020 (MA(7)), 0.04153 (chart tick/range area), and 0.04226–0.04258 (Bollinger mid-band and MA(25)).
.
Risk & Execution Notes
20x Leverage on a Volatile Mover: Down -11.23% on the day, a ~5% adverse move against a 20x position equals a 100% move on margin before fees. Using Isolated margin caps the loss at the allocated margin for that specific position, though slippage and rapid wicks are common during high volatility.
Funding & Order Placement: The negative funding rate (-0.10196%) slightly favors longs at funding settlement, while the order book currently shows heavier ask/sell weight (61.30%). Also note that Avbl is 0.00 USDT, so funds would need to be transferred to the USDⓈ-M Futures wallet before an order can fill.
Disclaimers‼️: This is not a financial advice , Just for informational purpose. Do your Own Research. And Make decision by yourself.
(This is technical/market observation for educational purposes, not financial advice.)
Are you looking to trade a bounce off the 0.03941–0.04010 support zone, or waiting for a breakdown/retest confirmation?
$LUNC $ZEC $BCH
#1000LUNC/USDT #LUNC✅ #Market_Update #technicalanalyst #BinanceSquareTalks
386
·
--
ສັນຍານໝີ
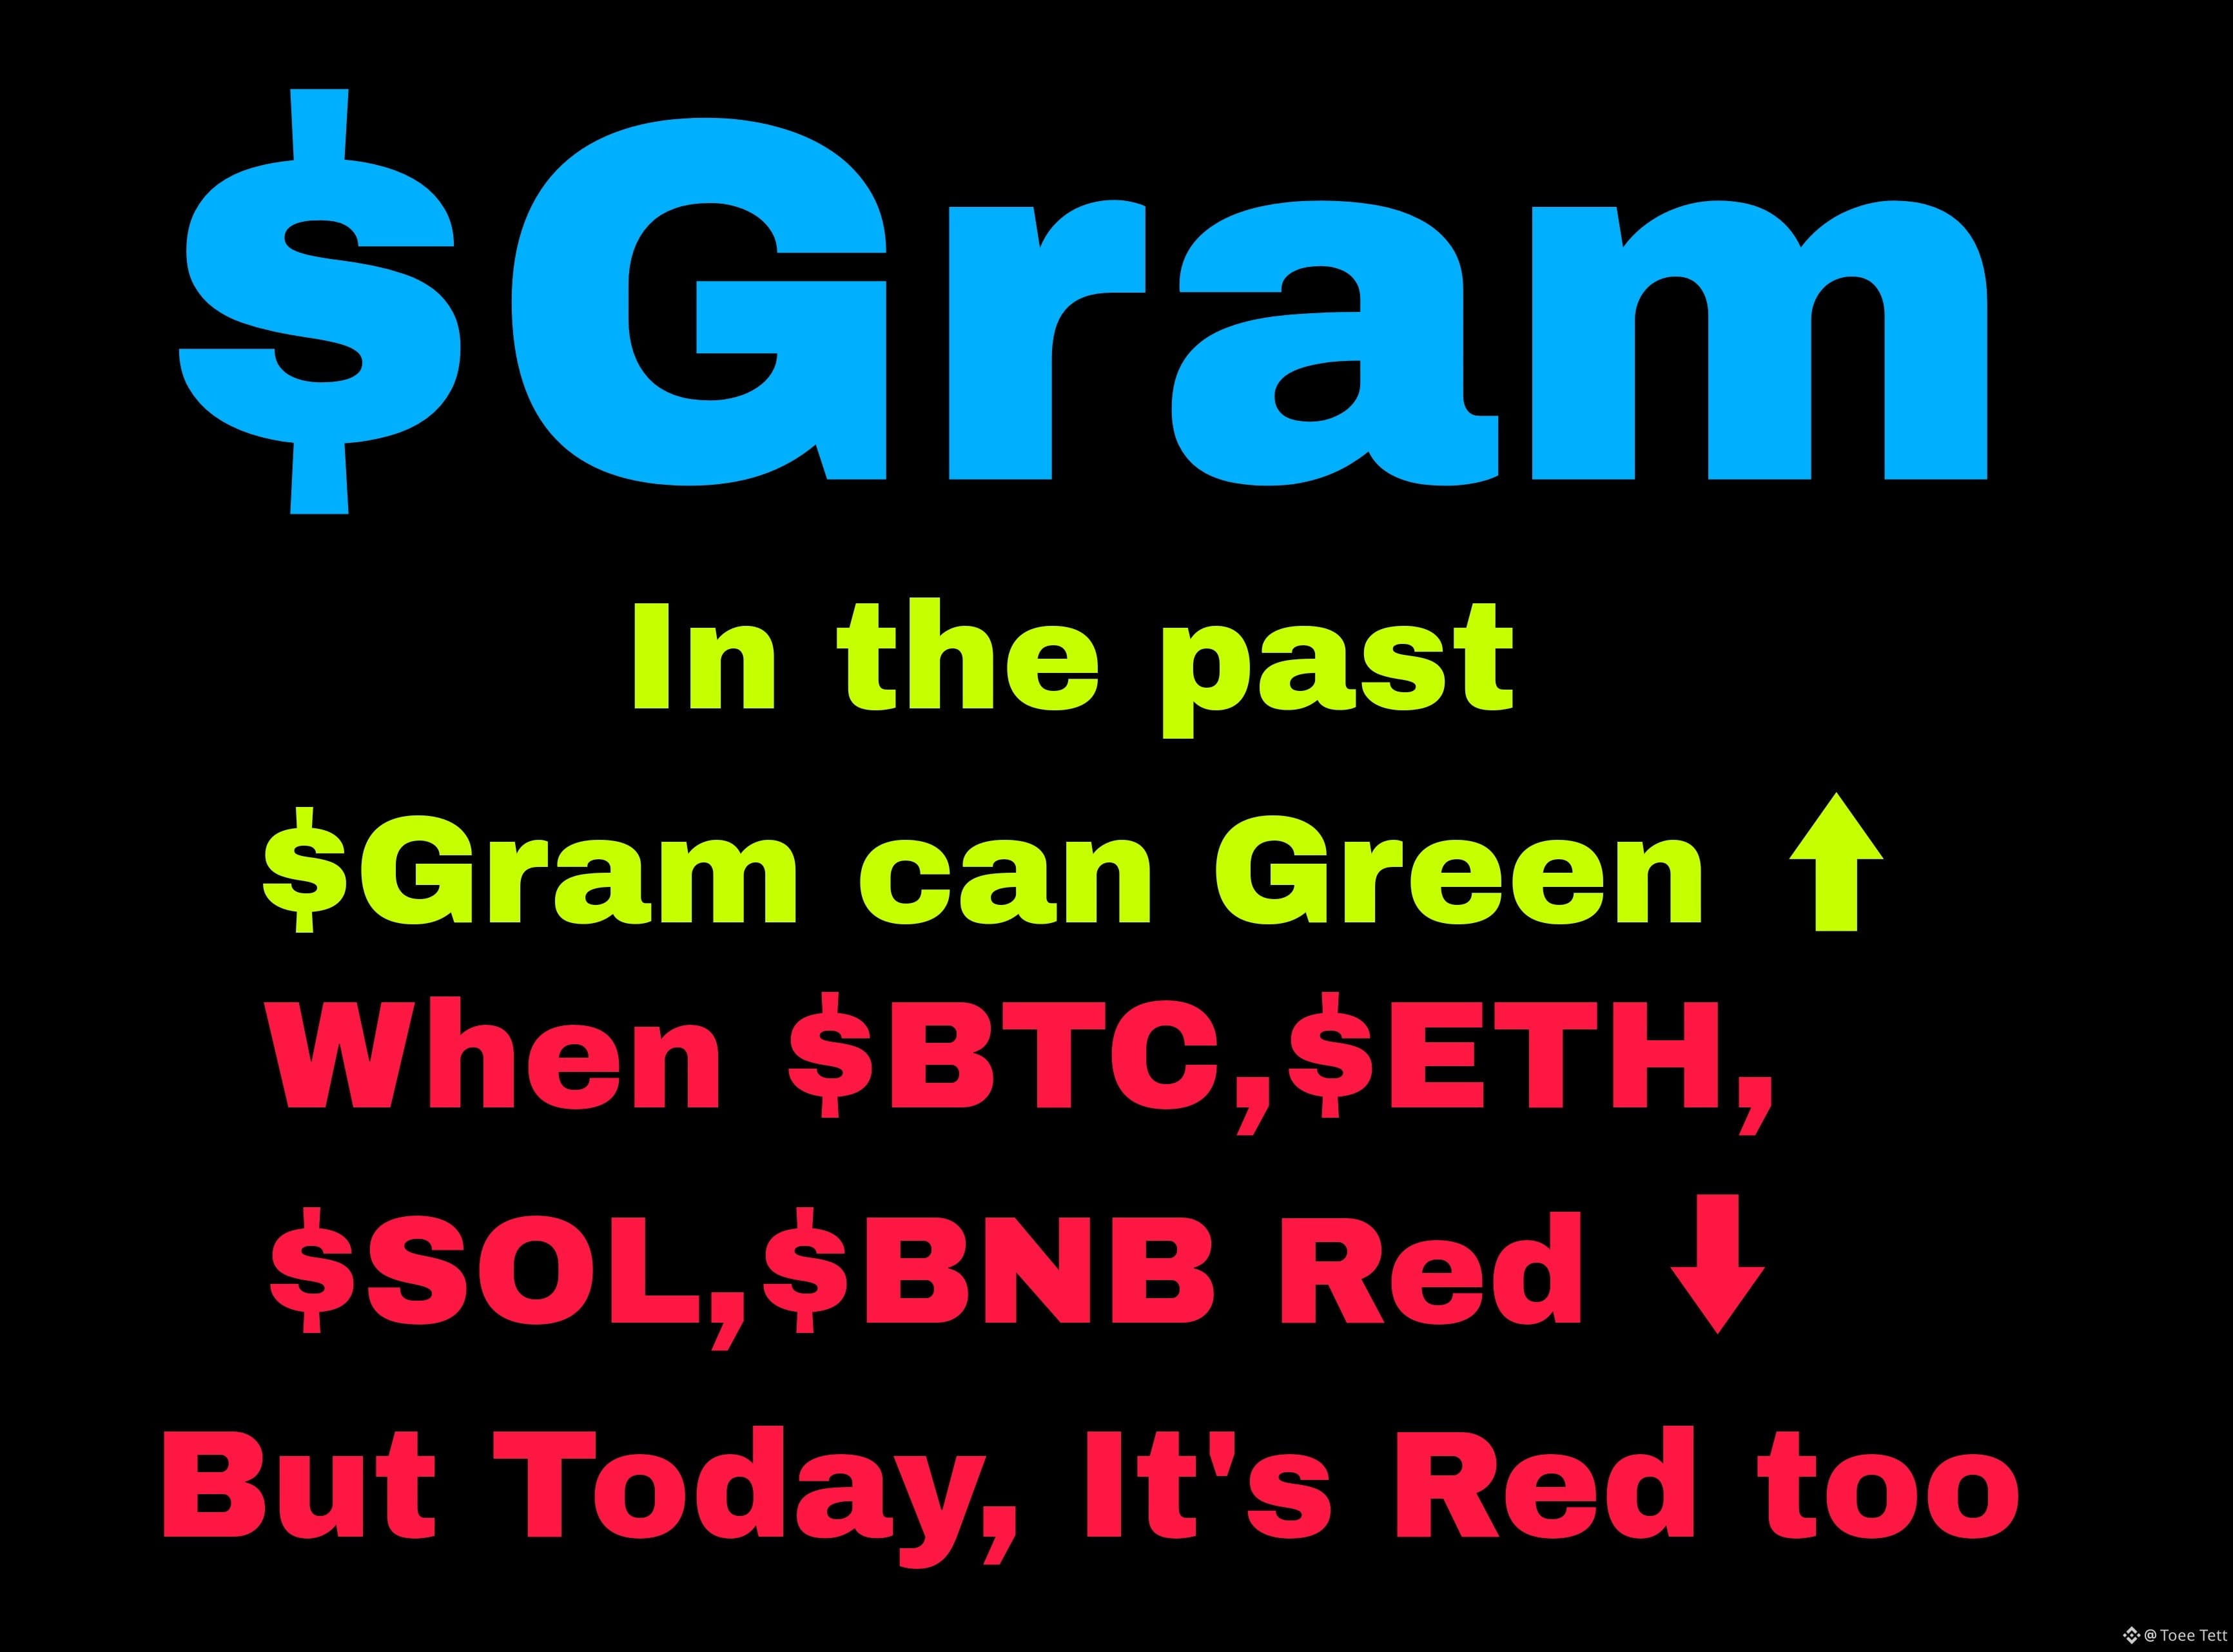
$GRAM is trading around $0.964 (-4.93% over 24h) on the daily chart, hovering near its 24h low of $0.956 against a 24h high of $1.029 and 24h volume of $8.58M (8.62M GRAM). Broader momentum remains bearish following a multi-week downtrend (7D: -14.54%, 30D: -29.12%, 90D: -33.33%).
Key Levels & Indicators (1D):
Moving Averages: Price sits below MA(7) at $1.028, MA(25) at $1.106, and MA(99) at $1.325, keeping overhead trend pressure heavy.
Bollinger Bands (20, 2): Hugging the lower band (DN: $0.952), with MB: $1.083 and UP: $1.213 acting as key upside reference zones.
Order Book: Shows 59.98% buy-side vs. 40.02% sell-side depth as price tests support.
What to Watch Next:
Support: Holding above $0.952–$0.956 is critical to avoid deeper downside discovery.
Resistance: Reclaiming $1.028–$1.083 would be an early sign of stabilization.
Educational and informational purposes only—not financial advice. Always DYOR and manage risk.
$BTC $BNB
{future}(GRAMUSDT)
{future}(BNBUSDT)
{future}(BTCUSDT)
#GRAM #GRAMUSDT #CryptoAnalysis #Altcoins #BinanceSquare
$GRAM is trading around $0.964 (-4.93% over 24h) on the daily chart, hovering near its 24h low of $0.956 against a 24h high of $1.029 and 24h volume of $8.58M (8.62M GRAM). Broader momentum remains bearish following a multi-week downtrend (7D: -14.54%, 30D: -29.12%, 90D: -33.33%).
Key Levels & Indicators (1D):
Moving Averages: Price sits below MA(7) at $1.028, MA(25) at $1.106, and MA(99) at $1.325, keeping overhead trend pressure heavy.
Bollinger Bands (20, 2): Hugging the lower band (DN: $0.952), with MB: $1.083 and UP: $1.213 acting as key upside reference zones.
Order Book: Shows 59.98% buy-side vs. 40.02% sell-side depth as price tests support.
What to Watch Next:
Support: Holding above $0.952–$0.956 is critical to avoid deeper downside discovery.
Resistance: Reclaiming $1.028–$1.083 would be an early sign of stabilization.
Educational and informational purposes only—not financial advice. Always DYOR and manage risk.
$BTC $BNB
#GRAM #GRAMUSDT #CryptoAnalysis #Altcoins #BinanceSquare
Key Levels & Indicators (1D):
Moving Averages: Price sits below MA(7) at $1.028, MA(25) at $1.106, and MA(99) at $1.325, keeping overhead trend pressure heavy.
Bollinger Bands (20, 2): Hugging the lower band (DN: $0.952), with MB: $1.083 and UP: $1.213 acting as key upside reference zones.
Order Book: Shows 59.98% buy-side vs. 40.02% sell-side depth as price tests support.
What to Watch Next:
Support: Holding above $0.952–$0.956 is critical to avoid deeper downside discovery.
Resistance: Reclaiming $1.028–$1.083 would be an early sign of stabilization.
Educational and informational purposes only—not financial advice. Always DYOR and manage risk.
$BTC $BNB
#GRAM #GRAMUSDT #CryptoAnalysis #Altcoins #BinanceSquare
474
·
--
$BTC Bitcoin is trading around $59,143.17 (-4.68% over 24h) on the 15m chart after bouncing off a 24h low of $57,778.35 (24h high: $62,639.52, 24h volume: $2.31B / 38,421.35 BTC).
Key Technical Levels & Indicators (15m):
Moving Averages: Price is currently holding above MA(7) at $59,032.02 and MA(25) at $58,829.87, while MA(99) sits higher overhead around $60,714.53 as major dynamic resistance.
Bollinger Bands (20, 2): Trading near the upper-middle zone below UP: $59,511.81, with MB (mid-band): $58,931.08 acting as nearby support and DN (lower band): $58,350.35 below.
Order Book & Momentum: Order book shows roughly 69.48% buy-side vs. 30.52% sell-side depth, though broader timeframe performance remains under pressure (7D: -13.90%, 30D: -30.05%).
What to Watch Next:
Bullish Scenario: A clean 15m push and hold above $59,510–$59,700 with rising volume could open room toward $60,700.
Bearish Scenario: Failure to clear $59,500 or a drop back below $58,830–$58,930 could retest $58,350 or the $57,778 swing low.
$BNB $ETH
Disclaimer: This post is for informational and educational purposes only and does not constitute financial or investment advice. Always do your own research (DYOR) and manage risk carefully.
#BTC #bitcoin #CryptoAnalysis" #BTCUSDT. #BİNANCESQUARE #analysis
$BTC Bitcoin is trading around $59,143.17 (-4.68% over 24h) on the 15m chart after bouncing off a 24h low of $57,778.35 (24h high: $62,639.52, 24h volume: $2.31B / 38,421.35 BTC).
Key Technical Levels & Indicators (15m):
Moving Averages: Price is currently holding above MA(7) at $59,032.02 and MA(25) at $58,829.87, while MA(99) sits higher overhead around $60,714.53 as major dynamic resistance.
Bollinger Bands (20, 2): Trading near the upper-middle zone below UP: $59,511.81, with MB (mid-band): $58,931.08 acting as nearby support and DN (lower band): $58,350.35 below.
Order Book & Momentum: Order book shows roughly 69.48% buy-side vs. 30.52% sell-side depth, though broader timeframe performance remains under pressure (7D: -13.90%, 30D: -30.05%).
What to Watch Next:
Bullish Scenario: A clean 15m push and hold above $59,510–$59,700 with rising volume could open room toward $60,700.
Bearish Scenario: Failure to clear $59,500 or a drop back below $58,830–$58,930 could retest $58,350 or the $57,778 swing low.
$BNB $ETH
Disclaimer: This post is for informational and educational purposes only and does not constitute financial or investment advice. Always do your own research (DYOR) and manage risk carefully.
#BTC #bitcoin #CryptoAnalysis" #BTCUSDT. #BİNANCESQUARE #analysis
Key Technical Levels & Indicators (15m):
Moving Averages: Price is currently holding above MA(7) at $59,032.02 and MA(25) at $58,829.87, while MA(99) sits higher overhead around $60,714.53 as major dynamic resistance.
Bollinger Bands (20, 2): Trading near the upper-middle zone below UP: $59,511.81, with MB (mid-band): $58,931.08 acting as nearby support and DN (lower band): $58,350.35 below.
Order Book & Momentum: Order book shows roughly 69.48% buy-side vs. 30.52% sell-side depth, though broader timeframe performance remains under pressure (7D: -13.90%, 30D: -30.05%).
What to Watch Next:
Bullish Scenario: A clean 15m push and hold above $59,510–$59,700 with rising volume could open room toward $60,700.
Bearish Scenario: Failure to clear $59,500 or a drop back below $58,830–$58,930 could retest $58,350 or the $57,778 swing low.
$BNB $ETH
Disclaimer: This post is for informational and educational purposes only and does not constitute financial or investment advice. Always do your own research (DYOR) and manage risk carefully.
#BTC #bitcoin #CryptoAnalysis" #BTCUSDT. #BİNANCESQUARE #analysis
96
·
--
ສັນຍານໝີ
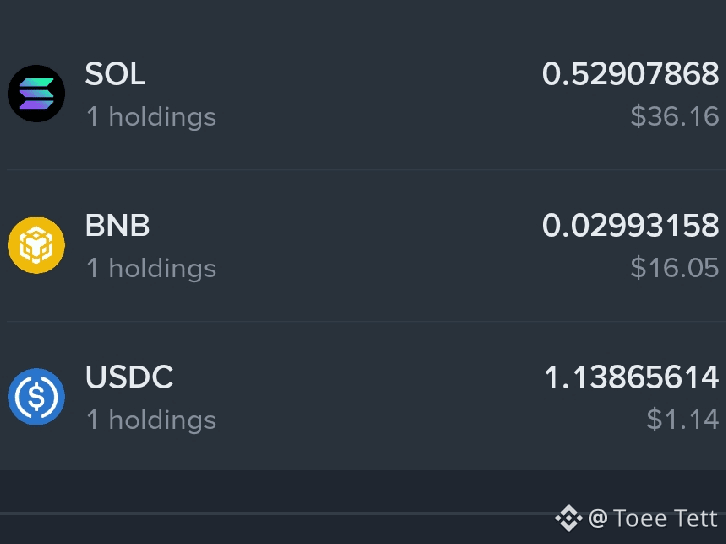
$BNB $SOL $USDC
Should I keep Holding or What?
What should I do?
What do you think about that??
I know the risk and DYOR, I just want to know your opinion.
#DYOR #BinanceSquareTalks #BNBToken #SolanaUSTD
$BNB $SOL $USDC
Should I keep Holding or What?
What should I do?
What do you think about that??
I know the risk and DYOR, I just want to know your opinion.
#DYOR #BinanceSquareTalks #BNBToken #SolanaUSTD
Should I keep Holding or What?
What should I do?
What do you think about that??
I know the risk and DYOR, I just want to know your opinion.
#DYOR #BinanceSquareTalks #BNBToken #SolanaUSTD
54
·
--
$BNB NB Market Update: Heavy Selling Pressure Continues — Key Support Levels to Watch
$BNB is currently trading around $532.83 (down -9.13% over the past 24 hours), after touching an intraday low of $530.85.
📊 Technical Breakdown (15m Timeframe):
Trend & Moving Averages: Price remains firmly below key moving averages — MA(7): $539.30, MA(25): $551.72, and MA(99): $569.05 — confirming that short-term bearish momentum is still in control.
Bollinger Bands: $BNB is hovering near the lower Bollinger Band (DN: $528.26), testing local support around the $530–$531 zone.
Order Book: Short-term buyers are showing interest (67.98% Bid vs. 32.02% Ask), though strong confirmation is still needed before calling a reversal.
🎯 Key Levels on My Radar:
Support Zone: $528 – $531 (A clean breakdown below this zone could open the door for further downside).
Resistance Zone: $539 – $552 (Bulls need to reclaim these MA levels to shift short-term momentum).
Are you buying this dip on Spot or waiting for clearer confirmation? Drop your thoughts below! 👇
Disclaimer: This content is for informational and educational purposes only and does not constitute financial advice. Always manage your risk and do your own research (DYOR).
#BNB #BNBUSDT #CryptoAnalysis
#TradingView #DYOR
$BNB NB Market Update: Heavy Selling Pressure Continues — Key Support Levels to Watch
$BNB is currently trading around $532.83 (down -9.13% over the past 24 hours), after touching an intraday low of $530.85.
📊 Technical Breakdown (15m Timeframe):
Trend & Moving Averages: Price remains firmly below key moving averages — MA(7): $539.30, MA(25): $551.72, and MA(99): $569.05 — confirming that short-term bearish momentum is still in control.
Bollinger Bands: $BNB is hovering near the lower Bollinger Band (DN: $528.26), testing local support around the $530–$531 zone.
Order Book: Short-term buyers are showing interest (67.98% Bid vs. 32.02% Ask), though strong confirmation is still needed before calling a reversal.
🎯 Key Levels on My Radar:
Support Zone: $528 – $531 (A clean breakdown below this zone could open the door for further downside).
Resistance Zone: $539 – $552 (Bulls need to reclaim these MA levels to shift short-term momentum).
Are you buying this dip on Spot or waiting for clearer confirmation? Drop your thoughts below! 👇
Disclaimer: This content is for informational and educational purposes only and does not constitute financial advice. Always manage your risk and do your own research (DYOR).
#BNB #BNBUSDT #CryptoAnalysis
#TradingView #DYOR
$BNB is currently trading around $532.83 (down -9.13% over the past 24 hours), after touching an intraday low of $530.85.
📊 Technical Breakdown (15m Timeframe):
Trend & Moving Averages: Price remains firmly below key moving averages — MA(7): $539.30, MA(25): $551.72, and MA(99): $569.05 — confirming that short-term bearish momentum is still in control.
Bollinger Bands: $BNB is hovering near the lower Bollinger Band (DN: $528.26), testing local support around the $530–$531 zone.
Order Book: Short-term buyers are showing interest (67.98% Bid vs. 32.02% Ask), though strong confirmation is still needed before calling a reversal.
🎯 Key Levels on My Radar:
Support Zone: $528 – $531 (A clean breakdown below this zone could open the door for further downside).
Resistance Zone: $539 – $552 (Bulls need to reclaim these MA levels to shift short-term momentum).
Are you buying this dip on Spot or waiting for clearer confirmation? Drop your thoughts below! 👇
Disclaimer: This content is for informational and educational purposes only and does not constitute financial advice. Always manage your risk and do your own research (DYOR).
#BNB #BNBUSDT #CryptoAnalysis
#TradingView #DYOR
59
·
--
ສັນຍານໝີ
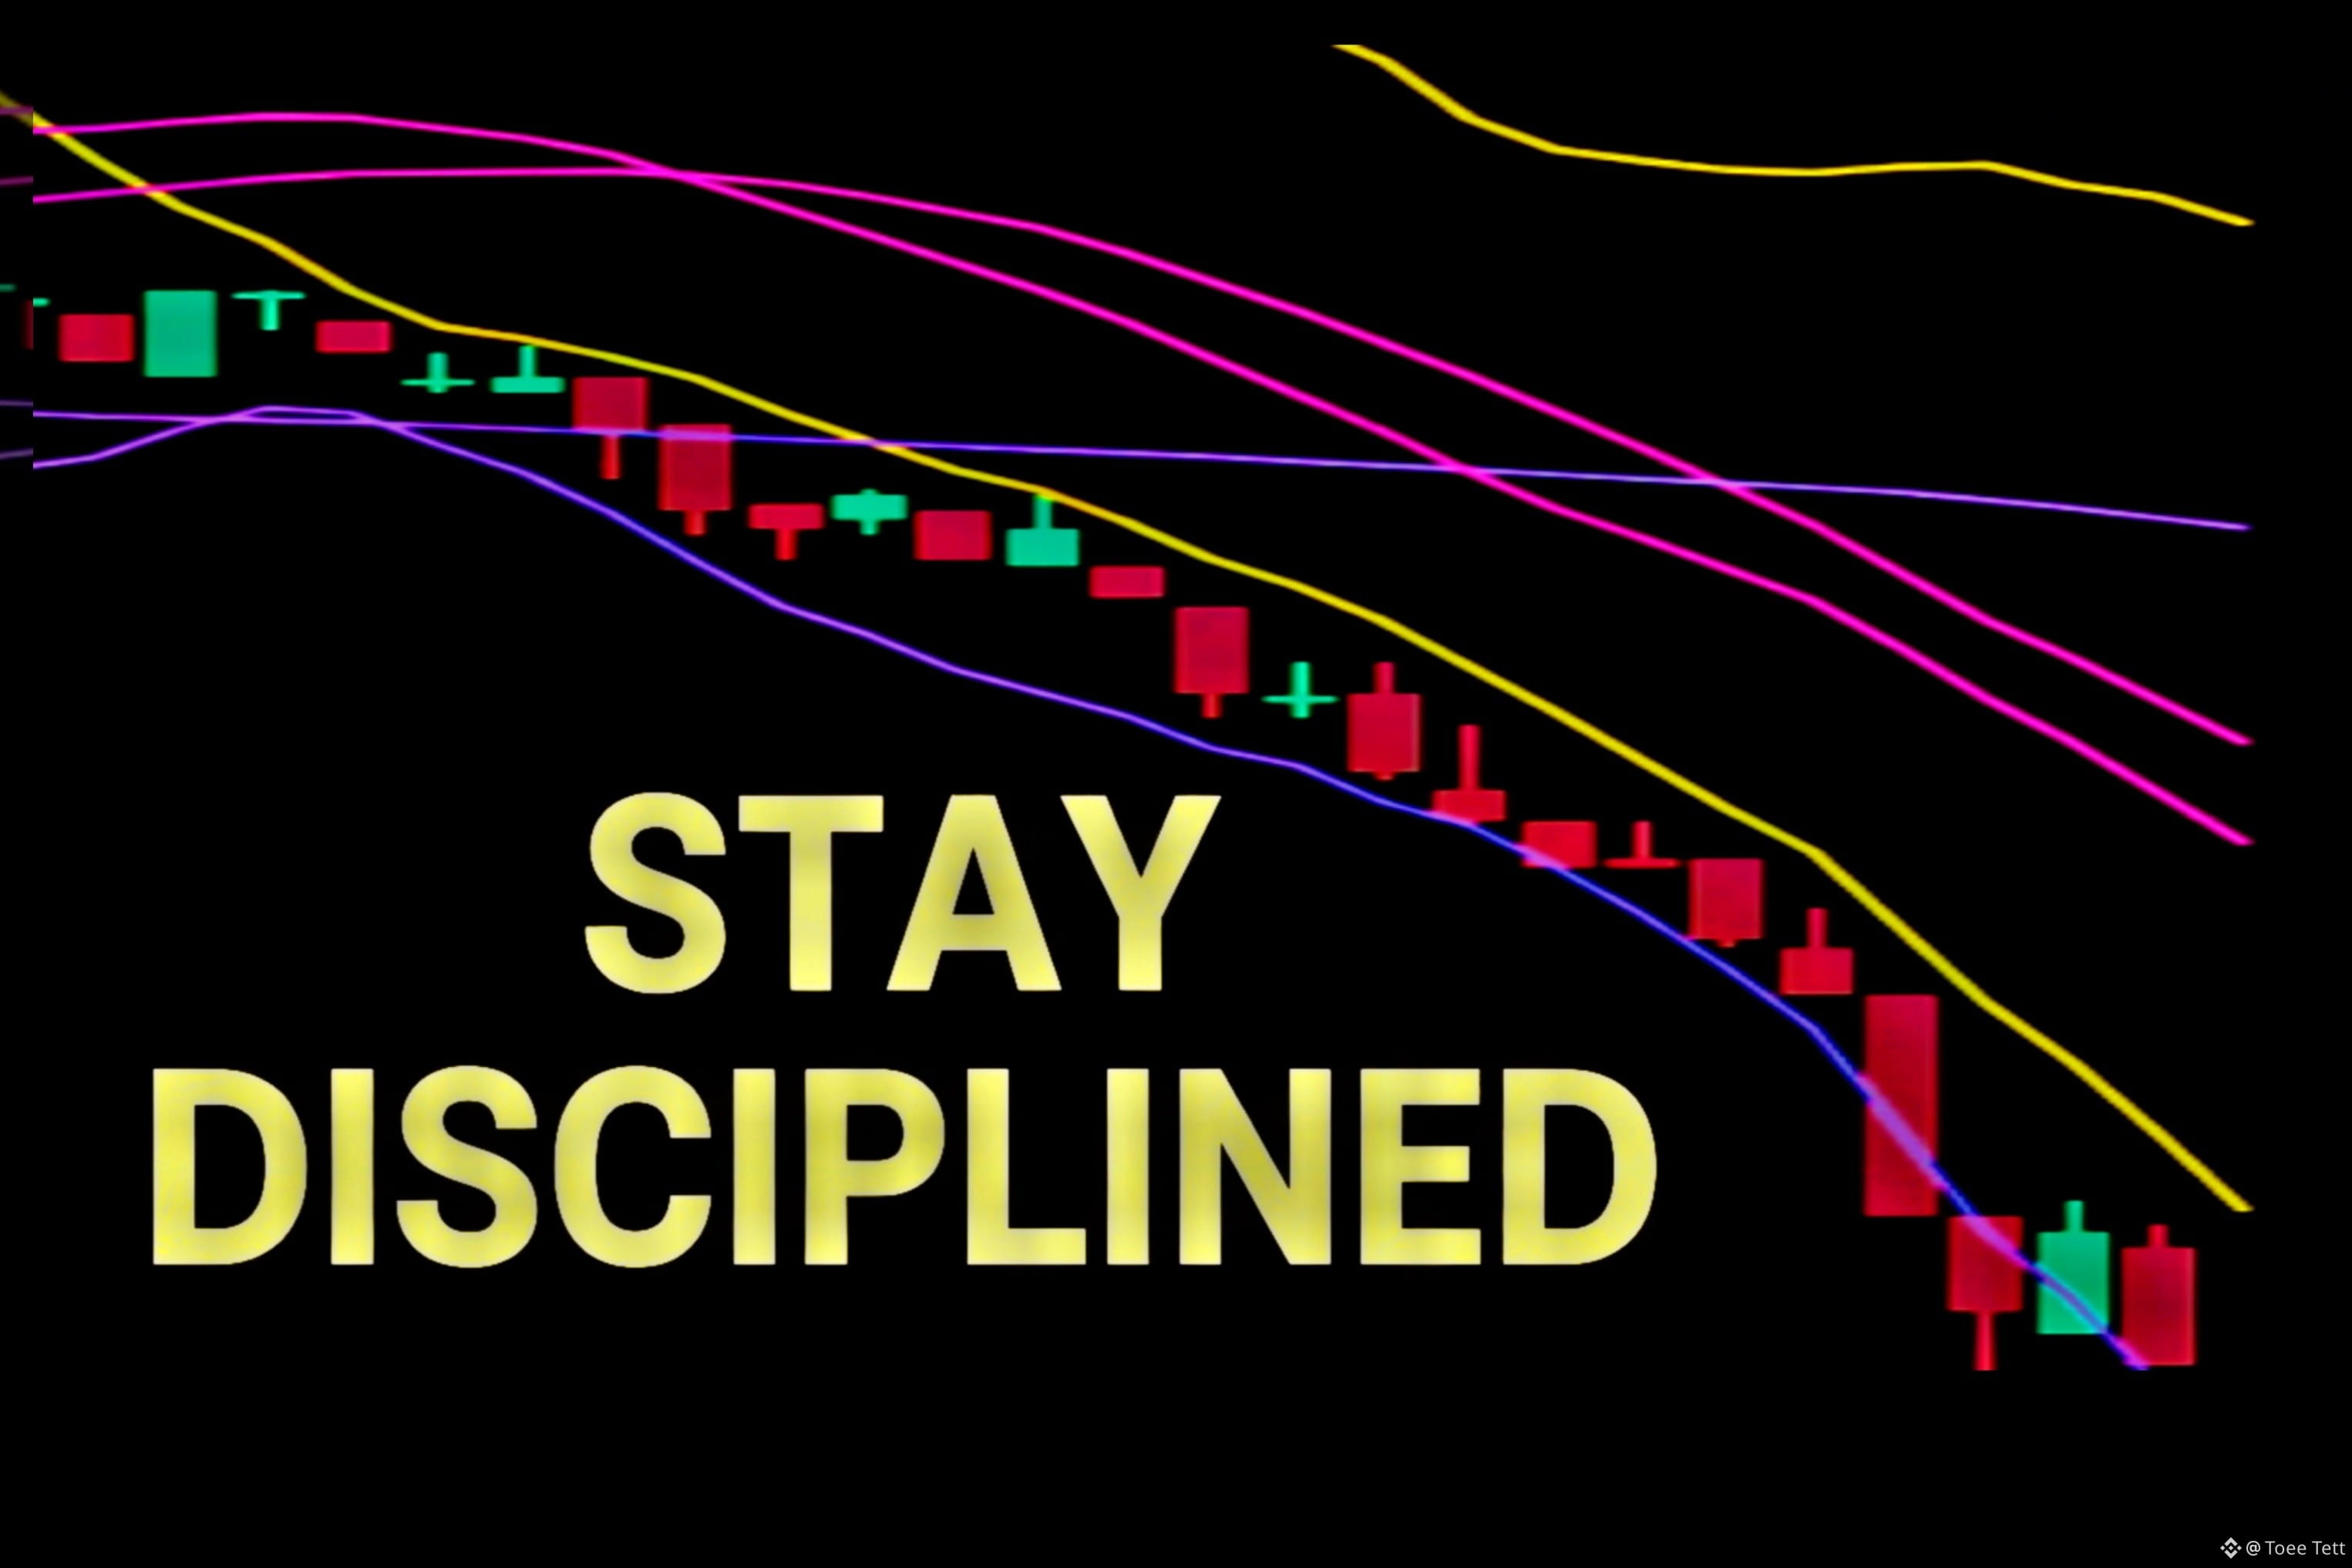
Surviving Red Markets: Essential Strategies for Beginners
$BTC $BNB $SPCXB
Seeing a sea of red on your screen can be stressful, especially when sentiment is heavy. During uncertain market days, survival and discipline matter far more than trying to force quick gains.
Here are key strategies to keep in mind when the market turns red:
Risk Management: Never put more capital at risk than you can comfortably afford to lose. Protect your core balance first so you stay in the game.
Stop Loss: Always know your exit level before entering a trade. A planned stop loss turns potential chaos into a controlled, manageable outcome.
Not Winning Is Better Than Losing: Missing a move or sitting on the sidelines costs you nothing—taking an unplanned loss hurts your capital and confidence.
DCA (Dollar-Cost Averaging): Instead of going all-in at once during high volatility, spreading entries gradually helps smooth out average prices over time.
Avoid FOMO: Don't chase sudden green candles inside a broader downtrend, and don't panic-sell out of fear without a plan.
Fear & Greed Awareness: Extreme fear often drives emotional decisions. Pause, check the bigger picture, and stick to your rules rather than reacting to crowd panic.
Red days test patience more than chart skills. Stay calm, stay objective, and focus on what you can control.
What is one habit that helps you stay disciplined during red markets? Share your thoughts below!
Disclaimer: This post is for educational and informational purposes only and does not constitute financial or investment advice. Always do your own research (DYOR).
#BinanceSquare #RiskManagement #DCA #TradingPsychology #CryptoEducation #DYOR
Surviving Red Markets: Essential Strategies for Beginners
$BTC $BNB $SPCXB
Seeing a sea of red on your screen can be stressful, especially when sentiment is heavy. During uncertain market days, survival and discipline matter far more than trying to force quick gains.
Here are key strategies to keep in mind when the market turns red:
Risk Management: Never put more capital at risk than you can comfortably afford to lose. Protect your core balance first so you stay in the game.
Stop Loss: Always know your exit level before entering a trade. A planned stop loss turns potential chaos into a controlled, manageable outcome.
Not Winning Is Better Than Losing: Missing a move or sitting on the sidelines costs you nothing—taking an unplanned loss hurts your capital and confidence.
DCA (Dollar-Cost Averaging): Instead of going all-in at once during high volatility, spreading entries gradually helps smooth out average prices over time.
Avoid FOMO: Don't chase sudden green candles inside a broader downtrend, and don't panic-sell out of fear without a plan.
Fear & Greed Awareness: Extreme fear often drives emotional decisions. Pause, check the bigger picture, and stick to your rules rather than reacting to crowd panic.
Red days test patience more than chart skills. Stay calm, stay objective, and focus on what you can control.
What is one habit that helps you stay disciplined during red markets? Share your thoughts below!
Disclaimer: This post is for educational and informational purposes only and does not constitute financial or investment advice. Always do your own research (DYOR).
#BinanceSquare #RiskManagement #DCA #TradingPsychology #CryptoEducation #DYOR
$BTC $BNB $SPCXB
Seeing a sea of red on your screen can be stressful, especially when sentiment is heavy. During uncertain market days, survival and discipline matter far more than trying to force quick gains.
Here are key strategies to keep in mind when the market turns red:
Risk Management: Never put more capital at risk than you can comfortably afford to lose. Protect your core balance first so you stay in the game.
Stop Loss: Always know your exit level before entering a trade. A planned stop loss turns potential chaos into a controlled, manageable outcome.
Not Winning Is Better Than Losing: Missing a move or sitting on the sidelines costs you nothing—taking an unplanned loss hurts your capital and confidence.
DCA (Dollar-Cost Averaging): Instead of going all-in at once during high volatility, spreading entries gradually helps smooth out average prices over time.
Avoid FOMO: Don't chase sudden green candles inside a broader downtrend, and don't panic-sell out of fear without a plan.
Fear & Greed Awareness: Extreme fear often drives emotional decisions. Pause, check the bigger picture, and stick to your rules rather than reacting to crowd panic.
Red days test patience more than chart skills. Stay calm, stay objective, and focus on what you can control.
What is one habit that helps you stay disciplined during red markets? Share your thoughts below!
Disclaimer: This post is for educational and informational purposes only and does not constitute financial or investment advice. Always do your own research (DYOR).
#BinanceSquare #RiskManagement #DCA #TradingPsychology #CryptoEducation #DYOR
207
·
--

ບົດຄວາມ
Navigating the Crypto Pullback:Why the Market Is Dropping,How Experienced Traders Adapt, and What Beginners Must Avoid
The cryptocurrency market is going through a sharp wave of volatility, pulling sentiment toward fear and testing traders across every level. When red candles dominate the charts day after day, emotions run high—panicked sellers rush for the exits while overly confident buyers try to catch a falling knife.
Understanding why the market is falling, how #BTC pulls the rest of the market down with it, and how to manage risk during downturns can make the difference between surviving a storm and getting wiped out.
1. Why Is the Crypto Market Dropping?
Market downturns rarely happen because of a single isolated event. Instead, they usually form when macro pressure, liquidity shifts, and over-leveraged positioning collide at the same time:
Macroeconomic & Interest Rate Pressure: Persistent inflation concerns and shifting expectations around central bank interest rates tighten liquidity across risk assets. When borrowing costs stay higher or rate-hike fears return, institutional and retail capital often rotate toward safer yields or cash.
Institutional Flows & Capital Rotation: Outflows from major spot funds and competing narratives in traditional markets (such as major tech or AI listings drawing institutional attention) can drain short-term momentum from digital assets.
Leverage Cascades & Liquidations: When markets rally, traders frequently open high-leverage long positions. Once price breaks key support levels, exchanges automatically liquidate over-leveraged accounts. Those forced sell orders push prices even lower, triggering chain-reaction liquidations.
Thin Liquidity & Derivatives Positioning: During lower-liquidity periods (such as weekends) or when options market makers hold short/negative gamma exposure, large orders or hedging flows can exaggerate price swings in both directions.
2. Why Does #BTC Drop—and Why Do Most Coins Follow?
#BTC is the anchor of the cryptocurrency market—both in liquidity and in market psychology.
Liquidity & Pairing Structure: #BTC holds the deepest liquidity, highest institutional visibility, and serves as a primary benchmark for risk appetite. When big players reduce exposure to crypto, #BTC is often the first asset to see heavy volume and price movement.
Market Sentiment & Risk-Off Contagion: Most altcoins—whether large-cap ecosystems like #ETH, #BNB, and #SOL or higher-beta mid/small caps—carry higher volatility than #BTC. When #BTC drops sharply, traders view the broader market as "risk-off" and quickly de-risk out of higher-volatility altcoins.
Cross-Market & Algorithmic Correlation: Many trading bots, liquidity pools, and market makers price and hedge altcoin pairs relative to #BTC and USD liquidity. When #BTC breaks downward, automated selling and thin altcoin order books often cause coins to fall even harder on a percentage basis.
3. How Experienced Traders Look for Profit in a Downturn
Experienced traders do not rely on luck or blind hope during red markets. They focus on capital preservation, patience, and structured execution:
Disciplined Dollar-Cost Averaging (DCA): Instead of going all-in at one price, experienced spot buyers scale in gradually at predefined support zones or key valuation levels, keeping cash reserves ready in case price dips further.
Yield & Cash Management: Rather than letting idle stablecoins or spot holdings sit doing nothing while waiting for clearer structure, many traders utilize low-risk yield/earn options or hold stable liquidity so they have dry powder when high-probability setups appear.
Strict Risk-Defined Trading (Spot or Futures): Those who trade short-term swings or futures use strict position sizing, isolated margin where appropriate, and pre-set Stop-Loss (SL) and Take-Profit (TP) levels before entering—never letting a single trade threaten their account.
Trading Structure, Not Emotion: Experienced participants wait for confirmation—such as liquidity sweeps, volume spikes, declining funding rates, or clear support/resistance reactions—rather than chasing green candles out of FOMO or panic-selling at the bottom.
4. What Beginners Should NOT Do When They Lack Experience
If you are still building your experience, a falling market is not the time to experiment recklessly. Avoid these common traps:
Do NOT Use High Leverage: High leverage magnifies small normal fluctuations into instant liquidations. A small bounce against your direction can wipe out an account in minutes.
Do NOT "Revenge Trade" or Average Down Blindly: Chasing losses with bigger positions or buying a weak coin endlessly just because it looks "cheap" can turn a manageable loss into a major hole.
Do NOT Trade Without a Stop-Loss: Hoping a losing trade will "come back" without an invalidation point is one of the fastest ways to suffer heavy drawdowns.
Do NOT Follow Social Media Hype blindly: During crashes, loud calls for "guaranteed bottoms" or "100x gems" are everywhere. Always verify charts, liquidity, and risk yourself.
5. Do's and Don'ts (Quick Summary)
Do's (ဆောင်ရန်)
Do protect your principal first—survival in a bear or choppy market is a win.
Do size positions small relative to your total portfolio.
Do use Stop-Loss and Take-Profit plans and stick to your rules.
Do keep stablecoin reserves for high-conviction opportunities.
Do journal your trades and review mistakes calmly.
Don'ts (ရှောင်ရန်)
Don't go all-in with money you cannot afford to lose or might need urgently.
Don't over-leverage out of boredom, FOMO, or frustration.
Don't move your Stop-Loss further away just to avoid taking a loss.
Don't panic-sell every red candle without a plan.
Don't treat unverified rumors as financial truth.
Disclaimer‼️: This article is for informational and educational purposes only and does not constitute financial, investment, or trading advice. Cryptocurrency markets are highly volatile, and risk is always present—including the potential loss of part or all of your invested capital. Always do your own research (DYOR) and manage your risk carefully before making any financial decisions.
$BTC
{future}(BTCUSDT)
#Crypto #BTC #ETH #BNB #SOL #CryptoTrading #RiskManagement #MarketAnalysis #BinanceSquare
$BNB $ETH
Navigating the Crypto Pullback:Why the Market Is Dropping,
How Experienced Traders Adapt, and What Beginners Must Avoid
The cryptocurrency market is going through a sharp wave of volatility, pulling sentiment toward fear and testing traders across every level. When red candles dominate the charts day after day, emotions run high—panicked sellers rush for the exits while overly confident buyers try to catch a falling knife.
Understanding why the market is falling, how #BTC pulls the rest of the market down with it, and how to manage risk during downturns can make the difference between surviving a storm and getting wiped out.
1. Why Is the Crypto Market Dropping?
Market downturns rarely happen because of a single isolated event. Instead, they usually form when macro pressure, liquidity shifts, and over-leveraged positioning collide at the same time:
Macroeconomic & Interest Rate Pressure: Persistent inflation concerns and shifting expectations around central bank interest rates tighten liquidity across risk assets. When borrowing costs stay higher or rate-hike fears return, institutional and retail capital often rotate toward safer yields or cash.
Institutional Flows & Capital Rotation: Outflows from major spot funds and competing narratives in traditional markets (such as major tech or AI listings drawing institutional attention) can drain short-term momentum from digital assets.
Leverage Cascades & Liquidations: When markets rally, traders frequently open high-leverage long positions. Once price breaks key support levels, exchanges automatically liquidate over-leveraged accounts. Those forced sell orders push prices even lower, triggering chain-reaction liquidations.
Thin Liquidity & Derivatives Positioning: During lower-liquidity periods (such as weekends) or when options market makers hold short/negative gamma exposure, large orders or hedging flows can exaggerate price swings in both directions.
2. Why Does #BTC Drop—and Why Do Most Coins Follow?
#BTC is the anchor of the cryptocurrency market—both in liquidity and in market psychology.
Liquidity & Pairing Structure: #BTC holds the deepest liquidity, highest institutional visibility, and serves as a primary benchmark for risk appetite. When big players reduce exposure to crypto, #BTC is often the first asset to see heavy volume and price movement.
Market Sentiment & Risk-Off Contagion: Most altcoins—whether large-cap ecosystems like #ETH, #BNB, and #SOL or higher-beta mid/small caps—carry higher volatility than #BTC. When #BTC drops sharply, traders view the broader market as "risk-off" and quickly de-risk out of higher-volatility altcoins.
Cross-Market & Algorithmic Correlation: Many trading bots, liquidity pools, and market makers price and hedge altcoin pairs relative to #BTC and USD liquidity. When #BTC breaks downward, automated selling and thin altcoin order books often cause coins to fall even harder on a percentage basis.
3. How Experienced Traders Look for Profit in a Downturn
Experienced traders do not rely on luck or blind hope during red markets. They focus on capital preservation, patience, and structured execution:
Disciplined Dollar-Cost Averaging (DCA): Instead of going all-in at one price, experienced spot buyers scale in gradually at predefined support zones or key valuation levels, keeping cash reserves ready in case price dips further.
Yield & Cash Management: Rather than letting idle stablecoins or spot holdings sit doing nothing while waiting for clearer structure, many traders utilize low-risk yield/earn options or hold stable liquidity so they have dry powder when high-probability setups appear.
Strict Risk-Defined Trading (Spot or Futures): Those who trade short-term swings or futures use strict position sizing, isolated margin where appropriate, and pre-set Stop-Loss (SL) and Take-Profit (TP) levels before entering—never letting a single trade threaten their account.
Trading Structure, Not Emotion: Experienced participants wait for confirmation—such as liquidity sweeps, volume spikes, declining funding rates, or clear support/resistance reactions—rather than chasing green candles out of FOMO or panic-selling at the bottom.
4. What Beginners Should NOT Do When They Lack Experience
If you are still building your experience, a falling market is not the time to experiment recklessly. Avoid these common traps:
Do NOT Use High Leverage: High leverage magnifies small normal fluctuations into instant liquidations. A small bounce against your direction can wipe out an account in minutes.
Do NOT "Revenge Trade" or Average Down Blindly: Chasing losses with bigger positions or buying a weak coin endlessly just because it looks "cheap" can turn a manageable loss into a major hole.
Do NOT Trade Without a Stop-Loss: Hoping a losing trade will "come back" without an invalidation point is one of the fastest ways to suffer heavy drawdowns.
Do NOT Follow Social Media Hype blindly: During crashes, loud calls for "guaranteed bottoms" or "100x gems" are everywhere. Always verify charts, liquidity, and risk yourself.
5. Do's and Don'ts (Quick Summary)
Do's (ဆောင်ရန်)
Do protect your principal first—survival in a bear or choppy market is a win.
Do size positions small relative to your total portfolio.
Do use Stop-Loss and Take-Profit plans and stick to your rules.
Do keep stablecoin reserves for high-conviction opportunities.
Do journal your trades and review mistakes calmly.
Don'ts (ရှောင်ရန်)
Don't go all-in with money you cannot afford to lose or might need urgently.
Don't over-leverage out of boredom, FOMO, or frustration.
Don't move your Stop-Loss further away just to avoid taking a loss.
Don't panic-sell every red candle without a plan.
Don't treat unverified rumors as financial truth.
Disclaimer‼️: This article is for informational and educational purposes only and does not constitute financial, investment, or trading advice. Cryptocurrency markets are highly volatile, and risk is always present—including the potential loss of part or all of your invested capital. Always do your own research (DYOR) and manage your risk carefully before making any financial decisions.
$BTC
#Crypto #BTC #ETH #BNB #SOL #CryptoTrading #RiskManagement #MarketAnalysis #BinanceSquare
$BNB $ETH
The cryptocurrency market is going through a sharp wave of volatility, pulling sentiment toward fear and testing traders across every level. When red candles dominate the charts day after day, emotions run high—panicked sellers rush for the exits while overly confident buyers try to catch a falling knife.
Understanding why the market is falling, how #BTC pulls the rest of the market down with it, and how to manage risk during downturns can make the difference between surviving a storm and getting wiped out.
1. Why Is the Crypto Market Dropping?
Market downturns rarely happen because of a single isolated event. Instead, they usually form when macro pressure, liquidity shifts, and over-leveraged positioning collide at the same time:
Macroeconomic & Interest Rate Pressure: Persistent inflation concerns and shifting expectations around central bank interest rates tighten liquidity across risk assets. When borrowing costs stay higher or rate-hike fears return, institutional and retail capital often rotate toward safer yields or cash.
Institutional Flows & Capital Rotation: Outflows from major spot funds and competing narratives in traditional markets (such as major tech or AI listings drawing institutional attention) can drain short-term momentum from digital assets.
Leverage Cascades & Liquidations: When markets rally, traders frequently open high-leverage long positions. Once price breaks key support levels, exchanges automatically liquidate over-leveraged accounts. Those forced sell orders push prices even lower, triggering chain-reaction liquidations.
Thin Liquidity & Derivatives Positioning: During lower-liquidity periods (such as weekends) or when options market makers hold short/negative gamma exposure, large orders or hedging flows can exaggerate price swings in both directions.
2. Why Does #BTC Drop—and Why Do Most Coins Follow?
#BTC is the anchor of the cryptocurrency market—both in liquidity and in market psychology.
Liquidity & Pairing Structure: #BTC holds the deepest liquidity, highest institutional visibility, and serves as a primary benchmark for risk appetite. When big players reduce exposure to crypto, #BTC is often the first asset to see heavy volume and price movement.
Market Sentiment & Risk-Off Contagion: Most altcoins—whether large-cap ecosystems like #ETH, #BNB, and #SOL or higher-beta mid/small caps—carry higher volatility than #BTC. When #BTC drops sharply, traders view the broader market as "risk-off" and quickly de-risk out of higher-volatility altcoins.
Cross-Market & Algorithmic Correlation: Many trading bots, liquidity pools, and market makers price and hedge altcoin pairs relative to #BTC and USD liquidity. When #BTC breaks downward, automated selling and thin altcoin order books often cause coins to fall even harder on a percentage basis.
3. How Experienced Traders Look for Profit in a Downturn
Experienced traders do not rely on luck or blind hope during red markets. They focus on capital preservation, patience, and structured execution:
Disciplined Dollar-Cost Averaging (DCA): Instead of going all-in at one price, experienced spot buyers scale in gradually at predefined support zones or key valuation levels, keeping cash reserves ready in case price dips further.
Yield & Cash Management: Rather than letting idle stablecoins or spot holdings sit doing nothing while waiting for clearer structure, many traders utilize low-risk yield/earn options or hold stable liquidity so they have dry powder when high-probability setups appear.
Strict Risk-Defined Trading (Spot or Futures): Those who trade short-term swings or futures use strict position sizing, isolated margin where appropriate, and pre-set Stop-Loss (SL) and Take-Profit (TP) levels before entering—never letting a single trade threaten their account.
Trading Structure, Not Emotion: Experienced participants wait for confirmation—such as liquidity sweeps, volume spikes, declining funding rates, or clear support/resistance reactions—rather than chasing green candles out of FOMO or panic-selling at the bottom.
4. What Beginners Should NOT Do When They Lack Experience
If you are still building your experience, a falling market is not the time to experiment recklessly. Avoid these common traps:
Do NOT Use High Leverage: High leverage magnifies small normal fluctuations into instant liquidations. A small bounce against your direction can wipe out an account in minutes.
Do NOT "Revenge Trade" or Average Down Blindly: Chasing losses with bigger positions or buying a weak coin endlessly just because it looks "cheap" can turn a manageable loss into a major hole.
Do NOT Trade Without a Stop-Loss: Hoping a losing trade will "come back" without an invalidation point is one of the fastest ways to suffer heavy drawdowns.
Do NOT Follow Social Media Hype blindly: During crashes, loud calls for "guaranteed bottoms" or "100x gems" are everywhere. Always verify charts, liquidity, and risk yourself.
5. Do's and Don'ts (Quick Summary)
Do's (ဆောင်ရန်)
Do protect your principal first—survival in a bear or choppy market is a win.
Do size positions small relative to your total portfolio.
Do use Stop-Loss and Take-Profit plans and stick to your rules.
Do keep stablecoin reserves for high-conviction opportunities.
Do journal your trades and review mistakes calmly.
Don'ts (ရှောင်ရန်)
Don't go all-in with money you cannot afford to lose or might need urgently.
Don't over-leverage out of boredom, FOMO, or frustration.
Don't move your Stop-Loss further away just to avoid taking a loss.
Don't panic-sell every red candle without a plan.
Don't treat unverified rumors as financial truth.
Disclaimer‼️: This article is for informational and educational purposes only and does not constitute financial, investment, or trading advice. Cryptocurrency markets are highly volatile, and risk is always present—including the potential loss of part or all of your invested capital. Always do your own research (DYOR) and manage your risk carefully before making any financial decisions.
$BTC
#Crypto #BTC #ETH #BNB #SOL #CryptoTrading #RiskManagement #MarketAnalysis #BinanceSquare
$BNB $ETH
1
103

·
--
ບົດຄວາມ
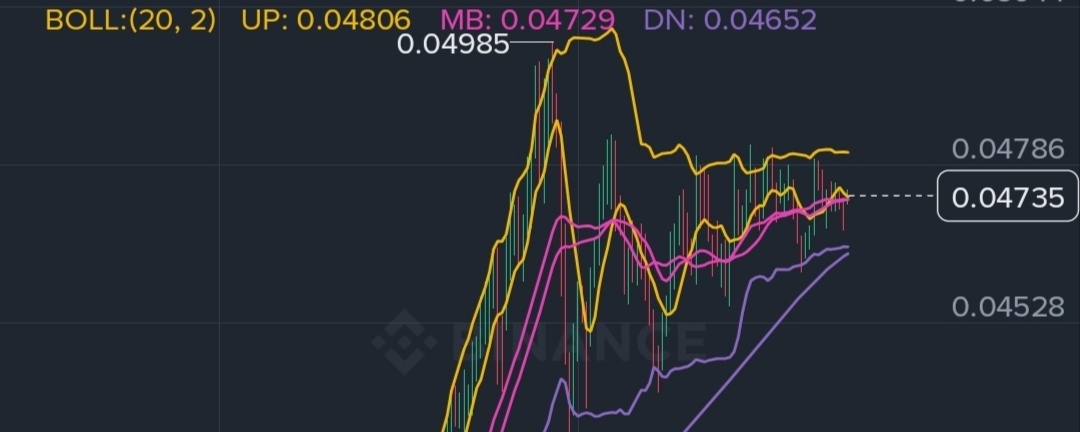
A Quick Analysis to 1000LUNCHere is a technical and market snapshot of the 1000LUNCUSDT Perpetual chart shown in the screenshot:
1. Market Overview
Last Price: 0.04740 (Mark Price: 0.04736)
24h Change: +11.61% (with Today showing +2.11% and 7 Days showing +26.27%)
24h Range: 0.04234 (Low) – 0.04985 (High)
24h Volume: 1.97B (1000LUNC) / 91.83M USDT
Timeframe: 15m chart
2. Technical Indicators (15m)
Moving Averages (MA)
MA(7): 0.04733
MA(25): 0.04730
MA(99): 0.04641
Price is hovering right around the short-term MA(7) and MA(25) cluster (~0.04730–0.04735), while holding comfortably above the MA(99) (0.04641) after a sharp rally from around 0.03814. Tightly clustered short MAs near current price often signal a brief consolidation or decision zone following a strong move.
Bollinger Bands — BOLL(20, 2)
Upper Band (UP): 0.04806
Middle Band (MB): 0.04729
Lower Band (DN): 0.04652
Price is trading slightly above the Middle Band (0.04729), putting it in neutral-to-bullish territory on the 15-minute timeframe with room toward the upper band (0.04806) if buying pressure picks up.
Volume
A clear volume spike accompanied the breakout/rally from the ~0.03814 area up toward 0.04985, followed by cooling volume during the sideways/pullback phase.
MA(5) Vol: 4.49M | MA(10) Vol: 6.36M
3. Key Levels to Watch
Immediate Resistance: ~0.04786 – 0.04806 (chart level & Bollinger upper band), followed by the 24h high at 0.04985 (and psychological/chart area near 0.05044).
Immediate Support: ~0.04729 – 0.04735 (MA(7)/MA(25)/BOLL MB), then 0.04641 – 0.04652 (MA(99) & Bollinger lower band), with deeper chart reference levels lower around 0.04528 and 0.04271.
4. Broader Context & Risk Note
While short-term momentum over the past 7 days (+26.27%) and 24 hours (+11.61%) is strong, longer-term performance on the screen shows 90 Days (-20.13%) and 180 Days (-42.12%) still in the red despite 1 Year (+57.11%). Perpetual futures also carry liquidation and volatility risk—especially after rapid spikes. (This is chart analysis for informational purposes, not financial advice.)
Are you looking at this for a short-term scalp/intraday trade, or evaluating a swing/longer-term position?
A Quick Analysis to 1000LUNC
Here is a technical and market snapshot of the 1000LUNCUSDT Perpetual chart shown in the screenshot:
1. Market Overview
Last Price: 0.04740 (Mark Price: 0.04736)
24h Change: +11.61% (with Today showing +2.11% and 7 Days showing +26.27%)
24h Range: 0.04234 (Low) – 0.04985 (High)
24h Volume: 1.97B (1000LUNC) / 91.83M USDT
Timeframe: 15m chart
2. Technical Indicators (15m)
Moving Averages (MA)
MA(7): 0.04733
MA(25): 0.04730
MA(99): 0.04641
Price is hovering right around the short-term MA(7) and MA(25) cluster (~0.04730–0.04735), while holding comfortably above the MA(99) (0.04641) after a sharp rally from around 0.03814. Tightly clustered short MAs near current price often signal a brief consolidation or decision zone following a strong move.
Bollinger Bands — BOLL(20, 2)
Upper Band (UP): 0.04806
Middle Band (MB): 0.04729
Lower Band (DN): 0.04652
Price is trading slightly above the Middle Band (0.04729), putting it in neutral-to-bullish territory on the 15-minute timeframe with room toward the upper band (0.04806) if buying pressure picks up.
Volume
A clear volume spike accompanied the breakout/rally from the ~0.03814 area up toward 0.04985, followed by cooling volume during the sideways/pullback phase.
MA(5) Vol: 4.49M | MA(10) Vol: 6.36M
3. Key Levels to Watch
Immediate Resistance: ~0.04786 – 0.04806 (chart level & Bollinger upper band), followed by the 24h high at 0.04985 (and psychological/chart area near 0.05044).
Immediate Support: ~0.04729 – 0.04735 (MA(7)/MA(25)/BOLL MB), then 0.04641 – 0.04652 (MA(99) & Bollinger lower band), with deeper chart reference levels lower around 0.04528 and 0.04271.
4. Broader Context & Risk Note
While short-term momentum over the past 7 days (+26.27%) and 24 hours (+11.61%) is strong, longer-term performance on the screen shows 90 Days (-20.13%) and 180 Days (-42.12%) still in the red despite 1 Year (+57.11%). Perpetual futures also carry liquidation and volatility risk—especially after rapid spikes. (This is chart analysis for informational purposes, not financial advice.)
Are you looking at this for a short-term scalp/intraday trade, or evaluating a swing/longer-term position?
1. Market Overview
Last Price: 0.04740 (Mark Price: 0.04736)
24h Change: +11.61% (with Today showing +2.11% and 7 Days showing +26.27%)
24h Range: 0.04234 (Low) – 0.04985 (High)
24h Volume: 1.97B (1000LUNC) / 91.83M USDT
Timeframe: 15m chart
2. Technical Indicators (15m)
Moving Averages (MA)
MA(7): 0.04733
MA(25): 0.04730
MA(99): 0.04641
Price is hovering right around the short-term MA(7) and MA(25) cluster (~0.04730–0.04735), while holding comfortably above the MA(99) (0.04641) after a sharp rally from around 0.03814. Tightly clustered short MAs near current price often signal a brief consolidation or decision zone following a strong move.
Bollinger Bands — BOLL(20, 2)
Upper Band (UP): 0.04806
Middle Band (MB): 0.04729
Lower Band (DN): 0.04652
Price is trading slightly above the Middle Band (0.04729), putting it in neutral-to-bullish territory on the 15-minute timeframe with room toward the upper band (0.04806) if buying pressure picks up.
Volume
A clear volume spike accompanied the breakout/rally from the ~0.03814 area up toward 0.04985, followed by cooling volume during the sideways/pullback phase.
MA(5) Vol: 4.49M | MA(10) Vol: 6.36M
3. Key Levels to Watch
Immediate Resistance: ~0.04786 – 0.04806 (chart level & Bollinger upper band), followed by the 24h high at 0.04985 (and psychological/chart area near 0.05044).
Immediate Support: ~0.04729 – 0.04735 (MA(7)/MA(25)/BOLL MB), then 0.04641 – 0.04652 (MA(99) & Bollinger lower band), with deeper chart reference levels lower around 0.04528 and 0.04271.
4. Broader Context & Risk Note
While short-term momentum over the past 7 days (+26.27%) and 24 hours (+11.61%) is strong, longer-term performance on the screen shows 90 Days (-20.13%) and 180 Days (-42.12%) still in the red despite 1 Year (+57.11%). Perpetual futures also carry liquidation and volatility risk—especially after rapid spikes. (This is chart analysis for informational purposes, not financial advice.)
Are you looking at this for a short-term scalp/intraday trade, or evaluating a swing/longer-term position?
322
·
--
ANT just open for trades,110$ within 1 minutes
{future}(ANTUSDT)
$ANTB
ANT just open for trades,110$ within 1 minutes
$ANTB
$ANTB
123
·
--
ສັນຍານກະທິງ
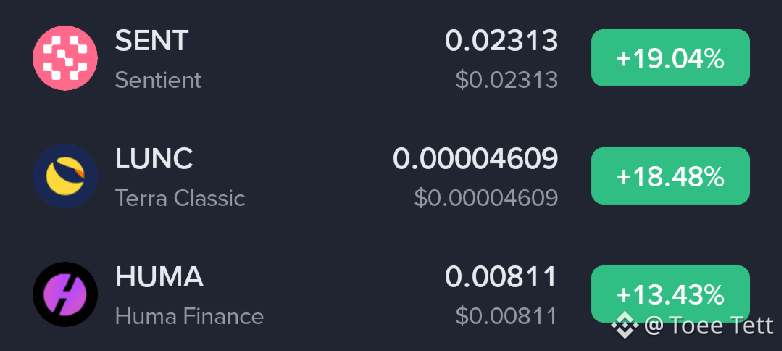
$SENT $LUNC $HUMA They Still Stand On the Top. But Sadly,, I couldn't make any profit from it. Kind Of miss opportunity, but You Know,, I have to forgive myself. Because Nobody Knows the Future.
Better Luck Next Time,Right 😀.
#LUNC✅ #SENT #Huma'n #BinanceSquareTalks #Binance
$SENT $LUNC $HUMA They Still Stand On the Top. But Sadly,, I couldn't make any profit from it. Kind Of miss opportunity, but You Know,, I have to forgive myself. Because Nobody Knows the Future.
Better Luck Next Time,Right 😀.
#LUNC✅ #SENT #Huma'n #BinanceSquareTalks #Binance
Better Luck Next Time,Right 😀.
#LUNC✅ #SENT #Huma'n #BinanceSquareTalks #Binance
255
·
--
$LUNC $NVDAB $AMZNB
{spot}(LUNCUSDT)
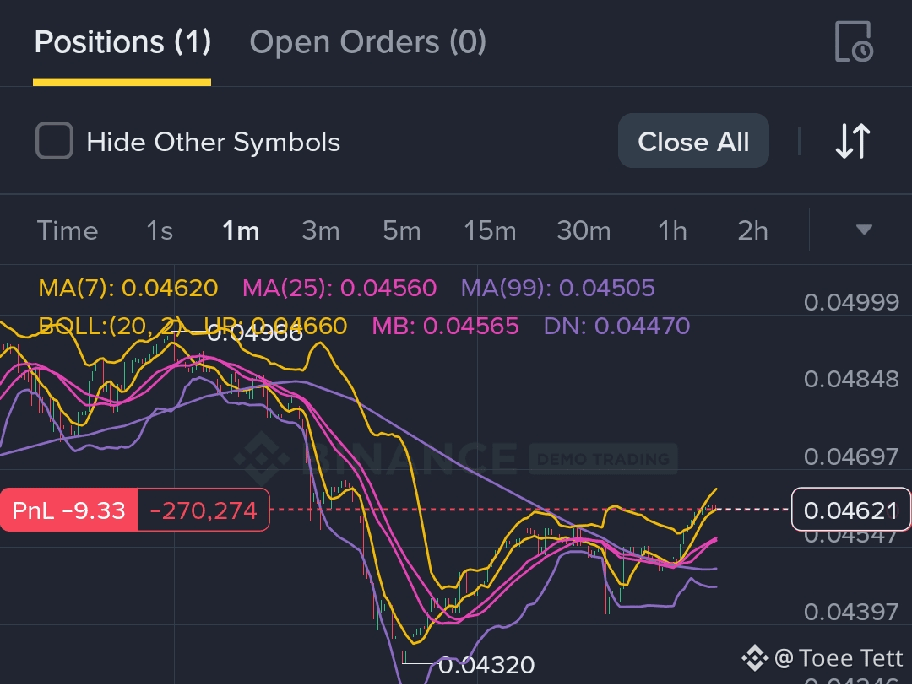
Even In Demo Trading , I am still losing 😑🤣🤣
I need to refresh my self 📺
$LUNC $NVDAB $AMZNB
Even In Demo Trading , I am still losing 😑🤣🤣
I need to refresh my self 📺
Even In Demo Trading , I am still losing 😑🤣🤣
I need to refresh my self 📺
164
·
--
1000LUNC Price Action & Key Levels to Watch Today $LUNC $MMT $BTC
{spot}(LUNCUSDT)
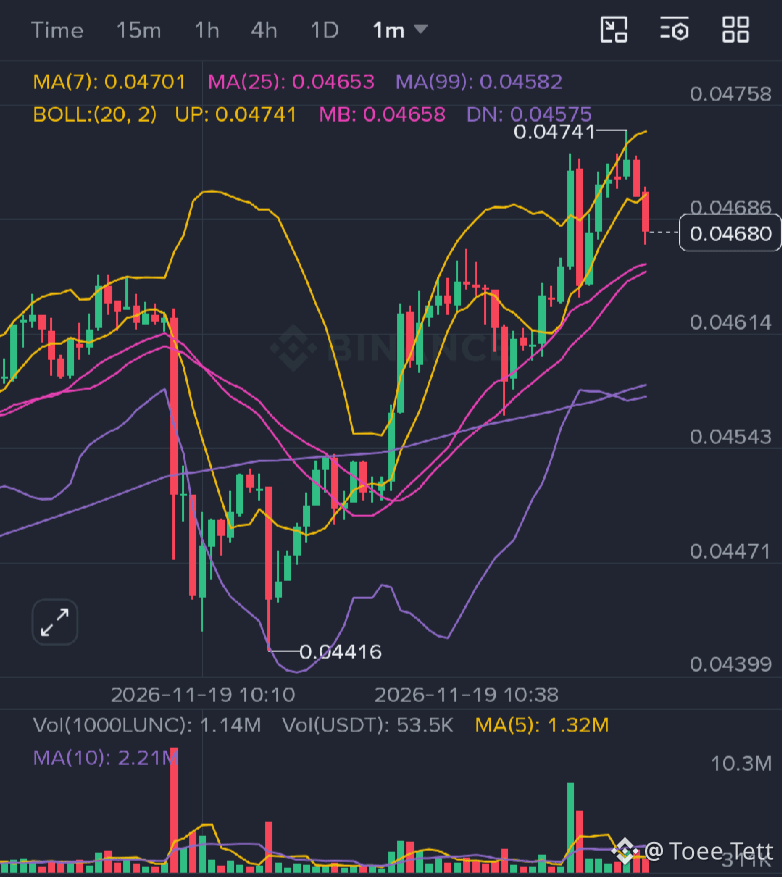
1000LUNCUSDT has shown strong volatility today, surging from around 0.03814 to a 24h high of 0.04716—a gain of roughly +19%. Here is a quick breakdown of what is driving the move and what to watch next:
Momentum & Squeeze Dynamics: When price rallies rapidly, a combination of FOMO buying and short stop-losses getting triggered creates extra upward momentum.
Key Zones to Monitor: On the upside, 0.04716 is the immediate resistance level to watch. If a pullback occurs, look for potential support around 0.04627 and 0.04605.
Risk Management Takeaway: Chasing green candles near local highs carries high risk. Protecting your capital by staying patient and avoiding emotional FOMO entries is always more important than catching every single pump.
How are you reading this #1000LUNC move—do you think it breaks above 0.04716 or cools off from here?
#1000LUNC #LUNC #CryptoTrading #BinanceSquare #RiskManagement
Disclaimer: This post is for educational and informational purposes only and does not constitute financial advice. Always do your own research (DYOR) and manage your risk carefully.
1000LUNC Price Action & Key Levels to Watch Today $LUNC $MMT $BTC
1000LUNCUSDT has shown strong volatility today, surging from around 0.03814 to a 24h high of 0.04716—a gain of roughly +19%. Here is a quick breakdown of what is driving the move and what to watch next:
Momentum & Squeeze Dynamics: When price rallies rapidly, a combination of FOMO buying and short stop-losses getting triggered creates extra upward momentum.
Key Zones to Monitor: On the upside, 0.04716 is the immediate resistance level to watch. If a pullback occurs, look for potential support around 0.04627 and 0.04605.
Risk Management Takeaway: Chasing green candles near local highs carries high risk. Protecting your capital by staying patient and avoiding emotional FOMO entries is always more important than catching every single pump.
How are you reading this #1000LUNC move—do you think it breaks above 0.04716 or cools off from here?
#1000LUNC #LUNC #CryptoTrading #BinanceSquare #RiskManagement
Disclaimer: This post is for educational and informational purposes only and does not constitute financial advice. Always do your own research (DYOR) and manage your risk carefully.
1000LUNCUSDT has shown strong volatility today, surging from around 0.03814 to a 24h high of 0.04716—a gain of roughly +19%. Here is a quick breakdown of what is driving the move and what to watch next:
Momentum & Squeeze Dynamics: When price rallies rapidly, a combination of FOMO buying and short stop-losses getting triggered creates extra upward momentum.
Key Zones to Monitor: On the upside, 0.04716 is the immediate resistance level to watch. If a pullback occurs, look for potential support around 0.04627 and 0.04605.
Risk Management Takeaway: Chasing green candles near local highs carries high risk. Protecting your capital by staying patient and avoiding emotional FOMO entries is always more important than catching every single pump.
How are you reading this #1000LUNC move—do you think it breaks above 0.04716 or cools off from here?
#1000LUNC #LUNC #CryptoTrading #BinanceSquare #RiskManagement
Disclaimer: This post is for educational and informational purposes only and does not constitute financial advice. Always do your own research (DYOR) and manage your risk carefully.
2
388
ເຂົ້າສູ່ລະບົບເພື່ອສຳຫຼວດເນື້ອຫາເພີ່ມເຕີມ
ເຂົ້າຮ່ວມກຸ່ມຜູ້ໃຊ້ຄຣິບໂຕທົ່ວໂລກໃນ Binance Square.
⚡️ ໄດ້ຮັບຂໍ້ມູນຫຼ້າສຸດ ແລະ ທີ່ມີປະໂຫຍດກ່ຽວກັບຄຣິບໂຕ.
💬 ໄດ້ຮັບຄວາມໄວ້ວາງໃຈຈາກຕະຫຼາດແລກປ່ຽນຄຣິບໂຕທີ່ໃຫຍ່ທີ່ສຸດໃນໂລກ.
👍 ຄົ້ນຫາຂໍ້ມູນເຊີງເລິກທີ່ແທ້ຈາກນັກສ້າງທີ່ໄດ້ຮັບການຢືນຢັນ.
ອີເມວ / ເບີໂທລະສັບ
ຫົວຂໍ້ທີ່ກໍາລັງນິຍົມ
BTCReboundsAbove$60KAmidWhaleDipBuying
81,456 ຄັ້ງທີ່ເບິ່ງ
357 ກຳລັງສົນທະນາ
Abraxas Capital, Other Whales Buy the BTC Dip as Bitcoin Briefly Reclaims $60,000
Binance News
·35 ຖືກໃຈ
·78.8k ຄັ້ງທີ່ເບິ່ງ
SolanaSets2027RoadmapToDoubleComputeCapacity
66,241 ຄັ້ງທີ່ເບິ່ງ
1,050 ກຳລັງສົນທະນາ
CaliforniaNvidiaProbeExaminesPotentialCriminalViolations
17,858 ຄັ້ງທີ່ເບິ່ງ
143 ກຳລັງສົນທະນາ