
Mrs Akhter
17 ໂພສ

Mrs Akhter
ລາຍງານ
ບລັອກຜູ້ໃຊ້
ເປີດການຊື້ຂາຍ
ຜູ້ຊື້ຂາຍຊົ່ວຄາວ
1.6 ປີ
10 ກໍາລັງຕິດຕາມ
0 ຜູ້ຕິດຕາມ
0 Liked
ໂພສ
Portfolio
·
--
Solana $(SOL) is trading at $99.19 [1.34]
{future}(XRPUSDT)
while $(XRP)is hovering around $1.34 [1.42], demonstrating a brief cooling-down phase across the broader digital asset markets.
{future}(SOLUSDT)
Solana $(SOL) is trading at $99.19 [1.34]
while $(XRP)is hovering around $1.34 [1.42], demonstrating a brief cooling-down phase across the broader digital asset markets.
while $(XRP)is hovering around $1.34 [1.42], demonstrating a brief cooling-down phase across the broader digital asset markets.
34
·
--
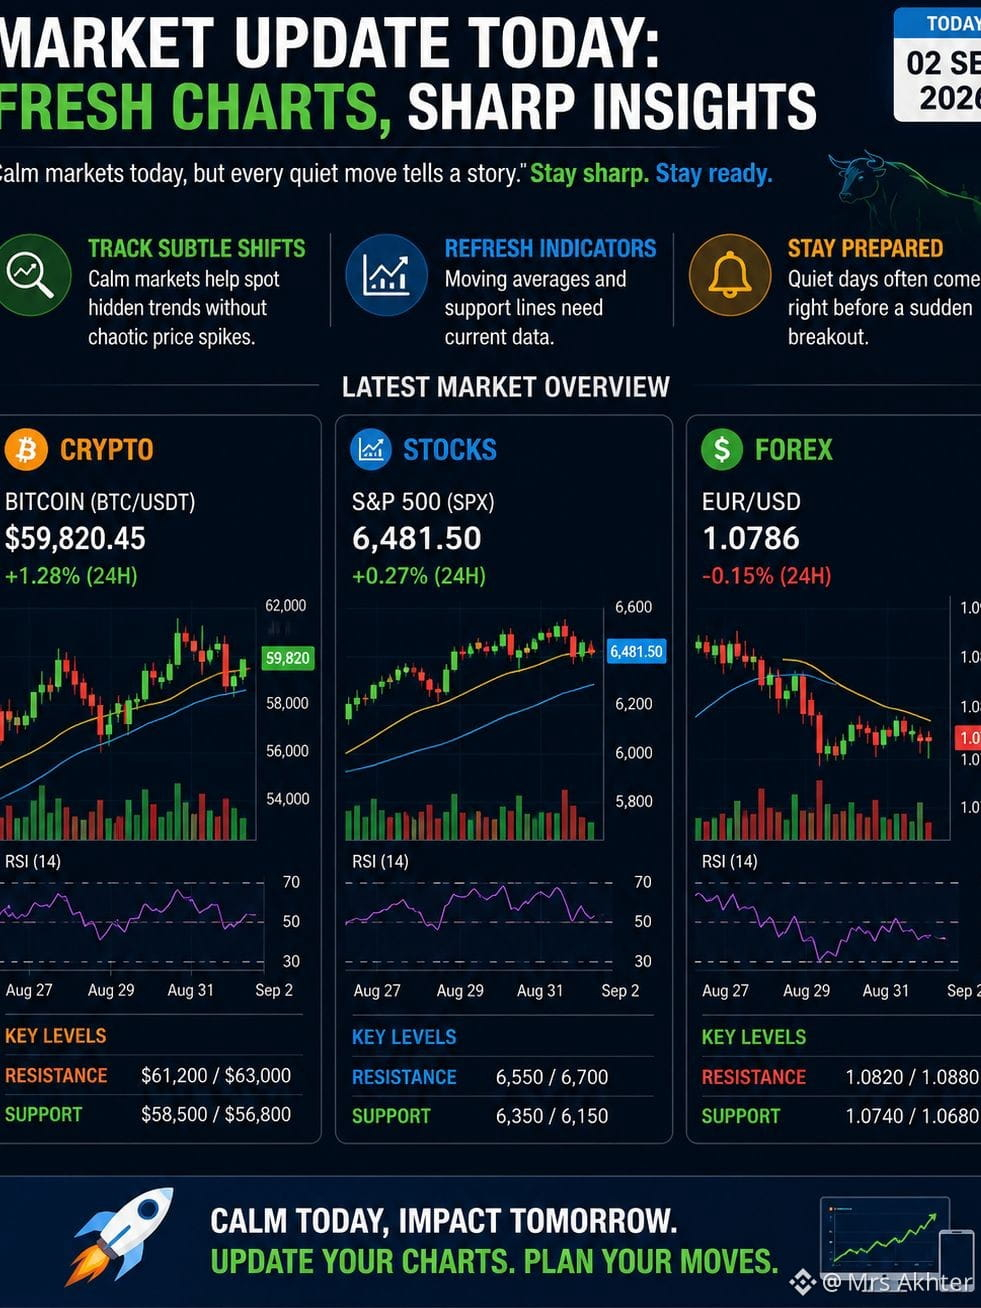
Market Charts Need a Fresh Look Today
Markets are shifting fast, with crypto and global assets reacting to rising yields, oil prices, and renewed geopolitical uncertainty.
. Spot the hidden trend: Consolidation can reveal where momentum is building.
. Refresh key levels: Recheck moving averages, support, resistance, and volume.
. Watch for volatility: Quiet price action can quickly turn into a breakout or breakdown.
Which charts should we update today — Crypto, Stocks, or Forex?I can also make it shorter, more professional, or more bullish for a crypto audience.
#MarketUpddadate #stockmarketnews #marketanalysis. #forexmarkets #TradingSignal
Market Charts Need a Fresh Look Today
Markets are shifting fast, with crypto and global assets reacting to rising yields, oil prices, and renewed geopolitical uncertainty.
. Spot the hidden trend: Consolidation can reveal where momentum is building.
. Refresh key levels: Recheck moving averages, support, resistance, and volume.
. Watch for volatility: Quiet price action can quickly turn into a breakout or breakdown.
Which charts should we update today — Crypto, Stocks, or Forex?I can also make it shorter, more professional, or more bullish for a crypto audience.
#MarketUpddadate #stockmarketnews #marketanalysis. #forexmarkets #TradingSignal
Markets are shifting fast, with crypto and global assets reacting to rising yields, oil prices, and renewed geopolitical uncertainty.
. Spot the hidden trend: Consolidation can reveal where momentum is building.
. Refresh key levels: Recheck moving averages, support, resistance, and volume.
. Watch for volatility: Quiet price action can quickly turn into a breakout or breakdown.
Which charts should we update today — Crypto, Stocks, or Forex?I can also make it shorter, more professional, or more bullish for a crypto audience.
#MarketUpddadate #stockmarketnews #marketanalysis. #forexmarkets #TradingSignal
55
·
--
Traders on Kalshi are forecasting a peak price target of around $125.5 for Solana (SOL) by late 2026.
{spot}(SOLUSDT)
Traders on Kalshi are forecasting a peak price target of around $125.5 for Solana (SOL) by late 2026.
71
·
--
U.S. 10-Year Treasury Yield Hits 4.81% — Markets on Alert
The U.S. 10-Year Treasury yield has climbed to around 4.81%, pushing toward its highest levels since early 2025. Rising oil prices and renewed inflation concerns are adding pressure to bond markets.
Fed Chair Kevin Warsh’s hawkish stance has also increased expectations for tighter monetary policy, with markets pricing in a higher probability of a September rate hike.
⚠️ Why it matters: Higher yields can tighten financial conditions and increase volatility across stocks and crypto, including BTC.
📈 Key levels: 4.81% → 4.90% → 5.00%
{etf_us}(OILT.ETF)
{future}(BTCUSDT)
#BTC、 #OilPrice #CryptoNews #TrendingPredictions #Market_Update
U.S. 10-Year Treasury Yield Hits 4.81% — Markets on Alert
The U.S. 10-Year Treasury yield has climbed to around 4.81%, pushing toward its highest levels since early 2025. Rising oil prices and renewed inflation concerns are adding pressure to bond markets.
Fed Chair Kevin Warsh’s hawkish stance has also increased expectations for tighter monetary policy, with markets pricing in a higher probability of a September rate hike.
⚠️ Why it matters: Higher yields can tighten financial conditions and increase volatility across stocks and crypto, including BTC.
📈 Key levels: 4.81% → 4.90% → 5.00%
#BTC、 #OilPrice #CryptoNews #TrendingPredictions #Market_Update
The U.S. 10-Year Treasury yield has climbed to around 4.81%, pushing toward its highest levels since early 2025. Rising oil prices and renewed inflation concerns are adding pressure to bond markets.
Fed Chair Kevin Warsh’s hawkish stance has also increased expectations for tighter monetary policy, with markets pricing in a higher probability of a September rate hike.
⚠️ Why it matters: Higher yields can tighten financial conditions and increase volatility across stocks and crypto, including BTC.
📈 Key levels: 4.81% → 4.90% → 5.00%
#BTC、 #OilPrice #CryptoNews #TrendingPredictions #Market_Update
BTC-0,09%
OILTETF+0,62%
95
·
--
Arbitrum $(ARB) is indeed the standout top gainer today, surging over 26% to a live price of approximately $0.1101. This massive rally heavily outpaces the broader crypto market—including Bitcoin and Ethereum, which have both experienced slight downward consolidations.
Crypto Market Update — Sept. 1, 2026
ARB: +26.10% at ~$0.1101 — boosted by Robinhood Chain activity and fee revenue.
UNI: +10.96% at ~$5.21 — supported by DeFi momentum.
ENA: +7.85% at ~$0.203 — gaining amid stronger ecosystem flows.
ARB is the standout gainer today.
{spot}(ARBUSDT)
{future}(UNIUSDT)
{future}(ENAUSDT)
Arbitrum $(ARB) is indeed the standout top gainer today, surging over 26% to a live price of approximately $0.1101. This massive rally heavily outpaces the broader crypto market—including Bitcoin and Ethereum, which have both experienced slight downward consolidations.
Crypto Market Update — Sept. 1, 2026
ARB: +26.10% at ~$0.1101 — boosted by Robinhood Chain activity and fee revenue.
UNI: +10.96% at ~$5.21 — supported by DeFi momentum.
ENA: +7.85% at ~$0.203 — gaining amid stronger ecosystem flows.
ARB is the standout gainer today.
Crypto Market Update — Sept. 1, 2026
ARB: +26.10% at ~$0.1101 — boosted by Robinhood Chain activity and fee revenue.
UNI: +10.96% at ~$5.21 — supported by DeFi momentum.
ENA: +7.85% at ~$0.203 — gaining amid stronger ecosystem flows.
ARB is the standout gainer today.
33
·
--
Binance Market Watch: UNI Leads the Momentum
Uniswap $(UNI) is currently leading the pack with an impressive +10.70% 24-hour gain, followed by $NEAR at +7.96% and $ZEC at +1.75%.
What’s driving attention?
🔹 $UNI: DeFi activity, governance developments and ecosystem growth
🔹 $NEAR: AI integrations, network upgrades and ecosystem expansion
🔹 $ZEC: Privacy technology developments and regulatory sentiment
{future}(ZECUSDT)
{future}(NEARUSDT)
{future}(UNIUSDT)
Momentum is strong, but crypto markets can move quickly—always do your own research before making decisions. 📊
#BinanceSquare #Crypto #UNI #Uniswap #NEAR #ZEC #DeFi #Altcoins #CryptoMarket #CryptoNews
Binance Market Watch: UNI Leads the Momentum
Uniswap $(UNI) is currently leading the pack with an impressive +10.70% 24-hour gain, followed by $NEAR at +7.96% and $ZEC at +1.75%.
What’s driving attention?
🔹 $UNI: DeFi activity, governance developments and ecosystem growth
🔹 $NEAR: AI integrations, network upgrades and ecosystem expansion
🔹 $ZEC: Privacy technology developments and regulatory sentiment
Momentum is strong, but crypto markets can move quickly—always do your own research before making decisions. 📊
#BinanceSquare #Crypto #UNI #Uniswap #NEAR #ZEC #DeFi #Altcoins #CryptoMarket #CryptoNews
Uniswap $(UNI) is currently leading the pack with an impressive +10.70% 24-hour gain, followed by $NEAR at +7.96% and $ZEC at +1.75%.
What’s driving attention?
🔹 $UNI: DeFi activity, governance developments and ecosystem growth
🔹 $NEAR: AI integrations, network upgrades and ecosystem expansion
🔹 $ZEC: Privacy technology developments and regulatory sentiment
Momentum is strong, but crypto markets can move quickly—always do your own research before making decisions. 📊
#BinanceSquare #Crypto #UNI #Uniswap #NEAR #ZEC #DeFi #Altcoins #CryptoMarket #CryptoNews
111
·
--
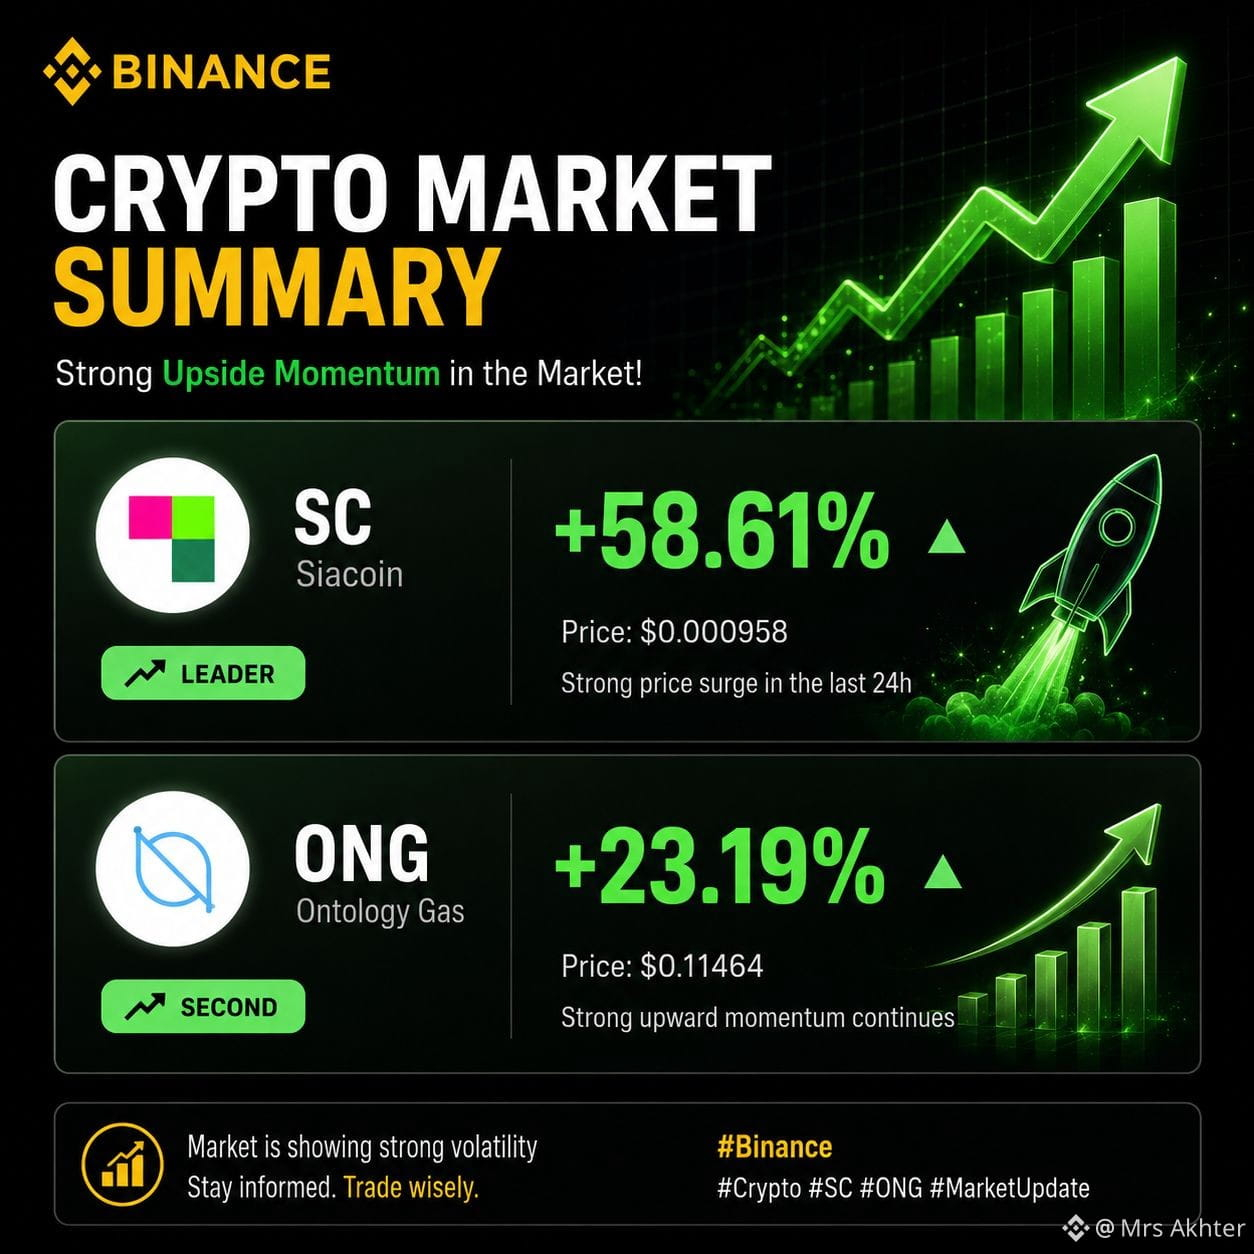
📈 Crypto Market Update: $SC & $ONG Surge
🚀 Siacoin$ (SC) is leading the market with an impressive +58.61% gain, showing strong short-term momentum.
🔥 Ontology Gas $(ONG) follows with a solid +23.19% increase.
{spot}(ONGUSDT)
{spot}(SCUSDT)
Both tokens are showing notable upward volatility and strong market activity. Traders are watching closely to see whether this momentum can continue. 📊
#BinanceSquare #Crypto #SC #Siacoin #ONG #OntologyGas #CryptoMarket #Altcoins #CryptoNews #MarketUpdate
📈 Crypto Market Update: $SC & $ONG Surge
🚀 Siacoin$ (SC) is leading the market with an impressive +58.61% gain, showing strong short-term momentum.
🔥 Ontology Gas $(ONG) follows with a solid +23.19% increase.
Both tokens are showing notable upward volatility and strong market activity. Traders are watching closely to see whether this momentum can continue. 📊
#BinanceSquare #Crypto #SC #Siacoin #ONG #OntologyGas #CryptoMarket #Altcoins #CryptoNews #MarketUpdate
🚀 Siacoin$ (SC) is leading the market with an impressive +58.61% gain, showing strong short-term momentum.
🔥 Ontology Gas $(ONG) follows with a solid +23.19% increase.
Both tokens are showing notable upward volatility and strong market activity. Traders are watching closely to see whether this momentum can continue. 📊
#BinanceSquare #Crypto #SC #Siacoin #ONG #OntologyGas #CryptoMarket #Altcoins #CryptoNews #MarketUpdate
184
·
--
ບົດຄວາມ
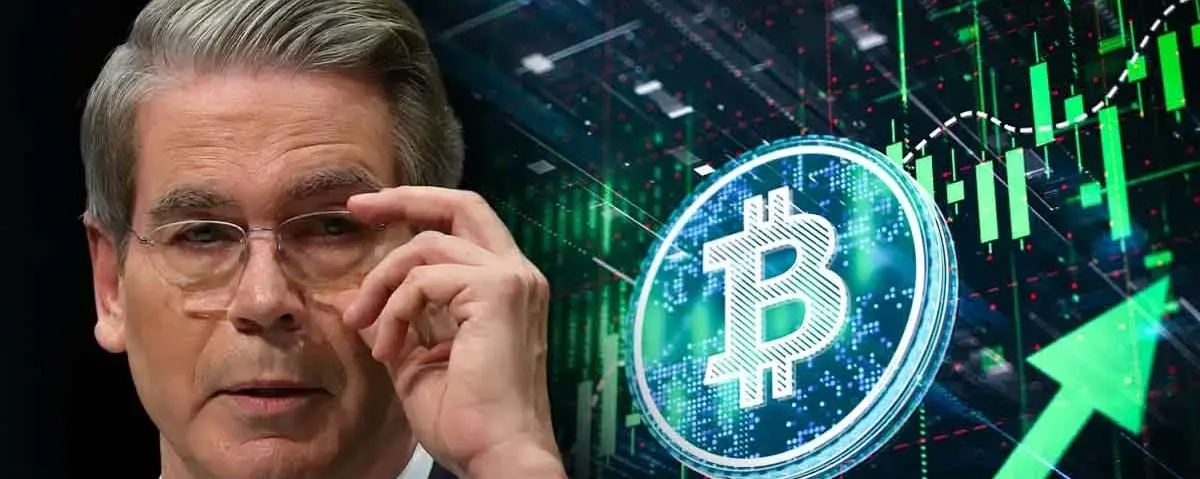
Bitcoin Holds Near $78K as Binance Expands Trading BotsBitcoin is trading around $78,000, while Binance expands Spot Grid and Spot DCA bots for tokenized stock pairs such as CRCLB/USDT and MSTRB/USDT. Binance has also extended its zero-maker-fee promotion until September 30, 2026.
{spot}(CRCLBUSDT)
{spot}(MSTRBUSDT)
Bitcoin Holds Near $78K as Binance Expands Trading Bots
Bitcoin is trading around $78,000, while Binance expands Spot Grid and Spot DCA bots for tokenized stock pairs such as CRCLB/USDT and MSTRB/USDT. Binance has also extended its zero-maker-fee promotion until September 30, 2026.
73
·
--

ບົດຄວາມ
AI Crypto Market Faces Heavy Volatility as TAO and NEAR Battle Key LowsThe AI-focused crypto sector has endured a sharp correction, highlighting just how quickly sentiment can change across digital-asset markets. The sector previously lost around 12.1%, wiping approximately $2.8 billion from its combined market capitalization, while major AI-linked tokens came under intense selling pressure.
Bittensor (TAO) and NEAR Protocol (NEAR) were among the projects attracting attention as prices moved toward multi-year lows during the downturn. The weakness reflected broader pressure across altcoins rather than an isolated decline in AI-related assets.
However, the latest market data suggests the sector is beginning to show signs of recovery. Recent September figures put TAO around $241.50 and NEAR near $1.98, with both recording positive weekly performance in the latest snapshot.
The mixed performance shows that the AI-crypto market is not moving as a single group. Some projects are recovering strongly, while smaller AI tokens continue to face substantial volatility.
For investors and market watchers, the key question n
ow is whether the recent rebound can develop
{spot}(TAOUSDT)
i
{spot}(NEARUSDT)
nto a sustained recovery or whether AI tokens will remain vulnerable to another wave of selling.
AI Crypto Market Faces Heavy Volatility as TAO and NEAR Battle Key Lows
The AI-focused crypto sector has endured a sharp correction, highlighting just how quickly sentiment can change across digital-asset markets. The sector previously lost around 12.1%, wiping approximately $2.8 billion from its combined market capitalization, while major AI-linked tokens came under intense selling pressure.
Bittensor (TAO) and NEAR Protocol (NEAR) were among the projects attracting attention as prices moved toward multi-year lows during the downturn. The weakness reflected broader pressure across altcoins rather than an isolated decline in AI-related assets.
However, the latest market data suggests the sector is beginning to show signs of recovery. Recent September figures put TAO around $241.50 and NEAR near $1.98, with both recording positive weekly performance in the latest snapshot.
The mixed performance shows that the AI-crypto market is not moving as a single group. Some projects are recovering strongly, while smaller AI tokens continue to face substantial volatility.
For investors and market watchers, the key question n
ow is whether the recent rebound can develop
i
nto a sustained recovery or whether AI tokens will remain vulnerable to another wave of selling.
Bittensor (TAO) and NEAR Protocol (NEAR) were among the projects attracting attention as prices moved toward multi-year lows during the downturn. The weakness reflected broader pressure across altcoins rather than an isolated decline in AI-related assets.
However, the latest market data suggests the sector is beginning to show signs of recovery. Recent September figures put TAO around $241.50 and NEAR near $1.98, with both recording positive weekly performance in the latest snapshot.
The mixed performance shows that the AI-crypto market is not moving as a single group. Some projects are recovering strongly, while smaller AI tokens continue to face substantial volatility.
For investors and market watchers, the key question n
ow is whether the recent rebound can develop
i
nto a sustained recovery or whether AI tokens will remain vulnerable to another wave of selling.
123
·
--

ບົດຄວາມ
Strategy Returns to Bitcoin Market With $369.7 Million PurchaseMichael Saylor-led Strategy has returned to Bitcoin accumulation after a 10-week pause, purchasing $BTC for approximately $369.7 million between August 24 and 30.
The company paid an average of about $80,318 per Bitcoin, bringing its total Bitcoin holdings to 845,050 $BTC , acquired at an average cost of roughly $75,412 per coin.
{spot}(BTCUSDT)
The latest purchase was funded through Strategy’s stock-sale program. The move signals a renewed commitment to Bitcoin accumulation after the company spent part of the summer managing its cash reserves and other financial obligations.
Strategy’s return to buying comes as Bitcoin continues to trade near the $78,000–$80,000 range, making the purchase a notable development for the broader crypto market.SEO Title: Strategy Resumes Bitcoin Buying With $369.7M $BTC Purchase
Hashtags: #Bitcoin #BTC #MichaelSaylor #Strategy #MSTR #CryptoNews #BitcoinNews
Strategy Returns to Bitcoin Market With $369.7 Million Purchase
Michael Saylor-led Strategy has returned to Bitcoin accumulation after a 10-week pause, purchasing $BTC for approximately $369.7 million between August 24 and 30.
The company paid an average of about $80,318 per Bitcoin, bringing its total Bitcoin holdings to 845,050 $BTC , acquired at an average cost of roughly $75,412 per coin.
The latest purchase was funded through Strategy’s stock-sale program. The move signals a renewed commitment to Bitcoin accumulation after the company spent part of the summer managing its cash reserves and other financial obligations.
Strategy’s return to buying comes as Bitcoin continues to trade near the $78,000–$80,000 range, making the purchase a notable development for the broader crypto market.SEO Title: Strategy Resumes Bitcoin Buying With $369.7M $BTC Purchase
Hashtags: #Bitcoin #BTC #MichaelSaylor #Strategy #MSTR #CryptoNews #BitcoinNews
The company paid an average of about $80,318 per Bitcoin, bringing its total Bitcoin holdings to 845,050 $BTC , acquired at an average cost of roughly $75,412 per coin.
The latest purchase was funded through Strategy’s stock-sale program. The move signals a renewed commitment to Bitcoin accumulation after the company spent part of the summer managing its cash reserves and other financial obligations.
Strategy’s return to buying comes as Bitcoin continues to trade near the $78,000–$80,000 range, making the purchase a notable development for the broader crypto market.SEO Title: Strategy Resumes Bitcoin Buying With $369.7M $BTC Purchase
Hashtags: #Bitcoin #BTC #MichaelSaylor #Strategy #MSTR #CryptoNews #BitcoinNews
62
·
--
ບົດຄວາມ
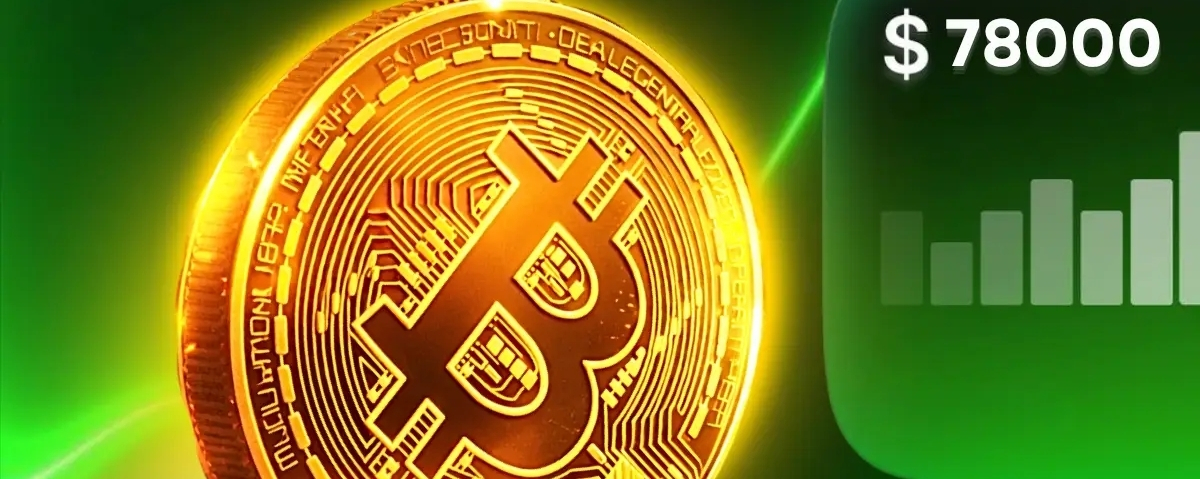
Bitcoin Holds Near $78,000 as $80K Resistance and Fed Policy Shape September OutlookBitcoin (BTC) is trading around $78,400, remaining below the crucial $80,000 level after recent volatility.
The market is now watching whether BTC can reclaim $80K and build fresh momentum. At the same time, expectations of a possible U.S. Federal Reserve rate hike in September are adding pressure to risk assets.
Key levels: Support near $77K | Resistance near $80K–$82K
Bitcoin Holds Near $78,000 as $80K Resistance and Fed Policy Shape September Outlook
Bitcoin (BTC) is trading around $78,400, remaining below the crucial $80,000 level after recent volatility.
The market is now watching whether BTC can reclaim $80K and build fresh momentum. At the same time, expectations of a possible U.S. Federal Reserve rate hike in September are adding pressure to risk assets.
Key levels: Support near $77K | Resistance near $80K–$82K
The market is now watching whether BTC can reclaim $80K and build fresh momentum. At the same time, expectations of a possible U.S. Federal Reserve rate hike in September are adding pressure to risk assets.
Key levels: Support near $77K | Resistance near $80K–$82K
40
·
--
ບົດຄວາມ
Bitcoin surged 24% in August 2026Bitcoin surged 24% in August 2026
{spot}(BTCUSDT)
to briefly clear $80,000 before encountering heavy overhead resistance. The market structure exhibits deep institutional participation, though key technical blocks and cooling short-term indicators point to immediate consolidation.Valid result indices for FinancePriceChart: 1.4.1
1 BTC equalsRs 21,916,049.60As of 31 Aug, 2:38 pm GMT+5 • Disclaimer2 Aug8 Aug14 Aug20 Aug26 Aug18,000,00019,000,00020,000,00021,000,00022,000,000
Bitcoin surged 24% in August 2026
Bitcoin surged 24% in August 2026
to briefly clear $80,000 before encountering heavy overhead resistance. The market structure exhibits deep institutional participation, though key technical blocks and cooling short-term indicators point to immediate consolidation.Valid result indices for FinancePriceChart: 1.4.1
1 BTC equalsRs 21,916,049.60As of 31 Aug, 2:38 pm GMT+5 • Disclaimer2 Aug8 Aug14 Aug20 Aug26 Aug18,000,00019,000,00020,000,00021,000,00022,000,000
to briefly clear $80,000 before encountering heavy overhead resistance. The market structure exhibits deep institutional participation, though key technical blocks and cooling short-term indicators point to immediate consolidation.Valid result indices for FinancePriceChart: 1.4.1
1 BTC equalsRs 21,916,049.60As of 31 Aug, 2:38 pm GMT+5 • Disclaimer2 Aug8 Aug14 Aug20 Aug26 Aug18,000,00019,000,00020,000,00021,000,00022,000,000
85
·
--

ບົດຄວາມ
Tectonic Exploit Drains Nearly $75 Million as Most Funds Remain Stranded on CronosMeta Description: Tectonic has reportedly suffered a roughly $75 million DeFi exploit on Cronos, with about $6.3 million moved to Ethereum while nearly $69 million remains stranded.
Tectonic Hit by Estimated $75 Million DeFi Exploit
Tectonic, a decentralized lending protocol operating on the Cronos network, has reportedly been targeted in an exploit involving approximately $75 million in digital assets.
The incident prompted Cronos Network to halt blockchain activity after identifying an exploit affecting Tectonic. Validators reportedly stopped producing blocks while teams investigate the incident and assess the potential impact on users and assets.
TectonicFi has also warned users against interacting with the protocol until the platform is confirmed to be safe.
TONIC Liquidity Manipulation at the Center of Attack
Preliminary on-chain analysis suggests the attacker exploited TONIC's relatively thin liquidity to manipulate its market price. The inflated valuation was then allegedly used to borrow additional assets against artificially expensive collateral.
The suspected attack method has drawn comparisons with previous DeFi exploits, including the Mango Markets incident, where price manipulation was used to increase the value of collateral and enable large borrowing positions.
However, the exact mechanics and total financial impact remain subject to investigation and official confirmation.
About $6.3 Million Reportedly Reached Ethereum
Blockchain tracking reports indicate that approximately $6 million to $6.3 million was transferred from Cronos to Ethereum before the network was halted.
The funds were reportedly swapped into approximately 2,592 ETH.
Meanwhile, the overwhelming majority of the estimated stolen assets — approximately $68 million to $69 million — reportedly remain on the Cronos network. The chain halt may have prevented the attacker from moving a larger portion of the funds.
These figures remain preliminary and could change as investigators reconstruct the transactions and identify additional wallets or asset movements.
Cronos and Tectonic Investigation Underway
The immediate priority for Cronos and Tectonic is determining how the exploit occurred, securing the protocol and assessing the assets affected.
Users are expected to closely monitor official announcements for information regarding the investigation, network restart, affected deposits and potential recovery measures.
A detailed postmortem could provide important information about the vulnerability and whether changes to Tectonic's pricing, liquidity and lending mechanisms are required before the protocol resumes normal operations.
What DeFi Users Should Watch Next
The Tectonic incident once again highlights the risks associated with low liquidity, price manipulation and leveraged lending protocols in decentralized finance.
The next major developments will likely include:
Confirmation of the final amount lost-A technical postmortem from Tectonic Further updates from Cronos NetworkDetails on when Cronos will resume normal block productionEfforts to track or recover transferred assetsPotential compensation or recovery plans for affected users
Until official investigations are completed and Tectonic is declared safe, users should avoid interacting with the affected protocol.
Conclusion
The reported $75 million Tectonic exploit is one of the more significant recent DeFi security incidents involving the Cronos ecosystem. While only a relatively small portion of the suspected funds appears to have reached Ethereum, most of the estimated assets remain stranded on Cronos following the network halt.
The final scale of the incident will depend on the results of the ongoing investigation. For now, the crypto community will be watching Cronos and Tectonic for a definitive explanation of the exploit, the status of the stranded funds and any potential recovery or compensation measures.
SEO Keywords: Tectonic exploit, Tectonic hack, Tectonic crypto hack, TONIC exploit, Cronos Network exploit, Cronos hack, DeFi exploit, DeFi hack 2026, Tectonic $75 million hack, TONIC token, Cronos DeFi, crypto security, blockchain exploit, crypto hack news
{spot}(ETHUSDT)
ashtags:
#Tectonic #TONIC #Cronos #CronosNetwork #DeFi #DeFiHack #CryptoHack #CryptoSecurity #Blockchain #CryptoNews #Web3 #Ethereum #Crypto
Tectonic Exploit Drains Nearly $75 Million as Most Funds Remain Stranded on Cronos
Meta Description: Tectonic has reportedly suffered a roughly $75 million DeFi exploit on Cronos, with about $6.3 million moved to Ethereum while nearly $69 million remains stranded.
Tectonic Hit by Estimated $75 Million DeFi Exploit
Tectonic, a decentralized lending protocol operating on the Cronos network, has reportedly been targeted in an exploit involving approximately $75 million in digital assets.
The incident prompted Cronos Network to halt blockchain activity after identifying an exploit affecting Tectonic. Validators reportedly stopped producing blocks while teams investigate the incident and assess the potential impact on users and assets.
TectonicFi has also warned users against interacting with the protocol until the platform is confirmed to be safe.
TONIC Liquidity Manipulation at the Center of Attack
Preliminary on-chain analysis suggests the attacker exploited TONIC's relatively thin liquidity to manipulate its market price. The inflated valuation was then allegedly used to borrow additional assets against artificially expensive collateral.
The suspected attack method has drawn comparisons with previous DeFi exploits, including the Mango Markets incident, where price manipulation was used to increase the value of collateral and enable large borrowing positions.
However, the exact mechanics and total financial impact remain subject to investigation and official confirmation.
About $6.3 Million Reportedly Reached Ethereum
Blockchain tracking reports indicate that approximately $6 million to $6.3 million was transferred from Cronos to Ethereum before the network was halted.
The funds were reportedly swapped into approximately 2,592 ETH.
Meanwhile, the overwhelming majority of the estimated stolen assets — approximately $68 million to $69 million — reportedly remain on the Cronos network. The chain halt may have prevented the attacker from moving a larger portion of the funds.
These figures remain preliminary and could change as investigators reconstruct the transactions and identify additional wallets or asset movements.
Cronos and Tectonic Investigation Underway
The immediate priority for Cronos and Tectonic is determining how the exploit occurred, securing the protocol and assessing the assets affected.
Users are expected to closely monitor official announcements for information regarding the investigation, network restart, affected deposits and potential recovery measures.
A detailed postmortem could provide important information about the vulnerability and whether changes to Tectonic's pricing, liquidity and lending mechanisms are required before the protocol resumes normal operations.
What DeFi Users Should Watch Next
The Tectonic incident once again highlights the risks associated with low liquidity, price manipulation and leveraged lending protocols in decentralized finance.
The next major developments will likely include:
Confirmation of the final amount lost-A technical postmortem from Tectonic Further updates from Cronos NetworkDetails on when Cronos will resume normal block productionEfforts to track or recover transferred assetsPotential compensation or recovery plans for affected users
Until official investigations are completed and Tectonic is declared safe, users should avoid interacting with the affected protocol.
Conclusion
The reported $75 million Tectonic exploit is one of the more significant recent DeFi security incidents involving the Cronos ecosystem. While only a relatively small portion of the suspected funds appears to have reached Ethereum, most of the estimated assets remain stranded on Cronos following the network halt.
The final scale of the incident will depend on the results of the ongoing investigation. For now, the crypto community will be watching Cronos and Tectonic for a definitive explanation of the exploit, the status of the stranded funds and any potential recovery or compensation measures.
SEO Keywords: Tectonic exploit, Tectonic hack, Tectonic crypto hack, TONIC exploit, Cronos Network exploit, Cronos hack, DeFi exploit, DeFi hack 2026, Tectonic $75 million hack, TONIC token, Cronos DeFi, crypto security, blockchain exploit, crypto hack news
ashtags:
#Tectonic #TONIC #Cronos #CronosNetwork #DeFi #DeFiHack #CryptoHack #CryptoSecurity #Blockchain #CryptoNews #Web3 #Ethereum #Crypto
Tectonic Hit by Estimated $75 Million DeFi Exploit
Tectonic, a decentralized lending protocol operating on the Cronos network, has reportedly been targeted in an exploit involving approximately $75 million in digital assets.
The incident prompted Cronos Network to halt blockchain activity after identifying an exploit affecting Tectonic. Validators reportedly stopped producing blocks while teams investigate the incident and assess the potential impact on users and assets.
TectonicFi has also warned users against interacting with the protocol until the platform is confirmed to be safe.
TONIC Liquidity Manipulation at the Center of Attack
Preliminary on-chain analysis suggests the attacker exploited TONIC's relatively thin liquidity to manipulate its market price. The inflated valuation was then allegedly used to borrow additional assets against artificially expensive collateral.
The suspected attack method has drawn comparisons with previous DeFi exploits, including the Mango Markets incident, where price manipulation was used to increase the value of collateral and enable large borrowing positions.
However, the exact mechanics and total financial impact remain subject to investigation and official confirmation.
About $6.3 Million Reportedly Reached Ethereum
Blockchain tracking reports indicate that approximately $6 million to $6.3 million was transferred from Cronos to Ethereum before the network was halted.
The funds were reportedly swapped into approximately 2,592 ETH.
Meanwhile, the overwhelming majority of the estimated stolen assets — approximately $68 million to $69 million — reportedly remain on the Cronos network. The chain halt may have prevented the attacker from moving a larger portion of the funds.
These figures remain preliminary and could change as investigators reconstruct the transactions and identify additional wallets or asset movements.
Cronos and Tectonic Investigation Underway
The immediate priority for Cronos and Tectonic is determining how the exploit occurred, securing the protocol and assessing the assets affected.
Users are expected to closely monitor official announcements for information regarding the investigation, network restart, affected deposits and potential recovery measures.
A detailed postmortem could provide important information about the vulnerability and whether changes to Tectonic's pricing, liquidity and lending mechanisms are required before the protocol resumes normal operations.
What DeFi Users Should Watch Next
The Tectonic incident once again highlights the risks associated with low liquidity, price manipulation and leveraged lending protocols in decentralized finance.
The next major developments will likely include:
Confirmation of the final amount lost-A technical postmortem from Tectonic Further updates from Cronos NetworkDetails on when Cronos will resume normal block productionEfforts to track or recover transferred assetsPotential compensation or recovery plans for affected users
Until official investigations are completed and Tectonic is declared safe, users should avoid interacting with the affected protocol.
Conclusion
The reported $75 million Tectonic exploit is one of the more significant recent DeFi security incidents involving the Cronos ecosystem. While only a relatively small portion of the suspected funds appears to have reached Ethereum, most of the estimated assets remain stranded on Cronos following the network halt.
The final scale of the incident will depend on the results of the ongoing investigation. For now, the crypto community will be watching Cronos and Tectonic for a definitive explanation of the exploit, the status of the stranded funds and any potential recovery or compensation measures.
SEO Keywords: Tectonic exploit, Tectonic hack, Tectonic crypto hack, TONIC exploit, Cronos Network exploit, Cronos hack, DeFi exploit, DeFi hack 2026, Tectonic $75 million hack, TONIC token, Cronos DeFi, crypto security, blockchain exploit, crypto hack news
ashtags:
#Tectonic #TONIC #Cronos #CronosNetwork #DeFi #DeFiHack #CryptoHack #CryptoSecurity #Blockchain #CryptoNews #Web3 #Ethereum #Crypto
83
·
--
ບົດຄວາມ
The Volume-Confirmed Breakout System For Big Wins.Most traders lose money trying to predict the market. I stopped doing that.
Instead, I wait for the market to tell me what it wants to do. That’s what breakout trading is.
This is the exact strategy I use to catch the big $20\%$– $100\%$ moves without sitting on charts all day.
1. What is a Breakout?
A breakout happens when price pushes out of a area where it’s been stuck.
Think of it like a coiled spring. The longer it’s squeezed, the bigger the jump when it releases.
In trading terms:
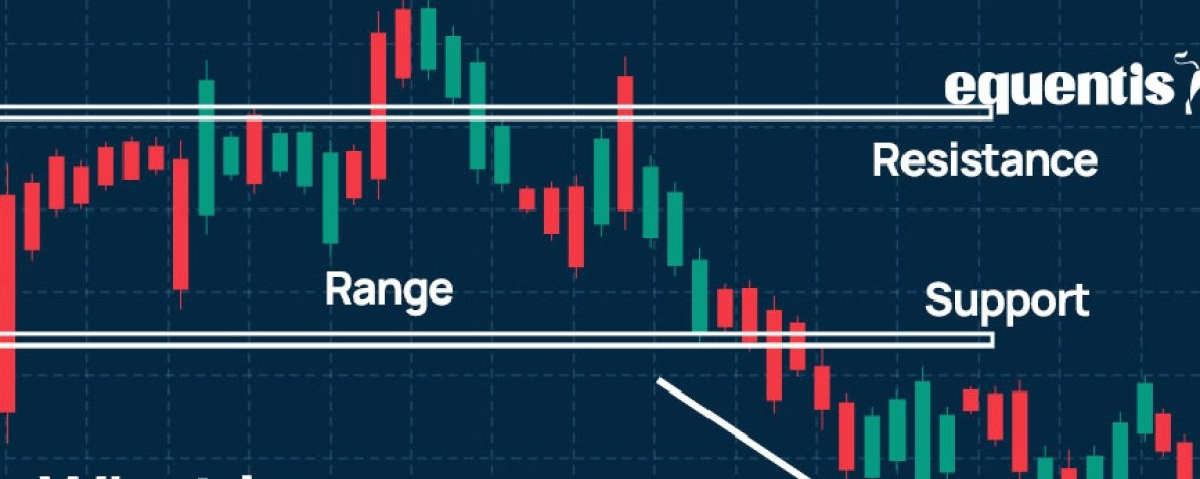
Breakout = Price closes above resistance or below support with volume.
We’re not guessing. We’re waiting for confirmation that buyers or sellers have taken control.
2. The 3-Part Setup I Look For
I don’t trade every breakout. 90% of them are fakeouts. I only take A+ setups.
Part A: The Base / Consolidation
I want at least 3-6 weeks of sideways movement. The tighter the range, the better.
Stocks/Crypto:
Look for a range that’s less than 15% wide
mKey levels:
Mark clear support and resistance. This is where the "spring" is coiling
Example: BTC stuck between $58,000 – $61,000 for 1 month
Part B: Volume Confirmation
A breakout without volume is a trap.
Rule: The breakout candle volume should be 50% higher than the 20-day average volume.
This tells me real money is entering, not just retail.
Part C: The Catalyst
Big moves need a reason.
For stocks: earnings, news, sector rotation.
For crypto: BTC move, exchange listing, DTC transfer news, halving, etc.
For *DTC Transfer: Stocks to Binance* theme, the catalyst would be the actual transfer window opening.
3. The Entry: Don’t Chase
This is where most people mess up.
My entry rule:
Wait for a close above resistance. Then enter on the next day’s retest of that level.
Why? First candle often spikes and dumps. The retest is safer and gives you a tight stop.
Example:
Resistance = $100
Day 1: Closes at $102 on high volume → Breakout confirmed
Day 2: Pulls back to $99-$100 → Enter here
Stop Loss = Below $97, just under the old resistance
4. Managing The Trade
*Target: I use 2 targets.
- Target 1: 2R. Book 50% here.
- Target 2: Let the rest run with a trailing stop. Use the 20 EMA as your guide.
Stop Loss: Never move it down. If price closes back inside the base, I’m out. That means the breakout failed.
5. The 2 Rules That Save Me Money
1. Time Stop: If the breakout doesn’t move in 3-5 days, it’s weak. Exit. Big moves don’t sit still.
2. Avoid Low Volume Breakouts: If volume is dead, institutions aren’t in it. Skip it.
Final Thoughts
Breakout trading is boring 80% of the time. You’re waiting.
But that 20% when it works pays for everything else.
You’re not predicting. You’re reacting. You’re letting the market do the hard work, then you just follow.
Start with paper trading this for 1 month. Mark 10 bases, track the breakouts, and only take the ones with volume + catalyst.
That’s how you train your eye to spot the real big moves.
Want me to turn this into a checklist PDF or show you a real chart example with this setup?
The Volume-Confirmed Breakout System For Big Wins.
Most traders lose money trying to predict the market. I stopped doing that.
Instead, I wait for the market to tell me what it wants to do. That’s what breakout trading is.
This is the exact strategy I use to catch the big $20\%$– $100\%$ moves without sitting on charts all day.
1. What is a Breakout?
A breakout happens when price pushes out of a area where it’s been stuck.
Think of it like a coiled spring. The longer it’s squeezed, the bigger the jump when it releases.
In trading terms:
Breakout = Price closes above resistance or below support with volume.
We’re not guessing. We’re waiting for confirmation that buyers or sellers have taken control.
2. The 3-Part Setup I Look For
I don’t trade every breakout. 90% of them are fakeouts. I only take A+ setups.
Part A: The Base / Consolidation
I want at least 3-6 weeks of sideways movement. The tighter the range, the better.
Stocks/Crypto:
Look for a range that’s less than 15% wide
mKey levels:
Mark clear support and resistance. This is where the "spring" is coiling
Example: BTC stuck between $58,000 – $61,000 for 1 month
Part B: Volume Confirmation
A breakout without volume is a trap.
Rule: The breakout candle volume should be 50% higher than the 20-day average volume.
This tells me real money is entering, not just retail.
Part C: The Catalyst
Big moves need a reason.
For stocks: earnings, news, sector rotation.
For crypto: BTC move, exchange listing, DTC transfer news, halving, etc.
For *DTC Transfer: Stocks to Binance* theme, the catalyst would be the actual transfer window opening.
3. The Entry: Don’t Chase
This is where most people mess up.
My entry rule:
Wait for a close above resistance. Then enter on the next day’s retest of that level.
Why? First candle often spikes and dumps. The retest is safer and gives you a tight stop.
Example:
Resistance = $100
Day 1: Closes at $102 on high volume → Breakout confirmed
Day 2: Pulls back to $99-$100 → Enter here
Stop Loss = Below $97, just under the old resistance
4. Managing The Trade
*Target: I use 2 targets.
- Target 1: 2R. Book 50% here.
- Target 2: Let the rest run with a trailing stop. Use the 20 EMA as your guide.
Stop Loss: Never move it down. If price closes back inside the base, I’m out. That means the breakout failed.
5. The 2 Rules That Save Me Money
1. Time Stop: If the breakout doesn’t move in 3-5 days, it’s weak. Exit. Big moves don’t sit still.
2. Avoid Low Volume Breakouts: If volume is dead, institutions aren’t in it. Skip it.
Final Thoughts
Breakout trading is boring 80% of the time. You’re waiting.
But that 20% when it works pays for everything else.
You’re not predicting. You’re reacting. You’re letting the market do the hard work, then you just follow.
Start with paper trading this for 1 month. Mark 10 bases, track the breakouts, and only take the ones with volume + catalyst.
That’s how you train your eye to spot the real big moves.
Want me to turn this into a checklist PDF or show you a real chart example with this setup?
Instead, I wait for the market to tell me what it wants to do. That’s what breakout trading is.
This is the exact strategy I use to catch the big $20\%$– $100\%$ moves without sitting on charts all day.
1. What is a Breakout?
A breakout happens when price pushes out of a area where it’s been stuck.
Think of it like a coiled spring. The longer it’s squeezed, the bigger the jump when it releases.
In trading terms:
Breakout = Price closes above resistance or below support with volume.
We’re not guessing. We’re waiting for confirmation that buyers or sellers have taken control.
2. The 3-Part Setup I Look For
I don’t trade every breakout. 90% of them are fakeouts. I only take A+ setups.
Part A: The Base / Consolidation
I want at least 3-6 weeks of sideways movement. The tighter the range, the better.
Stocks/Crypto:
Look for a range that’s less than 15% wide
mKey levels:
Mark clear support and resistance. This is where the "spring" is coiling
Example: BTC stuck between $58,000 – $61,000 for 1 month
Part B: Volume Confirmation
A breakout without volume is a trap.
Rule: The breakout candle volume should be 50% higher than the 20-day average volume.
This tells me real money is entering, not just retail.
Part C: The Catalyst
Big moves need a reason.
For stocks: earnings, news, sector rotation.
For crypto: BTC move, exchange listing, DTC transfer news, halving, etc.
For *DTC Transfer: Stocks to Binance* theme, the catalyst would be the actual transfer window opening.
3. The Entry: Don’t Chase
This is where most people mess up.
My entry rule:
Wait for a close above resistance. Then enter on the next day’s retest of that level.
Why? First candle often spikes and dumps. The retest is safer and gives you a tight stop.
Example:
Resistance = $100
Day 1: Closes at $102 on high volume → Breakout confirmed
Day 2: Pulls back to $99-$100 → Enter here
Stop Loss = Below $97, just under the old resistance
4. Managing The Trade
*Target: I use 2 targets.
- Target 1: 2R. Book 50% here.
- Target 2: Let the rest run with a trailing stop. Use the 20 EMA as your guide.
Stop Loss: Never move it down. If price closes back inside the base, I’m out. That means the breakout failed.
5. The 2 Rules That Save Me Money
1. Time Stop: If the breakout doesn’t move in 3-5 days, it’s weak. Exit. Big moves don’t sit still.
2. Avoid Low Volume Breakouts: If volume is dead, institutions aren’t in it. Skip it.
Final Thoughts
Breakout trading is boring 80% of the time. You’re waiting.
But that 20% when it works pays for everything else.
You’re not predicting. You’re reacting. You’re letting the market do the hard work, then you just follow.
Start with paper trading this for 1 month. Mark 10 bases, track the breakouts, and only take the ones with volume + catalyst.
That’s how you train your eye to spot the real big moves.
Want me to turn this into a checklist PDF or show you a real chart example with this setup?
33
·
--
##Bitcoin #BTC #BitcoinPrice #BitcoinNews #Crypto #Cryptocurrency #CryptoMarket #BTCPrice #BitcoinAnalysis #CryptoTrading #BitcoinETF #CryptoNews #Blockchain #DigitalAssets #BullMarket #BitcoinUpdate #BTCUSD #CryptoInvesting #MarketAnalysis #Binance
##Bitcoin #BTC #BitcoinPrice #BitcoinNews #Crypto #Cryptocurrency #CryptoMarket #BTCPrice #BitcoinAnalysis #CryptoTrading #BitcoinETF #CryptoNews #Blockchain #DigitalAssets #BullMarket #BitcoinUpdate #BTCUSD #CryptoInvesting #MarketAnalysis #Binance
60
·
--
ບົດຄວາມ
PROM Crypto Surges as Explosive Weekly Rally Draws Market AttentionAugust 30, 2026 — PROM (PROM) is making a strong move in the cryptocurrency market, emerging as one of the notable gainers as buying activity and trading volume accelerate. The token’s sharp rise has attracted significant speculative interest, while its rapid price movement highlights the importance of careful risk management.
PROM Market Overview
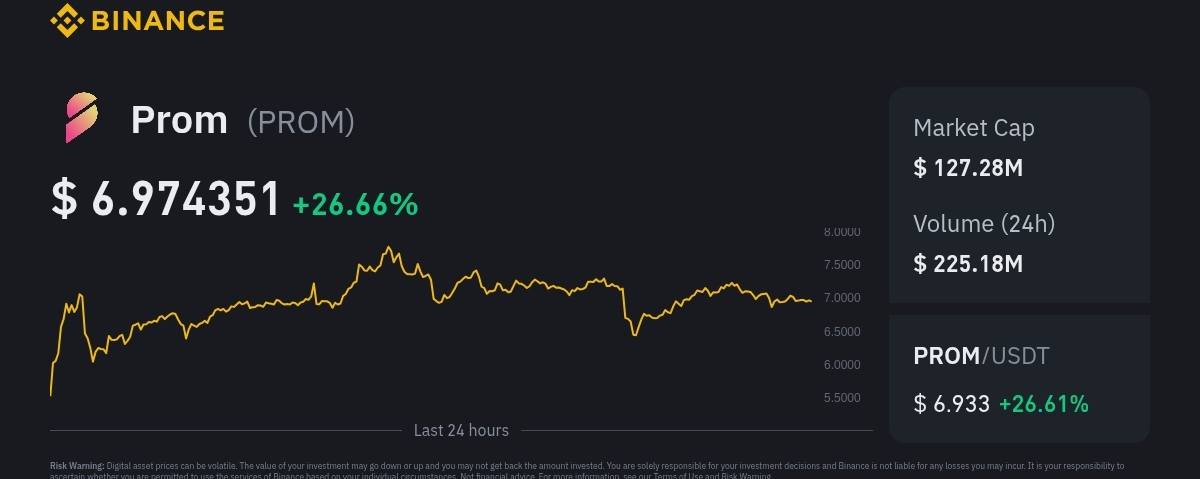
According to the latest market snapshot, PROM is trading in the range of approximately $7.11 to $7.37, representing a substantial increase over the past 24 hours.
- Current Price: Approximately $7.11–$7.37
- 24-Hour Change: Around +45% to +48%
- 7-Day Performance: Approximately +164%
- 24-Hour Trading Volume: More than $167.8 million to $223.5 million
- Market Capitalization: Approximately $132 million–$134 million
The combination of a triple-digit weekly gain and exceptionally high trading volume suggests that market participation has increased dramatically. Such momentum can create opportunities for traders, but it can also lead to significant price swings.
Strong Momentum and Rising Trading Activity
PROM’s weekly performance stands out, with the token gaining roughly 164% in seven days. At the same time, its daily trading volume has climbed into the hundreds of millions of dollars.
High volume generally indicates strong market activity and liquidity. However, when it accompanies a rapid price increase, it can also signal heightened speculation. Investors should therefore avoid making decisions based solely on short-term price momentum.
Risk Remains a Key Factor
Despite PROM’s impressive rally, its relatively modest market capitalization places it in a more volatile segment of the cryptocurrency market. Smaller-cap assets can experience rapid upward and downward movements, particularly when trading activity becomes unusually intense.
For market participants, monitoring volume, price support levels, broader crypto-market conditions, and momentum indicators may be more useful than chasing a sudden rally.
Conclusion
PROM’s recent performance has put the token firmly on the market’s radar. With a triple-digit weekly increase, strong daily gains, and trading volume exceeding $167 million, the asset is experiencing a period of intense market activity.
Whether the rally can continue will depend on sustained demand and broader market conditions. For now, PROM remains a high-momentum asset that deserves attention—but also a cautious and strategic approach to risk.
PROM Crypto Surges as Explosive Weekly Rally Draws Market Attention
August 30, 2026 — PROM (PROM) is making a strong move in the cryptocurrency market, emerging as one of the notable gainers as buying activity and trading volume accelerate. The token’s sharp rise has attracted significant speculative interest, while its rapid price movement highlights the importance of careful risk management.
PROM Market Overview
According to the latest market snapshot, PROM is trading in the range of approximately $7.11 to $7.37, representing a substantial increase over the past 24 hours.
- Current Price: Approximately $7.11–$7.37
- 24-Hour Change: Around +45% to +48%
- 7-Day Performance: Approximately +164%
- 24-Hour Trading Volume: More than $167.8 million to $223.5 million
- Market Capitalization: Approximately $132 million–$134 million
The combination of a triple-digit weekly gain and exceptionally high trading volume suggests that market participation has increased dramatically. Such momentum can create opportunities for traders, but it can also lead to significant price swings.
Strong Momentum and Rising Trading Activity
PROM’s weekly performance stands out, with the token gaining roughly 164% in seven days. At the same time, its daily trading volume has climbed into the hundreds of millions of dollars.
High volume generally indicates strong market activity and liquidity. However, when it accompanies a rapid price increase, it can also signal heightened speculation. Investors should therefore avoid making decisions based solely on short-term price momentum.
Risk Remains a Key Factor
Despite PROM’s impressive rally, its relatively modest market capitalization places it in a more volatile segment of the cryptocurrency market. Smaller-cap assets can experience rapid upward and downward movements, particularly when trading activity becomes unusually intense.
For market participants, monitoring volume, price support levels, broader crypto-market conditions, and momentum indicators may be more useful than chasing a sudden rally.
Conclusion
PROM’s recent performance has put the token firmly on the market’s radar. With a triple-digit weekly increase, strong daily gains, and trading volume exceeding $167 million, the asset is experiencing a period of intense market activity.
Whether the rally can continue will depend on sustained demand and broader market conditions. For now, PROM remains a high-momentum asset that deserves attention—but also a cautious and strategic approach to risk.
PROM Market Overview
According to the latest market snapshot, PROM is trading in the range of approximately $7.11 to $7.37, representing a substantial increase over the past 24 hours.
- Current Price: Approximately $7.11–$7.37
- 24-Hour Change: Around +45% to +48%
- 7-Day Performance: Approximately +164%
- 24-Hour Trading Volume: More than $167.8 million to $223.5 million
- Market Capitalization: Approximately $132 million–$134 million
The combination of a triple-digit weekly gain and exceptionally high trading volume suggests that market participation has increased dramatically. Such momentum can create opportunities for traders, but it can also lead to significant price swings.
Strong Momentum and Rising Trading Activity
PROM’s weekly performance stands out, with the token gaining roughly 164% in seven days. At the same time, its daily trading volume has climbed into the hundreds of millions of dollars.
High volume generally indicates strong market activity and liquidity. However, when it accompanies a rapid price increase, it can also signal heightened speculation. Investors should therefore avoid making decisions based solely on short-term price momentum.
Risk Remains a Key Factor
Despite PROM’s impressive rally, its relatively modest market capitalization places it in a more volatile segment of the cryptocurrency market. Smaller-cap assets can experience rapid upward and downward movements, particularly when trading activity becomes unusually intense.
For market participants, monitoring volume, price support levels, broader crypto-market conditions, and momentum indicators may be more useful than chasing a sudden rally.
Conclusion
PROM’s recent performance has put the token firmly on the market’s radar. With a triple-digit weekly increase, strong daily gains, and trading volume exceeding $167 million, the asset is experiencing a period of intense market activity.
Whether the rally can continue will depend on sustained demand and broader market conditions. For now, PROM remains a high-momentum asset that deserves attention—but also a cautious and strategic approach to risk.
102
·
--
ບົດຄວາມ
Bitcoin Price Analysis: BTC Consolidates Below $80,000 Amid Market PressureBitcoin is currently trading around $78,760, continuing to consolidate below the important $80,000 level after a recent market pullback. Although Bitcoin remains above key support areas, several factors are creating short-term uncertainty for the cryptocurrency market.
Bitcoin Pulls Back From Key Resistance
Bitcoin recently faced strong selling pressure near the $81,000–$81,500 resistance zone. A massive $6.36 billion options expiry contributed to increased market volatility as traders adjusted their positions and leverage was reset.
The pullback has kept Bitcoin below the psychological $80,000 threshold, making the next few trading sessions important for determining whether BTC can regain upward momentum.
Bitcoin ETF Inflows Lose Momentum
Another factor affecting Bitcoin's short-term performance is weaker demand from U.S. spot Bitcoin exchange-traded funds (ETFs). Recent data showed approximately $201.8 million in net daily outflows, bringing an end to a strong multi-day buying streak.
Lower ETF demand can reduce immediate buying pressure and may make it more difficult for Bitcoin to break through nearby resistance levels.
Macroeconomic Pressure Weighs on Risk Assets
Broader economic conditions are also influencing Bitcoin's price. Hawkish monetary-policy signals and persistent inflation concerns have increased expectations that interest rates could remain higher for longer.
Higher interest rates generally create pressure on risk-sensitive assets, including cryptocurrencies, as investors may become more cautious about taking on market risk.
Whales and Short-Term Holders Take Profits
On-chain activity suggests that some short-term holders and large Bitcoin investors, often referred to as whales, have been taking profits following Bitcoin's rapid August advance.
This profit-taking has contributed to increased selling pressure. Analysts are watching the $81,000–$86,000 area, where a significant amount of potential overhead supply could make Bitcoin's next upward move more challenging.
What Comes Next for Bitcoin?
Bitcoin's ability to reclaim and hold above $80,000 could be an important signal for renewed bullish momentum. A sustained breakout above the $81,000–$81,500 resistance zone could strengthen the market's bullish outlook.
However, continued ETF outflows, macroeconomic uncertainty, and profit-taking could keep BTC under pressure in the short term.
For real-time Bitcoin prices, market data, and charts, traders can monitor platforms such as Binance and CoinGecko.
Conclusion
Bitcoin's current price action reflects a market caught between strong long-term optimism and short-term selling pressure. With BTC trading around $78,760, the $80,000 level remains a key psychological area to watch. Whether Bitcoin can break through resistance or experience another pullback may depend on ETF demand, macroeconomic deBitcoin Price Analysis: BTC Consolidates Below $80,000 Amid Market Pressurevelopments, and renewed buying activity.
Bitcoin Price Analysis: BTC Consolidates Below $80,000 Amid Market Pressure
Bitcoin is currently trading around $78,760, continuing to consolidate below the important $80,000 level after a recent market pullback. Although Bitcoin remains above key support areas, several factors are creating short-term uncertainty for the cryptocurrency market.
Bitcoin Pulls Back From Key Resistance
Bitcoin recently faced strong selling pressure near the $81,000–$81,500 resistance zone. A massive $6.36 billion options expiry contributed to increased market volatility as traders adjusted their positions and leverage was reset.
The pullback has kept Bitcoin below the psychological $80,000 threshold, making the next few trading sessions important for determining whether BTC can regain upward momentum.
Bitcoin ETF Inflows Lose Momentum
Another factor affecting Bitcoin's short-term performance is weaker demand from U.S. spot Bitcoin exchange-traded funds (ETFs). Recent data showed approximately $201.8 million in net daily outflows, bringing an end to a strong multi-day buying streak.
Lower ETF demand can reduce immediate buying pressure and may make it more difficult for Bitcoin to break through nearby resistance levels.
Macroeconomic Pressure Weighs on Risk Assets
Broader economic conditions are also influencing Bitcoin's price. Hawkish monetary-policy signals and persistent inflation concerns have increased expectations that interest rates could remain higher for longer.
Higher interest rates generally create pressure on risk-sensitive assets, including cryptocurrencies, as investors may become more cautious about taking on market risk.
Whales and Short-Term Holders Take Profits
On-chain activity suggests that some short-term holders and large Bitcoin investors, often referred to as whales, have been taking profits following Bitcoin's rapid August advance.
This profit-taking has contributed to increased selling pressure. Analysts are watching the $81,000–$86,000 area, where a significant amount of potential overhead supply could make Bitcoin's next upward move more challenging.
What Comes Next for Bitcoin?
Bitcoin's ability to reclaim and hold above $80,000 could be an important signal for renewed bullish momentum. A sustained breakout above the $81,000–$81,500 resistance zone could strengthen the market's bullish outlook.
However, continued ETF outflows, macroeconomic uncertainty, and profit-taking could keep BTC under pressure in the short term.
For real-time Bitcoin prices, market data, and charts, traders can monitor platforms such as Binance and CoinGecko.
Conclusion
Bitcoin's current price action reflects a market caught between strong long-term optimism and short-term selling pressure. With BTC trading around $78,760, the $80,000 level remains a key psychological area to watch. Whether Bitcoin can break through resistance or experience another pullback may depend on ETF demand, macroeconomic deBitcoin Price Analysis: BTC Consolidates Below $80,000 Amid Market Pressurevelopments, and renewed buying activity.
Bitcoin Pulls Back From Key Resistance
Bitcoin recently faced strong selling pressure near the $81,000–$81,500 resistance zone. A massive $6.36 billion options expiry contributed to increased market volatility as traders adjusted their positions and leverage was reset.
The pullback has kept Bitcoin below the psychological $80,000 threshold, making the next few trading sessions important for determining whether BTC can regain upward momentum.
Bitcoin ETF Inflows Lose Momentum
Another factor affecting Bitcoin's short-term performance is weaker demand from U.S. spot Bitcoin exchange-traded funds (ETFs). Recent data showed approximately $201.8 million in net daily outflows, bringing an end to a strong multi-day buying streak.
Lower ETF demand can reduce immediate buying pressure and may make it more difficult for Bitcoin to break through nearby resistance levels.
Macroeconomic Pressure Weighs on Risk Assets
Broader economic conditions are also influencing Bitcoin's price. Hawkish monetary-policy signals and persistent inflation concerns have increased expectations that interest rates could remain higher for longer.
Higher interest rates generally create pressure on risk-sensitive assets, including cryptocurrencies, as investors may become more cautious about taking on market risk.
Whales and Short-Term Holders Take Profits
On-chain activity suggests that some short-term holders and large Bitcoin investors, often referred to as whales, have been taking profits following Bitcoin's rapid August advance.
This profit-taking has contributed to increased selling pressure. Analysts are watching the $81,000–$86,000 area, where a significant amount of potential overhead supply could make Bitcoin's next upward move more challenging.
What Comes Next for Bitcoin?
Bitcoin's ability to reclaim and hold above $80,000 could be an important signal for renewed bullish momentum. A sustained breakout above the $81,000–$81,500 resistance zone could strengthen the market's bullish outlook.
However, continued ETF outflows, macroeconomic uncertainty, and profit-taking could keep BTC under pressure in the short term.
For real-time Bitcoin prices, market data, and charts, traders can monitor platforms such as Binance and CoinGecko.
Conclusion
Bitcoin's current price action reflects a market caught between strong long-term optimism and short-term selling pressure. With BTC trading around $78,760, the $80,000 level remains a key psychological area to watch. Whether Bitcoin can break through resistance or experience another pullback may depend on ETF demand, macroeconomic deBitcoin Price Analysis: BTC Consolidates Below $80,000 Amid Market Pressurevelopments, and renewed buying activity.
77
ເຂົ້າສູ່ລະບົບເພື່ອສຳຫຼວດເນື້ອຫາເພີ່ມເຕີມ
ເຂົ້າຮ່ວມກຸ່ມຜູ້ໃຊ້ຄຣິບໂຕທົ່ວໂລກໃນ Binance Square.
⚡️ ໄດ້ຮັບຂໍ້ມູນຫຼ້າສຸດ ແລະ ທີ່ມີປະໂຫຍດກ່ຽວກັບຄຣິບໂຕ.
💬 ໄດ້ຮັບຄວາມໄວ້ວາງໃຈຈາກຕະຫຼາດແລກປ່ຽນຄຣິບໂຕທີ່ໃຫຍ່ທີ່ສຸດໃນໂລກ.
👍 ຄົ້ນຫາຂໍ້ມູນເຊີງເລິກທີ່ແທ້ຈາກນັກສ້າງທີ່ໄດ້ຮັບການຢືນຢັນ.
ອີເມວ / ເບີໂທລະສັບ
ຫົວຂໍ້ທີ່ກໍາລັງນິຍົມ
SolanaFallsOver3%
9,118 views
320 ກຳລັງສົນທະນາ
#solanafallsover3%
Solana ($SOL) drops more than 3%, putting short-term pressure on the market. Traders are watching support levels and overall crypto sentiment closely.
📉 SOL: Bearish short-term momentum
⚠️ Watch: Support levels & trading volume
🔎 Key factor: Broader crypto market direction
#SOL #Solana #Crypto #Altcoins
$SOL
$BTC
$ETH
Older-group
·0 ຖືກໃຈ
·1.5k views
DellSurges8%OnEarningsBeat
9,324 views
267 ກຳລັງສົນທະນາ
USAugADPJobsSmallestGainSinceJan
8,967 views
221 ກຳລັງສົນທະນາ