
Bhandari Pitambar
2.5k ໂພສ

Bhandari Pitambar
ລາຍງານ
ບລັອກຜູ້ໃຊ້
ເປີດການຊື້ຂາຍ

ຜູ້ຖື PEPE
ຜູ້ຊື້ຂາຍປະຈໍາ
1.2 ປີ
2.2K+ ກໍາລັງຕິດຕາມ
601 ຜູ້ຕິດຕາມ
233 Liked
ໂພສ
Portfolio
ທັງໝົດ
ວີດີໂອ
ຖ່າຍທອດສົດ
ບົດຄວາມ
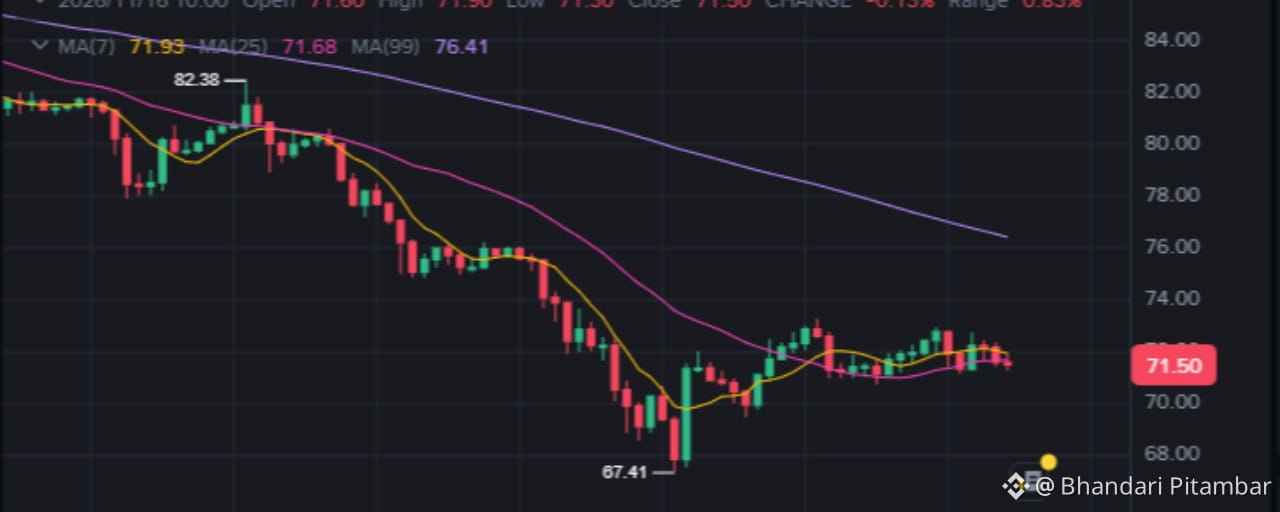
Solana at $71.50 Two Bullets Fired at $73, Both Missed Why SOL Is Now the Weakest Major on the BoardOpening with the meta-problem, because it's now unavoidable: this is the fourth chart this session (BNB, BTC, DOGE, SOL) showing the identical structure — impulse down, capitulation wick at the low, shrinking-volume coil under a descending MA99. When four unrelated assets print the same grammar simultaneously, coin-level analysis is mostly overfitting to one macro move. The honest signal today is the regime, not the token. Any SOL-specific "narrative" attached to this chart is decoration on a beta trade.
Now stress-testing the two reads of SOL itself:
The bullish read ("higher lows since 67.41, coiling to break out") fails on the 73 rejections. Price attacked the low-73s twice post-low — the stronger attempt carrying the biggest post-capitulation volume bar in the pane — and both were sold back. Last close 71.50 sits below MA7 (71.93) and MA25 (71.68). Buyers have spent their two best shots inside this coil and hold nothing above 72. Volume-backed failure is worse than low-volume failure: it proves real supply, not just apathy.
The bearish read ("deepest drawdown of the majors, straight back to 67.41") ignores the absorption and the floor. The 67.41 low printed with a long wick on peak volume — forced selling was bought. Since then, pullbacks have held ~71 twice, and today's candle low (71.30) defended that shelf again. Shorting a defended floor inside a 0.83% coil is selling the exact level the tape has already refused to break three times.
Unverifiable here, therefore not asserted: funding, OI, long/short ratios, liquidation depth, today's ETF flow prints, exchange netflows, Fear & Greed, live CPI/DXY. Off-chart items below are conditional frameworks, labeled.
MARKET ANALYSIS — SOL/USDT (1H, Nov 16, 2026, 10:00 candle)
1. Macro & Global Context (framework)
Binding variables unchanged market-wide: Fed December meeting path, DXY strength, post-midterm policy digestion. SOL is high-beta risk asset par excellence — its -18.17% impulse (82.38 → 67.41) is the deepest of the four charts verified this session, consistent with liquidity contraction hitting duration-heavy assets hardest.No candle on this chart evidences an idiosyncratic SOL catalyst in either direction. The coil is macro-waiting, same as BTC/BNB/DOGE.
2. Market Structure & Dominance (conditional)
Defensive regime signature: BTC dominance bid, alt liquidity thinning, USDT dominance creeping. SOL's deeper drawdown vs BTC (-18.17% vs -14.15%) is that regime expressed in beta, not a SOL-specific failure. If altseason indicators (unverified here) were rising into this tape, I'd distrust the indicators, not the price.
3. Technicals — chart-verified (1H), inferred (higher TFs)
1H facts:
Last candle: O 71.60 / H 71.90 / L 71.30 / C 71.50, change -0.13%, range 0.83%. Compression, though wider than DOGE's 0.30% — SOL's coil is looser, i.e., more contested.MAs: close below MA7 (71.93) and MA25 (71.68); MA99 at 76.41 descending, +6.87% overhead — the largest trend-gap of the verified set (BTC +4.87%, BNB +5.43%, DOGE +6.44%).Structure: impulse 82.38 → 67.41; absorption wick on peak volume; two pushes into ~72.8–73.2 (visual estimate), both rejected; coil floor ~71.0–71.3 defended repeatedly; now fading mid-coil.Volume: current hour 76.264K SOL / 5.458M USDT — below both volume MAs (109.031K / 121.171K). Participation is leaving the coil; the only conviction prints remain the 67.41 absorption and the failed 73 attack.
4H/Daily inference (labeled): deepest impulse + widest MA99 gap of the majors means SOL needs the largest repair effort to flip trend. Mean-reversion toward 76.41 is possible on any BTC strength, but trend inversion requires holding ~76.5+ — a two-stage climb, not one breakout.
15m: noise; ignore.
4. Futures & Positioning (conditional framework)
SOL perps historically run hot leverage; coils like this are where funding gets reset.If funding flipped negative into the 73 rejections and price still holds 71: shorts are paying to fade a defended floor — squeeze fuel if BTC breaks up.If OI rose on both failed 73 pushes and is now declining: trapped longs are unwinding inside the coil → grind toward 71.00/70.00 before any upside.Liquidation logic: resting liquidity above 73.20 and below 67.41/67.00. The coil's job is to lure positioning toward one edge before resolving.
5. Whales & Institutional Reality (watch-list)
Unlike DOGE, SOL has a real institutional channel: US spot SOL ETFs exist as a structural flow vehicle (existence verified from prior knowledge; today's flow numbers are not verifiable in this session — demand live sources).The only whale footprint this chart verifies is the 67.41 absorption. Confirmation of accumulation would be a held reclaim of 73.20 on expanding volume, or a higher low on rising volume. Neither has printed. Two volume-backed failures at 73 are, for now, the stronger evidence — of supply.
6. News, Sentiment, Calendar (unverified — flagged)
Ecosystem headlines (client upgrades, network performance history) remain SOL's sentiment swing factors, but none are verifiable as today's drivers here. Sentiment in post-18%-drawdown high-beta tapes skews fear with reflexive dip-buying — inference, not a quoted index.Forward catalysts: US macro prints, December FOMC window, and BTC's coil resolution (65,200 up / 64,000 down on BTC 1H). SOL will amplify whichever edge BTC chooses.
FINAL ANALYSIS — SOL: MOVE SIDEWAYS (71.0–73.2 coil), bearish tilt, weakest major on the verified board
Verified ranking (four charts, same session): BTC strongest (shallowest drawdown -14.15%, smallest MA99 gap +4.87%, cleanest higher low) > BNB (-14.27%, +5.43%) > DOGE (-16.90%, +6.44%, one failed reclaim) > SOL weakest (-18.17%, +6.87%, two failed rejections at 73 including one on volume). Concrete reasons, not vibes: depth of impulse, distance from trend mean, and quality of failed upside attempts.
Key levels (chart-derived):
Resistance 1: 71.93–72.00 (MA7 + round number)Resistance 2: 72.80–73.20 (double-rejection zone, visual estimate)Resistance 3 / trend flip: 76.41 (MA99) confluence with breakdown shelf ~75.5–76.5Support 1: 71.00–71.30 (coil floor, defended 3× including today's low)Support 2: 70.00 psychologicalSupport 3: 67.41 (swing low — base thesis invalidation); loss opens unlabeled air toward ~65–66
Scenarios & triggers:
Bullish trigger: 1H close above 73.20 on volume exceeding the failed push → targets 74.5–75.0, then 76.41 shelf. Invalidation: close back below 71.00.Bearish trigger: 1H close below 71.00 → 70.00, then 67.41 retest; loss of 67.41 extends toward ~65–66. Invalidation: reclaim of 73.20.Base case: 71.0–73.2 chop until BTC resolves its own coil; SOL amplifies the outcome with the highest variance of the verified set.
Outlook:
Short-term (days): sideways; 0.83% range and sub-MA volume say expansion is near but direction is imported.Medium-term (weeks): bearish while below 76.41; neutral only on sustained hold above ~76.5
Solana closed the hour at $71.50, down 0.13%, coiling inside a 0.83% range after an -18.17% impulse from $82.38 to $67.41 — the deepest drawdown among the majors I've verified this session. The coil looks like calm. It isn't. It's the aftermath of two failed attacks on the low-73s, one of them carrying the biggest post-capitulation volume bar on the chart. Supply at 73 isn't a theory; it's on the tape.
Market Overview: One Regime, Four Charts
BNB, BTC, DOGE, SOL — all four print the same structure today: impulse down, absorption wick at the low, shrinking-volume coil under a descending long-run mean. That's not four stories; it's one macro story (Fed December window, firm dollar, defensive positioning) told in four betas. SOL's version is the loudest because its beta is the highest and its overhead damage is the worst: the descending MA99 at 76.41 sits +6.87% above price — the largest trend gap of the set (BTC: +4.87%, BNB: +5.43%, DOGE: +6.44%).
The Chart: Verified Supply Above, Verified Bids Below
Verified bids: the $67.41 low printed with a long wick on peak volume, and the ~$71.00–71.30 shelf has since been defended three times, including today's candle low at 71.30.
Verified supply: two pushes into ~72.8–73.2, both sold back; price now sits below MA7 (71.93) and MA25 (71.68). Current-hour volume (76.264K SOL / 5.458M USDT) runs below both volume MAs — the coil is losing participants, which is how ranges end: quietly, then violently.
Bullish vs. Bearish Scenarios
Bulls need: a 1H close above 73.20 on volume bigger than the failed attempt. That opens 74.5–75.0 and puts the 76.41 breakdown shelf in play — a two-stage repair, not a single breakout. Thesis dies below 71.00.
Bears need: a 1H close below 71.00, the thrice-defended floor. That targets 70.00, then a 67.41 retest; losing 67.41 opens thin air toward ~65–66. Thesis dies on a 73.20 reclaim.
Most likely: more coil, then an imported move. SOL amplifies BTC's next edge break (65,200 up / 64,000 down on the BTC 1H). Trading SOL mid-coil is trading BTC's coin flip with extra variance.
Whale & Institutional Reality Check
SOL does have a genuine institutional channel — US spot SOL ETFs — but today's flow numbers are not verifiable in this analysis, and anyone quoting them without a live source is guessing aloud. What the chart itself verifies: absorption at 67.41 (passive bids present) and two volume-backed failures at 73 (active buyers absent where it matters). Accumulation confirms itself with held reclaims on rising volume. SOL hasn't done that yet.
Key Levels Cheat Sheet
R1: 71.93–72.00 | R2: 72.80–73.20 | R3 (trend flip): 76.41–76.50S1: 71.00–71.30 | S2: 70.00 | S3: 67.41
Final Prediction
SIDEWAYS inside 71.0–73.2, bearish tilt below 76.41, weakest major of the verified set. Expect compression until macro or BTC forces the edge. The thrice-defended 71.00 floor and the twice-rejected 73.20 ceiling are your contract with reality; mid-range is where contracts go to die. No guarantees — invalidations above are the exit doors.
The Bottom Line
SOL's chart is a negotiation between buyers who only show up at 71 and sellers who only show up at 73. Negotiations this tight end in breakouts or breakdowns, not compromises. Let the edges vote first.
71.00 floor or 73.20 ceiling — which breaks first? Comments open.
#SOL #Solana #CryptoMarket #TechnicalAnalysis #Altcoins
{spot}(SOLUSDT)
Solana at $71.50 Two Bullets Fired at $73, Both Missed Why SOL Is Now the Weakest Major on the Board
Opening with the meta-problem, because it's now unavoidable: this is the fourth chart this session (BNB, BTC, DOGE, SOL) showing the identical structure — impulse down, capitulation wick at the low, shrinking-volume coil under a descending MA99. When four unrelated assets print the same grammar simultaneously, coin-level analysis is mostly overfitting to one macro move. The honest signal today is the regime, not the token. Any SOL-specific "narrative" attached to this chart is decoration on a beta trade.
Now stress-testing the two reads of SOL itself:
The bullish read ("higher lows since 67.41, coiling to break out") fails on the 73 rejections. Price attacked the low-73s twice post-low — the stronger attempt carrying the biggest post-capitulation volume bar in the pane — and both were sold back. Last close 71.50 sits below MA7 (71.93) and MA25 (71.68). Buyers have spent their two best shots inside this coil and hold nothing above 72. Volume-backed failure is worse than low-volume failure: it proves real supply, not just apathy.
The bearish read ("deepest drawdown of the majors, straight back to 67.41") ignores the absorption and the floor. The 67.41 low printed with a long wick on peak volume — forced selling was bought. Since then, pullbacks have held ~71 twice, and today's candle low (71.30) defended that shelf again. Shorting a defended floor inside a 0.83% coil is selling the exact level the tape has already refused to break three times.
Unverifiable here, therefore not asserted: funding, OI, long/short ratios, liquidation depth, today's ETF flow prints, exchange netflows, Fear & Greed, live CPI/DXY. Off-chart items below are conditional frameworks, labeled.
MARKET ANALYSIS — SOL/USDT (1H, Nov 16, 2026, 10:00 candle)
1. Macro & Global Context (framework)
Binding variables unchanged market-wide: Fed December meeting path, DXY strength, post-midterm policy digestion. SOL is high-beta risk asset par excellence — its -18.17% impulse (82.38 → 67.41) is the deepest of the four charts verified this session, consistent with liquidity contraction hitting duration-heavy assets hardest.No candle on this chart evidences an idiosyncratic SOL catalyst in either direction. The coil is macro-waiting, same as BTC/BNB/DOGE.
2. Market Structure & Dominance (conditional)
Defensive regime signature: BTC dominance bid, alt liquidity thinning, USDT dominance creeping. SOL's deeper drawdown vs BTC (-18.17% vs -14.15%) is that regime expressed in beta, not a SOL-specific failure. If altseason indicators (unverified here) were rising into this tape, I'd distrust the indicators, not the price.
3. Technicals — chart-verified (1H), inferred (higher TFs)
1H facts:
Last candle: O 71.60 / H 71.90 / L 71.30 / C 71.50, change -0.13%, range 0.83%. Compression, though wider than DOGE's 0.30% — SOL's coil is looser, i.e., more contested.MAs: close below MA7 (71.93) and MA25 (71.68); MA99 at 76.41 descending, +6.87% overhead — the largest trend-gap of the verified set (BTC +4.87%, BNB +5.43%, DOGE +6.44%).Structure: impulse 82.38 → 67.41; absorption wick on peak volume; two pushes into ~72.8–73.2 (visual estimate), both rejected; coil floor ~71.0–71.3 defended repeatedly; now fading mid-coil.Volume: current hour 76.264K SOL / 5.458M USDT — below both volume MAs (109.031K / 121.171K). Participation is leaving the coil; the only conviction prints remain the 67.41 absorption and the failed 73 attack.
4H/Daily inference (labeled): deepest impulse + widest MA99 gap of the majors means SOL needs the largest repair effort to flip trend. Mean-reversion toward 76.41 is possible on any BTC strength, but trend inversion requires holding ~76.5+ — a two-stage climb, not one breakout.
15m: noise; ignore.
4. Futures & Positioning (conditional framework)
SOL perps historically run hot leverage; coils like this are where funding gets reset.If funding flipped negative into the 73 rejections and price still holds 71: shorts are paying to fade a defended floor — squeeze fuel if BTC breaks up.If OI rose on both failed 73 pushes and is now declining: trapped longs are unwinding inside the coil → grind toward 71.00/70.00 before any upside.Liquidation logic: resting liquidity above 73.20 and below 67.41/67.00. The coil's job is to lure positioning toward one edge before resolving.
5. Whales & Institutional Reality (watch-list)
Unlike DOGE, SOL has a real institutional channel: US spot SOL ETFs exist as a structural flow vehicle (existence verified from prior knowledge; today's flow numbers are not verifiable in this session — demand live sources).The only whale footprint this chart verifies is the 67.41 absorption. Confirmation of accumulation would be a held reclaim of 73.20 on expanding volume, or a higher low on rising volume. Neither has printed. Two volume-backed failures at 73 are, for now, the stronger evidence — of supply.
6. News, Sentiment, Calendar (unverified — flagged)
Ecosystem headlines (client upgrades, network performance history) remain SOL's sentiment swing factors, but none are verifiable as today's drivers here. Sentiment in post-18%-drawdown high-beta tapes skews fear with reflexive dip-buying — inference, not a quoted index.Forward catalysts: US macro prints, December FOMC window, and BTC's coil resolution (65,200 up / 64,000 down on BTC 1H). SOL will amplify whichever edge BTC chooses.
FINAL ANALYSIS — SOL: MOVE SIDEWAYS (71.0–73.2 coil), bearish tilt, weakest major on the verified board
Verified ranking (four charts, same session): BTC strongest (shallowest drawdown -14.15%, smallest MA99 gap +4.87%, cleanest higher low) > BNB (-14.27%, +5.43%) > DOGE (-16.90%, +6.44%, one failed reclaim) > SOL weakest (-18.17%, +6.87%, two failed rejections at 73 including one on volume). Concrete reasons, not vibes: depth of impulse, distance from trend mean, and quality of failed upside attempts.
Key levels (chart-derived):
Resistance 1: 71.93–72.00 (MA7 + round number)Resistance 2: 72.80–73.20 (double-rejection zone, visual estimate)Resistance 3 / trend flip: 76.41 (MA99) confluence with breakdown shelf ~75.5–76.5Support 1: 71.00–71.30 (coil floor, defended 3× including today's low)Support 2: 70.00 psychologicalSupport 3: 67.41 (swing low — base thesis invalidation); loss opens unlabeled air toward ~65–66
Scenarios & triggers:
Bullish trigger: 1H close above 73.20 on volume exceeding the failed push → targets 74.5–75.0, then 76.41 shelf. Invalidation: close back below 71.00.Bearish trigger: 1H close below 71.00 → 70.00, then 67.41 retest; loss of 67.41 extends toward ~65–66. Invalidation: reclaim of 73.20.Base case: 71.0–73.2 chop until BTC resolves its own coil; SOL amplifies the outcome with the highest variance of the verified set.
Outlook:
Short-term (days): sideways; 0.83% range and sub-MA volume say expansion is near but direction is imported.Medium-term (weeks): bearish while below 76.41; neutral only on sustained hold above ~76.5
Solana closed the hour at $71.50, down 0.13%, coiling inside a 0.83% range after an -18.17% impulse from $82.38 to $67.41 — the deepest drawdown among the majors I've verified this session. The coil looks like calm. It isn't. It's the aftermath of two failed attacks on the low-73s, one of them carrying the biggest post-capitulation volume bar on the chart. Supply at 73 isn't a theory; it's on the tape.
Market Overview: One Regime, Four Charts
BNB, BTC, DOGE, SOL — all four print the same structure today: impulse down, absorption wick at the low, shrinking-volume coil under a descending long-run mean. That's not four stories; it's one macro story (Fed December window, firm dollar, defensive positioning) told in four betas. SOL's version is the loudest because its beta is the highest and its overhead damage is the worst: the descending MA99 at 76.41 sits +6.87% above price — the largest trend gap of the set (BTC: +4.87%, BNB: +5.43%, DOGE: +6.44%).
The Chart: Verified Supply Above, Verified Bids Below
Verified bids: the $67.41 low printed with a long wick on peak volume, and the ~$71.00–71.30 shelf has since been defended three times, including today's candle low at 71.30.
Verified supply: two pushes into ~72.8–73.2, both sold back; price now sits below MA7 (71.93) and MA25 (71.68). Current-hour volume (76.264K SOL / 5.458M USDT) runs below both volume MAs — the coil is losing participants, which is how ranges end: quietly, then violently.
Bullish vs. Bearish Scenarios
Bulls need: a 1H close above 73.20 on volume bigger than the failed attempt. That opens 74.5–75.0 and puts the 76.41 breakdown shelf in play — a two-stage repair, not a single breakout. Thesis dies below 71.00.
Bears need: a 1H close below 71.00, the thrice-defended floor. That targets 70.00, then a 67.41 retest; losing 67.41 opens thin air toward ~65–66. Thesis dies on a 73.20 reclaim.
Most likely: more coil, then an imported move. SOL amplifies BTC's next edge break (65,200 up / 64,000 down on the BTC 1H). Trading SOL mid-coil is trading BTC's coin flip with extra variance.
Whale & Institutional Reality Check
SOL does have a genuine institutional channel — US spot SOL ETFs — but today's flow numbers are not verifiable in this analysis, and anyone quoting them without a live source is guessing aloud. What the chart itself verifies: absorption at 67.41 (passive bids present) and two volume-backed failures at 73 (active buyers absent where it matters). Accumulation confirms itself with held reclaims on rising volume. SOL hasn't done that yet.
Key Levels Cheat Sheet
R1: 71.93–72.00 | R2: 72.80–73.20 | R3 (trend flip): 76.41–76.50S1: 71.00–71.30 | S2: 70.00 | S3: 67.41
Final Prediction
SIDEWAYS inside 71.0–73.2, bearish tilt below 76.41, weakest major of the verified set. Expect compression until macro or BTC forces the edge. The thrice-defended 71.00 floor and the twice-rejected 73.20 ceiling are your contract with reality; mid-range is where contracts go to die. No guarantees — invalidations above are the exit doors.
The Bottom Line
SOL's chart is a negotiation between buyers who only show up at 71 and sellers who only show up at 73. Negotiations this tight end in breakouts or breakdowns, not compromises. Let the edges vote first.
71.00 floor or 73.20 ceiling — which breaks first? Comments open.
#SOL #Solana #CryptoMarket #TechnicalAnalysis #Altcoins
Now stress-testing the two reads of SOL itself:
The bullish read ("higher lows since 67.41, coiling to break out") fails on the 73 rejections. Price attacked the low-73s twice post-low — the stronger attempt carrying the biggest post-capitulation volume bar in the pane — and both were sold back. Last close 71.50 sits below MA7 (71.93) and MA25 (71.68). Buyers have spent their two best shots inside this coil and hold nothing above 72. Volume-backed failure is worse than low-volume failure: it proves real supply, not just apathy.
The bearish read ("deepest drawdown of the majors, straight back to 67.41") ignores the absorption and the floor. The 67.41 low printed with a long wick on peak volume — forced selling was bought. Since then, pullbacks have held ~71 twice, and today's candle low (71.30) defended that shelf again. Shorting a defended floor inside a 0.83% coil is selling the exact level the tape has already refused to break three times.
Unverifiable here, therefore not asserted: funding, OI, long/short ratios, liquidation depth, today's ETF flow prints, exchange netflows, Fear & Greed, live CPI/DXY. Off-chart items below are conditional frameworks, labeled.
MARKET ANALYSIS — SOL/USDT (1H, Nov 16, 2026, 10:00 candle)
1. Macro & Global Context (framework)
Binding variables unchanged market-wide: Fed December meeting path, DXY strength, post-midterm policy digestion. SOL is high-beta risk asset par excellence — its -18.17% impulse (82.38 → 67.41) is the deepest of the four charts verified this session, consistent with liquidity contraction hitting duration-heavy assets hardest.No candle on this chart evidences an idiosyncratic SOL catalyst in either direction. The coil is macro-waiting, same as BTC/BNB/DOGE.
2. Market Structure & Dominance (conditional)
Defensive regime signature: BTC dominance bid, alt liquidity thinning, USDT dominance creeping. SOL's deeper drawdown vs BTC (-18.17% vs -14.15%) is that regime expressed in beta, not a SOL-specific failure. If altseason indicators (unverified here) were rising into this tape, I'd distrust the indicators, not the price.
3. Technicals — chart-verified (1H), inferred (higher TFs)
1H facts:
Last candle: O 71.60 / H 71.90 / L 71.30 / C 71.50, change -0.13%, range 0.83%. Compression, though wider than DOGE's 0.30% — SOL's coil is looser, i.e., more contested.MAs: close below MA7 (71.93) and MA25 (71.68); MA99 at 76.41 descending, +6.87% overhead — the largest trend-gap of the verified set (BTC +4.87%, BNB +5.43%, DOGE +6.44%).Structure: impulse 82.38 → 67.41; absorption wick on peak volume; two pushes into ~72.8–73.2 (visual estimate), both rejected; coil floor ~71.0–71.3 defended repeatedly; now fading mid-coil.Volume: current hour 76.264K SOL / 5.458M USDT — below both volume MAs (109.031K / 121.171K). Participation is leaving the coil; the only conviction prints remain the 67.41 absorption and the failed 73 attack.
4H/Daily inference (labeled): deepest impulse + widest MA99 gap of the majors means SOL needs the largest repair effort to flip trend. Mean-reversion toward 76.41 is possible on any BTC strength, but trend inversion requires holding ~76.5+ — a two-stage climb, not one breakout.
15m: noise; ignore.
4. Futures & Positioning (conditional framework)
SOL perps historically run hot leverage; coils like this are where funding gets reset.If funding flipped negative into the 73 rejections and price still holds 71: shorts are paying to fade a defended floor — squeeze fuel if BTC breaks up.If OI rose on both failed 73 pushes and is now declining: trapped longs are unwinding inside the coil → grind toward 71.00/70.00 before any upside.Liquidation logic: resting liquidity above 73.20 and below 67.41/67.00. The coil's job is to lure positioning toward one edge before resolving.
5. Whales & Institutional Reality (watch-list)
Unlike DOGE, SOL has a real institutional channel: US spot SOL ETFs exist as a structural flow vehicle (existence verified from prior knowledge; today's flow numbers are not verifiable in this session — demand live sources).The only whale footprint this chart verifies is the 67.41 absorption. Confirmation of accumulation would be a held reclaim of 73.20 on expanding volume, or a higher low on rising volume. Neither has printed. Two volume-backed failures at 73 are, for now, the stronger evidence — of supply.
6. News, Sentiment, Calendar (unverified — flagged)
Ecosystem headlines (client upgrades, network performance history) remain SOL's sentiment swing factors, but none are verifiable as today's drivers here. Sentiment in post-18%-drawdown high-beta tapes skews fear with reflexive dip-buying — inference, not a quoted index.Forward catalysts: US macro prints, December FOMC window, and BTC's coil resolution (65,200 up / 64,000 down on BTC 1H). SOL will amplify whichever edge BTC chooses.
FINAL ANALYSIS — SOL: MOVE SIDEWAYS (71.0–73.2 coil), bearish tilt, weakest major on the verified board
Verified ranking (four charts, same session): BTC strongest (shallowest drawdown -14.15%, smallest MA99 gap +4.87%, cleanest higher low) > BNB (-14.27%, +5.43%) > DOGE (-16.90%, +6.44%, one failed reclaim) > SOL weakest (-18.17%, +6.87%, two failed rejections at 73 including one on volume). Concrete reasons, not vibes: depth of impulse, distance from trend mean, and quality of failed upside attempts.
Key levels (chart-derived):
Resistance 1: 71.93–72.00 (MA7 + round number)Resistance 2: 72.80–73.20 (double-rejection zone, visual estimate)Resistance 3 / trend flip: 76.41 (MA99) confluence with breakdown shelf ~75.5–76.5Support 1: 71.00–71.30 (coil floor, defended 3× including today's low)Support 2: 70.00 psychologicalSupport 3: 67.41 (swing low — base thesis invalidation); loss opens unlabeled air toward ~65–66
Scenarios & triggers:
Bullish trigger: 1H close above 73.20 on volume exceeding the failed push → targets 74.5–75.0, then 76.41 shelf. Invalidation: close back below 71.00.Bearish trigger: 1H close below 71.00 → 70.00, then 67.41 retest; loss of 67.41 extends toward ~65–66. Invalidation: reclaim of 73.20.Base case: 71.0–73.2 chop until BTC resolves its own coil; SOL amplifies the outcome with the highest variance of the verified set.
Outlook:
Short-term (days): sideways; 0.83% range and sub-MA volume say expansion is near but direction is imported.Medium-term (weeks): bearish while below 76.41; neutral only on sustained hold above ~76.5
Solana closed the hour at $71.50, down 0.13%, coiling inside a 0.83% range after an -18.17% impulse from $82.38 to $67.41 — the deepest drawdown among the majors I've verified this session. The coil looks like calm. It isn't. It's the aftermath of two failed attacks on the low-73s, one of them carrying the biggest post-capitulation volume bar on the chart. Supply at 73 isn't a theory; it's on the tape.
Market Overview: One Regime, Four Charts
BNB, BTC, DOGE, SOL — all four print the same structure today: impulse down, absorption wick at the low, shrinking-volume coil under a descending long-run mean. That's not four stories; it's one macro story (Fed December window, firm dollar, defensive positioning) told in four betas. SOL's version is the loudest because its beta is the highest and its overhead damage is the worst: the descending MA99 at 76.41 sits +6.87% above price — the largest trend gap of the set (BTC: +4.87%, BNB: +5.43%, DOGE: +6.44%).
The Chart: Verified Supply Above, Verified Bids Below
Verified bids: the $67.41 low printed with a long wick on peak volume, and the ~$71.00–71.30 shelf has since been defended three times, including today's candle low at 71.30.
Verified supply: two pushes into ~72.8–73.2, both sold back; price now sits below MA7 (71.93) and MA25 (71.68). Current-hour volume (76.264K SOL / 5.458M USDT) runs below both volume MAs — the coil is losing participants, which is how ranges end: quietly, then violently.
Bullish vs. Bearish Scenarios
Bulls need: a 1H close above 73.20 on volume bigger than the failed attempt. That opens 74.5–75.0 and puts the 76.41 breakdown shelf in play — a two-stage repair, not a single breakout. Thesis dies below 71.00.
Bears need: a 1H close below 71.00, the thrice-defended floor. That targets 70.00, then a 67.41 retest; losing 67.41 opens thin air toward ~65–66. Thesis dies on a 73.20 reclaim.
Most likely: more coil, then an imported move. SOL amplifies BTC's next edge break (65,200 up / 64,000 down on the BTC 1H). Trading SOL mid-coil is trading BTC's coin flip with extra variance.
Whale & Institutional Reality Check
SOL does have a genuine institutional channel — US spot SOL ETFs — but today's flow numbers are not verifiable in this analysis, and anyone quoting them without a live source is guessing aloud. What the chart itself verifies: absorption at 67.41 (passive bids present) and two volume-backed failures at 73 (active buyers absent where it matters). Accumulation confirms itself with held reclaims on rising volume. SOL hasn't done that yet.
Key Levels Cheat Sheet
R1: 71.93–72.00 | R2: 72.80–73.20 | R3 (trend flip): 76.41–76.50S1: 71.00–71.30 | S2: 70.00 | S3: 67.41
Final Prediction
SIDEWAYS inside 71.0–73.2, bearish tilt below 76.41, weakest major of the verified set. Expect compression until macro or BTC forces the edge. The thrice-defended 71.00 floor and the twice-rejected 73.20 ceiling are your contract with reality; mid-range is where contracts go to die. No guarantees — invalidations above are the exit doors.
The Bottom Line
SOL's chart is a negotiation between buyers who only show up at 71 and sellers who only show up at 73. Negotiations this tight end in breakouts or breakdowns, not compromises. Let the edges vote first.
71.00 floor or 73.20 ceiling — which breaks first? Comments open.
#SOL #Solana #CryptoMarket #TechnicalAnalysis #Altcoins
1
1
47
ບົດຄວາມ
NEAR PROTOCOL AT $3.17: BULLISH REVERSAL OR ANOTHER BIG DUMP? KEY LEVELS TO WATCH!🔥 NEAR Protocol is attempting to recover after a significant correction, but buyers are facing an important resistance zone.
With price consolidating around $3.17, elevated futures activity, and extreme fear across the broader crypto market, traders are asking one important question:
Can NEAR reclaim $3.30 and start another rally, or will sellers push the price back toward $3.00?
Let's examine the latest market data, technical structure, derivatives positioning, and important trading levels.
📊 1. NEAR Market Overview
According to November 16, 2026 market
NEAR price: approximately $3.19–$3.21.Market capitalization: approximately $4.2 billion.24-hour spot volume: approximately $267.72 million.Futures trading volume: approximately $1.21 billion.Open interest: approximately $694.90 million.Funding rate: approximately +0.0042%.
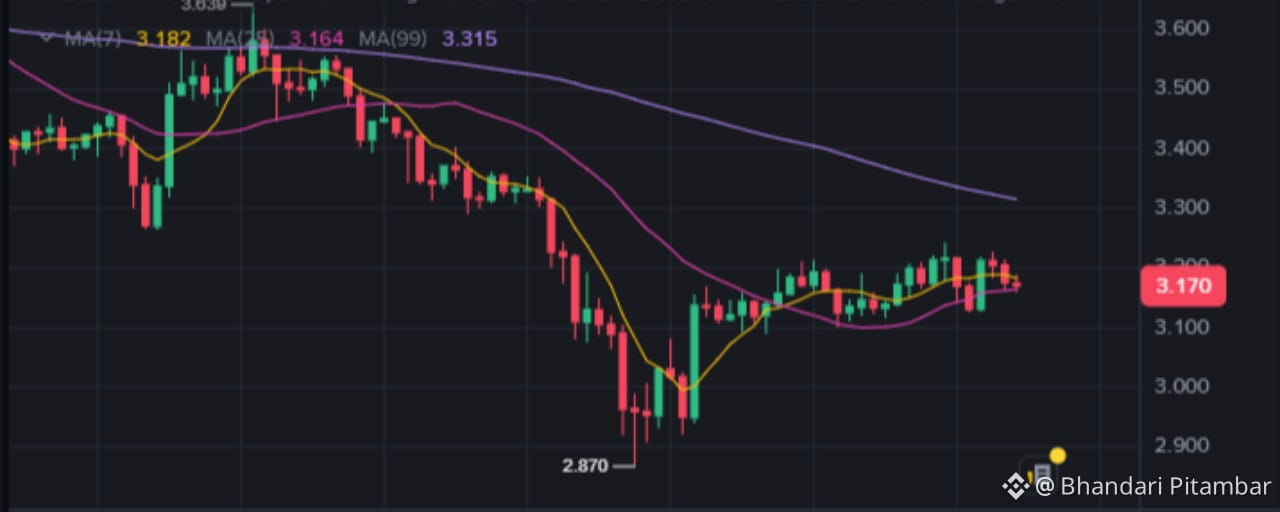
My Binance 1-hour chart screenshot shows a price of $3.170.
These figures come from different market snapshots and may vary between exchanges.
📉 2. Technical Analysis: Buyers Are Fighting Back
NEAR previously declined from approximately $3.60 to $2.87.
After reaching the $2.87 area, buyers entered the market and created a recovery.
However, the current chart shows consolidation rather than a confirmed bullish reversal.
Moving averages from the Binance screenshot:
MA(7): $3.182MA(25): $3.164MA(99): $3.315
Price is currently below MA(7) and MA(99), while remaining slightly above MA(25).
This indicates mixed short-term momentum.
The most important resistance is around $3.20–$3.23, followed by $3.315.
🎯 3. Important NEAR Support and Resistance
Resistance levels:
$3.20–$3.23: Immediate resistance.$3.315: MA(99) resistance.$3.40–$3.45: Potential recovery target.$3.50–$3.60: Major resistance zone.
Support levels:
$3.10–$3.12: Immediate support.$3.00: Psychological support.$2.95: Secondary support.$2.87: Major swing-low support.
These are technical levels based on the supplied chart, not guaranteed price targets.
🐂 4. Bullish Scenario: Can NEAR Reach $3.50?
If buyers successfully break above $3.23 with strong volume, NEAR could attempt a recovery toward:
$3.315$3.40$3.50$3.60
A sustained move above $3.315 would strengthen the bullish outlook.
However, a breakout without strong spot volume could become a false breakout.
🐻 5. Bearish Scenario: Is $3.00 in Danger?
If NEAR loses the $3.10 support zone, selling pressure could increase.
Potential downside levels:
$3.00$2.95$2.87
A decisive breakdown below $2.87 would significantly weaken the recovery structure.
🐋 6. Futures, Liquidations and Market Positioning
NEAR derivatives activity is substantial.
Latest aggregated data indicates:
Futures volume: approximately $1.21 billion.Open interest: approximately $694.90 million.Funding rate: approximately +0.0042%.24-hour liquidations: approximately $9.51 million.Approximately 83% of reported liquidations were long positions.
This suggests leveraged traders have experienced significant pressure.
Open interest has also declined slightly over the last 24 hours.
The combination of elevated leverage and long liquidations means traders should avoid assuming that every recovery candle represents genuine accumulation.
There is currently insufficient verified evidence to claim major whale accumulation or institutional NEAR buying.
🌍 7. Global Crypto Market Sentiment
The broader market remains challenging.
Total cryptocurrency market capitalization: approximately $2.19 trillion.Bitcoin dominance: approximately 59.4%.Crypto Fear & Greed Index: 10/100.Market sentiment: Extreme Fear.
A stronger US dollar, elevated Treasury yields, and uncertainty about Federal Reserve policy are additional risks for speculative assets.
Upcoming economic events include US retail sales on November 17, FOMC minutes on November 18, and jobless claims on November 19.
These events could create volatility across the cryptocurrency market.
🔥 8. NEAR Fundamental Development
NEAR governance recently approved proposal HSP-029, which aims to reduce the maximum annual token issuance rate from 2.5% to 1.6% over 24 months.
The proposal still requires further implementation steps.
If implemented, lower token issuance could improve NEAR's long-term supply economics.
However, fundamental improvements do not automatically produce short-term price increases.
🔮 9. Final Prediction: PUMP, DUMP OR SIDEWAYS?
My current assessment:
🟡 SHORT-TERM: SIDEWAYS — NEAR is consolidating and waiting for a breakout.
🟢 BULLISH TRIGGER: A sustained breakout above $3.23, followed by $3.315, could open the way toward $3.50.
🔴 BEARISH TRIGGER: Losing $3.10 could expose $3.00 and $2.87.
The most important level to watch is $3.315.
A successful reclaim of this level could signal a stronger recovery.
Until then, NEAR remains in a recovery attempt rather than a confirmed bullish trend reversal.
💬 What Is Your Prediction?
Can NEAR Protocol break $3.315 and reach $3.50?
Or will bears push the price below $3.00?
Share your prediction in the comments!
⚠️ DISCLAIMER: This article is for educational purposes only and does not constitute financial advice. Cryptocurrency markets are highly volatile. Always conduct your own research and manage risk responsibly.
#NEAR #NEARProtoco l #BinanceSquare #CryptoAnalysis #Altcoins
{spot}(NEARUSDT)
NEAR PROTOCOL AT $3.17: BULLISH REVERSAL OR ANOTHER BIG DUMP? KEY LEVELS TO WATCH!
🔥 NEAR Protocol is attempting to recover after a significant correction, but buyers are facing an important resistance zone.
With price consolidating around $3.17, elevated futures activity, and extreme fear across the broader crypto market, traders are asking one important question:
Can NEAR reclaim $3.30 and start another rally, or will sellers push the price back toward $3.00?
Let's examine the latest market data, technical structure, derivatives positioning, and important trading levels.
📊 1. NEAR Market Overview
According to November 16, 2026 market
NEAR price: approximately $3.19–$3.21.Market capitalization: approximately $4.2 billion.24-hour spot volume: approximately $267.72 million.Futures trading volume: approximately $1.21 billion.Open interest: approximately $694.90 million.Funding rate: approximately +0.0042%.
My Binance 1-hour chart screenshot shows a price of $3.170.
These figures come from different market snapshots and may vary between exchanges.
📉 2. Technical Analysis: Buyers Are Fighting Back
NEAR previously declined from approximately $3.60 to $2.87.
After reaching the $2.87 area, buyers entered the market and created a recovery.
However, the current chart shows consolidation rather than a confirmed bullish reversal.
Moving averages from the Binance screenshot:
MA(7): $3.182MA(25): $3.164MA(99): $3.315
Price is currently below MA(7) and MA(99), while remaining slightly above MA(25).
This indicates mixed short-term momentum.
The most important resistance is around $3.20–$3.23, followed by $3.315.
🎯 3. Important NEAR Support and Resistance
Resistance levels:
$3.20–$3.23: Immediate resistance.$3.315: MA(99) resistance.$3.40–$3.45: Potential recovery target.$3.50–$3.60: Major resistance zone.
Support levels:
$3.10–$3.12: Immediate support.$3.00: Psychological support.$2.95: Secondary support.$2.87: Major swing-low support.
These are technical levels based on the supplied chart, not guaranteed price targets.
🐂 4. Bullish Scenario: Can NEAR Reach $3.50?
If buyers successfully break above $3.23 with strong volume, NEAR could attempt a recovery toward:
$3.315$3.40$3.50$3.60
A sustained move above $3.315 would strengthen the bullish outlook.
However, a breakout without strong spot volume could become a false breakout.
🐻 5. Bearish Scenario: Is $3.00 in Danger?
If NEAR loses the $3.10 support zone, selling pressure could increase.
Potential downside levels:
$3.00$2.95$2.87
A decisive breakdown below $2.87 would significantly weaken the recovery structure.
🐋 6. Futures, Liquidations and Market Positioning
NEAR derivatives activity is substantial.
Latest aggregated data indicates:
Futures volume: approximately $1.21 billion.Open interest: approximately $694.90 million.Funding rate: approximately +0.0042%.24-hour liquidations: approximately $9.51 million.Approximately 83% of reported liquidations were long positions.
This suggests leveraged traders have experienced significant pressure.
Open interest has also declined slightly over the last 24 hours.
The combination of elevated leverage and long liquidations means traders should avoid assuming that every recovery candle represents genuine accumulation.
There is currently insufficient verified evidence to claim major whale accumulation or institutional NEAR buying.
🌍 7. Global Crypto Market Sentiment
The broader market remains challenging.
Total cryptocurrency market capitalization: approximately $2.19 trillion.Bitcoin dominance: approximately 59.4%.Crypto Fear & Greed Index: 10/100.Market sentiment: Extreme Fear.
A stronger US dollar, elevated Treasury yields, and uncertainty about Federal Reserve policy are additional risks for speculative assets.
Upcoming economic events include US retail sales on November 17, FOMC minutes on November 18, and jobless claims on November 19.
These events could create volatility across the cryptocurrency market.
🔥 8. NEAR Fundamental Development
NEAR governance recently approved proposal HSP-029, which aims to reduce the maximum annual token issuance rate from 2.5% to 1.6% over 24 months.
The proposal still requires further implementation steps.
If implemented, lower token issuance could improve NEAR's long-term supply economics.
However, fundamental improvements do not automatically produce short-term price increases.
🔮 9. Final Prediction: PUMP, DUMP OR SIDEWAYS?
My current assessment:
🟡 SHORT-TERM: SIDEWAYS — NEAR is consolidating and waiting for a breakout.
🟢 BULLISH TRIGGER: A sustained breakout above $3.23, followed by $3.315, could open the way toward $3.50.
🔴 BEARISH TRIGGER: Losing $3.10 could expose $3.00 and $2.87.
The most important level to watch is $3.315.
A successful reclaim of this level could signal a stronger recovery.
Until then, NEAR remains in a recovery attempt rather than a confirmed bullish trend reversal.
💬 What Is Your Prediction?
Can NEAR Protocol break $3.315 and reach $3.50?
Or will bears push the price below $3.00?
Share your prediction in the comments!
⚠️ DISCLAIMER: This article is for educational purposes only and does not constitute financial advice. Cryptocurrency markets are highly volatile. Always conduct your own research and manage risk responsibly.
#NEAR #NEARProtoco l #BinanceSquare #CryptoAnalysis #Altcoins
With price consolidating around $3.17, elevated futures activity, and extreme fear across the broader crypto market, traders are asking one important question:
Can NEAR reclaim $3.30 and start another rally, or will sellers push the price back toward $3.00?
Let's examine the latest market data, technical structure, derivatives positioning, and important trading levels.
📊 1. NEAR Market Overview
According to November 16, 2026 market
NEAR price: approximately $3.19–$3.21.Market capitalization: approximately $4.2 billion.24-hour spot volume: approximately $267.72 million.Futures trading volume: approximately $1.21 billion.Open interest: approximately $694.90 million.Funding rate: approximately +0.0042%.
My Binance 1-hour chart screenshot shows a price of $3.170.
These figures come from different market snapshots and may vary between exchanges.
📉 2. Technical Analysis: Buyers Are Fighting Back
NEAR previously declined from approximately $3.60 to $2.87.
After reaching the $2.87 area, buyers entered the market and created a recovery.
However, the current chart shows consolidation rather than a confirmed bullish reversal.
Moving averages from the Binance screenshot:
MA(7): $3.182MA(25): $3.164MA(99): $3.315
Price is currently below MA(7) and MA(99), while remaining slightly above MA(25).
This indicates mixed short-term momentum.
The most important resistance is around $3.20–$3.23, followed by $3.315.
🎯 3. Important NEAR Support and Resistance
Resistance levels:
$3.20–$3.23: Immediate resistance.$3.315: MA(99) resistance.$3.40–$3.45: Potential recovery target.$3.50–$3.60: Major resistance zone.
Support levels:
$3.10–$3.12: Immediate support.$3.00: Psychological support.$2.95: Secondary support.$2.87: Major swing-low support.
These are technical levels based on the supplied chart, not guaranteed price targets.
🐂 4. Bullish Scenario: Can NEAR Reach $3.50?
If buyers successfully break above $3.23 with strong volume, NEAR could attempt a recovery toward:
$3.315$3.40$3.50$3.60
A sustained move above $3.315 would strengthen the bullish outlook.
However, a breakout without strong spot volume could become a false breakout.
🐻 5. Bearish Scenario: Is $3.00 in Danger?
If NEAR loses the $3.10 support zone, selling pressure could increase.
Potential downside levels:
$3.00$2.95$2.87
A decisive breakdown below $2.87 would significantly weaken the recovery structure.
🐋 6. Futures, Liquidations and Market Positioning
NEAR derivatives activity is substantial.
Latest aggregated data indicates:
Futures volume: approximately $1.21 billion.Open interest: approximately $694.90 million.Funding rate: approximately +0.0042%.24-hour liquidations: approximately $9.51 million.Approximately 83% of reported liquidations were long positions.
This suggests leveraged traders have experienced significant pressure.
Open interest has also declined slightly over the last 24 hours.
The combination of elevated leverage and long liquidations means traders should avoid assuming that every recovery candle represents genuine accumulation.
There is currently insufficient verified evidence to claim major whale accumulation or institutional NEAR buying.
🌍 7. Global Crypto Market Sentiment
The broader market remains challenging.
Total cryptocurrency market capitalization: approximately $2.19 trillion.Bitcoin dominance: approximately 59.4%.Crypto Fear & Greed Index: 10/100.Market sentiment: Extreme Fear.
A stronger US dollar, elevated Treasury yields, and uncertainty about Federal Reserve policy are additional risks for speculative assets.
Upcoming economic events include US retail sales on November 17, FOMC minutes on November 18, and jobless claims on November 19.
These events could create volatility across the cryptocurrency market.
🔥 8. NEAR Fundamental Development
NEAR governance recently approved proposal HSP-029, which aims to reduce the maximum annual token issuance rate from 2.5% to 1.6% over 24 months.
The proposal still requires further implementation steps.
If implemented, lower token issuance could improve NEAR's long-term supply economics.
However, fundamental improvements do not automatically produce short-term price increases.
🔮 9. Final Prediction: PUMP, DUMP OR SIDEWAYS?
My current assessment:
🟡 SHORT-TERM: SIDEWAYS — NEAR is consolidating and waiting for a breakout.
🟢 BULLISH TRIGGER: A sustained breakout above $3.23, followed by $3.315, could open the way toward $3.50.
🔴 BEARISH TRIGGER: Losing $3.10 could expose $3.00 and $2.87.
The most important level to watch is $3.315.
A successful reclaim of this level could signal a stronger recovery.
Until then, NEAR remains in a recovery attempt rather than a confirmed bullish trend reversal.
💬 What Is Your Prediction?
Can NEAR Protocol break $3.315 and reach $3.50?
Or will bears push the price below $3.00?
Share your prediction in the comments!
⚠️ DISCLAIMER: This article is for educational purposes only and does not constitute financial advice. Cryptocurrency markets are highly volatile. Always conduct your own research and manage risk responsibly.
#NEAR #NEARProtoco l #BinanceSquare #CryptoAnalysis #Altcoins
1
1
101
ບົດຄວາມ
RARE EXPLODES +52%! IS SUPERRARE PREPARING FOR ANOTHER MASSIVE BREAKOUT?🔥 SuperRare (RARE) is attracting serious market attention after a powerful price explosion, massive trading volume, and a dramatic increase in futures open interest. But is this the beginning of another rally, or could late buyers become trapped?
Let's examine the technical structure, derivatives positioning, market sentiment, and important price levels.
📊 1. RARE Market Overview
SuperRare has experienced a significant bullish move.
According to the November 16 market snapshot:
Aggregated market price: approximately $0.01279.24-hour price change: approximately +52%.Market capitalization: approximately $10.24 million.Futures trading volume: approximately $134.66 million.Spot trading volume: approximately $13.50 million.Open interest: approximately $8.25 million.
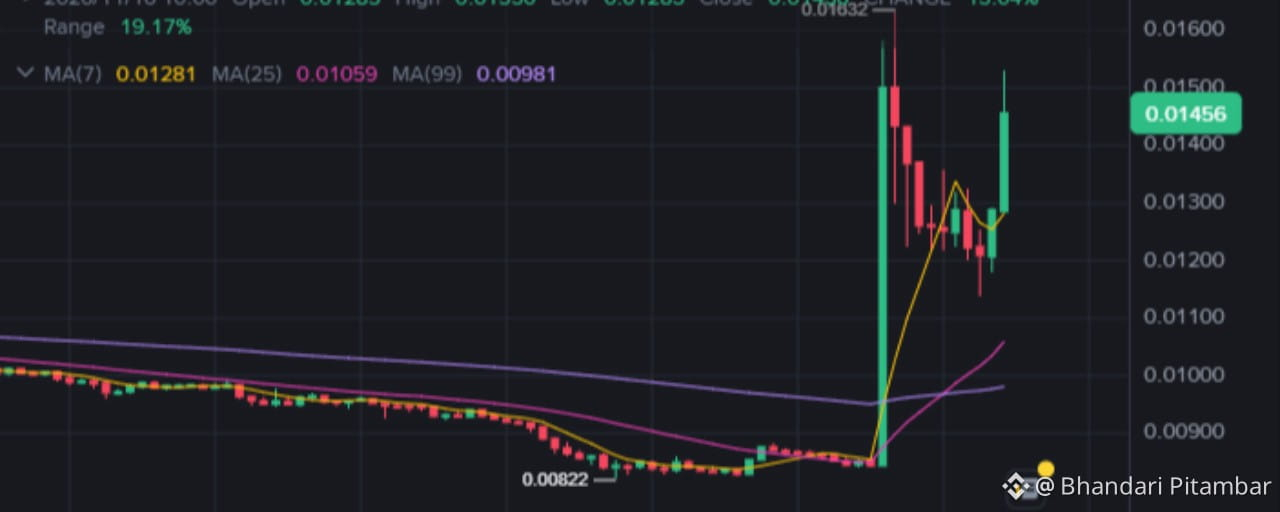
My Binance chart screenshot separately shows RARE trading at 0.01456 USDT, with a 1-hour gain of 13.04%.
These prices represent different market snapshots and should not be treated as identical exchange quotes.
📈 2. Technical Analysis
The 1-hour Binance chart shows a strong breakout from an extended consolidation period.
Moving averages shown in the screenshot:
MA(7): 0.01281MA(25): 0.01059MA(99): 0.00981
Price is above all three moving averages, indicating strong short-term bullish momentum.
The large green breakout candle and volume expansion suggest aggressive buying activity.
However, after such a rapid move, profit-taking and volatility are normal possibilities.
🎯 3. Important Support and Resistance
Resistance levels:
0.01530 – Immediate resistance.0.01600–0.01630 – Major breakout zone.0.01700–0.01800 – Potential bullish targets.0.02000 – Extended psychological target.
Support levels:
0.01280 – Important near-term support.0.01200 – Consolidation support.0.01060 – MA(25) area.0.00980–0.01000 – MA(99) area.
These levels are technical reference zones, not guaranteed price targets.
🐂 4. Bullish Scenario
If RARE maintains support around 0.01280 and successfully breaks above 0.01530 with strong spot buying volume, bullish momentum could continue.
Potential targets:
0.016300.017000.018000.02000
A sustained breakout above resistance would improve the probability of further upside.
🐻 5. Bearish Scenario
The biggest risk is a failed breakout.
If buyers cannot defend 0.01280, selling pressure could push RARE toward:
0.012000.010600.00980
A breakdown below 0.01200 would significantly weaken the short-term bullish structure.
🐋 6. Futures and Whale Activity
One of the most interesting developments is RARE's derivatives activity.
Reported market data shows:
Open interest increased approximately 230% in 24 hours.Futures volume reached approximately $134.66 million.Funding was deeply negative.Reported liquidations reached approximately $715,000.
This combination suggests aggressive speculative positioning and potential short-squeeze conditions.
However, increased open interest does not automatically mean whales are accumulating spot tokens.
Traders should monitor whether spot buying supports the futures-driven rally.
🌍 7. Global Crypto Market Sentiment
The wider cryptocurrency market remains under pressure.
Bitcoin dominance is elevated, while the Fear & Greed Index is showing extreme fear.
A stronger US dollar, elevated Treasury yields, and uncertainty around Federal Reserve policy could create additional pressure on speculative altcoins.
Upcoming US economic releases and Federal Reserve communications may also increase volatility.
RARE's independent strength is encouraging, but the broader market remains an important risk factor.
🔮 8. Final Prediction: PUMP, DUMP OR SIDEWAYS?
My current assessment:
🟢 Short-term: BULLISH BIAS — potential continuation if resistance breaks.
🟡 Medium-term: SIDEWAYS / RECOVERY — confirmation is still required.
🔴 Bearish trigger: Losing 0.01200 could invalidate the immediate bullish structure.
The most important level to watch is 0.01530 USDT.
A confirmed breakout with strong spot volume could open the door toward 0.01700–0.01800.
But if buying momentum disappears, a sharp correction is possible.
💬 What do you think?
Can RARE break above 0.01630 and move toward 0.02000, or will sellers take control?
Share your prediction in the comments!
⚠️ Disclaimer: This article is for educational and informational purposes only, not financial advice. Cryptocurrency trading involves substantial risk. Always use proper risk management and do your own research.
#RARE #SuperRare #CryptoAnalysis #BinanceSquare #Altcoins
{spot}(RAREUSDT)
RARE EXPLODES +52%! IS SUPERRARE PREPARING FOR ANOTHER MASSIVE BREAKOUT?
🔥 SuperRare (RARE) is attracting serious market attention after a powerful price explosion, massive trading volume, and a dramatic increase in futures open interest. But is this the beginning of another rally, or could late buyers become trapped?
Let's examine the technical structure, derivatives positioning, market sentiment, and important price levels.
📊 1. RARE Market Overview
SuperRare has experienced a significant bullish move.
According to the November 16 market snapshot:
Aggregated market price: approximately $0.01279.24-hour price change: approximately +52%.Market capitalization: approximately $10.24 million.Futures trading volume: approximately $134.66 million.Spot trading volume: approximately $13.50 million.Open interest: approximately $8.25 million.
My Binance chart screenshot separately shows RARE trading at 0.01456 USDT, with a 1-hour gain of 13.04%.
These prices represent different market snapshots and should not be treated as identical exchange quotes.
📈 2. Technical Analysis
The 1-hour Binance chart shows a strong breakout from an extended consolidation period.
Moving averages shown in the screenshot:
MA(7): 0.01281MA(25): 0.01059MA(99): 0.00981
Price is above all three moving averages, indicating strong short-term bullish momentum.
The large green breakout candle and volume expansion suggest aggressive buying activity.
However, after such a rapid move, profit-taking and volatility are normal possibilities.
🎯 3. Important Support and Resistance
Resistance levels:
0.01530 – Immediate resistance.0.01600–0.01630 – Major breakout zone.0.01700–0.01800 – Potential bullish targets.0.02000 – Extended psychological target.
Support levels:
0.01280 – Important near-term support.0.01200 – Consolidation support.0.01060 – MA(25) area.0.00980–0.01000 – MA(99) area.
These levels are technical reference zones, not guaranteed price targets.
🐂 4. Bullish Scenario
If RARE maintains support around 0.01280 and successfully breaks above 0.01530 with strong spot buying volume, bullish momentum could continue.
Potential targets:
0.016300.017000.018000.02000
A sustained breakout above resistance would improve the probability of further upside.
🐻 5. Bearish Scenario
The biggest risk is a failed breakout.
If buyers cannot defend 0.01280, selling pressure could push RARE toward:
0.012000.010600.00980
A breakdown below 0.01200 would significantly weaken the short-term bullish structure.
🐋 6. Futures and Whale Activity
One of the most interesting developments is RARE's derivatives activity.
Reported market data shows:
Open interest increased approximately 230% in 24 hours.Futures volume reached approximately $134.66 million.Funding was deeply negative.Reported liquidations reached approximately $715,000.
This combination suggests aggressive speculative positioning and potential short-squeeze conditions.
However, increased open interest does not automatically mean whales are accumulating spot tokens.
Traders should monitor whether spot buying supports the futures-driven rally.
🌍 7. Global Crypto Market Sentiment
The wider cryptocurrency market remains under pressure.
Bitcoin dominance is elevated, while the Fear & Greed Index is showing extreme fear.
A stronger US dollar, elevated Treasury yields, and uncertainty around Federal Reserve policy could create additional pressure on speculative altcoins.
Upcoming US economic releases and Federal Reserve communications may also increase volatility.
RARE's independent strength is encouraging, but the broader market remains an important risk factor.
🔮 8. Final Prediction: PUMP, DUMP OR SIDEWAYS?
My current assessment:
🟢 Short-term: BULLISH BIAS — potential continuation if resistance breaks.
🟡 Medium-term: SIDEWAYS / RECOVERY — confirmation is still required.
🔴 Bearish trigger: Losing 0.01200 could invalidate the immediate bullish structure.
The most important level to watch is 0.01530 USDT.
A confirmed breakout with strong spot volume could open the door toward 0.01700–0.01800.
But if buying momentum disappears, a sharp correction is possible.
💬 What do you think?
Can RARE break above 0.01630 and move toward 0.02000, or will sellers take control?
Share your prediction in the comments!
⚠️ Disclaimer: This article is for educational and informational purposes only, not financial advice. Cryptocurrency trading involves substantial risk. Always use proper risk management and do your own research.
#RARE #SuperRare #CryptoAnalysis #BinanceSquare #Altcoins
Let's examine the technical structure, derivatives positioning, market sentiment, and important price levels.
📊 1. RARE Market Overview
SuperRare has experienced a significant bullish move.
According to the November 16 market snapshot:
Aggregated market price: approximately $0.01279.24-hour price change: approximately +52%.Market capitalization: approximately $10.24 million.Futures trading volume: approximately $134.66 million.Spot trading volume: approximately $13.50 million.Open interest: approximately $8.25 million.
My Binance chart screenshot separately shows RARE trading at 0.01456 USDT, with a 1-hour gain of 13.04%.
These prices represent different market snapshots and should not be treated as identical exchange quotes.
📈 2. Technical Analysis
The 1-hour Binance chart shows a strong breakout from an extended consolidation period.
Moving averages shown in the screenshot:
MA(7): 0.01281MA(25): 0.01059MA(99): 0.00981
Price is above all three moving averages, indicating strong short-term bullish momentum.
The large green breakout candle and volume expansion suggest aggressive buying activity.
However, after such a rapid move, profit-taking and volatility are normal possibilities.
🎯 3. Important Support and Resistance
Resistance levels:
0.01530 – Immediate resistance.0.01600–0.01630 – Major breakout zone.0.01700–0.01800 – Potential bullish targets.0.02000 – Extended psychological target.
Support levels:
0.01280 – Important near-term support.0.01200 – Consolidation support.0.01060 – MA(25) area.0.00980–0.01000 – MA(99) area.
These levels are technical reference zones, not guaranteed price targets.
🐂 4. Bullish Scenario
If RARE maintains support around 0.01280 and successfully breaks above 0.01530 with strong spot buying volume, bullish momentum could continue.
Potential targets:
0.016300.017000.018000.02000
A sustained breakout above resistance would improve the probability of further upside.
🐻 5. Bearish Scenario
The biggest risk is a failed breakout.
If buyers cannot defend 0.01280, selling pressure could push RARE toward:
0.012000.010600.00980
A breakdown below 0.01200 would significantly weaken the short-term bullish structure.
🐋 6. Futures and Whale Activity
One of the most interesting developments is RARE's derivatives activity.
Reported market data shows:
Open interest increased approximately 230% in 24 hours.Futures volume reached approximately $134.66 million.Funding was deeply negative.Reported liquidations reached approximately $715,000.
This combination suggests aggressive speculative positioning and potential short-squeeze conditions.
However, increased open interest does not automatically mean whales are accumulating spot tokens.
Traders should monitor whether spot buying supports the futures-driven rally.
🌍 7. Global Crypto Market Sentiment
The wider cryptocurrency market remains under pressure.
Bitcoin dominance is elevated, while the Fear & Greed Index is showing extreme fear.
A stronger US dollar, elevated Treasury yields, and uncertainty around Federal Reserve policy could create additional pressure on speculative altcoins.
Upcoming US economic releases and Federal Reserve communications may also increase volatility.
RARE's independent strength is encouraging, but the broader market remains an important risk factor.
🔮 8. Final Prediction: PUMP, DUMP OR SIDEWAYS?
My current assessment:
🟢 Short-term: BULLISH BIAS — potential continuation if resistance breaks.
🟡 Medium-term: SIDEWAYS / RECOVERY — confirmation is still required.
🔴 Bearish trigger: Losing 0.01200 could invalidate the immediate bullish structure.
The most important level to watch is 0.01530 USDT.
A confirmed breakout with strong spot volume could open the door toward 0.01700–0.01800.
But if buying momentum disappears, a sharp correction is possible.
💬 What do you think?
Can RARE break above 0.01630 and move toward 0.02000, or will sellers take control?
Share your prediction in the comments!
⚠️ Disclaimer: This article is for educational and informational purposes only, not financial advice. Cryptocurrency trading involves substantial risk. Always use proper risk management and do your own research.
#RARE #SuperRare #CryptoAnalysis #BinanceSquare #Altcoins
1
1
90
ບົດຄວາມ
NEAR PROTOCOL PRICE PREDICTION: NEAR HOLDS $3.17 AFTER A SHARP CRASH — IS $3.50 THE NEXT TARGET?NEAR/USDT Technical Analysis | November 16, 2026
NEAR Protocol is attempting to recover after a significant market correction.
The token recently dropped toward $2.87 before buyers stepped in and pushed the price back toward $3.20.
However, the recovery is now facing resistance.
Is NEAR preparing for a bullish breakout toward $3.50, or could sellers push the price below $3.00 again?
Let's examine the technical structure, futures positioning, institutional activity and broader crypto market.
📊 1. NEAR Market Overview
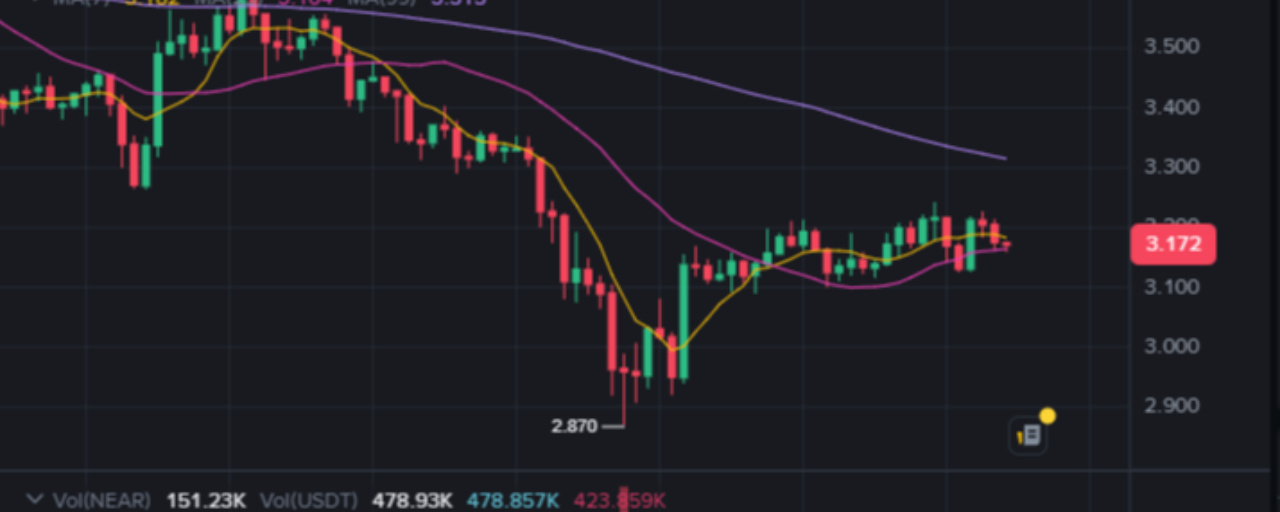
Based on the supplied Binance 1H chart:
Reference price: $3.172MA7: $3.182MA25: $3.164MA99: $3.315Recent swing low: $2.870
NEAR is currently trading close to its short-term moving averages.
However, the price remains below MA99, indicating that the larger recovery is not yet confirmed.
The market is currently consolidating after a strong sell-off.
📉 2. Technical Analysis
The broader technical picture remains cautious.
Daily RSI is approximately 34.5, suggesting weak momentum.
The 4H technical trend is bearish, while the daily trend is mixed.
Daily MACD also remains negative.
Important resistance levels:
$3.20$3.24$3.308$3.315$3.446$3.488
Important support levels:
$3.158$3.100$3.007$2.870$2.768
The $3.308 region is particularly important because a sustained breakout could improve the short-term structure.
🐂 3. Bullish Scenario: Can NEAR Reach $3.50?
For buyers, the first challenge is reclaiming $3.20–$3.24.
If NEAR breaks above $3.308 with strong buying volume, the next potential targets are:
🎯 $3.35
🎯 $3.446
🎯 $3.488
🎯 $3.70
A sustained breakout above $3.446 would provide stronger evidence of a recovery.
However, buyers must defend the $3.158 support area.
🐻 4. Bearish Scenario: Could NEAR Fall Below $3.00?
The bearish structure remains important.
If NEAR loses $3.158, the next support areas are:
$3.100$3.007$2.870
A confirmed breakdown below $2.870 would significantly weaken the recovery structure.
Further downside toward $2.768 could become possible.
These are conditional technical levels, not guaranteed predictions.
⚡ 5. NEAR Futures Market
The latest retrieved derivatives snapshot showed:
Total open interest: Approximately $312.41 million24-hour futures volume: Approximately $479.33 millionWeighted funding: +0.0049% per 8 hoursBinance open interest: Approximately $168.50 millionBinance long accounts: 56.99%Binance short accounts: 43.01%
Positive funding indicates that long positions are paying short positions.
This suggests that leveraged bullish positioning is somewhat crowded.
If NEAR experiences another sudden decline, long liquidations could increase selling pressure.
🐋 6. NEAR Ecosystem and Institutional Developments
NEAR continues developing its AI infrastructure and cross-chain ecosystem.
Recent developments include:
NEAR AI Gateway for macOS.Continued development of NEAR Intents.Growth initiatives around AI infrastructure.A governance proposal targeting a gradual reduction in token issuance.
However, reported NEAR ETF outflows of approximately $10.58 million since October 27 are a near-term concern.
The ecosystem narrative is constructive, but it still needs to translate into sustained token demand.
🌍 7. Global Crypto Market Sentiment
The wider crypto market is experiencing extreme fear.
Important indicators:
Bitcoin dominance: Approximately 59.35%Fear & Greed Index: 10/100Total crypto market capitalization: Approximately $2.2 trillionUS dollar index: Approximately 103.44
Higher Treasury yields, inflation concerns and expectations of Federal Reserve tightening are creating pressure on speculative assets.
This environment makes sustained altcoin rallies more difficult.
🔥 8. My NEAR Price Prediction
My current assessment:
15M: No confirmed direction.
1H: Sideways consolidation.
4H: Bearish.
Daily: Neutral to bearish.
Bullish confirmation: Sustained breakout above $3.308.
Bearish confirmation: Breakdown below $3.158, followed by a possible test of $3.007.
🎯 FINAL VERDICT
NEAR is showing signs of recovery, but the larger bearish structure has not yet been reversed.
The most important upside level is $3.308.
The most important downside support is $3.158.
If buyers regain control, NEAR could attempt a recovery toward $3.446–$3.488.
If sellers break support, a retest of $3.007 and potentially $2.870 becomes possible.
My strategy: Wait for confirmation instead of chasing the current consolidation.
🚀 Can NEAR reach $3.50?
🐻 Or will it fall below $3.00 first?
Share your prediction in the comments!
#NEAR #NEARProtocol #NEARUSDT #BinanceSquare #CryptoAnalysis
Final trading verdict
NEAR/USDT
SIDEWAYS short-term · BEARISH higher timeframe
$3.172
My most important levels:
$3.308 — Bullish breakout confirmation.$3.158 — Immediate support.$3.007 — Next downside support.$2.870 — Critical swing low.
I would wait for a confirmed move above $3.308 before treating NEAR as a stronger bullish opportunity.
{spot}(NEARUSDT)
NEAR PROTOCOL PRICE PREDICTION: NEAR HOLDS $3.17 AFTER A SHARP CRASH — IS $3.50 THE NEXT TARGET?
NEAR/USDT Technical Analysis | November 16, 2026
NEAR Protocol is attempting to recover after a significant market correction.
The token recently dropped toward $2.87 before buyers stepped in and pushed the price back toward $3.20.
However, the recovery is now facing resistance.
Is NEAR preparing for a bullish breakout toward $3.50, or could sellers push the price below $3.00 again?
Let's examine the technical structure, futures positioning, institutional activity and broader crypto market.
📊 1. NEAR Market Overview
Based on the supplied Binance 1H chart:
Reference price: $3.172MA7: $3.182MA25: $3.164MA99: $3.315Recent swing low: $2.870
NEAR is currently trading close to its short-term moving averages.
However, the price remains below MA99, indicating that the larger recovery is not yet confirmed.
The market is currently consolidating after a strong sell-off.
📉 2. Technical Analysis
The broader technical picture remains cautious.
Daily RSI is approximately 34.5, suggesting weak momentum.
The 4H technical trend is bearish, while the daily trend is mixed.
Daily MACD also remains negative.
Important resistance levels:
$3.20$3.24$3.308$3.315$3.446$3.488
Important support levels:
$3.158$3.100$3.007$2.870$2.768
The $3.308 region is particularly important because a sustained breakout could improve the short-term structure.
🐂 3. Bullish Scenario: Can NEAR Reach $3.50?
For buyers, the first challenge is reclaiming $3.20–$3.24.
If NEAR breaks above $3.308 with strong buying volume, the next potential targets are:
🎯 $3.35
🎯 $3.446
🎯 $3.488
🎯 $3.70
A sustained breakout above $3.446 would provide stronger evidence of a recovery.
However, buyers must defend the $3.158 support area.
🐻 4. Bearish Scenario: Could NEAR Fall Below $3.00?
The bearish structure remains important.
If NEAR loses $3.158, the next support areas are:
$3.100$3.007$2.870
A confirmed breakdown below $2.870 would significantly weaken the recovery structure.
Further downside toward $2.768 could become possible.
These are conditional technical levels, not guaranteed predictions.
⚡ 5. NEAR Futures Market
The latest retrieved derivatives snapshot showed:
Total open interest: Approximately $312.41 million24-hour futures volume: Approximately $479.33 millionWeighted funding: +0.0049% per 8 hoursBinance open interest: Approximately $168.50 millionBinance long accounts: 56.99%Binance short accounts: 43.01%
Positive funding indicates that long positions are paying short positions.
This suggests that leveraged bullish positioning is somewhat crowded.
If NEAR experiences another sudden decline, long liquidations could increase selling pressure.
🐋 6. NEAR Ecosystem and Institutional Developments
NEAR continues developing its AI infrastructure and cross-chain ecosystem.
Recent developments include:
NEAR AI Gateway for macOS.Continued development of NEAR Intents.Growth initiatives around AI infrastructure.A governance proposal targeting a gradual reduction in token issuance.
However, reported NEAR ETF outflows of approximately $10.58 million since October 27 are a near-term concern.
The ecosystem narrative is constructive, but it still needs to translate into sustained token demand.
🌍 7. Global Crypto Market Sentiment
The wider crypto market is experiencing extreme fear.
Important indicators:
Bitcoin dominance: Approximately 59.35%Fear & Greed Index: 10/100Total crypto market capitalization: Approximately $2.2 trillionUS dollar index: Approximately 103.44
Higher Treasury yields, inflation concerns and expectations of Federal Reserve tightening are creating pressure on speculative assets.
This environment makes sustained altcoin rallies more difficult.
🔥 8. My NEAR Price Prediction
My current assessment:
15M: No confirmed direction.
1H: Sideways consolidation.
4H: Bearish.
Daily: Neutral to bearish.
Bullish confirmation: Sustained breakout above $3.308.
Bearish confirmation: Breakdown below $3.158, followed by a possible test of $3.007.
🎯 FINAL VERDICT
NEAR is showing signs of recovery, but the larger bearish structure has not yet been reversed.
The most important upside level is $3.308.
The most important downside support is $3.158.
If buyers regain control, NEAR could attempt a recovery toward $3.446–$3.488.
If sellers break support, a retest of $3.007 and potentially $2.870 becomes possible.
My strategy: Wait for confirmation instead of chasing the current consolidation.
🚀 Can NEAR reach $3.50?
🐻 Or will it fall below $3.00 first?
Share your prediction in the comments!
#NEAR #NEARProtocol #NEARUSDT #BinanceSquare #CryptoAnalysis
Final trading verdict
NEAR/USDT
SIDEWAYS short-term · BEARISH higher timeframe
$3.172
My most important levels:
$3.308 — Bullish breakout confirmation.$3.158 — Immediate support.$3.007 — Next downside support.$2.870 — Critical swing low.
I would wait for a confirmed move above $3.308 before treating NEAR as a stronger bullish opportunity.
NEAR Protocol is attempting to recover after a significant market correction.
The token recently dropped toward $2.87 before buyers stepped in and pushed the price back toward $3.20.
However, the recovery is now facing resistance.
Is NEAR preparing for a bullish breakout toward $3.50, or could sellers push the price below $3.00 again?
Let's examine the technical structure, futures positioning, institutional activity and broader crypto market.
📊 1. NEAR Market Overview
Based on the supplied Binance 1H chart:
Reference price: $3.172MA7: $3.182MA25: $3.164MA99: $3.315Recent swing low: $2.870
NEAR is currently trading close to its short-term moving averages.
However, the price remains below MA99, indicating that the larger recovery is not yet confirmed.
The market is currently consolidating after a strong sell-off.
📉 2. Technical Analysis
The broader technical picture remains cautious.
Daily RSI is approximately 34.5, suggesting weak momentum.
The 4H technical trend is bearish, while the daily trend is mixed.
Daily MACD also remains negative.
Important resistance levels:
$3.20$3.24$3.308$3.315$3.446$3.488
Important support levels:
$3.158$3.100$3.007$2.870$2.768
The $3.308 region is particularly important because a sustained breakout could improve the short-term structure.
🐂 3. Bullish Scenario: Can NEAR Reach $3.50?
For buyers, the first challenge is reclaiming $3.20–$3.24.
If NEAR breaks above $3.308 with strong buying volume, the next potential targets are:
🎯 $3.35
🎯 $3.446
🎯 $3.488
🎯 $3.70
A sustained breakout above $3.446 would provide stronger evidence of a recovery.
However, buyers must defend the $3.158 support area.
🐻 4. Bearish Scenario: Could NEAR Fall Below $3.00?
The bearish structure remains important.
If NEAR loses $3.158, the next support areas are:
$3.100$3.007$2.870
A confirmed breakdown below $2.870 would significantly weaken the recovery structure.
Further downside toward $2.768 could become possible.
These are conditional technical levels, not guaranteed predictions.
⚡ 5. NEAR Futures Market
The latest retrieved derivatives snapshot showed:
Total open interest: Approximately $312.41 million24-hour futures volume: Approximately $479.33 millionWeighted funding: +0.0049% per 8 hoursBinance open interest: Approximately $168.50 millionBinance long accounts: 56.99%Binance short accounts: 43.01%
Positive funding indicates that long positions are paying short positions.
This suggests that leveraged bullish positioning is somewhat crowded.
If NEAR experiences another sudden decline, long liquidations could increase selling pressure.
🐋 6. NEAR Ecosystem and Institutional Developments
NEAR continues developing its AI infrastructure and cross-chain ecosystem.
Recent developments include:
NEAR AI Gateway for macOS.Continued development of NEAR Intents.Growth initiatives around AI infrastructure.A governance proposal targeting a gradual reduction in token issuance.
However, reported NEAR ETF outflows of approximately $10.58 million since October 27 are a near-term concern.
The ecosystem narrative is constructive, but it still needs to translate into sustained token demand.
🌍 7. Global Crypto Market Sentiment
The wider crypto market is experiencing extreme fear.
Important indicators:
Bitcoin dominance: Approximately 59.35%Fear & Greed Index: 10/100Total crypto market capitalization: Approximately $2.2 trillionUS dollar index: Approximately 103.44
Higher Treasury yields, inflation concerns and expectations of Federal Reserve tightening are creating pressure on speculative assets.
This environment makes sustained altcoin rallies more difficult.
🔥 8. My NEAR Price Prediction
My current assessment:
15M: No confirmed direction.
1H: Sideways consolidation.
4H: Bearish.
Daily: Neutral to bearish.
Bullish confirmation: Sustained breakout above $3.308.
Bearish confirmation: Breakdown below $3.158, followed by a possible test of $3.007.
🎯 FINAL VERDICT
NEAR is showing signs of recovery, but the larger bearish structure has not yet been reversed.
The most important upside level is $3.308.
The most important downside support is $3.158.
If buyers regain control, NEAR could attempt a recovery toward $3.446–$3.488.
If sellers break support, a retest of $3.007 and potentially $2.870 becomes possible.
My strategy: Wait for confirmation instead of chasing the current consolidation.
🚀 Can NEAR reach $3.50?
🐻 Or will it fall below $3.00 first?
Share your prediction in the comments!
#NEAR #NEARProtocol #NEARUSDT #BinanceSquare #CryptoAnalysis
Final trading verdict
NEAR/USDT
SIDEWAYS short-term · BEARISH higher timeframe
$3.172
My most important levels:
$3.308 — Bullish breakout confirmation.$3.158 — Immediate support.$3.007 — Next downside support.$2.870 — Critical swing low.
I would wait for a confirmed move above $3.308 before treating NEAR as a stronger bullish opportunity.
1
1
1
251
ບົດຄວາມ
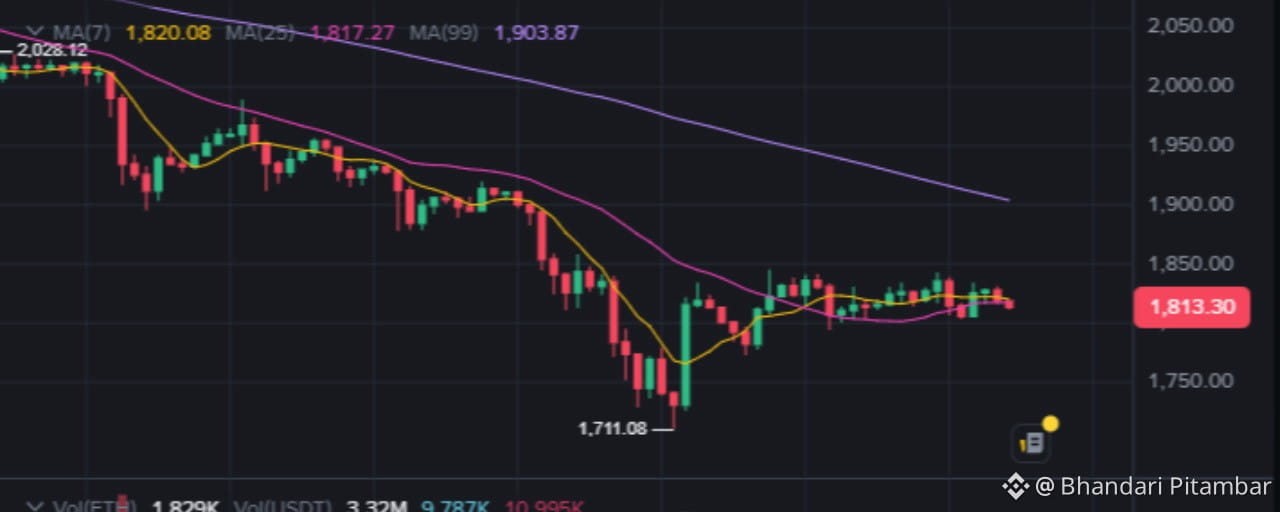
ETHEREUM PRICE PREDICTION: ETH BOUNCES FROM $1,711 — IS $2,000 THE NEXT TARGET OR ANOTHER CRASH COMETH/USDT Technical Analysis | November 16, 2026
Ethereum is showing signs of recovery after a significant market correction.
ETH recently touched approximately $1,711 before bouncing toward the $1,840 region. However, buyers are now facing resistance, and the larger market trend remains under pressure.
Is Ethereum preparing for a major recovery, or is this just another temporary bounce?
Let's examine the charts, derivatives, institutional flows and market sentiment.
📊 1. ETH Market Overview
Based on the supplied Binance 1H chart:
ETH reference price: $1,813.30MA7: $1,820.08MA25: $1,817.27MA99: $1,903.87Recent swing low: $1,711.08
Ethereum has recovered from its recent low but remains below its major long-term moving average.
The market is showing short-term consolidation rather than a confirmed bullish reversal.
📉 2. Technical Analysis
The higher-timeframe technical structure remains bearish.
Daily RSI readings from independent technical feeds are around 25–26, indicating deeply oversold conditions.
The 4H RSI is also below 40 in one tracked feed.
This suggests that selling pressure has been substantial.
However, oversold conditions can persist during strong downtrends.
Important resistance levels:
$1,820$1,840$1,860$1,883$1,904
Important support levels:
$1,804$1,786$1,749$1,711
🐂 3. Bullish Scenario: Can ETH Reach $1,950?
For buyers, the first major challenge is reclaiming $1,840.
If Ethereum breaks this level with strong volume, the next potential targets are:
🎯 $1,860
🎯 $1,883
🎯 $1,904
🎯 $1,950
A sustained recovery above $1,883 would significantly improve the short-term technical picture.
Reclaiming $1,904 would provide stronger evidence of a broader reversal.
🐻 4. Bearish Scenario: Could ETH Fall Below $1,700?
The bearish structure remains important.
If Ethereum loses $1,786, selling pressure could increase.
A confirmed daily close below $1,749 would expose the recent low at $1,711.
If that level also breaks, further downside toward $1,695 and $1,663 becomes possible.
These are conditional technical targets, not guaranteed outcomes.
⚡ 5. Ethereum Futures Market
The latest retrieved derivatives snapshot showed:
Open interest: Approximately $12.5 billion24-hour OI change: -2.5%Funding rate: -0.0044% per 8 hoursBinance accounts with long positions: 71.6%
Approximately $91.8 million in ETH futures positions were liquidated over 24 hours in that snapshot.
Short liquidations were approximately $61.6 million, while long liquidations were approximately $30.2 million.
Negative funding creates the possibility of another short squeeze, but crowded long positioning also presents liquidation risk.
🏦 6. Institutional ETH ETF Activity
Ethereum spot ETFs recorded approximately $2.3 million in net inflows on November 13.
Fidelity recorded approximately $11.6 million in inflows, while Grayscale recorded approximately $9.3 million in outflows.
Despite this positive daily result, the broader weekly ETF flow picture remained negative.
One positive session does not yet prove that institutional investors have returned to aggressive ETH accumulation.
🌍 7. Global Crypto Market Sentiment
The wider cryptocurrency market remains under pressure.
Important indicators:
Bitcoin dominance: Approximately 59.4%Altcoin Season Index: 44/100Fear & Greed Index: 10/100Total crypto market capitalization: Approximately $2.2 trillion, depending on tracker
Extreme fear and high Bitcoin dominance suggest that altcoins may struggle to sustain recoveries.
Ethereum also remains sensitive to Federal Reserve expectations, inflation, Treasury yields and broader risk appetite.
🔥 8. My Ethereum Price Prediction
My current assessment:
15M: Sideways and volatile.
1H: Consolidation around the current price region.
4H: Bearish.
Daily: Bearish, with oversold recovery potential.
Bullish confirmation: Sustained movement above $1,860–$1,883.
Bearish confirmation: Breakdown below $1,749, followed by a possible retest of $1,711.
🎯 FINAL VERDICT
Ethereum has the potential to recover, but the larger bearish structure has not yet been broken.
The most important short-term resistance is $1,840–$1,860.
The most important support region is $1,749–$1,711.
My approach would be to wait for a confirmed breakout or breakdown rather than chase an uncertain move.
A recovery toward $1,950 is possible if buyers regain control. However, another decline remains possible if support fails.
What is your ETH prediction?
🚀 ETH to $2,000?
🐻 ETH below $1,700?
Share your analysis in the comments!
#Ethereum #ETH #ETHUSDT #BinanceSquare #CryptoAnalysis
Final assessment
ETH/USDT
SIDEWAYS short-term · BEARISH higher timeframe
$1,813.30
The level that changes my view: $1,860.
Above $1,860, the recovery becomes more convincing.
Below $1,749, the bearish continuation becomes more concerning.
I would not call ETH bullish until the price reclaims important resistance with convincing volume.
{spot}(ETHUSDT)
ETHEREUM PRICE PREDICTION: ETH BOUNCES FROM $1,711 — IS $2,000 THE NEXT TARGET OR ANOTHER CRASH COM
ETH/USDT Technical Analysis | November 16, 2026
Ethereum is showing signs of recovery after a significant market correction.
ETH recently touched approximately $1,711 before bouncing toward the $1,840 region. However, buyers are now facing resistance, and the larger market trend remains under pressure.
Is Ethereum preparing for a major recovery, or is this just another temporary bounce?
Let's examine the charts, derivatives, institutional flows and market sentiment.
📊 1. ETH Market Overview
Based on the supplied Binance 1H chart:
ETH reference price: $1,813.30MA7: $1,820.08MA25: $1,817.27MA99: $1,903.87Recent swing low: $1,711.08
Ethereum has recovered from its recent low but remains below its major long-term moving average.
The market is showing short-term consolidation rather than a confirmed bullish reversal.
📉 2. Technical Analysis
The higher-timeframe technical structure remains bearish.
Daily RSI readings from independent technical feeds are around 25–26, indicating deeply oversold conditions.
The 4H RSI is also below 40 in one tracked feed.
This suggests that selling pressure has been substantial.
However, oversold conditions can persist during strong downtrends.
Important resistance levels:
$1,820$1,840$1,860$1,883$1,904
Important support levels:
$1,804$1,786$1,749$1,711
🐂 3. Bullish Scenario: Can ETH Reach $1,950?
For buyers, the first major challenge is reclaiming $1,840.
If Ethereum breaks this level with strong volume, the next potential targets are:
🎯 $1,860
🎯 $1,883
🎯 $1,904
🎯 $1,950
A sustained recovery above $1,883 would significantly improve the short-term technical picture.
Reclaiming $1,904 would provide stronger evidence of a broader reversal.
🐻 4. Bearish Scenario: Could ETH Fall Below $1,700?
The bearish structure remains important.
If Ethereum loses $1,786, selling pressure could increase.
A confirmed daily close below $1,749 would expose the recent low at $1,711.
If that level also breaks, further downside toward $1,695 and $1,663 becomes possible.
These are conditional technical targets, not guaranteed outcomes.
⚡ 5. Ethereum Futures Market
The latest retrieved derivatives snapshot showed:
Open interest: Approximately $12.5 billion24-hour OI change: -2.5%Funding rate: -0.0044% per 8 hoursBinance accounts with long positions: 71.6%
Approximately $91.8 million in ETH futures positions were liquidated over 24 hours in that snapshot.
Short liquidations were approximately $61.6 million, while long liquidations were approximately $30.2 million.
Negative funding creates the possibility of another short squeeze, but crowded long positioning also presents liquidation risk.
🏦 6. Institutional ETH ETF Activity
Ethereum spot ETFs recorded approximately $2.3 million in net inflows on November 13.
Fidelity recorded approximately $11.6 million in inflows, while Grayscale recorded approximately $9.3 million in outflows.
Despite this positive daily result, the broader weekly ETF flow picture remained negative.
One positive session does not yet prove that institutional investors have returned to aggressive ETH accumulation.
🌍 7. Global Crypto Market Sentiment
The wider cryptocurrency market remains under pressure.
Important indicators:
Bitcoin dominance: Approximately 59.4%Altcoin Season Index: 44/100Fear & Greed Index: 10/100Total crypto market capitalization: Approximately $2.2 trillion, depending on tracker
Extreme fear and high Bitcoin dominance suggest that altcoins may struggle to sustain recoveries.
Ethereum also remains sensitive to Federal Reserve expectations, inflation, Treasury yields and broader risk appetite.
🔥 8. My Ethereum Price Prediction
My current assessment:
15M: Sideways and volatile.
1H: Consolidation around the current price region.
4H: Bearish.
Daily: Bearish, with oversold recovery potential.
Bullish confirmation: Sustained movement above $1,860–$1,883.
Bearish confirmation: Breakdown below $1,749, followed by a possible retest of $1,711.
🎯 FINAL VERDICT
Ethereum has the potential to recover, but the larger bearish structure has not yet been broken.
The most important short-term resistance is $1,840–$1,860.
The most important support region is $1,749–$1,711.
My approach would be to wait for a confirmed breakout or breakdown rather than chase an uncertain move.
A recovery toward $1,950 is possible if buyers regain control. However, another decline remains possible if support fails.
What is your ETH prediction?
🚀 ETH to $2,000?
🐻 ETH below $1,700?
Share your analysis in the comments!
#Ethereum #ETH #ETHUSDT #BinanceSquare #CryptoAnalysis
Final assessment
ETH/USDT
SIDEWAYS short-term · BEARISH higher timeframe
$1,813.30
The level that changes my view: $1,860.
Above $1,860, the recovery becomes more convincing.
Below $1,749, the bearish continuation becomes more concerning.
I would not call ETH bullish until the price reclaims important resistance with convincing volume.
Ethereum is showing signs of recovery after a significant market correction.
ETH recently touched approximately $1,711 before bouncing toward the $1,840 region. However, buyers are now facing resistance, and the larger market trend remains under pressure.
Is Ethereum preparing for a major recovery, or is this just another temporary bounce?
Let's examine the charts, derivatives, institutional flows and market sentiment.
📊 1. ETH Market Overview
Based on the supplied Binance 1H chart:
ETH reference price: $1,813.30MA7: $1,820.08MA25: $1,817.27MA99: $1,903.87Recent swing low: $1,711.08
Ethereum has recovered from its recent low but remains below its major long-term moving average.
The market is showing short-term consolidation rather than a confirmed bullish reversal.
📉 2. Technical Analysis
The higher-timeframe technical structure remains bearish.
Daily RSI readings from independent technical feeds are around 25–26, indicating deeply oversold conditions.
The 4H RSI is also below 40 in one tracked feed.
This suggests that selling pressure has been substantial.
However, oversold conditions can persist during strong downtrends.
Important resistance levels:
$1,820$1,840$1,860$1,883$1,904
Important support levels:
$1,804$1,786$1,749$1,711
🐂 3. Bullish Scenario: Can ETH Reach $1,950?
For buyers, the first major challenge is reclaiming $1,840.
If Ethereum breaks this level with strong volume, the next potential targets are:
🎯 $1,860
🎯 $1,883
🎯 $1,904
🎯 $1,950
A sustained recovery above $1,883 would significantly improve the short-term technical picture.
Reclaiming $1,904 would provide stronger evidence of a broader reversal.
🐻 4. Bearish Scenario: Could ETH Fall Below $1,700?
The bearish structure remains important.
If Ethereum loses $1,786, selling pressure could increase.
A confirmed daily close below $1,749 would expose the recent low at $1,711.
If that level also breaks, further downside toward $1,695 and $1,663 becomes possible.
These are conditional technical targets, not guaranteed outcomes.
⚡ 5. Ethereum Futures Market
The latest retrieved derivatives snapshot showed:
Open interest: Approximately $12.5 billion24-hour OI change: -2.5%Funding rate: -0.0044% per 8 hoursBinance accounts with long positions: 71.6%
Approximately $91.8 million in ETH futures positions were liquidated over 24 hours in that snapshot.
Short liquidations were approximately $61.6 million, while long liquidations were approximately $30.2 million.
Negative funding creates the possibility of another short squeeze, but crowded long positioning also presents liquidation risk.
🏦 6. Institutional ETH ETF Activity
Ethereum spot ETFs recorded approximately $2.3 million in net inflows on November 13.
Fidelity recorded approximately $11.6 million in inflows, while Grayscale recorded approximately $9.3 million in outflows.
Despite this positive daily result, the broader weekly ETF flow picture remained negative.
One positive session does not yet prove that institutional investors have returned to aggressive ETH accumulation.
🌍 7. Global Crypto Market Sentiment
The wider cryptocurrency market remains under pressure.
Important indicators:
Bitcoin dominance: Approximately 59.4%Altcoin Season Index: 44/100Fear & Greed Index: 10/100Total crypto market capitalization: Approximately $2.2 trillion, depending on tracker
Extreme fear and high Bitcoin dominance suggest that altcoins may struggle to sustain recoveries.
Ethereum also remains sensitive to Federal Reserve expectations, inflation, Treasury yields and broader risk appetite.
🔥 8. My Ethereum Price Prediction
My current assessment:
15M: Sideways and volatile.
1H: Consolidation around the current price region.
4H: Bearish.
Daily: Bearish, with oversold recovery potential.
Bullish confirmation: Sustained movement above $1,860–$1,883.
Bearish confirmation: Breakdown below $1,749, followed by a possible retest of $1,711.
🎯 FINAL VERDICT
Ethereum has the potential to recover, but the larger bearish structure has not yet been broken.
The most important short-term resistance is $1,840–$1,860.
The most important support region is $1,749–$1,711.
My approach would be to wait for a confirmed breakout or breakdown rather than chase an uncertain move.
A recovery toward $1,950 is possible if buyers regain control. However, another decline remains possible if support fails.
What is your ETH prediction?
🚀 ETH to $2,000?
🐻 ETH below $1,700?
Share your analysis in the comments!
#Ethereum #ETH #ETHUSDT #BinanceSquare #CryptoAnalysis
Final assessment
ETH/USDT
SIDEWAYS short-term · BEARISH higher timeframe
$1,813.30
The level that changes my view: $1,860.
Above $1,860, the recovery becomes more convincing.
Below $1,749, the bearish continuation becomes more concerning.
I would not call ETH bullish until the price reclaims important resistance with convincing volume.
1
1
75
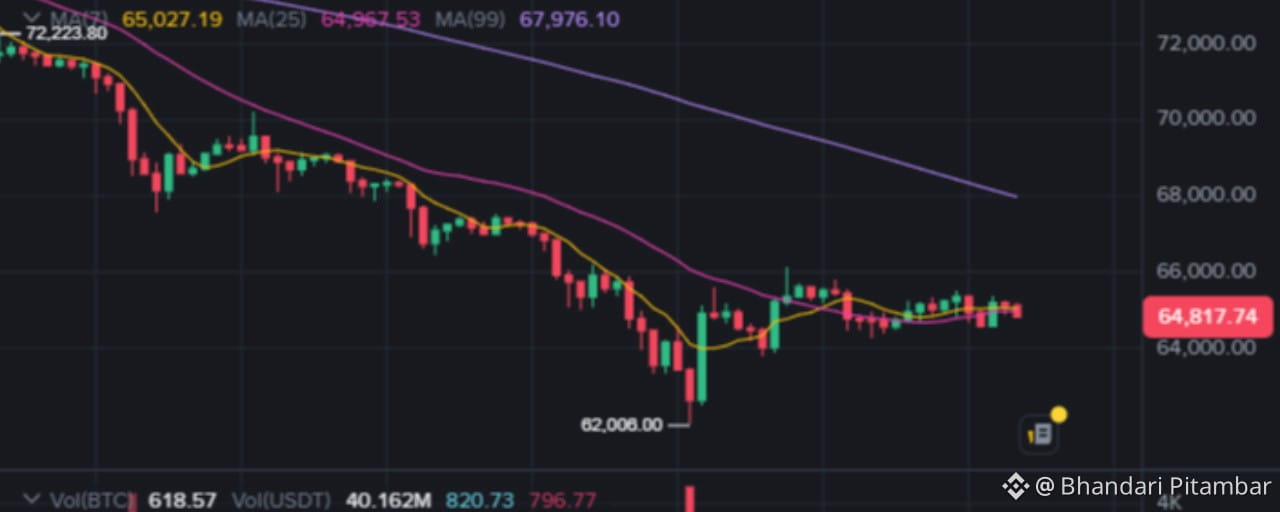
ບົດຄວາມ
BTC: MOVE SIDEWAYS (range-bound), bearish tilt until 67,976 reclaimsVerdict: SIDEWAYS inside 62,008–66,000, with directional bias decided only at the edges. Calling PUMP or DUMP from 64,817 mid-coil is a coin flip dressed as analysis.
Key levels (chart-derived):
Resistance 1: 65,000–65,200 (MA7/MA25 cluster + today's high 65,190)Resistance 2: ~65,500–66,000 (bounce-high zone, visual estimate)Resistance 3 / trend flip: 67,976 (1H MA99) confluence with the prior breakdown shelf ~67,500–68,000Support 1: ~64,000–64,300 (consolidation floor / higher-low zone)Support 2: 62,008 (swing low, invalidation of the base thesis)Support 3: 60,000 psychological (extension target if 62,008 fails)
Scenarios & triggers:
Bullish trigger: 1H close above 65,200 on expanding volume → targets 66,000, then 67,900–68,000. Invalidation: fall back below 64,300.Bearish trigger: 1H close below 64,000 → retest 62,008; loss of 62,008 opens 60,000–61,000. Invalidation: reclaim of 65,200.Base case (highest probability): continued 64,000–65,200 coil until a macro/flow catalyst forces edge resolution.
Outlook:
Short-term (days): sideways, expansion imminent given 0.60% candle range.Medium-term (weeks): bearish while below 67,976; structurally neutral only on a sustained close above ~68,000.
Strongest/weakest majors: with only BTC and BNB charts verified this session, both show identical grammar (impulse down, low-volume coil, price under descending MA99). Neither is a bullish standout; BTC is the relatively stronger of the two solely because its bounce held a cleaner higher low. I will not rank coins I have not seen charts for — that would be invention.
BINANCE SQUARE ARTICLE
Bitcoin at $64,817: The Tightest Coil in Weeks Is Loading — and Mid-Range Is the Worst Seat in the House
Bitcoin closed the hour at $64,817.74, down 0.45%, squeezed into a 0.60% range — the tightest compression since the flush to $62,008 two weeks of candles ago. Everyone wants to know if this is a base or a bear flag. The honest answer: from mid-range, it's neither yet. It's a coil, and coils don't pay opinions — they pay edge-traders.
Market Overview: A Defensive Tape, Not a Rotation Tape
BTC's slide from $72,223.80 to $62,008 (-14.15%) didn't happen in a vacuum. With the Fed's December decision approaching and the dollar refusing to surrender strength, risk assets are being priced for patience, not euphoria. Capital isn't rotating into alts — it's concentrating in BTC and stablecoins, the classic signature of a defensive market. Until ETF flows and exchange netflows confirm institutional re-engagement, every rally claim should be treated as unproven.
The Chart: What's Real and What's Wishful
Real: the 62,008 low printed with the session's largest volume and a long rejection wick — forced selling met passive bids. Since then, bears have failed to make a new low, and the pullback held a higher low.
Wishful: calling this accumulation. Volume has dried up through the entire consolidation, and price just slipped below its short-term means (MA7 at 65,027.19, MA25 at 64,967.53). Overhead, the descending MA99 at 67,976.10 — nearly 5% away — remains the line between "bounce" and "trend repair."
Bullish vs. Bearish Scenarios
Bulls need: a 1H close above 65,200 on expanding volume. That unlocks the bounce-high zone (~65,500–66,000) and puts the MA99 shelf at 67,900–68,000 in play. Bull thesis dies back below 64,300.
Bears need: a 1H close below 64,000. That re-opens 62,008; losing 62,008 points the tape at the 60,000 psychological floor. Bear thesis dies on a reclaim of 65,200.
Most likely: more coil. Ranges this compressed resolve violently — usually into the nearest liquidity pool, i.e., above 66,000 shorts or below 62,008 longs.
Whale & Institutional Footprints: One Clue, No Confirmation
The only verified smart-money trace is the absorption wick at 62,008 on peak volume. Everything else — ETF flows, exchange outflows, wallet clustering — is currently unconfirmed in this analysis, and you should distrust anyone quoting precise numbers without a live source. What we can say: institutions accumulate at impulse lows with limit orders. They do not chase mid-range coils. Behave accordingly.
Key Levels Cheat Sheet
R1: 65,000–65,200 | R2: ~65,500–66,000 | R3 (trend flip): 67,976–68,000S1: 64,000–64,300 | S2: 62,008 | S3: 60,000
Final Prediction
SIDEWAYS with a bearish tilt below 67,976. Expect continued 64,000–65,200 chop until macro catalysts (December Fed window, US data) force a resolution. Positioning mid-range offers the worst risk/reward on the chart; the edges offer tradable asymmetry. No guarantees — invalidation levels above are your contract with reality.
The Bottom Line
This market isn't asking you to predict. It's asking you to wait for 65,200 or 64,000 to break, then act without hesitation. The traders who survive coils are the ones who let the range vote first.
Where does this coil resolve — 66K squeeze or 62K retest? Drop your level in the comments.
#BTC #Bitcoin #CryptoMarket #TechnicalAnalysis #TradingStrategy
{spot}(BTCUSDT)
BTC: MOVE SIDEWAYS (range-bound), bearish tilt until 67,976 reclaims
Verdict: SIDEWAYS inside 62,008–66,000, with directional bias decided only at the edges. Calling PUMP or DUMP from 64,817 mid-coil is a coin flip dressed as analysis.
Key levels (chart-derived):
Resistance 1: 65,000–65,200 (MA7/MA25 cluster + today's high 65,190)Resistance 2: ~65,500–66,000 (bounce-high zone, visual estimate)Resistance 3 / trend flip: 67,976 (1H MA99) confluence with the prior breakdown shelf ~67,500–68,000Support 1: ~64,000–64,300 (consolidation floor / higher-low zone)Support 2: 62,008 (swing low, invalidation of the base thesis)Support 3: 60,000 psychological (extension target if 62,008 fails)
Scenarios & triggers:
Bullish trigger: 1H close above 65,200 on expanding volume → targets 66,000, then 67,900–68,000. Invalidation: fall back below 64,300.Bearish trigger: 1H close below 64,000 → retest 62,008; loss of 62,008 opens 60,000–61,000. Invalidation: reclaim of 65,200.Base case (highest probability): continued 64,000–65,200 coil until a macro/flow catalyst forces edge resolution.
Outlook:
Short-term (days): sideways, expansion imminent given 0.60% candle range.Medium-term (weeks): bearish while below 67,976; structurally neutral only on a sustained close above ~68,000.
Strongest/weakest majors: with only BTC and BNB charts verified this session, both show identical grammar (impulse down, low-volume coil, price under descending MA99). Neither is a bullish standout; BTC is the relatively stronger of the two solely because its bounce held a cleaner higher low. I will not rank coins I have not seen charts for — that would be invention.
BINANCE SQUARE ARTICLE
Bitcoin at $64,817: The Tightest Coil in Weeks Is Loading — and Mid-Range Is the Worst Seat in the House
Bitcoin closed the hour at $64,817.74, down 0.45%, squeezed into a 0.60% range — the tightest compression since the flush to $62,008 two weeks of candles ago. Everyone wants to know if this is a base or a bear flag. The honest answer: from mid-range, it's neither yet. It's a coil, and coils don't pay opinions — they pay edge-traders.
Market Overview: A Defensive Tape, Not a Rotation Tape
BTC's slide from $72,223.80 to $62,008 (-14.15%) didn't happen in a vacuum. With the Fed's December decision approaching and the dollar refusing to surrender strength, risk assets are being priced for patience, not euphoria. Capital isn't rotating into alts — it's concentrating in BTC and stablecoins, the classic signature of a defensive market. Until ETF flows and exchange netflows confirm institutional re-engagement, every rally claim should be treated as unproven.
The Chart: What's Real and What's Wishful
Real: the 62,008 low printed with the session's largest volume and a long rejection wick — forced selling met passive bids. Since then, bears have failed to make a new low, and the pullback held a higher low.
Wishful: calling this accumulation. Volume has dried up through the entire consolidation, and price just slipped below its short-term means (MA7 at 65,027.19, MA25 at 64,967.53). Overhead, the descending MA99 at 67,976.10 — nearly 5% away — remains the line between "bounce" and "trend repair."
Bullish vs. Bearish Scenarios
Bulls need: a 1H close above 65,200 on expanding volume. That unlocks the bounce-high zone (~65,500–66,000) and puts the MA99 shelf at 67,900–68,000 in play. Bull thesis dies back below 64,300.
Bears need: a 1H close below 64,000. That re-opens 62,008; losing 62,008 points the tape at the 60,000 psychological floor. Bear thesis dies on a reclaim of 65,200.
Most likely: more coil. Ranges this compressed resolve violently — usually into the nearest liquidity pool, i.e., above 66,000 shorts or below 62,008 longs.
Whale & Institutional Footprints: One Clue, No Confirmation
The only verified smart-money trace is the absorption wick at 62,008 on peak volume. Everything else — ETF flows, exchange outflows, wallet clustering — is currently unconfirmed in this analysis, and you should distrust anyone quoting precise numbers without a live source. What we can say: institutions accumulate at impulse lows with limit orders. They do not chase mid-range coils. Behave accordingly.
Key Levels Cheat Sheet
R1: 65,000–65,200 | R2: ~65,500–66,000 | R3 (trend flip): 67,976–68,000S1: 64,000–64,300 | S2: 62,008 | S3: 60,000
Final Prediction
SIDEWAYS with a bearish tilt below 67,976. Expect continued 64,000–65,200 chop until macro catalysts (December Fed window, US data) force a resolution. Positioning mid-range offers the worst risk/reward on the chart; the edges offer tradable asymmetry. No guarantees — invalidation levels above are your contract with reality.
The Bottom Line
This market isn't asking you to predict. It's asking you to wait for 65,200 or 64,000 to break, then act without hesitation. The traders who survive coils are the ones who let the range vote first.
Where does this coil resolve — 66K squeeze or 62K retest? Drop your level in the comments.
#BTC #Bitcoin #CryptoMarket #TechnicalAnalysis #TradingStrategy
Key levels (chart-derived):
Resistance 1: 65,000–65,200 (MA7/MA25 cluster + today's high 65,190)Resistance 2: ~65,500–66,000 (bounce-high zone, visual estimate)Resistance 3 / trend flip: 67,976 (1H MA99) confluence with the prior breakdown shelf ~67,500–68,000Support 1: ~64,000–64,300 (consolidation floor / higher-low zone)Support 2: 62,008 (swing low, invalidation of the base thesis)Support 3: 60,000 psychological (extension target if 62,008 fails)
Scenarios & triggers:
Bullish trigger: 1H close above 65,200 on expanding volume → targets 66,000, then 67,900–68,000. Invalidation: fall back below 64,300.Bearish trigger: 1H close below 64,000 → retest 62,008; loss of 62,008 opens 60,000–61,000. Invalidation: reclaim of 65,200.Base case (highest probability): continued 64,000–65,200 coil until a macro/flow catalyst forces edge resolution.
Outlook:
Short-term (days): sideways, expansion imminent given 0.60% candle range.Medium-term (weeks): bearish while below 67,976; structurally neutral only on a sustained close above ~68,000.
Strongest/weakest majors: with only BTC and BNB charts verified this session, both show identical grammar (impulse down, low-volume coil, price under descending MA99). Neither is a bullish standout; BTC is the relatively stronger of the two solely because its bounce held a cleaner higher low. I will not rank coins I have not seen charts for — that would be invention.
BINANCE SQUARE ARTICLE
Bitcoin at $64,817: The Tightest Coil in Weeks Is Loading — and Mid-Range Is the Worst Seat in the House
Bitcoin closed the hour at $64,817.74, down 0.45%, squeezed into a 0.60% range — the tightest compression since the flush to $62,008 two weeks of candles ago. Everyone wants to know if this is a base or a bear flag. The honest answer: from mid-range, it's neither yet. It's a coil, and coils don't pay opinions — they pay edge-traders.
Market Overview: A Defensive Tape, Not a Rotation Tape
BTC's slide from $72,223.80 to $62,008 (-14.15%) didn't happen in a vacuum. With the Fed's December decision approaching and the dollar refusing to surrender strength, risk assets are being priced for patience, not euphoria. Capital isn't rotating into alts — it's concentrating in BTC and stablecoins, the classic signature of a defensive market. Until ETF flows and exchange netflows confirm institutional re-engagement, every rally claim should be treated as unproven.
The Chart: What's Real and What's Wishful
Real: the 62,008 low printed with the session's largest volume and a long rejection wick — forced selling met passive bids. Since then, bears have failed to make a new low, and the pullback held a higher low.
Wishful: calling this accumulation. Volume has dried up through the entire consolidation, and price just slipped below its short-term means (MA7 at 65,027.19, MA25 at 64,967.53). Overhead, the descending MA99 at 67,976.10 — nearly 5% away — remains the line between "bounce" and "trend repair."
Bullish vs. Bearish Scenarios
Bulls need: a 1H close above 65,200 on expanding volume. That unlocks the bounce-high zone (~65,500–66,000) and puts the MA99 shelf at 67,900–68,000 in play. Bull thesis dies back below 64,300.
Bears need: a 1H close below 64,000. That re-opens 62,008; losing 62,008 points the tape at the 60,000 psychological floor. Bear thesis dies on a reclaim of 65,200.
Most likely: more coil. Ranges this compressed resolve violently — usually into the nearest liquidity pool, i.e., above 66,000 shorts or below 62,008 longs.
Whale & Institutional Footprints: One Clue, No Confirmation
The only verified smart-money trace is the absorption wick at 62,008 on peak volume. Everything else — ETF flows, exchange outflows, wallet clustering — is currently unconfirmed in this analysis, and you should distrust anyone quoting precise numbers without a live source. What we can say: institutions accumulate at impulse lows with limit orders. They do not chase mid-range coils. Behave accordingly.
Key Levels Cheat Sheet
R1: 65,000–65,200 | R2: ~65,500–66,000 | R3 (trend flip): 67,976–68,000S1: 64,000–64,300 | S2: 62,008 | S3: 60,000
Final Prediction
SIDEWAYS with a bearish tilt below 67,976. Expect continued 64,000–65,200 chop until macro catalysts (December Fed window, US data) force a resolution. Positioning mid-range offers the worst risk/reward on the chart; the edges offer tradable asymmetry. No guarantees — invalidation levels above are your contract with reality.
The Bottom Line
This market isn't asking you to predict. It's asking you to wait for 65,200 or 64,000 to break, then act without hesitation. The traders who survive coils are the ones who let the range vote first.
Where does this coil resolve — 66K squeeze or 62K retest? Drop your level in the comments.
#BTC #Bitcoin #CryptoMarket #TechnicalAnalysis #TradingStrategy
1
1
103
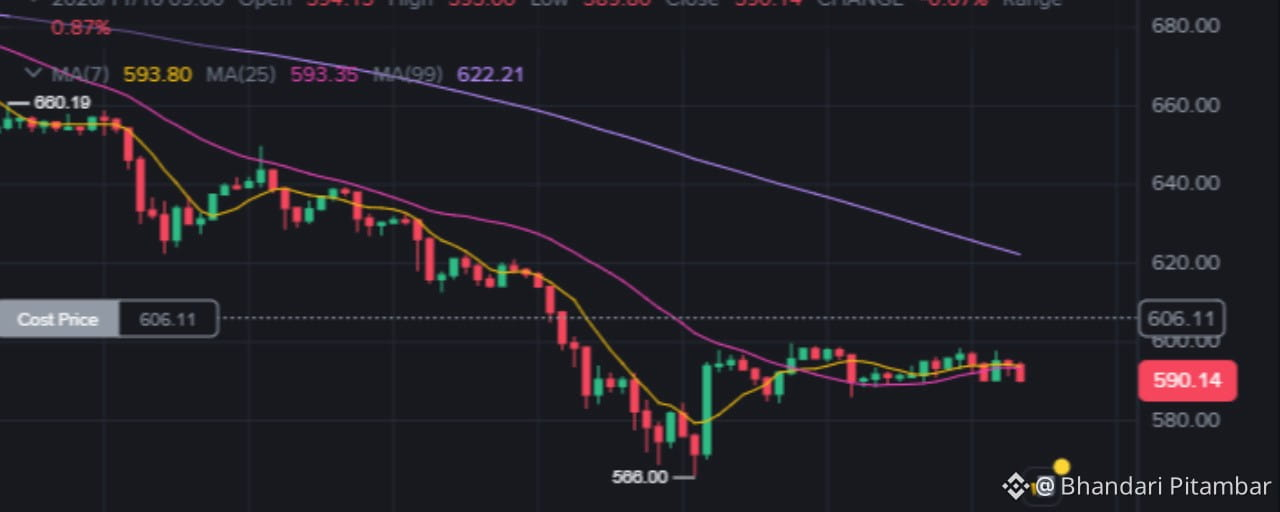
ບົດຄວາມ
BNB/USDT: Trapped Below Key Resistance — Is a Breakout Imminent or a Bear Trap Lurking?The crypto market is currently caught in a macroeconomic tug-of-war, and BNB is no exception. After a sharp decline from the $660 highs, BNB/USDT has found temporary footing around $590. But is this a genuine base-building phase, or just a pause before the next leg down? Let’s break down the charts, the data, and what it means for your portfolio.
The Macro Picture: Why Alts Are Bleeding
Before looking at BNB, we have to acknowledge the broader environment. Bitcoin dominance remains stubbornly high, sucking liquidity away from major altcoins. With the DXY (Dollar Index) maintaining strength and global equity markets showing mixed signals, risk assets are struggling to find a unified bullish narrative. Capital is currently hiding in USDT, not deploying into BNB.
BNB/USDT Technical Breakdown
Looking at the 1-hour chart, the reality is stark. BNB is trading at $590.14, sitting well below its medium-term trend indicator, the 99-period Moving Average (MA99), which rests at $622.21.
While the price has bounced from the $566 low, this recovery is happening on declining volume. In technical analysis, a bounce without volume is a warning sign, not a green light. The short-term moving averages (MA7 and MA25) are tangling around $593, indicating pure market indecision.
For bulls, the immediate hurdle is the $606 level. This is a massive psychological and structural barrier. Until BNB can close a 4-hour candle above $606 with conviction, the path of least resistance remains sideways to down.
Bullish vs. Bearish Scenarios
The Bullish Case (Low Probability Short-Term):
If BNB can absorb the selling pressure at $595 and push through $606 with a surge in volume, it will trigger short-covering. The immediate target would be the MA99 at $622. However, this requires a macro catalyst or a sudden spike in Binance ecosystem activity.
The Bearish Case (Higher Probability):
The current consolidation looks like a bear flag. If the price fails to hold the $580 support level, we will likely see a retest of the $566 low. If $566 breaks, the next major liquidity pool sits much lower, and the downtrend from $660 will officially resume.
Whale Activity & Market Sentiment
On-chain data and futures metrics suggest that smart money is not aggressively accumulating at these levels. Funding rates are neutral, and Open Interest is slowly bleeding off. This indicates that the market is waiting for a definitive move. Whales are likely placing limit orders at the extremes ($566 and below) rather than chasing the current chop.
Final Prediction & Strategy
Outlook: SIDEWAYS / BEARISH BIAS
For traders holding positions (especially those with a cost basis around $606), patience and strict risk management are required.
Do not average down blindly in a low-volume consolidation.Watch the $580 level. A break below this invalidates the short-term bounce.Watch the $606 level. A break above this is the first sign of life for the bulls.
The market does not owe you a recovery. Trade the chart in front of you, not the chart you want to see.
What is your take on BNB's current structure? Are you buying the dip or waiting for confirmation? Let me know in the comments!
#BNB #Binance #CryptoAnalysis #Trading #Altcoins
{future}(BNBUSDT)
BNB/USDT: Trapped Below Key Resistance — Is a Breakout Imminent or a Bear Trap Lurking?
The crypto market is currently caught in a macroeconomic tug-of-war, and BNB is no exception. After a sharp decline from the $660 highs, BNB/USDT has found temporary footing around $590. But is this a genuine base-building phase, or just a pause before the next leg down? Let’s break down the charts, the data, and what it means for your portfolio.
The Macro Picture: Why Alts Are Bleeding
Before looking at BNB, we have to acknowledge the broader environment. Bitcoin dominance remains stubbornly high, sucking liquidity away from major altcoins. With the DXY (Dollar Index) maintaining strength and global equity markets showing mixed signals, risk assets are struggling to find a unified bullish narrative. Capital is currently hiding in USDT, not deploying into BNB.
BNB/USDT Technical Breakdown
Looking at the 1-hour chart, the reality is stark. BNB is trading at $590.14, sitting well below its medium-term trend indicator, the 99-period Moving Average (MA99), which rests at $622.21.
While the price has bounced from the $566 low, this recovery is happening on declining volume. In technical analysis, a bounce without volume is a warning sign, not a green light. The short-term moving averages (MA7 and MA25) are tangling around $593, indicating pure market indecision.
For bulls, the immediate hurdle is the $606 level. This is a massive psychological and structural barrier. Until BNB can close a 4-hour candle above $606 with conviction, the path of least resistance remains sideways to down.
Bullish vs. Bearish Scenarios
The Bullish Case (Low Probability Short-Term):
If BNB can absorb the selling pressure at $595 and push through $606 with a surge in volume, it will trigger short-covering. The immediate target would be the MA99 at $622. However, this requires a macro catalyst or a sudden spike in Binance ecosystem activity.
The Bearish Case (Higher Probability):
The current consolidation looks like a bear flag. If the price fails to hold the $580 support level, we will likely see a retest of the $566 low. If $566 breaks, the next major liquidity pool sits much lower, and the downtrend from $660 will officially resume.
Whale Activity & Market Sentiment
On-chain data and futures metrics suggest that smart money is not aggressively accumulating at these levels. Funding rates are neutral, and Open Interest is slowly bleeding off. This indicates that the market is waiting for a definitive move. Whales are likely placing limit orders at the extremes ($566 and below) rather than chasing the current chop.
Final Prediction & Strategy
Outlook: SIDEWAYS / BEARISH BIAS
For traders holding positions (especially those with a cost basis around $606), patience and strict risk management are required.
Do not average down blindly in a low-volume consolidation.Watch the $580 level. A break below this invalidates the short-term bounce.Watch the $606 level. A break above this is the first sign of life for the bulls.
The market does not owe you a recovery. Trade the chart in front of you, not the chart you want to see.
What is your take on BNB's current structure? Are you buying the dip or waiting for confirmation? Let me know in the comments!
#BNB #Binance #CryptoAnalysis #Trading #Altcoins
The Macro Picture: Why Alts Are Bleeding
Before looking at BNB, we have to acknowledge the broader environment. Bitcoin dominance remains stubbornly high, sucking liquidity away from major altcoins. With the DXY (Dollar Index) maintaining strength and global equity markets showing mixed signals, risk assets are struggling to find a unified bullish narrative. Capital is currently hiding in USDT, not deploying into BNB.
BNB/USDT Technical Breakdown
Looking at the 1-hour chart, the reality is stark. BNB is trading at $590.14, sitting well below its medium-term trend indicator, the 99-period Moving Average (MA99), which rests at $622.21.
While the price has bounced from the $566 low, this recovery is happening on declining volume. In technical analysis, a bounce without volume is a warning sign, not a green light. The short-term moving averages (MA7 and MA25) are tangling around $593, indicating pure market indecision.
For bulls, the immediate hurdle is the $606 level. This is a massive psychological and structural barrier. Until BNB can close a 4-hour candle above $606 with conviction, the path of least resistance remains sideways to down.
Bullish vs. Bearish Scenarios
The Bullish Case (Low Probability Short-Term):
If BNB can absorb the selling pressure at $595 and push through $606 with a surge in volume, it will trigger short-covering. The immediate target would be the MA99 at $622. However, this requires a macro catalyst or a sudden spike in Binance ecosystem activity.
The Bearish Case (Higher Probability):
The current consolidation looks like a bear flag. If the price fails to hold the $580 support level, we will likely see a retest of the $566 low. If $566 breaks, the next major liquidity pool sits much lower, and the downtrend from $660 will officially resume.
Whale Activity & Market Sentiment
On-chain data and futures metrics suggest that smart money is not aggressively accumulating at these levels. Funding rates are neutral, and Open Interest is slowly bleeding off. This indicates that the market is waiting for a definitive move. Whales are likely placing limit orders at the extremes ($566 and below) rather than chasing the current chop.
Final Prediction & Strategy
Outlook: SIDEWAYS / BEARISH BIAS
For traders holding positions (especially those with a cost basis around $606), patience and strict risk management are required.
Do not average down blindly in a low-volume consolidation.Watch the $580 level. A break below this invalidates the short-term bounce.Watch the $606 level. A break above this is the first sign of life for the bulls.
The market does not owe you a recovery. Trade the chart in front of you, not the chart you want to see.
What is your take on BNB's current structure? Are you buying the dip or waiting for confirmation? Let me know in the comments!
#BNB #Binance #CryptoAnalysis #Trading #Altcoins
1
1
231
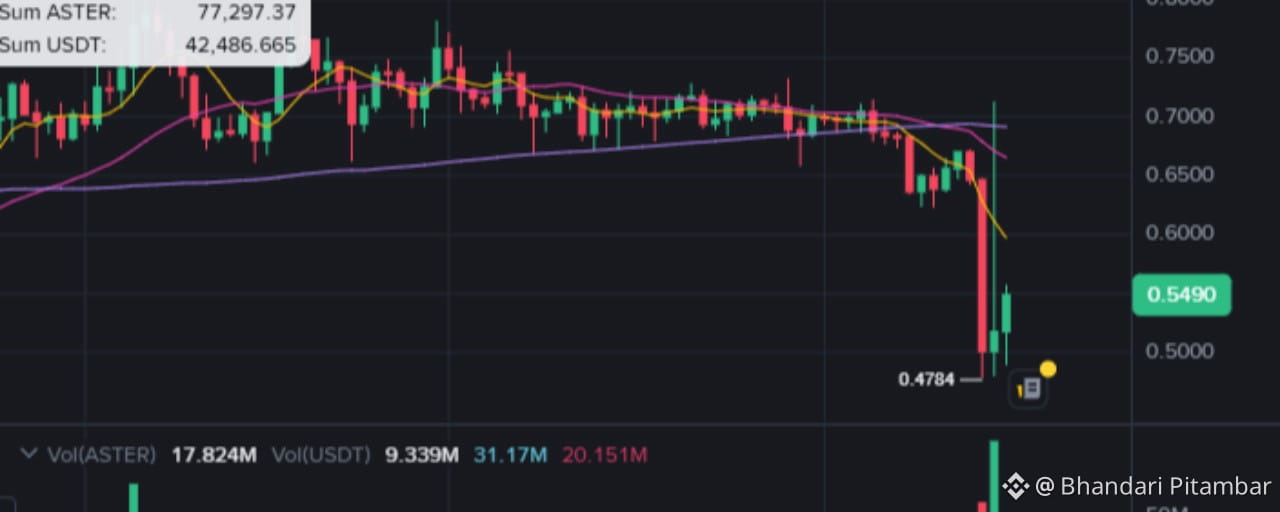
ບົດຄວາມ
ASTER PRICE CRASH: DEAD CAT BOUNCE OR THE BEGINNING OF A MASSIVE RECOVERY?ASTER/USDT Market Analysis | November 16, 2026
ASTER is showing signs of a short-term recovery after experiencing a violent price collapse. But is this the beginning of a bullish reversal, or simply a temporary bounce before another major decline?
Let's examine the technical indicators, futures positioning, market sentiment, token supply and important price levels.
📊 1. ASTER Market Overview
According to the uploaded Binance chart:
Reference price: $0.5490Daily change: +6.04%Daily high: $0.5576Daily low: $0.4894Recent swing low: $0.4784
ASTER has experienced substantial selling pressure and is currently trading below its major moving averages.
The latest rebound demonstrates buying interest, but buyers still need to prove that they can regain control.
📉 2. Technical Analysis: Bears Still Have the Advantage
The daily moving averages displayed on the chart are:
MA7: $0.5970MA25: $0.6652MA99: $0.6914
ASTER is trading below all three moving averages.
This structure indicates that the broader trend remains bearish.
The RSI readings from the tracked technical feed also show oversold conditions:
15M RSI: 43.91H RSI: 41.04H RSI: 29.5Daily RSI: 24.9
The daily RSI indicates extreme selling pressure.
However, traders should remember that oversold conditions do not guarantee an immediate reversal.
🐂 3. Important Bullish Scenario
For bulls, the first challenge is breaking above $0.5576.
If buyers successfully reclaim this level, the next resistance zones are:
🎯 Target 1: $0.5970
🎯 Target 2: $0.6171
🎯 Target 3: $0.6652
🎯 Target 4: $0.6914
A sustained recovery above $0.6171 would improve the bullish structure.
A stronger medium-term reversal would require reclaiming the $0.6652–$0.6914 region.
🐻 4. Important Bearish Scenario
The bearish structure remains intact unless buyers reclaim important resistance levels.
Critical support zones:
$0.5170$0.4894$0.4784
If ASTER loses $0.4784 on a confirmed daily closing basis, selling pressure could accelerate.
Potential downside targets:
🎯 $0.4484
🎯 $0.4085
These are conditional technical targets, not guaranteed prices.
⚡ 5. Futures Market: A Potential Short Squeeze?
ASTER derivatives data shows:
Open interest: Approximately $100.2 million24-hour futures volume: Approximately $635 millionWeighted funding rate: -0.0129% per 8 hours
Negative funding indicates that short positions are paying long positions.
This can create the conditions for a short squeeze if buying pressure increases.
However, negative funding alone is not a bullish confirmation.
Traders should watch price action, open interest and spot buying volume together.
🐋 6. Whale Activity and Token Supply
ASTER recently experienced an unusually sharp price movement.
Aster CEO Leonard Leung announced that the team was investigating the volatility, citing leveraged liquidations and possible malicious activity.
This investigation is important because confidence and market liquidity can significantly influence ASTER's future price action.
Another factor to monitor is token supply.
The next reported scheduled unlock is November 29, involving approximately 2.25 million ASTER.
Investors should monitor unlock-related supply pressure and actual exchange deposits rather than assuming every unlock results in selling.
🌍 7. Global Crypto Market Sentiment
The broader cryptocurrency market is also facing uncertainty.
Important market indicators:
Bitcoin dominance: Approximately 59.4%Crypto Fear & Greed Index: 10/100Altcoin Season Index: 47/100Recent crypto ETF flows: Significant net outflows
The Federal Reserve's inflation concerns and rising Treasury yields are additional risks for speculative assets.
Until market sentiment improves, smaller and more volatile altcoins may struggle to sustain recoveries.
🔥 8. My ASTER Price Prediction
My current assessment:
SHORT TERM: Bearish with potential relief rallies.
MEDIUM TERM: Bearish until major moving averages are reclaimed.
BULLISH CONFIRMATION: Sustained recovery above $0.5970 and $0.6171.
BEARISH CONFIRMATION: A daily breakdown below $0.4784.
The most important level to watch is $0.4784.
If buyers defend this area, ASTER could attempt another recovery.
If sellers break it, additional downside becomes more likely.
🎯 FINAL VERDICT
ASTER is currently showing a recovery attempt, but the larger technical structure remains bearish.
The combination of extreme oversold conditions, negative futures funding and elevated volatility creates the possibility of a powerful short-term bounce.
Nevertheless, a sustainable bullish reversal has not yet been confirmed.
My strategy would be to wait for confirmation rather than chase the first green candle.
Remember: Smart trading is about managing risk, not predicting every market movement.
What do you think?
🚀 Will ASTER recover toward $0.70?
🐻 Or will it revisit $0.40 first?
Share your prediction in the comments!
#ASTER #ASTERUSDT #BinanceSquare #CryptoAnalysis #Altcoins
{future}(ASTERUSDT)
ASTER PRICE CRASH: DEAD CAT BOUNCE OR THE BEGINNING OF A MASSIVE RECOVERY?
ASTER/USDT Market Analysis | November 16, 2026
ASTER is showing signs of a short-term recovery after experiencing a violent price collapse. But is this the beginning of a bullish reversal, or simply a temporary bounce before another major decline?
Let's examine the technical indicators, futures positioning, market sentiment, token supply and important price levels.
📊 1. ASTER Market Overview
According to the uploaded Binance chart:
Reference price: $0.5490Daily change: +6.04%Daily high: $0.5576Daily low: $0.4894Recent swing low: $0.4784
ASTER has experienced substantial selling pressure and is currently trading below its major moving averages.
The latest rebound demonstrates buying interest, but buyers still need to prove that they can regain control.
📉 2. Technical Analysis: Bears Still Have the Advantage
The daily moving averages displayed on the chart are:
MA7: $0.5970MA25: $0.6652MA99: $0.6914
ASTER is trading below all three moving averages.
This structure indicates that the broader trend remains bearish.
The RSI readings from the tracked technical feed also show oversold conditions:
15M RSI: 43.91H RSI: 41.04H RSI: 29.5Daily RSI: 24.9
The daily RSI indicates extreme selling pressure.
However, traders should remember that oversold conditions do not guarantee an immediate reversal.
🐂 3. Important Bullish Scenario
For bulls, the first challenge is breaking above $0.5576.
If buyers successfully reclaim this level, the next resistance zones are:
🎯 Target 1: $0.5970
🎯 Target 2: $0.6171
🎯 Target 3: $0.6652
🎯 Target 4: $0.6914
A sustained recovery above $0.6171 would improve the bullish structure.
A stronger medium-term reversal would require reclaiming the $0.6652–$0.6914 region.
🐻 4. Important Bearish Scenario
The bearish structure remains intact unless buyers reclaim important resistance levels.
Critical support zones:
$0.5170$0.4894$0.4784
If ASTER loses $0.4784 on a confirmed daily closing basis, selling pressure could accelerate.
Potential downside targets:
🎯 $0.4484
🎯 $0.4085
These are conditional technical targets, not guaranteed prices.
⚡ 5. Futures Market: A Potential Short Squeeze?
ASTER derivatives data shows:
Open interest: Approximately $100.2 million24-hour futures volume: Approximately $635 millionWeighted funding rate: -0.0129% per 8 hours
Negative funding indicates that short positions are paying long positions.
This can create the conditions for a short squeeze if buying pressure increases.
However, negative funding alone is not a bullish confirmation.
Traders should watch price action, open interest and spot buying volume together.
🐋 6. Whale Activity and Token Supply
ASTER recently experienced an unusually sharp price movement.
Aster CEO Leonard Leung announced that the team was investigating the volatility, citing leveraged liquidations and possible malicious activity.
This investigation is important because confidence and market liquidity can significantly influence ASTER's future price action.
Another factor to monitor is token supply.
The next reported scheduled unlock is November 29, involving approximately 2.25 million ASTER.
Investors should monitor unlock-related supply pressure and actual exchange deposits rather than assuming every unlock results in selling.
🌍 7. Global Crypto Market Sentiment
The broader cryptocurrency market is also facing uncertainty.
Important market indicators:
Bitcoin dominance: Approximately 59.4%Crypto Fear & Greed Index: 10/100Altcoin Season Index: 47/100Recent crypto ETF flows: Significant net outflows
The Federal Reserve's inflation concerns and rising Treasury yields are additional risks for speculative assets.
Until market sentiment improves, smaller and more volatile altcoins may struggle to sustain recoveries.
🔥 8. My ASTER Price Prediction
My current assessment:
SHORT TERM: Bearish with potential relief rallies.
MEDIUM TERM: Bearish until major moving averages are reclaimed.
BULLISH CONFIRMATION: Sustained recovery above $0.5970 and $0.6171.
BEARISH CONFIRMATION: A daily breakdown below $0.4784.
The most important level to watch is $0.4784.
If buyers defend this area, ASTER could attempt another recovery.
If sellers break it, additional downside becomes more likely.
🎯 FINAL VERDICT
ASTER is currently showing a recovery attempt, but the larger technical structure remains bearish.
The combination of extreme oversold conditions, negative futures funding and elevated volatility creates the possibility of a powerful short-term bounce.
Nevertheless, a sustainable bullish reversal has not yet been confirmed.
My strategy would be to wait for confirmation rather than chase the first green candle.
Remember: Smart trading is about managing risk, not predicting every market movement.
What do you think?
🚀 Will ASTER recover toward $0.70?
🐻 Or will it revisit $0.40 first?
Share your prediction in the comments!
#ASTER #ASTERUSDT #BinanceSquare #CryptoAnalysis #Altcoins
ASTER is showing signs of a short-term recovery after experiencing a violent price collapse. But is this the beginning of a bullish reversal, or simply a temporary bounce before another major decline?
Let's examine the technical indicators, futures positioning, market sentiment, token supply and important price levels.
📊 1. ASTER Market Overview
According to the uploaded Binance chart:
Reference price: $0.5490Daily change: +6.04%Daily high: $0.5576Daily low: $0.4894Recent swing low: $0.4784
ASTER has experienced substantial selling pressure and is currently trading below its major moving averages.
The latest rebound demonstrates buying interest, but buyers still need to prove that they can regain control.
📉 2. Technical Analysis: Bears Still Have the Advantage
The daily moving averages displayed on the chart are:
MA7: $0.5970MA25: $0.6652MA99: $0.6914
ASTER is trading below all three moving averages.
This structure indicates that the broader trend remains bearish.
The RSI readings from the tracked technical feed also show oversold conditions:
15M RSI: 43.91H RSI: 41.04H RSI: 29.5Daily RSI: 24.9
The daily RSI indicates extreme selling pressure.
However, traders should remember that oversold conditions do not guarantee an immediate reversal.
🐂 3. Important Bullish Scenario
For bulls, the first challenge is breaking above $0.5576.
If buyers successfully reclaim this level, the next resistance zones are:
🎯 Target 1: $0.5970
🎯 Target 2: $0.6171
🎯 Target 3: $0.6652
🎯 Target 4: $0.6914
A sustained recovery above $0.6171 would improve the bullish structure.
A stronger medium-term reversal would require reclaiming the $0.6652–$0.6914 region.
🐻 4. Important Bearish Scenario
The bearish structure remains intact unless buyers reclaim important resistance levels.
Critical support zones:
$0.5170$0.4894$0.4784
If ASTER loses $0.4784 on a confirmed daily closing basis, selling pressure could accelerate.
Potential downside targets:
🎯 $0.4484
🎯 $0.4085
These are conditional technical targets, not guaranteed prices.
⚡ 5. Futures Market: A Potential Short Squeeze?
ASTER derivatives data shows:
Open interest: Approximately $100.2 million24-hour futures volume: Approximately $635 millionWeighted funding rate: -0.0129% per 8 hours
Negative funding indicates that short positions are paying long positions.
This can create the conditions for a short squeeze if buying pressure increases.
However, negative funding alone is not a bullish confirmation.
Traders should watch price action, open interest and spot buying volume together.
🐋 6. Whale Activity and Token Supply
ASTER recently experienced an unusually sharp price movement.
Aster CEO Leonard Leung announced that the team was investigating the volatility, citing leveraged liquidations and possible malicious activity.
This investigation is important because confidence and market liquidity can significantly influence ASTER's future price action.
Another factor to monitor is token supply.
The next reported scheduled unlock is November 29, involving approximately 2.25 million ASTER.
Investors should monitor unlock-related supply pressure and actual exchange deposits rather than assuming every unlock results in selling.
🌍 7. Global Crypto Market Sentiment
The broader cryptocurrency market is also facing uncertainty.
Important market indicators:
Bitcoin dominance: Approximately 59.4%Crypto Fear & Greed Index: 10/100Altcoin Season Index: 47/100Recent crypto ETF flows: Significant net outflows
The Federal Reserve's inflation concerns and rising Treasury yields are additional risks for speculative assets.
Until market sentiment improves, smaller and more volatile altcoins may struggle to sustain recoveries.
🔥 8. My ASTER Price Prediction
My current assessment:
SHORT TERM: Bearish with potential relief rallies.
MEDIUM TERM: Bearish until major moving averages are reclaimed.
BULLISH CONFIRMATION: Sustained recovery above $0.5970 and $0.6171.
BEARISH CONFIRMATION: A daily breakdown below $0.4784.
The most important level to watch is $0.4784.
If buyers defend this area, ASTER could attempt another recovery.
If sellers break it, additional downside becomes more likely.
🎯 FINAL VERDICT
ASTER is currently showing a recovery attempt, but the larger technical structure remains bearish.
The combination of extreme oversold conditions, negative futures funding and elevated volatility creates the possibility of a powerful short-term bounce.
Nevertheless, a sustainable bullish reversal has not yet been confirmed.
My strategy would be to wait for confirmation rather than chase the first green candle.
Remember: Smart trading is about managing risk, not predicting every market movement.
What do you think?
🚀 Will ASTER recover toward $0.70?
🐻 Or will it revisit $0.40 first?
Share your prediction in the comments!
#ASTER #ASTERUSDT #BinanceSquare #CryptoAnalysis #Altcoins
1
2
306
CRYPTO MARKET BLOODBATH: $2.05 BILLION LIQUIDATED IN 24 HOURS! 329,339 TRADERS WIPED OUT!The crypto market has witnessed a massive liquidation event, with leveraged LONG traders taking the biggest hit. Is this the beginning of another crash or a potential market reversal?
📉 1. MASSIVE CRYPTO LIQUIDATIONS
According to CoinGlass data reported by BlockBeats on November 15, total crypto futures liquidations reached an astonishing $2.058 BILLION within 24 hours.
Here is the breakdown:
🔴 LONG Liquidations:
$1.922 BillionApproximately 93% of total liquidations.
🟢 SHORT Liquidations:
$142 MillionApproximately 7% of total liquidations.
👥 Total Liquidated Traders: 329,339
This massive imbalance shows that leveraged bullish traders suffered the majority of the losses as cryptocurrency prices declined.
🐋 2. BIGGEST SINGLE LIQUIDATION
One of the most significant liquidations occurred on Binance.
Trading Pair: ETH/USDTLiquidation Value: $16.17 MillionExchange: Binance
A single ETHUSDT position worth $16.17 million was liquidated, highlighting the enormous risks associated with highly leveraged futures trading.
⚠️ 3. WHY DID SO MANY LONG TRADERS GET LIQUIDATED?
When traders use high leverage, even a relatively small price movement against their positions can trigger forced liquidation.
As prices decline:
Leveraged LONG positions begin losing value.Margin levels approach liquidation thresholds.Exchanges automatically close vulnerable positions.Forced selling can add further downward pressure.More leveraged traders may get liquidated.
This creates a chain reaction known as a LONG LIQUIDATION CASCADE.
🔍 4. WHAT DOES THIS MEAN FOR THE CRYPTO MARKET?
The liquidation imbalance reveals several important market signals:
1. Excessive bullish leverage has been flushed out
The massive $1.922 billion in LONG liquidations suggests that many bullish traders were positioned on the wrong side of the market.
2. Market volatility could increase
After such a large liquidation event, prices may experience sharp movements in either direction.
3. A potential recovery is possible
When excessive leveraged positions are cleared, the market may find opportunities to stabilize and recover. However, a reversal is not guaranteed.
📊 5. WHAT SHOULD TRADERS WATCH NEXT?
Before taking a new LONG or SHORT position, monitor these indicators:
Open Interest (OI): Is leveraged positioning increasing or decreasing?Funding Rate: Are LONG or SHORT traders paying more?RSI: Is momentum showing oversold or overbought conditions?EMA 20/50: Is the short-term trend bullish or bearish?Trading Volume: Are buyers returning or are sellers still dominant?Liquidation Heatmap: Where are the major potential liquidation clusters?
These indicators can help traders understand whether the market is preparing for a recovery or another downward move.
🎯 6. FINAL MARKET OUTLOOK
My current assessment: HIGH VOLATILITY – CAUTIOUS MARKET OUTLOOK.
The $2.058 billion liquidation event demonstrates how dangerous excessive leverage can become during a sudden market decline.
However, traders should not automatically assume that the market will pump after a major liquidation event.
If buying pressure returns and Bitcoin and Ethereum reclaim important resistance levels, a recovery could develop.
On the other hand, continued selling pressure could trigger another wave of liquidations.
My trading strategy:
Avoid chasing sudden price movements.Wait for confirmation before entering.Monitor BTC and ETH market structure.Always use appropriate stop-loss protection.Avoid excessive leverage.
🔥 FINAL QUESTION
What happens next?
🚀 Will Bitcoin and Ethereum recover after this massive liquidation?
📉 Or are we about to witness another major crypto market crash?
Share your thoughts in the comments!
Remember: In futures trading, protecting your capital is more important than chasing profits.
#Crypto #Bitcoin #Ethereum #BTC #ETH
{spot}(BNBUSDT)
{spot}(ETHUSDT)
{spot}(BTCUSDT)
CRYPTO MARKET BLOODBATH: $2.05 BILLION LIQUIDATED IN 24 HOURS! 329,339 TRADERS WIPED OUT!
The crypto market has witnessed a massive liquidation event, with leveraged LONG traders taking the biggest hit. Is this the beginning of another crash or a potential market reversal?
📉 1. MASSIVE CRYPTO LIQUIDATIONS
According to CoinGlass data reported by BlockBeats on November 15, total crypto futures liquidations reached an astonishing $2.058 BILLION within 24 hours.
Here is the breakdown:
🔴 LONG Liquidations:
$1.922 BillionApproximately 93% of total liquidations.
🟢 SHORT Liquidations:
$142 MillionApproximately 7% of total liquidations.
👥 Total Liquidated Traders: 329,339
This massive imbalance shows that leveraged bullish traders suffered the majority of the losses as cryptocurrency prices declined.
🐋 2. BIGGEST SINGLE LIQUIDATION
One of the most significant liquidations occurred on Binance.
Trading Pair: ETH/USDTLiquidation Value: $16.17 MillionExchange: Binance
A single ETHUSDT position worth $16.17 million was liquidated, highlighting the enormous risks associated with highly leveraged futures trading.
⚠️ 3. WHY DID SO MANY LONG TRADERS GET LIQUIDATED?
When traders use high leverage, even a relatively small price movement against their positions can trigger forced liquidation.
As prices decline:
Leveraged LONG positions begin losing value.Margin levels approach liquidation thresholds.Exchanges automatically close vulnerable positions.Forced selling can add further downward pressure.More leveraged traders may get liquidated.
This creates a chain reaction known as a LONG LIQUIDATION CASCADE.
🔍 4. WHAT DOES THIS MEAN FOR THE CRYPTO MARKET?
The liquidation imbalance reveals several important market signals:
1. Excessive bullish leverage has been flushed out
The massive $1.922 billion in LONG liquidations suggests that many bullish traders were positioned on the wrong side of the market.
2. Market volatility could increase
After such a large liquidation event, prices may experience sharp movements in either direction.
3. A potential recovery is possible
When excessive leveraged positions are cleared, the market may find opportunities to stabilize and recover. However, a reversal is not guaranteed.
📊 5. WHAT SHOULD TRADERS WATCH NEXT?
Before taking a new LONG or SHORT position, monitor these indicators:
Open Interest (OI): Is leveraged positioning increasing or decreasing?Funding Rate: Are LONG or SHORT traders paying more?RSI: Is momentum showing oversold or overbought conditions?EMA 20/50: Is the short-term trend bullish or bearish?Trading Volume: Are buyers returning or are sellers still dominant?Liquidation Heatmap: Where are the major potential liquidation clusters?
These indicators can help traders understand whether the market is preparing for a recovery or another downward move.
🎯 6. FINAL MARKET OUTLOOK
My current assessment: HIGH VOLATILITY – CAUTIOUS MARKET OUTLOOK.
The $2.058 billion liquidation event demonstrates how dangerous excessive leverage can become during a sudden market decline.
However, traders should not automatically assume that the market will pump after a major liquidation event.
If buying pressure returns and Bitcoin and Ethereum reclaim important resistance levels, a recovery could develop.
On the other hand, continued selling pressure could trigger another wave of liquidations.
My trading strategy:
Avoid chasing sudden price movements.Wait for confirmation before entering.Monitor BTC and ETH market structure.Always use appropriate stop-loss protection.Avoid excessive leverage.
🔥 FINAL QUESTION
What happens next?
🚀 Will Bitcoin and Ethereum recover after this massive liquidation?
📉 Or are we about to witness another major crypto market crash?
Share your thoughts in the comments!
Remember: In futures trading, protecting your capital is more important than chasing profits.
#Crypto #Bitcoin #Ethereum #BTC #ETH
📉 1. MASSIVE CRYPTO LIQUIDATIONS
According to CoinGlass data reported by BlockBeats on November 15, total crypto futures liquidations reached an astonishing $2.058 BILLION within 24 hours.
Here is the breakdown:
🔴 LONG Liquidations:
$1.922 BillionApproximately 93% of total liquidations.
🟢 SHORT Liquidations:
$142 MillionApproximately 7% of total liquidations.
👥 Total Liquidated Traders: 329,339
This massive imbalance shows that leveraged bullish traders suffered the majority of the losses as cryptocurrency prices declined.
🐋 2. BIGGEST SINGLE LIQUIDATION
One of the most significant liquidations occurred on Binance.
Trading Pair: ETH/USDTLiquidation Value: $16.17 MillionExchange: Binance
A single ETHUSDT position worth $16.17 million was liquidated, highlighting the enormous risks associated with highly leveraged futures trading.
⚠️ 3. WHY DID SO MANY LONG TRADERS GET LIQUIDATED?
When traders use high leverage, even a relatively small price movement against their positions can trigger forced liquidation.
As prices decline:
Leveraged LONG positions begin losing value.Margin levels approach liquidation thresholds.Exchanges automatically close vulnerable positions.Forced selling can add further downward pressure.More leveraged traders may get liquidated.
This creates a chain reaction known as a LONG LIQUIDATION CASCADE.
🔍 4. WHAT DOES THIS MEAN FOR THE CRYPTO MARKET?
The liquidation imbalance reveals several important market signals:
1. Excessive bullish leverage has been flushed out
The massive $1.922 billion in LONG liquidations suggests that many bullish traders were positioned on the wrong side of the market.
2. Market volatility could increase
After such a large liquidation event, prices may experience sharp movements in either direction.
3. A potential recovery is possible
When excessive leveraged positions are cleared, the market may find opportunities to stabilize and recover. However, a reversal is not guaranteed.
📊 5. WHAT SHOULD TRADERS WATCH NEXT?
Before taking a new LONG or SHORT position, monitor these indicators:
Open Interest (OI): Is leveraged positioning increasing or decreasing?Funding Rate: Are LONG or SHORT traders paying more?RSI: Is momentum showing oversold or overbought conditions?EMA 20/50: Is the short-term trend bullish or bearish?Trading Volume: Are buyers returning or are sellers still dominant?Liquidation Heatmap: Where are the major potential liquidation clusters?
These indicators can help traders understand whether the market is preparing for a recovery or another downward move.
🎯 6. FINAL MARKET OUTLOOK
My current assessment: HIGH VOLATILITY – CAUTIOUS MARKET OUTLOOK.
The $2.058 billion liquidation event demonstrates how dangerous excessive leverage can become during a sudden market decline.
However, traders should not automatically assume that the market will pump after a major liquidation event.
If buying pressure returns and Bitcoin and Ethereum reclaim important resistance levels, a recovery could develop.
On the other hand, continued selling pressure could trigger another wave of liquidations.
My trading strategy:
Avoid chasing sudden price movements.Wait for confirmation before entering.Monitor BTC and ETH market structure.Always use appropriate stop-loss protection.Avoid excessive leverage.
🔥 FINAL QUESTION
What happens next?
🚀 Will Bitcoin and Ethereum recover after this massive liquidation?
📉 Or are we about to witness another major crypto market crash?
Share your thoughts in the comments!
Remember: In futures trading, protecting your capital is more important than chasing profits.
#Crypto #Bitcoin #Ethereum #BTC #ETH
1
1
83
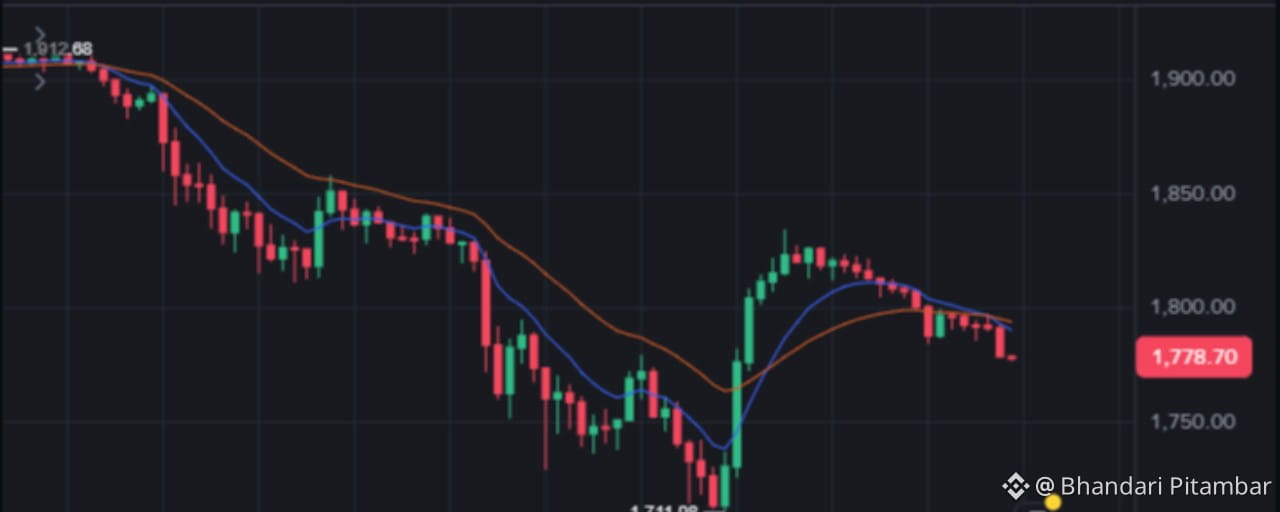
ບົດຄວາມ
ETH/USDT Alert: $1,778 Critical Level – Is Ethereum Heading for $1,700 or Ready to Bounce?Date: November 15, 2026
Asset: ETH/USDT
Timeframe: 15-Minute Chart
Ethereum (ETH) is facing a crucial test of support today. After a volatile session that saw prices swing from $1,912 down to $1,711, the second-largest cryptocurrency is now struggling to find its footing. With the price hovering at $1,778.70, traders are asking: Is this the bottom, or is there more pain to come? Let’s break down the charts.
📊 Market Overview: The Macro Headwinds
The broader crypto market is feeling the weight of a strong Dollar Index (DXY) and cautious Federal Reserve policies. Risk assets are under pressure globally. In this environment, Bitcoin Dominance is rising, leaving altcoins like ETH to fight for liquidity. The current market sentiment is "Fear," with traders moving to stablecoins (USDT) to wait for clearer signals.
🔍 Technical Analysis: ETH/USDT (15m)
The 15-minute chart paints a picture of a short-term downtrend within a larger consolidation.
The "Lower High" Structure: ETH bounced strongly from the $1,711.08 low, reaching up to ~$1,830. However, buyers couldn't sustain the momentum. The price has since formed lower highs and is currently drifting down toward the $1,778 level.EMA Resistance: The price is trading below the key Exponential Moving Averages (the blue and orange lines on the chart), which are converging around $1,800 - $1,810. These EMAs are now acting as a ceiling. Until ETH closes a 15m candle above $1,810, the bears are in control.RSI Oversold: The RSI (6) is sitting at approximately 30.39. This is a critical level. It indicates that the asset is oversold in the short term. While the trend is down, a technical bounce or sideways consolidation is highly likely here as selling pressure exhausts itself.
🐋 Whale Watch & Futures Data
Liquidations: The drop from $1,830 to $1,778 has likely triggered a cascade of long liquidations.Support Zone: The $1,711 level is the "line in the sand." If whales are accumulating, they will defend this level. A break below $1,700 would be extremely bearish and could trigger a flush to $1,650.Institutional Flows: With ETH ETF flows likely stagnant in this macro environment, retail sentiment is driving the short-term price action.
🎯 Key Levels to Watch
🔴 Resistance 1: $1,800 - $1,810 (The EMA Cluster - Immediate Hurdle)🔴 Resistance 2: $1,830 (Recent Local High)🟢 Support 1: $1,750 (Psychological/Minor Support)🟢 Support 2: $1,711 (The "Line in the Sand" - Major Swing Low)
🔮 Final Prediction: PUMP, DUMP, or SIDEWAYS?
Verdict: MOVE SIDEWAYS / BEARISH BIAS 📉 (Short Term)
ETH is currently stuck in a tight range with a downward tilt. The rejection at the EMAs is concerning for bulls.
The Bearish Scenario: If the price fails to reclaim $1,800, we will likely see a slow grind down to retest the $1,711 low. A break below $1,711 opens the door to $1,680.The Bullish Scenario: Because the RSI is oversold (~30), a sharp relief bounce is possible. If buyers step in here, we could see a push back to $1,800. A sustained move above $1,810 would invalidate the bearish thesis and target $1,850.
Strategy:
Aggressive Traders: Look for long entries near $1,711 - $1,720 with a tight stop loss below $1,700, targeting a bounce to $1,800.Conservative Traders: Wait for a confirmed breakout above $1,810 to enter longs, or wait for a breakdown below $1,711 to short.Current Zone: The $1,778 area is "no man's land." It is risky to enter right here.
Disclaimer: This analysis is for educational purposes only. Crypto markets are highly volatile. Do your own research (DYOR) before trading.
#ETH #Ethereum #CryptoAnalysis #BinanceSquare #TechnicalAnalysis
{spot}(ETHUSDT)
ETH/USDT Alert: $1,778 Critical Level – Is Ethereum Heading for $1,700 or Ready to Bounce?
Date: November 15, 2026
Asset: ETH/USDT
Timeframe: 15-Minute Chart
Ethereum (ETH) is facing a crucial test of support today. After a volatile session that saw prices swing from $1,912 down to $1,711, the second-largest cryptocurrency is now struggling to find its footing. With the price hovering at $1,778.70, traders are asking: Is this the bottom, or is there more pain to come? Let’s break down the charts.
📊 Market Overview: The Macro Headwinds
The broader crypto market is feeling the weight of a strong Dollar Index (DXY) and cautious Federal Reserve policies. Risk assets are under pressure globally. In this environment, Bitcoin Dominance is rising, leaving altcoins like ETH to fight for liquidity. The current market sentiment is "Fear," with traders moving to stablecoins (USDT) to wait for clearer signals.
🔍 Technical Analysis: ETH/USDT (15m)
The 15-minute chart paints a picture of a short-term downtrend within a larger consolidation.
The "Lower High" Structure: ETH bounced strongly from the $1,711.08 low, reaching up to ~$1,830. However, buyers couldn't sustain the momentum. The price has since formed lower highs and is currently drifting down toward the $1,778 level.EMA Resistance: The price is trading below the key Exponential Moving Averages (the blue and orange lines on the chart), which are converging around $1,800 - $1,810. These EMAs are now acting as a ceiling. Until ETH closes a 15m candle above $1,810, the bears are in control.RSI Oversold: The RSI (6) is sitting at approximately 30.39. This is a critical level. It indicates that the asset is oversold in the short term. While the trend is down, a technical bounce or sideways consolidation is highly likely here as selling pressure exhausts itself.
🐋 Whale Watch & Futures Data
Liquidations: The drop from $1,830 to $1,778 has likely triggered a cascade of long liquidations.Support Zone: The $1,711 level is the "line in the sand." If whales are accumulating, they will defend this level. A break below $1,700 would be extremely bearish and could trigger a flush to $1,650.Institutional Flows: With ETH ETF flows likely stagnant in this macro environment, retail sentiment is driving the short-term price action.
🎯 Key Levels to Watch
🔴 Resistance 1: $1,800 - $1,810 (The EMA Cluster - Immediate Hurdle)🔴 Resistance 2: $1,830 (Recent Local High)🟢 Support 1: $1,750 (Psychological/Minor Support)🟢 Support 2: $1,711 (The "Line in the Sand" - Major Swing Low)
🔮 Final Prediction: PUMP, DUMP, or SIDEWAYS?
Verdict: MOVE SIDEWAYS / BEARISH BIAS 📉 (Short Term)
ETH is currently stuck in a tight range with a downward tilt. The rejection at the EMAs is concerning for bulls.
The Bearish Scenario: If the price fails to reclaim $1,800, we will likely see a slow grind down to retest the $1,711 low. A break below $1,711 opens the door to $1,680.The Bullish Scenario: Because the RSI is oversold (~30), a sharp relief bounce is possible. If buyers step in here, we could see a push back to $1,800. A sustained move above $1,810 would invalidate the bearish thesis and target $1,850.
Strategy:
Aggressive Traders: Look for long entries near $1,711 - $1,720 with a tight stop loss below $1,700, targeting a bounce to $1,800.Conservative Traders: Wait for a confirmed breakout above $1,810 to enter longs, or wait for a breakdown below $1,711 to short.Current Zone: The $1,778 area is "no man's land." It is risky to enter right here.
Disclaimer: This analysis is for educational purposes only. Crypto markets are highly volatile. Do your own research (DYOR) before trading.
#ETH #Ethereum #CryptoAnalysis #BinanceSquare #TechnicalAnalysis
Asset: ETH/USDT
Timeframe: 15-Minute Chart
Ethereum (ETH) is facing a crucial test of support today. After a volatile session that saw prices swing from $1,912 down to $1,711, the second-largest cryptocurrency is now struggling to find its footing. With the price hovering at $1,778.70, traders are asking: Is this the bottom, or is there more pain to come? Let’s break down the charts.
📊 Market Overview: The Macro Headwinds
The broader crypto market is feeling the weight of a strong Dollar Index (DXY) and cautious Federal Reserve policies. Risk assets are under pressure globally. In this environment, Bitcoin Dominance is rising, leaving altcoins like ETH to fight for liquidity. The current market sentiment is "Fear," with traders moving to stablecoins (USDT) to wait for clearer signals.
🔍 Technical Analysis: ETH/USDT (15m)
The 15-minute chart paints a picture of a short-term downtrend within a larger consolidation.
The "Lower High" Structure: ETH bounced strongly from the $1,711.08 low, reaching up to ~$1,830. However, buyers couldn't sustain the momentum. The price has since formed lower highs and is currently drifting down toward the $1,778 level.EMA Resistance: The price is trading below the key Exponential Moving Averages (the blue and orange lines on the chart), which are converging around $1,800 - $1,810. These EMAs are now acting as a ceiling. Until ETH closes a 15m candle above $1,810, the bears are in control.RSI Oversold: The RSI (6) is sitting at approximately 30.39. This is a critical level. It indicates that the asset is oversold in the short term. While the trend is down, a technical bounce or sideways consolidation is highly likely here as selling pressure exhausts itself.
🐋 Whale Watch & Futures Data
Liquidations: The drop from $1,830 to $1,778 has likely triggered a cascade of long liquidations.Support Zone: The $1,711 level is the "line in the sand." If whales are accumulating, they will defend this level. A break below $1,700 would be extremely bearish and could trigger a flush to $1,650.Institutional Flows: With ETH ETF flows likely stagnant in this macro environment, retail sentiment is driving the short-term price action.
🎯 Key Levels to Watch
🔴 Resistance 1: $1,800 - $1,810 (The EMA Cluster - Immediate Hurdle)🔴 Resistance 2: $1,830 (Recent Local High)🟢 Support 1: $1,750 (Psychological/Minor Support)🟢 Support 2: $1,711 (The "Line in the Sand" - Major Swing Low)
🔮 Final Prediction: PUMP, DUMP, or SIDEWAYS?
Verdict: MOVE SIDEWAYS / BEARISH BIAS 📉 (Short Term)
ETH is currently stuck in a tight range with a downward tilt. The rejection at the EMAs is concerning for bulls.
The Bearish Scenario: If the price fails to reclaim $1,800, we will likely see a slow grind down to retest the $1,711 low. A break below $1,711 opens the door to $1,680.The Bullish Scenario: Because the RSI is oversold (~30), a sharp relief bounce is possible. If buyers step in here, we could see a push back to $1,800. A sustained move above $1,810 would invalidate the bearish thesis and target $1,850.
Strategy:
Aggressive Traders: Look for long entries near $1,711 - $1,720 with a tight stop loss below $1,700, targeting a bounce to $1,800.Conservative Traders: Wait for a confirmed breakout above $1,810 to enter longs, or wait for a breakdown below $1,711 to short.Current Zone: The $1,778 area is "no man's land." It is risky to enter right here.
Disclaimer: This analysis is for educational purposes only. Crypto markets are highly volatile. Do your own research (DYOR) before trading.
#ETH #Ethereum #CryptoAnalysis #BinanceSquare #TechnicalAnalysis
1
1
37
ບົດຄວາມ
DOGE/USDT Alert: Critical Support Tested as Bears Take Control – What's Next?Date: November 15, 2026
Asset: DOGE/USDT
Timeframe: 15-Minute Chart
The crypto market is witnessing a tug-of-war today, and Dogecoin (DOGE) is currently feeling the pressure. After a volatile session that saw prices swing from $0.063 down to $0.055, DOGE is now caught in a slow grind. Are we looking at a accumulation zone or a prelude to another drop? Let’s dive into the charts.
📊 Market Overview: The Big Picture
The broader crypto market is showing signs of fatigue. With Bitcoin dominance likely remaining high, altcoins like DOGE are struggling to find independent momentum. The macroeconomic environment—characterized by cautious Federal Reserve policies and a strong Dollar Index (DXY)—has kept risk assets under pressure. Today, DOGE is trading at $0.05776, down roughly 0.36% on the session.
🔍 Technical Analysis: DOGE/USDT (15m)
Looking at the 15-minute chart, the structure is telling a clear story of short-term weakness.
The "Lower High" Pattern: After bouncing from the local low of $0.05543, buyers pushed the price up to nearly $0.05950. However, they failed to hold the ground. The price has since printed lower highs, indicating that sellers are stepping in at every rally.EMA Resistance: The price is currently trading below the key moving averages.EMA(9): $0.05799EMA(24): $0.05806The fact that the price ($0.05776) is below both these lines creates a "ceiling" effect. Until DOGE reclaims $0.05810, the bears are in control.RSI Weakness: The Relative Strength Index (RSI 6) is sitting at 34.52. This is in the lower quadrant. While it’s not fully "oversold" (which would be below 30), it shows that momentum is heavily skewed to the downside.
🐋 Whale Watch & Futures Data
Open Interest: We are seeing a gradual decline in Open Interest, suggesting that leveraged longs are being flushed out or are voluntarily closing positions.Support Zone: The $0.05543 level is critical. This is where the recent bounce originated. If whales are accumulating, they will likely defend this level aggressively.
🎯 Key Levels to Watch
🔴 Resistance 1: $0.05800 - $0.05810 (The EMA Cluster - Immediate Hurdle)🔴 Resistance 2: $0.05950 (Recent Local High)🟢 Support 1: $0.05700 (Psychological/Minor Support)🟢 Support 2: $0.05543 (The "Line in the Sand")
🔮 Final Prediction: PUMP, DUMP, or SIDEWAYS?
Verdict: MOVE SIDEWAYS with Bearish Bias 📉
Currently, DOGE is in a "no man's land." It is slowly bleeding value as it fails to break the EMA resistance.
The Bearish Scenario (Most Likely Short-Term): If the price gets rejected at $0.05800 again, we will likely see a retest of the $0.05543 low. A break below this level could trigger a dump toward $0.05200.The Bullish Scenario: For a pump to occur, DOGE needs a high-volume candle to close above $0.05810. This would invalidate the short-term bearish trend and target $0.06000.
Strategy: Traders should wait for a clear breakout. Longing here is risky as the trend is down. Shorting is also risky as RSI is getting low. Patience is key. Wait for the retest of $0.05543 for a potential long entry, or wait for a break of $0.05810 for momentum.
Disclaimer: This analysis is for educational purposes only. Crypto markets are highly volatile. Do your own research (DYOR) before trading.
BEARISH BIAS
DOGE/USDT
Short-term outlook · Based on available evidence
Pump
Conditional
Dump
Higher risk currently
Sideways
Possible near-term
Trading bias: Wait for confirmation rather than entering immediately.
This is a qualitative assessment, not a calculated probability.
15-minute: Bearish while below EMA 9 and EMA 24.1-hour: Not independently confirmed; additional chart data needed.4-hour: Broader market weakness creates downside risk.Daily: Recent large decline means recovery confirmation is important.
MACD, VWAP, EMA 20/50/200, and higher-timeframe RSI cannot be reliably calculated from the supplied screenshot alone.
{spot}(DOGEUSDT)
DOGE/USDT Alert: Critical Support Tested as Bears Take Control – What's Next?
Date: November 15, 2026
Asset: DOGE/USDT
Timeframe: 15-Minute Chart
The crypto market is witnessing a tug-of-war today, and Dogecoin (DOGE) is currently feeling the pressure. After a volatile session that saw prices swing from $0.063 down to $0.055, DOGE is now caught in a slow grind. Are we looking at a accumulation zone or a prelude to another drop? Let’s dive into the charts.
📊 Market Overview: The Big Picture
The broader crypto market is showing signs of fatigue. With Bitcoin dominance likely remaining high, altcoins like DOGE are struggling to find independent momentum. The macroeconomic environment—characterized by cautious Federal Reserve policies and a strong Dollar Index (DXY)—has kept risk assets under pressure. Today, DOGE is trading at $0.05776, down roughly 0.36% on the session.
🔍 Technical Analysis: DOGE/USDT (15m)
Looking at the 15-minute chart, the structure is telling a clear story of short-term weakness.
The "Lower High" Pattern: After bouncing from the local low of $0.05543, buyers pushed the price up to nearly $0.05950. However, they failed to hold the ground. The price has since printed lower highs, indicating that sellers are stepping in at every rally.EMA Resistance: The price is currently trading below the key moving averages.EMA(9): $0.05799EMA(24): $0.05806The fact that the price ($0.05776) is below both these lines creates a "ceiling" effect. Until DOGE reclaims $0.05810, the bears are in control.RSI Weakness: The Relative Strength Index (RSI 6) is sitting at 34.52. This is in the lower quadrant. While it’s not fully "oversold" (which would be below 30), it shows that momentum is heavily skewed to the downside.
🐋 Whale Watch & Futures Data
Open Interest: We are seeing a gradual decline in Open Interest, suggesting that leveraged longs are being flushed out or are voluntarily closing positions.Support Zone: The $0.05543 level is critical. This is where the recent bounce originated. If whales are accumulating, they will likely defend this level aggressively.
🎯 Key Levels to Watch
🔴 Resistance 1: $0.05800 - $0.05810 (The EMA Cluster - Immediate Hurdle)🔴 Resistance 2: $0.05950 (Recent Local High)🟢 Support 1: $0.05700 (Psychological/Minor Support)🟢 Support 2: $0.05543 (The "Line in the Sand")
🔮 Final Prediction: PUMP, DUMP, or SIDEWAYS?
Verdict: MOVE SIDEWAYS with Bearish Bias 📉
Currently, DOGE is in a "no man's land." It is slowly bleeding value as it fails to break the EMA resistance.
The Bearish Scenario (Most Likely Short-Term): If the price gets rejected at $0.05800 again, we will likely see a retest of the $0.05543 low. A break below this level could trigger a dump toward $0.05200.The Bullish Scenario: For a pump to occur, DOGE needs a high-volume candle to close above $0.05810. This would invalidate the short-term bearish trend and target $0.06000.
Strategy: Traders should wait for a clear breakout. Longing here is risky as the trend is down. Shorting is also risky as RSI is getting low. Patience is key. Wait for the retest of $0.05543 for a potential long entry, or wait for a break of $0.05810 for momentum.
Disclaimer: This analysis is for educational purposes only. Crypto markets are highly volatile. Do your own research (DYOR) before trading.
BEARISH BIAS
DOGE/USDT
Short-term outlook · Based on available evidence
Pump
Conditional
Dump
Higher risk currently
Sideways
Possible near-term
Trading bias: Wait for confirmation rather than entering immediately.
This is a qualitative assessment, not a calculated probability.
15-minute: Bearish while below EMA 9 and EMA 24.1-hour: Not independently confirmed; additional chart data needed.4-hour: Broader market weakness creates downside risk.Daily: Recent large decline means recovery confirmation is important.
MACD, VWAP, EMA 20/50/200, and higher-timeframe RSI cannot be reliably calculated from the supplied screenshot alone.
Asset: DOGE/USDT
Timeframe: 15-Minute Chart
The crypto market is witnessing a tug-of-war today, and Dogecoin (DOGE) is currently feeling the pressure. After a volatile session that saw prices swing from $0.063 down to $0.055, DOGE is now caught in a slow grind. Are we looking at a accumulation zone or a prelude to another drop? Let’s dive into the charts.
📊 Market Overview: The Big Picture
The broader crypto market is showing signs of fatigue. With Bitcoin dominance likely remaining high, altcoins like DOGE are struggling to find independent momentum. The macroeconomic environment—characterized by cautious Federal Reserve policies and a strong Dollar Index (DXY)—has kept risk assets under pressure. Today, DOGE is trading at $0.05776, down roughly 0.36% on the session.
🔍 Technical Analysis: DOGE/USDT (15m)
Looking at the 15-minute chart, the structure is telling a clear story of short-term weakness.
The "Lower High" Pattern: After bouncing from the local low of $0.05543, buyers pushed the price up to nearly $0.05950. However, they failed to hold the ground. The price has since printed lower highs, indicating that sellers are stepping in at every rally.EMA Resistance: The price is currently trading below the key moving averages.EMA(9): $0.05799EMA(24): $0.05806The fact that the price ($0.05776) is below both these lines creates a "ceiling" effect. Until DOGE reclaims $0.05810, the bears are in control.RSI Weakness: The Relative Strength Index (RSI 6) is sitting at 34.52. This is in the lower quadrant. While it’s not fully "oversold" (which would be below 30), it shows that momentum is heavily skewed to the downside.
🐋 Whale Watch & Futures Data
Open Interest: We are seeing a gradual decline in Open Interest, suggesting that leveraged longs are being flushed out or are voluntarily closing positions.Support Zone: The $0.05543 level is critical. This is where the recent bounce originated. If whales are accumulating, they will likely defend this level aggressively.
🎯 Key Levels to Watch
🔴 Resistance 1: $0.05800 - $0.05810 (The EMA Cluster - Immediate Hurdle)🔴 Resistance 2: $0.05950 (Recent Local High)🟢 Support 1: $0.05700 (Psychological/Minor Support)🟢 Support 2: $0.05543 (The "Line in the Sand")
🔮 Final Prediction: PUMP, DUMP, or SIDEWAYS?
Verdict: MOVE SIDEWAYS with Bearish Bias 📉
Currently, DOGE is in a "no man's land." It is slowly bleeding value as it fails to break the EMA resistance.
The Bearish Scenario (Most Likely Short-Term): If the price gets rejected at $0.05800 again, we will likely see a retest of the $0.05543 low. A break below this level could trigger a dump toward $0.05200.The Bullish Scenario: For a pump to occur, DOGE needs a high-volume candle to close above $0.05810. This would invalidate the short-term bearish trend and target $0.06000.
Strategy: Traders should wait for a clear breakout. Longing here is risky as the trend is down. Shorting is also risky as RSI is getting low. Patience is key. Wait for the retest of $0.05543 for a potential long entry, or wait for a break of $0.05810 for momentum.
Disclaimer: This analysis is for educational purposes only. Crypto markets are highly volatile. Do your own research (DYOR) before trading.
BEARISH BIAS
DOGE/USDT
Short-term outlook · Based on available evidence
Pump
Conditional
Dump
Higher risk currently
Sideways
Possible near-term
Trading bias: Wait for confirmation rather than entering immediately.
This is a qualitative assessment, not a calculated probability.
15-minute: Bearish while below EMA 9 and EMA 24.1-hour: Not independently confirmed; additional chart data needed.4-hour: Broader market weakness creates downside risk.Daily: Recent large decline means recovery confirmation is important.
MACD, VWAP, EMA 20/50/200, and higher-timeframe RSI cannot be reliably calculated from the supplied screenshot alone.
1
1
58
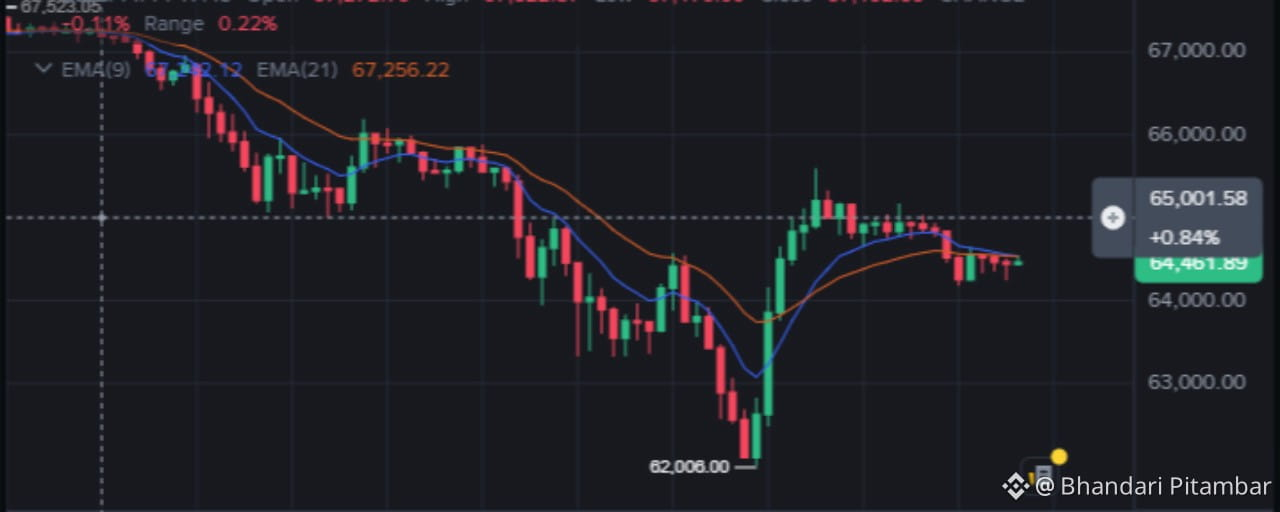
ບົດຄວາມ
BITCOIN PRICE PREDICTION: BTCUSDT BEARS TAKE CONTROL! WILL BTC CRASH BELOW $62,000 OR REBOUND?PART 1 — MARKET ANALYSIS (BTC/USDT Focus | Data as of Nov 15, 2026)
1. Global Macro
Inflation/Fed: October US PPI came in hot at +6.5% YoY, shifting market pricing toward a possible December Fed rate hike — a major risk-off driver for the Nov 13–14 selloff (Binance Research, via CoinStats, Nov 13).Risk assets: The macro shock hit crypto in parallel with equities-sensitive assets; a hike-leaning Fed implies a firmer dollar environment, which historically caps risk-asset rallies (analytical inference, not a verified DXY print).Geopolitics/regulation: US DOJ is pursuing $1.2B in stolen crypto tied to the Oct 29 Binance hack; the US Senate's Permanent Subcommittee on Investigations demanded Binance/Tether records by Jan 4, 2027; a FinCEN order takes effect Dec 10 (Binance to reject MEXC-linked transfers). Regulatory overhang = sustained caution.
2. Market Structure
Total crypto market cap: $2.18T, −4.29% in 24h (CoinMarketCap, Nov 15).BTC dominance: 59.4% (ETH 10.0%) — BTC still absorbs most liquidity; altcoin season is off the table in this tape.Sentiment: Fear & Greed fell from 21 (Nov 13) to 12/100 — Extreme Fear (Nov 15). In risk-off phases like this, capital typically rotates into stablecoins, lifting USDT dominance — a structural headwind for alts (general market mechanic, labeled as analysis).
3. Technicals (your 15m chart + verified price history)
Price: $64,461.89 at your chart snapshot (Nov 14, 17:45), +0.84% on the bounce session. BTC broke below $69,000 on Nov 13 with a ~4.3% daily drop, tagged a 62,000.00 swing low, then V-bounced to ~65,500–65,800 and is now compressing.15m: Price pinned between EMA(9) (~64,500) and a declining EMA(21); RSI(6) = 41.54 — neutral-weak, no momentum edge. Range compression after a V-bounce usually resolves with the higher-timeframe trend (currently down).1H/4H: Relief bounce inside a descending structure; the bounce printed a lower high (~65,200s) after 65,800 — bears still control retries. A 4H close above 66,000 is the minimum needed to invalidate the immediate downtrend.Daily: A −10% weekly impulse (69K → 62K) leaves short/mid moving averages stacked above price as dynamic resistance (structural inference from verified price path). Daily momentum is washed out; mean-reversion bounces are common here, but trend reversal requires reclaiming the 67,600 breakdown origin.
4. Futures & Positioning
Liquidations: >$1.9B market-wide in 24h (Nov 14); longs took ~89% of liquidations in major-coin samples (e.g., BNB: 88.7–89.1% longs) — this was a long flush, not a short attack.Open interest: Falling OI alongside falling price (BNB sample: −4.74% in 2 days) indicates orderly long unwinding, not fresh short conviction — conditions that allow bounces but not reversals.Funding: Near-neutral (BNB sample: +0.0034%/8h) — nobody is paying up for leverage; conviction is absent on both sides.
5. Whales, Institutions & ETFs
Spot Bitcoin ETFs: Continued outflows reported Nov 13 — institutional bid is absent exactly where it's needed.Cross-check: VanEck's BNB ETF logged zero net flows for consecutive sessions — institutional caution is market-wide, not BTC-specific.Whales: Distribution confirmed in alts (10M–100M ADA wallets sold ~50M ADA, Nov 4–10). For BTC, the dominant "whale" story is exchange-level: Binance fully replenished hack losses via SAFU/treasury and published a Proof-of-Reserves snapshot (Nov 12); the zero-knowledge proof verification was still computing (40–50h). An earlier reported $3.64B net outflow figure remains unverified — treat with caution.
6. News & Sentiment Calendar
Extreme Fear (12) + hack overhang + hot PPI = the three pillars of current bearish sentiment.Upcoming catalysts: December FOMC (hike odds), Binance ZK-PoR verification result, Dec 10 FinCEN order, Jan 4 Senate records deadline.
🎯 PART 2 — FINAL ANALYSIS: BTC/USDT VERDICT
Horizon
Call
Triggers
Targets
Invalidation
Short-term (hrs–3d)
SIDEWAYS → mild pump leg
Hold 64,000; 15m/4H close above 65,800
66,500 → 67,000
Loss of 64,000
Medium-term (1–4w)
DUMP bias
Daily close < 62,000
60,000 psych; below = speculative air pocket toward high-50Ks (labeled speculation)
Daily close > 67,600
Trend flip (bullish)
PUMP
Daily close > 67,600
69,000 → 70,000
Fall back under 66,000
Key levels: Support 64,000 / 62,000 / 60,000 • Resistance 65,500–65,800 / 66,500–67,000 / 67,600 / 69,000.
Strongest major (relative): BNB — smallest drawdown Oct 9–Nov 7 (−5.6% vs SOL −18.5%, XRP −15.9%, Bittime Research), hack fully backstopped, tokenized-equity ecosystem leading ($1.5B bStocks).
Weakest major: ADA — −34.98%/30d, whale distribution, confidence headlines.
📰 PART 3 — BINANCE SQUARE ARTICLE (Ready to Publish)
🚨 Bitcoin at $64,400: Relief Bounce or Bear Trap? The $62,000 Line Decides Everything
The crypto market just lived through one of its most violent weeks of 2026. Bitcoin sliced below $69,000, liquidations exploded past $1.9 billion in 24 hours, and the Fear & Greed Index cratered to 12 — Extreme Fear. Now BTC is coiling at ~$64,460 after a textbook V-bounce off $62,000. The question every trader is asking: is this the bottom, or just fuel for the next leg down?
🌍 Market Overview: Macro Is Driving the Tape
October's US PPI print of +6.5% YoY resurrected something traders never expected to price in late in the cycle: odds of a December Fed rate hike. Add continued spot Bitcoin ETF outflows, a total market cap bleeding to $2.18T (−4.29% in 24h), and BTC dominance pinned at 59.4%, and you have a market where safety outranks speculation. Altseason? Not in this climate.
📉 Bitcoin Technicals: The Battle Map
15-minute chart: After tagging 62,000.00, BTC printed a V-recovery to ~65,800 and is now compressing between its short-term EMAs with RSI(6) at ~41.5 — a market waiting for a catalyst, not a trend.
4-hour chart: The bounce already printed a lower high. Until BTC closes above 66,000, every rally is statistically a guest in a bearish house.
Daily chart: The 69K→62K impulse left moving averages stacked overhead. The 67,600 breakdown origin is the line that separates "bounce" from "reversal."
Key levels:
🟢 Support: 64,000 → 62,000 → 60,000🔴 Resistance: 65,500–65,800 → 66,500–67,000 → 67,600 → 69,000
🐂 Bullish vs 🐻 Bearish Scenarios
🐂 The Pump Case: 64,000 holds, 65,800 falls with volume → targets 66,500–67,000. A daily close above 67,600 flips structure and opens 69,000–70,000. Oversold conditions + exhausted longs (funding near neutral) are classic bounce fuel.
🐻 The Dump Case: Lose 64,000 and the market retests 62,000. A daily close below it exposes the 60,000 psychological floor — and below that, thin liquidity (speculative zone). With ETF outflows ongoing and a hike-leaning Fed, rallies keep meeting sellers.
🐋 Whale & Institutional Tape
The Nov 13–14 flush was a long liquidation event (~89% of liquidated positions were longs) with falling open interest — an orderly deleveraging, not a short ambush. That distinction matters: deleveraged markets bounce harder, but they don't reverse without institutional demand, and spot ETF flows are still negative. Meanwhile, Binance's post-hack Proof-of-Reserves snapshot and completed SAFU replenishment removed one systemic fear — verification of the ZK proof remains the next trust milestone to watch.
🔭 Alt Radar: Who's Strong, Who's Weak
Strongest: BNB — outperformed every major from Oct 9–Nov 7 (−5.6% vs SOL −18.5%, XRP −15.9%), with a fully backstopped exchange balance sheet and a tokenized-equity ecosystem crossing $1.5B.Weakest: ADA — down ~35% in 30 days, hit by whale distribution (~50M ADA sold Nov 4–10) and shaky holder confidence.
🔮 Final Prediction
Short term: sideways-to-up inside a 62,000–66,000 range — a deleveraged bounce in progress.
Medium term: bearish until proven otherwise. 67,600 is the verdict level. Below it, rallies are for trading, not marrying. Below 62,000, the trend resumes with 60,000 in sight.
Extreme Fear readings like 12 have historically marked zones of opportunity — but only for those who wait for confirmation, not those who guess bottoms.
💬 Conclusion
This market isn't paying the brave; it's paying the patient. Watch 64,000 for the day-trade, 66,000 for the swing, and 67,600 for the trend. Manage risk like your portfolio depends on it — because right now, it does.
Not financial advice. Do your own research.
#Bitcoin #BTC #CryptoMarket #TechnicalAnalysis #Fed #WhaleWatch #BinanceSquare #BTCUSDT
{spot}(BNBUSDT)
{spot}(BTCUSDT)
BITCOIN PRICE PREDICTION: BTCUSDT BEARS TAKE CONTROL! WILL BTC CRASH BELOW $62,000 OR REBOUND?
PART 1 — MARKET ANALYSIS (BTC/USDT Focus | Data as of Nov 15, 2026)
1. Global Macro
Inflation/Fed: October US PPI came in hot at +6.5% YoY, shifting market pricing toward a possible December Fed rate hike — a major risk-off driver for the Nov 13–14 selloff (Binance Research, via CoinStats, Nov 13).Risk assets: The macro shock hit crypto in parallel with equities-sensitive assets; a hike-leaning Fed implies a firmer dollar environment, which historically caps risk-asset rallies (analytical inference, not a verified DXY print).Geopolitics/regulation: US DOJ is pursuing $1.2B in stolen crypto tied to the Oct 29 Binance hack; the US Senate's Permanent Subcommittee on Investigations demanded Binance/Tether records by Jan 4, 2027; a FinCEN order takes effect Dec 10 (Binance to reject MEXC-linked transfers). Regulatory overhang = sustained caution.
2. Market Structure
Total crypto market cap: $2.18T, −4.29% in 24h (CoinMarketCap, Nov 15).BTC dominance: 59.4% (ETH 10.0%) — BTC still absorbs most liquidity; altcoin season is off the table in this tape.Sentiment: Fear & Greed fell from 21 (Nov 13) to 12/100 — Extreme Fear (Nov 15). In risk-off phases like this, capital typically rotates into stablecoins, lifting USDT dominance — a structural headwind for alts (general market mechanic, labeled as analysis).
3. Technicals (your 15m chart + verified price history)
Price: $64,461.89 at your chart snapshot (Nov 14, 17:45), +0.84% on the bounce session. BTC broke below $69,000 on Nov 13 with a ~4.3% daily drop, tagged a 62,000.00 swing low, then V-bounced to ~65,500–65,800 and is now compressing.15m: Price pinned between EMA(9) (~64,500) and a declining EMA(21); RSI(6) = 41.54 — neutral-weak, no momentum edge. Range compression after a V-bounce usually resolves with the higher-timeframe trend (currently down).1H/4H: Relief bounce inside a descending structure; the bounce printed a lower high (~65,200s) after 65,800 — bears still control retries. A 4H close above 66,000 is the minimum needed to invalidate the immediate downtrend.Daily: A −10% weekly impulse (69K → 62K) leaves short/mid moving averages stacked above price as dynamic resistance (structural inference from verified price path). Daily momentum is washed out; mean-reversion bounces are common here, but trend reversal requires reclaiming the 67,600 breakdown origin.
4. Futures & Positioning
Liquidations: >$1.9B market-wide in 24h (Nov 14); longs took ~89% of liquidations in major-coin samples (e.g., BNB: 88.7–89.1% longs) — this was a long flush, not a short attack.Open interest: Falling OI alongside falling price (BNB sample: −4.74% in 2 days) indicates orderly long unwinding, not fresh short conviction — conditions that allow bounces but not reversals.Funding: Near-neutral (BNB sample: +0.0034%/8h) — nobody is paying up for leverage; conviction is absent on both sides.
5. Whales, Institutions & ETFs
Spot Bitcoin ETFs: Continued outflows reported Nov 13 — institutional bid is absent exactly where it's needed.Cross-check: VanEck's BNB ETF logged zero net flows for consecutive sessions — institutional caution is market-wide, not BTC-specific.Whales: Distribution confirmed in alts (10M–100M ADA wallets sold ~50M ADA, Nov 4–10). For BTC, the dominant "whale" story is exchange-level: Binance fully replenished hack losses via SAFU/treasury and published a Proof-of-Reserves snapshot (Nov 12); the zero-knowledge proof verification was still computing (40–50h). An earlier reported $3.64B net outflow figure remains unverified — treat with caution.
6. News & Sentiment Calendar
Extreme Fear (12) + hack overhang + hot PPI = the three pillars of current bearish sentiment.Upcoming catalysts: December FOMC (hike odds), Binance ZK-PoR verification result, Dec 10 FinCEN order, Jan 4 Senate records deadline.
🎯 PART 2 — FINAL ANALYSIS: BTC/USDT VERDICT
Horizon
Call
Triggers
Targets
Invalidation
Short-term (hrs–3d)
SIDEWAYS → mild pump leg
Hold 64,000; 15m/4H close above 65,800
66,500 → 67,000
Loss of 64,000
Medium-term (1–4w)
DUMP bias
Daily close < 62,000
60,000 psych; below = speculative air pocket toward high-50Ks (labeled speculation)
Daily close > 67,600
Trend flip (bullish)
PUMP
Daily close > 67,600
69,000 → 70,000
Fall back under 66,000
Key levels: Support 64,000 / 62,000 / 60,000 • Resistance 65,500–65,800 / 66,500–67,000 / 67,600 / 69,000.
Strongest major (relative): BNB — smallest drawdown Oct 9–Nov 7 (−5.6% vs SOL −18.5%, XRP −15.9%, Bittime Research), hack fully backstopped, tokenized-equity ecosystem leading ($1.5B bStocks).
Weakest major: ADA — −34.98%/30d, whale distribution, confidence headlines.
📰 PART 3 — BINANCE SQUARE ARTICLE (Ready to Publish)
🚨 Bitcoin at $64,400: Relief Bounce or Bear Trap? The $62,000 Line Decides Everything
The crypto market just lived through one of its most violent weeks of 2026. Bitcoin sliced below $69,000, liquidations exploded past $1.9 billion in 24 hours, and the Fear & Greed Index cratered to 12 — Extreme Fear. Now BTC is coiling at ~$64,460 after a textbook V-bounce off $62,000. The question every trader is asking: is this the bottom, or just fuel for the next leg down?
🌍 Market Overview: Macro Is Driving the Tape
October's US PPI print of +6.5% YoY resurrected something traders never expected to price in late in the cycle: odds of a December Fed rate hike. Add continued spot Bitcoin ETF outflows, a total market cap bleeding to $2.18T (−4.29% in 24h), and BTC dominance pinned at 59.4%, and you have a market where safety outranks speculation. Altseason? Not in this climate.
📉 Bitcoin Technicals: The Battle Map
15-minute chart: After tagging 62,000.00, BTC printed a V-recovery to ~65,800 and is now compressing between its short-term EMAs with RSI(6) at ~41.5 — a market waiting for a catalyst, not a trend.
4-hour chart: The bounce already printed a lower high. Until BTC closes above 66,000, every rally is statistically a guest in a bearish house.
Daily chart: The 69K→62K impulse left moving averages stacked overhead. The 67,600 breakdown origin is the line that separates "bounce" from "reversal."
Key levels:
🟢 Support: 64,000 → 62,000 → 60,000🔴 Resistance: 65,500–65,800 → 66,500–67,000 → 67,600 → 69,000
🐂 Bullish vs 🐻 Bearish Scenarios
🐂 The Pump Case: 64,000 holds, 65,800 falls with volume → targets 66,500–67,000. A daily close above 67,600 flips structure and opens 69,000–70,000. Oversold conditions + exhausted longs (funding near neutral) are classic bounce fuel.
🐻 The Dump Case: Lose 64,000 and the market retests 62,000. A daily close below it exposes the 60,000 psychological floor — and below that, thin liquidity (speculative zone). With ETF outflows ongoing and a hike-leaning Fed, rallies keep meeting sellers.
🐋 Whale & Institutional Tape
The Nov 13–14 flush was a long liquidation event (~89% of liquidated positions were longs) with falling open interest — an orderly deleveraging, not a short ambush. That distinction matters: deleveraged markets bounce harder, but they don't reverse without institutional demand, and spot ETF flows are still negative. Meanwhile, Binance's post-hack Proof-of-Reserves snapshot and completed SAFU replenishment removed one systemic fear — verification of the ZK proof remains the next trust milestone to watch.
🔭 Alt Radar: Who's Strong, Who's Weak
Strongest: BNB — outperformed every major from Oct 9–Nov 7 (−5.6% vs SOL −18.5%, XRP −15.9%), with a fully backstopped exchange balance sheet and a tokenized-equity ecosystem crossing $1.5B.Weakest: ADA — down ~35% in 30 days, hit by whale distribution (~50M ADA sold Nov 4–10) and shaky holder confidence.
🔮 Final Prediction
Short term: sideways-to-up inside a 62,000–66,000 range — a deleveraged bounce in progress.
Medium term: bearish until proven otherwise. 67,600 is the verdict level. Below it, rallies are for trading, not marrying. Below 62,000, the trend resumes with 60,000 in sight.
Extreme Fear readings like 12 have historically marked zones of opportunity — but only for those who wait for confirmation, not those who guess bottoms.
💬 Conclusion
This market isn't paying the brave; it's paying the patient. Watch 64,000 for the day-trade, 66,000 for the swing, and 67,600 for the trend. Manage risk like your portfolio depends on it — because right now, it does.
Not financial advice. Do your own research.
#Bitcoin #BTC #CryptoMarket #TechnicalAnalysis #Fed #WhaleWatch #BinanceSquare #BTCUSDT
1. Global Macro
Inflation/Fed: October US PPI came in hot at +6.5% YoY, shifting market pricing toward a possible December Fed rate hike — a major risk-off driver for the Nov 13–14 selloff (Binance Research, via CoinStats, Nov 13).Risk assets: The macro shock hit crypto in parallel with equities-sensitive assets; a hike-leaning Fed implies a firmer dollar environment, which historically caps risk-asset rallies (analytical inference, not a verified DXY print).Geopolitics/regulation: US DOJ is pursuing $1.2B in stolen crypto tied to the Oct 29 Binance hack; the US Senate's Permanent Subcommittee on Investigations demanded Binance/Tether records by Jan 4, 2027; a FinCEN order takes effect Dec 10 (Binance to reject MEXC-linked transfers). Regulatory overhang = sustained caution.
2. Market Structure
Total crypto market cap: $2.18T, −4.29% in 24h (CoinMarketCap, Nov 15).BTC dominance: 59.4% (ETH 10.0%) — BTC still absorbs most liquidity; altcoin season is off the table in this tape.Sentiment: Fear & Greed fell from 21 (Nov 13) to 12/100 — Extreme Fear (Nov 15). In risk-off phases like this, capital typically rotates into stablecoins, lifting USDT dominance — a structural headwind for alts (general market mechanic, labeled as analysis).
3. Technicals (your 15m chart + verified price history)
Price: $64,461.89 at your chart snapshot (Nov 14, 17:45), +0.84% on the bounce session. BTC broke below $69,000 on Nov 13 with a ~4.3% daily drop, tagged a 62,000.00 swing low, then V-bounced to ~65,500–65,800 and is now compressing.15m: Price pinned between EMA(9) (~64,500) and a declining EMA(21); RSI(6) = 41.54 — neutral-weak, no momentum edge. Range compression after a V-bounce usually resolves with the higher-timeframe trend (currently down).1H/4H: Relief bounce inside a descending structure; the bounce printed a lower high (~65,200s) after 65,800 — bears still control retries. A 4H close above 66,000 is the minimum needed to invalidate the immediate downtrend.Daily: A −10% weekly impulse (69K → 62K) leaves short/mid moving averages stacked above price as dynamic resistance (structural inference from verified price path). Daily momentum is washed out; mean-reversion bounces are common here, but trend reversal requires reclaiming the 67,600 breakdown origin.
4. Futures & Positioning
Liquidations: >$1.9B market-wide in 24h (Nov 14); longs took ~89% of liquidations in major-coin samples (e.g., BNB: 88.7–89.1% longs) — this was a long flush, not a short attack.Open interest: Falling OI alongside falling price (BNB sample: −4.74% in 2 days) indicates orderly long unwinding, not fresh short conviction — conditions that allow bounces but not reversals.Funding: Near-neutral (BNB sample: +0.0034%/8h) — nobody is paying up for leverage; conviction is absent on both sides.
5. Whales, Institutions & ETFs
Spot Bitcoin ETFs: Continued outflows reported Nov 13 — institutional bid is absent exactly where it's needed.Cross-check: VanEck's BNB ETF logged zero net flows for consecutive sessions — institutional caution is market-wide, not BTC-specific.Whales: Distribution confirmed in alts (10M–100M ADA wallets sold ~50M ADA, Nov 4–10). For BTC, the dominant "whale" story is exchange-level: Binance fully replenished hack losses via SAFU/treasury and published a Proof-of-Reserves snapshot (Nov 12); the zero-knowledge proof verification was still computing (40–50h). An earlier reported $3.64B net outflow figure remains unverified — treat with caution.
6. News & Sentiment Calendar
Extreme Fear (12) + hack overhang + hot PPI = the three pillars of current bearish sentiment.Upcoming catalysts: December FOMC (hike odds), Binance ZK-PoR verification result, Dec 10 FinCEN order, Jan 4 Senate records deadline.
🎯 PART 2 — FINAL ANALYSIS: BTC/USDT VERDICT
Horizon
Call
Triggers
Targets
Invalidation
Short-term (hrs–3d)
SIDEWAYS → mild pump leg
Hold 64,000; 15m/4H close above 65,800
66,500 → 67,000
Loss of 64,000
Medium-term (1–4w)
DUMP bias
Daily close < 62,000
60,000 psych; below = speculative air pocket toward high-50Ks (labeled speculation)
Daily close > 67,600
Trend flip (bullish)
PUMP
Daily close > 67,600
69,000 → 70,000
Fall back under 66,000
Key levels: Support 64,000 / 62,000 / 60,000 • Resistance 65,500–65,800 / 66,500–67,000 / 67,600 / 69,000.
Strongest major (relative): BNB — smallest drawdown Oct 9–Nov 7 (−5.6% vs SOL −18.5%, XRP −15.9%, Bittime Research), hack fully backstopped, tokenized-equity ecosystem leading ($1.5B bStocks).
Weakest major: ADA — −34.98%/30d, whale distribution, confidence headlines.
📰 PART 3 — BINANCE SQUARE ARTICLE (Ready to Publish)
🚨 Bitcoin at $64,400: Relief Bounce or Bear Trap? The $62,000 Line Decides Everything
The crypto market just lived through one of its most violent weeks of 2026. Bitcoin sliced below $69,000, liquidations exploded past $1.9 billion in 24 hours, and the Fear & Greed Index cratered to 12 — Extreme Fear. Now BTC is coiling at ~$64,460 after a textbook V-bounce off $62,000. The question every trader is asking: is this the bottom, or just fuel for the next leg down?
🌍 Market Overview: Macro Is Driving the Tape
October's US PPI print of +6.5% YoY resurrected something traders never expected to price in late in the cycle: odds of a December Fed rate hike. Add continued spot Bitcoin ETF outflows, a total market cap bleeding to $2.18T (−4.29% in 24h), and BTC dominance pinned at 59.4%, and you have a market where safety outranks speculation. Altseason? Not in this climate.
📉 Bitcoin Technicals: The Battle Map
15-minute chart: After tagging 62,000.00, BTC printed a V-recovery to ~65,800 and is now compressing between its short-term EMAs with RSI(6) at ~41.5 — a market waiting for a catalyst, not a trend.
4-hour chart: The bounce already printed a lower high. Until BTC closes above 66,000, every rally is statistically a guest in a bearish house.
Daily chart: The 69K→62K impulse left moving averages stacked overhead. The 67,600 breakdown origin is the line that separates "bounce" from "reversal."
Key levels:
🟢 Support: 64,000 → 62,000 → 60,000🔴 Resistance: 65,500–65,800 → 66,500–67,000 → 67,600 → 69,000
🐂 Bullish vs 🐻 Bearish Scenarios
🐂 The Pump Case: 64,000 holds, 65,800 falls with volume → targets 66,500–67,000. A daily close above 67,600 flips structure and opens 69,000–70,000. Oversold conditions + exhausted longs (funding near neutral) are classic bounce fuel.
🐻 The Dump Case: Lose 64,000 and the market retests 62,000. A daily close below it exposes the 60,000 psychological floor — and below that, thin liquidity (speculative zone). With ETF outflows ongoing and a hike-leaning Fed, rallies keep meeting sellers.
🐋 Whale & Institutional Tape
The Nov 13–14 flush was a long liquidation event (~89% of liquidated positions were longs) with falling open interest — an orderly deleveraging, not a short ambush. That distinction matters: deleveraged markets bounce harder, but they don't reverse without institutional demand, and spot ETF flows are still negative. Meanwhile, Binance's post-hack Proof-of-Reserves snapshot and completed SAFU replenishment removed one systemic fear — verification of the ZK proof remains the next trust milestone to watch.
🔭 Alt Radar: Who's Strong, Who's Weak
Strongest: BNB — outperformed every major from Oct 9–Nov 7 (−5.6% vs SOL −18.5%, XRP −15.9%), with a fully backstopped exchange balance sheet and a tokenized-equity ecosystem crossing $1.5B.Weakest: ADA — down ~35% in 30 days, hit by whale distribution (~50M ADA sold Nov 4–10) and shaky holder confidence.
🔮 Final Prediction
Short term: sideways-to-up inside a 62,000–66,000 range — a deleveraged bounce in progress.
Medium term: bearish until proven otherwise. 67,600 is the verdict level. Below it, rallies are for trading, not marrying. Below 62,000, the trend resumes with 60,000 in sight.
Extreme Fear readings like 12 have historically marked zones of opportunity — but only for those who wait for confirmation, not those who guess bottoms.
💬 Conclusion
This market isn't paying the brave; it's paying the patient. Watch 64,000 for the day-trade, 66,000 for the swing, and 67,600 for the trend. Manage risk like your portfolio depends on it — because right now, it does.
Not financial advice. Do your own research.
#Bitcoin #BTC #CryptoMarket #TechnicalAnalysis #Fed #WhaleWatch #BinanceSquare #BTCUSDT
104
ບົດຄວາມ
ADA/USDT Market Analysis (15m Chart + Overall Market)What your chart shows:
Price: $0.1501 — after a heavy decline from 0.1647, price bottomed at 0.1426, then V-shaped bounced to ~0.1520, and is now consolidating in a tight 0.1495–0.1510 rangeEMA(9) ≈ 0.1501 and EMA(24) = 0.1497 — price is stuck right at/above both EMAs, meaning the short-term decline has paused but direction is still undecidedRSI(6) = 49.90 — perfectly neutral. Neither oversold nor overbought — the market is waiting for a breakout
The bigger picture (what matters):
ADA is down -10.29% in 24h and -34.98% over 30 days — even weaker performance than BNBThe whole market is crashing: Bitcoin below $69K, and the Fear & Greed Index has fallen to 12/100 (Extreme Fear)Whale selling: wallets holding 10M–100M ADA reportedly sold ~50 million ADA between Nov 4–10 — a negative signal for the near termFounder Charles Hoskinson's remarks that "the roadmap is complete, my role is done" have left holders frustrated and dented confidenceTechnically, ADA is considered bearish below $0.20, and the $0.1820 support has already brokenSome analysts have warned price could slide toward $0.14 within November
Pump or Dump now? — Both scenarios:
🟢 Pump (bounce) scenario:
If 0.1490–0.1497 (EMA24 zone) holds and 0.1520 breaks with volume → 0.1550, then a relief rally toward 0.1600 is possibleOnly a reclaim of 0.1647 (the chart's old breakdown point) would signal a genuine structure changeBut this is most likely just an oversold bounce — it won't sustain unless BTC stabilizes
🔴 Dump (decline) scenario (higher probability, trend-wise):
If 0.1490 breaks → 0.1450, then a retest of 0.1426 (the chart low)If 0.1426 fails → the 0.1400 psychological level, and beyond that the path opens toward 0.135–0.13, as analysts have warnedThe -35% 30-day decline and ongoing whale selling keep the downside risk alive
My conclusion:
Short term, expect a 0.1426–0.1520 range, but the overall trend is clearly bearish. ADA is currently weaker than the broader market (relative weakness), so bounces are likely to meet selling pressure quickly. Confirmation of a "pump" requires a strong-volume close above 0.1520; until then, this is likely just a temporary pause within the decline. If scalping, only do so with a stop-loss near 0.1426, and exit immediately if 0.1426 breaks.
{future}(ADAUSDT)
ADA/USDT Market Analysis (15m Chart + Overall Market)
What your chart shows:
Price: $0.1501 — after a heavy decline from 0.1647, price bottomed at 0.1426, then V-shaped bounced to ~0.1520, and is now consolidating in a tight 0.1495–0.1510 rangeEMA(9) ≈ 0.1501 and EMA(24) = 0.1497 — price is stuck right at/above both EMAs, meaning the short-term decline has paused but direction is still undecidedRSI(6) = 49.90 — perfectly neutral. Neither oversold nor overbought — the market is waiting for a breakout
The bigger picture (what matters):
ADA is down -10.29% in 24h and -34.98% over 30 days — even weaker performance than BNBThe whole market is crashing: Bitcoin below $69K, and the Fear & Greed Index has fallen to 12/100 (Extreme Fear)Whale selling: wallets holding 10M–100M ADA reportedly sold ~50 million ADA between Nov 4–10 — a negative signal for the near termFounder Charles Hoskinson's remarks that "the roadmap is complete, my role is done" have left holders frustrated and dented confidenceTechnically, ADA is considered bearish below $0.20, and the $0.1820 support has already brokenSome analysts have warned price could slide toward $0.14 within November
Pump or Dump now? — Both scenarios:
🟢 Pump (bounce) scenario:
If 0.1490–0.1497 (EMA24 zone) holds and 0.1520 breaks with volume → 0.1550, then a relief rally toward 0.1600 is possibleOnly a reclaim of 0.1647 (the chart's old breakdown point) would signal a genuine structure changeBut this is most likely just an oversold bounce — it won't sustain unless BTC stabilizes
🔴 Dump (decline) scenario (higher probability, trend-wise):
If 0.1490 breaks → 0.1450, then a retest of 0.1426 (the chart low)If 0.1426 fails → the 0.1400 psychological level, and beyond that the path opens toward 0.135–0.13, as analysts have warnedThe -35% 30-day decline and ongoing whale selling keep the downside risk alive
My conclusion:
Short term, expect a 0.1426–0.1520 range, but the overall trend is clearly bearish. ADA is currently weaker than the broader market (relative weakness), so bounces are likely to meet selling pressure quickly. Confirmation of a "pump" requires a strong-volume close above 0.1520; until then, this is likely just a temporary pause within the decline. If scalping, only do so with a stop-loss near 0.1426, and exit immediately if 0.1426 breaks.
Price: $0.1501 — after a heavy decline from 0.1647, price bottomed at 0.1426, then V-shaped bounced to ~0.1520, and is now consolidating in a tight 0.1495–0.1510 rangeEMA(9) ≈ 0.1501 and EMA(24) = 0.1497 — price is stuck right at/above both EMAs, meaning the short-term decline has paused but direction is still undecidedRSI(6) = 49.90 — perfectly neutral. Neither oversold nor overbought — the market is waiting for a breakout
The bigger picture (what matters):
ADA is down -10.29% in 24h and -34.98% over 30 days — even weaker performance than BNBThe whole market is crashing: Bitcoin below $69K, and the Fear & Greed Index has fallen to 12/100 (Extreme Fear)Whale selling: wallets holding 10M–100M ADA reportedly sold ~50 million ADA between Nov 4–10 — a negative signal for the near termFounder Charles Hoskinson's remarks that "the roadmap is complete, my role is done" have left holders frustrated and dented confidenceTechnically, ADA is considered bearish below $0.20, and the $0.1820 support has already brokenSome analysts have warned price could slide toward $0.14 within November
Pump or Dump now? — Both scenarios:
🟢 Pump (bounce) scenario:
If 0.1490–0.1497 (EMA24 zone) holds and 0.1520 breaks with volume → 0.1550, then a relief rally toward 0.1600 is possibleOnly a reclaim of 0.1647 (the chart's old breakdown point) would signal a genuine structure changeBut this is most likely just an oversold bounce — it won't sustain unless BTC stabilizes
🔴 Dump (decline) scenario (higher probability, trend-wise):
If 0.1490 breaks → 0.1450, then a retest of 0.1426 (the chart low)If 0.1426 fails → the 0.1400 psychological level, and beyond that the path opens toward 0.135–0.13, as analysts have warnedThe -35% 30-day decline and ongoing whale selling keep the downside risk alive
My conclusion:
Short term, expect a 0.1426–0.1520 range, but the overall trend is clearly bearish. ADA is currently weaker than the broader market (relative weakness), so bounces are likely to meet selling pressure quickly. Confirmation of a "pump" requires a strong-volume close above 0.1520; until then, this is likely just a temporary pause within the decline. If scalping, only do so with a stop-loss near 0.1426, and exit immediately if 0.1426 breaks.
1
1
237
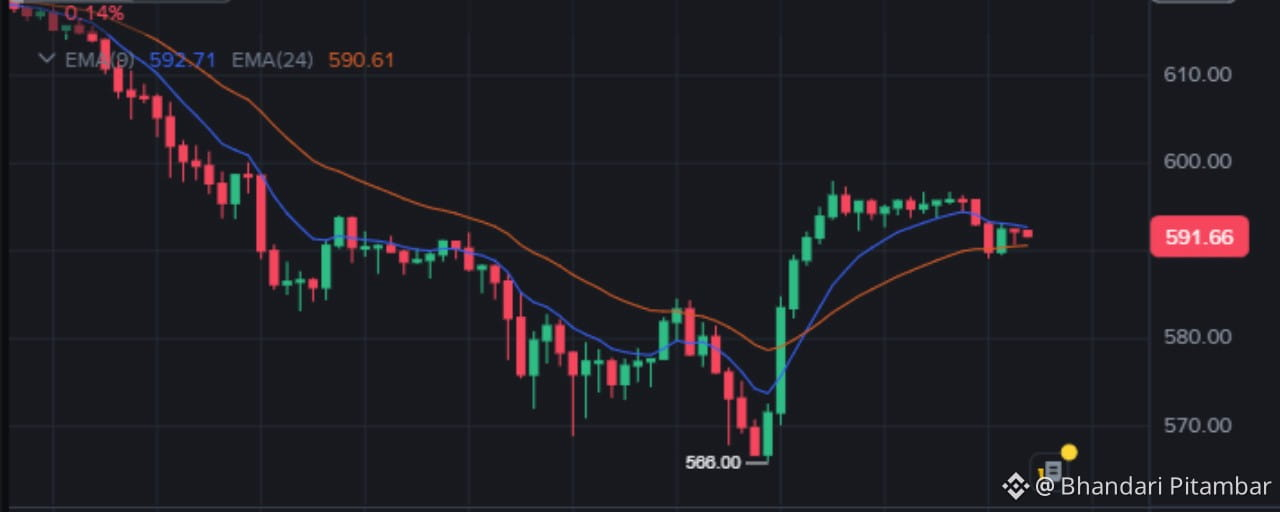
ບົດຄວາມ
BNB Market Analysis (15-Minute Chart + Overall Market)What Your Chart Shows:
Price: 591.66 — BNB bounced sharply in a V-shape from the low of 568 to around 597. It is now pulling back and trying to stabilize.EMA(9) = 592.71 (price is below it) and EMA(24) = 590.61 (price is above it) — Price is trapped between the two EMAs, indicating that the market is looking for direction.RSI(6) = 43 — Buying momentum is slowing down, but the market is not oversold. RSI is in a neutral-to-weak zone.
Bigger Picture (Very Important):
Looking only at the 15-minute chart is not enough. On higher timeframes, BNB is in a strong downtrend.
BNB has dropped approximately 15% in 7 days, falling from around 700 to 590.This is not just a BNB problem — the entire crypto market is under pressure: Bitcoin is below 69,000, ETH is below 2,000, and approximately $1.9 billion in liquidations have occurred within 24 hours.Macroeconomic pressure: Higher-than-expected US inflation has increased fears that the Federal Reserve may raise interest rates in December. ETF outflows are also putting pressure on the market.The impact of Binance's approximately $6.4 billion hack on October 29 is still being felt. However, Binance has reportedly covered all affected assets through its SAFU fund and published its Proof of Reserves.Fear & Greed Index = 21 (Extreme Fear), and approximately 71% of accounts are holding long positions. Heavy long positioning increases the risk of further liquidations.
Pump or Dump? — Both Scenarios:
🟢 Bullish Scenario (Pump):
If the 588–590 support zone (EMA24) holds and BNB breaks above 595–597 with strong volume, the next targets could be:600–605610–613 (potential relief rally)The daily RSI was around 28 (oversold), so there is room for a bounce.However, the rally may not last unless BTC also stabilizes and starts recovering.
🔴 Bearish Scenario (Dump) — More Likely According to the Current Trend:
If the price drops below 588–590, BNB could retest:580 support568 (the previous chart low)If 568 also breaks, the next downside zone could be 550–558.Analysts consider $580 an important support level. Losing this level could lead to a deeper decline.
My Conclusion:
In the short term, BNB appears likely to move within the 568–600 range, but the overall trend remains bearish.
Buying the current bounce and assuming that a new pump has started would be risky.
Until BTC recovers and BNB successfully reclaims the 600+ level, this move is more likely to be an oversold relief bounce rather than the beginning of a sustained bullish trend.
If 568 holds, a short-term long scalp setup may develop, but only with strict risk management and a stop-loss around 566–567.
{future}(BTCUSDT)
{spot}(BNBUSDT)
BNB Market Analysis (15-Minute Chart + Overall Market)
What Your Chart Shows:
Price: 591.66 — BNB bounced sharply in a V-shape from the low of 568 to around 597. It is now pulling back and trying to stabilize.EMA(9) = 592.71 (price is below it) and EMA(24) = 590.61 (price is above it) — Price is trapped between the two EMAs, indicating that the market is looking for direction.RSI(6) = 43 — Buying momentum is slowing down, but the market is not oversold. RSI is in a neutral-to-weak zone.
Bigger Picture (Very Important):
Looking only at the 15-minute chart is not enough. On higher timeframes, BNB is in a strong downtrend.
BNB has dropped approximately 15% in 7 days, falling from around 700 to 590.This is not just a BNB problem — the entire crypto market is under pressure: Bitcoin is below 69,000, ETH is below 2,000, and approximately $1.9 billion in liquidations have occurred within 24 hours.Macroeconomic pressure: Higher-than-expected US inflation has increased fears that the Federal Reserve may raise interest rates in December. ETF outflows are also putting pressure on the market.The impact of Binance's approximately $6.4 billion hack on October 29 is still being felt. However, Binance has reportedly covered all affected assets through its SAFU fund and published its Proof of Reserves.Fear & Greed Index = 21 (Extreme Fear), and approximately 71% of accounts are holding long positions. Heavy long positioning increases the risk of further liquidations.
Pump or Dump? — Both Scenarios:
🟢 Bullish Scenario (Pump):
If the 588–590 support zone (EMA24) holds and BNB breaks above 595–597 with strong volume, the next targets could be:600–605610–613 (potential relief rally)The daily RSI was around 28 (oversold), so there is room for a bounce.However, the rally may not last unless BTC also stabilizes and starts recovering.
🔴 Bearish Scenario (Dump) — More Likely According to the Current Trend:
If the price drops below 588–590, BNB could retest:580 support568 (the previous chart low)If 568 also breaks, the next downside zone could be 550–558.Analysts consider $580 an important support level. Losing this level could lead to a deeper decline.
My Conclusion:
In the short term, BNB appears likely to move within the 568–600 range, but the overall trend remains bearish.
Buying the current bounce and assuming that a new pump has started would be risky.
Until BTC recovers and BNB successfully reclaims the 600+ level, this move is more likely to be an oversold relief bounce rather than the beginning of a sustained bullish trend.
If 568 holds, a short-term long scalp setup may develop, but only with strict risk management and a stop-loss around 566–567.
Price: 591.66 — BNB bounced sharply in a V-shape from the low of 568 to around 597. It is now pulling back and trying to stabilize.EMA(9) = 592.71 (price is below it) and EMA(24) = 590.61 (price is above it) — Price is trapped between the two EMAs, indicating that the market is looking for direction.RSI(6) = 43 — Buying momentum is slowing down, but the market is not oversold. RSI is in a neutral-to-weak zone.
Bigger Picture (Very Important):
Looking only at the 15-minute chart is not enough. On higher timeframes, BNB is in a strong downtrend.
BNB has dropped approximately 15% in 7 days, falling from around 700 to 590.This is not just a BNB problem — the entire crypto market is under pressure: Bitcoin is below 69,000, ETH is below 2,000, and approximately $1.9 billion in liquidations have occurred within 24 hours.Macroeconomic pressure: Higher-than-expected US inflation has increased fears that the Federal Reserve may raise interest rates in December. ETF outflows are also putting pressure on the market.The impact of Binance's approximately $6.4 billion hack on October 29 is still being felt. However, Binance has reportedly covered all affected assets through its SAFU fund and published its Proof of Reserves.Fear & Greed Index = 21 (Extreme Fear), and approximately 71% of accounts are holding long positions. Heavy long positioning increases the risk of further liquidations.
Pump or Dump? — Both Scenarios:
🟢 Bullish Scenario (Pump):
If the 588–590 support zone (EMA24) holds and BNB breaks above 595–597 with strong volume, the next targets could be:600–605610–613 (potential relief rally)The daily RSI was around 28 (oversold), so there is room for a bounce.However, the rally may not last unless BTC also stabilizes and starts recovering.
🔴 Bearish Scenario (Dump) — More Likely According to the Current Trend:
If the price drops below 588–590, BNB could retest:580 support568 (the previous chart low)If 568 also breaks, the next downside zone could be 550–558.Analysts consider $580 an important support level. Losing this level could lead to a deeper decline.
My Conclusion:
In the short term, BNB appears likely to move within the 568–600 range, but the overall trend remains bearish.
Buying the current bounce and assuming that a new pump has started would be risky.
Until BTC recovers and BNB successfully reclaims the 600+ level, this move is more likely to be an oversold relief bounce rather than the beginning of a sustained bullish trend.
If 568 holds, a short-term long scalp setup may develop, but only with strict risk management and a stop-loss around 566–567.
1
1
98
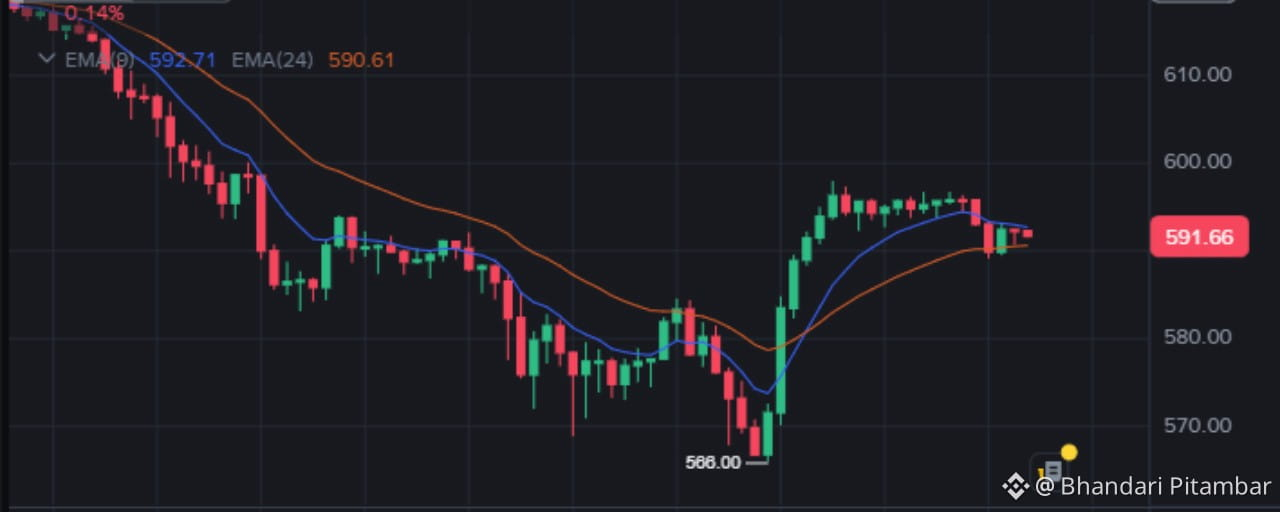
ບົດຄວາມ
BNB Market Analysis (15m Chart + Overall Market)Tapai ko chart ma k dekhinchha:
Price: 591.66 — 568 ko bottom bata V-shape bounce bhaera ~597 samma pugyo, aba tyaha bata pullback bhaera consolidate gardai chhaEMA(9) = 592.71 (price yo bhanda tala) vs EMA(24) = 590.61 (price yo bhanda mathi) — dui EMA ko bich ma squeeze chha, matlab market le direction khojirako chhaRSI(6) = 43 — bounce ko momentum chiso hudai chha, tara oversold chhaina. Neutral-weak zone
Thulo picture (yo chahi important chha):
15m chart matra herera hunna — bigger timeframe ma BNB strong downtrend ma chha:
7 din ma ~15% le gireko chha, ~$700 bata $590 sammacoinmarketcap.comYo BNB-specific matra haina — purai market crash ma chha: Bitcoin $69K bhanda tala, ETH $2,000 bhanda tala, 24 ghanta ma $1.9 billion liquidationcoinstats.appMacro pressure: US inflation tato aayeko le December ma Fed le rate badhaune dar, ETF outflowscoinstats.appBinance ko Oct 29 ko ~$6.4B hack ko overhang ajhai chha, yadyapi Binance le SAFU fund bata sabai asset replace garisakyo ra Proof of Reserves publish garyocoinstats.appFear & Greed Index = 21 (Extreme Fear), ra ~71% accounts long chhan — crowded longs = ajhai liquidation ko riskcoinstats.app
Aba Pump ki Dump? — Duitai scenario:
🟢 Pump (bounce) scenario:
588–590 (EMA24) hold bhayo + 595–597 break with volume → 600–605, tyaspachi 610–613 samma relief rally possibleDaily RSI oversold (~28) thiyo, tesaile bounce ko space chhacoinstats.appTara BTC le stabilize nagare samma bounce tikdaina
🔴 Dump scenario (higher probability trend-wise):
588–590 break bhayo bhane → 580 retest, tyaspachi 568 (tapai ko chart ko low)568 pani gayo bhane → 550–558 zone samma jharna sakchha$580 lai analysts le key support bhaneka chhan — yo gayo bhane deeper test hunchhacoinstats.app
Mero bias:
Short-term ma 568–600 ko range, tara overall trend bearish chha. Ahile ko bounce lai "pump suru bho" bhanera kinnu risky chha — yo oversold relief bounce matra huna sakne probability badi chha jab samma BTC recover hudaina ra BNB le 600+ reclaim gardaina. 568 hold bhayo bhane chai short-term long scalp ko setup banna sakchha, tara tight stop-loss (566–567) bina hoina.
{future}(BTCUSDT)
{spot}(BNBUSDT)
BNB Market Analysis (15m Chart + Overall Market)
Tapai ko chart ma k dekhinchha:
Price: 591.66 — 568 ko bottom bata V-shape bounce bhaera ~597 samma pugyo, aba tyaha bata pullback bhaera consolidate gardai chhaEMA(9) = 592.71 (price yo bhanda tala) vs EMA(24) = 590.61 (price yo bhanda mathi) — dui EMA ko bich ma squeeze chha, matlab market le direction khojirako chhaRSI(6) = 43 — bounce ko momentum chiso hudai chha, tara oversold chhaina. Neutral-weak zone
Thulo picture (yo chahi important chha):
15m chart matra herera hunna — bigger timeframe ma BNB strong downtrend ma chha:
7 din ma ~15% le gireko chha, ~$700 bata $590 sammacoinmarketcap.comYo BNB-specific matra haina — purai market crash ma chha: Bitcoin $69K bhanda tala, ETH $2,000 bhanda tala, 24 ghanta ma $1.9 billion liquidationcoinstats.appMacro pressure: US inflation tato aayeko le December ma Fed le rate badhaune dar, ETF outflowscoinstats.appBinance ko Oct 29 ko ~$6.4B hack ko overhang ajhai chha, yadyapi Binance le SAFU fund bata sabai asset replace garisakyo ra Proof of Reserves publish garyocoinstats.appFear & Greed Index = 21 (Extreme Fear), ra ~71% accounts long chhan — crowded longs = ajhai liquidation ko riskcoinstats.app
Aba Pump ki Dump? — Duitai scenario:
🟢 Pump (bounce) scenario:
588–590 (EMA24) hold bhayo + 595–597 break with volume → 600–605, tyaspachi 610–613 samma relief rally possibleDaily RSI oversold (~28) thiyo, tesaile bounce ko space chhacoinstats.appTara BTC le stabilize nagare samma bounce tikdaina
🔴 Dump scenario (higher probability trend-wise):
588–590 break bhayo bhane → 580 retest, tyaspachi 568 (tapai ko chart ko low)568 pani gayo bhane → 550–558 zone samma jharna sakchha$580 lai analysts le key support bhaneka chhan — yo gayo bhane deeper test hunchhacoinstats.app
Mero bias:
Short-term ma 568–600 ko range, tara overall trend bearish chha. Ahile ko bounce lai "pump suru bho" bhanera kinnu risky chha — yo oversold relief bounce matra huna sakne probability badi chha jab samma BTC recover hudaina ra BNB le 600+ reclaim gardaina. 568 hold bhayo bhane chai short-term long scalp ko setup banna sakchha, tara tight stop-loss (566–567) bina hoina.
Price: 591.66 — 568 ko bottom bata V-shape bounce bhaera ~597 samma pugyo, aba tyaha bata pullback bhaera consolidate gardai chhaEMA(9) = 592.71 (price yo bhanda tala) vs EMA(24) = 590.61 (price yo bhanda mathi) — dui EMA ko bich ma squeeze chha, matlab market le direction khojirako chhaRSI(6) = 43 — bounce ko momentum chiso hudai chha, tara oversold chhaina. Neutral-weak zone
Thulo picture (yo chahi important chha):
15m chart matra herera hunna — bigger timeframe ma BNB strong downtrend ma chha:
7 din ma ~15% le gireko chha, ~$700 bata $590 sammacoinmarketcap.comYo BNB-specific matra haina — purai market crash ma chha: Bitcoin $69K bhanda tala, ETH $2,000 bhanda tala, 24 ghanta ma $1.9 billion liquidationcoinstats.appMacro pressure: US inflation tato aayeko le December ma Fed le rate badhaune dar, ETF outflowscoinstats.appBinance ko Oct 29 ko ~$6.4B hack ko overhang ajhai chha, yadyapi Binance le SAFU fund bata sabai asset replace garisakyo ra Proof of Reserves publish garyocoinstats.appFear & Greed Index = 21 (Extreme Fear), ra ~71% accounts long chhan — crowded longs = ajhai liquidation ko riskcoinstats.app
Aba Pump ki Dump? — Duitai scenario:
🟢 Pump (bounce) scenario:
588–590 (EMA24) hold bhayo + 595–597 break with volume → 600–605, tyaspachi 610–613 samma relief rally possibleDaily RSI oversold (~28) thiyo, tesaile bounce ko space chhacoinstats.appTara BTC le stabilize nagare samma bounce tikdaina
🔴 Dump scenario (higher probability trend-wise):
588–590 break bhayo bhane → 580 retest, tyaspachi 568 (tapai ko chart ko low)568 pani gayo bhane → 550–558 zone samma jharna sakchha$580 lai analysts le key support bhaneka chhan — yo gayo bhane deeper test hunchhacoinstats.app
Mero bias:
Short-term ma 568–600 ko range, tara overall trend bearish chha. Ahile ko bounce lai "pump suru bho" bhanera kinnu risky chha — yo oversold relief bounce matra huna sakne probability badi chha jab samma BTC recover hudaina ra BNB le 600+ reclaim gardaina. 568 hold bhayo bhane chai short-term long scalp ko setup banna sakchha, tara tight stop-loss (566–567) bina hoina.
1
1
66
🎙️ BUILDING BINANCE SQUARE TOGETHER | CIPHERX LIVE
ສິ້ນສຸດ
03 ຊົ່ວໂມງ 16 ນາທີ 16 ວິນາທີ
6k
15
10
Looking at the PEPE/USDT chart right now the price is moving around 0.00000517 USDT. Last 24 hour price increased by about +6.38% and now there seems to be some correction till the 24 hour high price reached 0.00000568.
Now whether the market will rise or fall depends on technical indicators:
1. Bullish Signals:
The chart is currently seeing a support zone at 0.00000497 using the SUPERTREND (10, 3) indicator. As long as the price remains above this support level, the market is considered to be in the positive (bullish) zone and there is a possibility of going higher again.
2. Possibility of decrease or correction:
The price has recently reached a new low at (0.00000568), some time there may be a further support test in the market due to Profit Booking.
What should you do?
Now, if you are looking for money, then spend all your money at once.
If the price still bottoms out and settles in the support zone (around 0.00000500), the DCA (piece by piece par) risk becomes less.
(Note: This is not a financial advice. Since the crypto market is high risk, do your own research before taking the decision.)
{spot}(PEPEUSDT)
Looking at the PEPE/USDT chart right now the price is moving around 0.00000517 USDT. Last 24 hour price increased by about +6.38% and now there seems to be some correction till the 24 hour high price reached 0.00000568.
Now whether the market will rise or fall depends on technical indicators:
1. Bullish Signals:
The chart is currently seeing a support zone at 0.00000497 using the SUPERTREND (10, 3) indicator. As long as the price remains above this support level, the market is considered to be in the positive (bullish) zone and there is a possibility of going higher again.
2. Possibility of decrease or correction:
The price has recently reached a new low at (0.00000568), some time there may be a further support test in the market due to Profit Booking.
What should you do?
Now, if you are looking for money, then spend all your money at once.
If the price still bottoms out and settles in the support zone (around 0.00000500), the DCA (piece by piece par) risk becomes less.
(Note: This is not a financial advice. Since the crypto market is high risk, do your own research before taking the decision.)
Now whether the market will rise or fall depends on technical indicators:
1. Bullish Signals:
The chart is currently seeing a support zone at 0.00000497 using the SUPERTREND (10, 3) indicator. As long as the price remains above this support level, the market is considered to be in the positive (bullish) zone and there is a possibility of going higher again.
2. Possibility of decrease or correction:
The price has recently reached a new low at (0.00000568), some time there may be a further support test in the market due to Profit Booking.
What should you do?
Now, if you are looking for money, then spend all your money at once.
If the price still bottoms out and settles in the support zone (around 0.00000500), the DCA (piece by piece par) risk becomes less.
(Note: This is not a financial advice. Since the crypto market is high risk, do your own research before taking the decision.)
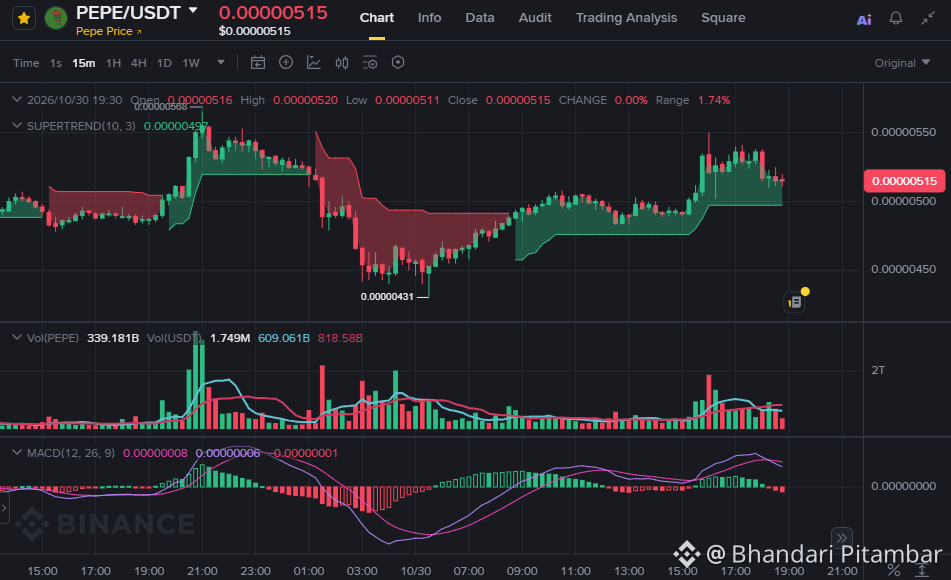
66
Current Chart State and Market Critical Herd Analysis of rare market decline or aging Yes Type F:
1. Pressure to decrease or correct the price (bearish pressure)
Recent chart: Bitcoin price is currently at $76,650 per trade.
Indicators: The Supertrend line on the 15-minute chart remains in the negative zone for the short-term stock price ($77,624). This indicates that in the short term, the pressure on short-term creditor-buyer sellers may remain high and the price may bottom out for some time or settle sideways (Uta Range).
2. How rare is the market to grow?
Support Level: 24-hour all-time low point (low) near $76,500. If the price takes important support, the price may bounce back.
Bholum: Halko Business Cash Body High ($2.74 Billion) Reko Chh, Jasle Thulo Dosima Kinbech Bharekhsho Sounch.
conclusion:
Short-term provisional reports indicate satellite growth. If the $76,500 support level remains intact then the market will remain stable, and at this point the bottom price will remain at the lowest level.
The crypto market is extremely volatile and any predictions regarding its risk appetite are necessary.
{spot}(BTCUSDT)
Current Chart State and Market Critical Herd Analysis of rare market decline or aging Yes Type F:
1. Pressure to decrease or correct the price (bearish pressure)
Recent chart: Bitcoin price is currently at $76,650 per trade.
Indicators: The Supertrend line on the 15-minute chart remains in the negative zone for the short-term stock price ($77,624). This indicates that in the short term, the pressure on short-term creditor-buyer sellers may remain high and the price may bottom out for some time or settle sideways (Uta Range).
2. How rare is the market to grow?
Support Level: 24-hour all-time low point (low) near $76,500. If the price takes important support, the price may bounce back.
Bholum: Halko Business Cash Body High ($2.74 Billion) Reko Chh, Jasle Thulo Dosima Kinbech Bharekhsho Sounch.
conclusion:
Short-term provisional reports indicate satellite growth. If the $76,500 support level remains intact then the market will remain stable, and at this point the bottom price will remain at the lowest level.
The crypto market is extremely volatile and any predictions regarding its risk appetite are necessary.
1. Pressure to decrease or correct the price (bearish pressure)
Recent chart: Bitcoin price is currently at $76,650 per trade.
Indicators: The Supertrend line on the 15-minute chart remains in the negative zone for the short-term stock price ($77,624). This indicates that in the short term, the pressure on short-term creditor-buyer sellers may remain high and the price may bottom out for some time or settle sideways (Uta Range).
2. How rare is the market to grow?
Support Level: 24-hour all-time low point (low) near $76,500. If the price takes important support, the price may bounce back.
Bholum: Halko Business Cash Body High ($2.74 Billion) Reko Chh, Jasle Thulo Dosima Kinbech Bharekhsho Sounch.
conclusion:
Short-term provisional reports indicate satellite growth. If the $76,500 support level remains intact then the market will remain stable, and at this point the bottom price will remain at the lowest level.
The crypto market is extremely volatile and any predictions regarding its risk appetite are necessary.
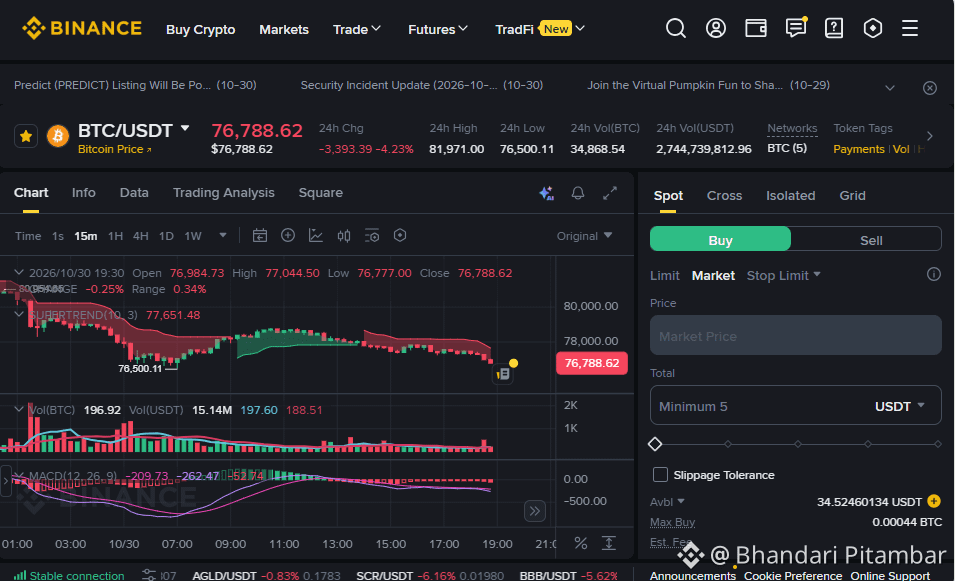
79
you are the girl of the garden
Looking at the current market situation and technical indicators, selling pressure and bearish trend are clearly visible in the market. Its main reasons are mentioned below:
Price Drop: BNB price 24 hours down 6.20% to 697.39 USDT (24 hours high price 754.29 USDT).
Supertrend: Current price is at 697.39 while Supertrend indicator is at 706.35. A price below this line indicates the continuation of a short-term downtrend.
MACD indicator: The MACD line is in the negative zone (-2.76 and -2.78), which shows that sellers are dominating the market and there is less possibility of a big upswing in the near future.
Impact on the overall market: Other major cryptocurrencies including Bitcoin (-3.69%) and Ethereum (-4.08%) are also trading down overnight.
conclusion:
Technically, the market is currently under pressure and may go down for some time in the short term or there may be fluctuations around this. To know when the market reverses, it has to cross the major resistance line.
Warning: Due to the highly volatile nature of the cryptocurrency market, you should only take decisions while investing or trading keeping your risk management in mind.
{spot}(BNBUSDT)
you are the girl of the garden
Looking at the current market situation and technical indicators, selling pressure and bearish trend are clearly visible in the market. Its main reasons are mentioned below:
Price Drop: BNB price 24 hours down 6.20% to 697.39 USDT (24 hours high price 754.29 USDT).
Supertrend: Current price is at 697.39 while Supertrend indicator is at 706.35. A price below this line indicates the continuation of a short-term downtrend.
MACD indicator: The MACD line is in the negative zone (-2.76 and -2.78), which shows that sellers are dominating the market and there is less possibility of a big upswing in the near future.
Impact on the overall market: Other major cryptocurrencies including Bitcoin (-3.69%) and Ethereum (-4.08%) are also trading down overnight.
conclusion:
Technically, the market is currently under pressure and may go down for some time in the short term or there may be fluctuations around this. To know when the market reverses, it has to cross the major resistance line.
Warning: Due to the highly volatile nature of the cryptocurrency market, you should only take decisions while investing or trading keeping your risk management in mind.
Looking at the current market situation and technical indicators, selling pressure and bearish trend are clearly visible in the market. Its main reasons are mentioned below:
Price Drop: BNB price 24 hours down 6.20% to 697.39 USDT (24 hours high price 754.29 USDT).
Supertrend: Current price is at 697.39 while Supertrend indicator is at 706.35. A price below this line indicates the continuation of a short-term downtrend.
MACD indicator: The MACD line is in the negative zone (-2.76 and -2.78), which shows that sellers are dominating the market and there is less possibility of a big upswing in the near future.
Impact on the overall market: Other major cryptocurrencies including Bitcoin (-3.69%) and Ethereum (-4.08%) are also trading down overnight.
conclusion:
Technically, the market is currently under pressure and may go down for some time in the short term or there may be fluctuations around this. To know when the market reverses, it has to cross the major resistance line.
Warning: Due to the highly volatile nature of the cryptocurrency market, you should only take decisions while investing or trading keeping your risk management in mind.
91
🎙️ 🎉2026狂暴牛市,号角已吹响,行情尽在BSC链!!11月1号马斯克将为火星狗Marvin庆祝生日,这波链上行情一定要抓住!
ສິ້ນສຸດ
02 ຊົ່ວໂມງ 03 ນາທີ 35 ວິນາທີ
2.5k
8
34
ເຂົ້າສູ່ລະບົບເພື່ອສຳຫຼວດເນື້ອຫາເພີ່ມເຕີມ
ເຂົ້າຮ່ວມກຸ່ມຜູ້ໃຊ້ຄຣິບໂຕທົ່ວໂລກໃນ Binance Square.
⚡️ ໄດ້ຮັບຂໍ້ມູນຫຼ້າສຸດ ແລະ ທີ່ມີປະໂຫຍດກ່ຽວກັບຄຣິບໂຕ.
💬 ໄດ້ຮັບຄວາມໄວ້ວາງໃຈຈາກຕະຫຼາດແລກປ່ຽນຄຣິບໂຕທີ່ໃຫຍ່ທີ່ສຸດໃນໂລກ.
👍 ຄົ້ນຫາຂໍ້ມູນເຊີງເລິກທີ່ແທ້ຈາກນັກສ້າງທີ່ໄດ້ຮັບການຢືນຢັນ.
ອີເມວ / ເບີໂທລະສັບ
ຫົວຂໍ້ທີ່ກໍາລັງນິຍົມ
A Packed Week of Earnings and Data Tests Markets
27,313 ຄັ້ງທີ່ເບິ່ງ
210 ກຳລັງສົນທະນາ
🚨🇺🇸 BIG WEEK AHEAD FOR THE MARKETS!
Markets are pricing in a Fed rate hike in December and $BTC could see some big moves next week.
Here's what's coming:
• Monday: Fed Chair Warsh speaks
• Tuesday: US Retail Sales + $NVDA earnings
• Wednesday: FOMC Minutes
• Thursday: Jobless Claims + Philly Fed Index
• Friday: Consumer Sentiment + Fed speeches
All eyes on $BTC as another important week begins.
#bitcoin
Mookie
·8 ຖືກໃຈ
·4.6k ຄັ້ງທີ່ເບິ່ງ
AnthropicIPOTestsInvestorAppetiteForAI
27,912 ຄັ້ງທີ່ເບິ່ງ
535 ກຳລັງສົນທະນາ
HuangReportedlyConsidersReturnToNvidia
53,990 ຄັ້ງທີ່ເບິ່ງ
670 ກຳລັງສົນທະນາ