
MOUZZAM ABBAS B
7 ໂພສ

MOUZZAM ABBAS B
ລາຍງານ
ບລັອກຜູ້ໃຊ້
9 ກໍາລັງຕິດຕາມ
2 ຜູ້ຕິດຕາມ
3 Liked
ໂພສ
ເບິ່ງການແປ
$ZEC
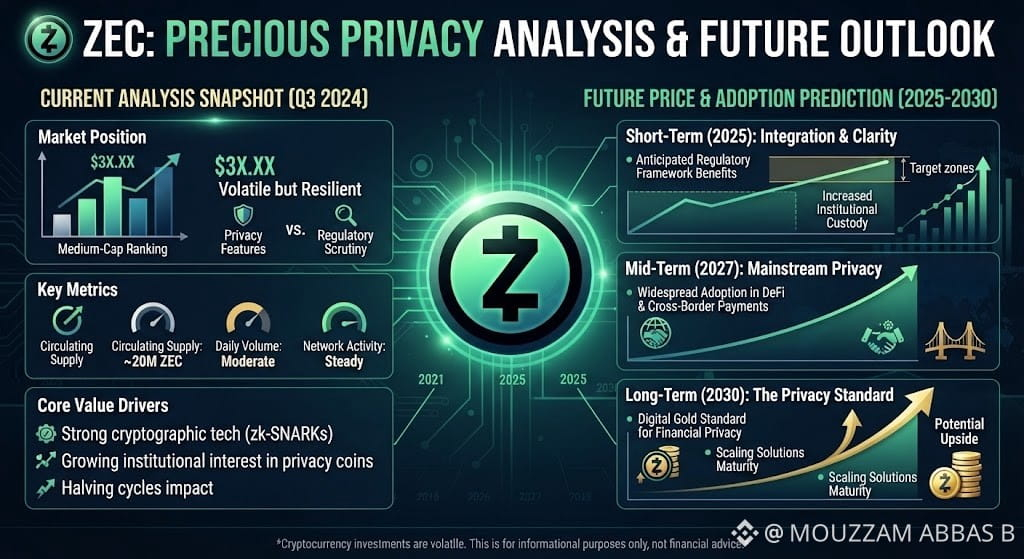
Zcash (ZEC) trades at approximately $1,180 to $1,225, backed by strong momentum and shifting dynamics within the privacy-focused asset sector.
Market Analysis
Shielded Supply Dynamics: A crucial fundamental driver is the continuous movement of tokens into shielded pools. On-chain data indicates that a major portion of circulating supply is held in private, long-term storage rather than active exchange order books, effectively creating a supply squeeze.
Technical Landscape: ZEC has experienced high volatility alongside a strong multi-month recovery. While relative strength index (RSI) indicators often hover near overbought thresholds during strong impulsive rallies, the structural baseline supported by moving averages points to sustained buyer interest.
CoinCodex
Evolving Utility: Upgrades focusing on network efficiency—such as transition paths to the Zebra consensus node and advanced threshold signature schemes (FROST)—are gradually improving institutional appeal for compliant, private enterprise asset management.
Phemex
Future Price Projections
Time HorizonProjected Price Range / TargetMarket Sentiment & OutlookShort-Term (Late 2026)$900 – $1,870High volatility with bullish momentum; potential to test higher resistance ceilings if broader market tailwinds persist.Medium-Term (2027 – 2028)$1,150 – $1,470Expected consolidation phase with gradual upward trajectory driven by persistent scarcity and incremental network adoption.Long-Term (2030)$2,200 – $3,500+Heavily tied to the long-range effects of fixed supply caps (21 million limit) and potential global demand for financial privacy infrastructure.
Disclaimer: Cryptocurrency markets are inherently volatile and subject to sudden regulatory shifts, macro trends, and sentiment fluctuations. This overview is for informational purposes and does not constitute financial advice.
CoinCodex
{spot}(ZECUSDT)
#zec #AEROSurges17%In24Hours #IranSaysItCapturedUSUnmannedSubmarine #ZcashRises45%WeeklyToHighestSince2016 #YenBreaks155NearingYearHigh
$ZEC
Zcash (ZEC) trades at approximately $1,180 to $1,225, backed by strong momentum and shifting dynamics within the privacy-focused asset sector.
Market Analysis
Shielded Supply Dynamics: A crucial fundamental driver is the continuous movement of tokens into shielded pools. On-chain data indicates that a major portion of circulating supply is held in private, long-term storage rather than active exchange order books, effectively creating a supply squeeze.
Technical Landscape: ZEC has experienced high volatility alongside a strong multi-month recovery. While relative strength index (RSI) indicators often hover near overbought thresholds during strong impulsive rallies, the structural baseline supported by moving averages points to sustained buyer interest.
CoinCodex
Evolving Utility: Upgrades focusing on network efficiency—such as transition paths to the Zebra consensus node and advanced threshold signature schemes (FROST)—are gradually improving institutional appeal for compliant, private enterprise asset management.
Phemex
Future Price Projections
Time HorizonProjected Price Range / TargetMarket Sentiment & OutlookShort-Term (Late 2026)$900 – $1,870High volatility with bullish momentum; potential to test higher resistance ceilings if broader market tailwinds persist.Medium-Term (2027 – 2028)$1,150 – $1,470Expected consolidation phase with gradual upward trajectory driven by persistent scarcity and incremental network adoption.Long-Term (2030)$2,200 – $3,500+Heavily tied to the long-range effects of fixed supply caps (21 million limit) and potential global demand for financial privacy infrastructure.
Disclaimer: Cryptocurrency markets are inherently volatile and subject to sudden regulatory shifts, macro trends, and sentiment fluctuations. This overview is for informational purposes and does not constitute financial advice.
CoinCodex
#zec #AEROSurges17%In24Hours #IranSaysItCapturedUSUnmannedSubmarine #ZcashRises45%WeeklyToHighestSince2016 #YenBreaks155NearingYearHigh
Zcash (ZEC) trades at approximately $1,180 to $1,225, backed by strong momentum and shifting dynamics within the privacy-focused asset sector.
Market Analysis
Shielded Supply Dynamics: A crucial fundamental driver is the continuous movement of tokens into shielded pools. On-chain data indicates that a major portion of circulating supply is held in private, long-term storage rather than active exchange order books, effectively creating a supply squeeze.
Technical Landscape: ZEC has experienced high volatility alongside a strong multi-month recovery. While relative strength index (RSI) indicators often hover near overbought thresholds during strong impulsive rallies, the structural baseline supported by moving averages points to sustained buyer interest.
CoinCodex
Evolving Utility: Upgrades focusing on network efficiency—such as transition paths to the Zebra consensus node and advanced threshold signature schemes (FROST)—are gradually improving institutional appeal for compliant, private enterprise asset management.
Phemex
Future Price Projections
Time HorizonProjected Price Range / TargetMarket Sentiment & OutlookShort-Term (Late 2026)$900 – $1,870High volatility with bullish momentum; potential to test higher resistance ceilings if broader market tailwinds persist.Medium-Term (2027 – 2028)$1,150 – $1,470Expected consolidation phase with gradual upward trajectory driven by persistent scarcity and incremental network adoption.Long-Term (2030)$2,200 – $3,500+Heavily tied to the long-range effects of fixed supply caps (21 million limit) and potential global demand for financial privacy infrastructure.
Disclaimer: Cryptocurrency markets are inherently volatile and subject to sudden regulatory shifts, macro trends, and sentiment fluctuations. This overview is for informational purposes and does not constitute financial advice.
CoinCodex
#zec #AEROSurges17%In24Hours #IranSaysItCapturedUSUnmannedSubmarine #ZcashRises45%WeeklyToHighestSince2016 #YenBreaks155NearingYearHigh
100
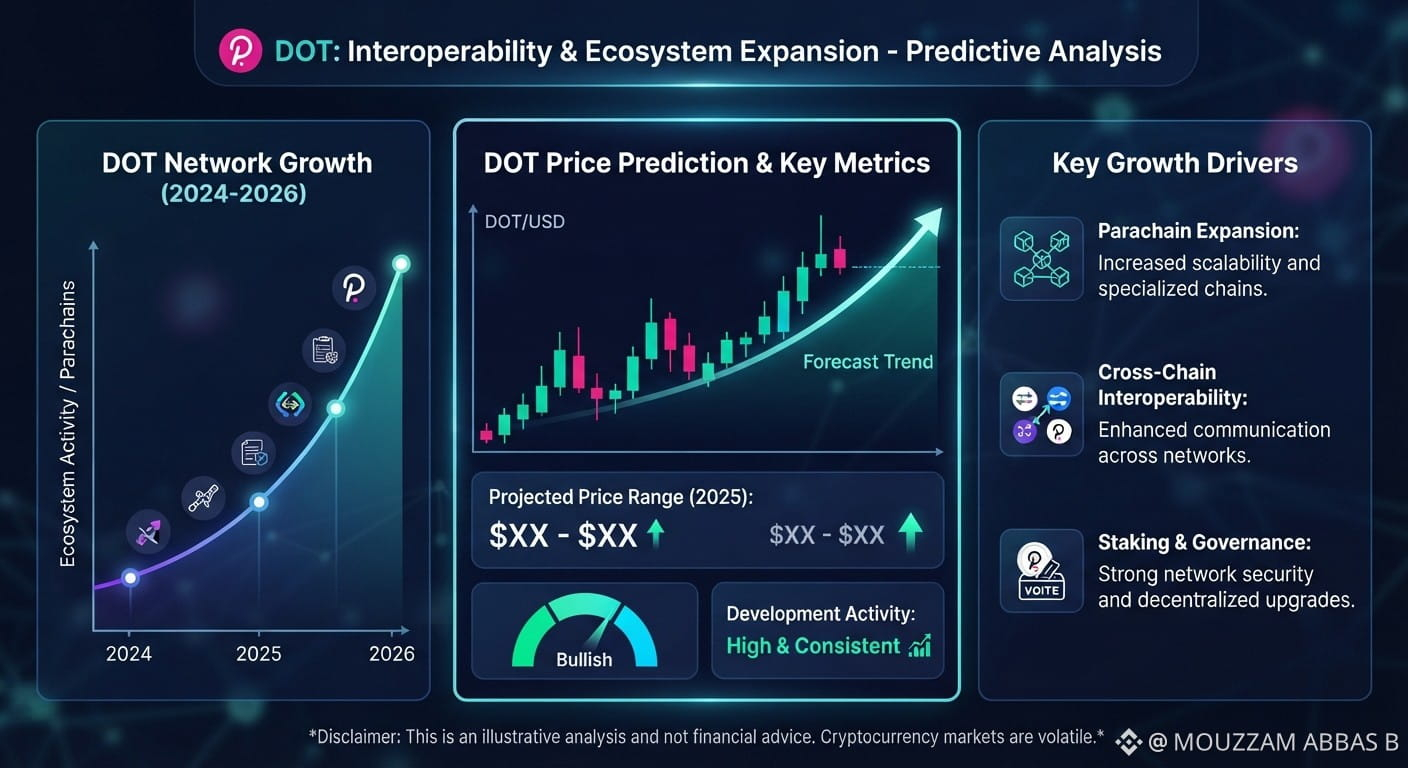
$DOT Polkadot (DOT) ngethithik phakathi kwe- $1.05 kuya ku-$1.10, idlula esigabeni esibucayi esichazwa wukuthuthukiswa okukhulu kwesakhiwo kanye nokushintsha kwemishini yemakethe.
Ukuhlaziywa Okuyisisekelo
Iqhaza Elidala Amathuba Ezobuchwepheshe: Izenzo zentengo zakamuva zibe nomthelela omkhulu yindlela yemakethe yezokuphuma (derivatives), kuhlanganise ne-short squeeze enamandla eye yaqeda izikhundla eziningi ezazikhuthaza ukwehla (bearish) futhi yadonsa inani elikhulu emifushane ngesikhathi esifushane.
CoinMarketCap
Ushintsho Lwe-Ecosystem & Tokenomics: Okushiwo ku-chain kukhombisa ushintsho oluya kuhlaka le-Polkadot 2.0 (oluhlanganisa i-Agile Coretime kanye nenguquko ezayo ye-JAM). Ukwengeza, ukulungiswa okuya ekubekweni okuqinile komkhawulo wokunikezwa (cishe ku-2.1B) kuhloswe ukunciphisa izingcindezi zokwehla kwamandla okwehla (inflation) zesikhathi eside ezake zathena umuzwa wabatshalizimali.
CoinMarketCap+ 1
Ukuxhumana Nenethiwekhi: Ukusebenzisana kwansuku zonke kubone ukukhuphuka okugqame kakhulu okukhuthazwe umsebenzi wokuthuthukisa kuma-devnets amasha, nakuba ukuqoqwa okuqhubekayo okungokwemvelo (organic spot accumulation) kusabalulekile ukuze kufakazeke ukuthi lezi zinyathelo zidlula nje ama-spike adalwe amandla okuxhaphaza isikhathi esifushane.
CoinMarketCap
Ukubikezela Intengo & Umbono
Ibanga Lesikhathi Esifushane: Ukusekelwa okusheshayo kuqinile cishe endaweni ye-$0.93–$1.00. Uma DOT ihlala ngaphezu kwalelo phansi elibonakala njengemfuneko yengqondo (psychological floor), ukungenzeka kokuthi iqhubeke ibheke ukumelana ku-$1.20 kuseza okuhle. Ngokuphambene, uma ilahlekelwa isiteji se-$0.93, lokho kungase kubangele ukubuyekezwa (retest) kwamabhande okudidiyela aphansi eduze kuka-$0.90.
CoinMarketCap+ 1
Umbono Wesikhathi Esiphakathi Kuze Kube Isikhathi Esinde: Izibikezelo ezihlanganiswe yi-consensus kulo lonke unyaka kulo lonke kuze kube ngu-2027 zikhomba indlela yokululama ethobekile (cautious recovery corridor). Kuncike esimweni esibanzi semakethe kanye nokuphumelela kokukhishwa kweziqephu ze-Polkadot 2.0, izilinganiso ezijwayelekile zithi amabanga okuhweba azungeze u-$1.50 kuya ku-$3.25 ezimeni zokuqhubeka okuhle (bullish continuation), kanti amamodeli alondolozayo abikezela ukunyakaza okuzungezile (range-bound) uma izinkinga zomnotho (macro headwinds) ziqhubeka.
Bitpanda
Yisiphi isikhathi esithile noma isu lokuhweba olugxile kulo ukuze uhlele ipotifoliyo yakho?
#DOTAnalysis #DOTUSD #AEROSurges17%In24Hours #DOT_UPDATE #IranSaysItCapturedUSUnmannedSubmarine
$DOT Polkadot (DOT) ngethithik phakathi kwe- $1.05 kuya ku-$1.10, idlula esigabeni esibucayi esichazwa wukuthuthukiswa okukhulu kwesakhiwo kanye nokushintsha kwemishini yemakethe.
Ukuhlaziywa Okuyisisekelo
Iqhaza Elidala Amathuba Ezobuchwepheshe: Izenzo zentengo zakamuva zibe nomthelela omkhulu yindlela yemakethe yezokuphuma (derivatives), kuhlanganise ne-short squeeze enamandla eye yaqeda izikhundla eziningi ezazikhuthaza ukwehla (bearish) futhi yadonsa inani elikhulu emifushane ngesikhathi esifushane.
CoinMarketCap
Ushintsho Lwe-Ecosystem & Tokenomics: Okushiwo ku-chain kukhombisa ushintsho oluya kuhlaka le-Polkadot 2.0 (oluhlanganisa i-Agile Coretime kanye nenguquko ezayo ye-JAM). Ukwengeza, ukulungiswa okuya ekubekweni okuqinile komkhawulo wokunikezwa (cishe ku-2.1B) kuhloswe ukunciphisa izingcindezi zokwehla kwamandla okwehla (inflation) zesikhathi eside ezake zathena umuzwa wabatshalizimali.
CoinMarketCap+ 1
Ukuxhumana Nenethiwekhi: Ukusebenzisana kwansuku zonke kubone ukukhuphuka okugqame kakhulu okukhuthazwe umsebenzi wokuthuthukisa kuma-devnets amasha, nakuba ukuqoqwa okuqhubekayo okungokwemvelo (organic spot accumulation) kusabalulekile ukuze kufakazeke ukuthi lezi zinyathelo zidlula nje ama-spike adalwe amandla okuxhaphaza isikhathi esifushane.
CoinMarketCap
Ukubikezela Intengo & Umbono
Ibanga Lesikhathi Esifushane: Ukusekelwa okusheshayo kuqinile cishe endaweni ye-$0.93–$1.00. Uma DOT ihlala ngaphezu kwalelo phansi elibonakala njengemfuneko yengqondo (psychological floor), ukungenzeka kokuthi iqhubeke ibheke ukumelana ku-$1.20 kuseza okuhle. Ngokuphambene, uma ilahlekelwa isiteji se-$0.93, lokho kungase kubangele ukubuyekezwa (retest) kwamabhande okudidiyela aphansi eduze kuka-$0.90.
CoinMarketCap+ 1
Umbono Wesikhathi Esiphakathi Kuze Kube Isikhathi Esinde: Izibikezelo ezihlanganiswe yi-consensus kulo lonke unyaka kulo lonke kuze kube ngu-2027 zikhomba indlela yokululama ethobekile (cautious recovery corridor). Kuncike esimweni esibanzi semakethe kanye nokuphumelela kokukhishwa kweziqephu ze-Polkadot 2.0, izilinganiso ezijwayelekile zithi amabanga okuhweba azungeze u-$1.50 kuya ku-$3.25 ezimeni zokuqhubeka okuhle (bullish continuation), kanti amamodeli alondolozayo abikezela ukunyakaza okuzungezile (range-bound) uma izinkinga zomnotho (macro headwinds) ziqhubeka.
Bitpanda
Yisiphi isikhathi esithile noma isu lokuhweba olugxile kulo ukuze uhlele ipotifoliyo yakho?
#DOTAnalysis #DOTUSD #AEROSurges17%In24Hours #DOT_UPDATE #IranSaysItCapturedUSUnmannedSubmarine
Ukuhlaziywa Okuyisisekelo
Iqhaza Elidala Amathuba Ezobuchwepheshe: Izenzo zentengo zakamuva zibe nomthelela omkhulu yindlela yemakethe yezokuphuma (derivatives), kuhlanganise ne-short squeeze enamandla eye yaqeda izikhundla eziningi ezazikhuthaza ukwehla (bearish) futhi yadonsa inani elikhulu emifushane ngesikhathi esifushane.
CoinMarketCap
Ushintsho Lwe-Ecosystem & Tokenomics: Okushiwo ku-chain kukhombisa ushintsho oluya kuhlaka le-Polkadot 2.0 (oluhlanganisa i-Agile Coretime kanye nenguquko ezayo ye-JAM). Ukwengeza, ukulungiswa okuya ekubekweni okuqinile komkhawulo wokunikezwa (cishe ku-2.1B) kuhloswe ukunciphisa izingcindezi zokwehla kwamandla okwehla (inflation) zesikhathi eside ezake zathena umuzwa wabatshalizimali.
CoinMarketCap+ 1
Ukuxhumana Nenethiwekhi: Ukusebenzisana kwansuku zonke kubone ukukhuphuka okugqame kakhulu okukhuthazwe umsebenzi wokuthuthukisa kuma-devnets amasha, nakuba ukuqoqwa okuqhubekayo okungokwemvelo (organic spot accumulation) kusabalulekile ukuze kufakazeke ukuthi lezi zinyathelo zidlula nje ama-spike adalwe amandla okuxhaphaza isikhathi esifushane.
CoinMarketCap
Ukubikezela Intengo & Umbono
Ibanga Lesikhathi Esifushane: Ukusekelwa okusheshayo kuqinile cishe endaweni ye-$0.93–$1.00. Uma DOT ihlala ngaphezu kwalelo phansi elibonakala njengemfuneko yengqondo (psychological floor), ukungenzeka kokuthi iqhubeke ibheke ukumelana ku-$1.20 kuseza okuhle. Ngokuphambene, uma ilahlekelwa isiteji se-$0.93, lokho kungase kubangele ukubuyekezwa (retest) kwamabhande okudidiyela aphansi eduze kuka-$0.90.
CoinMarketCap+ 1
Umbono Wesikhathi Esiphakathi Kuze Kube Isikhathi Esinde: Izibikezelo ezihlanganiswe yi-consensus kulo lonke unyaka kulo lonke kuze kube ngu-2027 zikhomba indlela yokululama ethobekile (cautious recovery corridor). Kuncike esimweni esibanzi semakethe kanye nokuphumelela kokukhishwa kweziqephu ze-Polkadot 2.0, izilinganiso ezijwayelekile zithi amabanga okuhweba azungeze u-$1.50 kuya ku-$3.25 ezimeni zokuqhubeka okuhle (bullish continuation), kanti amamodeli alondolozayo abikezela ukunyakaza okuzungezile (range-bound) uma izinkinga zomnotho (macro headwinds) ziqhubeka.
Bitpanda
Yisiphi isikhathi esithile noma isu lokuhweba olugxile kulo ukuze uhlele ipotifoliyo yakho?
#DOTAnalysis #DOTUSD #AEROSurges17%In24Hours #DOT_UPDATE #IranSaysItCapturedUSUnmannedSubmarine
101
$ETC I-Ethereum Classic (ETC) ukuhweba kubonisa isimo semakethe esinokucijwa okucacile esenziwa imodeli yokuvumelana i-proof-of-work (PoW), ukusekelwa okuqhubekayo kwabavukuzi, nokuhambisana okuqhubekayo nezitayela ezinkulu zezomnotho kanye nemikhuba yamanye ama-cryptocurrency.
Izisekelo Zemakethe & Ukusebenza
Ukuvumelana & Ukuvikeleka: Ngokusebenza njengenethiwekhi ye-PoW engashintshi (immutable), i-ETC iyathandwa ababambiqhaza abakwazisa ukuqina kwesivumelwano (protocol permanence) ngemuva kokuthi i-Ethereum ishintshele ku-proof-of-stake.
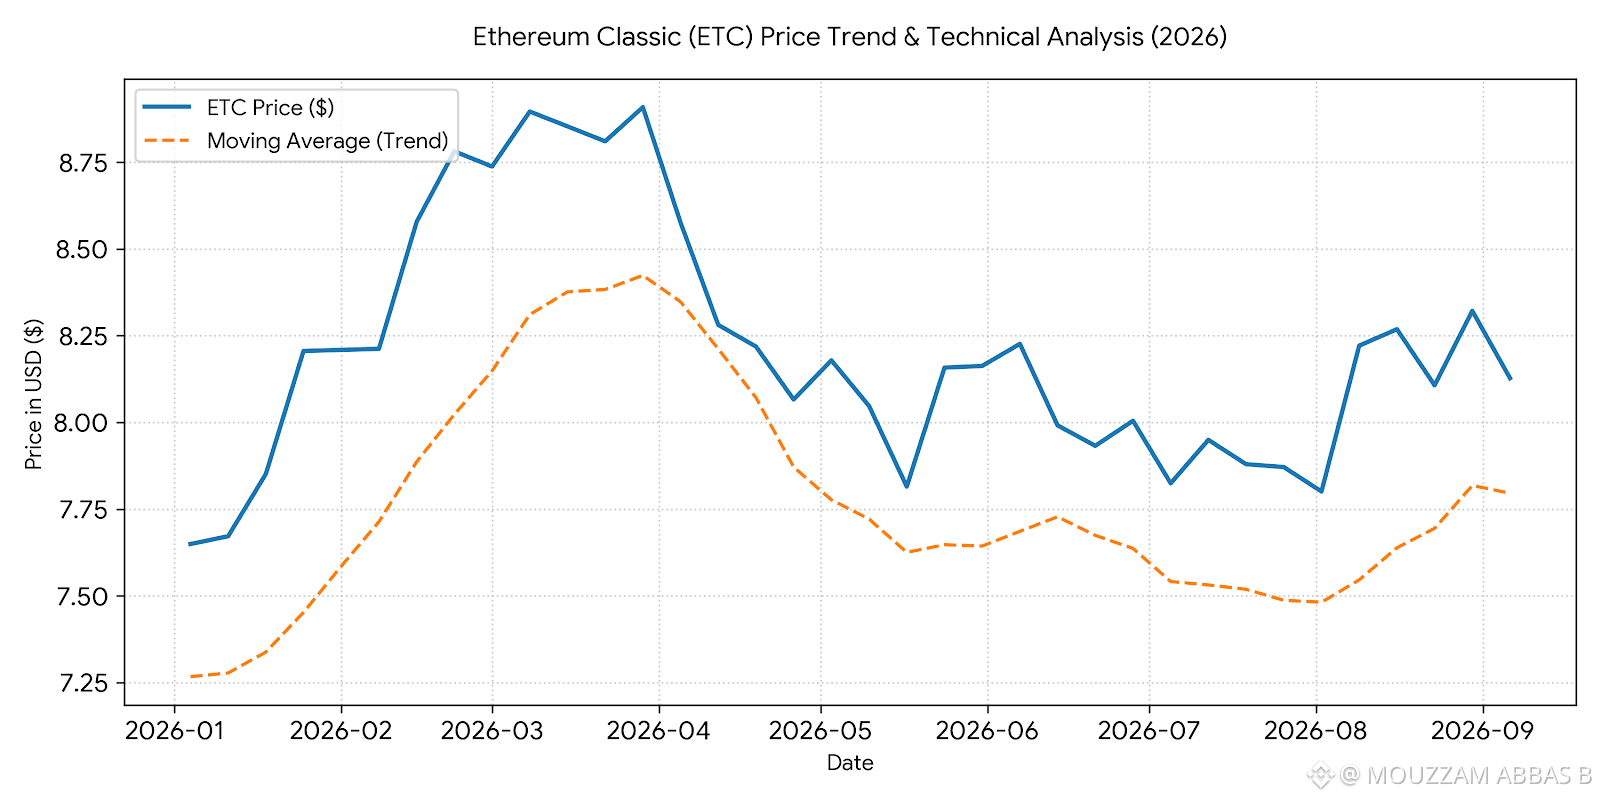
Ibanga Lentengo Yamanje: Ukuhweba kuvamise ukuhlala phakathi kuka-$7.50 no-$8.50, kukhombisa ukushintshashintsha kwesikhathi esifushane kanye nokuhambisana nokuguquguquka okuqhubekayo kwemakethe ye-crypto.
Izinkomba Zobuchwepheshe: Ama-moving averages abonisa isigaba sokuhlanganisa (consolidation), kanti amazinga okusekelwa asemqoka amisiwe eduze kuka-$7.50 futhi ukumelana kutholakala eduze no-$8.40.
Okucatshangelwayo Okubalulekile Ekuthengeni
Ukugeleza Kwemali (Liquidity) & Ukushintshashintsha (Volatility): I-ETC ngokuvamile iba nokushintshashintsha okuphezulu uma kuqhathaniswa nezimpahla ezinkulu (large-cap), okudinga ukuphathwa ngokuqinile kobungozi (risk management) kanye namazinga okukhawulela ukulahlekelwa (stop-loss) aqondiswe kusengaphambili.
Iziqalisi Zenethiwekhi (Network Catalysts): Izinguquko eziqhubekayo zenethiwekhi, ukusatshalaliswa kwamazinga e-hash rate kwabavukuzi, kanye nemizwa yemakethe ebanzi (broader market sentiment) kuhlala kungabashayeli abakhulu bokunquma umfutho wamanje wentengo.
{spot}(ETCUSDT)
#ETCUSDT #AEROSurges17%In24Hours #IranSaysItCapturedUSUnmannedSubmarine #USIranTradeTankerStrikesEscalate #ETCvsBTC
$ETC I-Ethereum Classic (ETC) ukuhweba kubonisa isimo semakethe esinokucijwa okucacile esenziwa imodeli yokuvumelana i-proof-of-work (PoW), ukusekelwa okuqhubekayo kwabavukuzi, nokuhambisana okuqhubekayo nezitayela ezinkulu zezomnotho kanye nemikhuba yamanye ama-cryptocurrency.
Izisekelo Zemakethe & Ukusebenza
Ukuvumelana & Ukuvikeleka: Ngokusebenza njengenethiwekhi ye-PoW engashintshi (immutable), i-ETC iyathandwa ababambiqhaza abakwazisa ukuqina kwesivumelwano (protocol permanence) ngemuva kokuthi i-Ethereum ishintshele ku-proof-of-stake.
Ibanga Lentengo Yamanje: Ukuhweba kuvamise ukuhlala phakathi kuka-$7.50 no-$8.50, kukhombisa ukushintshashintsha kwesikhathi esifushane kanye nokuhambisana nokuguquguquka okuqhubekayo kwemakethe ye-crypto.
Izinkomba Zobuchwepheshe: Ama-moving averages abonisa isigaba sokuhlanganisa (consolidation), kanti amazinga okusekelwa asemqoka amisiwe eduze kuka-$7.50 futhi ukumelana kutholakala eduze no-$8.40.
Okucatshangelwayo Okubalulekile Ekuthengeni
Ukugeleza Kwemali (Liquidity) & Ukushintshashintsha (Volatility): I-ETC ngokuvamile iba nokushintshashintsha okuphezulu uma kuqhathaniswa nezimpahla ezinkulu (large-cap), okudinga ukuphathwa ngokuqinile kobungozi (risk management) kanye namazinga okukhawulela ukulahlekelwa (stop-loss) aqondiswe kusengaphambili.
Iziqalisi Zenethiwekhi (Network Catalysts): Izinguquko eziqhubekayo zenethiwekhi, ukusatshalaliswa kwamazinga e-hash rate kwabavukuzi, kanye nemizwa yemakethe ebanzi (broader market sentiment) kuhlala kungabashayeli abakhulu bokunquma umfutho wamanje wentengo.
#ETCUSDT #AEROSurges17%In24Hours #IranSaysItCapturedUSUnmannedSubmarine #USIranTradeTankerStrikesEscalate #ETCvsBTC
Izisekelo Zemakethe & Ukusebenza
Ukuvumelana & Ukuvikeleka: Ngokusebenza njengenethiwekhi ye-PoW engashintshi (immutable), i-ETC iyathandwa ababambiqhaza abakwazisa ukuqina kwesivumelwano (protocol permanence) ngemuva kokuthi i-Ethereum ishintshele ku-proof-of-stake.
Ibanga Lentengo Yamanje: Ukuhweba kuvamise ukuhlala phakathi kuka-$7.50 no-$8.50, kukhombisa ukushintshashintsha kwesikhathi esifushane kanye nokuhambisana nokuguquguquka okuqhubekayo kwemakethe ye-crypto.
Izinkomba Zobuchwepheshe: Ama-moving averages abonisa isigaba sokuhlanganisa (consolidation), kanti amazinga okusekelwa asemqoka amisiwe eduze kuka-$7.50 futhi ukumelana kutholakala eduze no-$8.40.
Okucatshangelwayo Okubalulekile Ekuthengeni
Ukugeleza Kwemali (Liquidity) & Ukushintshashintsha (Volatility): I-ETC ngokuvamile iba nokushintshashintsha okuphezulu uma kuqhathaniswa nezimpahla ezinkulu (large-cap), okudinga ukuphathwa ngokuqinile kobungozi (risk management) kanye namazinga okukhawulela ukulahlekelwa (stop-loss) aqondiswe kusengaphambili.
Iziqalisi Zenethiwekhi (Network Catalysts): Izinguquko eziqhubekayo zenethiwekhi, ukusatshalaliswa kwamazinga e-hash rate kwabavukuzi, kanye nemizwa yemakethe ebanzi (broader market sentiment) kuhlala kungabashayeli abakhulu bokunquma umfutho wamanje wentengo.
#ETCUSDT #AEROSurges17%In24Hours #IranSaysItCapturedUSUnmannedSubmarine #USIranTradeTankerStrikesEscalate #ETCvsBTC
1
1
108
ເບິ່ງການແປ
$PUMP Analysis: The Mechanics of a "Pump" Coin
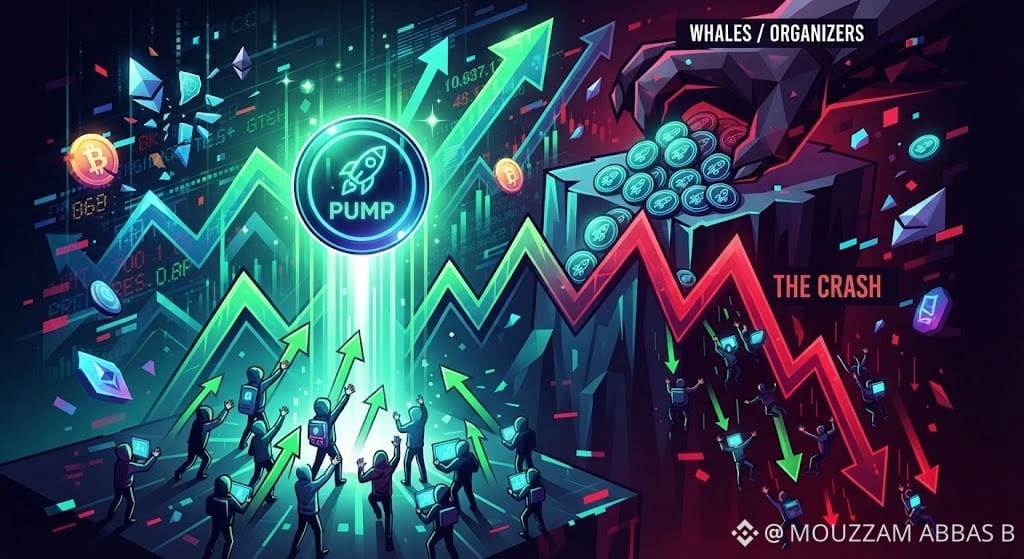
"Pump Coin" is not a specific cryptocurrency, but rather a colloquial term for any digital asset subject to an artificial, coordinated, and rapid price inflation—followed by an equally inevitable crash. This phenomenon, often orchestrated within private groups on platforms like Telegram or Discord, preys on market psychology and the fear of missing out (FOMO).
The Anatomy of a Pump and Dump:
The Accumulation Phase: Organizers quietly buy up a low-liquidity, low-market-cap coin (often a micro-cap altcoin or a meme token).
The Signal: The organizers announce the name of the coin simultaneously to their followers, triggering a massive, coordinated buy-in.
The Pump: The sudden influx of capital creates a vertical price spike. Unsuspecting retail traders, seeing the rapid gains on exchanges, rush to buy in, driving the price even higher.
The Dump: While new buyers are entering the market, the organizers and early buyers (who hold the majority of the supply) aggressively sell off their coins at the inflated price. This action instantly drains the liquidity and causes the price to crash precipitously.
Visualizing the Volatility:
The provided image illustrates the extreme volatility and artificial price action characteristic of a pump coin. It is a stark visual reminder of the risks associated with unregulated markets and the dangers of chasing hype without fundamental research
{spot}(PUMPUSDT)
#SaudiHaltsSouthernEnergySitesAfterAttacks #YenBreaks155NearingYearHigh #pumpiscoming #CanadaTariffsOnUSTakeEffect #IranSaysItHit3USShips3Tankers
$PUMP Analysis: The Mechanics of a "Pump" Coin
"Pump Coin" is not a specific cryptocurrency, but rather a colloquial term for any digital asset subject to an artificial, coordinated, and rapid price inflation—followed by an equally inevitable crash. This phenomenon, often orchestrated within private groups on platforms like Telegram or Discord, preys on market psychology and the fear of missing out (FOMO).
The Anatomy of a Pump and Dump:
The Accumulation Phase: Organizers quietly buy up a low-liquidity, low-market-cap coin (often a micro-cap altcoin or a meme token).
The Signal: The organizers announce the name of the coin simultaneously to their followers, triggering a massive, coordinated buy-in.
The Pump: The sudden influx of capital creates a vertical price spike. Unsuspecting retail traders, seeing the rapid gains on exchanges, rush to buy in, driving the price even higher.
The Dump: While new buyers are entering the market, the organizers and early buyers (who hold the majority of the supply) aggressively sell off their coins at the inflated price. This action instantly drains the liquidity and causes the price to crash precipitously.
Visualizing the Volatility:
The provided image illustrates the extreme volatility and artificial price action characteristic of a pump coin. It is a stark visual reminder of the risks associated with unregulated markets and the dangers of chasing hype without fundamental research
#SaudiHaltsSouthernEnergySitesAfterAttacks #YenBreaks155NearingYearHigh #pumpiscoming #CanadaTariffsOnUSTakeEffect #IranSaysItHit3USShips3Tankers
"Pump Coin" is not a specific cryptocurrency, but rather a colloquial term for any digital asset subject to an artificial, coordinated, and rapid price inflation—followed by an equally inevitable crash. This phenomenon, often orchestrated within private groups on platforms like Telegram or Discord, preys on market psychology and the fear of missing out (FOMO).
The Anatomy of a Pump and Dump:
The Accumulation Phase: Organizers quietly buy up a low-liquidity, low-market-cap coin (often a micro-cap altcoin or a meme token).
The Signal: The organizers announce the name of the coin simultaneously to their followers, triggering a massive, coordinated buy-in.
The Pump: The sudden influx of capital creates a vertical price spike. Unsuspecting retail traders, seeing the rapid gains on exchanges, rush to buy in, driving the price even higher.
The Dump: While new buyers are entering the market, the organizers and early buyers (who hold the majority of the supply) aggressively sell off their coins at the inflated price. This action instantly drains the liquidity and causes the price to crash precipitously.
Visualizing the Volatility:
The provided image illustrates the extreme volatility and artificial price action characteristic of a pump coin. It is a stark visual reminder of the risks associated with unregulated markets and the dangers of chasing hype without fundamental research
#SaudiHaltsSouthernEnergySitesAfterAttacks #YenBreaks155NearingYearHigh #pumpiscoming #CanadaTariffsOnUSTakeEffect #IranSaysItHit3USShips3Tankers
146
ເບິ່ງການແປ
$DOGE
DOGE Market Analysis — September 2026
Dogecoin ($DOGE) is hovering around the $0.090 mark, sitting at a crucial technical juncture. The market is caught at the apex of a multi-year consolidation pattern, balancing between vital support and make-or-break resistance zones.
Bullish Setup: Price action is testing the immediate resistance band near $0.087–$0.090. A confirmed breakout backed by strong volume could clear the path toward the $0.095 and $0.10 psychological thresholds.
Support & Risks: On the downside, holding the $0.080 support line is essential to keeping the short-term bullish structure intact. Failing to maintain this level risks a slide back toward the $0.075 and $0.068 major support zones.
Catalysts: Market sentiment continues to be heavily influenced by broader macro liquidity, shifting Federal Reserve expectations, and speculative volume typical of top meme assets.
{spot}(DOGEUSDT)
#USIranTradeTankerStrikesEscalate #Dogecoin #CanadaToImpose15%To50%TariffsOnUSGoods
#IranSaysItHit3USShips3Tankers #RussiaUkraineTradeStrikesKushnerWitkoffToKyiv
$DOGE
DOGE Market Analysis — September 2026
Dogecoin ($DOGE ) is hovering around the $0.090 mark, sitting at a crucial technical juncture. The market is caught at the apex of a multi-year consolidation pattern, balancing between vital support and make-or-break resistance zones.
Bullish Setup: Price action is testing the immediate resistance band near $0.087–$0.090. A confirmed breakout backed by strong volume could clear the path toward the $0.095 and $0.10 psychological thresholds.
Support & Risks: On the downside, holding the $0.080 support line is essential to keeping the short-term bullish structure intact. Failing to maintain this level risks a slide back toward the $0.075 and $0.068 major support zones.
Catalysts: Market sentiment continues to be heavily influenced by broader macro liquidity, shifting Federal Reserve expectations, and speculative volume typical of top meme assets.
#USIranTradeTankerStrikesEscalate #Dogecoin #CanadaToImpose15%To50%TariffsOnUSGoods
#IranSaysItHit3USShips3Tankers #RussiaUkraineTradeStrikesKushnerWitkoffToKyiv
DOGE Market Analysis — September 2026
Dogecoin ($DOGE ) is hovering around the $0.090 mark, sitting at a crucial technical juncture. The market is caught at the apex of a multi-year consolidation pattern, balancing between vital support and make-or-break resistance zones.
Bullish Setup: Price action is testing the immediate resistance band near $0.087–$0.090. A confirmed breakout backed by strong volume could clear the path toward the $0.095 and $0.10 psychological thresholds.
Support & Risks: On the downside, holding the $0.080 support line is essential to keeping the short-term bullish structure intact. Failing to maintain this level risks a slide back toward the $0.075 and $0.068 major support zones.
Catalysts: Market sentiment continues to be heavily influenced by broader macro liquidity, shifting Federal Reserve expectations, and speculative volume typical of top meme assets.
#USIranTradeTankerStrikesEscalate #Dogecoin #CanadaToImpose15%To50%TariffsOnUSGoods
#IranSaysItHit3USShips3Tankers #RussiaUkraineTradeStrikesKushnerWitkoffToKyiv
1
1
194
ເບິ່ງການແປ
Conversation with Gemini
$BTC bitcoin Analysis: Navigating the Mid-Range Consolidation
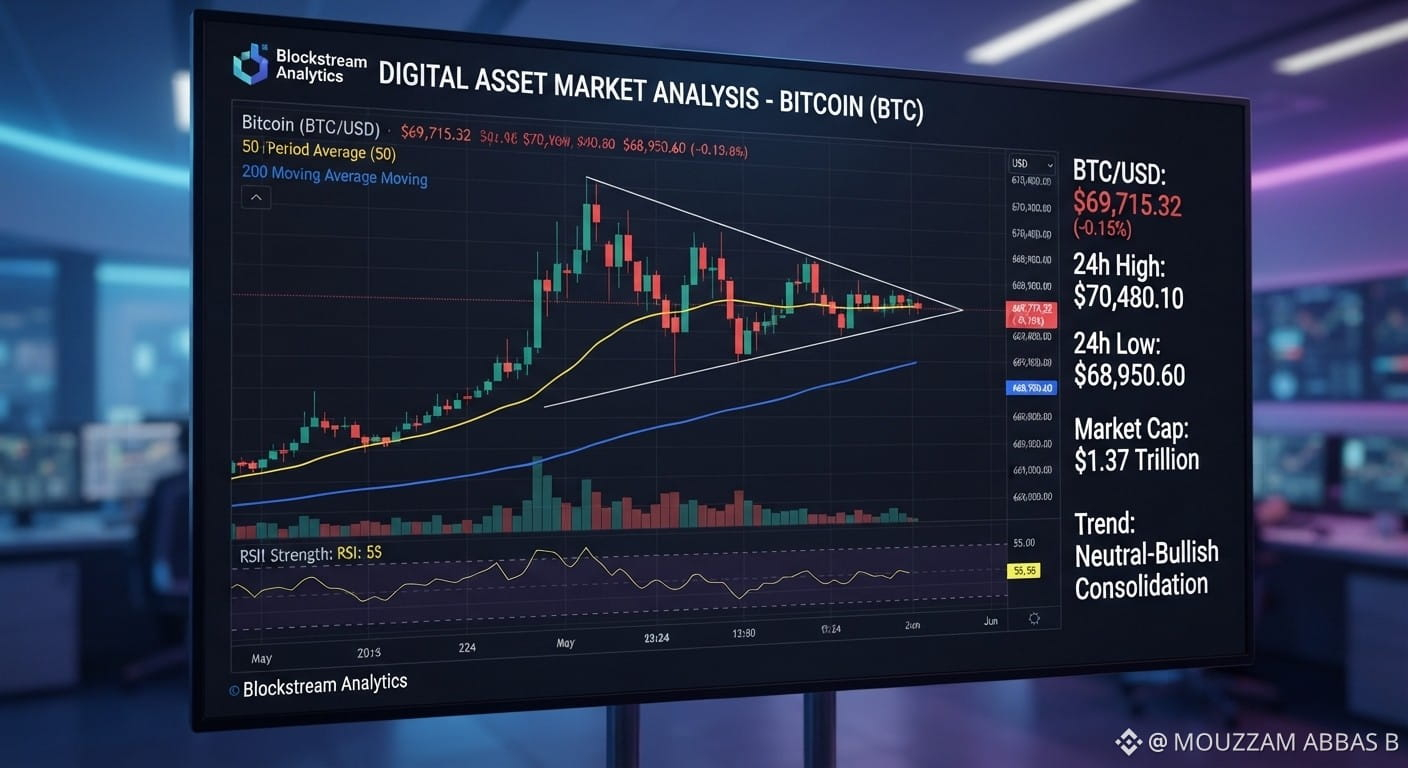
Bitcoin is currently navigating a critical consolidation phase, holding within a tight range between $68,500 and $71,500. Following a robust recovery from the mid-$60k support zone, the asset has established a well-defined symmetrical triangle pattern on the 4-hour timeframe.
Currently, BTC is trading at $69,700, just above the 200-period exponential moving average (EMA), indicating a slight bullish bias in the short term. Key findings from the chart analysis include:
Bullish Case: For Bitcoin to resume its trajectory toward the $72,000 and $73,800 resistance levels, it must decisively break above the triangle's upper trendline (approximately $70,300). Strong buy-side volume will be necessary to confirm this move.
Bearish Case: Conversely, if selling pressure increases, Bitcoin risks a breakdown below the pattern. Immediate downside support is located at $69,200, with stronger support at $68,500. A failure to hold this level could see a retest of the $67,200 major support zone.
The overall market structure remains bullish, but caution is advised in the current consolidation zone.
{spot}(BTCUSDT)
#USIranTradeTankerStrikesEscalate #bitcoin #CanadaToImpose15%To50%TariffsOnUSGoods #IMFSaysElSalvadorBTCNoPublicFunds #IranSaysItHit3USShips3Tankers
Conversation with Gemini
$BTC bitcoin Analysis: Navigating the Mid-Range Consolidation
Bitcoin is currently navigating a critical consolidation phase, holding within a tight range between $68,500 and $71,500. Following a robust recovery from the mid-$60k support zone, the asset has established a well-defined symmetrical triangle pattern on the 4-hour timeframe.
Currently, BTC is trading at $69,700, just above the 200-period exponential moving average (EMA), indicating a slight bullish bias in the short term. Key findings from the chart analysis include:
Bullish Case: For Bitcoin to resume its trajectory toward the $72,000 and $73,800 resistance levels, it must decisively break above the triangle's upper trendline (approximately $70,300). Strong buy-side volume will be necessary to confirm this move.
Bearish Case: Conversely, if selling pressure increases, Bitcoin risks a breakdown below the pattern. Immediate downside support is located at $69,200, with stronger support at $68,500. A failure to hold this level could see a retest of the $67,200 major support zone.
The overall market structure remains bullish, but caution is advised in the current consolidation zone.
#USIranTradeTankerStrikesEscalate #bitcoin #CanadaToImpose15%To50%TariffsOnUSGoods #IMFSaysElSalvadorBTCNoPublicFunds #IranSaysItHit3USShips3Tankers
$BTC bitcoin Analysis: Navigating the Mid-Range Consolidation
Bitcoin is currently navigating a critical consolidation phase, holding within a tight range between $68,500 and $71,500. Following a robust recovery from the mid-$60k support zone, the asset has established a well-defined symmetrical triangle pattern on the 4-hour timeframe.
Currently, BTC is trading at $69,700, just above the 200-period exponential moving average (EMA), indicating a slight bullish bias in the short term. Key findings from the chart analysis include:
Bullish Case: For Bitcoin to resume its trajectory toward the $72,000 and $73,800 resistance levels, it must decisively break above the triangle's upper trendline (approximately $70,300). Strong buy-side volume will be necessary to confirm this move.
Bearish Case: Conversely, if selling pressure increases, Bitcoin risks a breakdown below the pattern. Immediate downside support is located at $69,200, with stronger support at $68,500. A failure to hold this level could see a retest of the $67,200 major support zone.
The overall market structure remains bullish, but caution is advised in the current consolidation zone.
#USIranTradeTankerStrikesEscalate #bitcoin #CanadaToImpose15%To50%TariffsOnUSGoods #IMFSaysElSalvadorBTCNoPublicFunds #IranSaysItHit3USShips3Tankers
2
1
136
ເຂົ້າສູ່ລະບົບເພື່ອສຳຫຼວດເນື້ອຫາເພີ່ມເຕີມ
ເຂົ້າຮ່ວມກຸ່ມຜູ້ໃຊ້ຄຣິບໂຕທົ່ວໂລກໃນ Binance Square.
⚡️ ໄດ້ຮັບຂໍ້ມູນຫຼ້າສຸດ ແລະ ທີ່ມີປະໂຫຍດກ່ຽວກັບຄຣິບໂຕ.
💬 ໄດ້ຮັບຄວາມໄວ້ວາງໃຈຈາກຕະຫຼາດແລກປ່ຽນຄຣິບໂຕທີ່ໃຫຍ່ທີ່ສຸດໃນໂລກ.
👍 ຄົ້ນຫາຂໍ້ມູນເຊີງເລິກທີ່ແທ້ຈາກນັກສ້າງທີ່ໄດ້ຮັບການຢືນຢັນ.
ອີເມວ / ເບີໂທລະສັບ
ຫົວຂໍ້ທີ່ກໍາລັງນິຍົມ
USAugustPPIRisesLessThanExpected
56,057 views
849 ກຳລັງສົນທະນາ
🚨 US AUG PPI: ຂຶ້ນໜ້ອຍກວ່າທີ່ຄາດ! ເປັນບວກສໍາລັບ Crypto? 🚀
PPI +0.4% MoM ຕາມຄາດ, ແຕ່ CORE PPI ພຽງ +0.2% ທຽບກັບ +0.3% ທີ່ຄາດ - ເຢັນລົງ!
ຄວາມໝາຍຂອງມັນ:
• ອັດຕາເງິນເຟີ້ຂອງການຄ້າຂາຍສົ່ງເບົາກວ່າທີ່ກັງວົນ
• ໂອກາດຂອງການຂຶ້ນອັດຕາດອກເບ້ຍຂອງ Fed ຕອນນີ້ 62% - ແຕ່ມີສັນຍານແນວ dovish ມາ
• ຄາດວ່າການປັບປຸງ Core PCE ຈະອອກມາຕໍ່າລົງ - ເປັນບວກ
• BTC ປົກກະຕິຈະເພີ່ມຂຶ້ນເມື່ອ PPI ອ່ອນລົງ
ກອງປະຊຸມ Fed 15-16 ກັນຍາ - ຕອນນີ້ຕະຫຼາດຄາດຈະຢຸດ ບໍ່ແມ່ນຂຶ້ນ?
ນີ້ແມ່ນແສງສີຂຽວສໍາລັບການແຂ່ງຂຶ້ນໃນ Q4 ບໍ?
#Bitcoin #PPI #Fed #CryptoNews #BTC#usaugustppiriseslessthanexpected
True News
·1 ຖືກໃຈ
·1.4k views
SECApprovesNasdaqTexasCommodityTrustRule
30,367 views
616 ກຳລັງສົນທະນາ
ECBRaisesRatesSecondTimeTo2.5%
27,245 views
440 ກຳລັງສົນທະນາ