
Crypto Inside Official
224 ໂພສ

Crypto Inside Official
ລາຍງານ
ບລັອກຜູ້ໃຊ້
Follow Binance Official Page for the latest Update.
108 ກໍາລັງຕິດຕາມ
76 ຜູ້ຕິດຕາມ
237 Liked
ໂພສ
ທັງໝົດ
ວົງຢືມ
ປັກໝຸດ
[Claim Red packet and win Big Reward](https://app.binance.com/uni-qr/ArcywWAb?utm_medium=web_share_copy)
Red packet Give way Claim and win reeard
First come first serve
Claim Red packet and win Big Reward
Red packet Give way Claim and win reeard
First come first serve
Red packet Give way Claim and win reeard
First come first serve

7
1
44
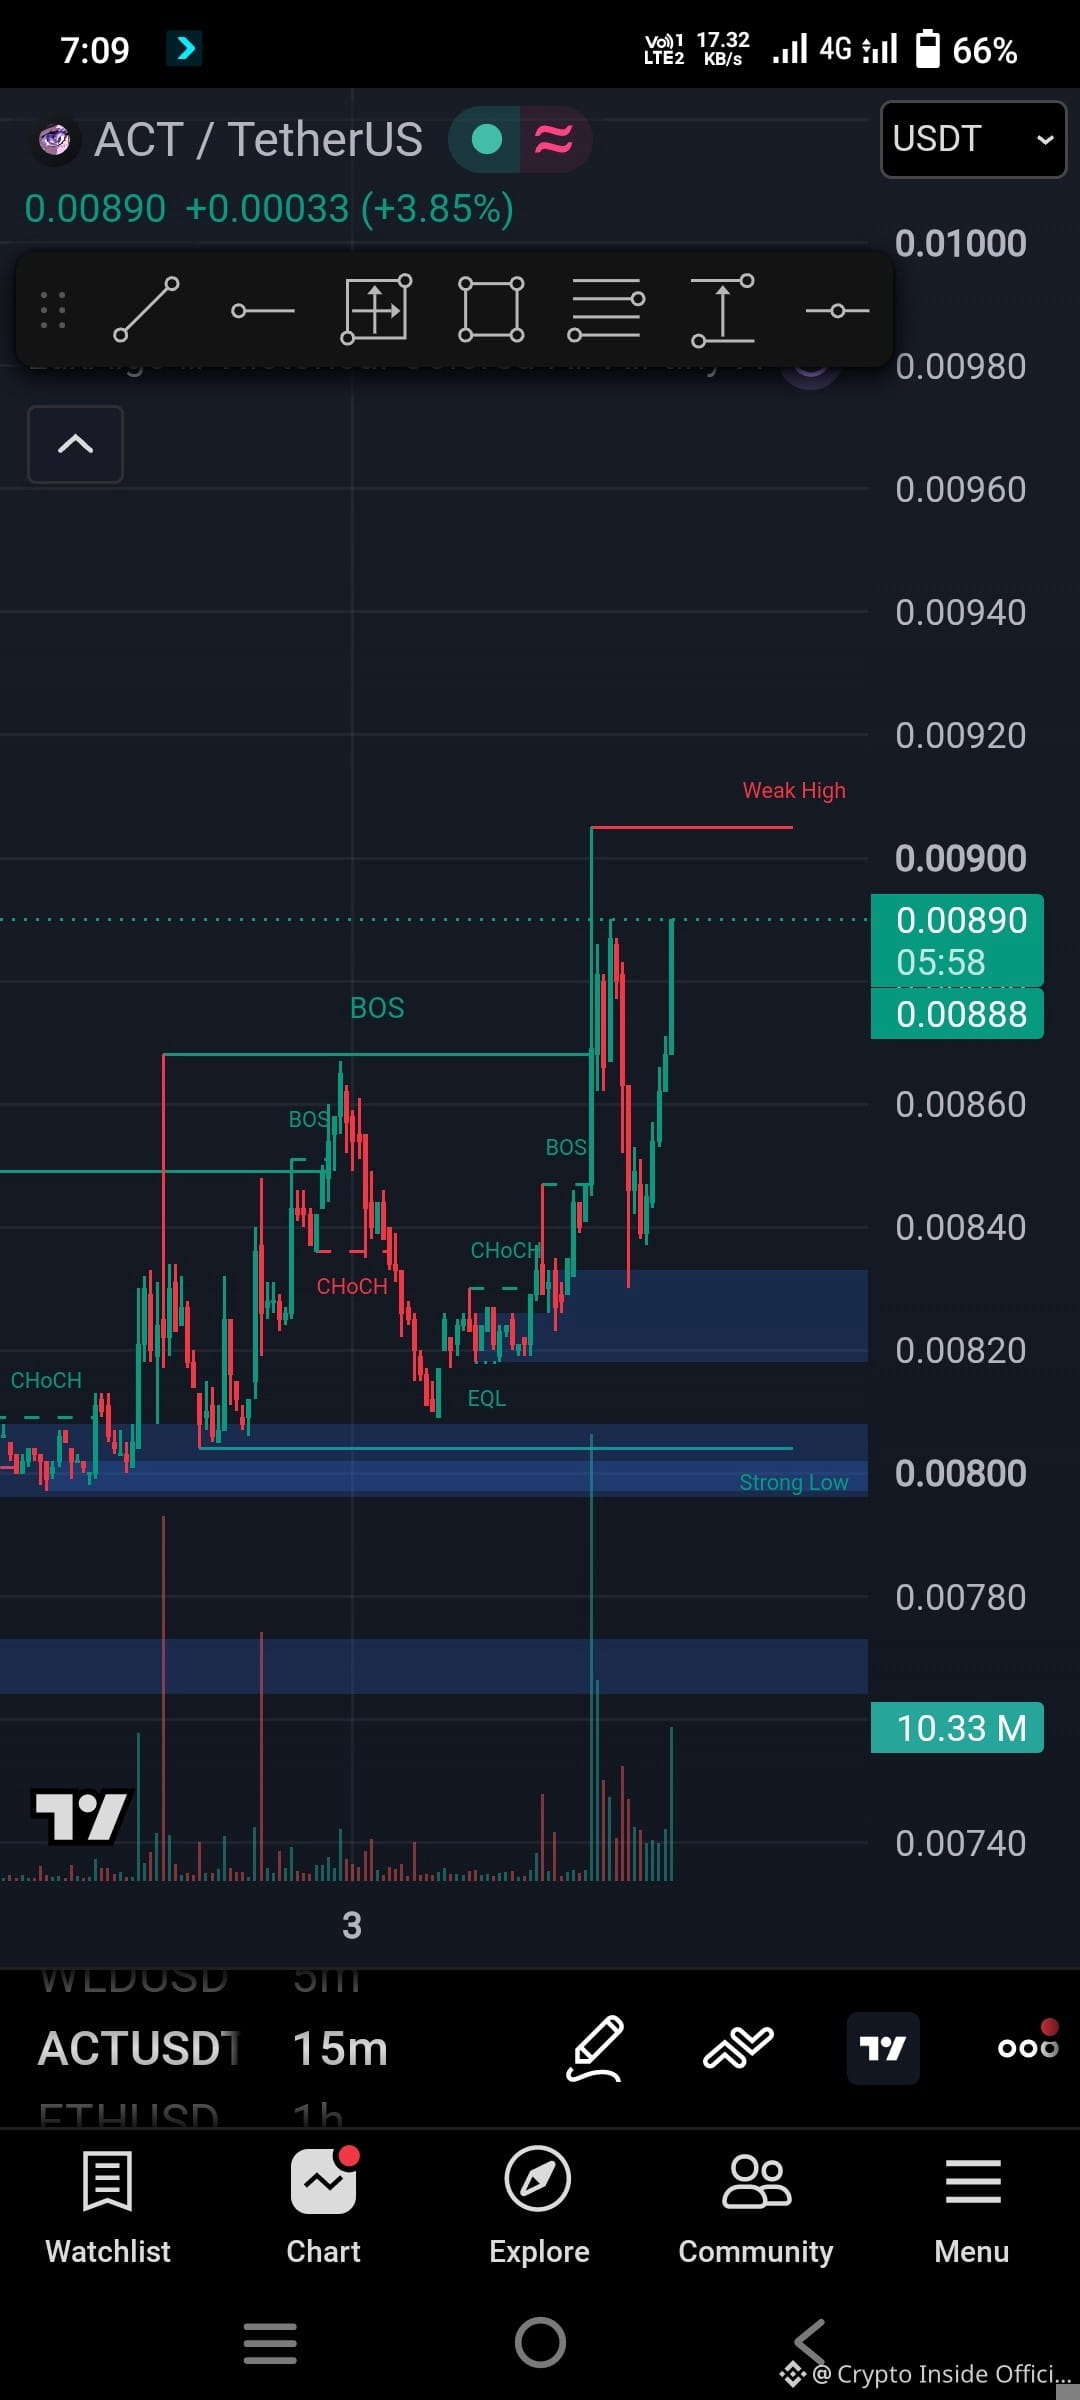
Technical and Fundamental Analysis $ACT On $SOL Blockchain
Market Overview
Current Price: ~$0.0081 – $0.0084 USD
24-Hour Range: ~$0.00757 – $0.00856 USD
24-Hour Change: Down roughly 4% to 5%
Market Sentiment: Short-term trend leans bearish/neutral, with moving averages pointing to prevailing overhead pressure.
Key Technical Levels
Immediate Support: ~$0.0075 – $0.0076 USD (Recent 24h low territory; holding this zone is critical to prevent deeper slides).
Immediate Resistance:
R1: ~$0.00886 USD
R2: ~$0.00925 USD
D
Moving Averages (Daily): The 20-day EMA sits near $0.00898, and the 50-day EMA sits around $0.00961, acting as immediate dynamic resistance lines.
Trade Setup Considerations
Scenario A: Range-Bound / Mean Reversion (Short-Term Scalping)
Bias: Neutral to cautious long on dips.
Entry Zone: Look for stabilization and bullish price action closer to immediate support ($0.0076 – $0.0078).
Take Profit: Scale out incrementally near short-term resistance ($0.0085 – $0.0088).
Stop Loss: Tight stop just below structural support (e.g., under $0.0074).
Scenario B: Breakdown Continuation (Short / Momentum Play)
Bias: Bearish continuation if macro weakness persists.
Entry Zone: On a confirmed high-volume breakdown and retest failure below $0.0075.
Take Profit: Target lower liquidity pockets toward $0.0070 or lower.
Stop Loss: Just above the breakdown pivot level (e.g., above $0.0078).
Note: Given the high short-term volatility and weak momentum on higher timeframes, keep position sizes disciplined and monitor order book depth closely for sudden shifts.
$BTC #solana #Act
Technical and Fundamental Analysis $ACT On $SOL Blockchain
Market Overview
Current Price: ~$0.0081 – $0.0084 USD
24-Hour Range: ~$0.00757 – $0.00856 USD
24-Hour Change: Down roughly 4% to 5%
Market Sentiment: Short-term trend leans bearish/neutral, with moving averages pointing to prevailing overhead pressure.
Key Technical Levels
Immediate Support: ~$0.0075 – $0.0076 USD (Recent 24h low territory; holding this zone is critical to prevent deeper slides).
Immediate Resistance:
R1: ~$0.00886 USD
R2: ~$0.00925 USD
D
Moving Averages (Daily): The 20-day EMA sits near $0.00898, and the 50-day EMA sits around $0.00961, acting as immediate dynamic resistance lines.
Trade Setup Considerations
Scenario A: Range-Bound / Mean Reversion (Short-Term Scalping)
Bias: Neutral to cautious long on dips.
Entry Zone: Look for stabilization and bullish price action closer to immediate support ($0.0076 – $0.0078).
Take Profit: Scale out incrementally near short-term resistance ($0.0085 – $0.0088).
Stop Loss: Tight stop just below structural support (e.g., under $0.0074).
Scenario B: Breakdown Continuation (Short / Momentum Play)
Bias: Bearish continuation if macro weakness persists.
Entry Zone: On a confirmed high-volume breakdown and retest failure below $0.0075.
Take Profit: Target lower liquidity pockets toward $0.0070 or lower.
Stop Loss: Just above the breakdown pivot level (e.g., above $0.0078).
Note: Given the high short-term volatility and weak momentum on higher timeframes, keep position sizes disciplined and monitor order book depth closely for sudden shifts.
$BTC #solana #Act
Market Overview
Current Price: ~$0.0081 – $0.0084 USD
24-Hour Range: ~$0.00757 – $0.00856 USD
24-Hour Change: Down roughly 4% to 5%
Market Sentiment: Short-term trend leans bearish/neutral, with moving averages pointing to prevailing overhead pressure.
Key Technical Levels
Immediate Support: ~$0.0075 – $0.0076 USD (Recent 24h low territory; holding this zone is critical to prevent deeper slides).
Immediate Resistance:
R1: ~$0.00886 USD
R2: ~$0.00925 USD
D
Moving Averages (Daily): The 20-day EMA sits near $0.00898, and the 50-day EMA sits around $0.00961, acting as immediate dynamic resistance lines.
Trade Setup Considerations
Scenario A: Range-Bound / Mean Reversion (Short-Term Scalping)
Bias: Neutral to cautious long on dips.
Entry Zone: Look for stabilization and bullish price action closer to immediate support ($0.0076 – $0.0078).
Take Profit: Scale out incrementally near short-term resistance ($0.0085 – $0.0088).
Stop Loss: Tight stop just below structural support (e.g., under $0.0074).
Scenario B: Breakdown Continuation (Short / Momentum Play)
Bias: Bearish continuation if macro weakness persists.
Entry Zone: On a confirmed high-volume breakdown and retest failure below $0.0075.
Take Profit: Target lower liquidity pockets toward $0.0070 or lower.
Stop Loss: Just above the breakdown pivot level (e.g., above $0.0078).
Note: Given the high short-term volatility and weak momentum on higher timeframes, keep position sizes disciplined and monitor order book depth closely for sudden shifts.
$BTC #solana #Act
1
494
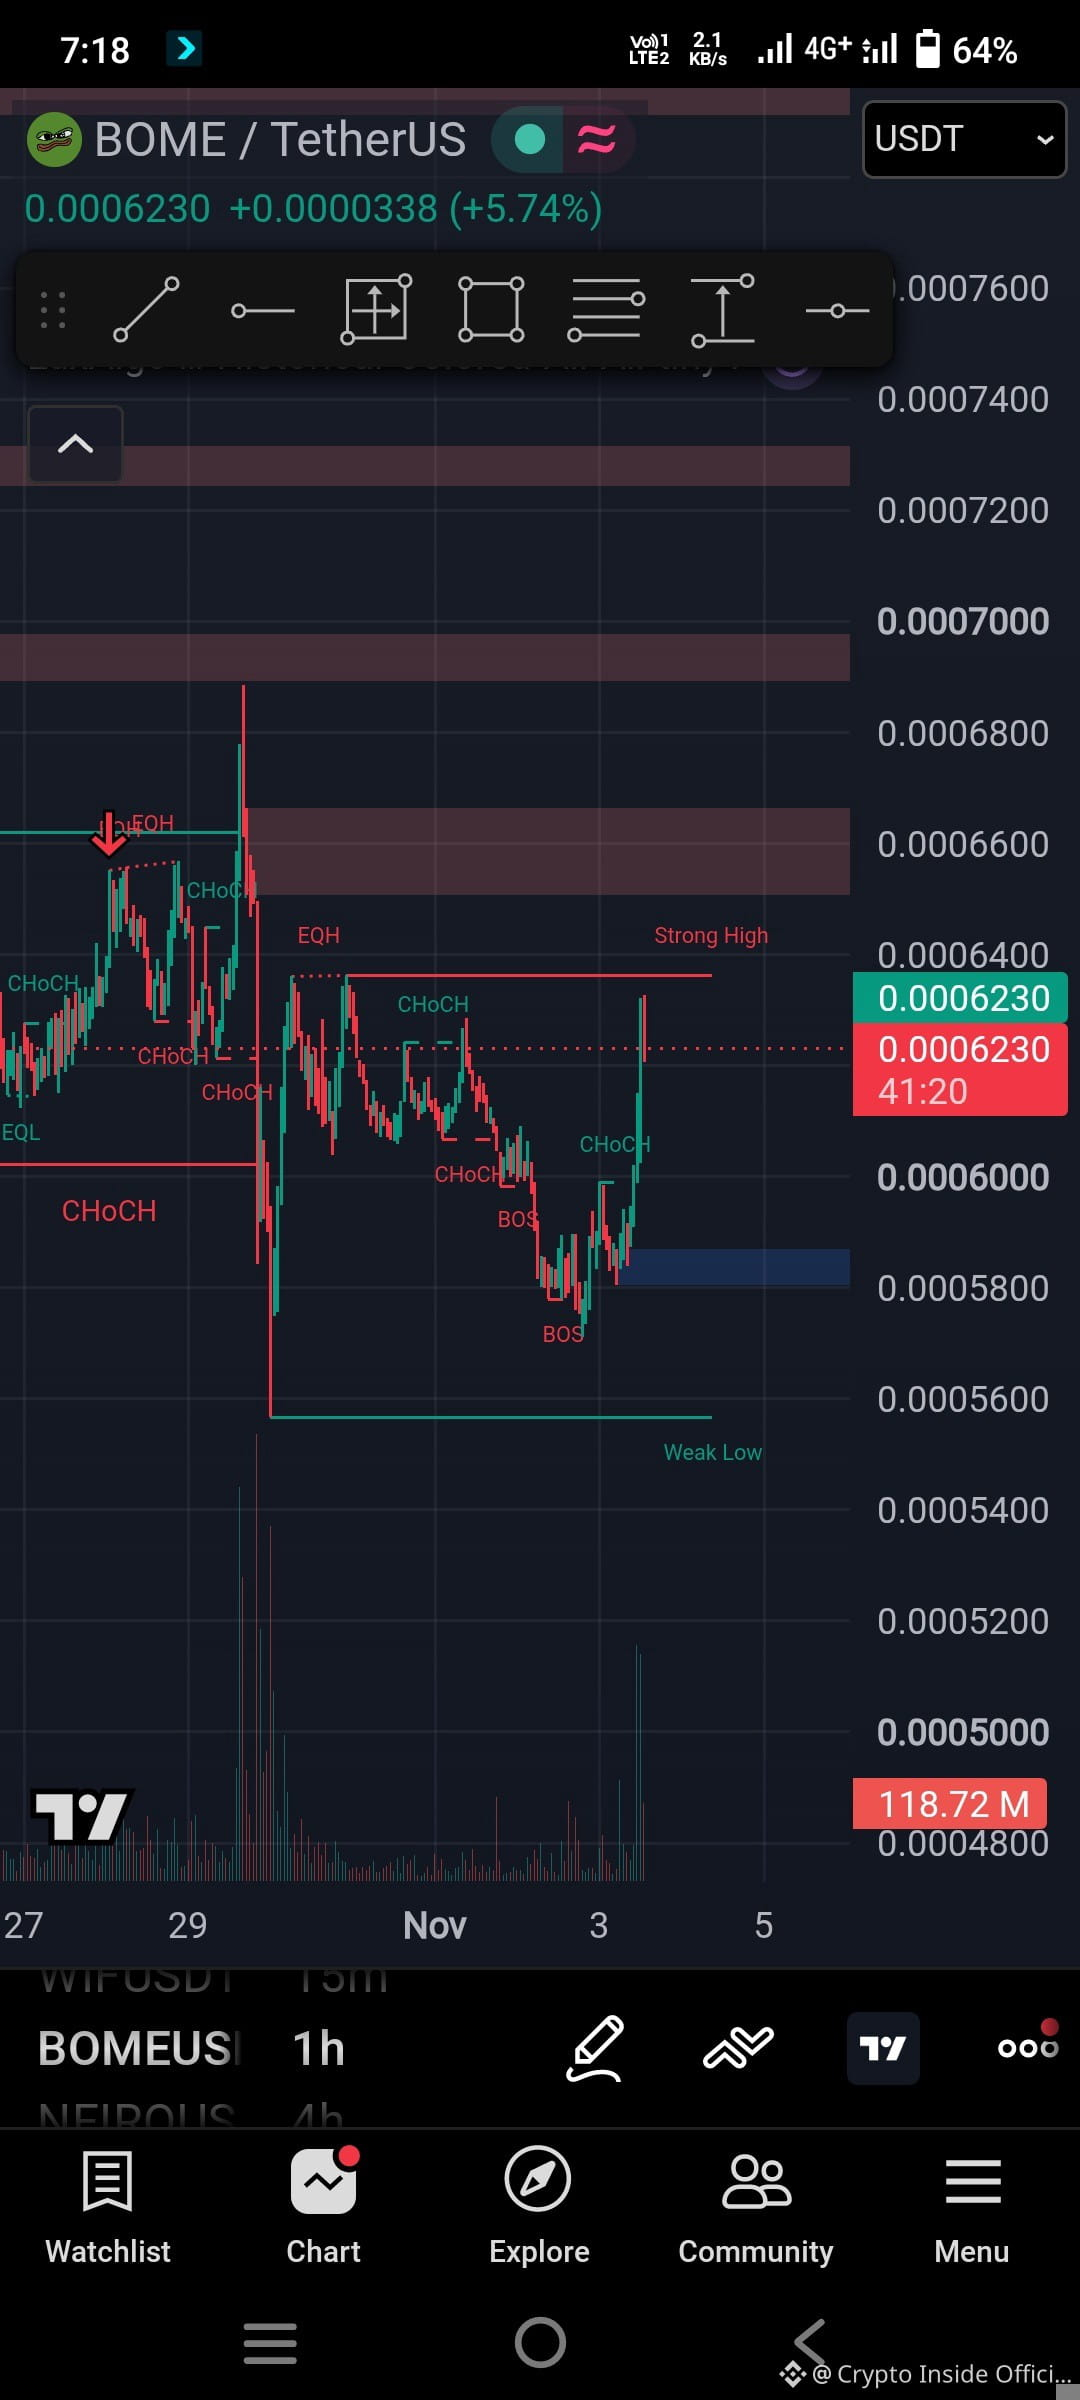
Technical and Fundamental Analysis Of $BOME On Solana Blockchain
📊 Market Overview
Current Price: ~$0.00060 - $0.00061
24-Hour Range: ~$0.00057 – $0.00061
Market Capitalization: ~$41M – $46M
24-Hour Volume: ~$6M – $7.5M
Market Context: BOME is moving within a tight consolidation band following recent minor pullbacks. Volume remains modest, which is typical for mid-tier meme tokens waiting for a broader market catalyst or a breakout from local resistance.
📉 Spot Trading Setup
Since meme coins like BOME are heavily driven by liquidity shifts and momentum, the strategy focuses on key technical levels for risk-defined entries.
1. Scenario A: Range Bounce / Support Rebound (Long Setup)
Idea: Buying near confirmed local support if the price stabilizes without heavy sell volume.
Entry Zone: $0.00057 – $0.00058 (near recent 24h lows)
Stop Loss: $0.00054 (strict cut-loss just below support breakdown to protect capital)
Take Profit Targets:
TP1: $0.00063
TP2: $0.00067
TP3: $0.00072 (Major resistance zone)
2. Scenario B: Momentum Breakout (Aggressive Long)
Idea: Entering only after a strong volume expansion pushes the price out of its current tight consolidation range.
Confirmation Trigger: A 4-hour candle close above $0.00062 accompanied by a spike in trading volume.
Stop Loss: $0.00058 (re-entry boundary)
Take Profit Targets:
TP1: $0.00068
TP2: $0.00075
⚠️ Risk Management Notes
Volatility Warning: BOME exhibits high beta relative to major crypto assets. Sudden market shifts (especially movements in Bitcoin or Solana) can cause rapid wicks.
Position Sizing: Keep position sizing conservative given the lower mid-range volume phase.
$BTC $SOL #Bome
Technical and Fundamental Analysis Of $BOME On Solana Blockchain
📊 Market Overview
Current Price: ~$0.00060 - $0.00061
24-Hour Range: ~$0.00057 – $0.00061
Market Capitalization: ~$41M – $46M
24-Hour Volume: ~$6M – $7.5M
Market Context: BOME is moving within a tight consolidation band following recent minor pullbacks. Volume remains modest, which is typical for mid-tier meme tokens waiting for a broader market catalyst or a breakout from local resistance.
📉 Spot Trading Setup
Since meme coins like BOME are heavily driven by liquidity shifts and momentum, the strategy focuses on key technical levels for risk-defined entries.
1. Scenario A: Range Bounce / Support Rebound (Long Setup)
Idea: Buying near confirmed local support if the price stabilizes without heavy sell volume.
Entry Zone: $0.00057 – $0.00058 (near recent 24h lows)
Stop Loss: $0.00054 (strict cut-loss just below support breakdown to protect capital)
Take Profit Targets:
TP1: $0.00063
TP2: $0.00067
TP3: $0.00072 (Major resistance zone)
2. Scenario B: Momentum Breakout (Aggressive Long)
Idea: Entering only after a strong volume expansion pushes the price out of its current tight consolidation range.
Confirmation Trigger: A 4-hour candle close above $0.00062 accompanied by a spike in trading volume.
Stop Loss: $0.00058 (re-entry boundary)
Take Profit Targets:
TP1: $0.00068
TP2: $0.00075
⚠️ Risk Management Notes
Volatility Warning: BOME exhibits high beta relative to major crypto assets. Sudden market shifts (especially movements in Bitcoin or Solana) can cause rapid wicks.
Position Sizing: Keep position sizing conservative given the lower mid-range volume phase.
$BTC $SOL #Bome
📊 Market Overview
Current Price: ~$0.00060 - $0.00061
24-Hour Range: ~$0.00057 – $0.00061
Market Capitalization: ~$41M – $46M
24-Hour Volume: ~$6M – $7.5M
Market Context: BOME is moving within a tight consolidation band following recent minor pullbacks. Volume remains modest, which is typical for mid-tier meme tokens waiting for a broader market catalyst or a breakout from local resistance.
📉 Spot Trading Setup
Since meme coins like BOME are heavily driven by liquidity shifts and momentum, the strategy focuses on key technical levels for risk-defined entries.
1. Scenario A: Range Bounce / Support Rebound (Long Setup)
Idea: Buying near confirmed local support if the price stabilizes without heavy sell volume.
Entry Zone: $0.00057 – $0.00058 (near recent 24h lows)
Stop Loss: $0.00054 (strict cut-loss just below support breakdown to protect capital)
Take Profit Targets:
TP1: $0.00063
TP2: $0.00067
TP3: $0.00072 (Major resistance zone)
2. Scenario B: Momentum Breakout (Aggressive Long)
Idea: Entering only after a strong volume expansion pushes the price out of its current tight consolidation range.
Confirmation Trigger: A 4-hour candle close above $0.00062 accompanied by a spike in trading volume.
Stop Loss: $0.00058 (re-entry boundary)
Take Profit Targets:
TP1: $0.00068
TP2: $0.00075
⚠️ Risk Management Notes
Volatility Warning: BOME exhibits high beta relative to major crypto assets. Sudden market shifts (especially movements in Bitcoin or Solana) can cause rapid wicks.
Position Sizing: Keep position sizing conservative given the lower mid-range volume phase.
$BTC $SOL #Bome
2
421
The crypto market is up 0.94% to $2.7T in 24h, primarily driven by a major institutional adoption catalyst for XRP and Ripple's ecosystem. It shows a strong correlation with the S&P 500 (89%) and Gold (90%), indicating a shared macro-driven move.
Primary reason: A cluster of high-profile Ripple announcements, including a partnership with Robinhood and BNY Mellon adding XRP custody, boosted institutional confidence and triggered positive sentiment.
Secondary reasons: The market was primed for a bounce from oversold technical levels, with the Fear & Greed Index at a neutral 45 and RSI readings below 40. Strong correlations with rising equity and gold markets provided macro tailwinds.
Near-term market outlook: If the positive sentiment from Ripple's Swell conference holds, the market could test the $2.73T–$2.81T resistance zone. A break below the $2.7T pivot would invalidate the bounce and signal a return to the recent downtrend.
$BTC $ETH
The crypto market is up 0.94% to $2.7T in 24h, primarily driven by a major institutional adoption catalyst for XRP and Ripple's ecosystem. It shows a strong correlation with the S&P 500 (89%) and Gold (90%), indicating a shared macro-driven move.
Primary reason: A cluster of high-profile Ripple announcements, including a partnership with Robinhood and BNY Mellon adding XRP custody, boosted institutional confidence and triggered positive sentiment.
Secondary reasons: The market was primed for a bounce from oversold technical levels, with the Fear & Greed Index at a neutral 45 and RSI readings below 40. Strong correlations with rising equity and gold markets provided macro tailwinds.
Near-term market outlook: If the positive sentiment from Ripple's Swell conference holds, the market could test the $2.73T–$2.81T resistance zone. A break below the $2.7T pivot would invalidate the bounce and signal a return to the recent downtrend.
$BTC $ETH
Primary reason: A cluster of high-profile Ripple announcements, including a partnership with Robinhood and BNY Mellon adding XRP custody, boosted institutional confidence and triggered positive sentiment.
Secondary reasons: The market was primed for a bounce from oversold technical levels, with the Fear & Greed Index at a neutral 45 and RSI readings below 40. Strong correlations with rising equity and gold markets provided macro tailwinds.
Near-term market outlook: If the positive sentiment from Ripple's Swell conference holds, the market could test the $2.73T–$2.81T resistance zone. A break below the $2.7T pivot would invalidate the bounce and signal a return to the recent downtrend.
$BTC $ETH
1
246
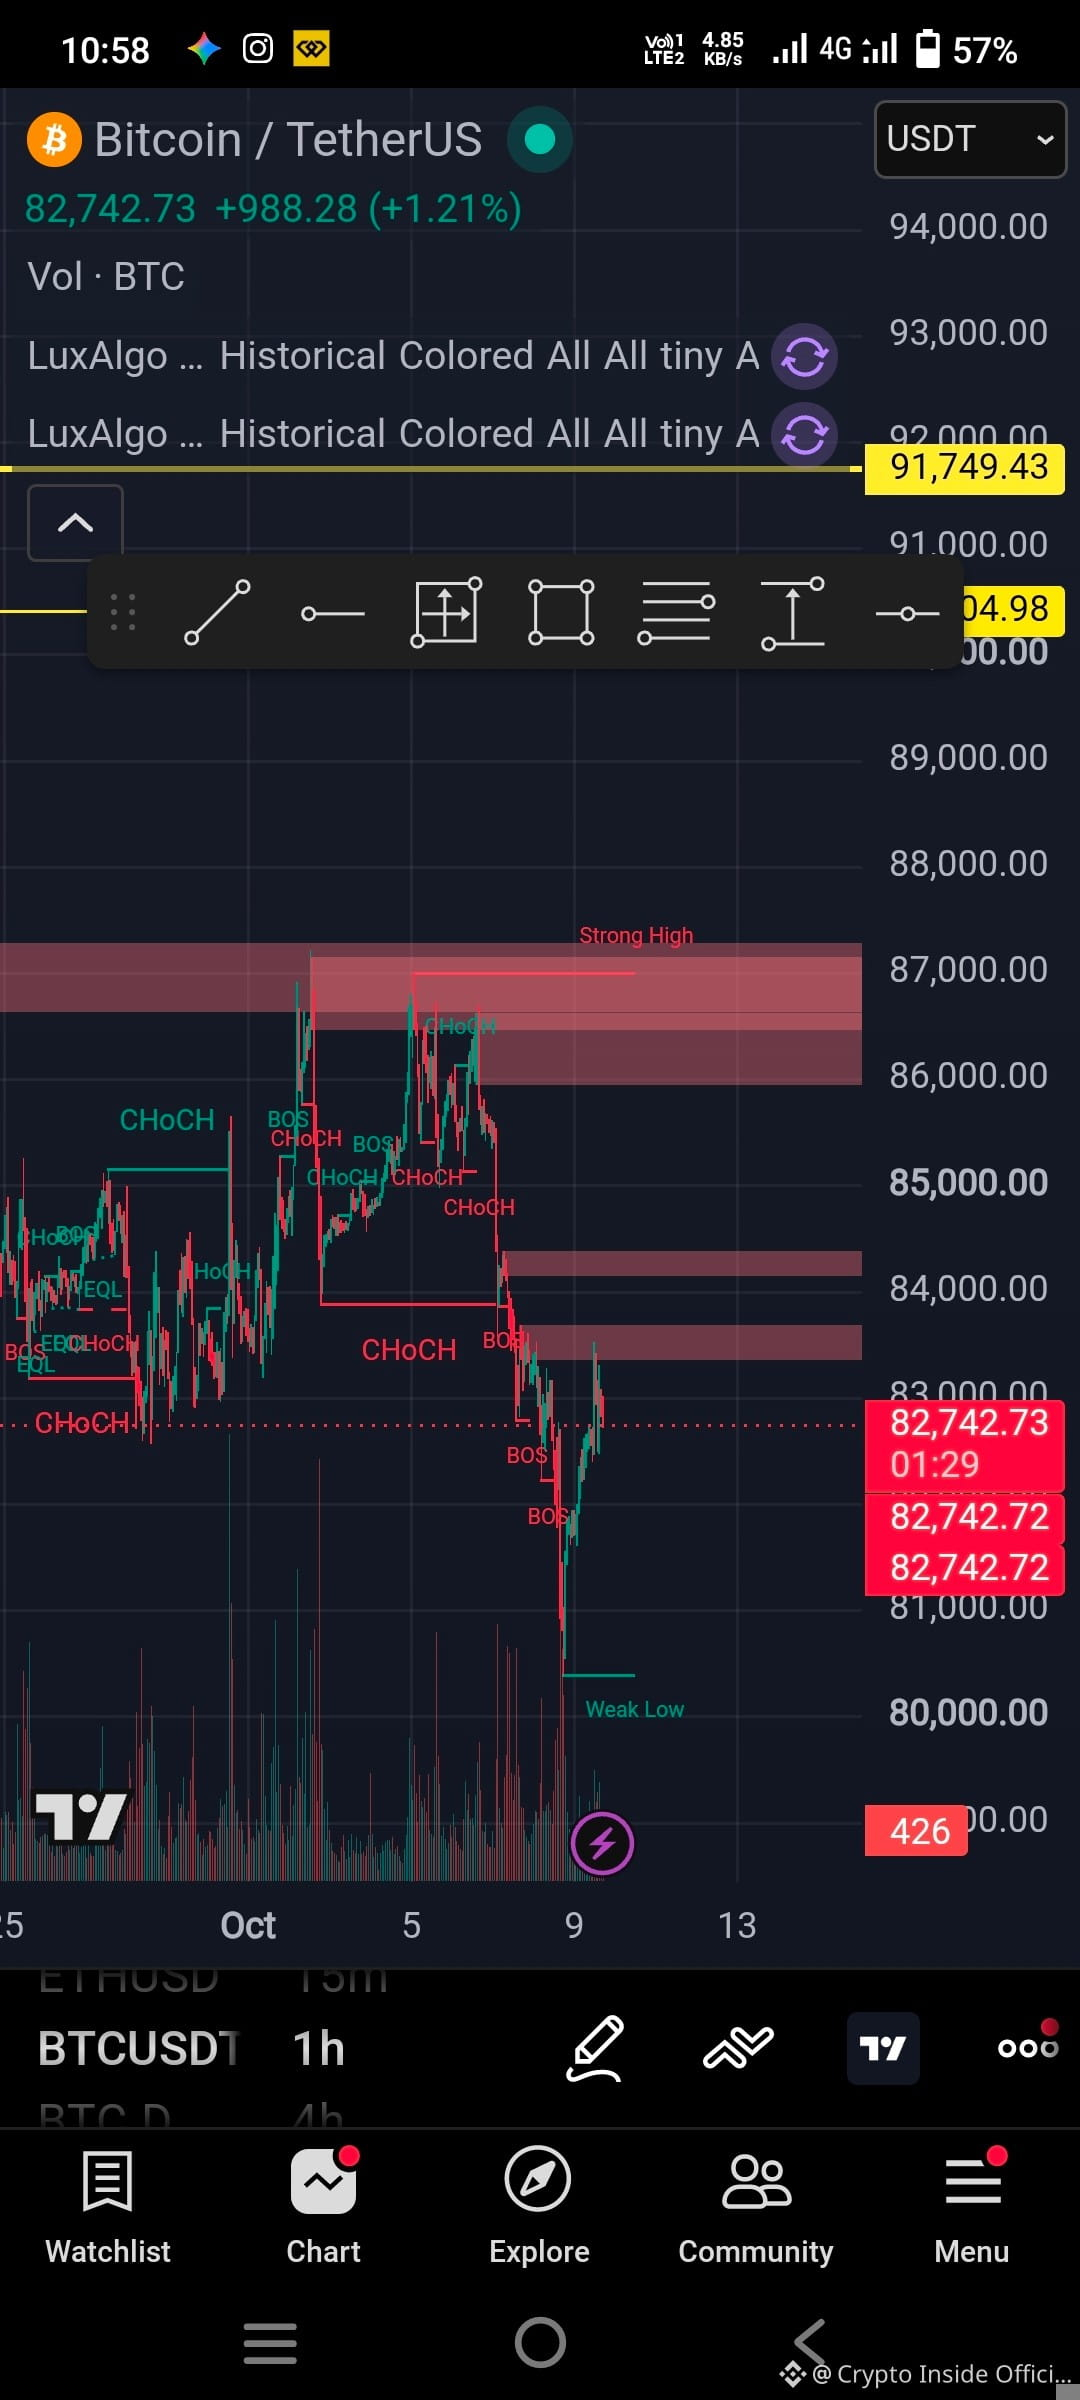
🚨 $BTC Pullback to $82K: Healthy Dip or Bull Trap? 🚨
Bitcoin touched $87,000 before seeing $1B+ in profit-taking, bringing price action back down into the $80,300 – $82,500 zone.
Here is what I am watching right now:
🔹 Key Support: $80,000 (Must hold to keep the macro uptrend structure intact)
🔹 Key Resistance: $85,200 (Breakout trigger back to $87K+)
🔹 My Strategy: Looking for a high-volume confirmation around the $81.5K demand zone before taking a long position.
📉 Leverage long liquidations just got flushed—smart money might be setting up the next leg.
Where do you think $BTC is headed next?
A) Rebound to $87K+ 🚀
B) Breakdown below $80K 📉
Drop your bias below! 👇
#Bitcoin #CryptoAnalysis📈📉🐋📅🚀 alysis #Tr
adingTips
🚨 $BTC Pullback to $82K: Healthy Dip or Bull Trap? 🚨
Bitcoin touched $87,000 before seeing $1B+ in profit-taking, bringing price action back down into the $80,300 – $82,500 zone.
Here is what I am watching right now:
🔹 Key Support: $80,000 (Must hold to keep the macro uptrend structure intact)
🔹 Key Resistance: $85,200 (Breakout trigger back to $87K+)
🔹 My Strategy: Looking for a high-volume confirmation around the $81.5K demand zone before taking a long position.
📉 Leverage long liquidations just got flushed—smart money might be setting up the next leg.
Where do you think $BTC is headed next?
A) Rebound to $87K+ 🚀
B) Breakdown below $80K 📉
Drop your bias below! 👇
#Bitcoin #CryptoAnalysis📈📉🐋📅🚀 alysis #Tr
adingTips
Bitcoin touched $87,000 before seeing $1B+ in profit-taking, bringing price action back down into the $80,300 – $82,500 zone.
Here is what I am watching right now:
🔹 Key Support: $80,000 (Must hold to keep the macro uptrend structure intact)
🔹 Key Resistance: $85,200 (Breakout trigger back to $87K+)
🔹 My Strategy: Looking for a high-volume confirmation around the $81.5K demand zone before taking a long position.
📉 Leverage long liquidations just got flushed—smart money might be setting up the next leg.
Where do you think $BTC is headed next?
A) Rebound to $87K+ 🚀
B) Breakdown below $80K 📉
Drop your bias below! 👇
#Bitcoin #CryptoAnalysis📈📉🐋📅🚀 alysis #Tr
adingTips
1
86
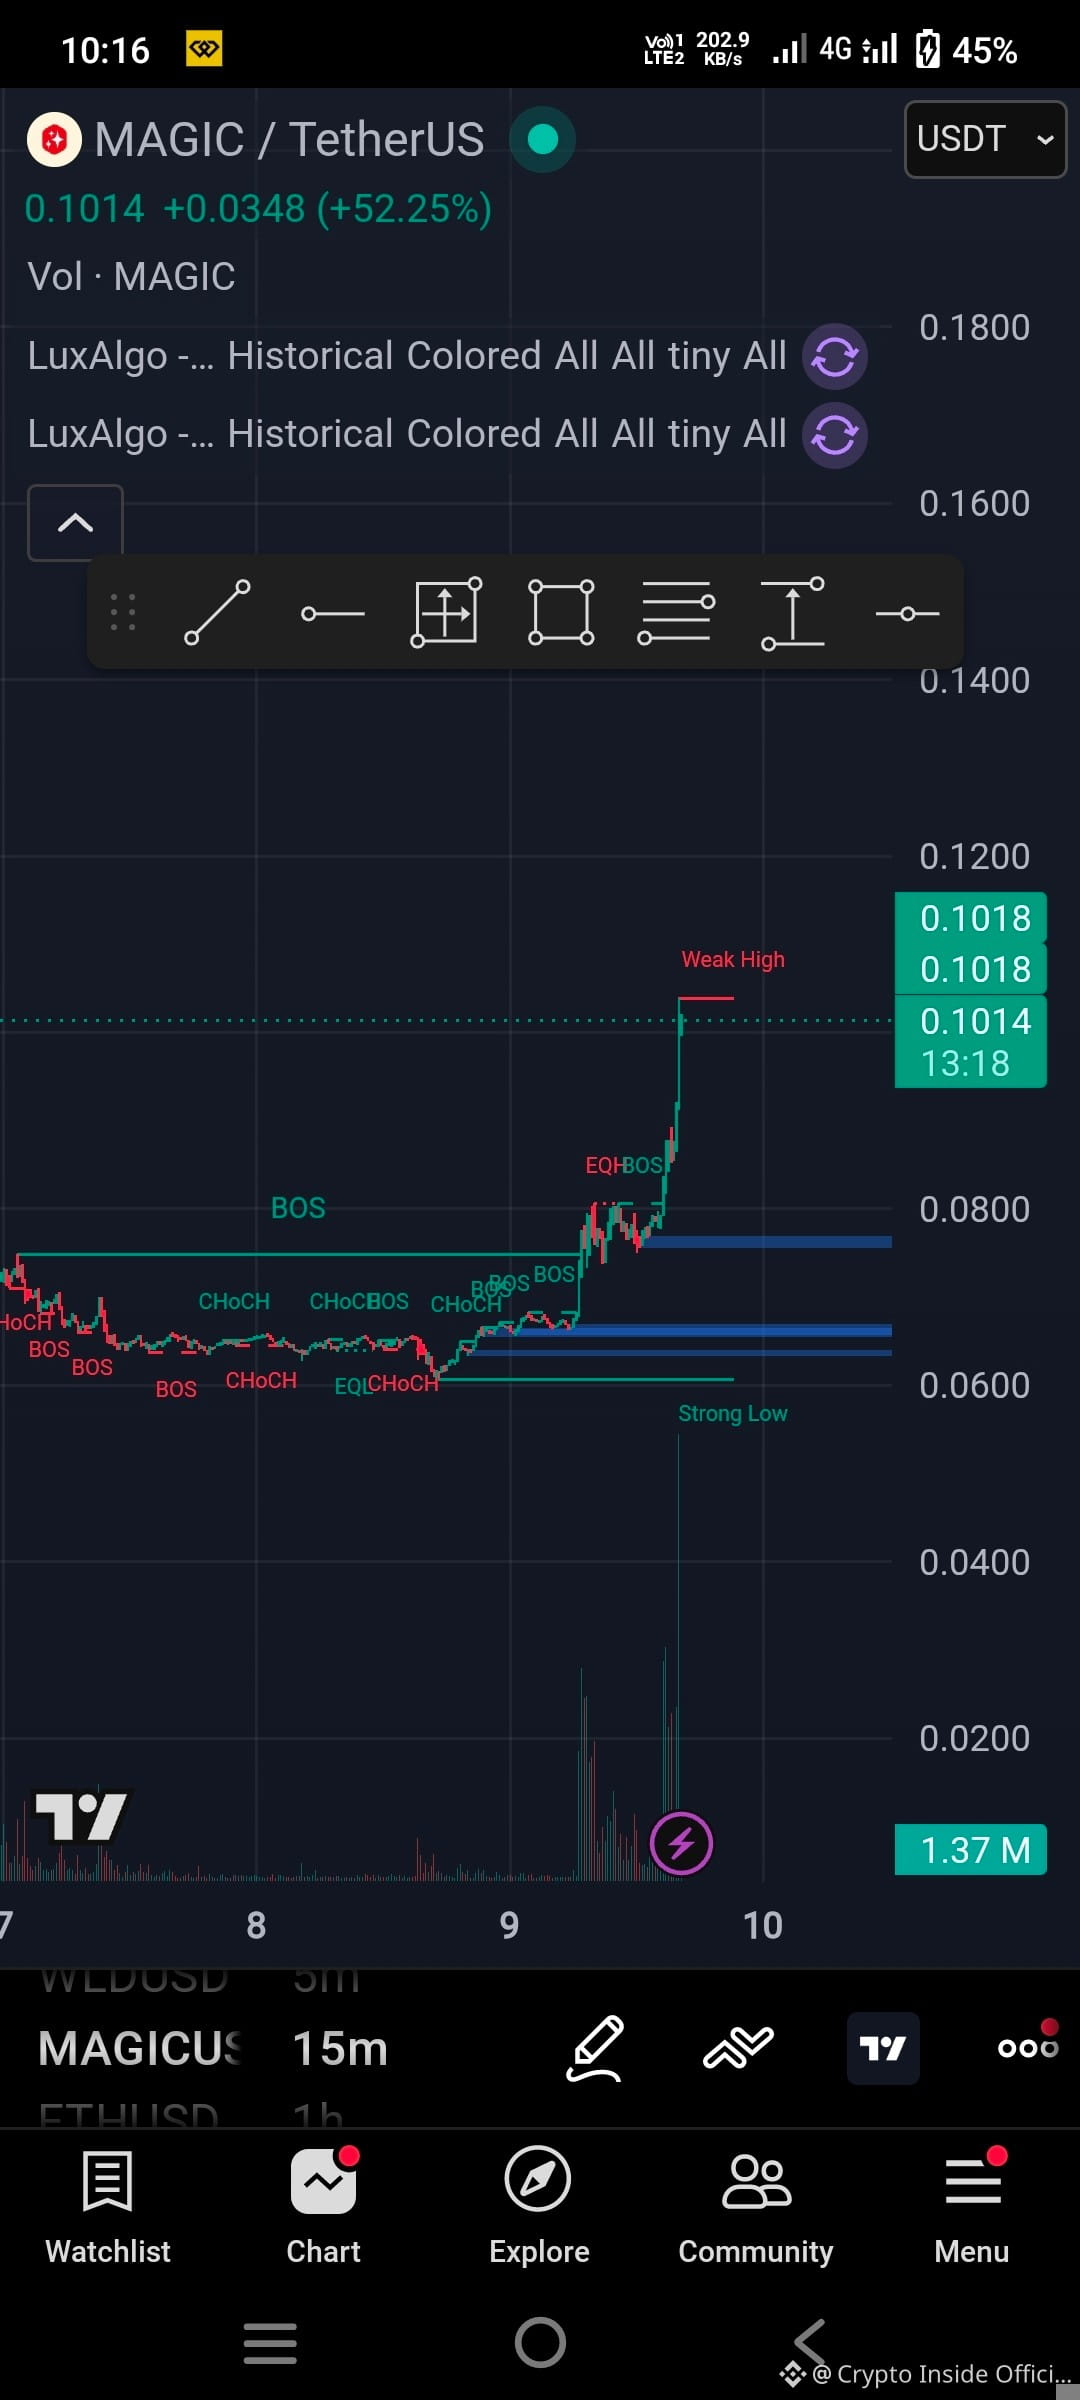
Market Overview (MAGIC / USDT)
MAGIC (Treasure) is currently trading in the $0.076 – $0.080 range following a strong short-term bullish momentum spike from the $0.065 consolidation zone. Technical indicators show the 14-period RSI holding near 65–67, reflecting active buying pressure while approaching a key overhead resistance region at $0.080 – $0.083.
Trade Scenarios
Scenario A: Long Setup (Pullback to Support — Lower Risk)
Entry Zone: $0.068 – $0.071 (retest of previous resistance turn support / hourly EMA 50)
Stop Loss (SL): $0.0635 (below key local pivot at $0.065)
Take Profit 1 (TP1): $0.080 (local resistance test)
Take Profit 2 (TP2): $0.092 (next major liquidity level)
Risk/Reward Ratio: ~1 : 2.5
Scenario B: Long Setup (Breakout Confirmation)
Entry Zone: Confirmed 1-hour or 4-hour candle close above $0.083 with expanding volume
Stop Loss (SL): $0.076
Take Profit 1 (TP1): $0.095
Take Profit 2 (TP2): $0.110
Risk/Reward Ratio: ~1 : 2.4
Scenario C: Short Setup (Rejection at Resistance)
Entry Zone: $0.081 – $0.083 (clear upper shadow / bearish engulfing candle on the 1H/4H chart)
Stop Loss (SL): $0.086
Take Profit 1 (TP1): $0.072
Take Profit 2 (TP2): $0.065
Risk/Reward Ratio: ~1 : 2.4
$MAGIC #BTC #ETH
Market Overview (MAGIC / USDT)
MAGIC (Treasure) is currently trading in the $0.076 – $0.080 range following a strong short-term bullish momentum spike from the $0.065 consolidation zone. Technical indicators show the 14-period RSI holding near 65–67, reflecting active buying pressure while approaching a key overhead resistance region at $0.080 – $0.083.
Trade Scenarios
Scenario A: Long Setup (Pullback to Support — Lower Risk)
Entry Zone: $0.068 – $0.071 (retest of previous resistance turn support / hourly EMA 50)
Stop Loss (SL): $0.0635 (below key local pivot at $0.065)
Take Profit 1 (TP1): $0.080 (local resistance test)
Take Profit 2 (TP2): $0.092 (next major liquidity level)
Risk/Reward Ratio: ~1 : 2.5
Scenario B: Long Setup (Breakout Confirmation)
Entry Zone: Confirmed 1-hour or 4-hour candle close above $0.083 with expanding volume
Stop Loss (SL): $0.076
Take Profit 1 (TP1): $0.095
Take Profit 2 (TP2): $0.110
Risk/Reward Ratio: ~1 : 2.4
Scenario C: Short Setup (Rejection at Resistance)
Entry Zone: $0.081 – $0.083 (clear upper shadow / bearish engulfing candle on the 1H/4H chart)
Stop Loss (SL): $0.086
Take Profit 1 (TP1): $0.072
Take Profit 2 (TP2): $0.065
Risk/Reward Ratio: ~1 : 2.4
$MAGIC #BTC #ETH
MAGIC (Treasure) is currently trading in the $0.076 – $0.080 range following a strong short-term bullish momentum spike from the $0.065 consolidation zone. Technical indicators show the 14-period RSI holding near 65–67, reflecting active buying pressure while approaching a key overhead resistance region at $0.080 – $0.083.
Trade Scenarios
Scenario A: Long Setup (Pullback to Support — Lower Risk)
Entry Zone: $0.068 – $0.071 (retest of previous resistance turn support / hourly EMA 50)
Stop Loss (SL): $0.0635 (below key local pivot at $0.065)
Take Profit 1 (TP1): $0.080 (local resistance test)
Take Profit 2 (TP2): $0.092 (next major liquidity level)
Risk/Reward Ratio: ~1 : 2.5
Scenario B: Long Setup (Breakout Confirmation)
Entry Zone: Confirmed 1-hour or 4-hour candle close above $0.083 with expanding volume
Stop Loss (SL): $0.076
Take Profit 1 (TP1): $0.095
Take Profit 2 (TP2): $0.110
Risk/Reward Ratio: ~1 : 2.4
Scenario C: Short Setup (Rejection at Resistance)
Entry Zone: $0.081 – $0.083 (clear upper shadow / bearish engulfing candle on the 1H/4H chart)
Stop Loss (SL): $0.086
Take Profit 1 (TP1): $0.072
Take Profit 2 (TP2): $0.065
Risk/Reward Ratio: ~1 : 2.4
$MAGIC #BTC #ETH
1
280
attention all trader which apps use to news in crypto world
Plz suggest me 🙏
attention all trader which apps use to news in crypto world
Plz suggest me 🙏
Plz suggest me 🙏
1
63
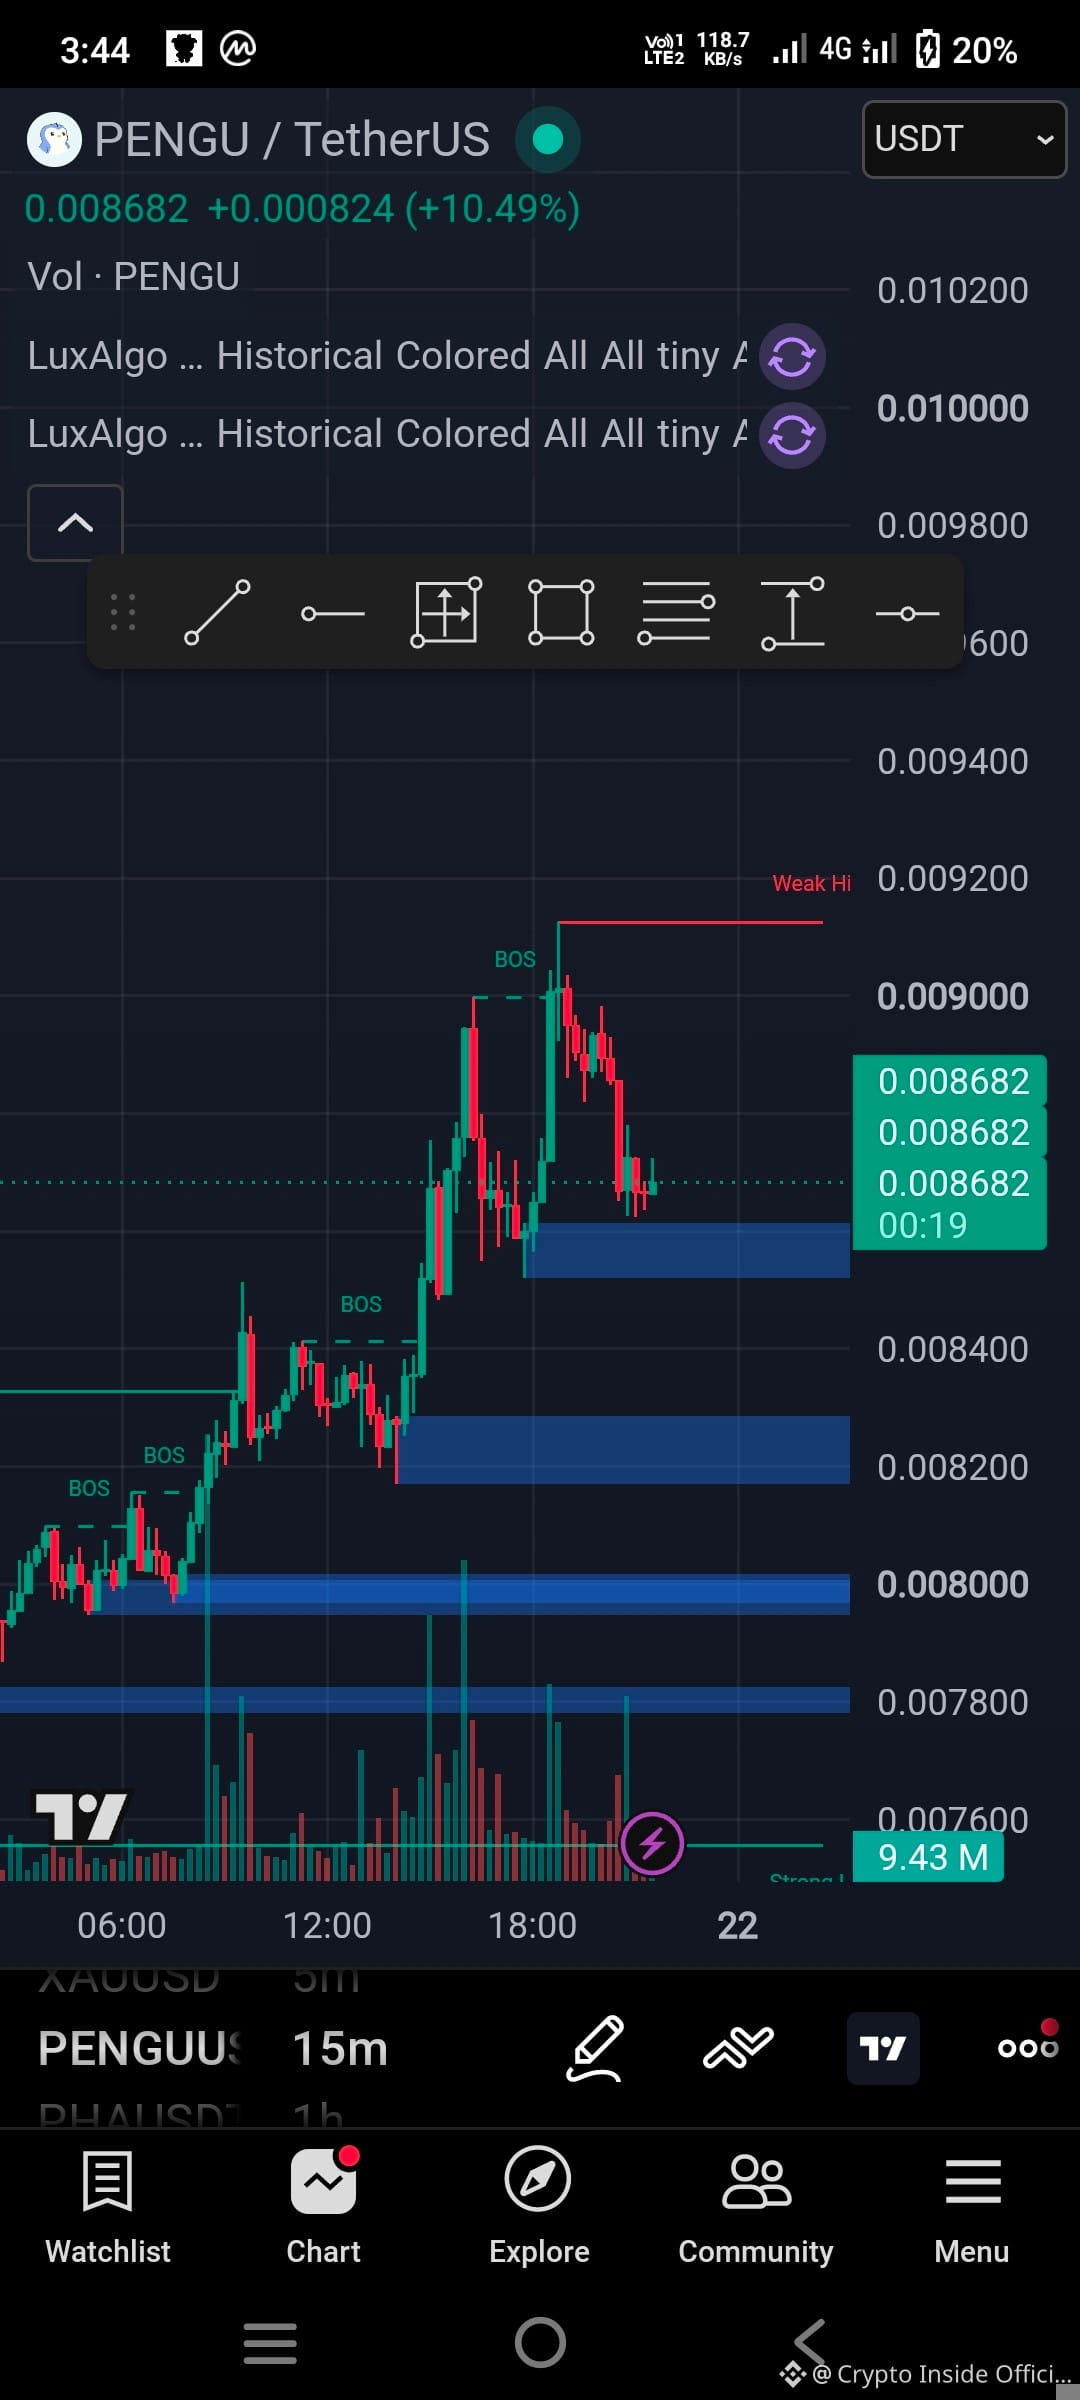
Technical and Fundamental Analysis on Pengu Coin
Current Price: $0.00883 USDT (24h Range: $0.00775 – $0.00897)
Active Trade Setups (PENGU/USDT Spot)
1. Dip Buy Setup (Limit Entry)
Entry Zone: $0.00780 – $0.00800 (Pullback to local support)
Target 1 (TP1): $0.00895 (Retest of 24h high)
Target 2 (TP2): $0.00980 (Next major liquidity cluster)
Stop Loss (SL): $0.00735 (4H close below recent demand floor)
2. Momentum Breakout Setup (Trigger Entry)
Trigger Entry: $0.00905 (Requires a 15m/1H candle close above $0.00900)
Target 1 (TP1): $0.00980
Target 2 (TP2): $0.01050
Stop Loss (SL): $0.00850 (Fall back inside trading range)
Critical Technical Levels
Immediate Resistance: $0.00897 – $0.00900
Major Resistance: $0.00980
Immediate Support: $0.00820
Major Support: $0.00775
Risk Warning: Limit position size to 1%–2% of total portfolio value. PENGU exhibits high 24-hour volume swings ($230M+) and sharp volatility.
#Pengu $BTC $ETH
Technical and Fundamental Analysis on Pengu Coin
Current Price: $0.00883 USDT (24h Range: $0.00775 – $0.00897)
Active Trade Setups (PENGU/USDT Spot)
1. Dip Buy Setup (Limit Entry)
Entry Zone: $0.00780 – $0.00800 (Pullback to local support)
Target 1 (TP1): $0.00895 (Retest of 24h high)
Target 2 (TP2): $0.00980 (Next major liquidity cluster)
Stop Loss (SL): $0.00735 (4H close below recent demand floor)
2. Momentum Breakout Setup (Trigger Entry)
Trigger Entry: $0.00905 (Requires a 15m/1H candle close above $0.00900)
Target 1 (TP1): $0.00980
Target 2 (TP2): $0.01050
Stop Loss (SL): $0.00850 (Fall back inside trading range)
Critical Technical Levels
Immediate Resistance: $0.00897 – $0.00900
Major Resistance: $0.00980
Immediate Support: $0.00820
Major Support: $0.00775
Risk Warning: Limit position size to 1%–2% of total portfolio value. PENGU exhibits high 24-hour volume swings ($230M+) and sharp volatility.
#Pengu $BTC $ETH
Current Price: $0.00883 USDT (24h Range: $0.00775 – $0.00897)
Active Trade Setups (PENGU/USDT Spot)
1. Dip Buy Setup (Limit Entry)
Entry Zone: $0.00780 – $0.00800 (Pullback to local support)
Target 1 (TP1): $0.00895 (Retest of 24h high)
Target 2 (TP2): $0.00980 (Next major liquidity cluster)
Stop Loss (SL): $0.00735 (4H close below recent demand floor)
2. Momentum Breakout Setup (Trigger Entry)
Trigger Entry: $0.00905 (Requires a 15m/1H candle close above $0.00900)
Target 1 (TP1): $0.00980
Target 2 (TP2): $0.01050
Stop Loss (SL): $0.00850 (Fall back inside trading range)
Critical Technical Levels
Immediate Resistance: $0.00897 – $0.00900
Major Resistance: $0.00980
Immediate Support: $0.00820
Major Support: $0.00775
Risk Warning: Limit position size to 1%–2% of total portfolio value. PENGU exhibits high 24-hour volume swings ($230M+) and sharp volatility.
#Pengu $BTC $ETH
1
333
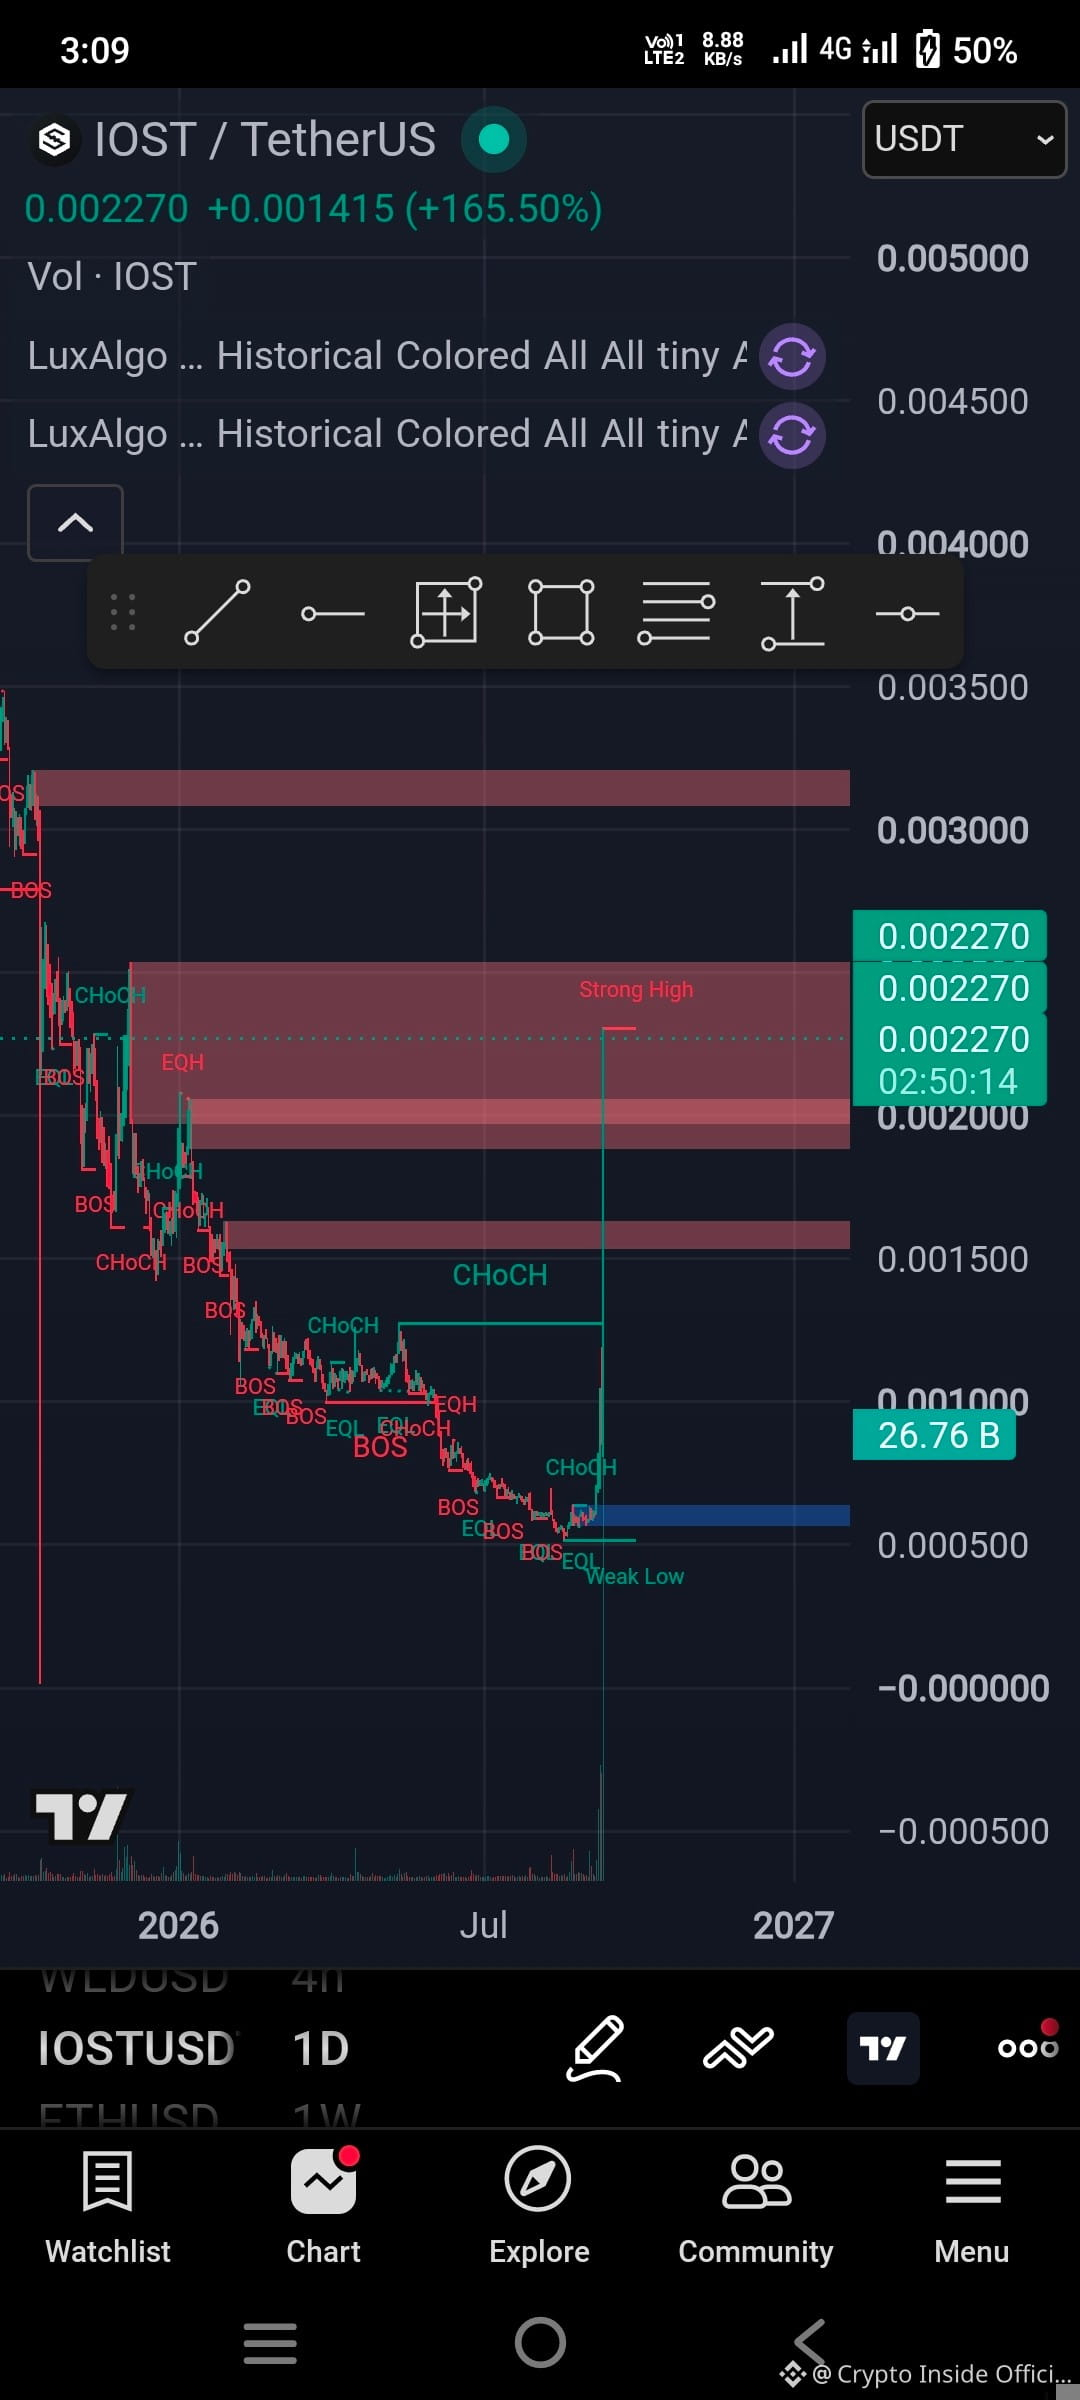
#Iost operates primarily on its own native Layer 1 mainnet blockchain
Spot Trade Setup
Entry Zone (DCA): $0.00080 – $0.00088
Breakout Trigger: Daily close above $0.00100
Stop Loss: $0.00072 (Strict exit on daily close below support)
Take-Profit 1: $0.00120
Take-Profit 2: $0.00160
Take-Profit 3: $0.00200
Execution Plan
Entry Strategy: Ladder 60% of your planned position size within the $0.00080–$0.00088 support zone. Allocate the remaining 40% only after a 4-hour candle closes above $0.00100.
Profit Taking: Scale out 30% at TP1, move stop-loss to breakeven, and trail stops toward TP2 and TP3.
Risk Allocation: Limit total exposure to 2–3% of your spot capital due to micro-cap volatility.
#Iost operates primarily on its own native Layer 1 mainnet blockchain
Spot Trade Setup
Entry Zone (DCA): $0.00080 – $0.00088
Breakout Trigger: Daily close above $0.00100
Stop Loss: $0.00072 (Strict exit on daily close below support)
Take-Profit 1: $0.00120
Take-Profit 2: $0.00160
Take-Profit 3: $0.00200
Execution Plan
Entry Strategy: Ladder 60% of your planned position size within the $0.00080–$0.00088 support zone. Allocate the remaining 40% only after a 4-hour candle closes above $0.00100.
Profit Taking: Scale out 30% at TP1, move stop-loss to breakeven, and trail stops toward TP2 and TP3.
Risk Allocation: Limit total exposure to 2–3% of your spot capital due to micro-cap volatility.
Spot Trade Setup
Entry Zone (DCA): $0.00080 – $0.00088
Breakout Trigger: Daily close above $0.00100
Stop Loss: $0.00072 (Strict exit on daily close below support)
Take-Profit 1: $0.00120
Take-Profit 2: $0.00160
Take-Profit 3: $0.00200
Execution Plan
Entry Strategy: Ladder 60% of your planned position size within the $0.00080–$0.00088 support zone. Allocate the remaining 40% only after a 4-hour candle closes above $0.00100.
Profit Taking: Scale out 30% at TP1, move stop-loss to breakeven, and trail stops toward TP2 and TP3.
Risk Allocation: Limit total exposure to 2–3% of your spot capital due to micro-cap volatility.
1
486
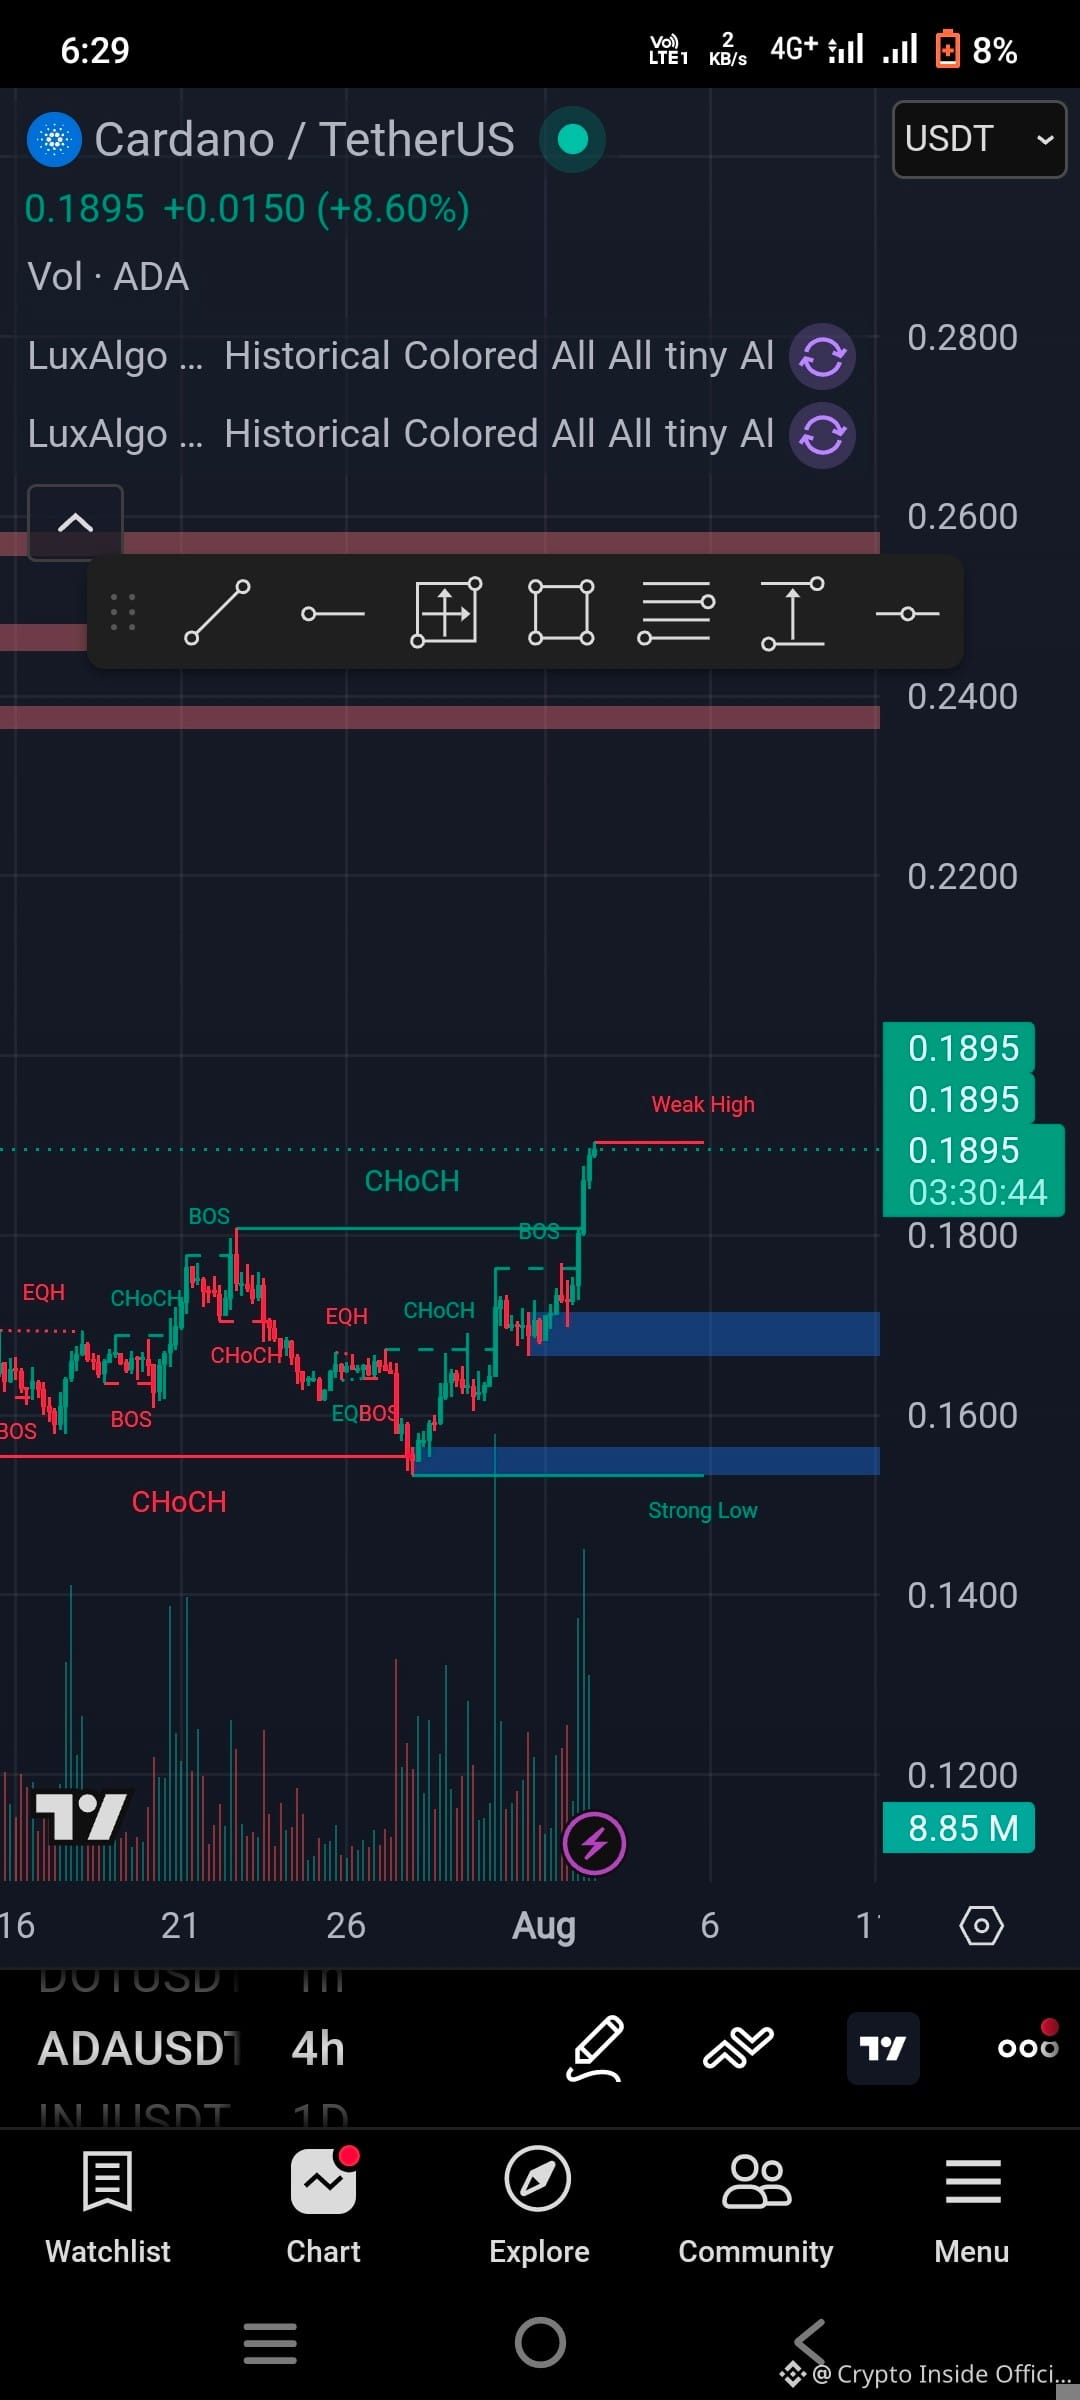
Bullish Setup
Entry Zone: $0.075 – $0.080
Target 1: $0.098
Target 2: $0.106
Target 3: $0.113
Stop Loss: $0.068
A breakout above the recent resistance zone could open the way toward the $0.098–0.113 area.
Bullish Setup
Entry Zone: $0.075 – $0.080
Target 1: $0.098
Target 2: $0.106
Target 3: $0.113
Stop Loss: $0.068
A breakout above the recent resistance zone could open the way toward the $0.098–0.113 area.
Entry Zone: $0.075 – $0.080
Target 1: $0.098
Target 2: $0.106
Target 3: $0.113
Stop Loss: $0.068
A breakout above the recent resistance zone could open the way toward the $0.098–0.113 area.
10
9
969
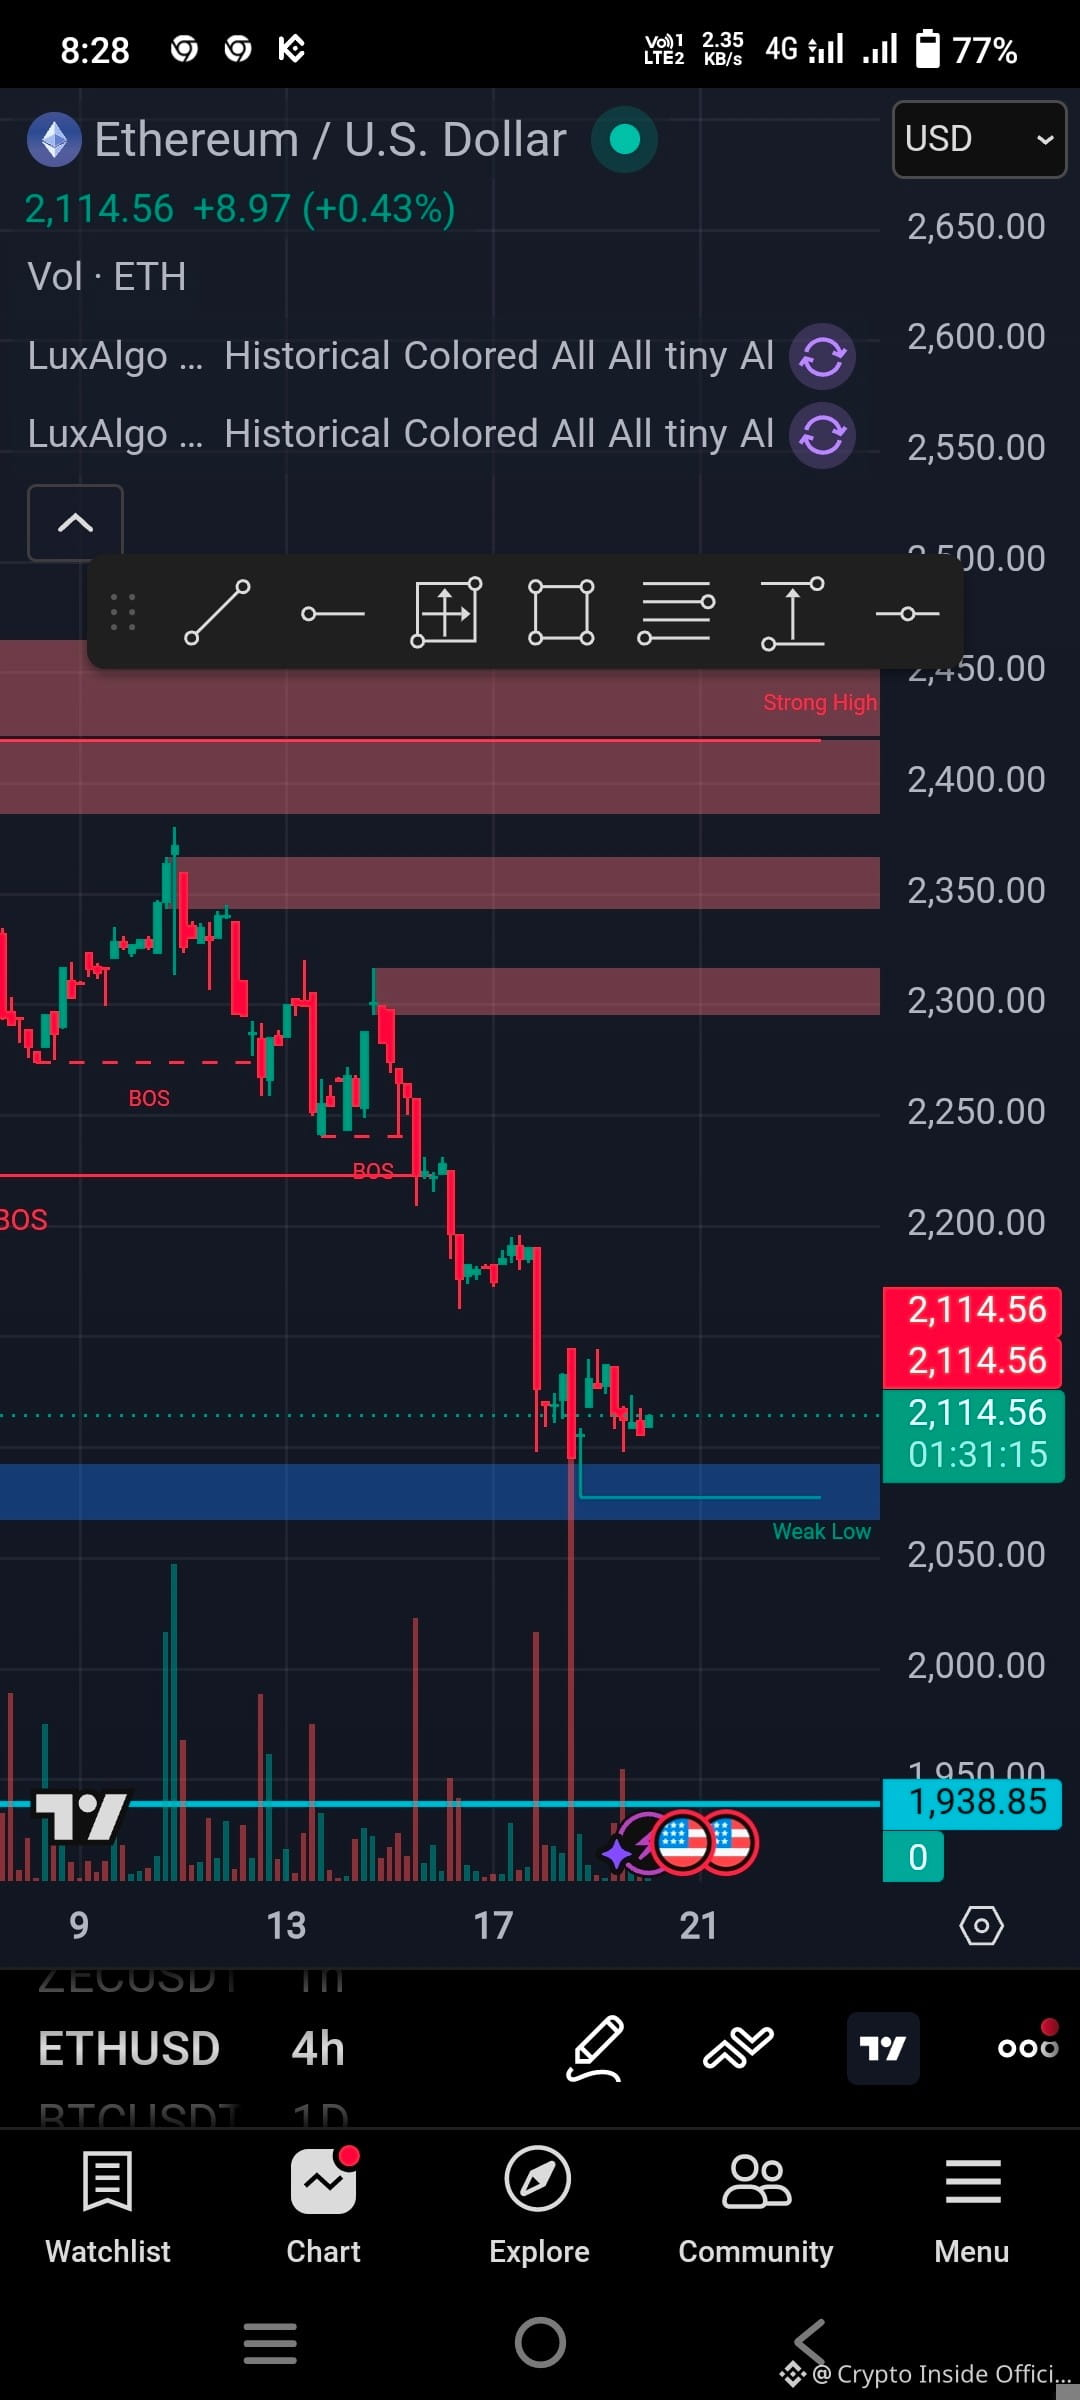
$ETH Fundamental and market Overview
Entry Zone: $2,095 – $2,115
Targets: $2,145 → $2,180
Stop Loss: $2,070
Breakout Long
👇
If ETH closes above $2,150
Targets: $2,220 → $2,280
Short Setup
👇
If ETH breaks below $2,080
Targets: $2,030 → $1,980
Important Levels
👇
Support: $2,080 / $2,020
Resistance: $2,150 / $2,220
Technical structure is currently ranging with bearish pressure on lower timeframes, but buyers are defending the $2.1K zone strongly
$ETH Fundamental and market Overview
Entry Zone: $2,095 – $2,115
Targets: $2,145 → $2,180
Stop Loss: $2,070
Breakout Long
👇
If ETH closes above $2,150
Targets: $2,220 → $2,280
Short Setup
👇
If ETH breaks below $2,080
Targets: $2,030 → $1,980
Important Levels
👇
Support: $2,080 / $2,020
Resistance: $2,150 / $2,220
Technical structure is currently ranging with bearish pressure on lower timeframes, but buyers are defending the $2.1K zone strongly
Entry Zone: $2,095 – $2,115
Targets: $2,145 → $2,180
Stop Loss: $2,070
Breakout Long
👇
If ETH closes above $2,150
Targets: $2,220 → $2,280
Short Setup
👇
If ETH breaks below $2,080
Targets: $2,030 → $1,980
Important Levels
👇
Support: $2,080 / $2,020
Resistance: $2,150 / $2,220
Technical structure is currently ranging with bearish pressure on lower timeframes, but buyers are defending the $2.1K zone strongly
2
139
[claim and win Reward](https://app.binance.com/uni-qr/6XyeJdus?utm_medium=web_share_copy)
[https://app.binance.com/uni-qr/6XyeJdus?utm_medium=web_share_copy](https://app.binance.com/uni-qr/6XyeJdus?utm_medium=web_share_copy)
claim and win Reward
https://app.binance.com/uni-qr/6XyeJdus?utm_medium=web_share_copy
https://app.binance.com/uni-qr/6XyeJdus?utm_medium=web_share_copy

1
19
Fundamental and Market Overview
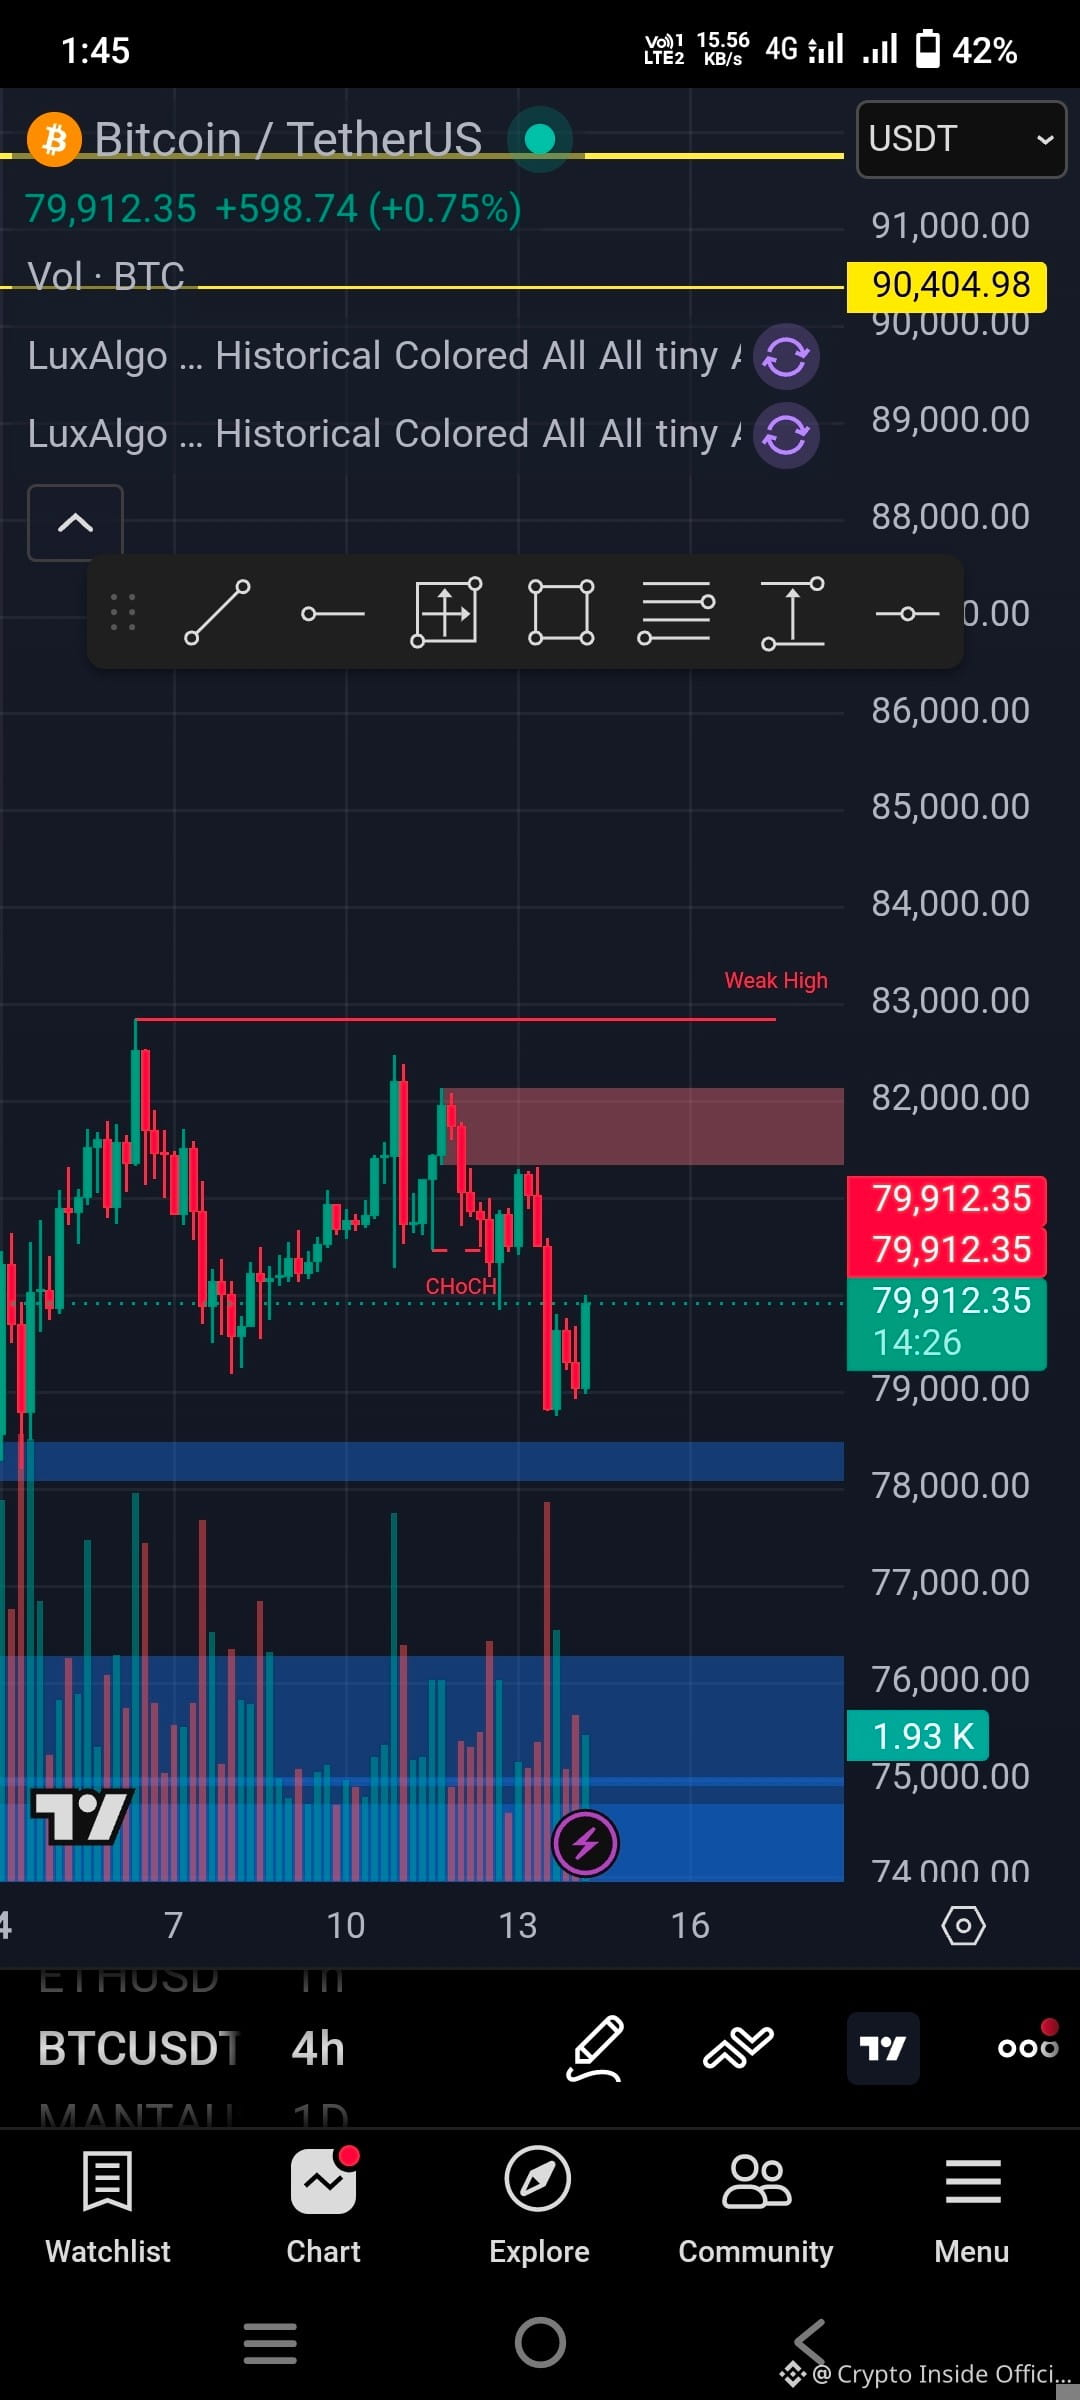
$BTC
Entry Zone: $79,900 – $80,400
Stop Loss: $78,950
Targets:
TP1: $81,400
TP2: $82,800
TP3: $84,000
Aggressive Breakout Entry
Buy only if BTC closes strongly above:
Breakout Target: $83.5K – $85K
Invalidation: back below $80.7K
Short Setup (Only if support breaks)
Sell Zone: below $79,400
Targets: $78,200 → $76,800
Stop Loss: $80,350
Market View
👇
BTC dominance remains strong while altcoins weaken slightly.
Bulls still control structure above the key psychological support:
Major resistance remains near $82.8K–84K.
Scalping Levels
👇
Support: $80K / $79.5K
Resistance: $81.4K / $82.8K
Fundamental and Market Overview
$BTC
Entry Zone: $79,900 – $80,400
Stop Loss: $78,950
Targets:
TP1: $81,400
TP2: $82,800
TP3: $84,000
Aggressive Breakout Entry
Buy only if BTC closes strongly above:
Breakout Target: $83.5K – $85K
Invalidation: back below $80.7K
Short Setup (Only if support breaks)
Sell Zone: below $79,400
Targets: $78,200 → $76,800
Stop Loss: $80,350
Market View
👇
BTC dominance remains strong while altcoins weaken slightly.
Bulls still control structure above the key psychological support:
Major resistance remains near $82.8K–84K.
Scalping Levels
👇
Support: $80K / $79.5K
Resistance: $81.4K / $82.8K
$BTC
Entry Zone: $79,900 – $80,400
Stop Loss: $78,950
Targets:
TP1: $81,400
TP2: $82,800
TP3: $84,000
Aggressive Breakout Entry
Buy only if BTC closes strongly above:
Breakout Target: $83.5K – $85K
Invalidation: back below $80.7K
Short Setup (Only if support breaks)
Sell Zone: below $79,400
Targets: $78,200 → $76,800
Stop Loss: $80,350
Market View
👇
BTC dominance remains strong while altcoins weaken slightly.
Bulls still control structure above the key psychological support:
Major resistance remains near $82.8K–84K.
Scalping Levels
👇
Support: $80K / $79.5K
Resistance: $81.4K / $82.8K
1
104
Fundamental and Market Overview
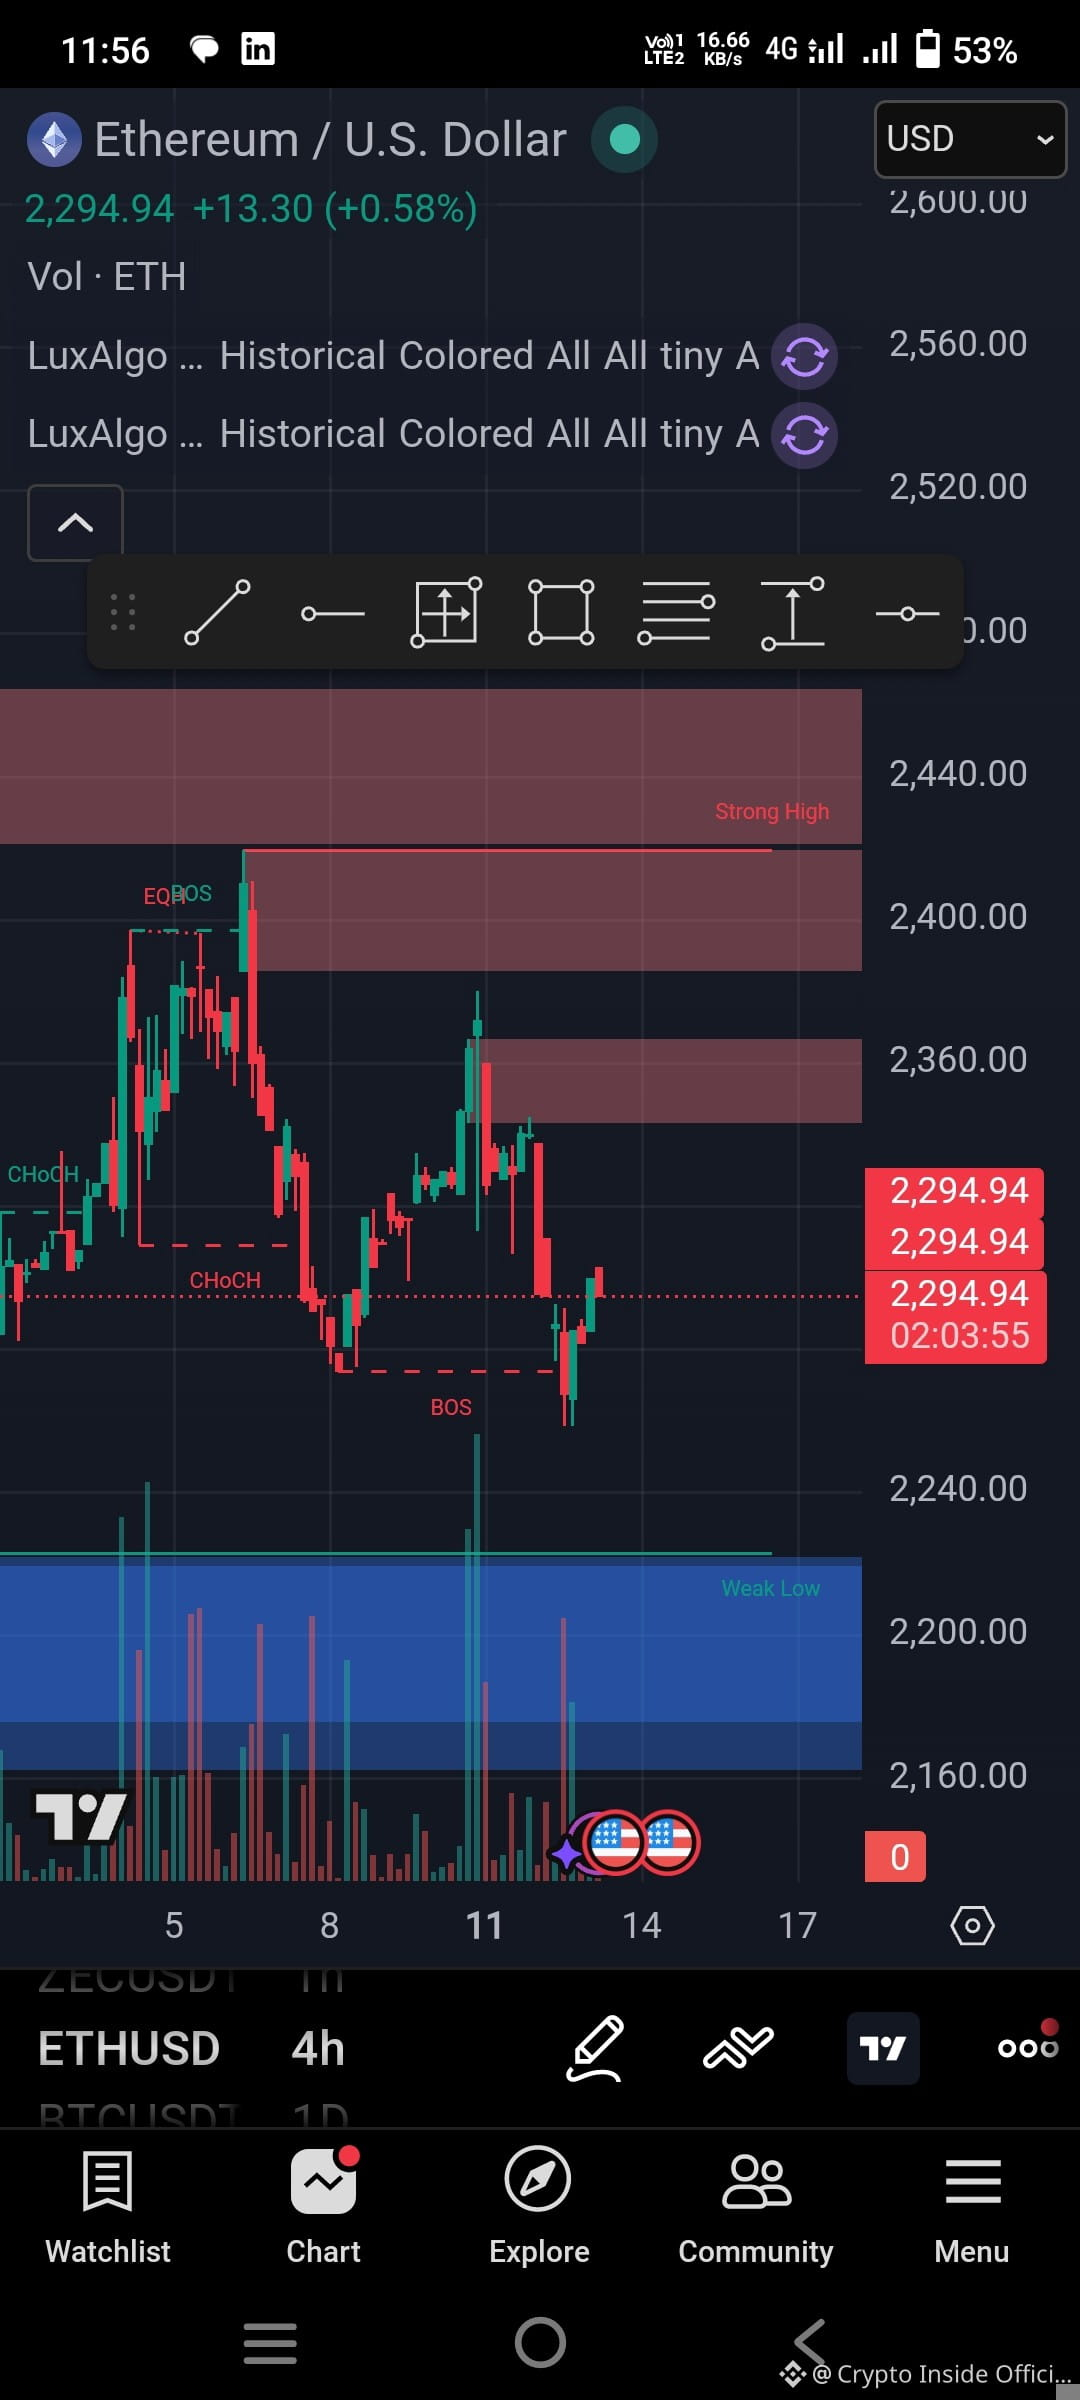
$ETH
Entry Zone: $2,285 – $2,315
Stop Loss: $2,240
Targets:
TP1: $2,380
TP2: $2,420
TP3: $2,500
Live Short Setup
If ETH loses $2,240 with strong selling volume:
👇
Short Entry: $2,235
Stop Loss: $2,285
Targets:
$2,180
$2,120
Key Levels
Level
Zone
👇
Strong Resistance
$2,400 – $2,420
Intraday Resistance
$2,350
Main Support
$2,250
Breakdown Zone
Below $2,220
Market Bias
👇
Above $2,300 → bullish continuation possible
Breakout above $2,420 → strong move toward $2,550+
Below $2,220 → bearish pressure increases sharply
Scalping Plan
👇
Buy dips near support, not after pumps
Use low leverage (5x–10x max)
Watch BTC direction before entering ETH trades
Fundamental and Market Overview
$ETH
Entry Zone: $2,285 – $2,315
Stop Loss: $2,240
Targets:
TP1: $2,380
TP2: $2,420
TP3: $2,500
Live Short Setup
If ETH loses $2,240 with strong selling volume:
👇
Short Entry: $2,235
Stop Loss: $2,285
Targets:
$2,180
$2,120
Key Levels
Level
Zone
👇
Strong Resistance
$2,400 – $2,420
Intraday Resistance
$2,350
Main Support
$2,250
Breakdown Zone
Below $2,220
Market Bias
👇
Above $2,300 → bullish continuation possible
Breakout above $2,420 → strong move toward $2,550+
Below $2,220 → bearish pressure increases sharply
Scalping Plan
👇
Buy dips near support, not after pumps
Use low leverage (5x–10x max)
Watch BTC direction before entering ETH trades
$ETH
Entry Zone: $2,285 – $2,315
Stop Loss: $2,240
Targets:
TP1: $2,380
TP2: $2,420
TP3: $2,500
Live Short Setup
If ETH loses $2,240 with strong selling volume:
👇
Short Entry: $2,235
Stop Loss: $2,285
Targets:
$2,180
$2,120
Key Levels
Level
Zone
👇
Strong Resistance
$2,400 – $2,420
Intraday Resistance
$2,350
Main Support
$2,250
Breakdown Zone
Below $2,220
Market Bias
👇
Above $2,300 → bullish continuation possible
Breakout above $2,420 → strong move toward $2,550+
Below $2,220 → bearish pressure increases sharply
Scalping Plan
👇
Buy dips near support, not after pumps
Use low leverage (5x–10x max)
Watch BTC direction before entering ETH trades
1
67
Fundamental and market Overview
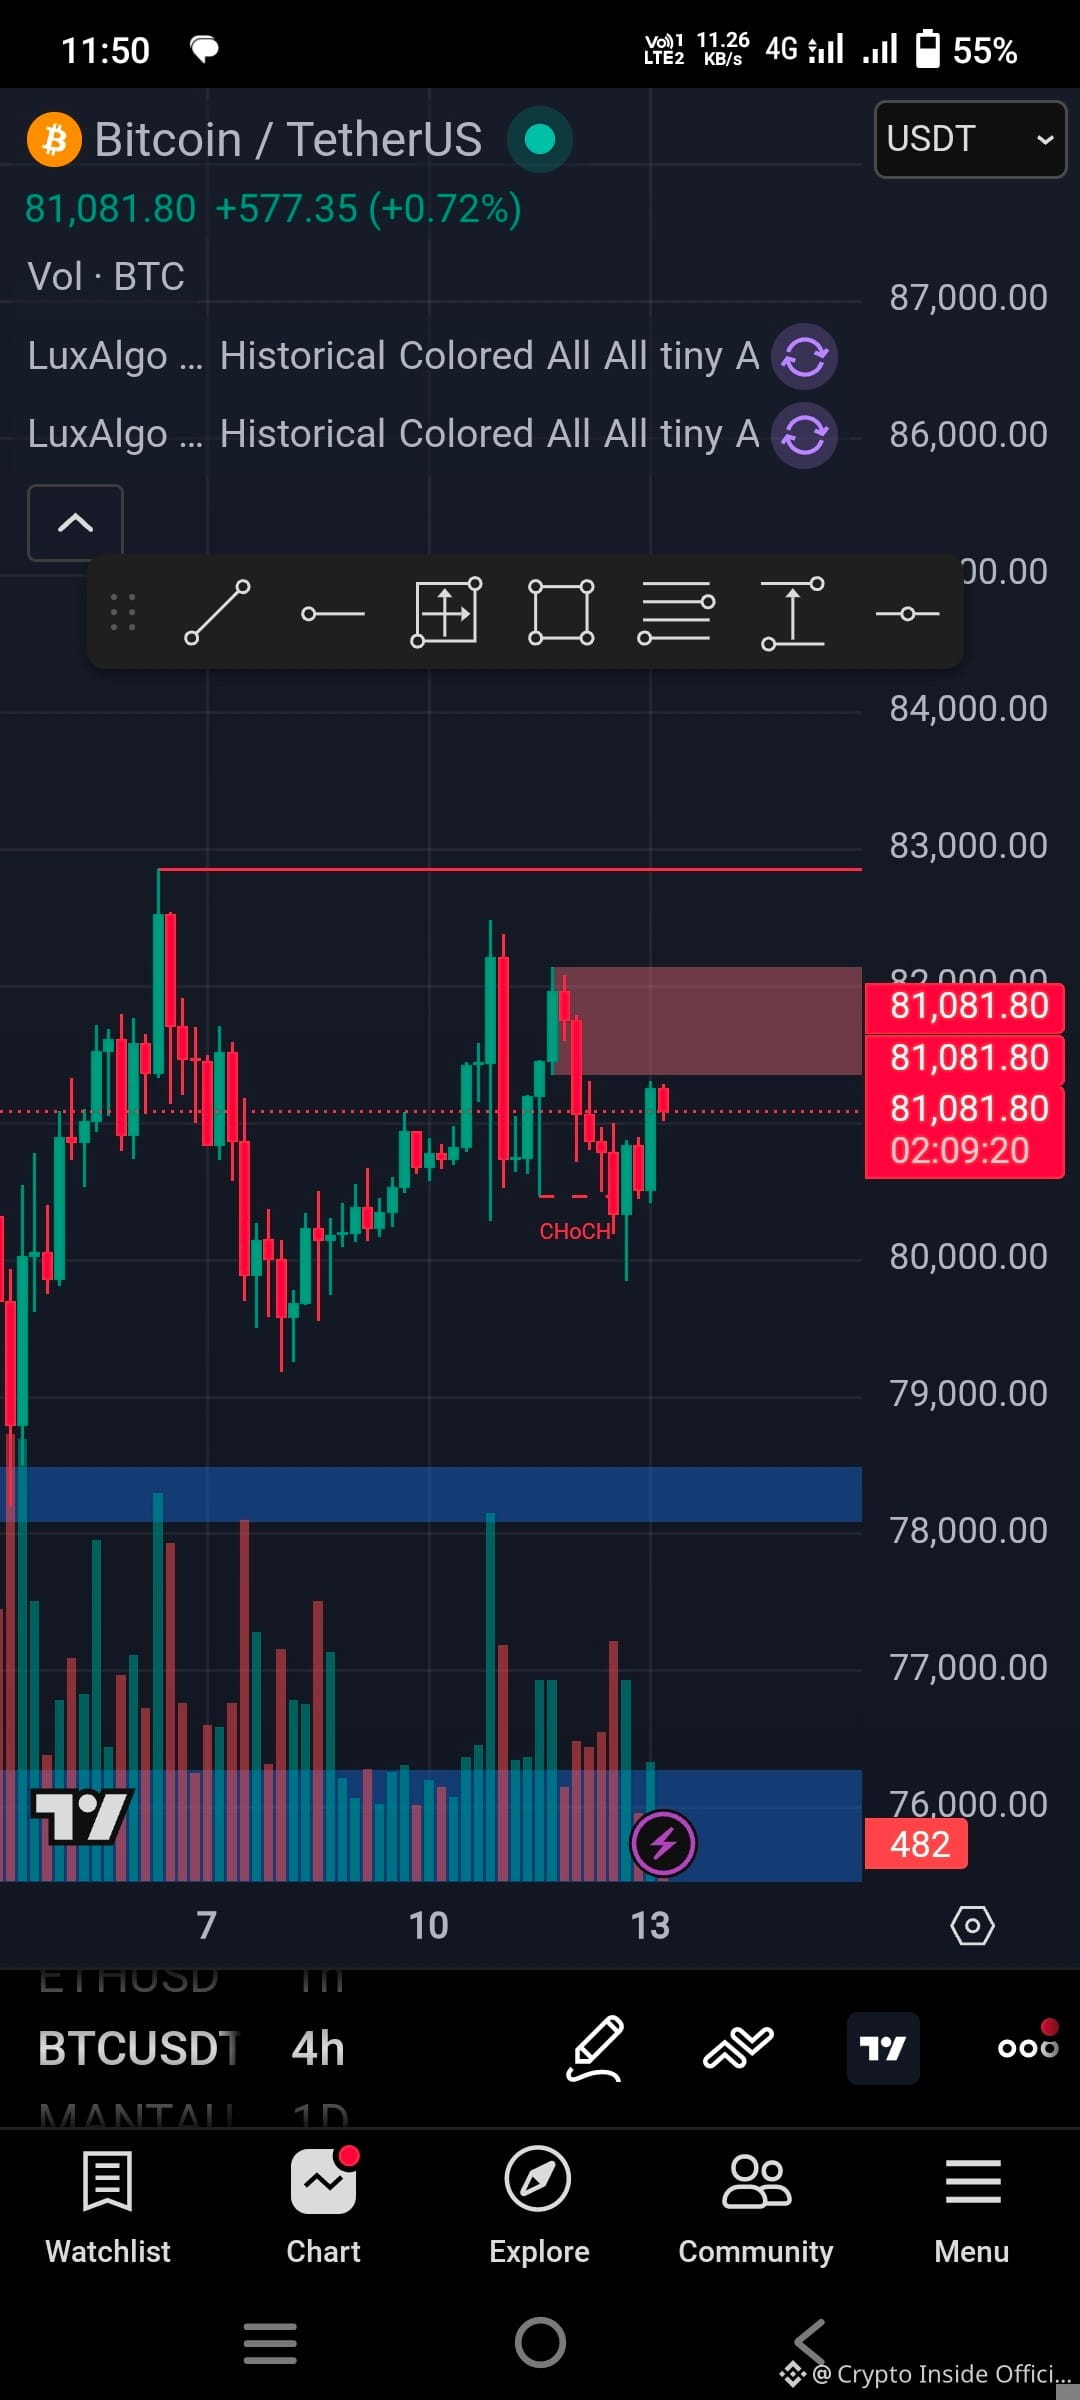
$BTC
Entry: $80,200 – $80,600
Stop Loss: $79,350
Targets:
TP1: $81,800
TP2: $82,500
TP3: $84,000
If BTC breaks below $79,300 with volume:
Entry: $79,200
Stop Loss: $80,100
Targets:
$78,000
$76,800
Scalping Zones
Type
Zone
Strong Buy Zone
$79.8K – $80.2K
Resistance
$81.8K – $82.2K
Breakdown Area
Below $79.3K
Market Bias
👇
Above $80K → bullish continuation possible
Break above $82K → momentum toward $85K
Below $79K → short-term bearish pressure increases
Fundamental and market Overview
$BTC
Entry: $80,200 – $80,600
Stop Loss: $79,350
Targets:
TP1: $81,800
TP2: $82,500
TP3: $84,000
If BTC breaks below $79,300 with volume:
Entry: $79,200
Stop Loss: $80,100
Targets:
$78,000
$76,800
Scalping Zones
Type
Zone
Strong Buy Zone
$79.8K – $80.2K
Resistance
$81.8K – $82.2K
Breakdown Area
Below $79.3K
Market Bias
👇
Above $80K → bullish continuation possible
Break above $82K → momentum toward $85K
Below $79K → short-term bearish pressure increases
$BTC
Entry: $80,200 – $80,600
Stop Loss: $79,350
Targets:
TP1: $81,800
TP2: $82,500
TP3: $84,000
If BTC breaks below $79,300 with volume:
Entry: $79,200
Stop Loss: $80,100
Targets:
$78,000
$76,800
Scalping Zones
Type
Zone
Strong Buy Zone
$79.8K – $80.2K
Resistance
$81.8K – $82.2K
Breakdown Area
Below $79.3K
Market Bias
👇
Above $80K → bullish continuation possible
Break above $82K → momentum toward $85K
Below $79K → short-term bearish pressure increases
1
87
Fundamental and Market Overview
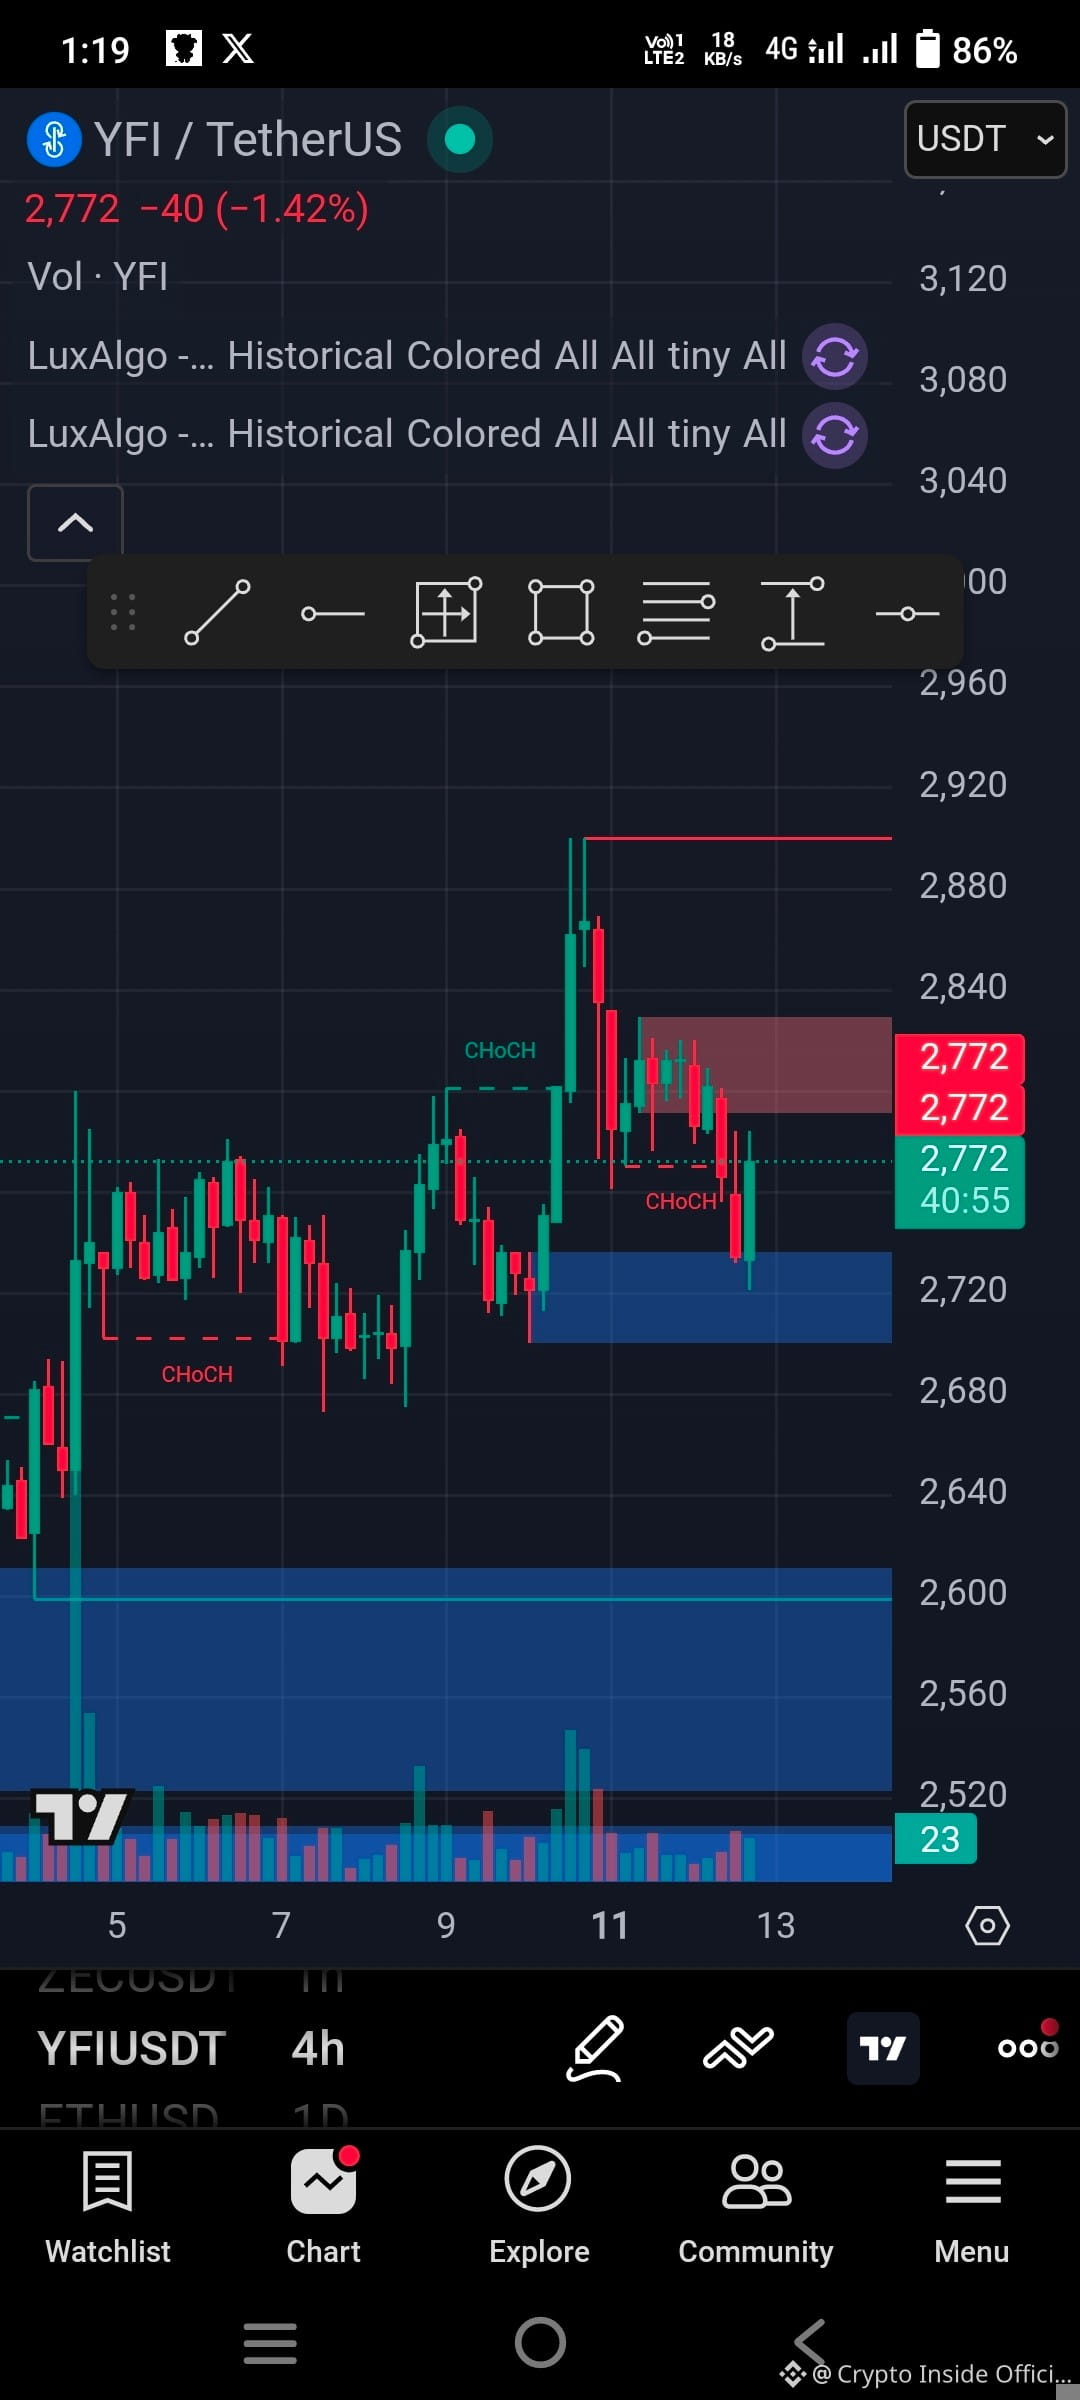
$YFI ON ETHEREUM Ecosystem
🟢 LONG SETUP (BUY)
📍 Entry Zone
$2,650 – $2,720 (accumulation zone)
✅ Confirmation
Strong 15m/1h bullish candle
Break + retest above $2,750
🎯 Targets
TP1: $2,780
TP2: $2,860
TP3: $2,950 (if BTC pumps)
🛑 Stop Loss
Below $2,580
🔴 SHORT SETUP (SELL)
📍 Entry Zone
$2,860 – $2,950 resistance zone
❌ Confirmation
Rejection candle / bearish engulfing
Failure to break $2,900 cleanly
🎯 Targets
TP1: $2,780
TP2: $2,700
TP3: $2,620
🛑 Stop Loss
Above $3,020
⚡ INTRADAY STRATEGY (IMPORTANT)
👇
YFI is low supply + high volatility asset
Avoid chasing breakout candles
Best trades come from:
🔁 Retests
📉 Fake breakouts
📊 Liquidity sweeps
Fundamental and Market Overview
$YFI ON ETHEREUM Ecosystem
🟢 LONG SETUP (BUY)
📍 Entry Zone
$2,650 – $2,720 (accumulation zone)
✅ Confirmation
Strong 15m/1h bullish candle
Break + retest above $2,750
🎯 Targets
TP1: $2,780
TP2: $2,860
TP3: $2,950 (if BTC pumps)
🛑 Stop Loss
Below $2,580
🔴 SHORT SETUP (SELL)
📍 Entry Zone
$2,860 – $2,950 resistance zone
❌ Confirmation
Rejection candle / bearish engulfing
Failure to break $2,900 cleanly
🎯 Targets
TP1: $2,780
TP2: $2,700
TP3: $2,620
🛑 Stop Loss
Above $3,020
⚡ INTRADAY STRATEGY (IMPORTANT)
👇
YFI is low supply + high volatility asset
Avoid chasing breakout candles
Best trades come from:
🔁 Retests
📉 Fake breakouts
📊 Liquidity sweeps
$YFI ON ETHEREUM Ecosystem
🟢 LONG SETUP (BUY)
📍 Entry Zone
$2,650 – $2,720 (accumulation zone)
✅ Confirmation
Strong 15m/1h bullish candle
Break + retest above $2,750
🎯 Targets
TP1: $2,780
TP2: $2,860
TP3: $2,950 (if BTC pumps)
🛑 Stop Loss
Below $2,580
🔴 SHORT SETUP (SELL)
📍 Entry Zone
$2,860 – $2,950 resistance zone
❌ Confirmation
Rejection candle / bearish engulfing
Failure to break $2,900 cleanly
🎯 Targets
TP1: $2,780
TP2: $2,700
TP3: $2,620
🛑 Stop Loss
Above $3,020
⚡ INTRADAY STRATEGY (IMPORTANT)
👇
YFI is low supply + high volatility asset
Avoid chasing breakout candles
Best trades come from:
🔁 Retests
📉 Fake breakouts
📊 Liquidity sweeps
1
141
Fundamental and. market Overview
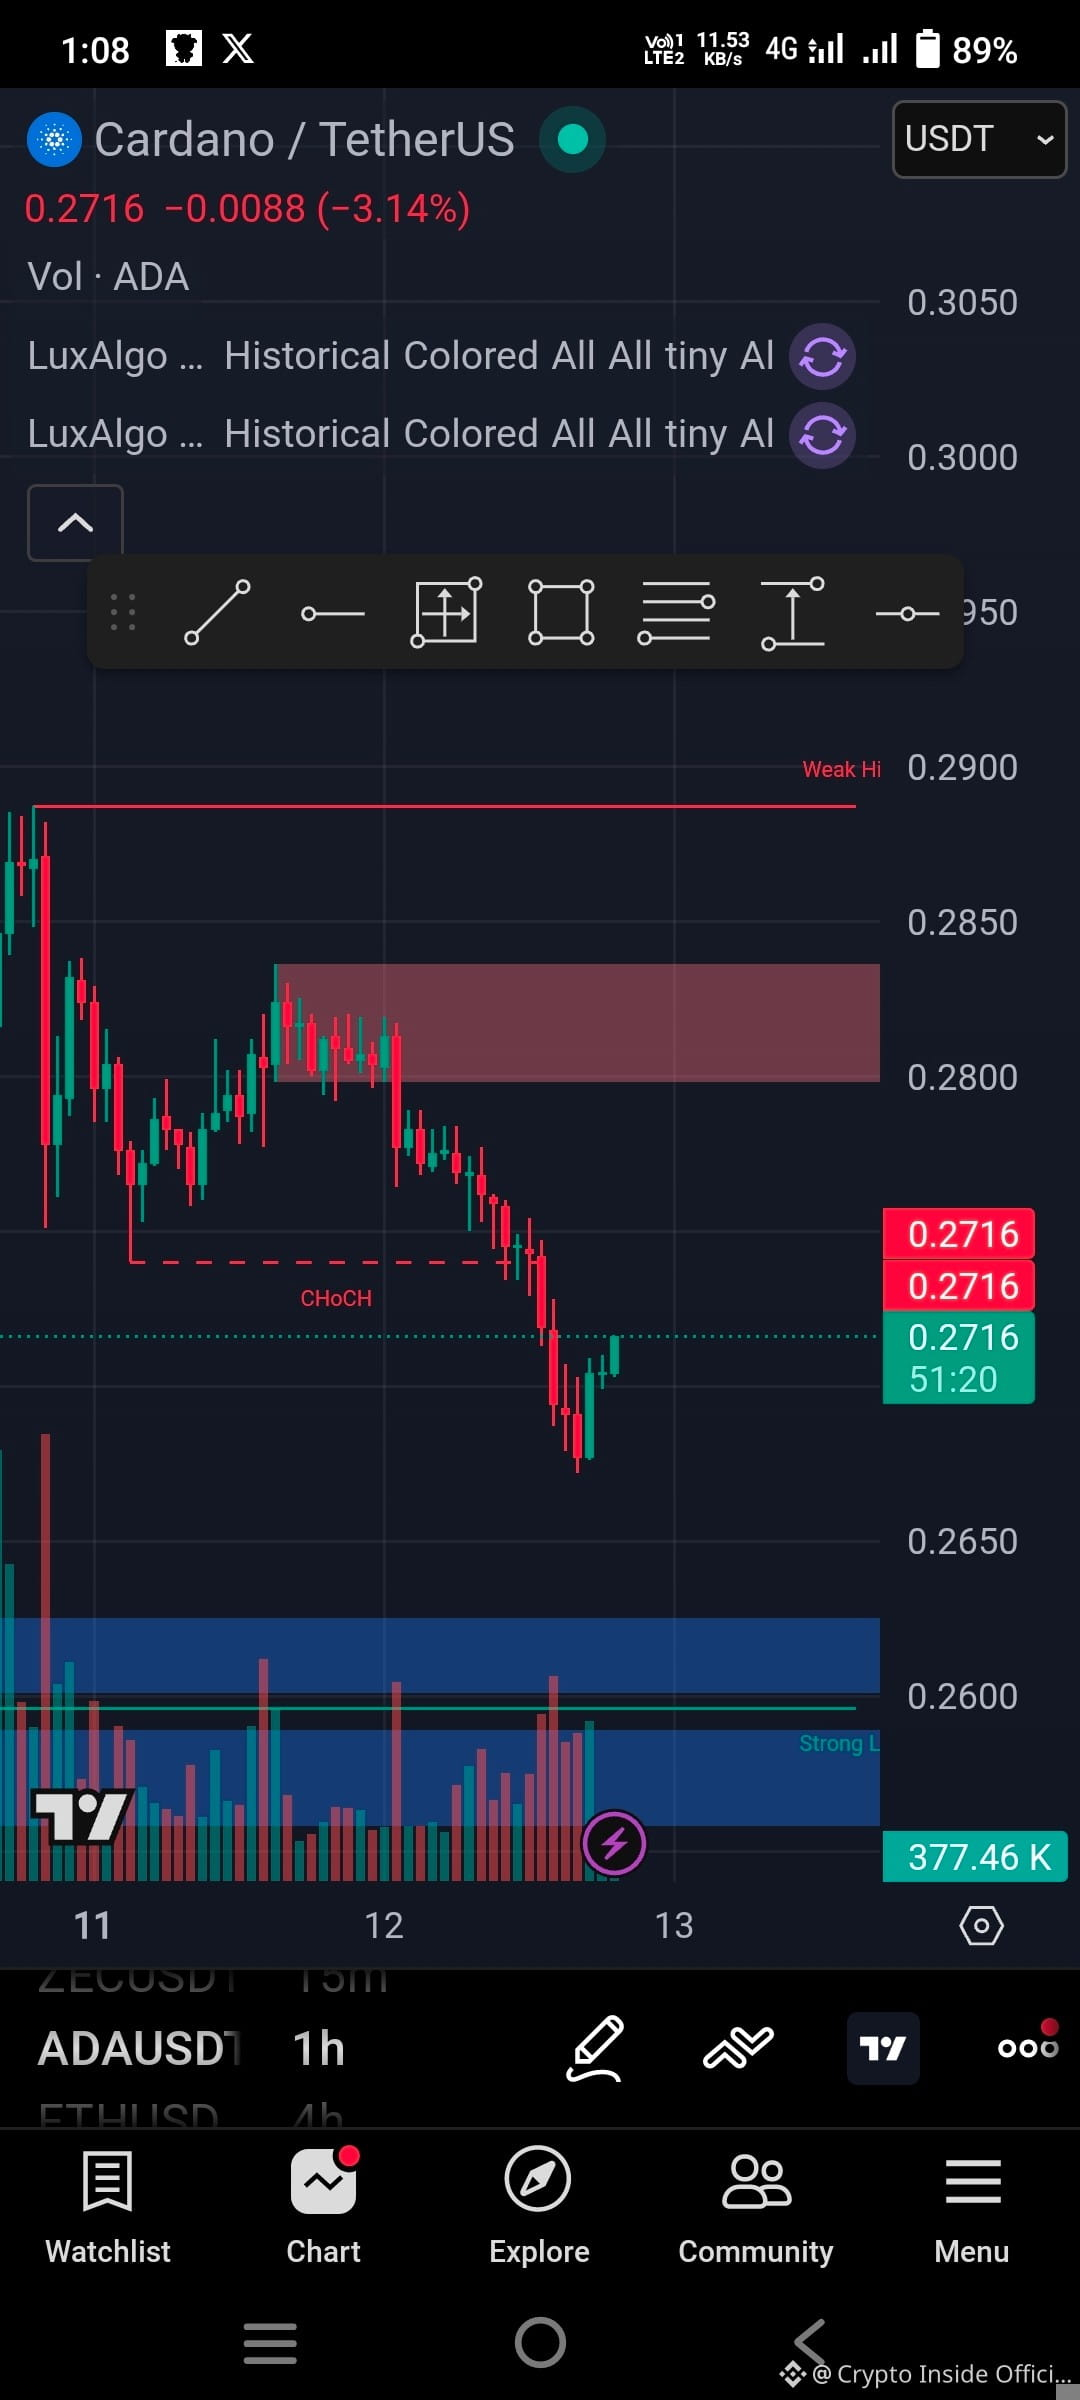
$ADA ON Independent Layer -1 Call Cardano Blockchain.
Entry Zone: $0.258 – $0.266
Aggressive Entry: breakout above $0.275
Targets:
TP1: $0.285
TP2: $0.300
TP3: $0.320
Stop Loss: below $0.245
⚡ Breakout Setup
👇
If ADA closes above $0.285–$0.290 with volume:
Next move can extend toward $0.32–$0.35 zone
If rejected:
Expect range between $0.24 – $0.28
📊 Key Levels
👇
Strong support: $0.245
Mid support: $0.255
Resistance: $0.285 – $0.30
Major breakout: $0.32
📈 Market Outlook
👇
Trend: Neutral → Slowly bullish
Structure: accumulation phase
Best strategy: buy dips, don’t chase pumps
Fundamental and. market Overview
$ADA ON Independent Layer -1 Call Cardano Blockchain.
Entry Zone: $0.258 – $0.266
Aggressive Entry: breakout above $0.275
Targets:
TP1: $0.285
TP2: $0.300
TP3: $0.320
Stop Loss: below $0.245
⚡ Breakout Setup
👇
If ADA closes above $0.285–$0.290 with volume:
Next move can extend toward $0.32–$0.35 zone
If rejected:
Expect range between $0.24 – $0.28
📊 Key Levels
👇
Strong support: $0.245
Mid support: $0.255
Resistance: $0.285 – $0.30
Major breakout: $0.32
📈 Market Outlook
👇
Trend: Neutral → Slowly bullish
Structure: accumulation phase
Best strategy: buy dips, don’t chase pumps
$ADA ON Independent Layer -1 Call Cardano Blockchain.
Entry Zone: $0.258 – $0.266
Aggressive Entry: breakout above $0.275
Targets:
TP1: $0.285
TP2: $0.300
TP3: $0.320
Stop Loss: below $0.245
⚡ Breakout Setup
👇
If ADA closes above $0.285–$0.290 with volume:
Next move can extend toward $0.32–$0.35 zone
If rejected:
Expect range between $0.24 – $0.28
📊 Key Levels
👇
Strong support: $0.245
Mid support: $0.255
Resistance: $0.285 – $0.30
Major breakout: $0.32
📈 Market Outlook
👇
Trend: Neutral → Slowly bullish
Structure: accumulation phase
Best strategy: buy dips, don’t chase pumps
1
121
Fundamental and Market Overview
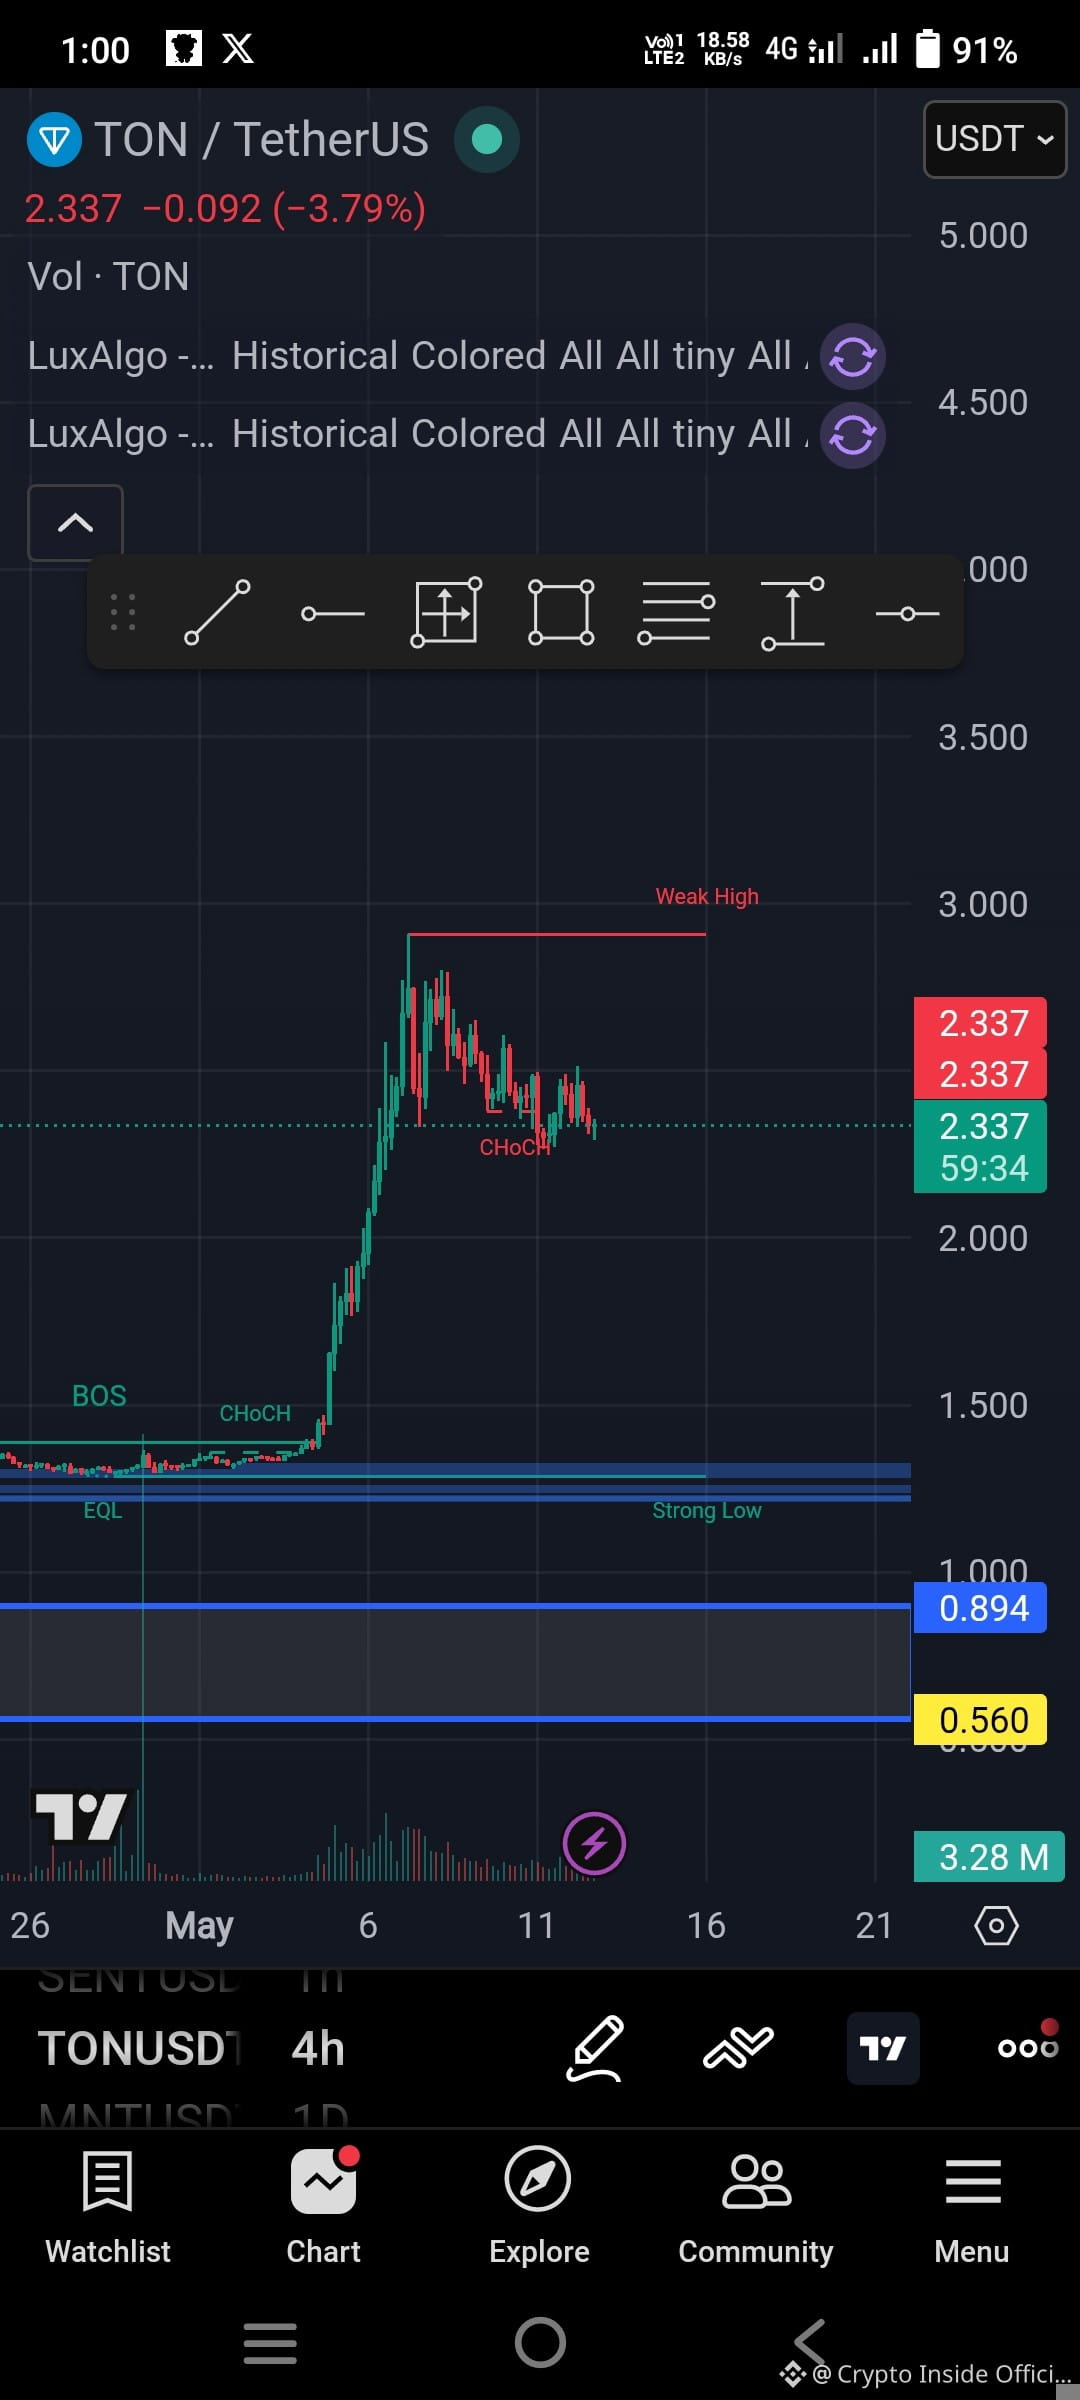
$TON The Open Network Independent Layer- 1 Blockchain.
Entry Zone: $2.26 – $2.32
Aggressive Entry: breakout above $2.42
Targets:
TP1: $2.55
TP2: $2.72
TP3: $2.95
Stop Loss: below $2.18
Scalping Setup (5m–15m)
👇
Buy near support retest around $2.28.
Momentum scalp possible if TON closes above $2.42 with strong volume.
Key Levels
👇
Strong support: $2.20
Resistance zone: $2.42 – $2.50
Major breakout area: $2.72
Market Outlook
👇
Trend: Bullish but volatile
TON recently showed strong momentum after a major breakout from accumulation.
Analysts are watching for possible continuation toward the $2.70–$3.20 area if buying pressure continues.
Fundamental and Market Overview
$TON The Open Network Independent Layer- 1 Blockchain.
Entry Zone: $2.26 – $2.32
Aggressive Entry: breakout above $2.42
Targets:
TP1: $2.55
TP2: $2.72
TP3: $2.95
Stop Loss: below $2.18
Scalping Setup (5m–15m)
👇
Buy near support retest around $2.28.
Momentum scalp possible if TON closes above $2.42 with strong volume.
Key Levels
👇
Strong support: $2.20
Resistance zone: $2.42 – $2.50
Major breakout area: $2.72
Market Outlook
👇
Trend: Bullish but volatile
TON recently showed strong momentum after a major breakout from accumulation.
Analysts are watching for possible continuation toward the $2.70–$3.20 area if buying pressure continues.
$TON The Open Network Independent Layer- 1 Blockchain.
Entry Zone: $2.26 – $2.32
Aggressive Entry: breakout above $2.42
Targets:
TP1: $2.55
TP2: $2.72
TP3: $2.95
Stop Loss: below $2.18
Scalping Setup (5m–15m)
👇
Buy near support retest around $2.28.
Momentum scalp possible if TON closes above $2.42 with strong volume.
Key Levels
👇
Strong support: $2.20
Resistance zone: $2.42 – $2.50
Major breakout area: $2.72
Market Outlook
👇
Trend: Bullish but volatile
TON recently showed strong momentum after a major breakout from accumulation.
Analysts are watching for possible continuation toward the $2.70–$3.20 area if buying pressure continues.
1
50
ເຂົ້າສູ່ລະບົບເພື່ອສຳຫຼວດເນື້ອຫາເພີ່ມເຕີມ
ເຂົ້າຮ່ວມກຸ່ມຜູ້ໃຊ້ຄຣິບໂຕທົ່ວໂລກໃນ Binance Square.
⚡️ ໄດ້ຮັບຂໍ້ມູນຫຼ້າສຸດ ແລະ ທີ່ມີປະໂຫຍດກ່ຽວກັບຄຣິບໂຕ.
💬 ໄດ້ຮັບຄວາມໄວ້ວາງໃຈຈາກຕະຫຼາດແລກປ່ຽນຄຣິບໂຕທີ່ໃຫຍ່ທີ່ສຸດໃນໂລກ.
👍 ຄົ້ນຫາຂໍ້ມູນເຊີງເລິກທີ່ແທ້ຈາກນັກສ້າງທີ່ໄດ້ຮັບການຢືນຢັນ.
ອີເມວ / ເບີໂທລະສັບ
ຫົວຂໍ້ທີ່ກໍາລັງນິຍົມ
NvidiaInvestigatesAfterHuang’sAffairApology
63,248 ຄັ້ງທີ່ເບິ່ງ
711 ກຳລັງສົນທະນາ
Nvidia Board Opens Probe Into Whether Huang Was Target of Foreign Intelligence Effort
Binance News
·12 ຖືກໃຈ
·34.5k ຄັ້ງທີ່ເບິ່ງ
BitcoinFiveWeeklyLosses
80,032 ຄັ້ງທີ່ເບິ່ງ
1,177 ກຳລັງສົນທະນາ
AIChipSlumpNasdaq
42,097 ຄັ້ງທີ່ເບິ່ງ
701 ກຳລັງສົນທະນາ