
Roaib_Bn
1.2k ໂພສ

Roaib_Bn
ລາຍງານ
ບລັອກຜູ້ໃຊ້
HOLDER | SELF BELIEVER | NOT A PERSONAL ADVISER | JUST AN EDUCATOR 📚 | Learning. Growing. Sharing Knowledge.Future in progress.
34 ກໍາລັງຕິດຕາມ
9.9K+ ຜູ້ຕິດຕາມ
13.8K+ Liked
ໂພສ
ທັງໝົດ
ວົງຢືມ
ວີດີໂອ
ຖ່າຍທອດສົດ
·
--
ບົດຄວາມ
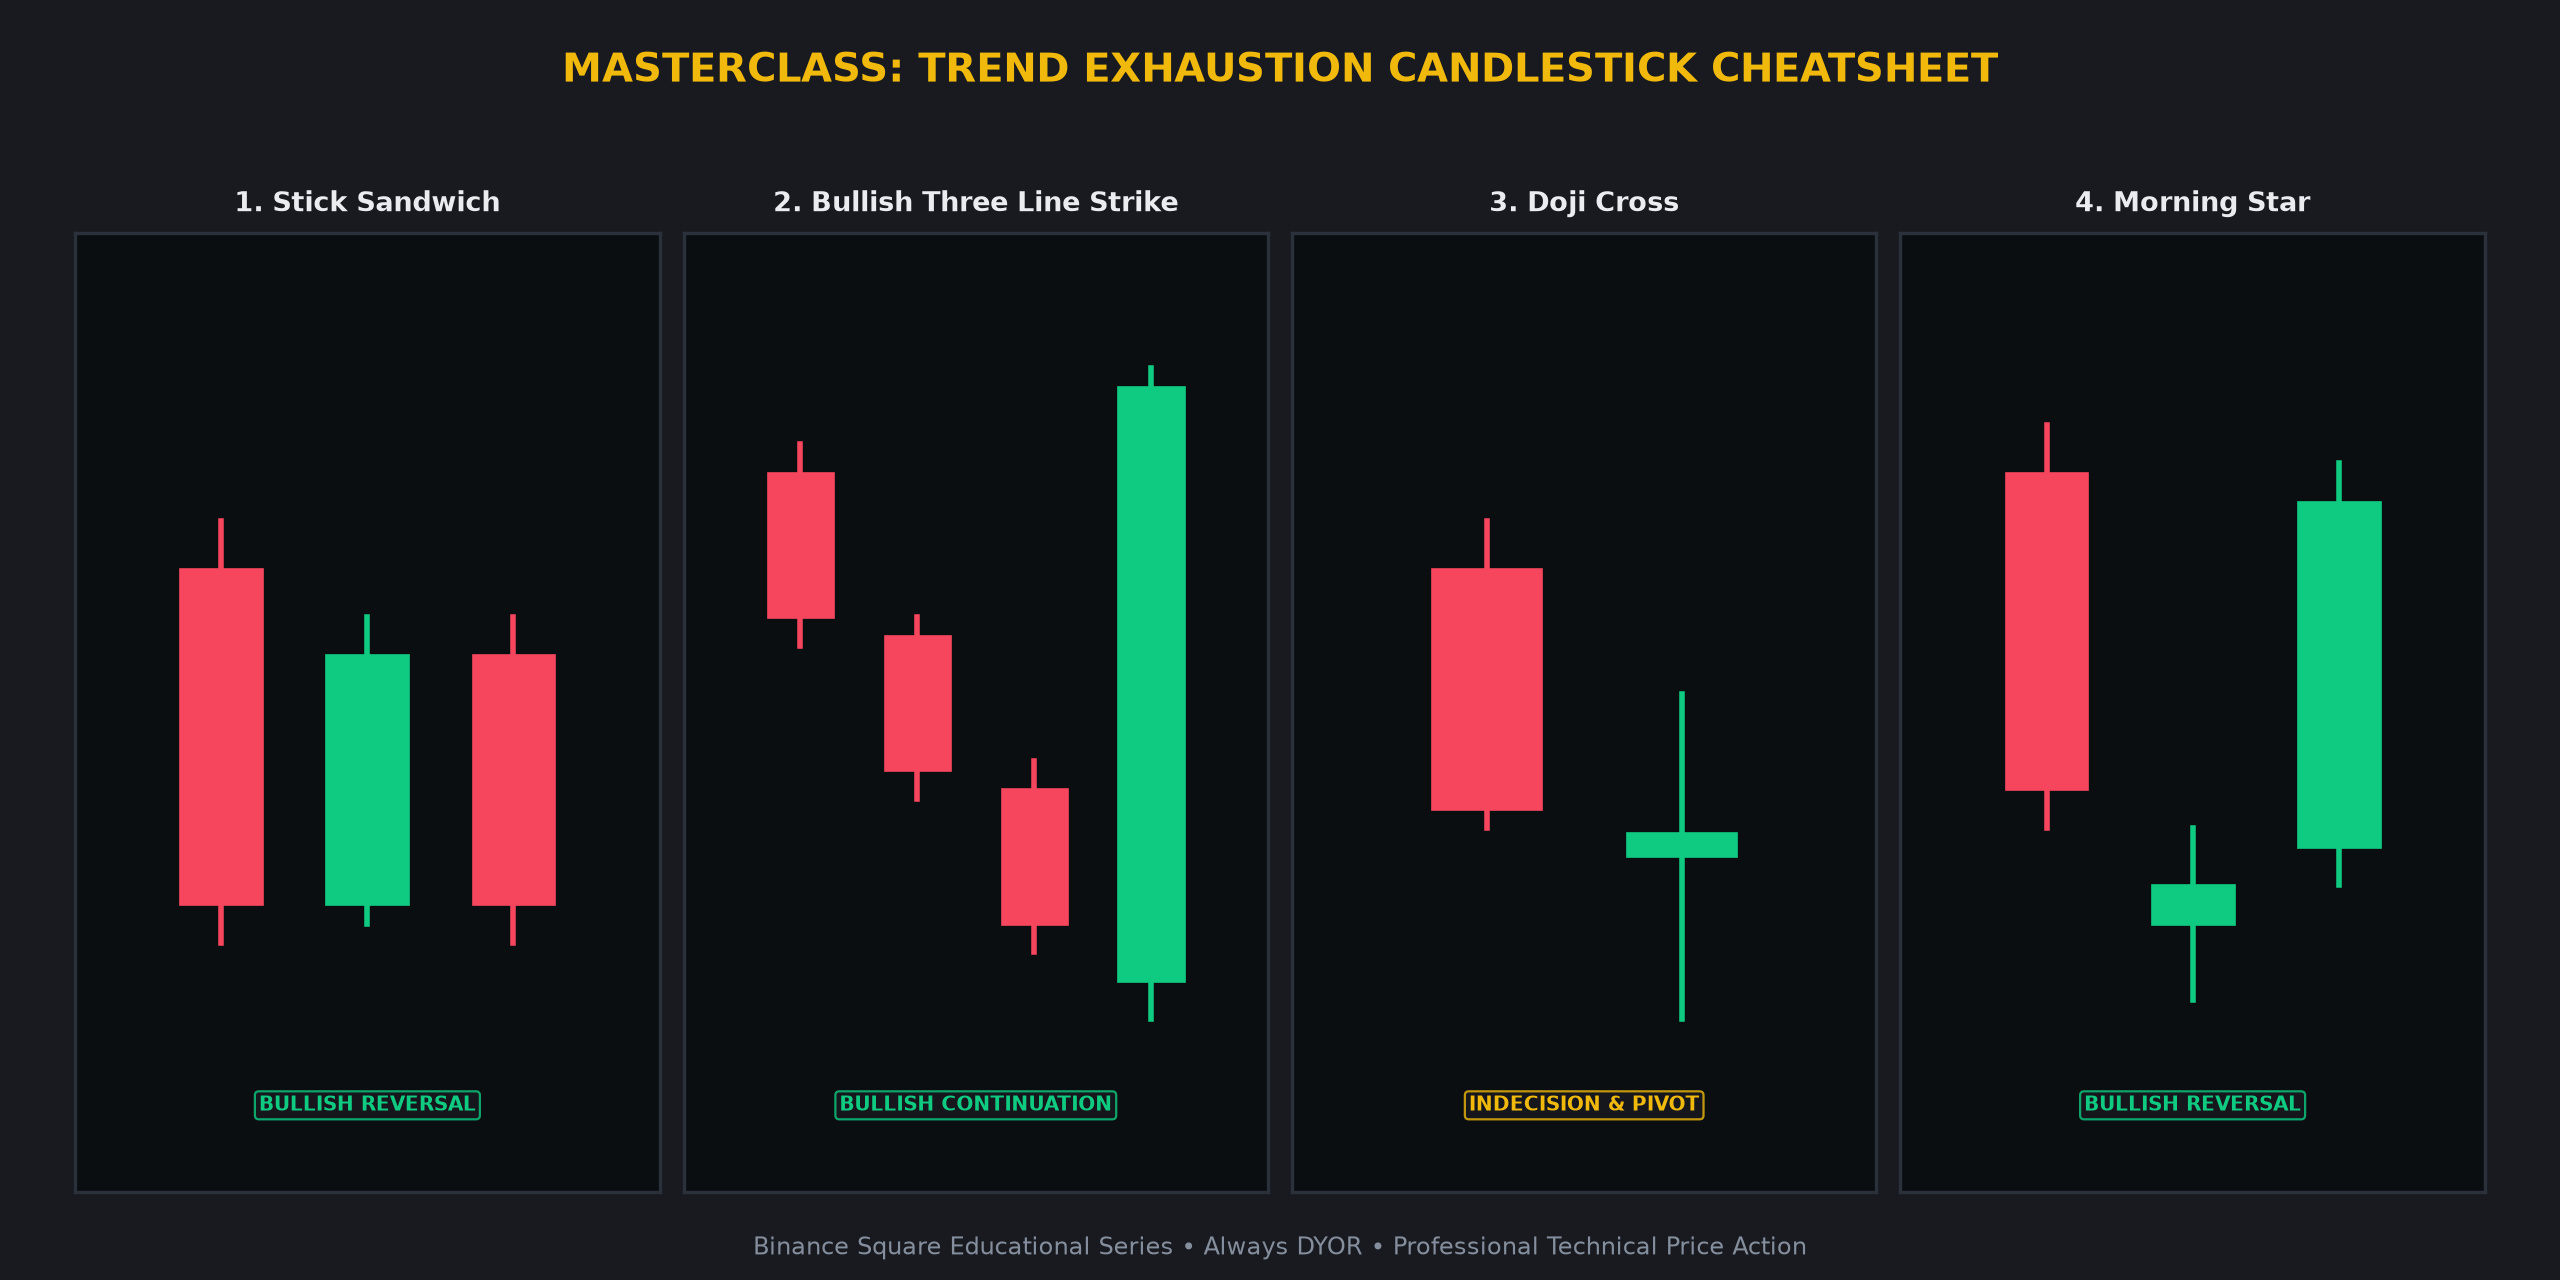
🚨 REVERSAL WARNING: 4 KEY CANDLESTICK FORMATIONS BEFORE THE TREND FLIPS 👇🚨 REVERSAL WARNING: 4 KEY CANDLESTICK FORMATIONS BEFORE THE TREND FLIPS 👇
Understand price action at an institutional level. Here is your definitive masterclass on the most reliable candlestick formations every crypto trader must master to identify trend exhaustion and potential pivots.
1️⃣ STICK SANDWICH 🥪
• Candlestick Anatomy: A bullish green candle is sandwiched between two red candles that share an identical support floor or closing price.
• Market Psychology: Sellers attempt to push the price lower twice but fail to break the established horizontal floor. This suggests strong buy-side absorption and a failure of bearish momentum.
• High-Confidence Confirmation: A subsequent breakout above the high of the middle green candle often signals that the support floor is solidified.
2️⃣ BULLISH THREE LINE STRIKE ⚡
• Candlestick Anatomy: Three consecutive small falling red candles are erased completely by one massive green candle that opens lower but closes above the first candle's start.
• Market Psychology: Prolonged seller pressure is engulfed in a single violent short-covering spike. It indicates that the previous downtrend was a liquidity grab before a major move.
• High-Confidence Confirmation: Look for a candle close above the high of the large green strike candle on elevated trading volume.
3️⃣ DOJI CROSS ⚖️
• Candlestick Anatomy: The open and close prices are virtually identical, creating a cross or plus shape. This represents a perfect tie in price action.
• Market Psychology: Total equilibrium between buyers and sellers. It signals that the previous trend is losing steam and prepares the stage for a violent expansion in the opposite direction.
• High-Confidence Confirmation: Directional breakout on high volume following the Doji formation is required to confirm the new technical bias.
4️⃣ MORNING STAR ⭐
• Candlestick Anatomy: A tall red candle is followed by a small spinning star (gap down), then a tall green candle closing
🚨 REVERSAL WARNING: 4 KEY CANDLESTICK FORMATIONS BEFORE THE TREND FLIPS 👇
🚨 REVERSAL WARNING: 4 KEY CANDLESTICK FORMATIONS BEFORE THE TREND FLIPS 👇
Understand price action at an institutional level. Here is your definitive masterclass on the most reliable candlestick formations every crypto trader must master to identify trend exhaustion and potential pivots.
1️⃣ STICK SANDWICH 🥪
• Candlestick Anatomy: A bullish green candle is sandwiched between two red candles that share an identical support floor or closing price.
• Market Psychology: Sellers attempt to push the price lower twice but fail to break the established horizontal floor. This suggests strong buy-side absorption and a failure of bearish momentum.
• High-Confidence Confirmation: A subsequent breakout above the high of the middle green candle often signals that the support floor is solidified.
2️⃣ BULLISH THREE LINE STRIKE ⚡
• Candlestick Anatomy: Three consecutive small falling red candles are erased completely by one massive green candle that opens lower but closes above the first candle's start.
• Market Psychology: Prolonged seller pressure is engulfed in a single violent short-covering spike. It indicates that the previous downtrend was a liquidity grab before a major move.
• High-Confidence Confirmation: Look for a candle close above the high of the large green strike candle on elevated trading volume.
3️⃣ DOJI CROSS ⚖️
• Candlestick Anatomy: The open and close prices are virtually identical, creating a cross or plus shape. This represents a perfect tie in price action.
• Market Psychology: Total equilibrium between buyers and sellers. It signals that the previous trend is losing steam and prepares the stage for a violent expansion in the opposite direction.
• High-Confidence Confirmation: Directional breakout on high volume following the Doji formation is required to confirm the new technical bias.
4️⃣ MORNING STAR ⭐
• Candlestick Anatomy: A tall red candle is followed by a small spinning star (gap down), then a tall green candle closing
Understand price action at an institutional level. Here is your definitive masterclass on the most reliable candlestick formations every crypto trader must master to identify trend exhaustion and potential pivots.
1️⃣ STICK SANDWICH 🥪
• Candlestick Anatomy: A bullish green candle is sandwiched between two red candles that share an identical support floor or closing price.
• Market Psychology: Sellers attempt to push the price lower twice but fail to break the established horizontal floor. This suggests strong buy-side absorption and a failure of bearish momentum.
• High-Confidence Confirmation: A subsequent breakout above the high of the middle green candle often signals that the support floor is solidified.
2️⃣ BULLISH THREE LINE STRIKE ⚡
• Candlestick Anatomy: Three consecutive small falling red candles are erased completely by one massive green candle that opens lower but closes above the first candle's start.
• Market Psychology: Prolonged seller pressure is engulfed in a single violent short-covering spike. It indicates that the previous downtrend was a liquidity grab before a major move.
• High-Confidence Confirmation: Look for a candle close above the high of the large green strike candle on elevated trading volume.
3️⃣ DOJI CROSS ⚖️
• Candlestick Anatomy: The open and close prices are virtually identical, creating a cross or plus shape. This represents a perfect tie in price action.
• Market Psychology: Total equilibrium between buyers and sellers. It signals that the previous trend is losing steam and prepares the stage for a violent expansion in the opposite direction.
• High-Confidence Confirmation: Directional breakout on high volume following the Doji formation is required to confirm the new technical bias.
4️⃣ MORNING STAR ⭐
• Candlestick Anatomy: A tall red candle is followed by a small spinning star (gap down), then a tall green candle closing
3
·
--
🌐 Crypto Market 24h Macro Pulse & Volume Overview
1. Overall Market Sentiment & Breadth
The current market landscape reflects a cautious stance with a bearish bias observed across major assets. Aggregate 24h volume for the top 50 assets sits at 3,008,749,580 USDT. The advance/decline ratio is currently skewed toward the downside, with 17 gainers against 33 losers. Market participants are observing consolidation patterns as liquidity flows remain subdued compared to previous weekly averages.
2. Top Volume Leaders
• $BTC : 64377.48 USDT (-1.48%)
• $ETH : 1800.32 USDT (-1.22%)
• SOL : 71.01 USDT (-0.99%)
• ZEC : 889.82 USDT (-2.00%)
• XRP : 0.945 USDT (-1.90%)
3. Prudent Trader Notes
Technical Momentum & Market Bias remain focused on established support floors. $BTC is currently testing its primary support structure, while $ETH shows relative weakness against the pair. Traders are monitoring the volume profile to identify if the current retracement is finding equilibrium or if further range expansion is likely. Key technical levels to monitor include the recent swing lows and the volume-weighted average price. Maintaining a neutral observation stance while waiting for a confirmed shift in momentum is a common approach during periods of low volatility and negative breadth.
4. Community Discussion
Given the current distribution of volume and the prevailing bearish sentiment, what technical indicators are you prioritizing to identify a potential stabilization point in the current market cycle?
⚠️ Educational analysis only. Not financial advice (NFA). DYOR.
BinanceSquare #CryptoMarket
🌐 Crypto Market 24h Macro Pulse & Volume Overview
1. Overall Market Sentiment & Breadth
The current market landscape reflects a cautious stance with a bearish bias observed across major assets. Aggregate 24h volume for the top 50 assets sits at 3,008,749,580 USDT. The advance/decline ratio is currently skewed toward the downside, with 17 gainers against 33 losers. Market participants are observing consolidation patterns as liquidity flows remain subdued compared to previous weekly averages.
2. Top Volume Leaders
• $BTC : 64377.48 USDT (-1.48%)
• $ETH : 1800.32 USDT (-1.22%)
• SOL : 71.01 USDT (-0.99%)
• ZEC : 889.82 USDT (-2.00%)
• XRP : 0.945 USDT (-1.90%)
3. Prudent Trader Notes
Technical Momentum & Market Bias remain focused on established support floors. $BTC is currently testing its primary support structure, while $ETH shows relative weakness against the pair. Traders are monitoring the volume profile to identify if the current retracement is finding equilibrium or if further range expansion is likely. Key technical levels to monitor include the recent swing lows and the volume-weighted average price. Maintaining a neutral observation stance while waiting for a confirmed shift in momentum is a common approach during periods of low volatility and negative breadth.
4. Community Discussion
Given the current distribution of volume and the prevailing bearish sentiment, what technical indicators are you prioritizing to identify a potential stabilization point in the current market cycle?
⚠️ Educational analysis only. Not financial advice (NFA). DYOR.
BinanceSquare #CryptoMarket
1. Overall Market Sentiment & Breadth
The current market landscape reflects a cautious stance with a bearish bias observed across major assets. Aggregate 24h volume for the top 50 assets sits at 3,008,749,580 USDT. The advance/decline ratio is currently skewed toward the downside, with 17 gainers against 33 losers. Market participants are observing consolidation patterns as liquidity flows remain subdued compared to previous weekly averages.
2. Top Volume Leaders
• $BTC : 64377.48 USDT (-1.48%)
• $ETH : 1800.32 USDT (-1.22%)
• SOL : 71.01 USDT (-0.99%)
• ZEC : 889.82 USDT (-2.00%)
• XRP : 0.945 USDT (-1.90%)
3. Prudent Trader Notes
Technical Momentum & Market Bias remain focused on established support floors. $BTC is currently testing its primary support structure, while $ETH shows relative weakness against the pair. Traders are monitoring the volume profile to identify if the current retracement is finding equilibrium or if further range expansion is likely. Key technical levels to monitor include the recent swing lows and the volume-weighted average price. Maintaining a neutral observation stance while waiting for a confirmed shift in momentum is a common approach during periods of low volatility and negative breadth.
4. Community Discussion
Given the current distribution of volume and the prevailing bearish sentiment, what technical indicators are you prioritizing to identify a potential stabilization point in the current market cycle?
⚠️ Educational analysis only. Not financial advice (NFA). DYOR.
BinanceSquare #CryptoMarket
2
·
--
⚡ Market Titans Dual Analysis: Bitcoin $BTC vs Ethereum $ETH
1. Bitcoin $BTC Technical Outlook
The lead asset is currently priced at 64,577.92, reflecting a marginal decline of 0.40%. Market structure remains under pressure as the price trades below the EMA 20 at 64,906.69 and the EMA 50 at 65,687.20. With an RSI of 44.73, the asset is hovering in neutral territory, leaning toward bearish sentiment. Key support floors are identified at 64,391.19 and 62,006.00. Should buyers regain momentum, resistance awaits at 65,759.35 and 67,523.05.
2. Ethereum $ETH Technical Outlook
Ethereum $ETH shows slight resilience, trading at $1,809.17 with a 0.30% gain. Similar to the broader market, it sits below its EMA 20 ($1,818.54) and EMA 50 ($1,839.62). The RSI at 45.47 suggests a lack of strong directional conviction. Technical levels to monitor include support at $1,795.62 and $1,711.08, while resistance stands firm at $1,840.93 and $1,919.76.
3. Macro Confluence & Market Structure
Both assets are currently testing critical EMA thresholds. The MACD histogram for $BTC at 8.6721 indicates minor stabilization, while $ETH shows negligible momentum at 0.2903. The market is currently consolidating, waiting for a catalyst to break the current range.
4. Community Discussion
Which asset do you expect to lead momentum this week: $BTC or $ETH? Share below! 👇
⚠️ Educational analysis only. Not financial advice (NFA). DYOR.
$BTC $ETH #BinanceSquare #CryptoMarket
⚡ Market Titans Dual Analysis: Bitcoin $BTC vs Ethereum $ETH
1. Bitcoin $BTC Technical Outlook
The lead asset is currently priced at 64,577.92, reflecting a marginal decline of 0.40%. Market structure remains under pressure as the price trades below the EMA 20 at 64,906.69 and the EMA 50 at 65,687.20. With an RSI of 44.73, the asset is hovering in neutral territory, leaning toward bearish sentiment. Key support floors are identified at 64,391.19 and 62,006.00. Should buyers regain momentum, resistance awaits at 65,759.35 and 67,523.05.
2. Ethereum $ETH Technical Outlook
Ethereum $ETH shows slight resilience, trading at $1,809.17 with a 0.30% gain. Similar to the broader market, it sits below its EMA 20 ($1,818.54) and EMA 50 ($1,839.62). The RSI at 45.47 suggests a lack of strong directional conviction. Technical levels to monitor include support at $1,795.62 and $1,711.08, while resistance stands firm at $1,840.93 and $1,919.76.
3. Macro Confluence & Market Structure
Both assets are currently testing critical EMA thresholds. The MACD histogram for $BTC at 8.6721 indicates minor stabilization, while $ETH shows negligible momentum at 0.2903. The market is currently consolidating, waiting for a catalyst to break the current range.
4. Community Discussion
Which asset do you expect to lead momentum this week: $BTC or $ETH ? Share below! 👇
⚠️ Educational analysis only. Not financial advice (NFA). DYOR.
$BTC $ETH #BinanceSquare #CryptoMarket
1. Bitcoin $BTC Technical Outlook
The lead asset is currently priced at 64,577.92, reflecting a marginal decline of 0.40%. Market structure remains under pressure as the price trades below the EMA 20 at 64,906.69 and the EMA 50 at 65,687.20. With an RSI of 44.73, the asset is hovering in neutral territory, leaning toward bearish sentiment. Key support floors are identified at 64,391.19 and 62,006.00. Should buyers regain momentum, resistance awaits at 65,759.35 and 67,523.05.
2. Ethereum $ETH Technical Outlook
Ethereum $ETH shows slight resilience, trading at $1,809.17 with a 0.30% gain. Similar to the broader market, it sits below its EMA 20 ($1,818.54) and EMA 50 ($1,839.62). The RSI at 45.47 suggests a lack of strong directional conviction. Technical levels to monitor include support at $1,795.62 and $1,711.08, while resistance stands firm at $1,840.93 and $1,919.76.
3. Macro Confluence & Market Structure
Both assets are currently testing critical EMA thresholds. The MACD histogram for $BTC at 8.6721 indicates minor stabilization, while $ETH shows negligible momentum at 0.2903. The market is currently consolidating, waiting for a catalyst to break the current range.
4. Community Discussion
Which asset do you expect to lead momentum this week: $BTC or $ETH ? Share below! 👇
⚠️ Educational analysis only. Not financial advice (NFA). DYOR.
$BTC $ETH #BinanceSquare #CryptoMarket
4
·
--
ບົດຄວາມ
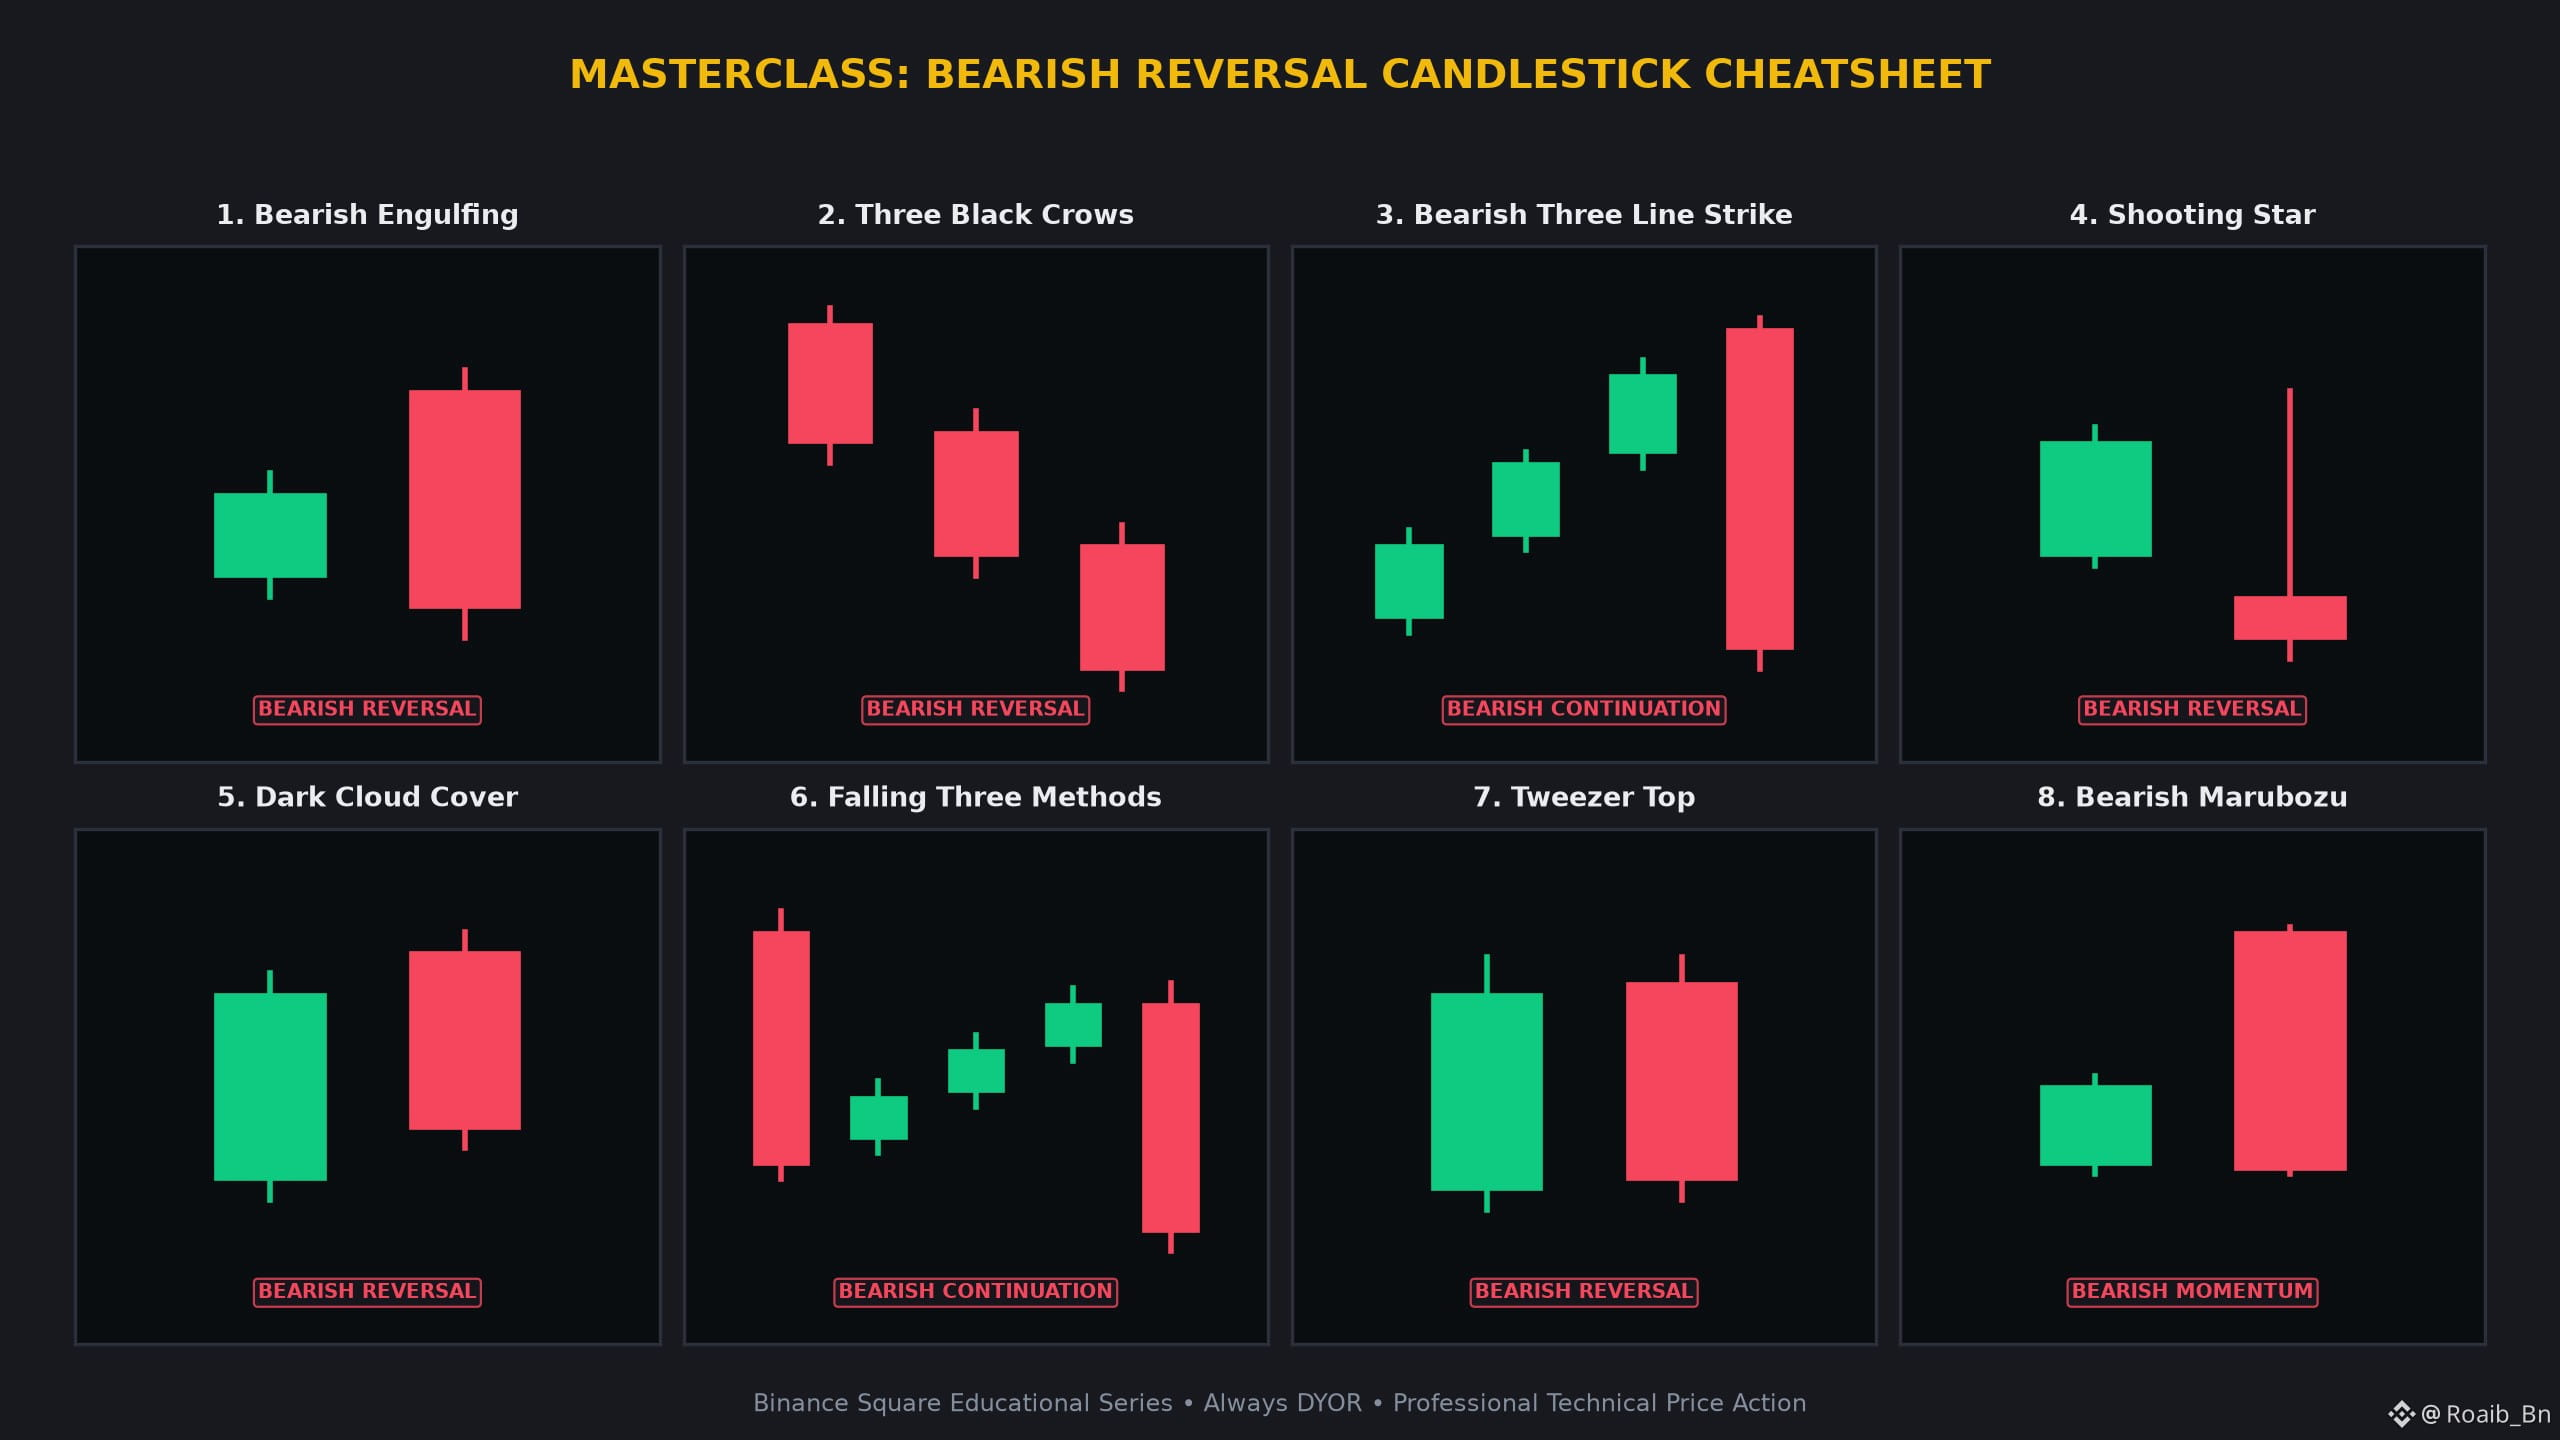
🚨 SPOT THE TOP: 8 CRITICAL BEARISH CANDLESTICK PATTERNS EVERY TRADER MUST KNOW 👇🚨 SPOT THE TOP: 8 CRITICAL BEARISH CANDLESTICK PATTERNS EVERY TRADER MUST KNOW 👇
Understand price action at an institutional level. Here is your definitive masterclass on the most reliable candlestick formations every trader must master.
1️⃣ Bearish Engulfing 🐻
• Anatomy: Small green candle engulfed by a large red body.
• Psychology: Bulls attempted higher prices but aggressive sellers wiped out prior gains.
• Confirmation: Wait for the red candle to close below the prior green open.
2️⃣ Three Black Crows 🦅
• Anatomy: Three consecutive tall red candles stepping downward.
• Psychology: Heavy distribution forcing buyers to surrender.
• Confirmation: Look for a break of the previous support floor.
3️⃣ Bearish Three Line Strike ⛈️
• Anatomy: Three rising green candles wiped out by one massive red candle.
• Psychology: Retail rally obliterated by institutional block selling.
• Confirmation: High volume on the final red candle.
4️⃣ Shooting Star 🌠
• Anatomy: Small body at bottom, long upper wick.
• Psychology: Bulls drove price up but hit a massive sell wall.
• Confirmation: Price failing to reclaim the wick high.
5️⃣ Dark Cloud Cover ☁️
• Anatomy: Green candle followed by red opening higher but closing below 50% midpoint.
• Psychology: Gap-up sold into heavily.
• Confirmation: Sustained move below the 50% level.
6️⃣ Falling Three Methods 📉
• Anatomy: Tall red, three small rising green bars, then steep red drop.
• Psychology: Weak corrective bounce crushed by sellers.
• Confirmation: Break below the initial red candle low.
7️⃣ Tweezer Top 📌
• Anatomy: Two candles topping at the exact same resistance point.
• Psychology: Double rejection at overhead supply.
• Confirmation: Close below the low of the two-candle range.
8️⃣ Bearish Marubozu 🧱
• Anatomy: Solid red body, zero wicks.
• Psychology: Total institutional dominance.
• Confirmation: Trend continuation on lower timeframes.
💡 Why Master These?
• Spot reversals before the crowd.
• Define exact risk boundaries.
• Combine with $BTC $ETH volume data.
💬 Community Masterclass Discussion:
Which of these 8 candlestick setups has yielded the highest win-rate in your crypto journey? Share your thoughts below! 👇
⚠️ Educational Masterclass Disclaimer:
This content is for educational purposes only and does not constitute financial advice (NFA). Cryptocurrency markets carry inherent volatility. Always manage risk prudently and conduct your own research (DYOR).
$BTC $ETH BNB #BinanceSquare #CryptoTrading
🚨 SPOT THE TOP: 8 CRITICAL BEARISH CANDLESTICK PATTERNS EVERY TRADER MUST KNOW 👇
🚨 SPOT THE TOP: 8 CRITICAL BEARISH CANDLESTICK PATTERNS EVERY TRADER MUST KNOW 👇
Understand price action at an institutional level. Here is your definitive masterclass on the most reliable candlestick formations every trader must master.
1️⃣ Bearish Engulfing 🐻
• Anatomy: Small green candle engulfed by a large red body.
• Psychology: Bulls attempted higher prices but aggressive sellers wiped out prior gains.
• Confirmation: Wait for the red candle to close below the prior green open.
2️⃣ Three Black Crows 🦅
• Anatomy: Three consecutive tall red candles stepping downward.
• Psychology: Heavy distribution forcing buyers to surrender.
• Confirmation: Look for a break of the previous support floor.
3️⃣ Bearish Three Line Strike ⛈️
• Anatomy: Three rising green candles wiped out by one massive red candle.
• Psychology: Retail rally obliterated by institutional block selling.
• Confirmation: High volume on the final red candle.
4️⃣ Shooting Star 🌠
• Anatomy: Small body at bottom, long upper wick.
• Psychology: Bulls drove price up but hit a massive sell wall.
• Confirmation: Price failing to reclaim the wick high.
5️⃣ Dark Cloud Cover ☁️
• Anatomy: Green candle followed by red opening higher but closing below 50% midpoint.
• Psychology: Gap-up sold into heavily.
• Confirmation: Sustained move below the 50% level.
6️⃣ Falling Three Methods 📉
• Anatomy: Tall red, three small rising green bars, then steep red drop.
• Psychology: Weak corrective bounce crushed by sellers.
• Confirmation: Break below the initial red candle low.
7️⃣ Tweezer Top 📌
• Anatomy: Two candles topping at the exact same resistance point.
• Psychology: Double rejection at overhead supply.
• Confirmation: Close below the low of the two-candle range.
8️⃣ Bearish Marubozu 🧱
• Anatomy: Solid red body, zero wicks.
• Psychology: Total institutional dominance.
• Confirmation: Trend continuation on lower timeframes.
💡 Why Master These?
• Spot reversals before the crowd.
• Define exact risk boundaries.
• Combine with $BTC $ETH volume data.
💬 Community Masterclass Discussion:
Which of these 8 candlestick setups has yielded the highest win-rate in your crypto journey? Share your thoughts below! 👇
⚠️ Educational Masterclass Disclaimer:
This content is for educational purposes only and does not constitute financial advice (NFA). Cryptocurrency markets carry inherent volatility. Always manage risk prudently and conduct your own research (DYOR).
$BTC $ETH BNB #BinanceSquare #CryptoTrading
Understand price action at an institutional level. Here is your definitive masterclass on the most reliable candlestick formations every trader must master.
1️⃣ Bearish Engulfing 🐻
• Anatomy: Small green candle engulfed by a large red body.
• Psychology: Bulls attempted higher prices but aggressive sellers wiped out prior gains.
• Confirmation: Wait for the red candle to close below the prior green open.
2️⃣ Three Black Crows 🦅
• Anatomy: Three consecutive tall red candles stepping downward.
• Psychology: Heavy distribution forcing buyers to surrender.
• Confirmation: Look for a break of the previous support floor.
3️⃣ Bearish Three Line Strike ⛈️
• Anatomy: Three rising green candles wiped out by one massive red candle.
• Psychology: Retail rally obliterated by institutional block selling.
• Confirmation: High volume on the final red candle.
4️⃣ Shooting Star 🌠
• Anatomy: Small body at bottom, long upper wick.
• Psychology: Bulls drove price up but hit a massive sell wall.
• Confirmation: Price failing to reclaim the wick high.
5️⃣ Dark Cloud Cover ☁️
• Anatomy: Green candle followed by red opening higher but closing below 50% midpoint.
• Psychology: Gap-up sold into heavily.
• Confirmation: Sustained move below the 50% level.
6️⃣ Falling Three Methods 📉
• Anatomy: Tall red, three small rising green bars, then steep red drop.
• Psychology: Weak corrective bounce crushed by sellers.
• Confirmation: Break below the initial red candle low.
7️⃣ Tweezer Top 📌
• Anatomy: Two candles topping at the exact same resistance point.
• Psychology: Double rejection at overhead supply.
• Confirmation: Close below the low of the two-candle range.
8️⃣ Bearish Marubozu 🧱
• Anatomy: Solid red body, zero wicks.
• Psychology: Total institutional dominance.
• Confirmation: Trend continuation on lower timeframes.
💡 Why Master These?
• Spot reversals before the crowd.
• Define exact risk boundaries.
• Combine with $BTC $ETH volume data.
💬 Community Masterclass Discussion:
Which of these 8 candlestick setups has yielded the highest win-rate in your crypto journey? Share your thoughts below! 👇
⚠️ Educational Masterclass Disclaimer:
This content is for educational purposes only and does not constitute financial advice (NFA). Cryptocurrency markets carry inherent volatility. Always manage risk prudently and conduct your own research (DYOR).
$BTC $ETH BNB #BinanceSquare #CryptoTrading
9
·
--
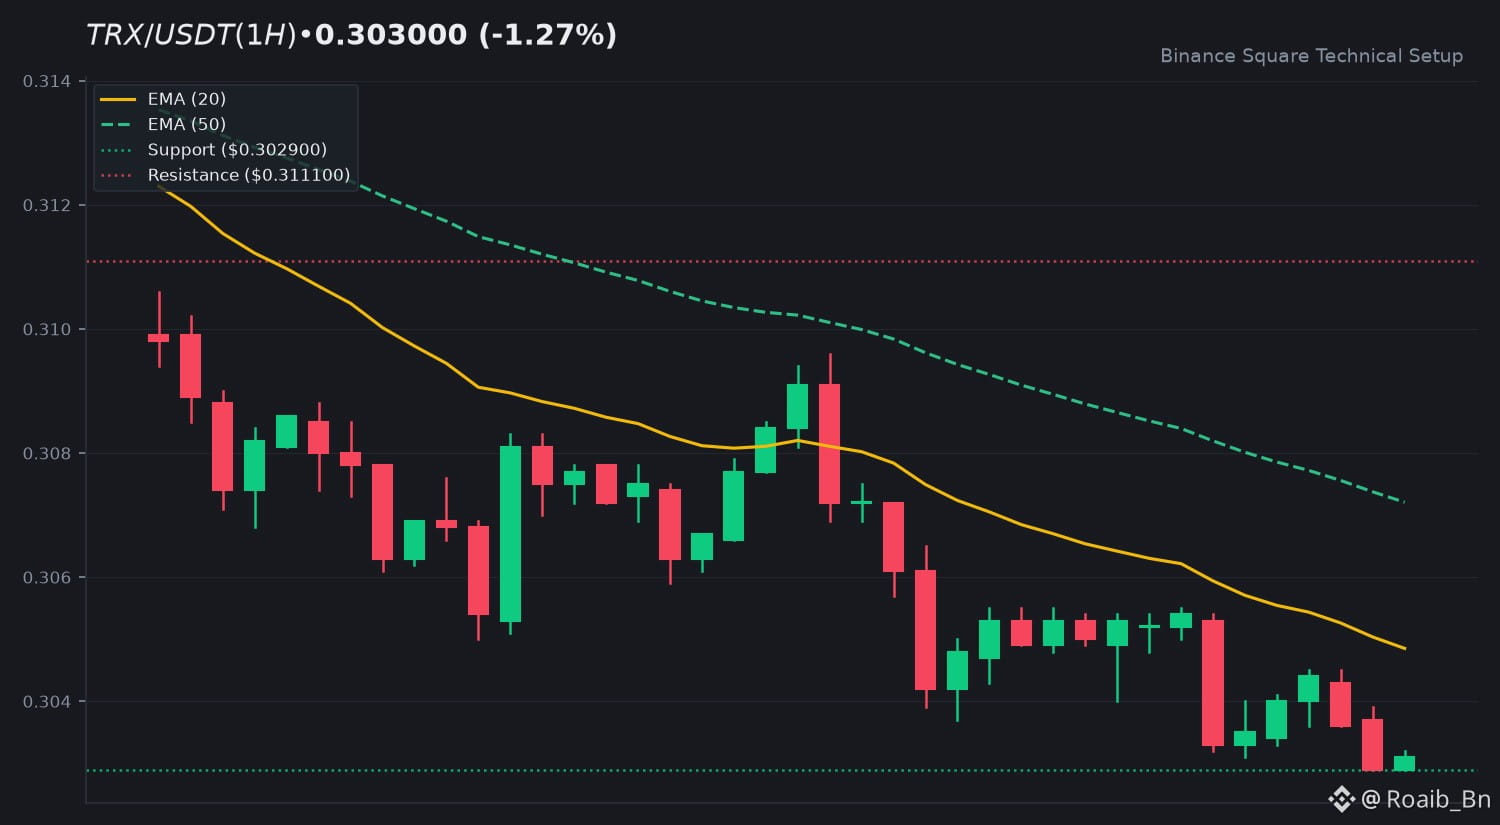
🔥 $TRX Technical Update: Key Levels & Momentum Breakdown
📊 1. Market Snapshot
The $TRX token is currently changing hands at $0.3030, marking a minor 24-hour decline of -1.27 percent. Price action over the last session recorded a high of $0.3096 and a low near the immediate floor of $0.3029. 24-hour quote volume stands at $22,128,202 USDT with low participation ratios, suggesting a consolidation phase with subdued market conviction.
📈 2. Technical Momentum & Indicator Bias
Technical Momentum & Market Bias currently shows a sustained downward posture. The EMA 20 rests at $0.3049 while the EMA 50 sits at $0.3072, confirming short-term price compression beneath key moving averages. The 14-period RSI prints at 35.77, reflecting weak buying pressure lingering near oversold territory without a definitive reversal signal yet. Meanwhile, the MACD histogram flatlines near -0.0000 alongside identical MACD and signal lines at -0.0012, highlighting quiet trend progression.
🎯 3. Key Technical Levels to Watch
• 🟢 Resistance Zone: $0.3111 acts as the primary overhead hurdle for bulls.
• 🔴 Support Zone: $0.3029 serves as the immediate support floor.
• 🛡️ Pivot Confluence: The EMA 20 zone at $0.3049 acts as the crucial pivot level.
💡 4. Technical Takeaway & Risk Management
Traders should closely monitor how price action interacts with the dynamic EMA resistance lines and the lower support boundary. Maintaining strict risk management protocols remains essential during low volume consolidation phases.
💬 5. Community Discussion
What is your technical outlook for $TRX this week? Are you monitoring the support floor or waiting for structural breakout confirmation? Drop your thoughts below! 👇
⚠️ 6. Disclaimer
Educational technical analysis only. Not financial advice (NFA). Crypto markets involve high risk. Always DYOR.
$TRX #TRX #BinanceSquare
🔥 $TRX Technical Update: Key Levels & Momentum Breakdown
📊 1. Market Snapshot
The $TRX token is currently changing hands at $0.3030, marking a minor 24-hour decline of -1.27 percent. Price action over the last session recorded a high of $0.3096 and a low near the immediate floor of $0.3029. 24-hour quote volume stands at $22,128,202 USDT with low participation ratios, suggesting a consolidation phase with subdued market conviction.
📈 2. Technical Momentum & Indicator Bias
Technical Momentum & Market Bias currently shows a sustained downward posture. The EMA 20 rests at $0.3049 while the EMA 50 sits at $0.3072, confirming short-term price compression beneath key moving averages. The 14-period RSI prints at 35.77, reflecting weak buying pressure lingering near oversold territory without a definitive reversal signal yet. Meanwhile, the MACD histogram flatlines near -0.0000 alongside identical MACD and signal lines at -0.0012, highlighting quiet trend progression.
🎯 3. Key Technical Levels to Watch
• 🟢 Resistance Zone: $0.3111 acts as the primary overhead hurdle for bulls.
• 🔴 Support Zone: $0.3029 serves as the immediate support floor.
• 🛡️ Pivot Confluence: The EMA 20 zone at $0.3049 acts as the crucial pivot level.
💡 4. Technical Takeaway & Risk Management
Traders should closely monitor how price action interacts with the dynamic EMA resistance lines and the lower support boundary. Maintaining strict risk management protocols remains essential during low volume consolidation phases.
💬 5. Community Discussion
What is your technical outlook for $TRX this week? Are you monitoring the support floor or waiting for structural breakout confirmation? Drop your thoughts below! 👇
⚠️ 6. Disclaimer
Educational technical analysis only. Not financial advice (NFA). Crypto markets involve high risk. Always DYOR.
$TRX #TRX #BinanceSquare
📊 1. Market Snapshot
The $TRX token is currently changing hands at $0.3030, marking a minor 24-hour decline of -1.27 percent. Price action over the last session recorded a high of $0.3096 and a low near the immediate floor of $0.3029. 24-hour quote volume stands at $22,128,202 USDT with low participation ratios, suggesting a consolidation phase with subdued market conviction.
📈 2. Technical Momentum & Indicator Bias
Technical Momentum & Market Bias currently shows a sustained downward posture. The EMA 20 rests at $0.3049 while the EMA 50 sits at $0.3072, confirming short-term price compression beneath key moving averages. The 14-period RSI prints at 35.77, reflecting weak buying pressure lingering near oversold territory without a definitive reversal signal yet. Meanwhile, the MACD histogram flatlines near -0.0000 alongside identical MACD and signal lines at -0.0012, highlighting quiet trend progression.
🎯 3. Key Technical Levels to Watch
• 🟢 Resistance Zone: $0.3111 acts as the primary overhead hurdle for bulls.
• 🔴 Support Zone: $0.3029 serves as the immediate support floor.
• 🛡️ Pivot Confluence: The EMA 20 zone at $0.3049 acts as the crucial pivot level.
💡 4. Technical Takeaway & Risk Management
Traders should closely monitor how price action interacts with the dynamic EMA resistance lines and the lower support boundary. Maintaining strict risk management protocols remains essential during low volume consolidation phases.
💬 5. Community Discussion
What is your technical outlook for $TRX this week? Are you monitoring the support floor or waiting for structural breakout confirmation? Drop your thoughts below! 👇
⚠️ 6. Disclaimer
Educational technical analysis only. Not financial advice (NFA). Crypto markets involve high risk. Always DYOR.
$TRX #TRX #BinanceSquare
22
·
--
🔥 $SPCXB Technical Update: Key Levels & Momentum Breakdown
📊 1. Market Snapshot
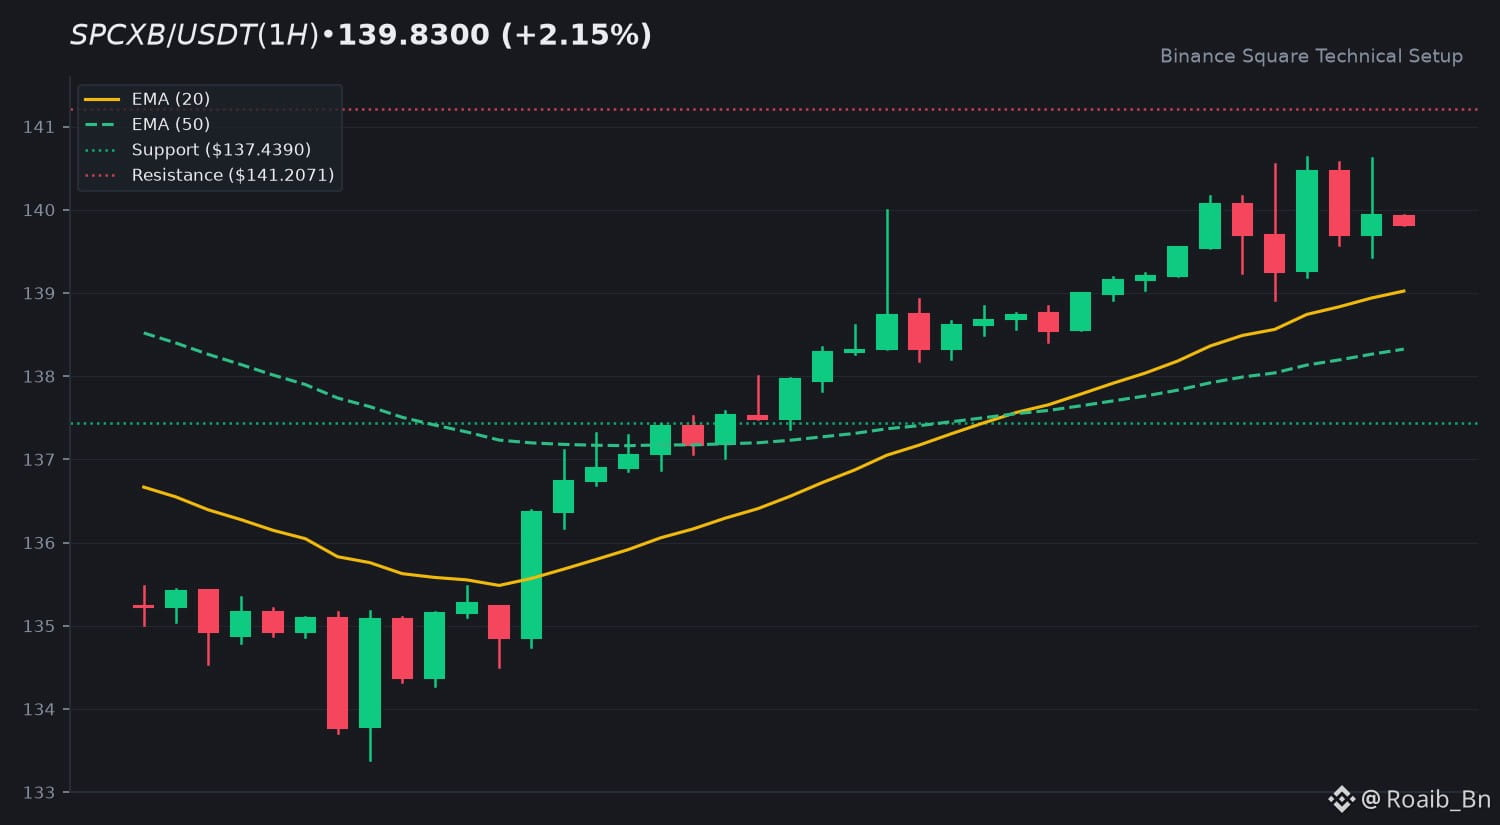
The asset $SPCXB is currently trading at 139.8300 USDT, reflecting a 24h change of +2.15%. Trading activity remains measured with a 24h quote volume of 21,303,929 USDT. The current volume relative to the 20-SMA is 0.08x, indicating a period of consolidation and low market conviction.
📈 2. Technical Momentum & Indicator Bias
Price action maintains a constructive posture above the EMA 20 at 139.0225 and the EMA 50 at 138.3243, confirming a steady uptrend. The RSI at 61.06 suggests moderate bullish momentum without entering overbought territory. The MACD histogram is positive at +0.0070, with the MACD line positioned above the signal line, signaling continued alignment with the broader upward trend.
🎯 3. Key Technical Levels to Watch
• 🟢 Resistance Zone: Initial resistance is identified at 141.2071, with a secondary extension target at 147.5400.
• 🔴 Support Zone: Immediate support floor is established at 137.4390.
• 🛡️ Pivot Confluence: The EMA 20 at 139.0225 serves as the primary pivot for intraday trend continuity.
💡 4. Technical Takeaway & Risk Management
$SPCXB demonstrates a disciplined uptrend. Traders often monitor the interaction between price and the EMA 20/50 support cluster. Given the current low volume, market participants may look for a higher volume breakout above resistance to confirm trend strength. Maintaining awareness of the support floor is essential for evaluating the validity of the current structure.
💬 5. Community Discussion
What is your technical outlook for $SPCXB this week? Are you accumulating or waiting for confirmation? Drop your thoughts below! 👇
⚠️ 6. Disclaimer
Educational technical analysis only. Not financial advice (NFA). Crypto markets involve risk. Always DYOR.
$SPCXB #SPCXB #BinanceSquare
🔥 $SPCXB Technical Update: Key Levels & Momentum Breakdown
📊 1. Market Snapshot
The asset $SPCXB is currently trading at 139.8300 USDT, reflecting a 24h change of +2.15%. Trading activity remains measured with a 24h quote volume of 21,303,929 USDT. The current volume relative to the 20-SMA is 0.08x, indicating a period of consolidation and low market conviction.
📈 2. Technical Momentum & Indicator Bias
Price action maintains a constructive posture above the EMA 20 at 139.0225 and the EMA 50 at 138.3243, confirming a steady uptrend. The RSI at 61.06 suggests moderate bullish momentum without entering overbought territory. The MACD histogram is positive at +0.0070, with the MACD line positioned above the signal line, signaling continued alignment with the broader upward trend.
🎯 3. Key Technical Levels to Watch
• 🟢 Resistance Zone: Initial resistance is identified at 141.2071, with a secondary extension target at 147.5400.
• 🔴 Support Zone: Immediate support floor is established at 137.4390.
• 🛡️ Pivot Confluence: The EMA 20 at 139.0225 serves as the primary pivot for intraday trend continuity.
💡 4. Technical Takeaway & Risk Management
$SPCXB demonstrates a disciplined uptrend. Traders often monitor the interaction between price and the EMA 20/50 support cluster. Given the current low volume, market participants may look for a higher volume breakout above resistance to confirm trend strength. Maintaining awareness of the support floor is essential for evaluating the validity of the current structure.
💬 5. Community Discussion
What is your technical outlook for $SPCXB this week? Are you accumulating or waiting for confirmation? Drop your thoughts below! 👇
⚠️ 6. Disclaimer
Educational technical analysis only. Not financial advice (NFA). Crypto markets involve risk. Always DYOR.
$SPCXB #SPCXB #BinanceSquare
📊 1. Market Snapshot
The asset $SPCXB is currently trading at 139.8300 USDT, reflecting a 24h change of +2.15%. Trading activity remains measured with a 24h quote volume of 21,303,929 USDT. The current volume relative to the 20-SMA is 0.08x, indicating a period of consolidation and low market conviction.
📈 2. Technical Momentum & Indicator Bias
Price action maintains a constructive posture above the EMA 20 at 139.0225 and the EMA 50 at 138.3243, confirming a steady uptrend. The RSI at 61.06 suggests moderate bullish momentum without entering overbought territory. The MACD histogram is positive at +0.0070, with the MACD line positioned above the signal line, signaling continued alignment with the broader upward trend.
🎯 3. Key Technical Levels to Watch
• 🟢 Resistance Zone: Initial resistance is identified at 141.2071, with a secondary extension target at 147.5400.
• 🔴 Support Zone: Immediate support floor is established at 137.4390.
• 🛡️ Pivot Confluence: The EMA 20 at 139.0225 serves as the primary pivot for intraday trend continuity.
💡 4. Technical Takeaway & Risk Management
$SPCXB demonstrates a disciplined uptrend. Traders often monitor the interaction between price and the EMA 20/50 support cluster. Given the current low volume, market participants may look for a higher volume breakout above resistance to confirm trend strength. Maintaining awareness of the support floor is essential for evaluating the validity of the current structure.
💬 5. Community Discussion
What is your technical outlook for $SPCXB this week? Are you accumulating or waiting for confirmation? Drop your thoughts below! 👇
⚠️ 6. Disclaimer
Educational technical analysis only. Not financial advice (NFA). Crypto markets involve risk. Always DYOR.
$SPCXB #SPCXB #BinanceSquare
40
·
--
ບົດຄວາມ
🚨 THE SCALPER'S PLAYBOOK: 8 HIGH-WIN-RATE CANDLESTICK PATTERNS 👇🚨 THE SCALPER'S PLAYBOOK: 8 HIGH-WIN-RATE CANDLESTICK PATTERNS 👇
Understand price action at an institutional level. Here is your definitive masterclass on the most reliable candlestick formations every $BTC $ETH SOL trader must master.
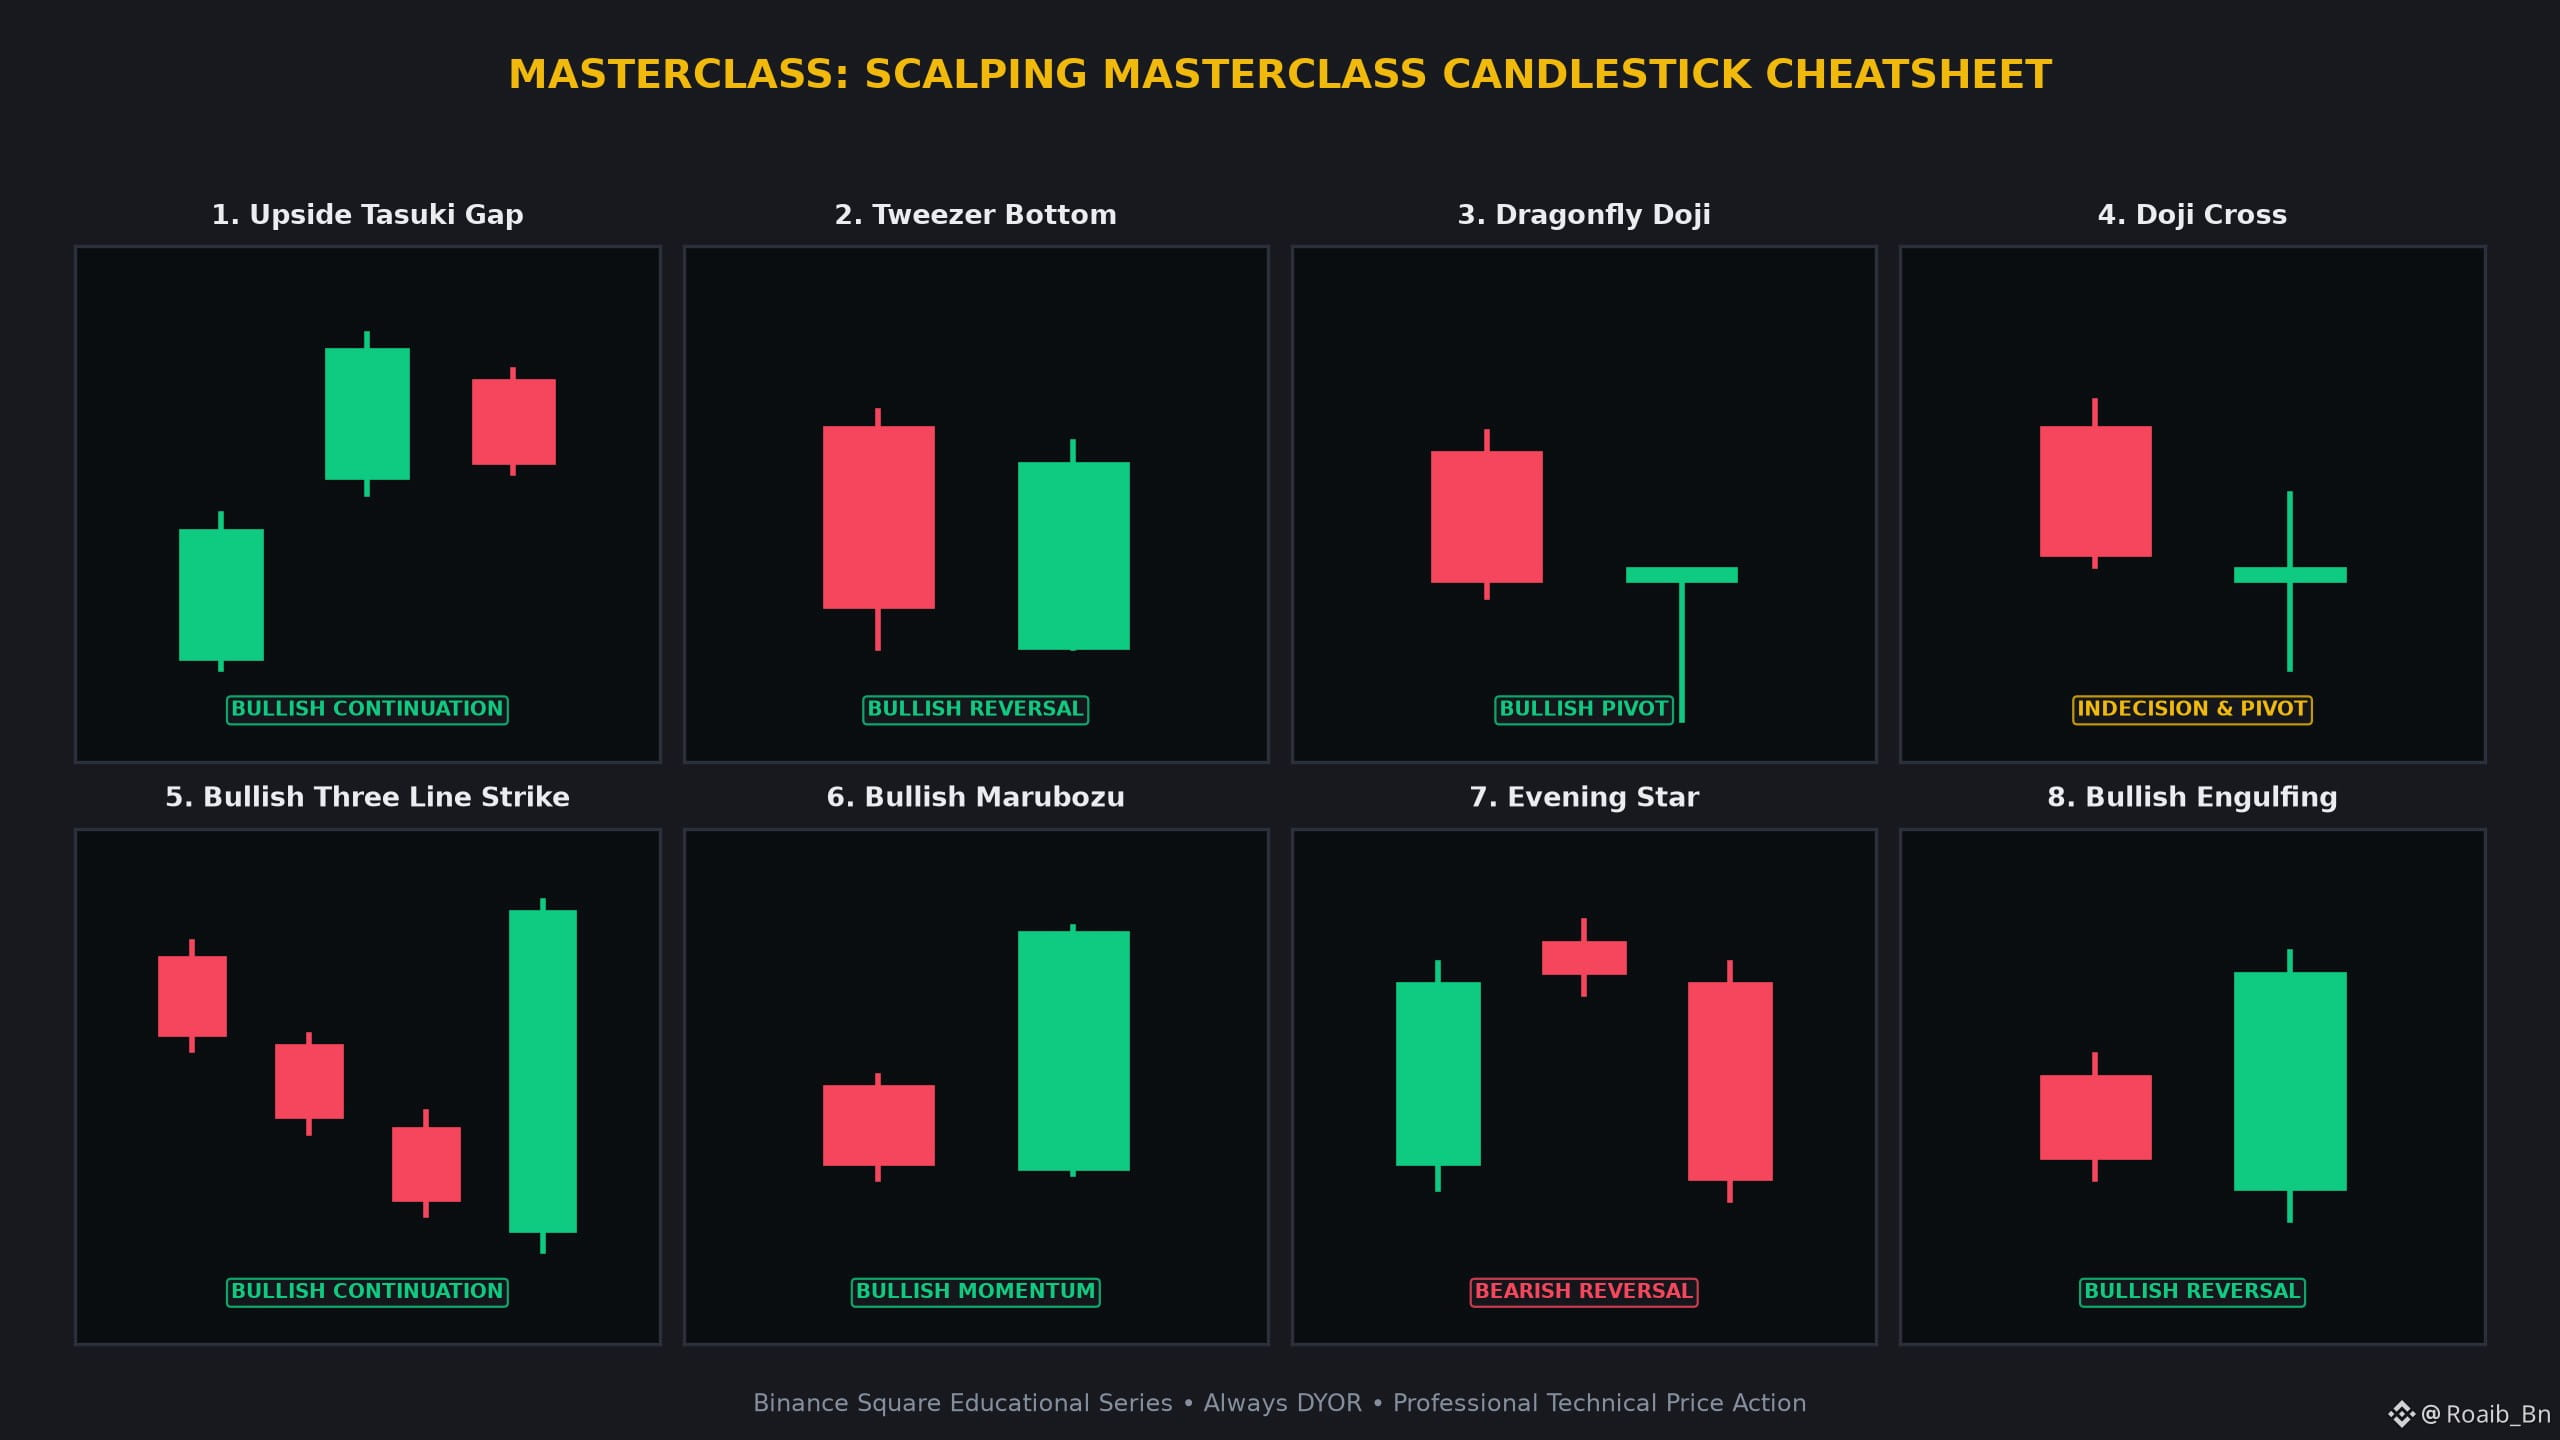
1 📈 Upside Tasuki Gap 📈
• Anatomy: Green candle gaps above prior green, followed by small red candle opening inside body.
• Psychology: Gap-up remains unfilled, confirming buyer appetite remains ferocious.
• Confirmation: Price breaking above the high of the gap-up candle.
2 🧲 Tweezer Bottom 🧲
• Anatomy: Red and green candles hitting the exact same low price level before bouncing.
• Psychology: Firm institutional support floor that rejects further seller probes twice.
• Confirmation: A close above the high of the formation.
3 🐉 Dragonfly Doji 🐉
• Anatomy: T-shaped candle with open, high, and close at the top and long lower shadow.
• Psychology: Sellers pushed price to deep lows, but buyers aggressively bought back up to the open.
• Confirmation: Price movement above the high of the wick.
4 ⚖️ Doji Cross ⚖️
• Anatomy: Identical open and close price creating a cross shape.
• Psychology: Total equilibrium between buyers and sellers; prepares the stage for violent expansion.
• Confirmation: Breakout in the direction of the subsequent momentum candle.
5 ⚡ Bullish Three Line Strike ⚡
• Anatomy: Three falling red candles erased completely by one massive green candle.
• Psychology: Prolonged seller pressure engulfed in a single violent short-covering spike.
• Confirmation: High volume on the engulfing green candle.
6 🔋 Bullish Marubozu 🔋
• Anatomy: Full solid green candle body with virtually no shadows.
• Psychology: Unconditional aggressive buyer dominance from open to close.
• Confirmation: Immediate momentum follow-through on lower timeframes.
7 🌙 Evening Star 🌙
• Anatomy: Tall green candle, small hesitation star at top, then a steep red plunge.
• Psychology: Buyer exhaustion at peak valuation followed by sudden take-profit orders.
• Confirmation: Close below the midpoint of the initial green candle.
8 🐂 Bullish Engulfing 🐂
• Anatomy: Small red candle completely engulfed by a large green candle body.
• Psychology: Bears tried pushing lower, but ferocious dip buyers took complete control.
• Confirmation: Sustained price action above the high of the engulfing candle.
💡 Why Master These Candlestick Formations?
• Spot high-probability reversals and continuation phases before the retail crowd.
• Define exact risk-to-reward boundaries with clear invalidation levels.
• Combine with volume confirmation and dynamic moving averages (EMA 20/50).
💬 Community Masterclass Discussion:
Which of these 8 candlestick setups has yielded the highest win-rate in your crypto journey? Share your thoughts below! 👇
⚠️ Educational Masterclass Disclaimer:
This content is for educational purposes only and does not constitute financial advice (NFA). Cryptocurrency markets carry inherent volatility. Always manage risk prudently and conduct your own research (DYOR).
$BTC $ETH SOL #BinanceSquare #CryptoTrading TechnicalAnalysis
🚨 THE SCALPER'S PLAYBOOK: 8 HIGH-WIN-RATE CANDLESTICK PATTERNS 👇
🚨 THE SCALPER'S PLAYBOOK: 8 HIGH-WIN-RATE CANDLESTICK PATTERNS 👇
Understand price action at an institutional level. Here is your definitive masterclass on the most reliable candlestick formations every $BTC $ETH SOL trader must master.
1 📈 Upside Tasuki Gap 📈
• Anatomy: Green candle gaps above prior green, followed by small red candle opening inside body.
• Psychology: Gap-up remains unfilled, confirming buyer appetite remains ferocious.
• Confirmation: Price breaking above the high of the gap-up candle.
2 🧲 Tweezer Bottom 🧲
• Anatomy: Red and green candles hitting the exact same low price level before bouncing.
• Psychology: Firm institutional support floor that rejects further seller probes twice.
• Confirmation: A close above the high of the formation.
3 🐉 Dragonfly Doji 🐉
• Anatomy: T-shaped candle with open, high, and close at the top and long lower shadow.
• Psychology: Sellers pushed price to deep lows, but buyers aggressively bought back up to the open.
• Confirmation: Price movement above the high of the wick.
4 ⚖️ Doji Cross ⚖️
• Anatomy: Identical open and close price creating a cross shape.
• Psychology: Total equilibrium between buyers and sellers; prepares the stage for violent expansion.
• Confirmation: Breakout in the direction of the subsequent momentum candle.
5 ⚡ Bullish Three Line Strike ⚡
• Anatomy: Three falling red candles erased completely by one massive green candle.
• Psychology: Prolonged seller pressure engulfed in a single violent short-covering spike.
• Confirmation: High volume on the engulfing green candle.
6 🔋 Bullish Marubozu 🔋
• Anatomy: Full solid green candle body with virtually no shadows.
• Psychology: Unconditional aggressive buyer dominance from open to close.
• Confirmation: Immediate momentum follow-through on lower timeframes.
7 🌙 Evening Star 🌙
• Anatomy: Tall green candle, small hesitation star at top, then a steep red plunge.
• Psychology: Buyer exhaustion at peak valuation followed by sudden take-profit orders.
• Confirmation: Close below the midpoint of the initial green candle.
8 🐂 Bullish Engulfing 🐂
• Anatomy: Small red candle completely engulfed by a large green candle body.
• Psychology: Bears tried pushing lower, but ferocious dip buyers took complete control.
• Confirmation: Sustained price action above the high of the engulfing candle.
💡 Why Master These Candlestick Formations?
• Spot high-probability reversals and continuation phases before the retail crowd.
• Define exact risk-to-reward boundaries with clear invalidation levels.
• Combine with volume confirmation and dynamic moving averages (EMA 20/50).
💬 Community Masterclass Discussion:
Which of these 8 candlestick setups has yielded the highest win-rate in your crypto journey? Share your thoughts below! 👇
⚠️ Educational Masterclass Disclaimer:
This content is for educational purposes only and does not constitute financial advice (NFA). Cryptocurrency markets carry inherent volatility. Always manage risk prudently and conduct your own research (DYOR).
$BTC $ETH SOL #BinanceSquare #CryptoTrading TechnicalAnalysis
Understand price action at an institutional level. Here is your definitive masterclass on the most reliable candlestick formations every $BTC $ETH SOL trader must master.
1 📈 Upside Tasuki Gap 📈
• Anatomy: Green candle gaps above prior green, followed by small red candle opening inside body.
• Psychology: Gap-up remains unfilled, confirming buyer appetite remains ferocious.
• Confirmation: Price breaking above the high of the gap-up candle.
2 🧲 Tweezer Bottom 🧲
• Anatomy: Red and green candles hitting the exact same low price level before bouncing.
• Psychology: Firm institutional support floor that rejects further seller probes twice.
• Confirmation: A close above the high of the formation.
3 🐉 Dragonfly Doji 🐉
• Anatomy: T-shaped candle with open, high, and close at the top and long lower shadow.
• Psychology: Sellers pushed price to deep lows, but buyers aggressively bought back up to the open.
• Confirmation: Price movement above the high of the wick.
4 ⚖️ Doji Cross ⚖️
• Anatomy: Identical open and close price creating a cross shape.
• Psychology: Total equilibrium between buyers and sellers; prepares the stage for violent expansion.
• Confirmation: Breakout in the direction of the subsequent momentum candle.
5 ⚡ Bullish Three Line Strike ⚡
• Anatomy: Three falling red candles erased completely by one massive green candle.
• Psychology: Prolonged seller pressure engulfed in a single violent short-covering spike.
• Confirmation: High volume on the engulfing green candle.
6 🔋 Bullish Marubozu 🔋
• Anatomy: Full solid green candle body with virtually no shadows.
• Psychology: Unconditional aggressive buyer dominance from open to close.
• Confirmation: Immediate momentum follow-through on lower timeframes.
7 🌙 Evening Star 🌙
• Anatomy: Tall green candle, small hesitation star at top, then a steep red plunge.
• Psychology: Buyer exhaustion at peak valuation followed by sudden take-profit orders.
• Confirmation: Close below the midpoint of the initial green candle.
8 🐂 Bullish Engulfing 🐂
• Anatomy: Small red candle completely engulfed by a large green candle body.
• Psychology: Bears tried pushing lower, but ferocious dip buyers took complete control.
• Confirmation: Sustained price action above the high of the engulfing candle.
💡 Why Master These Candlestick Formations?
• Spot high-probability reversals and continuation phases before the retail crowd.
• Define exact risk-to-reward boundaries with clear invalidation levels.
• Combine with volume confirmation and dynamic moving averages (EMA 20/50).
💬 Community Masterclass Discussion:
Which of these 8 candlestick setups has yielded the highest win-rate in your crypto journey? Share your thoughts below! 👇
⚠️ Educational Masterclass Disclaimer:
This content is for educational purposes only and does not constitute financial advice (NFA). Cryptocurrency markets carry inherent volatility. Always manage risk prudently and conduct your own research (DYOR).
$BTC $ETH SOL #BinanceSquare #CryptoTrading TechnicalAnalysis
32
·
--
🔥 $DOGE Technical Update: Key Levels & Momentum Breakdown
📊 1. Market Snapshot
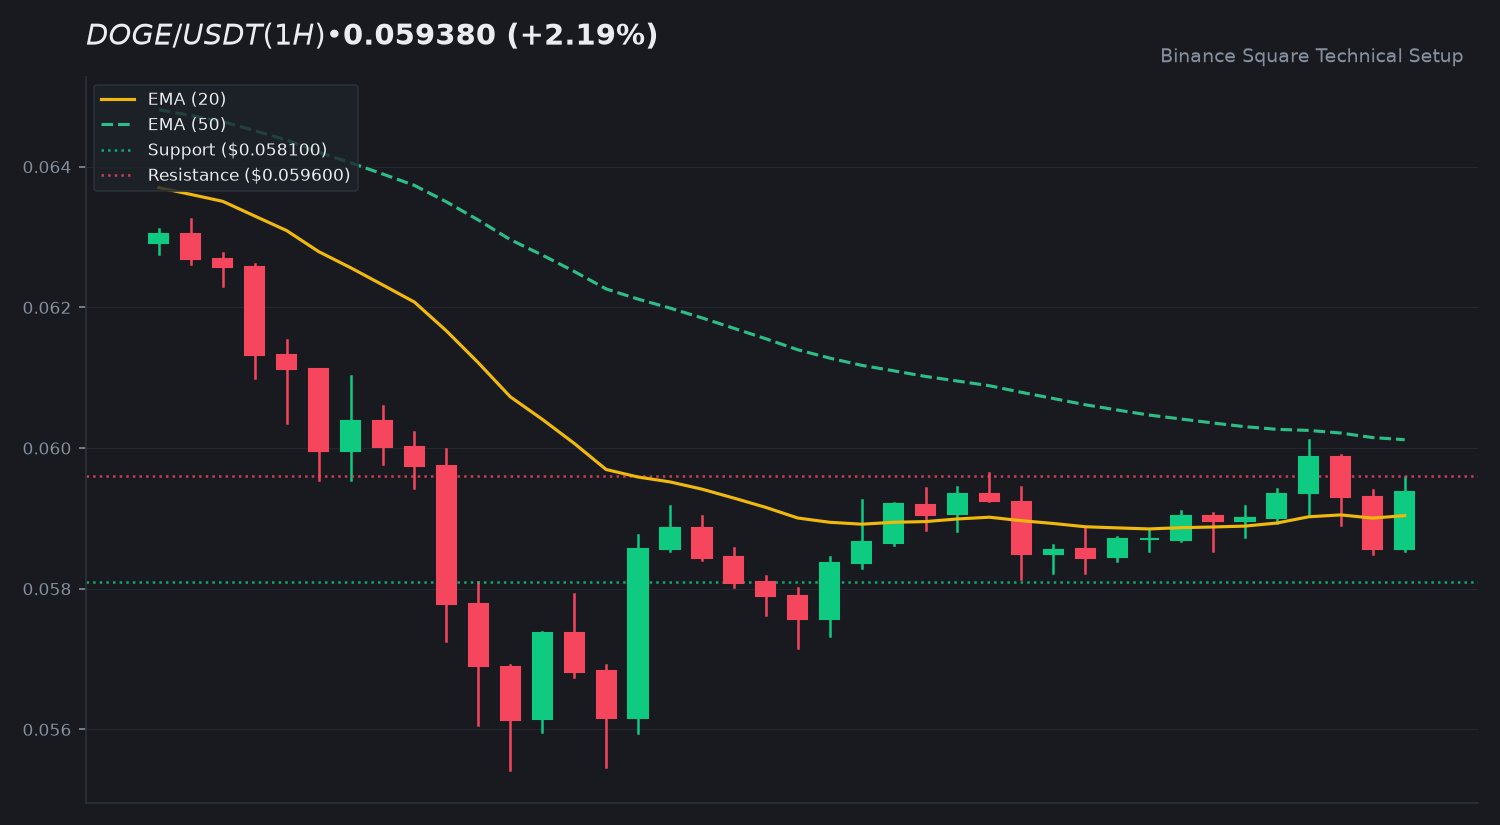
The current price of $DOGE is trading at $0.0594, reflecting a 24h change of +2.19%. Market activity is characterized by a 24h quote volume of $45,777,779 USDT. Current volume remains low, sitting at roughly 0.35x of the 20-SMA, suggesting a period of consolidation with relatively weak conviction from market participants.
📈 2. Technical Momentum & Indicator Bias
Price action is currently testing the EMA 20 at $0.0590, while the EMA 50 sits slightly above at $0.0601. The RSI at 51.71 indicates a neutral momentum state, showing neither overbought nor oversold conditions. The MACD histogram is positive at +0.0002, with the MACD line crossing slightly above the signal line, suggesting a minor shift toward bullish recovery attempts.
🎯 3. Key Technical Levels to Watch
• 🟢 Resistance Zone: Initial resistance is located at $0.0596, with a secondary extension target near $0.0666.
• 🔴 Support Zone: Immediate support holds at $0.0581, followed by the daily low at $0.0572.
• 🛡️ Pivot Confluence: The $0.0601 level remains the primary pivot to monitor for a potential trend reversal.
💡 4. Technical Takeaway & Risk Management
The asset is attempting a recovery phase. Traders are observing whether the price can sustain a close above the EMA 20. A failure to clear the $0.0601 EMA 50 resistance could lead to continued range-bound behavior. Monitoring volume expansion alongside these levels is essential for gauging the strength of the current movement.
💬 5. Community Discussion
What is your technical outlook for $DOGE this week? Are you accumulating or waiting for confirmation? Drop your thoughts below! 👇
⚠️ 6. Disclaimer
Educational technical analysis only. Not financial advice (NFA). Crypto markets involve risk. Always DYOR.
$DOGE #DOGE #BinanceSquare
🔥 $DOGE Technical Update: Key Levels & Momentum Breakdown
📊 1. Market Snapshot
The current price of $DOGE is trading at $0.0594, reflecting a 24h change of +2.19%. Market activity is characterized by a 24h quote volume of $45,777,779 USDT. Current volume remains low, sitting at roughly 0.35x of the 20-SMA, suggesting a period of consolidation with relatively weak conviction from market participants.
📈 2. Technical Momentum & Indicator Bias
Price action is currently testing the EMA 20 at $0.0590, while the EMA 50 sits slightly above at $0.0601. The RSI at 51.71 indicates a neutral momentum state, showing neither overbought nor oversold conditions. The MACD histogram is positive at +0.0002, with the MACD line crossing slightly above the signal line, suggesting a minor shift toward bullish recovery attempts.
🎯 3. Key Technical Levels to Watch
• 🟢 Resistance Zone: Initial resistance is located at $0.0596, with a secondary extension target near $0.0666.
• 🔴 Support Zone: Immediate support holds at $0.0581, followed by the daily low at $0.0572.
• 🛡️ Pivot Confluence: The $0.0601 level remains the primary pivot to monitor for a potential trend reversal.
💡 4. Technical Takeaway & Risk Management
The asset is attempting a recovery phase. Traders are observing whether the price can sustain a close above the EMA 20. A failure to clear the $0.0601 EMA 50 resistance could lead to continued range-bound behavior. Monitoring volume expansion alongside these levels is essential for gauging the strength of the current movement.
💬 5. Community Discussion
What is your technical outlook for $DOGE this week? Are you accumulating or waiting for confirmation? Drop your thoughts below! 👇
⚠️ 6. Disclaimer
Educational technical analysis only. Not financial advice (NFA). Crypto markets involve risk. Always DYOR.
$DOGE #DOGE #BinanceSquare
📊 1. Market Snapshot
The current price of $DOGE is trading at $0.0594, reflecting a 24h change of +2.19%. Market activity is characterized by a 24h quote volume of $45,777,779 USDT. Current volume remains low, sitting at roughly 0.35x of the 20-SMA, suggesting a period of consolidation with relatively weak conviction from market participants.
📈 2. Technical Momentum & Indicator Bias
Price action is currently testing the EMA 20 at $0.0590, while the EMA 50 sits slightly above at $0.0601. The RSI at 51.71 indicates a neutral momentum state, showing neither overbought nor oversold conditions. The MACD histogram is positive at +0.0002, with the MACD line crossing slightly above the signal line, suggesting a minor shift toward bullish recovery attempts.
🎯 3. Key Technical Levels to Watch
• 🟢 Resistance Zone: Initial resistance is located at $0.0596, with a secondary extension target near $0.0666.
• 🔴 Support Zone: Immediate support holds at $0.0581, followed by the daily low at $0.0572.
• 🛡️ Pivot Confluence: The $0.0601 level remains the primary pivot to monitor for a potential trend reversal.
💡 4. Technical Takeaway & Risk Management
The asset is attempting a recovery phase. Traders are observing whether the price can sustain a close above the EMA 20. A failure to clear the $0.0601 EMA 50 resistance could lead to continued range-bound behavior. Monitoring volume expansion alongside these levels is essential for gauging the strength of the current movement.
💬 5. Community Discussion
What is your technical outlook for $DOGE this week? Are you accumulating or waiting for confirmation? Drop your thoughts below! 👇
⚠️ 6. Disclaimer
Educational technical analysis only. Not financial advice (NFA). Crypto markets involve risk. Always DYOR.
$DOGE #DOGE #BinanceSquare
68
·
--
🔥 $ASTER Technical Update: Key Levels & Momentum Breakdown
📊 1. Market Snapshot
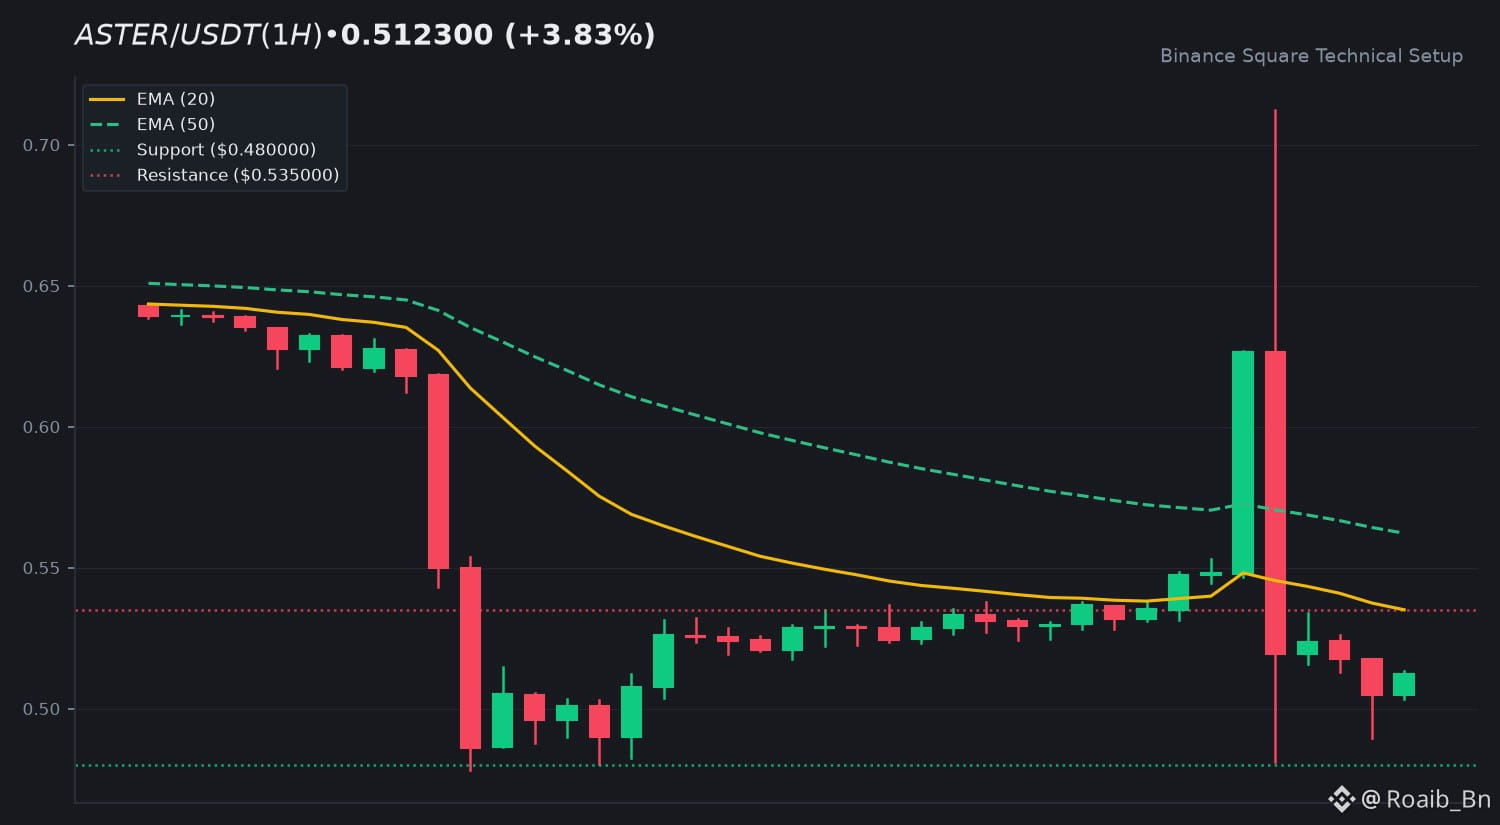
$ASTER is currently trading at $0.5123, reflecting a 24h increase of 3.83%. Trading activity remains relatively subdued, with a 24h quote volume of $53,481,642 USDT. The current volume ratio to the 20-SMA sits at 0.19x, indicating low conviction and a consolidation phase following recent volatility.
📈 2. Technical Momentum & Indicator Bias
The asset remains in a broader downtrend, confirmed by the EMA 20 at $0.5351 and the EMA 50 at $0.5622. Price action is currently situated below these dynamic resistance levels. The RSI at 43.05 suggests a neutral momentum state, lacking strong bullish or bearish dominance. The MACD histogram at -0.0006, combined with the MACD line positioned below the signal line, reflects a lack of immediate upward momentum.
🎯 3. Key Technical Levels to Watch
• 🟢 Resistance Zone: $0.5350 serves as the immediate hurdle, followed by a secondary resistance level at $0.6443.
• 🔴 Support Zone: The primary support floor is established at $0.4800, which aligns with recent lows.
• 🛡️ Pivot Confluence: The $0.5350 level is the critical pivot to monitor for a potential shift in short-term trend bias.
💡 4. Technical Takeaway & Risk Management
$ASTER is currently navigating a period of low-volume consolidation. Traders typically monitor the interaction between price action and the EMA 20/50 levels to identify potential reversals or trend continuations. A sustained move above the EMA 20 would be necessary to alter the current bearish technical posture.
💬 5. Community Discussion
What is your technical outlook for $ASTER this week? Are you accumulating or waiting for confirmation? Drop your thoughts below! 👇
⚠️ 6. Disclaimer
Educational technical analysis only. Not financial advice (NFA). Crypto markets involve risk. Always DYOR.
$ASTER #ASTER #BinanceSquare
🔥 $ASTER Technical Update: Key Levels & Momentum Breakdown
📊 1. Market Snapshot
$ASTER is currently trading at $0.5123, reflecting a 24h increase of 3.83%. Trading activity remains relatively subdued, with a 24h quote volume of $53,481,642 USDT. The current volume ratio to the 20-SMA sits at 0.19x, indicating low conviction and a consolidation phase following recent volatility.
📈 2. Technical Momentum & Indicator Bias
The asset remains in a broader downtrend, confirmed by the EMA 20 at $0.5351 and the EMA 50 at $0.5622. Price action is currently situated below these dynamic resistance levels. The RSI at 43.05 suggests a neutral momentum state, lacking strong bullish or bearish dominance. The MACD histogram at -0.0006, combined with the MACD line positioned below the signal line, reflects a lack of immediate upward momentum.
🎯 3. Key Technical Levels to Watch
• 🟢 Resistance Zone: $0.5350 serves as the immediate hurdle, followed by a secondary resistance level at $0.6443.
• 🔴 Support Zone: The primary support floor is established at $0.4800, which aligns with recent lows.
• 🛡️ Pivot Confluence: The $0.5350 level is the critical pivot to monitor for a potential shift in short-term trend bias.
💡 4. Technical Takeaway & Risk Management
$ASTER is currently navigating a period of low-volume consolidation. Traders typically monitor the interaction between price action and the EMA 20/50 levels to identify potential reversals or trend continuations. A sustained move above the EMA 20 would be necessary to alter the current bearish technical posture.
💬 5. Community Discussion
What is your technical outlook for $ASTER this week? Are you accumulating or waiting for confirmation? Drop your thoughts below! 👇
⚠️ 6. Disclaimer
Educational technical analysis only. Not financial advice (NFA). Crypto markets involve risk. Always DYOR.
$ASTER #ASTER #BinanceSquare
📊 1. Market Snapshot
$ASTER is currently trading at $0.5123, reflecting a 24h increase of 3.83%. Trading activity remains relatively subdued, with a 24h quote volume of $53,481,642 USDT. The current volume ratio to the 20-SMA sits at 0.19x, indicating low conviction and a consolidation phase following recent volatility.
📈 2. Technical Momentum & Indicator Bias
The asset remains in a broader downtrend, confirmed by the EMA 20 at $0.5351 and the EMA 50 at $0.5622. Price action is currently situated below these dynamic resistance levels. The RSI at 43.05 suggests a neutral momentum state, lacking strong bullish or bearish dominance. The MACD histogram at -0.0006, combined with the MACD line positioned below the signal line, reflects a lack of immediate upward momentum.
🎯 3. Key Technical Levels to Watch
• 🟢 Resistance Zone: $0.5350 serves as the immediate hurdle, followed by a secondary resistance level at $0.6443.
• 🔴 Support Zone: The primary support floor is established at $0.4800, which aligns with recent lows.
• 🛡️ Pivot Confluence: The $0.5350 level is the critical pivot to monitor for a potential shift in short-term trend bias.
💡 4. Technical Takeaway & Risk Management
$ASTER is currently navigating a period of low-volume consolidation. Traders typically monitor the interaction between price action and the EMA 20/50 levels to identify potential reversals or trend continuations. A sustained move above the EMA 20 would be necessary to alter the current bearish technical posture.
💬 5. Community Discussion
What is your technical outlook for $ASTER this week? Are you accumulating or waiting for confirmation? Drop your thoughts below! 👇
⚠️ 6. Disclaimer
Educational technical analysis only. Not financial advice (NFA). Crypto markets involve risk. Always DYOR.
$ASTER #ASTER #BinanceSquare
80
·
--
ບົດຄວາມ
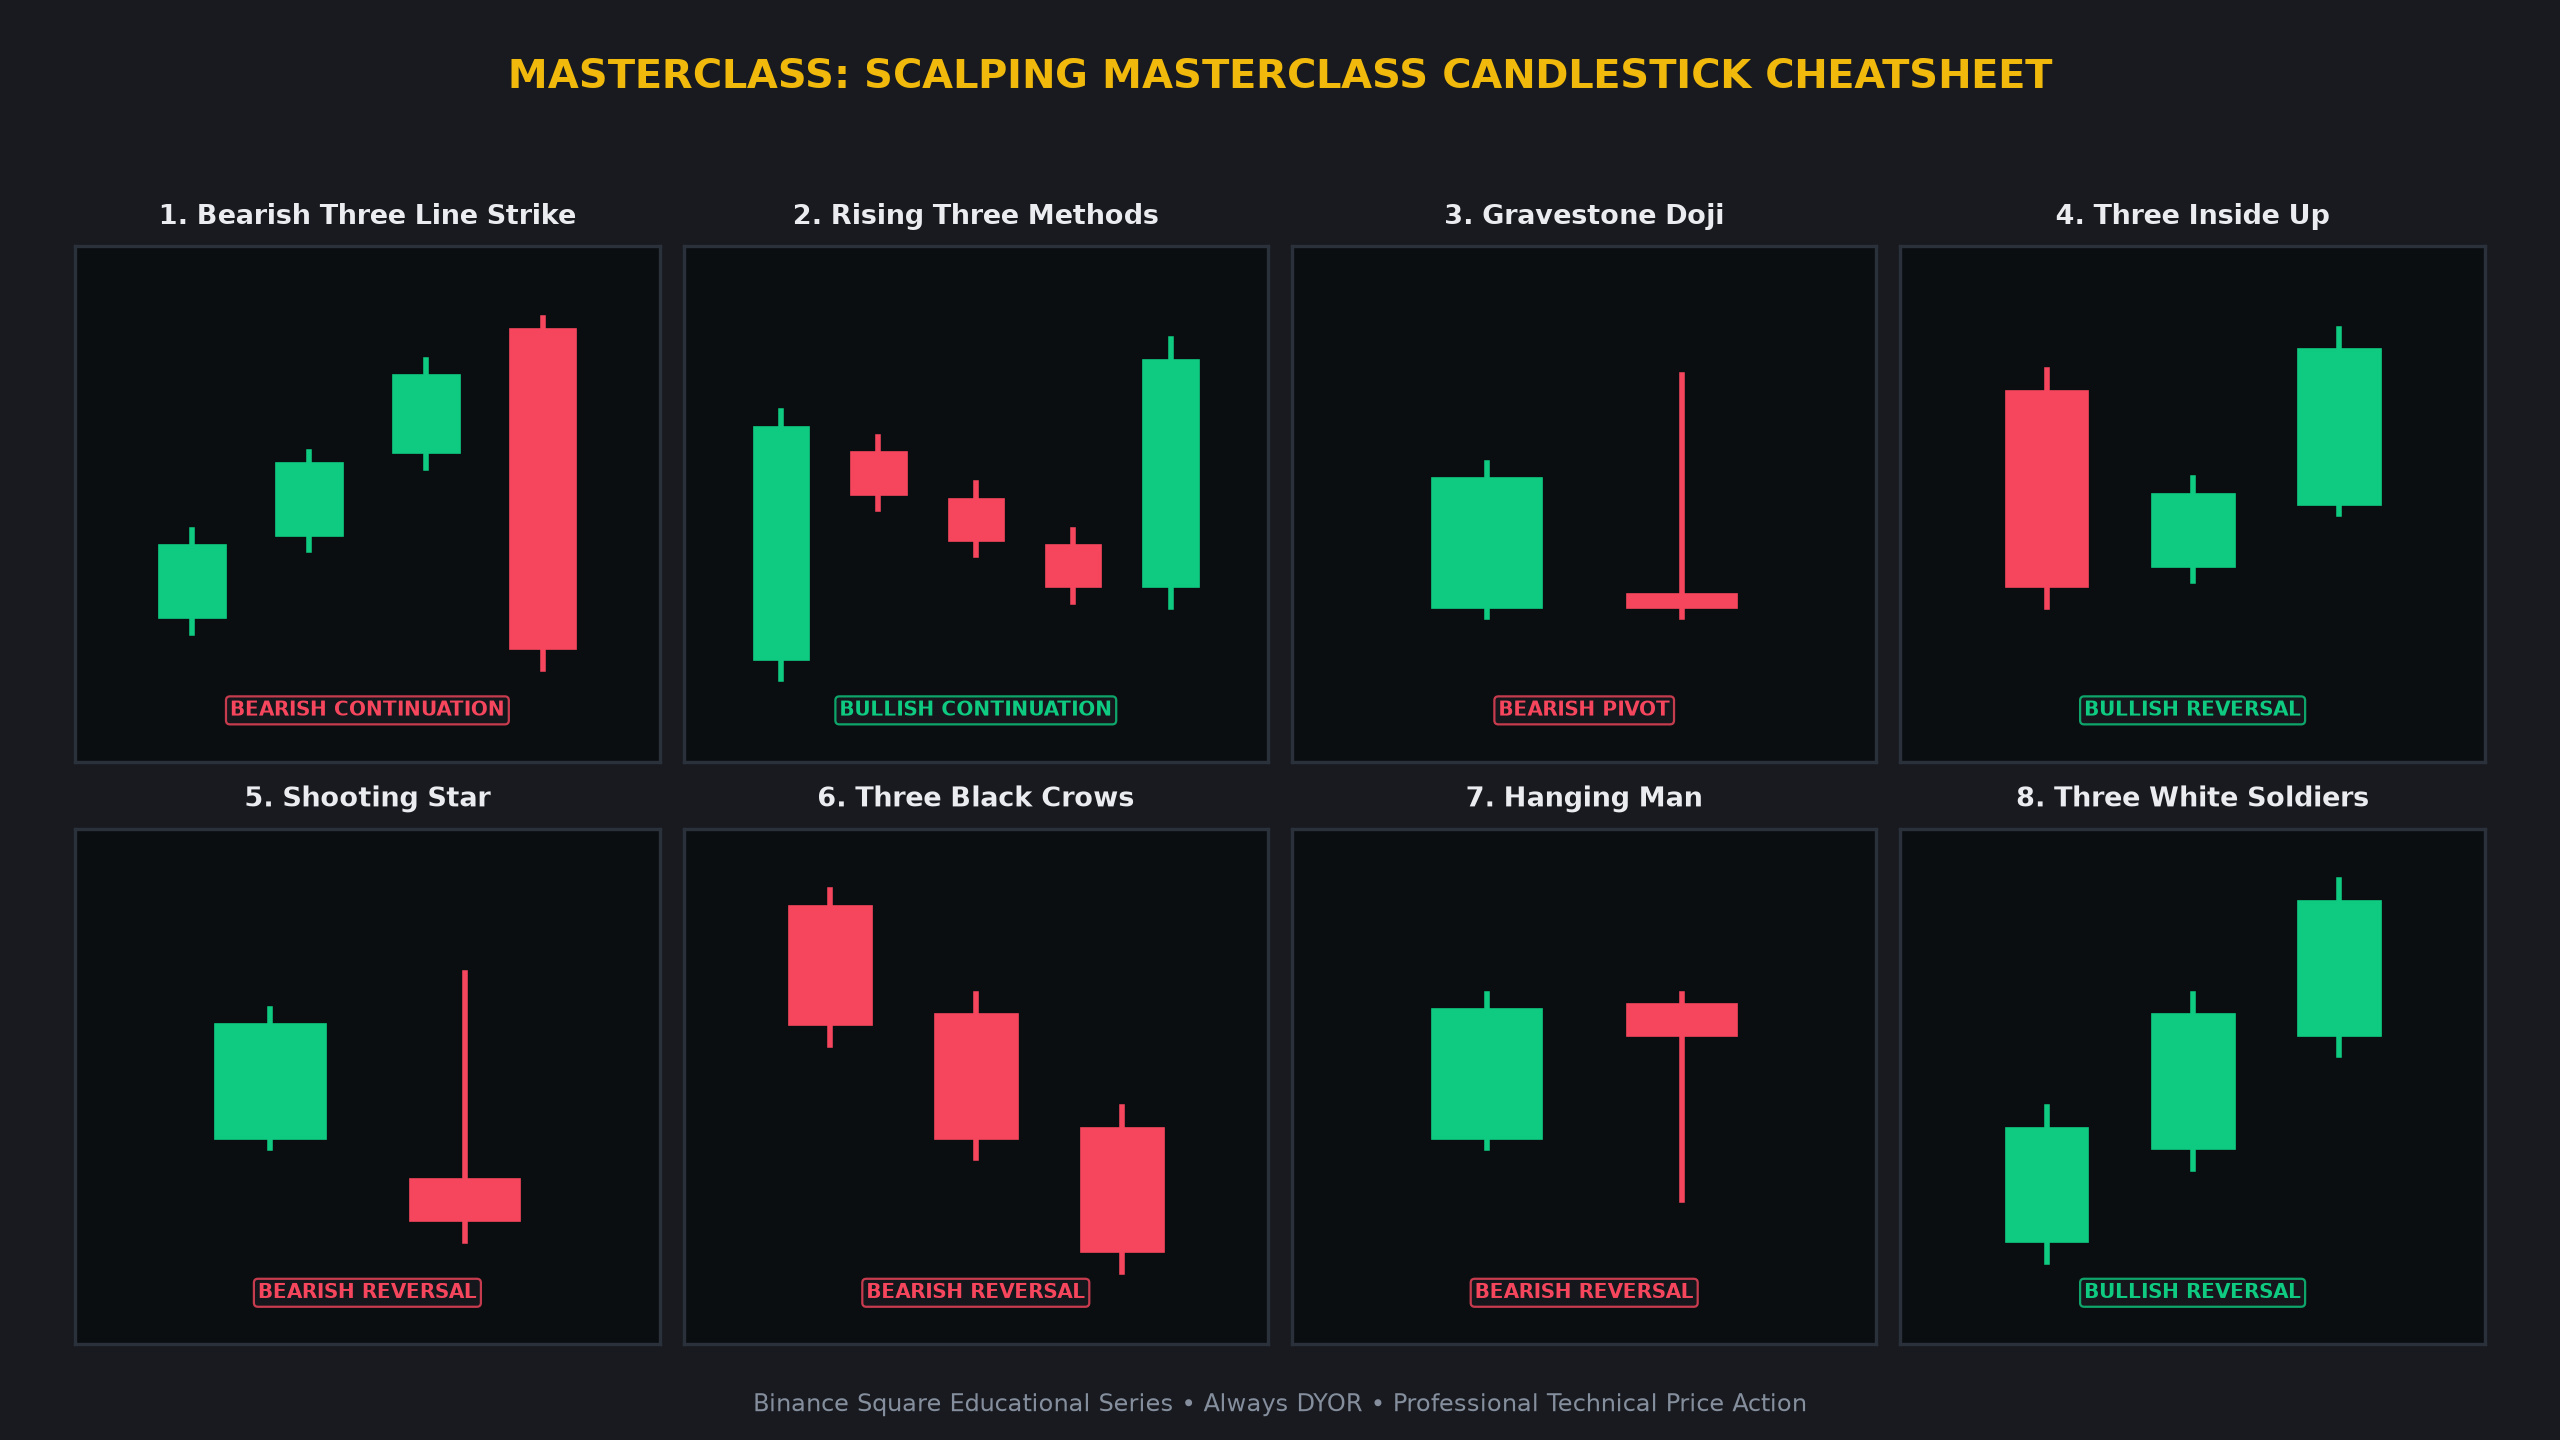
🚨 THE SCALPER'S PLAYBOOK: 8 HIGH-WIN-RATE CANDLESTICK PATTERNS 👇🚨 THE SCALPER'S PLAYBOOK: 8 HIGH-WIN-RATE CANDLESTICK PATTERNS 👇
Understand price action at an institutional level. Here is your definitive masterclass on the most reliable candlestick formations every crypto trader must master to navigate $BTC and altcoin volatility.
1 ⛈️ Bearish Three Line Strike ⛈️
• Candlestick Anatomy: Three consecutive rising green candles are wiped out entirely by one massive red engulfing candle.
• Market Psychology: Gradual retail buying momentum is suddenly obliterated by institutional block selling.
• High-Confidence Confirmation: Look for a close below the low of the first green candle in the sequence to confirm bearish bias.
2 🚀 Rising Three Methods 🚀
• Candlestick Anatomy: A tall green candle followed by three small falling red pullback candles, then a strong green surge.
• Market Psychology: Healthy minor consolidation is absorbed quietly by buyers before the primary trend resumes.
• High-Confidence Confirmation: A breakout and close above the high of the first tall green candle.
3 🪦 Gravestone Doji 🪦
• Candlestick Anatomy: Inverted T-shaped candle with the open, low, and close at the bottom and a very long upper shadow.
• Market Psychology: Bulls staged an aggressive rally that was completely rejected by sellers by the end of the period.
• High-Confidence Confirmation: Often signals a potential bearish pivot when appearing at key resistance zones.
4 💹 Three Inside Up 💹
• Candlestick Anatomy: A large red candle, a small green candle contained within its range, and a third green candle closing above the first.
• Market Psychology: A Harami pause resolved to the upside with a decisive structural break.
• High-Confidence Confirmation: Validation occurs when the third candle closes firmly above the high of the first red candle.
5 🌠 Shooting Star 🌠
• Candlestick Anatomy: A small body at the bottom with a long upper wick testing overhead resistance levels.
• Market Psychology: Bulls drove the price up but encountered a massive sell wall and became trapped.
• High-Confidence Confirmation: Look for bearish follow-through on the next candle to confirm the rejection.
6 🦅 Three Black Crows 🦅
• Candlestick Anatomy: Three consecutive tall red candles stepping downward after a sustained uptrend.
• Market Psychology: Heavy, aggressive distribution by smart money forcing buyers to surrender their positions.
• High-Confidence Confirmation: High-volume confirmation on these candles suggests strong bearish momentum.
7 ⚠️ Hanging Man ⚠️
• Candlestick Anatomy: A small body at the top with a long lower shadow appearing at the peak of an uptrend.
• Market Psychology: This is the first sign of sharp intraday liquidation and a warning that trend momentum is fragile.
• High-Confidence Confirmation: A bearish close on the following candle confirms the shift in sentiment.
8 🪖 Three White Soldiers 🪖
• Candlestick Anatomy: Three consecutive tall green candles stepping upward after a prolonged downtrend.
• Market Psychology: Steady, decisive accumulation by aggressive buyers overwhelming the remaining sellers.
• High-Confidence Confirmation: Watch for increasing volume across the three candles to validate the reversal.
💡 Why Master These Candlestick Formations?
• Spot high-probability reversals and continuation phases before the retail crowd reacts.
• Define exact risk-to-reward boundaries with clear structural invalidation levels.
• Combine
🚨 THE SCALPER'S PLAYBOOK: 8 HIGH-WIN-RATE CANDLESTICK PATTERNS 👇
🚨 THE SCALPER'S PLAYBOOK: 8 HIGH-WIN-RATE CANDLESTICK PATTERNS 👇
Understand price action at an institutional level. Here is your definitive masterclass on the most reliable candlestick formations every crypto trader must master to navigate $BTC and altcoin volatility.
1 ⛈️ Bearish Three Line Strike ⛈️
• Candlestick Anatomy: Three consecutive rising green candles are wiped out entirely by one massive red engulfing candle.
• Market Psychology: Gradual retail buying momentum is suddenly obliterated by institutional block selling.
• High-Confidence Confirmation: Look for a close below the low of the first green candle in the sequence to confirm bearish bias.
2 🚀 Rising Three Methods 🚀
• Candlestick Anatomy: A tall green candle followed by three small falling red pullback candles, then a strong green surge.
• Market Psychology: Healthy minor consolidation is absorbed quietly by buyers before the primary trend resumes.
• High-Confidence Confirmation: A breakout and close above the high of the first tall green candle.
3 🪦 Gravestone Doji 🪦
• Candlestick Anatomy: Inverted T-shaped candle with the open, low, and close at the bottom and a very long upper shadow.
• Market Psychology: Bulls staged an aggressive rally that was completely rejected by sellers by the end of the period.
• High-Confidence Confirmation: Often signals a potential bearish pivot when appearing at key resistance zones.
4 💹 Three Inside Up 💹
• Candlestick Anatomy: A large red candle, a small green candle contained within its range, and a third green candle closing above the first.
• Market Psychology: A Harami pause resolved to the upside with a decisive structural break.
• High-Confidence Confirmation: Validation occurs when the third candle closes firmly above the high of the first red candle.
5 🌠 Shooting Star 🌠
• Candlestick Anatomy: A small body at the bottom with a long upper wick testing overhead resistance levels.
• Market Psychology: Bulls drove the price up but encountered a massive sell wall and became trapped.
• High-Confidence Confirmation: Look for bearish follow-through on the next candle to confirm the rejection.
6 🦅 Three Black Crows 🦅
• Candlestick Anatomy: Three consecutive tall red candles stepping downward after a sustained uptrend.
• Market Psychology: Heavy, aggressive distribution by smart money forcing buyers to surrender their positions.
• High-Confidence Confirmation: High-volume confirmation on these candles suggests strong bearish momentum.
7 ⚠️ Hanging Man ⚠️
• Candlestick Anatomy: A small body at the top with a long lower shadow appearing at the peak of an uptrend.
• Market Psychology: This is the first sign of sharp intraday liquidation and a warning that trend momentum is fragile.
• High-Confidence Confirmation: A bearish close on the following candle confirms the shift in sentiment.
8 🪖 Three White Soldiers 🪖
• Candlestick Anatomy: Three consecutive tall green candles stepping upward after a prolonged downtrend.
• Market Psychology: Steady, decisive accumulation by aggressive buyers overwhelming the remaining sellers.
• High-Confidence Confirmation: Watch for increasing volume across the three candles to validate the reversal.
💡 Why Master These Candlestick Formations?
• Spot high-probability reversals and continuation phases before the retail crowd reacts.
• Define exact risk-to-reward boundaries with clear structural invalidation levels.
• Combine
Understand price action at an institutional level. Here is your definitive masterclass on the most reliable candlestick formations every crypto trader must master to navigate $BTC and altcoin volatility.
1 ⛈️ Bearish Three Line Strike ⛈️
• Candlestick Anatomy: Three consecutive rising green candles are wiped out entirely by one massive red engulfing candle.
• Market Psychology: Gradual retail buying momentum is suddenly obliterated by institutional block selling.
• High-Confidence Confirmation: Look for a close below the low of the first green candle in the sequence to confirm bearish bias.
2 🚀 Rising Three Methods 🚀
• Candlestick Anatomy: A tall green candle followed by three small falling red pullback candles, then a strong green surge.
• Market Psychology: Healthy minor consolidation is absorbed quietly by buyers before the primary trend resumes.
• High-Confidence Confirmation: A breakout and close above the high of the first tall green candle.
3 🪦 Gravestone Doji 🪦
• Candlestick Anatomy: Inverted T-shaped candle with the open, low, and close at the bottom and a very long upper shadow.
• Market Psychology: Bulls staged an aggressive rally that was completely rejected by sellers by the end of the period.
• High-Confidence Confirmation: Often signals a potential bearish pivot when appearing at key resistance zones.
4 💹 Three Inside Up 💹
• Candlestick Anatomy: A large red candle, a small green candle contained within its range, and a third green candle closing above the first.
• Market Psychology: A Harami pause resolved to the upside with a decisive structural break.
• High-Confidence Confirmation: Validation occurs when the third candle closes firmly above the high of the first red candle.
5 🌠 Shooting Star 🌠
• Candlestick Anatomy: A small body at the bottom with a long upper wick testing overhead resistance levels.
• Market Psychology: Bulls drove the price up but encountered a massive sell wall and became trapped.
• High-Confidence Confirmation: Look for bearish follow-through on the next candle to confirm the rejection.
6 🦅 Three Black Crows 🦅
• Candlestick Anatomy: Three consecutive tall red candles stepping downward after a sustained uptrend.
• Market Psychology: Heavy, aggressive distribution by smart money forcing buyers to surrender their positions.
• High-Confidence Confirmation: High-volume confirmation on these candles suggests strong bearish momentum.
7 ⚠️ Hanging Man ⚠️
• Candlestick Anatomy: A small body at the top with a long lower shadow appearing at the peak of an uptrend.
• Market Psychology: This is the first sign of sharp intraday liquidation and a warning that trend momentum is fragile.
• High-Confidence Confirmation: A bearish close on the following candle confirms the shift in sentiment.
8 🪖 Three White Soldiers 🪖
• Candlestick Anatomy: Three consecutive tall green candles stepping upward after a prolonged downtrend.
• Market Psychology: Steady, decisive accumulation by aggressive buyers overwhelming the remaining sellers.
• High-Confidence Confirmation: Watch for increasing volume across the three candles to validate the reversal.
💡 Why Master These Candlestick Formations?
• Spot high-probability reversals and continuation phases before the retail crowd reacts.
• Define exact risk-to-reward boundaries with clear structural invalidation levels.
• Combine
87
·
--
🔥 $NEAR Technical Update: Key Levels & Momentum Breakdown
📊 1. Market Snapshot
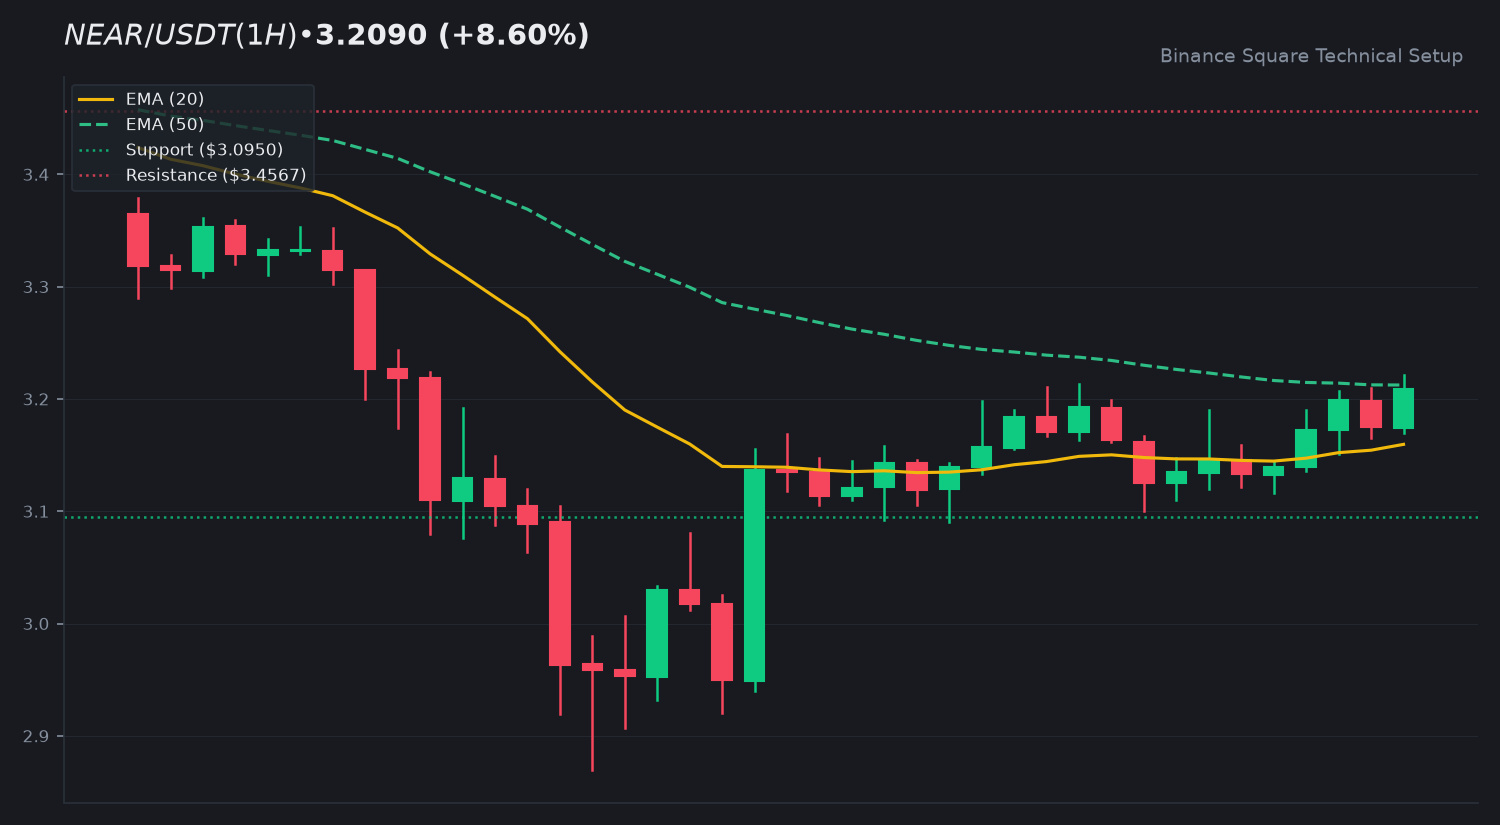
$NEAR is currently trading at 3.2090 USDT, reflecting a 24h gain of 8.60 percent. The asset has maintained a daily range between 2.9200 and 3.2210. Current quote volume stands at 68,664,935 USDT, indicating a low volume environment with a ratio to the 20-SMA of 0.43x, suggesting consolidation rather than aggressive accumulation.
📈 2. Technical Momentum & Indicator Bias
The price is currently positioned above the EMA 20 at 3.1596 but remains just below the EMA 50 at 3.2124. This proximity suggests a transitional phase in the trend. The RSI at 56.02 indicates neutral momentum, neither overbought nor oversold. The MACD histogram is positive at 0.0131, with the MACD line crossing above the signal line, hinting at a potential shift in momentum if volume increases.
🎯 3. Key Technical Levels to Watch
• 🟢 Resistance Zone: 3.4567 followed by 3.5605.
• 🔴 Support Zone: 3.0950 followed by 2.8700.
• 🛡️ Pivot Confluence: 3.2124 (EMA 50) acts as the immediate hurdle.
💡 4. Technical Takeaway & Risk Management
The current price action reflects a recovery attempt. Traders are monitoring the interaction between price and the EMA 50 for signs of sustained trend reversal. Given the low volume conviction, observing how the asset handles the 3.2124 level is essential for determining if the current bullish bias holds.
💬 5. Community Discussion
What is your technical outlook for $NEAR this week? Are you observing the EMA clusters or waiting for a higher volume confirmation? Drop your thoughts below! 👇
⚠️ 6. Disclaimer
Educational technical analysis only. Not financial advice (NFA). Crypto markets involve risk. Always DYOR.
$NEAR #NEAR #BinanceSquare
🔥 $NEAR Technical Update: Key Levels & Momentum Breakdown
📊 1. Market Snapshot
$NEAR is currently trading at 3.2090 USDT, reflecting a 24h gain of 8.60 percent. The asset has maintained a daily range between 2.9200 and 3.2210. Current quote volume stands at 68,664,935 USDT, indicating a low volume environment with a ratio to the 20-SMA of 0.43x, suggesting consolidation rather than aggressive accumulation.
📈 2. Technical Momentum & Indicator Bias
The price is currently positioned above the EMA 20 at 3.1596 but remains just below the EMA 50 at 3.2124. This proximity suggests a transitional phase in the trend. The RSI at 56.02 indicates neutral momentum, neither overbought nor oversold. The MACD histogram is positive at 0.0131, with the MACD line crossing above the signal line, hinting at a potential shift in momentum if volume increases.
🎯 3. Key Technical Levels to Watch
• 🟢 Resistance Zone: 3.4567 followed by 3.5605.
• 🔴 Support Zone: 3.0950 followed by 2.8700.
• 🛡️ Pivot Confluence: 3.2124 (EMA 50) acts as the immediate hurdle.
💡 4. Technical Takeaway & Risk Management
The current price action reflects a recovery attempt. Traders are monitoring the interaction between price and the EMA 50 for signs of sustained trend reversal. Given the low volume conviction, observing how the asset handles the 3.2124 level is essential for determining if the current bullish bias holds.
💬 5. Community Discussion
What is your technical outlook for $NEAR this week? Are you observing the EMA clusters or waiting for a higher volume confirmation? Drop your thoughts below! 👇
⚠️ 6. Disclaimer
Educational technical analysis only. Not financial advice (NFA). Crypto markets involve risk. Always DYOR.
$NEAR #NEAR #BinanceSquare
📊 1. Market Snapshot
$NEAR is currently trading at 3.2090 USDT, reflecting a 24h gain of 8.60 percent. The asset has maintained a daily range between 2.9200 and 3.2210. Current quote volume stands at 68,664,935 USDT, indicating a low volume environment with a ratio to the 20-SMA of 0.43x, suggesting consolidation rather than aggressive accumulation.
📈 2. Technical Momentum & Indicator Bias
The price is currently positioned above the EMA 20 at 3.1596 but remains just below the EMA 50 at 3.2124. This proximity suggests a transitional phase in the trend. The RSI at 56.02 indicates neutral momentum, neither overbought nor oversold. The MACD histogram is positive at 0.0131, with the MACD line crossing above the signal line, hinting at a potential shift in momentum if volume increases.
🎯 3. Key Technical Levels to Watch
• 🟢 Resistance Zone: 3.4567 followed by 3.5605.
• 🔴 Support Zone: 3.0950 followed by 2.8700.
• 🛡️ Pivot Confluence: 3.2124 (EMA 50) acts as the immediate hurdle.
💡 4. Technical Takeaway & Risk Management
The current price action reflects a recovery attempt. Traders are monitoring the interaction between price and the EMA 50 for signs of sustained trend reversal. Given the low volume conviction, observing how the asset handles the 3.2124 level is essential for determining if the current bullish bias holds.
💬 5. Community Discussion
What is your technical outlook for $NEAR this week? Are you observing the EMA clusters or waiting for a higher volume confirmation? Drop your thoughts below! 👇
⚠️ 6. Disclaimer
Educational technical analysis only. Not financial advice (NFA). Crypto markets involve risk. Always DYOR.
$NEAR #NEAR #BinanceSquare
1
22
·
--
🔥 $BNB Technical Update: Key Levels & Momentum Breakdown
📊 1. Market Snapshot
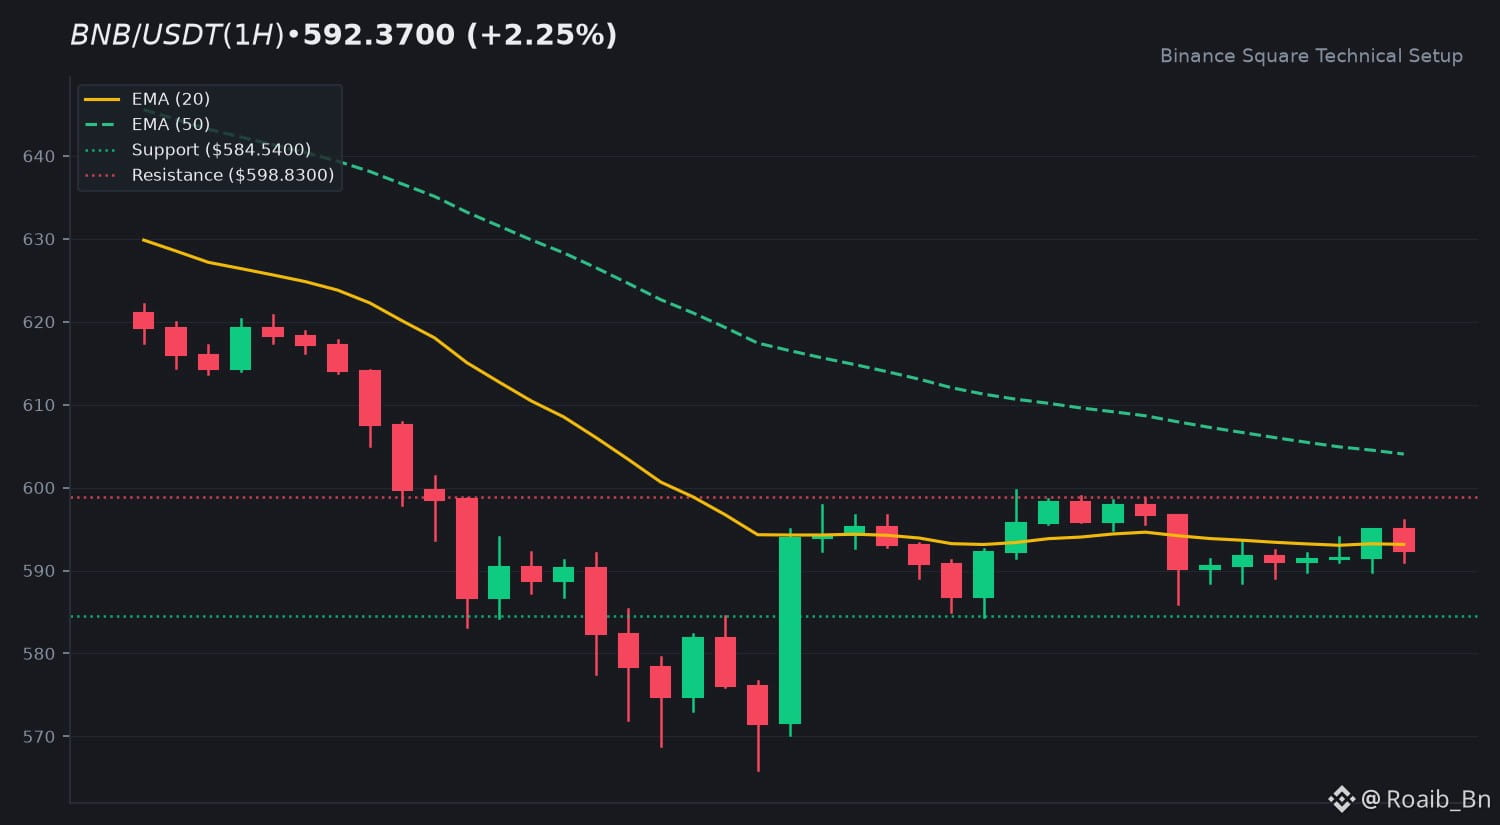
$BNB is currently trading at $592.37, recording a 24-hour gain of +2.25%. Price action has fluctuated within a daily range between a low of 566.00 and a high of 599.72, backed by a total 24-hour quote volume of approximately 100.5M USDT.
📈 2. Technical Momentum & Indicator Bias
The broader trend context remains in a strong downtrend on higher timeframes. The 20 EMA sits at 593.14, acting as immediate overhead dynamic resistance, while the 50 EMA rests higher at 604.04. The 14-period RSI prints at 46.91, signaling neutral momentum without clear overbought or oversold extremes. Meanwhile, the MACD histogram shows a mild positive reading of +0.98, though the MACD line remains below the signal line, indicating subdued momentum amid low relative volume.
🎯 3. Key Technical Levels to Watch
• 🟢 Resistance Zone: The immediate ceiling rests at 598.83, with secondary extension resistance positioned near 620.84.
• 🔴 Support Zone: Initial support is located at 584.54, with the major floor defending the 24-hour low at 566.00.
• 🛡️ Pivot Confluence: The 20 EMA near 593.14 serves as a critical short-term pivot line for trend continuation or rejection.
💡 4. Technical Takeaway & Risk Management
Price compression near the EMA 20 on low volume reflects cautious market positioning. Traders should monitor volume expansion alongside reactions at primary structural boundaries to gauge directional conviction.
💬 5. Community Discussion
What is your technical outlook for $BNB this week? Are you accumulating near support or waiting for structural confirmation? Drop your thoughts below! 👇
⚠️ 6. Disclaimer
Educational technical analysis only. Not financial advice (NFA). Crypto markets involve risk. Always DYOR.
$BNB #BNB #BinanceSquare
🔥 $BNB Technical Update: Key Levels & Momentum Breakdown
📊 1. Market Snapshot
$BNB is currently trading at $592.37, recording a 24-hour gain of +2.25%. Price action has fluctuated within a daily range between a low of 566.00 and a high of 599.72, backed by a total 24-hour quote volume of approximately 100.5M USDT.
📈 2. Technical Momentum & Indicator Bias
The broader trend context remains in a strong downtrend on higher timeframes. The 20 EMA sits at 593.14, acting as immediate overhead dynamic resistance, while the 50 EMA rests higher at 604.04. The 14-period RSI prints at 46.91, signaling neutral momentum without clear overbought or oversold extremes. Meanwhile, the MACD histogram shows a mild positive reading of +0.98, though the MACD line remains below the signal line, indicating subdued momentum amid low relative volume.
🎯 3. Key Technical Levels to Watch
• 🟢 Resistance Zone: The immediate ceiling rests at 598.83, with secondary extension resistance positioned near 620.84.
• 🔴 Support Zone: Initial support is located at 584.54, with the major floor defending the 24-hour low at 566.00.
• 🛡️ Pivot Confluence: The 20 EMA near 593.14 serves as a critical short-term pivot line for trend continuation or rejection.
💡 4. Technical Takeaway & Risk Management
Price compression near the EMA 20 on low volume reflects cautious market positioning. Traders should monitor volume expansion alongside reactions at primary structural boundaries to gauge directional conviction.
💬 5. Community Discussion
What is your technical outlook for $BNB this week? Are you accumulating near support or waiting for structural confirmation? Drop your thoughts below! 👇
⚠️ 6. Disclaimer
Educational technical analysis only. Not financial advice (NFA). Crypto markets involve risk. Always DYOR.
$BNB #BNB #BinanceSquare
📊 1. Market Snapshot
$BNB is currently trading at $592.37, recording a 24-hour gain of +2.25%. Price action has fluctuated within a daily range between a low of 566.00 and a high of 599.72, backed by a total 24-hour quote volume of approximately 100.5M USDT.
📈 2. Technical Momentum & Indicator Bias
The broader trend context remains in a strong downtrend on higher timeframes. The 20 EMA sits at 593.14, acting as immediate overhead dynamic resistance, while the 50 EMA rests higher at 604.04. The 14-period RSI prints at 46.91, signaling neutral momentum without clear overbought or oversold extremes. Meanwhile, the MACD histogram shows a mild positive reading of +0.98, though the MACD line remains below the signal line, indicating subdued momentum amid low relative volume.
🎯 3. Key Technical Levels to Watch
• 🟢 Resistance Zone: The immediate ceiling rests at 598.83, with secondary extension resistance positioned near 620.84.
• 🔴 Support Zone: Initial support is located at 584.54, with the major floor defending the 24-hour low at 566.00.
• 🛡️ Pivot Confluence: The 20 EMA near 593.14 serves as a critical short-term pivot line for trend continuation or rejection.
💡 4. Technical Takeaway & Risk Management
Price compression near the EMA 20 on low volume reflects cautious market positioning. Traders should monitor volume expansion alongside reactions at primary structural boundaries to gauge directional conviction.
💬 5. Community Discussion
What is your technical outlook for $BNB this week? Are you accumulating near support or waiting for structural confirmation? Drop your thoughts below! 👇
⚠️ 6. Disclaimer
Educational technical analysis only. Not financial advice (NFA). Crypto markets involve risk. Always DYOR.
$BNB #BNB #BinanceSquare
6
·
--
ບົດຄວາມ
🚨 RIDE THE MOMENTUM: 4 BULLISH CONTINUATION CANDLESTICKS EVERY TRADER NEEDS 👇🚨 RIDE THE MOMENTUM: 4 BULLISH CONTINUATION CANDLESTICKS EVERY TRADER NEEDS 👇
Understanding price action at an institutional level is the primary difference between a retail participant and a professional trader. Master these four high-probability candlestick formations to refine your market bias and identify trend strength.
1️⃣ BULLISH THREE LINE STRIKE ⚡
• Candlestick Anatomy: Three consecutive small red candles followed by one massive green candle that completely engulfs the entire range of the previous three bars.
• Market Psychology: Prolonged seller pressure is erased in a single session. This indicates a violent short-covering spike and an influx of aggressive buyers reclaiming control.
• High-Confidence Confirmation: Look for a breakout above the high of the large green candle. Potential support floor is established at the midpoint of the strike candle.
2️⃣ UPSIDE TASUKI GAP 📈
• Candlestick Anatomy: A bullish gap occurs between two green candles. The third candle is a small red bar that opens inside the body of the second candle but fails to close the gap.
• Market Psychology: The gap remains unfilled, confirming that buyer appetite remains ferocious even during a brief pause. Sellers tried to push back but failed to gain ground.
• High-Confidence Confirmation: A subsequent candle closing above the high of the second green candle signals technical momentum is still intact.
3️⃣ FALLING THREE METHODS 📉
• Candlestick Anatomy: A tall red candle is followed by three small rising green candles contained within its range. A final steep red candle then closes below the first candle low.
• Market Psychology: This represents a weak corrective bounce that is easily crushed by dominant institutional sellers. It confirms that the bearish trend has high conviction.
• High-Confidence Confirmation: Entry triggers upon the close of the final red candle. Watch for structural resistance at the top of the initial red candle.
4️⃣ BEARISH
🚨 RIDE THE MOMENTUM: 4 BULLISH CONTINUATION CANDLESTICKS EVERY TRADER NEEDS 👇
🚨 RIDE THE MOMENTUM: 4 BULLISH CONTINUATION CANDLESTICKS EVERY TRADER NEEDS 👇
Understanding price action at an institutional level is the primary difference between a retail participant and a professional trader. Master these four high-probability candlestick formations to refine your market bias and identify trend strength.
1️⃣ BULLISH THREE LINE STRIKE ⚡
• Candlestick Anatomy: Three consecutive small red candles followed by one massive green candle that completely engulfs the entire range of the previous three bars.
• Market Psychology: Prolonged seller pressure is erased in a single session. This indicates a violent short-covering spike and an influx of aggressive buyers reclaiming control.
• High-Confidence Confirmation: Look for a breakout above the high of the large green candle. Potential support floor is established at the midpoint of the strike candle.
2️⃣ UPSIDE TASUKI GAP 📈
• Candlestick Anatomy: A bullish gap occurs between two green candles. The third candle is a small red bar that opens inside the body of the second candle but fails to close the gap.
• Market Psychology: The gap remains unfilled, confirming that buyer appetite remains ferocious even during a brief pause. Sellers tried to push back but failed to gain ground.
• High-Confidence Confirmation: A subsequent candle closing above the high of the second green candle signals technical momentum is still intact.
3️⃣ FALLING THREE METHODS 📉
• Candlestick Anatomy: A tall red candle is followed by three small rising green candles contained within its range. A final steep red candle then closes below the first candle low.
• Market Psychology: This represents a weak corrective bounce that is easily crushed by dominant institutional sellers. It confirms that the bearish trend has high conviction.
• High-Confidence Confirmation: Entry triggers upon the close of the final red candle. Watch for structural resistance at the top of the initial red candle.
4️⃣ BEARISH
Understanding price action at an institutional level is the primary difference between a retail participant and a professional trader. Master these four high-probability candlestick formations to refine your market bias and identify trend strength.
1️⃣ BULLISH THREE LINE STRIKE ⚡
• Candlestick Anatomy: Three consecutive small red candles followed by one massive green candle that completely engulfs the entire range of the previous three bars.
• Market Psychology: Prolonged seller pressure is erased in a single session. This indicates a violent short-covering spike and an influx of aggressive buyers reclaiming control.
• High-Confidence Confirmation: Look for a breakout above the high of the large green candle. Potential support floor is established at the midpoint of the strike candle.
2️⃣ UPSIDE TASUKI GAP 📈
• Candlestick Anatomy: A bullish gap occurs between two green candles. The third candle is a small red bar that opens inside the body of the second candle but fails to close the gap.
• Market Psychology: The gap remains unfilled, confirming that buyer appetite remains ferocious even during a brief pause. Sellers tried to push back but failed to gain ground.
• High-Confidence Confirmation: A subsequent candle closing above the high of the second green candle signals technical momentum is still intact.
3️⃣ FALLING THREE METHODS 📉
• Candlestick Anatomy: A tall red candle is followed by three small rising green candles contained within its range. A final steep red candle then closes below the first candle low.
• Market Psychology: This represents a weak corrective bounce that is easily crushed by dominant institutional sellers. It confirms that the bearish trend has high conviction.
• High-Confidence Confirmation: Entry triggers upon the close of the final red candle. Watch for structural resistance at the top of the initial red candle.
4️⃣ BEARISH
16
·
--
🔥 $ZEC Technical Update: Key Levels & Momentum Breakdown
📊 1. Market Snapshot
The asset $ZEC is currently trading at 896.3600 USDT, reflecting a 4.50 percent increase over the last 24 hours. The trading environment remains characterized by lower liquidity, with a 24h quote volume of approximately 202.9 million USDT. Price action has fluctuated between a daily high of 930.4900 and a low of 801.5200.
📈 2. Technical Momentum & Indicator Bias
Current price action for $ZEC sits just below the EMA 20 at 897.2151 and the EMA 50 at 904.9745, indicating a neutral to bearish posture as the price tests these dynamic averages. The RSI at 49.55 suggests a state of equilibrium, lacking clear directional momentum. The MACD histogram at -0.2145, with the MACD line beneath the signal line, points to ongoing consolidation rather than an immediate trend reversal.
🎯 3. Key Technical Levels to Watch
• 🟢 Resistance Zone: Initial resistance is positioned at 929.5250, with a secondary ceiling observed at 963.7175.
• 🔴 Support Zone: Immediate support rests at 885.8420, while the 24h low of 801.5200 remains the primary floor for downside testing.
• 🛡️ Pivot Confluence: The 897 range is critical as it aligns with the EMA 20.
💡 4. Technical Takeaway & Risk Management
The market bias for $ZEC remains cautious. Traders are monitoring the interaction between the current price and the EMA 20/50 cluster. A sustained move above these averages could signal a shift in short-term sentiment, while failure to hold the 885 support might lead to retesting lower liquidity zones.
💬 5. Community Discussion
What is your technical outlook for $ZEC this week? Are you accumulating or waiting for confirmation? Drop your thoughts below! 👇
⚠️ 6. Disclaimer
Educational technical analysis only. Not financial advice (NFA). Crypto markets involve risk. Always DYOR.
$ZEC #ZEC #BinanceSquare
🔥 $ZEC Technical Update: Key Levels & Momentum Breakdown
📊 1. Market Snapshot
The asset $ZEC is currently trading at 896.3600 USDT, reflecting a 4.50 percent increase over the last 24 hours. The trading environment remains characterized by lower liquidity, with a 24h quote volume of approximately 202.9 million USDT. Price action has fluctuated between a daily high of 930.4900 and a low of 801.5200.
📈 2. Technical Momentum & Indicator Bias
Current price action for $ZEC sits just below the EMA 20 at 897.2151 and the EMA 50 at 904.9745, indicating a neutral to bearish posture as the price tests these dynamic averages. The RSI at 49.55 suggests a state of equilibrium, lacking clear directional momentum. The MACD histogram at -0.2145, with the MACD line beneath the signal line, points to ongoing consolidation rather than an immediate trend reversal.
🎯 3. Key Technical Levels to Watch
• 🟢 Resistance Zone: Initial resistance is positioned at 929.5250, with a secondary ceiling observed at 963.7175.
• 🔴 Support Zone: Immediate support rests at 885.8420, while the 24h low of 801.5200 remains the primary floor for downside testing.
• 🛡️ Pivot Confluence: The 897 range is critical as it aligns with the EMA 20.
💡 4. Technical Takeaway & Risk Management
The market bias for $ZEC remains cautious. Traders are monitoring the interaction between the current price and the EMA 20/50 cluster. A sustained move above these averages could signal a shift in short-term sentiment, while failure to hold the 885 support might lead to retesting lower liquidity zones.
💬 5. Community Discussion
What is your technical outlook for $ZEC this week? Are you accumulating or waiting for confirmation? Drop your thoughts below! 👇
⚠️ 6. Disclaimer
Educational technical analysis only. Not financial advice (NFA). Crypto markets involve risk. Always DYOR.
$ZEC #ZEC #BinanceSquare
📊 1. Market Snapshot
The asset $ZEC is currently trading at 896.3600 USDT, reflecting a 4.50 percent increase over the last 24 hours. The trading environment remains characterized by lower liquidity, with a 24h quote volume of approximately 202.9 million USDT. Price action has fluctuated between a daily high of 930.4900 and a low of 801.5200.
📈 2. Technical Momentum & Indicator Bias
Current price action for $ZEC sits just below the EMA 20 at 897.2151 and the EMA 50 at 904.9745, indicating a neutral to bearish posture as the price tests these dynamic averages. The RSI at 49.55 suggests a state of equilibrium, lacking clear directional momentum. The MACD histogram at -0.2145, with the MACD line beneath the signal line, points to ongoing consolidation rather than an immediate trend reversal.
🎯 3. Key Technical Levels to Watch
• 🟢 Resistance Zone: Initial resistance is positioned at 929.5250, with a secondary ceiling observed at 963.7175.
• 🔴 Support Zone: Immediate support rests at 885.8420, while the 24h low of 801.5200 remains the primary floor for downside testing.
• 🛡️ Pivot Confluence: The 897 range is critical as it aligns with the EMA 20.
💡 4. Technical Takeaway & Risk Management
The market bias for $ZEC remains cautious. Traders are monitoring the interaction between the current price and the EMA 20/50 cluster. A sustained move above these averages could signal a shift in short-term sentiment, while failure to hold the 885 support might lead to retesting lower liquidity zones.
💬 5. Community Discussion
What is your technical outlook for $ZEC this week? Are you accumulating or waiting for confirmation? Drop your thoughts below! 👇
⚠️ 6. Disclaimer
Educational technical analysis only. Not financial advice (NFA). Crypto markets involve risk. Always DYOR.
$ZEC #ZEC #BinanceSquare
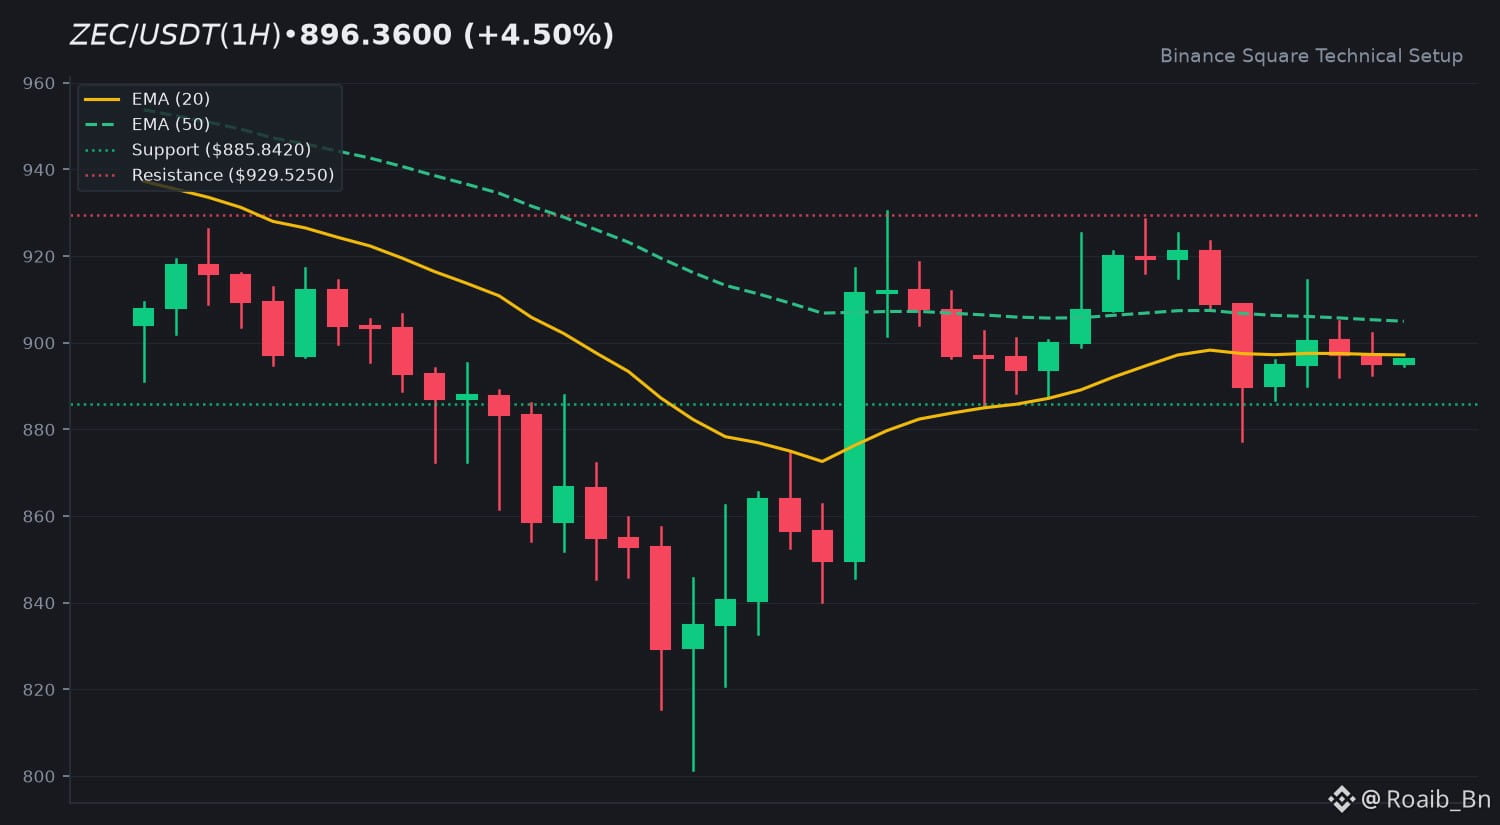
12
·
--
🔥 $XRP Technical Update: Key Levels & Momentum Breakdown
📊 1. Market Snapshot
$XRP is currently trading at $0.9490, marking a 24-hour decline of -1.70%. Price action over the past session established a high of $0.9794 and a low of $0.8930, backed by a stable 24-hour quote volume of $234.379,412 USDT.
📈 2. Technical Momentum & Indicator Bias
On the trend front, $XRP maintains a broader downward posture while sitting slightly below the EMA 20 at $0.9574 and the EMA 50 at $0.9732. The RSI (14) prints at 44.41, reflecting neutral-to-soft bearish momentum without reaching oversold extremes. Meanwhile, the MACD histogram shows a minor positive reading of +0.0014, with the MACD line at -0.0031 crossing close to the signal line at -0.0045, suggesting consolidation phases. Volume remains neutral at 0.77x the 20-SMA.
🎯 3. Key Technical Levels to Watch
• 🟢 Resistance Zone: Immediate overhead resistance rests at $0.9788, with secondary extension potential near $0.9983.
• 🔴 Support Zone: Initial support is located at $0.9431, backed by the 24-hour low floor at $0.8930.
• 🛡️ Pivot Confluence: The EMA 20 line at $0.9574 serves as the primary near-term pivot for structural bias.
💡 4. Technical Takeaway & Risk Management
Market participants are closely observing how price interacts with the immediate moving averages and support baselines. Managing risk effectively requires monitoring volume expansion alongside any potential retests of structural support zones.
💬 5. Community Discussion
What is your technical outlook for $XRP this week? Are you accumulating near support or waiting for structural confirmation? Drop your thoughts below! 👇
⚠️ 6. Disclaimer
Educational technical analysis only. Not financial advice (NFA). Crypto markets involve risk. Always DYOR.
$XRP #XRP #BinanceSquare
🔥 $XRP Technical Update: Key Levels & Momentum Breakdown
📊 1. Market Snapshot
$XRP is currently trading at $0.9490, marking a 24-hour decline of -1.70%. Price action over the past session established a high of $0.9794 and a low of $0.8930, backed by a stable 24-hour quote volume of $234.379,412 USDT.
📈 2. Technical Momentum & Indicator Bias
On the trend front, $XRP maintains a broader downward posture while sitting slightly below the EMA 20 at $0.9574 and the EMA 50 at $0.9732. The RSI (14) prints at 44.41, reflecting neutral-to-soft bearish momentum without reaching oversold extremes. Meanwhile, the MACD histogram shows a minor positive reading of +0.0014, with the MACD line at -0.0031 crossing close to the signal line at -0.0045, suggesting consolidation phases. Volume remains neutral at 0.77x the 20-SMA.
🎯 3. Key Technical Levels to Watch
• 🟢 Resistance Zone: Immediate overhead resistance rests at $0.9788, with secondary extension potential near $0.9983.
• 🔴 Support Zone: Initial support is located at $0.9431, backed by the 24-hour low floor at $0.8930.
• 🛡️ Pivot Confluence: The EMA 20 line at $0.9574 serves as the primary near-term pivot for structural bias.
💡 4. Technical Takeaway & Risk Management
Market participants are closely observing how price interacts with the immediate moving averages and support baselines. Managing risk effectively requires monitoring volume expansion alongside any potential retests of structural support zones.
💬 5. Community Discussion
What is your technical outlook for $XRP this week? Are you accumulating near support or waiting for structural confirmation? Drop your thoughts below! 👇
⚠️ 6. Disclaimer
Educational technical analysis only. Not financial advice (NFA). Crypto markets involve risk. Always DYOR.
$XRP #XRP #BinanceSquare
📊 1. Market Snapshot
$XRP is currently trading at $0.9490, marking a 24-hour decline of -1.70%. Price action over the past session established a high of $0.9794 and a low of $0.8930, backed by a stable 24-hour quote volume of $234.379,412 USDT.
📈 2. Technical Momentum & Indicator Bias
On the trend front, $XRP maintains a broader downward posture while sitting slightly below the EMA 20 at $0.9574 and the EMA 50 at $0.9732. The RSI (14) prints at 44.41, reflecting neutral-to-soft bearish momentum without reaching oversold extremes. Meanwhile, the MACD histogram shows a minor positive reading of +0.0014, with the MACD line at -0.0031 crossing close to the signal line at -0.0045, suggesting consolidation phases. Volume remains neutral at 0.77x the 20-SMA.
🎯 3. Key Technical Levels to Watch
• 🟢 Resistance Zone: Immediate overhead resistance rests at $0.9788, with secondary extension potential near $0.9983.
• 🔴 Support Zone: Initial support is located at $0.9431, backed by the 24-hour low floor at $0.8930.
• 🛡️ Pivot Confluence: The EMA 20 line at $0.9574 serves as the primary near-term pivot for structural bias.
💡 4. Technical Takeaway & Risk Management
Market participants are closely observing how price interacts with the immediate moving averages and support baselines. Managing risk effectively requires monitoring volume expansion alongside any potential retests of structural support zones.
💬 5. Community Discussion
What is your technical outlook for $XRP this week? Are you accumulating near support or waiting for structural confirmation? Drop your thoughts below! 👇
⚠️ 6. Disclaimer
Educational technical analysis only. Not financial advice (NFA). Crypto markets involve risk. Always DYOR.
$XRP #XRP #BinanceSquare
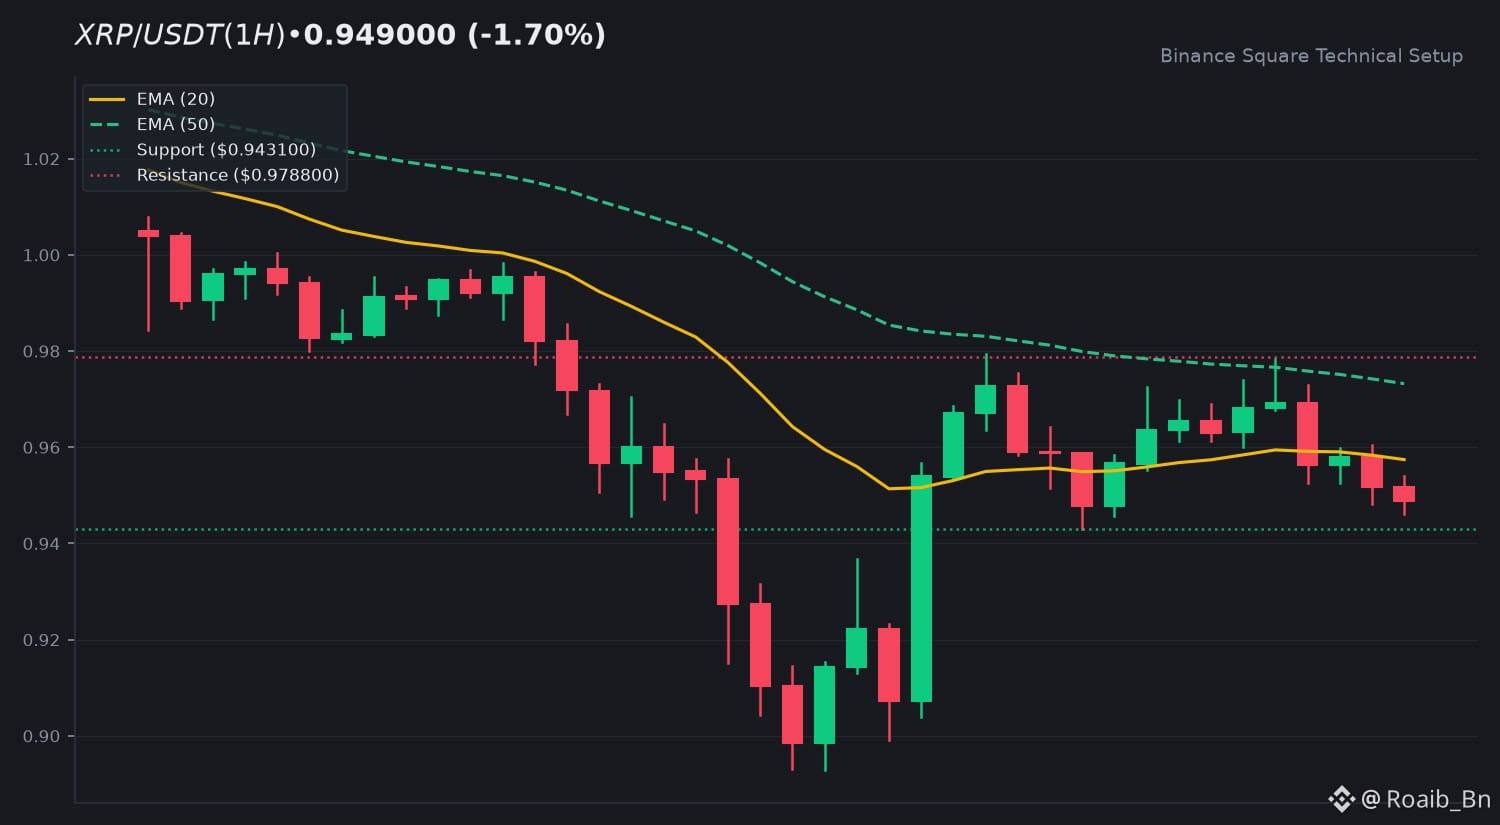
43
·
--
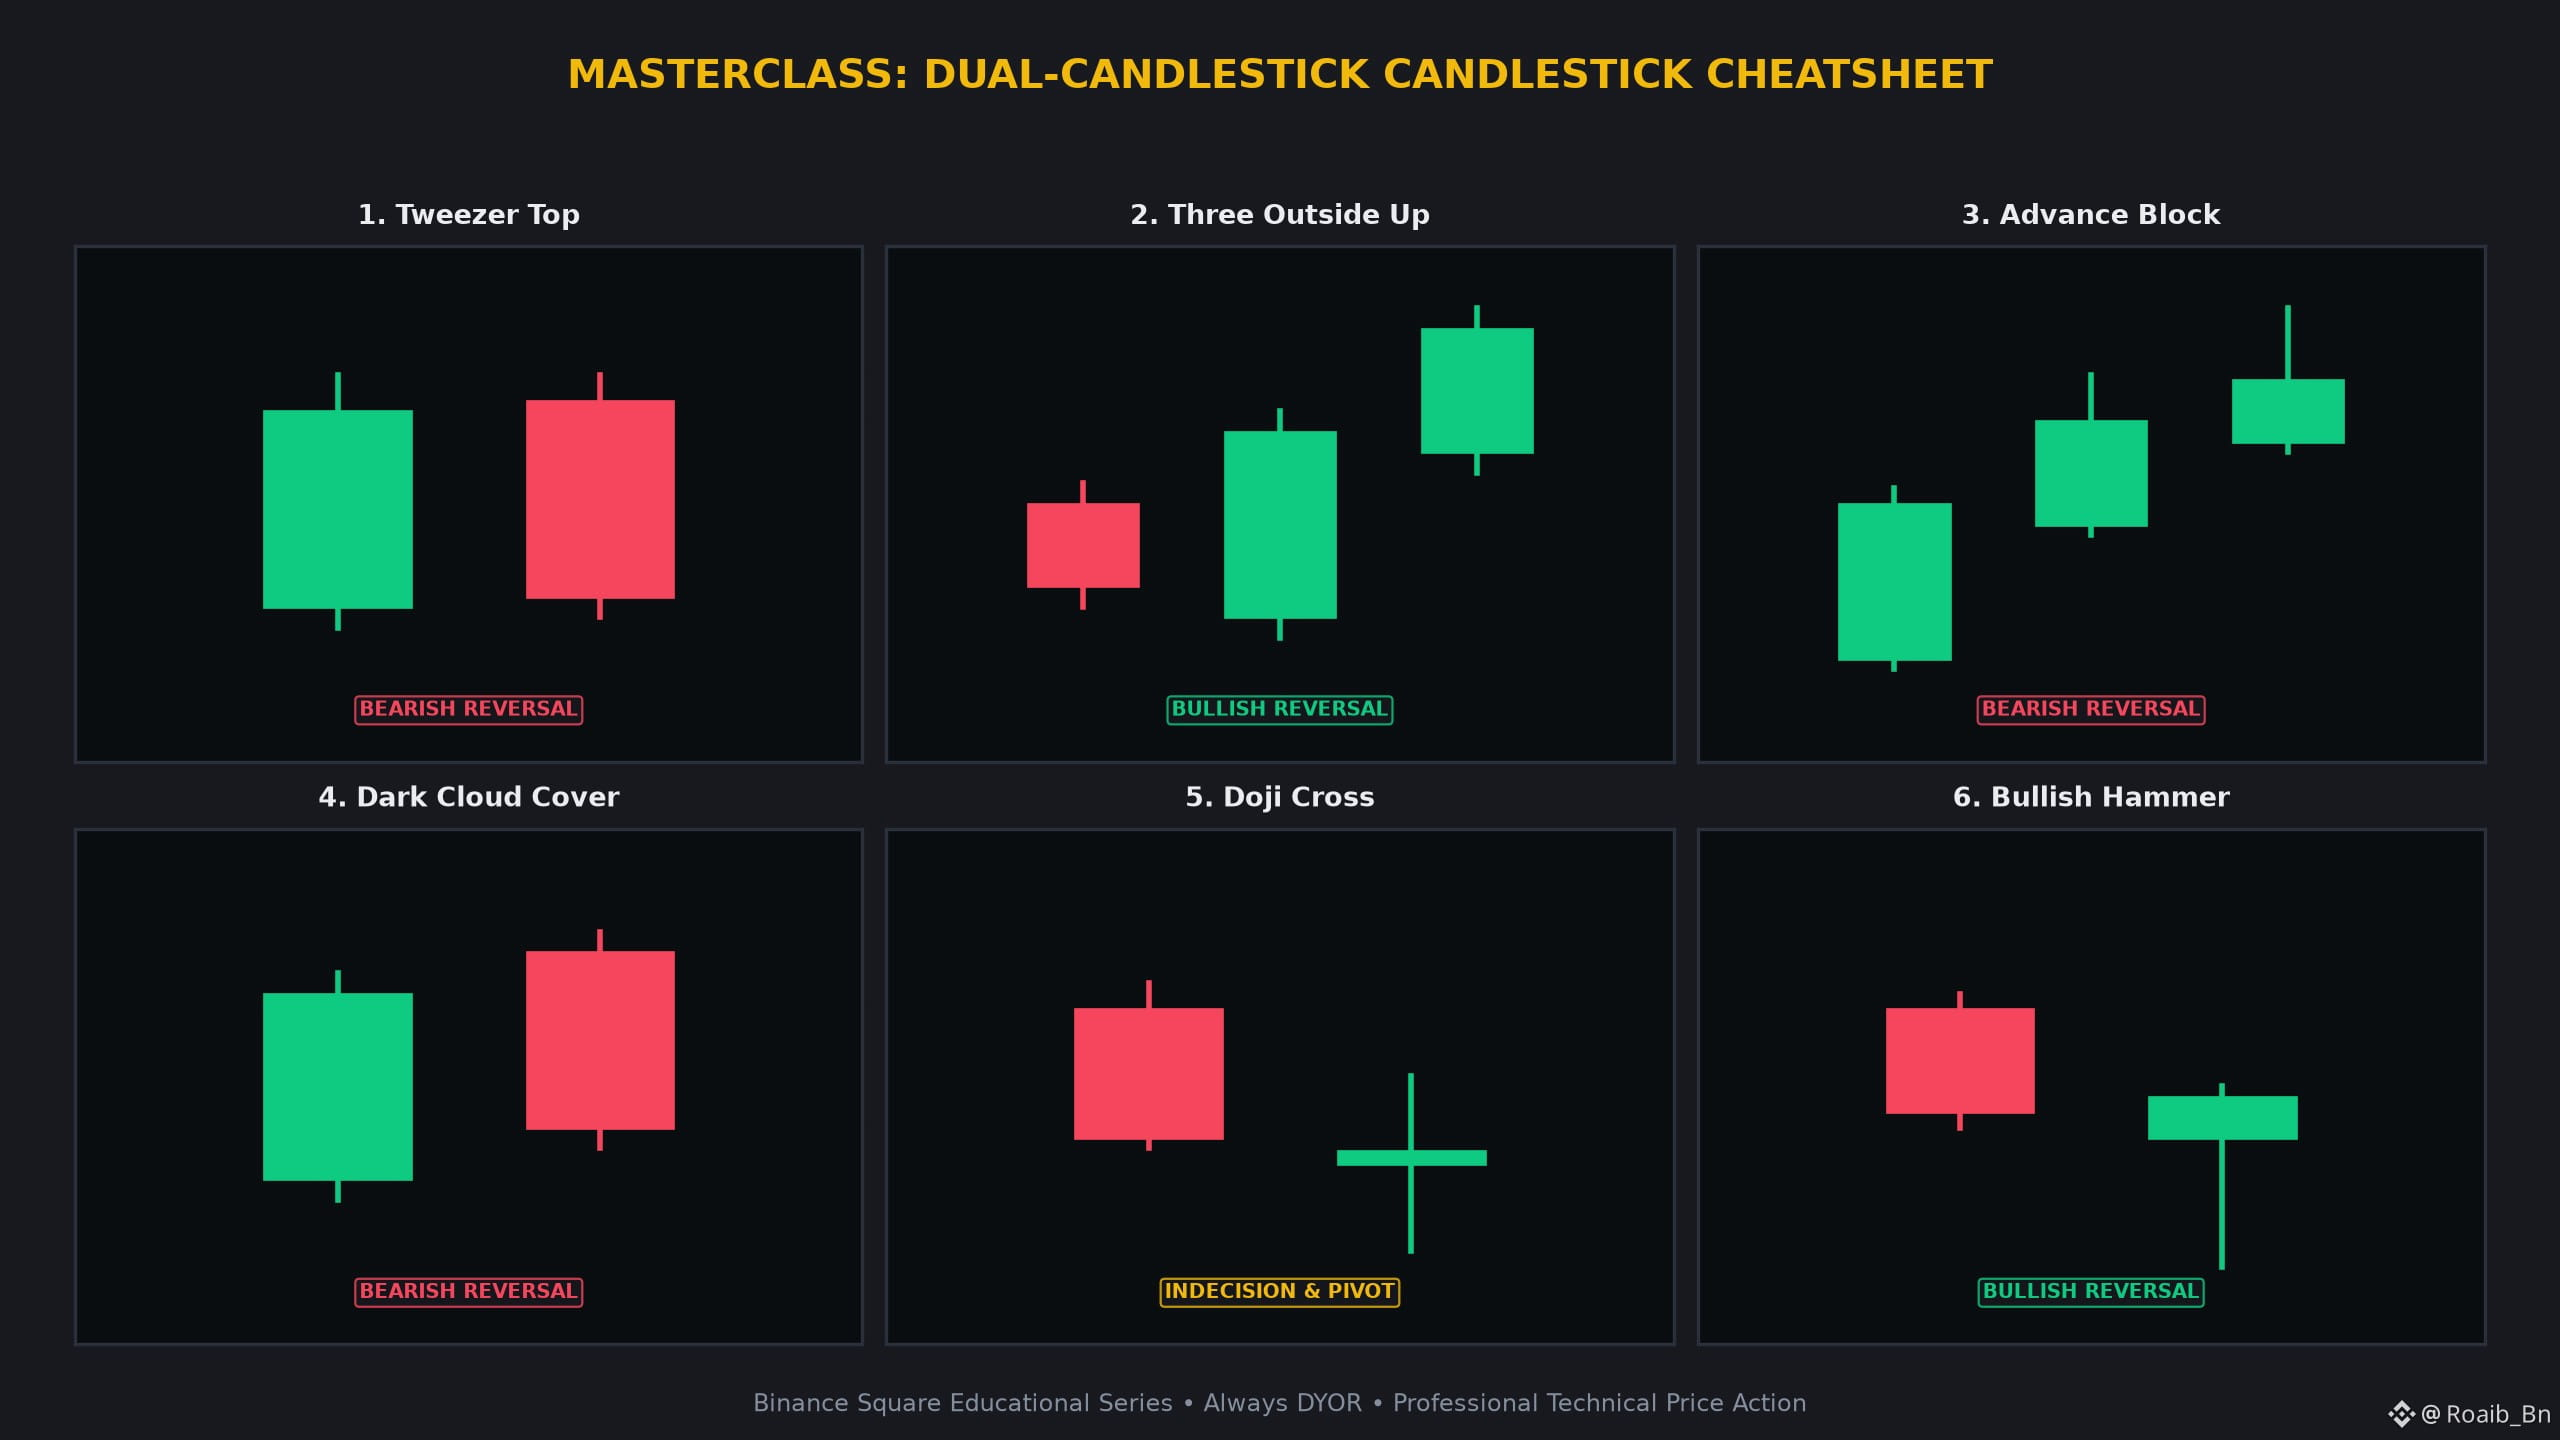
ບົດຄວາມ
🚨 THE ULTIMATE CHEATSHEET: 6 HIGH-CONFLUENCE CANDLESTICK COMBINATIONS 👇🚨 THE ULTIMATE CHEATSHEET: 6 HIGH-CONFLUENCE CANDLESTICK COMBINATIONS 👇
Understand price action at an institutional level. Here is your definitive masterclass on the most reliable candlestick formations every crypto trader must master.
1 📌 Tweezer Top 📌
• Candlestick Anatomy: Green and red candles reaching the exact same high resistance point.
• Market Psychology: Double rejection at major overhead resistance confirming a solid ceiling.
• High-Confidence Confirmation: Wait for a subsequent red candle to close below the low of the Tweezer formation.
2 ⬆️ Three Outside Up ⬆️
• Candlestick Anatomy: Red candle, large green engulfing candle, followed by a higher green close.
• Market Psychology: Validates the engulfing candle with immediate follow-through momentum.
• High-Confidence Confirmation: Look for a surge in volume on the third candle to confirm trend strength.
3 🚧 Advance Block 🚧
• Candlestick Anatomy: Three green candles with progressively smaller bodies and longer upper wicks.
• Market Psychology: Upward momentum is stalling out into heavy overhead institutional supply.
• High-Confidence Confirmation: Monitor the breach of the lowest point of the three candles as a shift in bias.
4 ☁️ Dark Cloud Cover ☁️
• Candlestick Anatomy: Green candle followed by a red candle opening higher but closing below the 50 percent midpoint.
• Market Psychology: Gap-up was sold into heavily, showing strong overhead supply.
• High-Confidence Confirmation: A failure to reclaim the 50 percent midpoint on lower timeframes.
5 ⚖️ Doji Cross ⚖️
• Candlestick Anatomy: Virtually identical open and close price creating a cross or plus shape.
• Market Psychology: Total equilibrium between buyers and sellers; prepares the stage for violent expansion.
• High-Confidence Confirmation: Wait for a breakout above or below the Doji range to determine the next directional bias.
6 🔨 Bullish Hammer 🔨
• Candlestick Anatomy: Small body at the top with a lower wick at least twice the length of the body.
• Market Psychology: Intraday seller dump was completely absorbed, closing near highs.
• High-Confidence Confirmation: A green candle following the hammer indicates successful demand absorption.
💡 Why Master These Candlestick Formations?
• Spot high-probability reversals and continuation phases before the retail crowd.
• Define exact risk-to-reward boundaries with clear invalidation levels.
• Combine with volume confirmation and dynamic moving averages (EMA 20/50).
💬 Community Masterclass Discussion:
Which of these 6 candlestick setups has yielded the highest win-rate in your crypto journey? Share your thoughts below! 👇
⚠️ Educational Masterclass Disclaimer:
This content is for educational purposes only and does not constitute financial advice (NFA). Cryptocurrency markets carry inherent volatility. Always manage risk prudently and conduct your own research (DYOR).
$BTC $ETH SOL BNB #BinanceSquare #CryptoTrading
🚨 THE ULTIMATE CHEATSHEET: 6 HIGH-CONFLUENCE CANDLESTICK COMBINATIONS 👇
🚨 THE ULTIMATE CHEATSHEET: 6 HIGH-CONFLUENCE CANDLESTICK COMBINATIONS 👇
Understand price action at an institutional level. Here is your definitive masterclass on the most reliable candlestick formations every crypto trader must master.
1 📌 Tweezer Top 📌
• Candlestick Anatomy: Green and red candles reaching the exact same high resistance point.
• Market Psychology: Double rejection at major overhead resistance confirming a solid ceiling.
• High-Confidence Confirmation: Wait for a subsequent red candle to close below the low of the Tweezer formation.
2 ⬆️ Three Outside Up ⬆️
• Candlestick Anatomy: Red candle, large green engulfing candle, followed by a higher green close.
• Market Psychology: Validates the engulfing candle with immediate follow-through momentum.
• High-Confidence Confirmation: Look for a surge in volume on the third candle to confirm trend strength.
3 🚧 Advance Block 🚧
• Candlestick Anatomy: Three green candles with progressively smaller bodies and longer upper wicks.
• Market Psychology: Upward momentum is stalling out into heavy overhead institutional supply.
• High-Confidence Confirmation: Monitor the breach of the lowest point of the three candles as a shift in bias.
4 ☁️ Dark Cloud Cover ☁️
• Candlestick Anatomy: Green candle followed by a red candle opening higher but closing below the 50 percent midpoint.
• Market Psychology: Gap-up was sold into heavily, showing strong overhead supply.
• High-Confidence Confirmation: A failure to reclaim the 50 percent midpoint on lower timeframes.
5 ⚖️ Doji Cross ⚖️
• Candlestick Anatomy: Virtually identical open and close price creating a cross or plus shape.
• Market Psychology: Total equilibrium between buyers and sellers; prepares the stage for violent expansion.
• High-Confidence Confirmation: Wait for a breakout above or below the Doji range to determine the next directional bias.
6 🔨 Bullish Hammer 🔨
• Candlestick Anatomy: Small body at the top with a lower wick at least twice the length of the body.
• Market Psychology: Intraday seller dump was completely absorbed, closing near highs.
• High-Confidence Confirmation: A green candle following the hammer indicates successful demand absorption.
💡 Why Master These Candlestick Formations?
• Spot high-probability reversals and continuation phases before the retail crowd.
• Define exact risk-to-reward boundaries with clear invalidation levels.
• Combine with volume confirmation and dynamic moving averages (EMA 20/50).
💬 Community Masterclass Discussion:
Which of these 6 candlestick setups has yielded the highest win-rate in your crypto journey? Share your thoughts below! 👇
⚠️ Educational Masterclass Disclaimer:
This content is for educational purposes only and does not constitute financial advice (NFA). Cryptocurrency markets carry inherent volatility. Always manage risk prudently and conduct your own research (DYOR).
$BTC $ETH SOL BNB #BinanceSquare #CryptoTrading
Understand price action at an institutional level. Here is your definitive masterclass on the most reliable candlestick formations every crypto trader must master.
1 📌 Tweezer Top 📌
• Candlestick Anatomy: Green and red candles reaching the exact same high resistance point.
• Market Psychology: Double rejection at major overhead resistance confirming a solid ceiling.
• High-Confidence Confirmation: Wait for a subsequent red candle to close below the low of the Tweezer formation.
2 ⬆️ Three Outside Up ⬆️
• Candlestick Anatomy: Red candle, large green engulfing candle, followed by a higher green close.
• Market Psychology: Validates the engulfing candle with immediate follow-through momentum.
• High-Confidence Confirmation: Look for a surge in volume on the third candle to confirm trend strength.
3 🚧 Advance Block 🚧
• Candlestick Anatomy: Three green candles with progressively smaller bodies and longer upper wicks.
• Market Psychology: Upward momentum is stalling out into heavy overhead institutional supply.
• High-Confidence Confirmation: Monitor the breach of the lowest point of the three candles as a shift in bias.
4 ☁️ Dark Cloud Cover ☁️
• Candlestick Anatomy: Green candle followed by a red candle opening higher but closing below the 50 percent midpoint.
• Market Psychology: Gap-up was sold into heavily, showing strong overhead supply.
• High-Confidence Confirmation: A failure to reclaim the 50 percent midpoint on lower timeframes.
5 ⚖️ Doji Cross ⚖️
• Candlestick Anatomy: Virtually identical open and close price creating a cross or plus shape.
• Market Psychology: Total equilibrium between buyers and sellers; prepares the stage for violent expansion.
• High-Confidence Confirmation: Wait for a breakout above or below the Doji range to determine the next directional bias.
6 🔨 Bullish Hammer 🔨
• Candlestick Anatomy: Small body at the top with a lower wick at least twice the length of the body.
• Market Psychology: Intraday seller dump was completely absorbed, closing near highs.
• High-Confidence Confirmation: A green candle following the hammer indicates successful demand absorption.
💡 Why Master These Candlestick Formations?
• Spot high-probability reversals and continuation phases before the retail crowd.
• Define exact risk-to-reward boundaries with clear invalidation levels.
• Combine with volume confirmation and dynamic moving averages (EMA 20/50).
💬 Community Masterclass Discussion:
Which of these 6 candlestick setups has yielded the highest win-rate in your crypto journey? Share your thoughts below! 👇
⚠️ Educational Masterclass Disclaimer:
This content is for educational purposes only and does not constitute financial advice (NFA). Cryptocurrency markets carry inherent volatility. Always manage risk prudently and conduct your own research (DYOR).
$BTC $ETH SOL BNB #BinanceSquare #CryptoTrading
17
·
--
🔥 $SOL Technical Update: Key Levels & Momentum Breakdown
📊 1. Market Snapshot
$SOL is currently trading at $71.1400, reflecting a 24-hour decline of -3.81%. The asset tested a 24-hour high of 74.3200 and a low of 67.4100, accompanied by a 24-hour quote volume of 411,818,067 USDT on a low volume profile.
📈 2. Technical Momentum & Indicator Bias
Price action remains positioned below the EMA 20 at $71.7939 and the EMA 50 at 74.0224 within a broader structural downtrend context. The RSI reading sits at 43.42, indicating a neutral-to-bearish momentum posture without entering oversold extremes. Meanwhile, the MACD histogram prints a minor positive value of +0.3490, suggesting mild stabilization attempts amidst low trading conviction relative to the 20-SMA.
🎯 3. Key Technical Levels to Watch
• 🟢 Resistance Zone: Immediate overhead resistance is located near 72.0300, with secondary resistance stretching toward 76.2200.
• 🔴 Support Zone: Immediate downside support rests at 69.5000, backed by the 24-hour low and major floor at 67.4100.
• 🛡️ Pivot Confluence: The EMA 20 at $71.7939 serves as the primary dynamic pivot for short-term trend evaluation.
💡 4. Technical Takeaway & Risk Management
Participants are closely monitoring how price behaves around the dynamic moving averages and immediate support boundaries. Low volume suggests a lack of aggressive market conviction, emphasizing the importance of disciplined risk management and waiting for definitive structural confirmations before establishing bias.
💬 5. Community Discussion
What is your technical outlook for $SOL this week? Are you accumulating near support or waiting for volume confirmation above the EMA layers? Drop your thoughts below! 👇
⚠️ 6. Disclaimer
Educational technical analysis only. Not financial advice (NFA). Crypto markets involve risk. Always DYOR.
$SOL #SOL #BinanceSquare
🔥 $SOL Technical Update: Key Levels & Momentum Breakdown
📊 1. Market Snapshot
$SOL is currently trading at $71.1400, reflecting a 24-hour decline of -3.81%. The asset tested a 24-hour high of 74.3200 and a low of 67.4100, accompanied by a 24-hour quote volume of 411,818,067 USDT on a low volume profile.
📈 2. Technical Momentum & Indicator Bias
Price action remains positioned below the EMA 20 at $71.7939 and the EMA 50 at 74.0224 within a broader structural downtrend context. The RSI reading sits at 43.42, indicating a neutral-to-bearish momentum posture without entering oversold extremes. Meanwhile, the MACD histogram prints a minor positive value of +0.3490, suggesting mild stabilization attempts amidst low trading conviction relative to the 20-SMA.
🎯 3. Key Technical Levels to Watch
• 🟢 Resistance Zone: Immediate overhead resistance is located near 72.0300, with secondary resistance stretching toward 76.2200.
• 🔴 Support Zone: Immediate downside support rests at 69.5000, backed by the 24-hour low and major floor at 67.4100.
• 🛡️ Pivot Confluence: The EMA 20 at $71.7939 serves as the primary dynamic pivot for short-term trend evaluation.
💡 4. Technical Takeaway & Risk Management
Participants are closely monitoring how price behaves around the dynamic moving averages and immediate support boundaries. Low volume suggests a lack of aggressive market conviction, emphasizing the importance of disciplined risk management and waiting for definitive structural confirmations before establishing bias.
💬 5. Community Discussion
What is your technical outlook for $SOL this week? Are you accumulating near support or waiting for volume confirmation above the EMA layers? Drop your thoughts below! 👇
⚠️ 6. Disclaimer
Educational technical analysis only. Not financial advice (NFA). Crypto markets involve risk. Always DYOR.
$SOL #SOL #BinanceSquare
📊 1. Market Snapshot
$SOL is currently trading at $71.1400, reflecting a 24-hour decline of -3.81%. The asset tested a 24-hour high of 74.3200 and a low of 67.4100, accompanied by a 24-hour quote volume of 411,818,067 USDT on a low volume profile.
📈 2. Technical Momentum & Indicator Bias
Price action remains positioned below the EMA 20 at $71.7939 and the EMA 50 at 74.0224 within a broader structural downtrend context. The RSI reading sits at 43.42, indicating a neutral-to-bearish momentum posture without entering oversold extremes. Meanwhile, the MACD histogram prints a minor positive value of +0.3490, suggesting mild stabilization attempts amidst low trading conviction relative to the 20-SMA.
🎯 3. Key Technical Levels to Watch
• 🟢 Resistance Zone: Immediate overhead resistance is located near 72.0300, with secondary resistance stretching toward 76.2200.
• 🔴 Support Zone: Immediate downside support rests at 69.5000, backed by the 24-hour low and major floor at 67.4100.
• 🛡️ Pivot Confluence: The EMA 20 at $71.7939 serves as the primary dynamic pivot for short-term trend evaluation.
💡 4. Technical Takeaway & Risk Management
Participants are closely monitoring how price behaves around the dynamic moving averages and immediate support boundaries. Low volume suggests a lack of aggressive market conviction, emphasizing the importance of disciplined risk management and waiting for definitive structural confirmations before establishing bias.
💬 5. Community Discussion
What is your technical outlook for $SOL this week? Are you accumulating near support or waiting for volume confirmation above the EMA layers? Drop your thoughts below! 👇
⚠️ 6. Disclaimer
Educational technical analysis only. Not financial advice (NFA). Crypto markets involve risk. Always DYOR.
$SOL #SOL #BinanceSquare
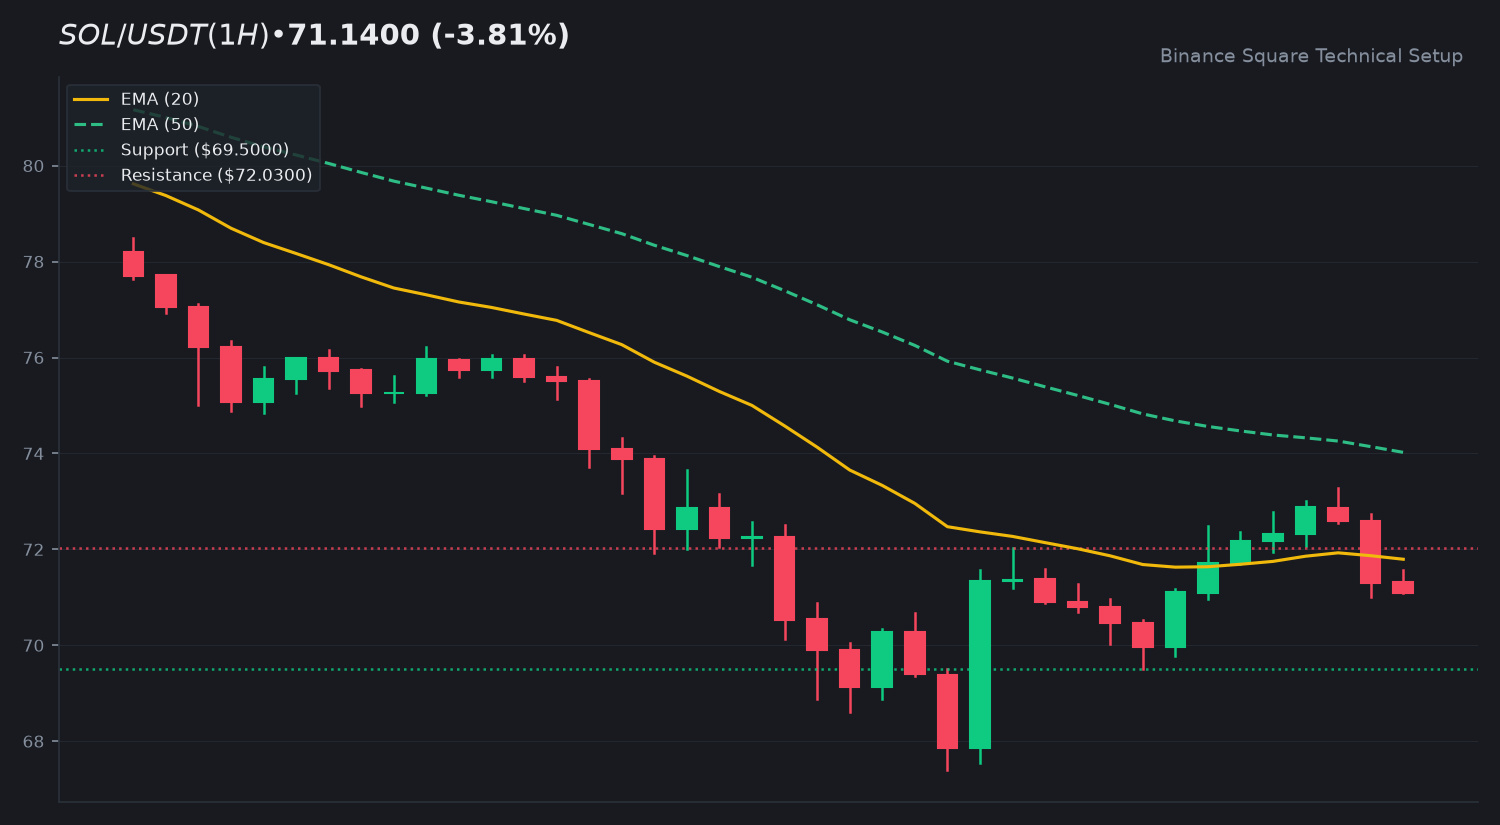
24
·
--
🔥 $ETH Technical Update: Key Levels & Momentum Breakdown
📊 1. Market Snapshot
$ETH is currently trading at $1,827.19, reflecting a 24-hour contraction of -3.52%. During the latest daily session, the asset established a high of $1,894.24 and a low of $1,711.08, accompanied by a 24-hour quote volume of $1.11 billion USDT, indicating measured consolidation activity.
📈 2. Technical Momentum & Indicator Bias
Price action hovers near the EMA 20 sitting at $1,820.37, while remaining beneath the EMA 50 positioned at $1,862.21. The Relative Strength Index (RSI 14) prints a neutral reading of 49.81, showing a balanced state between buyers and sellers. Meanwhile, the MACD histogram registers at +9.37, supported by a MACD line at -8.44 crossing above the signal line at -17.82, suggesting early signs of a bullish recovery attempt within the broader range.
🎯 3. Key Technical Levels to Watch
• 🟢 Resistance Zone: Immediate overhead resistance sits at $1,839.80, with a secondary extension target at $1,919.76.
• 🔴 Support Zone: Initial support is established near $1,811.29, backed by a deeper structural floor at $1,773.13.
• 🛡️ Pivot Confluence: The EMA 20 at $1,820.37 serves as the primary pivot confluence for short-term directional bias.
💡 4. Technical Takeaway & Risk Management
Market participants are monitoring whether $ETH can sustain closes above the EMA 20 to confirm trend continuity. Low relative volume highlights the need for patience while observing reaction zones.
💬 5. Community Discussion
What is your technical outlook for $ETH this week? Are you tracking consolidation or waiting for confirmation? Drop your thoughts below! 👇
⚠️ 6. Disclaimer
Educational technical analysis only. Not financial advice (NFA). Crypto markets involve risk. Always DYOR.
$ETH #ETH #BinanceSquare
🔥 $ETH Technical Update: Key Levels & Momentum Breakdown
📊 1. Market Snapshot
$ETH is currently trading at $1,827.19, reflecting a 24-hour contraction of -3.52%. During the latest daily session, the asset established a high of $1,894.24 and a low of $1,711.08, accompanied by a 24-hour quote volume of $1.11 billion USDT, indicating measured consolidation activity.
📈 2. Technical Momentum & Indicator Bias
Price action hovers near the EMA 20 sitting at $1,820.37, while remaining beneath the EMA 50 positioned at $1,862.21. The Relative Strength Index (RSI 14) prints a neutral reading of 49.81, showing a balanced state between buyers and sellers. Meanwhile, the MACD histogram registers at +9.37, supported by a MACD line at -8.44 crossing above the signal line at -17.82, suggesting early signs of a bullish recovery attempt within the broader range.
🎯 3. Key Technical Levels to Watch
• 🟢 Resistance Zone: Immediate overhead resistance sits at $1,839.80, with a secondary extension target at $1,919.76.
• 🔴 Support Zone: Initial support is established near $1,811.29, backed by a deeper structural floor at $1,773.13.
• 🛡️ Pivot Confluence: The EMA 20 at $1,820.37 serves as the primary pivot confluence for short-term directional bias.
💡 4. Technical Takeaway & Risk Management
Market participants are monitoring whether $ETH can sustain closes above the EMA 20 to confirm trend continuity. Low relative volume highlights the need for patience while observing reaction zones.
💬 5. Community Discussion
What is your technical outlook for $ETH this week? Are you tracking consolidation or waiting for confirmation? Drop your thoughts below! 👇
⚠️ 6. Disclaimer
Educational technical analysis only. Not financial advice (NFA). Crypto markets involve risk. Always DYOR.
$ETH #ETH #BinanceSquare
📊 1. Market Snapshot
$ETH is currently trading at $1,827.19, reflecting a 24-hour contraction of -3.52%. During the latest daily session, the asset established a high of $1,894.24 and a low of $1,711.08, accompanied by a 24-hour quote volume of $1.11 billion USDT, indicating measured consolidation activity.
📈 2. Technical Momentum & Indicator Bias
Price action hovers near the EMA 20 sitting at $1,820.37, while remaining beneath the EMA 50 positioned at $1,862.21. The Relative Strength Index (RSI 14) prints a neutral reading of 49.81, showing a balanced state between buyers and sellers. Meanwhile, the MACD histogram registers at +9.37, supported by a MACD line at -8.44 crossing above the signal line at -17.82, suggesting early signs of a bullish recovery attempt within the broader range.
🎯 3. Key Technical Levels to Watch
• 🟢 Resistance Zone: Immediate overhead resistance sits at $1,839.80, with a secondary extension target at $1,919.76.
• 🔴 Support Zone: Initial support is established near $1,811.29, backed by a deeper structural floor at $1,773.13.
• 🛡️ Pivot Confluence: The EMA 20 at $1,820.37 serves as the primary pivot confluence for short-term directional bias.
💡 4. Technical Takeaway & Risk Management
Market participants are monitoring whether $ETH can sustain closes above the EMA 20 to confirm trend continuity. Low relative volume highlights the need for patience while observing reaction zones.
💬 5. Community Discussion
What is your technical outlook for $ETH this week? Are you tracking consolidation or waiting for confirmation? Drop your thoughts below! 👇
⚠️ 6. Disclaimer
Educational technical analysis only. Not financial advice (NFA). Crypto markets involve risk. Always DYOR.
$ETH #ETH #BinanceSquare
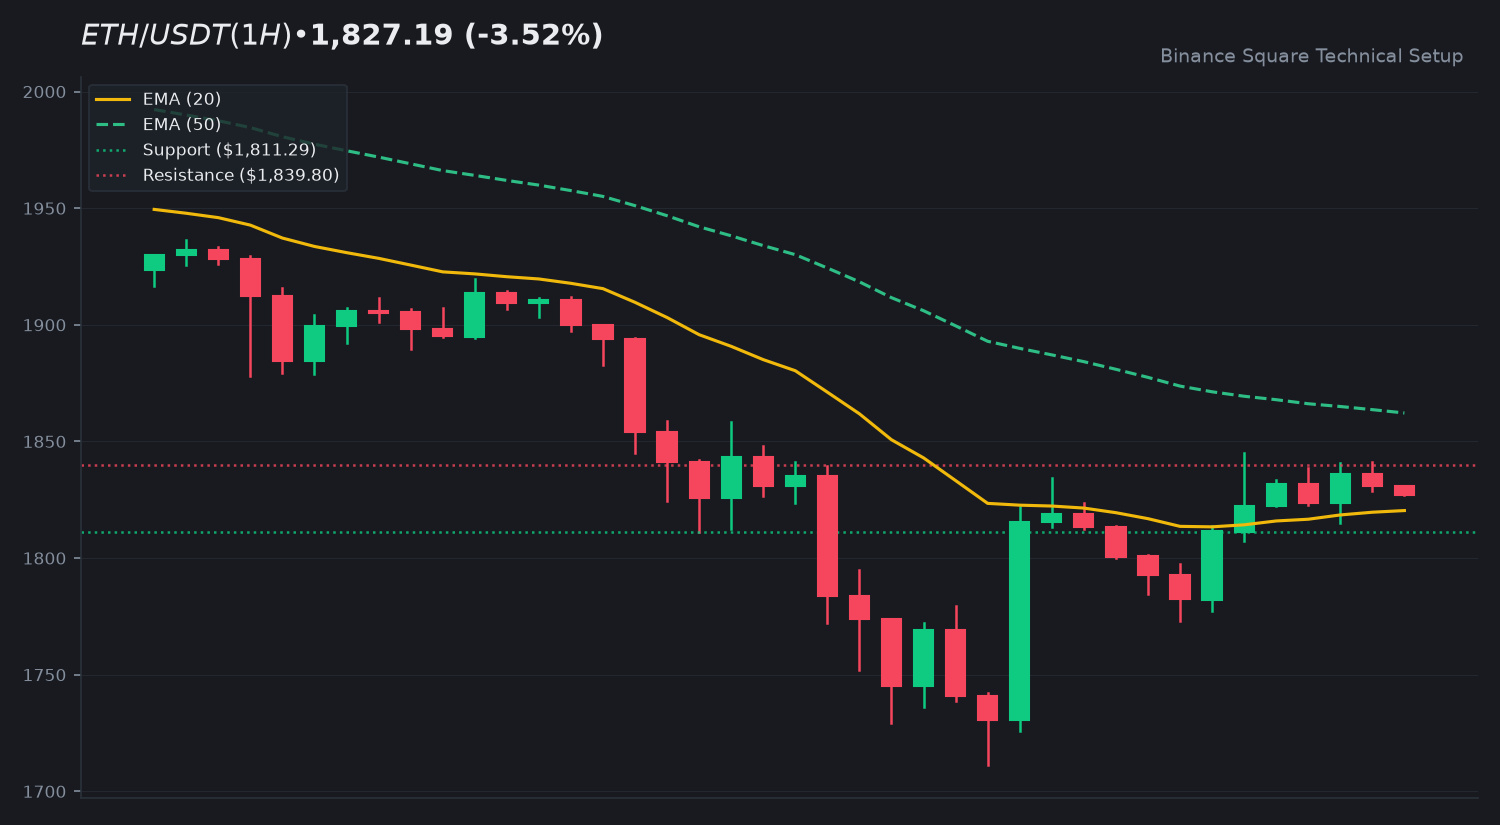
11
·
--
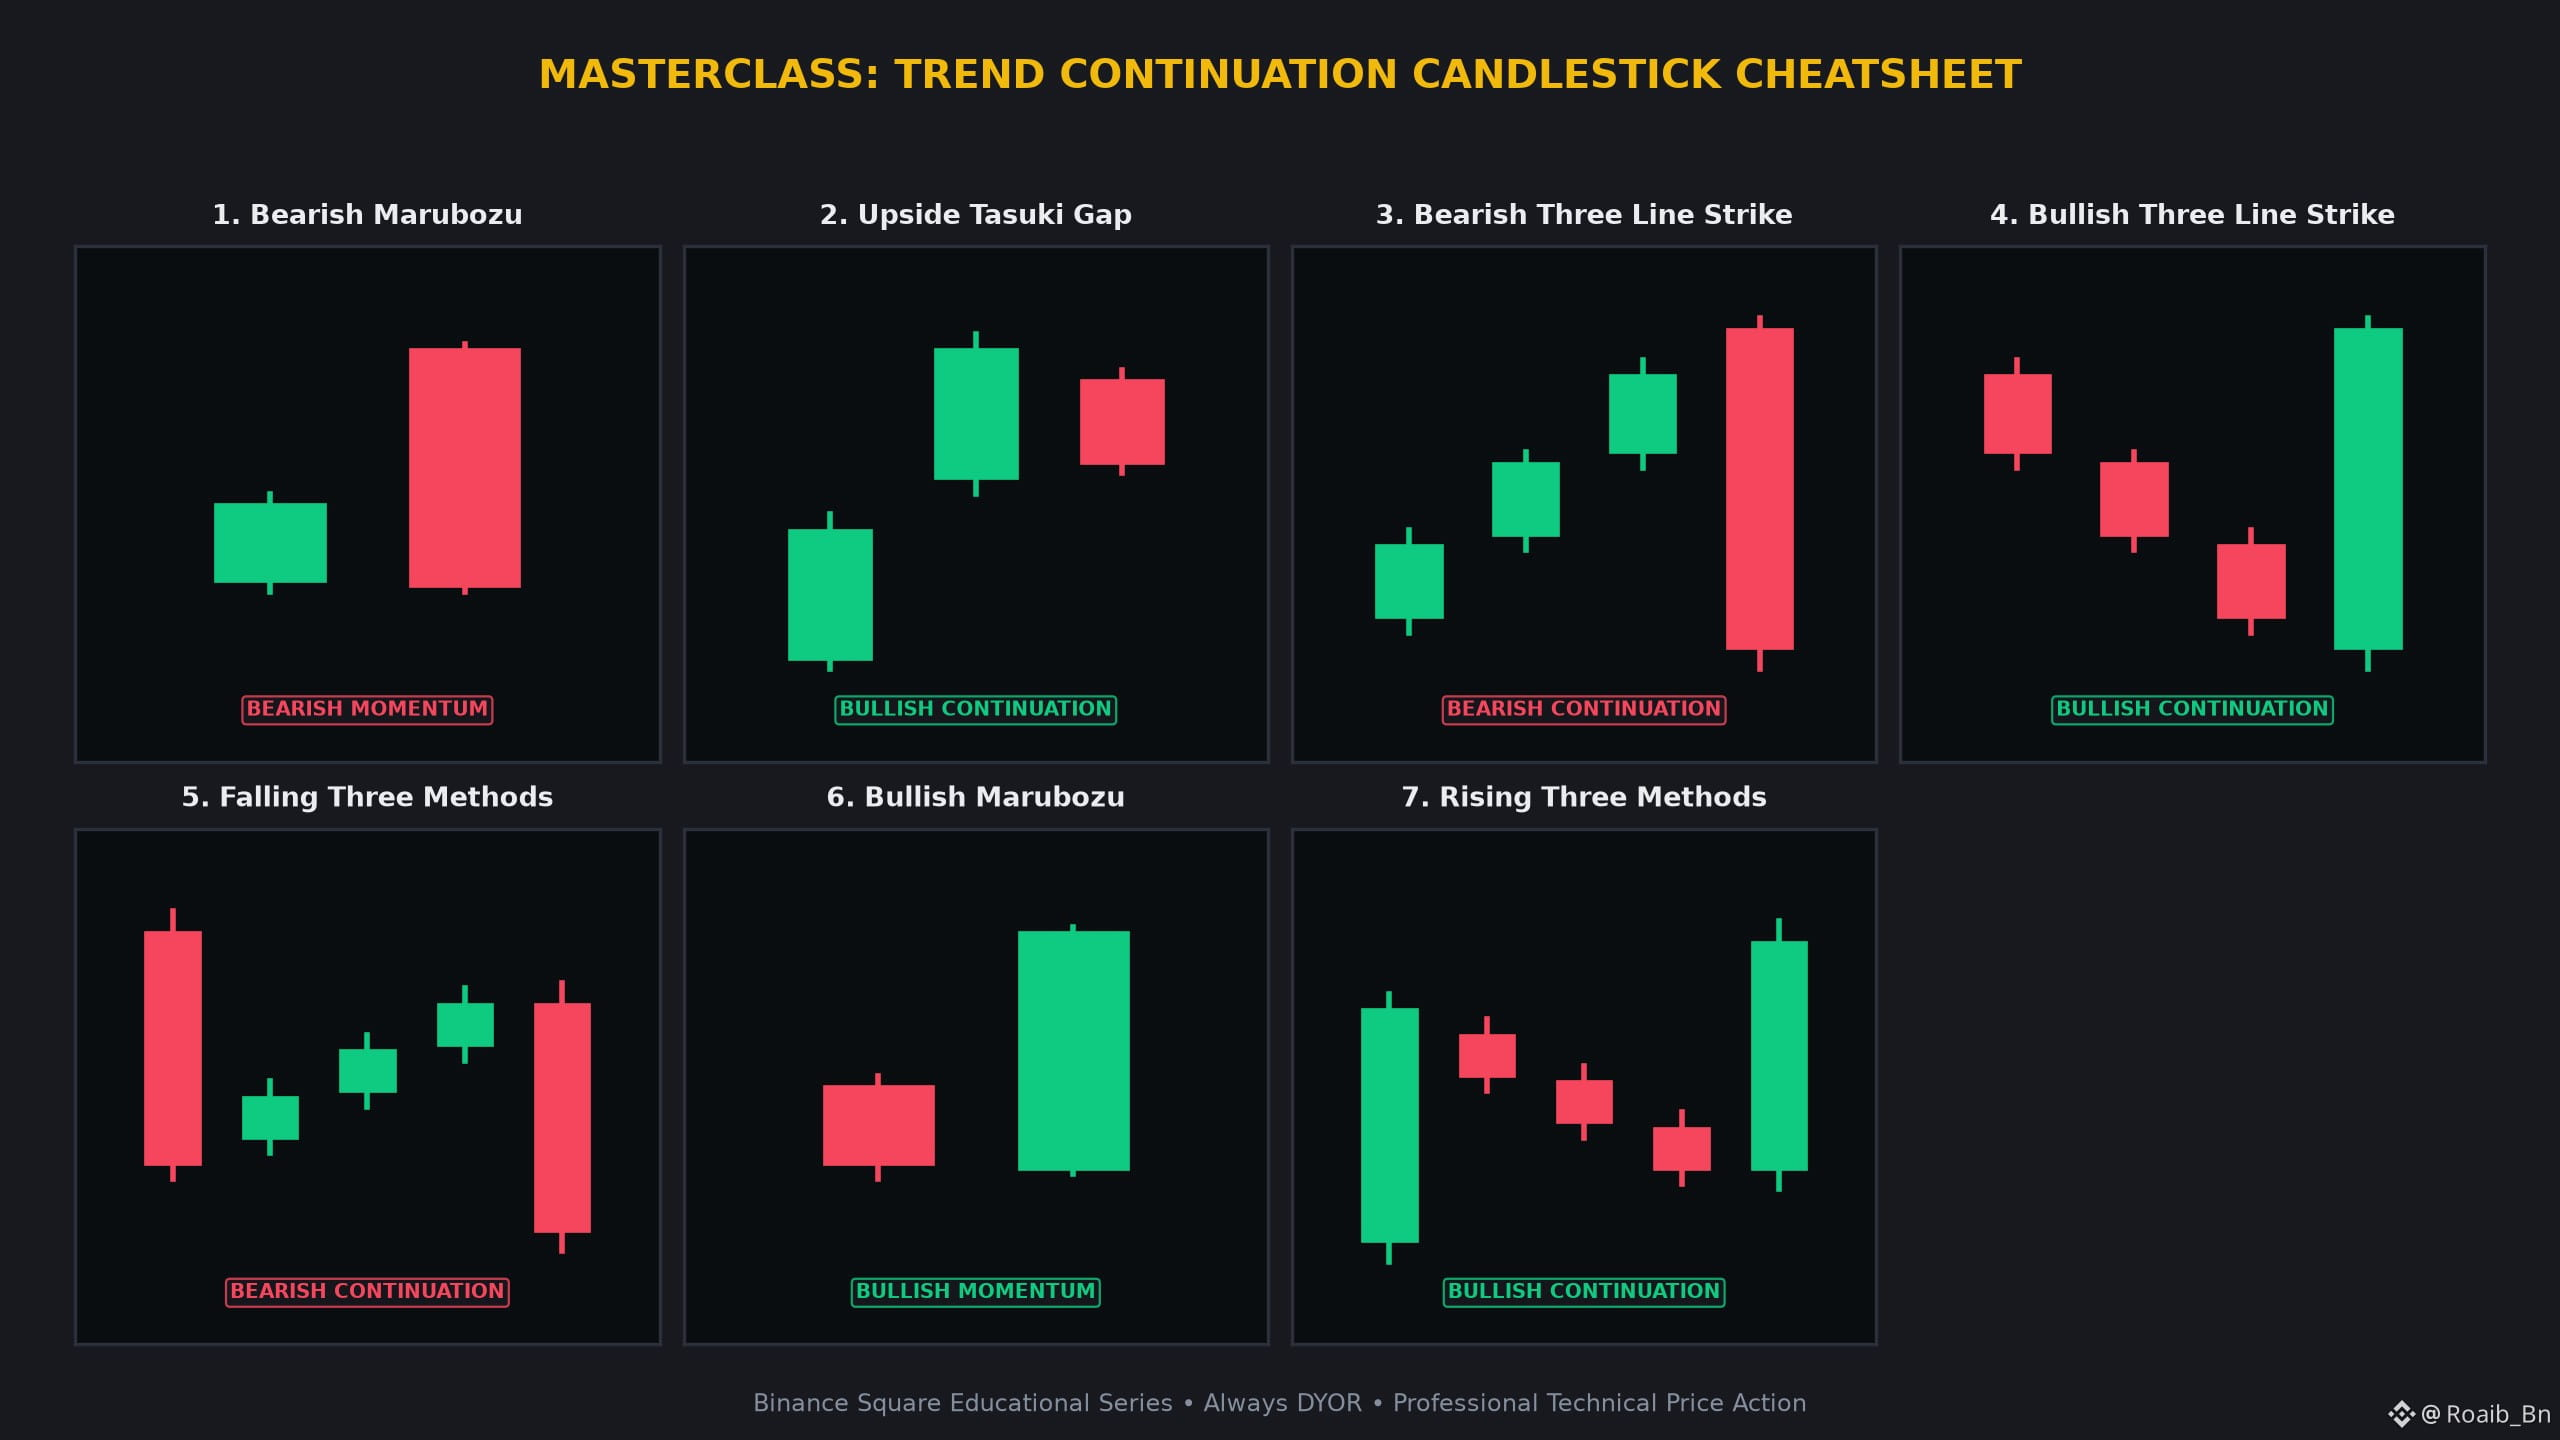
ບົດຄວາມ
🚨 RIDE THE MOMENTUM: 7 BULLISH CONTINUATION CANDLESTICKS EVERY TRADER NEEDS 👇🚨 RIDE THE MOMENTUM: 7 BULLISH CONTINUATION CANDLESTICKS EVERY TRADER NEEDS 👇
Understand price action at an institutional level. Here is your definitive masterclass on the most reliable candlestick formations every crypto trader must master.
1 🧱 Bearish Marubozu 🧱
• Anatomy: Full solid red candle body with zero wicks.
• Psychology: Institutional liquidation with zero buyer resistance.
• Confirmation: Watch for a test of the low as a potential resistance zone.
2 📈 Upside Tasuki Gap 📈
• Anatomy: Green candle gaps above prior green, followed by small red candle opening inside the body.
• Psychology: Gap-up remains unfilled, confirming buyer appetite.
• Confirmation: Breakout above the small red candle high.
3 ⛈️ Bearish Three Line Strike ⛈️
• Anatomy: Three rising green candles wiped out by one massive red engulfing candle.
• Psychology: Retail rally obliterated by institutional block selling.
• Confirmation: Sustained move below the massive red candle low.
4 ⚡ Bullish Three Line Strike ⚡
• Anatomy: Three falling red candles erased by one massive green candle.
• Psychology: Seller pressure engulfed in a violent short-covering spike.
• Confirmation: Retest of the green candle body as support.
5 📉 Falling Three Methods 📉
• Anatomy: Tall red candle, three small rising green bars, followed by a steep red drop.
• Psychology: Weak corrective bounce crushed by dominant sellers.
• Confirmation: Break below the initial tall red candle support level.
6 🔋 Bullish Marubozu 🔋
• Anatomy: Full solid green candle body with no shadows.
• Psychology: Unconditional aggressive buyer dominance.
• Confirmation: Continued momentum on high relative volume.
7 🚀 Rising Three Methods 🚀
• Anatomy: Tall green candle, three small falling red pullback candles, followed by a strong green surge.
• Psychology: Healthy consolidation before the trend resumes.
• Confirmation: Price closing above the high of the first green candle.
💡 Why Master These Candlestick Formations?
• Spot high-probability phases before the retail crowd.
• Define exact risk-to-reward boundaries with clear invalidation levels.
• Combine with volume confirmation and dynamic moving averages.
💬 Community Masterclass Discussion:
Which of these 7 candlestick setups has yielded the highest win-rate in your crypto journey? Share your thoughts below! 👇
⚠️ Educational Masterclass Disclaimer:
This content is for educational purposes only and does not constitute financial advice (NFA). Cryptocurrency markets carry inherent volatility. Always manage risk prudently and conduct your own research (DYOR).
$BTC $ETH BNB #BinanceSquare #CryptoTrading
🚨 RIDE THE MOMENTUM: 7 BULLISH CONTINUATION CANDLESTICKS EVERY TRADER NEEDS 👇
🚨 RIDE THE MOMENTUM: 7 BULLISH CONTINUATION CANDLESTICKS EVERY TRADER NEEDS 👇
Understand price action at an institutional level. Here is your definitive masterclass on the most reliable candlestick formations every crypto trader must master.
1 🧱 Bearish Marubozu 🧱
• Anatomy: Full solid red candle body with zero wicks.
• Psychology: Institutional liquidation with zero buyer resistance.
• Confirmation: Watch for a test of the low as a potential resistance zone.
2 📈 Upside Tasuki Gap 📈
• Anatomy: Green candle gaps above prior green, followed by small red candle opening inside the body.
• Psychology: Gap-up remains unfilled, confirming buyer appetite.
• Confirmation: Breakout above the small red candle high.
3 ⛈️ Bearish Three Line Strike ⛈️
• Anatomy: Three rising green candles wiped out by one massive red engulfing candle.
• Psychology: Retail rally obliterated by institutional block selling.
• Confirmation: Sustained move below the massive red candle low.
4 ⚡ Bullish Three Line Strike ⚡
• Anatomy: Three falling red candles erased by one massive green candle.
• Psychology: Seller pressure engulfed in a violent short-covering spike.
• Confirmation: Retest of the green candle body as support.
5 📉 Falling Three Methods 📉
• Anatomy: Tall red candle, three small rising green bars, followed by a steep red drop.
• Psychology: Weak corrective bounce crushed by dominant sellers.
• Confirmation: Break below the initial tall red candle support level.
6 🔋 Bullish Marubozu 🔋
• Anatomy: Full solid green candle body with no shadows.
• Psychology: Unconditional aggressive buyer dominance.
• Confirmation: Continued momentum on high relative volume.
7 🚀 Rising Three Methods 🚀
• Anatomy: Tall green candle, three small falling red pullback candles, followed by a strong green surge.
• Psychology: Healthy consolidation before the trend resumes.
• Confirmation: Price closing above the high of the first green candle.
💡 Why Master These Candlestick Formations?
• Spot high-probability phases before the retail crowd.
• Define exact risk-to-reward boundaries with clear invalidation levels.
• Combine with volume confirmation and dynamic moving averages.
💬 Community Masterclass Discussion:
Which of these 7 candlestick setups has yielded the highest win-rate in your crypto journey? Share your thoughts below! 👇
⚠️ Educational Masterclass Disclaimer:
This content is for educational purposes only and does not constitute financial advice (NFA). Cryptocurrency markets carry inherent volatility. Always manage risk prudently and conduct your own research (DYOR).
$BTC $ETH BNB #BinanceSquare #CryptoTrading
Understand price action at an institutional level. Here is your definitive masterclass on the most reliable candlestick formations every crypto trader must master.
1 🧱 Bearish Marubozu 🧱
• Anatomy: Full solid red candle body with zero wicks.
• Psychology: Institutional liquidation with zero buyer resistance.
• Confirmation: Watch for a test of the low as a potential resistance zone.
2 📈 Upside Tasuki Gap 📈
• Anatomy: Green candle gaps above prior green, followed by small red candle opening inside the body.
• Psychology: Gap-up remains unfilled, confirming buyer appetite.
• Confirmation: Breakout above the small red candle high.
3 ⛈️ Bearish Three Line Strike ⛈️
• Anatomy: Three rising green candles wiped out by one massive red engulfing candle.
• Psychology: Retail rally obliterated by institutional block selling.
• Confirmation: Sustained move below the massive red candle low.
4 ⚡ Bullish Three Line Strike ⚡
• Anatomy: Three falling red candles erased by one massive green candle.
• Psychology: Seller pressure engulfed in a violent short-covering spike.
• Confirmation: Retest of the green candle body as support.
5 📉 Falling Three Methods 📉
• Anatomy: Tall red candle, three small rising green bars, followed by a steep red drop.
• Psychology: Weak corrective bounce crushed by dominant sellers.
• Confirmation: Break below the initial tall red candle support level.
6 🔋 Bullish Marubozu 🔋
• Anatomy: Full solid green candle body with no shadows.
• Psychology: Unconditional aggressive buyer dominance.
• Confirmation: Continued momentum on high relative volume.
7 🚀 Rising Three Methods 🚀
• Anatomy: Tall green candle, three small falling red pullback candles, followed by a strong green surge.
• Psychology: Healthy consolidation before the trend resumes.
• Confirmation: Price closing above the high of the first green candle.
💡 Why Master These Candlestick Formations?
• Spot high-probability phases before the retail crowd.
• Define exact risk-to-reward boundaries with clear invalidation levels.
• Combine with volume confirmation and dynamic moving averages.
💬 Community Masterclass Discussion:
Which of these 7 candlestick setups has yielded the highest win-rate in your crypto journey? Share your thoughts below! 👇
⚠️ Educational Masterclass Disclaimer:
This content is for educational purposes only and does not constitute financial advice (NFA). Cryptocurrency markets carry inherent volatility. Always manage risk prudently and conduct your own research (DYOR).
$BTC $ETH BNB #BinanceSquare #CryptoTrading
4
·
--
🌐 Crypto Market 24h Macro Pulse & Volume Overview
1. Overall Market Sentiment & Breadth
Current market conditions reflect a cautious posture as we navigate the mid-November cycle. The broader market sentiment is currently leaning toward a bearish bias, evidenced by a significant Advance/Decline ratio of 5 gainers against 45 losers within the top 50 assets. Total 24h volume across these leaders sits at 6,236,450,748 USDT, suggesting that liquidity remains active despite the downward price pressure across most major caps.
2. Top Volume Leaders
• $BTC : 65388.01 (-2.65%)
• $ETH : 1830.63 (-3.96%)
• SOL : 72.35 (-4.42%)
• XRP : 0.9645 (-2.44%)
• ZEC : 920.4 (+2.35%)
3. Prudent Trader Notes
Technical momentum indicates that major assets are testing established support floors. With $BTC failing to maintain higher ground, participants are monitoring for potential consolidation phases. ZEC stands out as an outlier with positive price action, decoupling from the broader trend. Traders should keep a close watch on volume profiles near current support levels to gauge if buying interest emerges or if the downward trend persists.
4. Community Discussion
Given the current distribution of volume and the prevailing bearish sentiment, what key support levels are you monitoring to determine if the market is finding a stable floor?
⚠️ Educational analysis only. Not financial advice (NFA). DYOR.
BinanceSquare #CryptoMarket
🌐 Crypto Market 24h Macro Pulse & Volume Overview
1. Overall Market Sentiment & Breadth
Current market conditions reflect a cautious posture as we navigate the mid-November cycle. The broader market sentiment is currently leaning toward a bearish bias, evidenced by a significant Advance/Decline ratio of 5 gainers against 45 losers within the top 50 assets. Total 24h volume across these leaders sits at 6,236,450,748 USDT, suggesting that liquidity remains active despite the downward price pressure across most major caps.
2. Top Volume Leaders
• $BTC : 65388.01 (-2.65%)
• $ETH : 1830.63 (-3.96%)
• SOL : 72.35 (-4.42%)
• XRP : 0.9645 (-2.44%)
• ZEC : 920.4 (+2.35%)
3. Prudent Trader Notes
Technical momentum indicates that major assets are testing established support floors. With $BTC failing to maintain higher ground, participants are monitoring for potential consolidation phases. ZEC stands out as an outlier with positive price action, decoupling from the broader trend. Traders should keep a close watch on volume profiles near current support levels to gauge if buying interest emerges or if the downward trend persists.
4. Community Discussion
Given the current distribution of volume and the prevailing bearish sentiment, what key support levels are you monitoring to determine if the market is finding a stable floor?
⚠️ Educational analysis only. Not financial advice (NFA). DYOR.
BinanceSquare #CryptoMarket
1. Overall Market Sentiment & Breadth
Current market conditions reflect a cautious posture as we navigate the mid-November cycle. The broader market sentiment is currently leaning toward a bearish bias, evidenced by a significant Advance/Decline ratio of 5 gainers against 45 losers within the top 50 assets. Total 24h volume across these leaders sits at 6,236,450,748 USDT, suggesting that liquidity remains active despite the downward price pressure across most major caps.
2. Top Volume Leaders
• $BTC : 65388.01 (-2.65%)
• $ETH : 1830.63 (-3.96%)
• SOL : 72.35 (-4.42%)
• XRP : 0.9645 (-2.44%)
• ZEC : 920.4 (+2.35%)
3. Prudent Trader Notes
Technical momentum indicates that major assets are testing established support floors. With $BTC failing to maintain higher ground, participants are monitoring for potential consolidation phases. ZEC stands out as an outlier with positive price action, decoupling from the broader trend. Traders should keep a close watch on volume profiles near current support levels to gauge if buying interest emerges or if the downward trend persists.
4. Community Discussion
Given the current distribution of volume and the prevailing bearish sentiment, what key support levels are you monitoring to determine if the market is finding a stable floor?
⚠️ Educational analysis only. Not financial advice (NFA). DYOR.
BinanceSquare #CryptoMarket
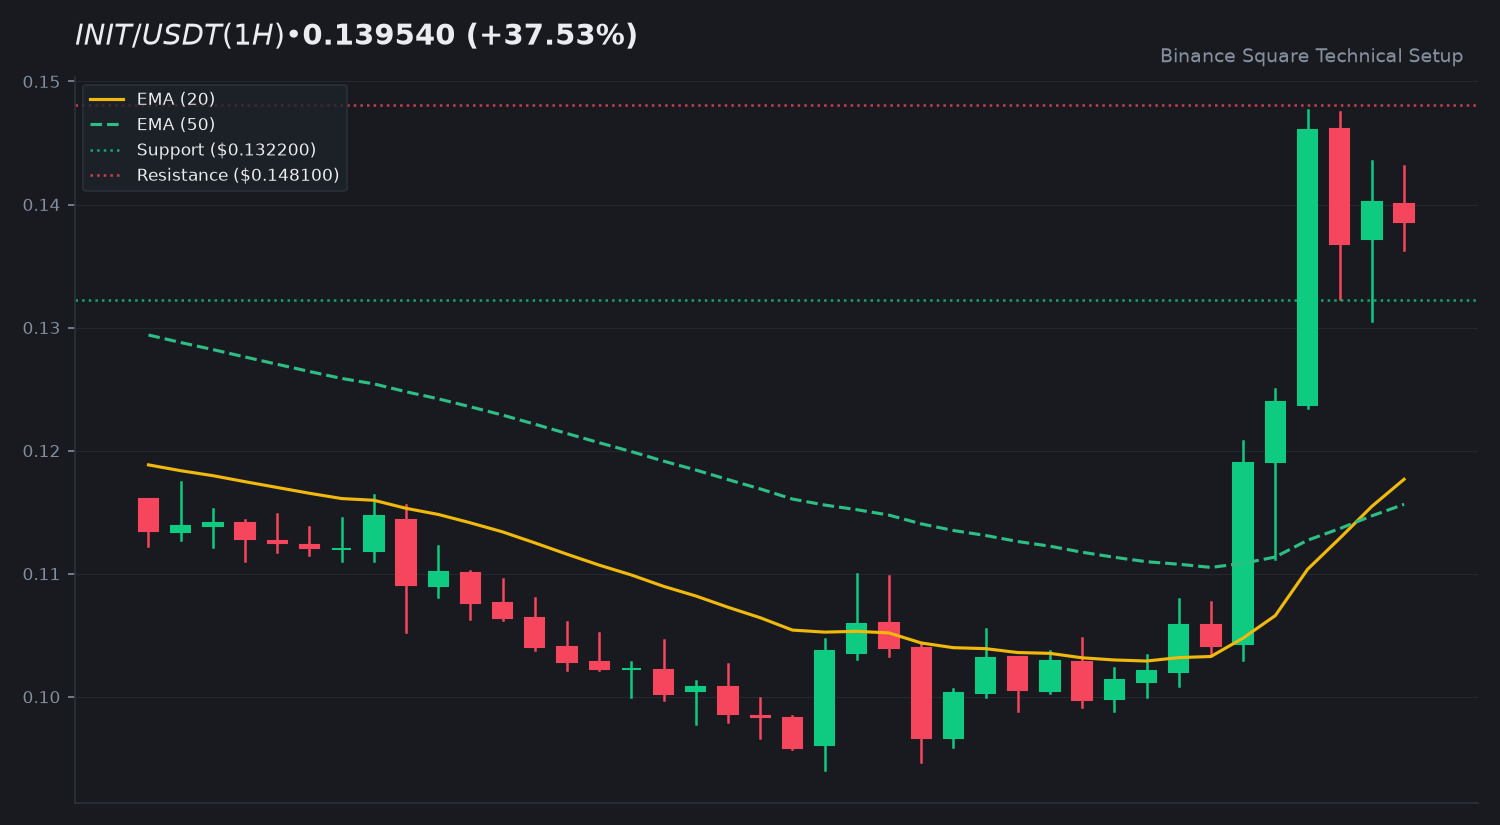
8
ເຂົ້າສູ່ລະບົບເພື່ອສຳຫຼວດເນື້ອຫາເພີ່ມເຕີມ
ເຂົ້າຮ່ວມກຸ່ມຜູ້ໃຊ້ຄຣິບໂຕທົ່ວໂລກໃນ Binance Square.
⚡️ ໄດ້ຮັບຂໍ້ມູນຫຼ້າສຸດ ແລະ ທີ່ມີປະໂຫຍດກ່ຽວກັບຄຣິບໂຕ.
💬 ໄດ້ຮັບຄວາມໄວ້ວາງໃຈຈາກຕະຫຼາດແລກປ່ຽນຄຣິບໂຕທີ່ໃຫຍ່ທີ່ສຸດໃນໂລກ.
👍 ຄົ້ນຫາຂໍ້ມູນເຊີງເລິກທີ່ແທ້ຈາກນັກສ້າງທີ່ໄດ້ຮັບການຢືນຢັນ.
ອີເມວ / ເບີໂທລະສັບ
ຫົວຂໍ້ທີ່ກໍາລັງນິຍົມ
A Packed Week of Earnings and Data Tests Markets
22,552 ຄັ້ງທີ່ເບິ່ງ
178 ກຳລັງສົນທະນາ
🚨🇺🇸 BIG WEEK AHEAD FOR THE MARKETS!
Markets are pricing in a Fed rate hike in December and $BTC could see some big moves next week.
Here's what's coming:
• Monday: Fed Chair Warsh speaks
• Tuesday: US Retail Sales + $NVDA earnings
• Wednesday: FOMC Minutes
• Thursday: Jobless Claims + Philly Fed Index
• Friday: Consumer Sentiment + Fed speeches
All eyes on $BTC as another important week begins.
#bitcoin
Mookie
·7 ຖືກໃຈ
·4.1k ຄັ້ງທີ່ເບິ່ງ
AnthropicIPOTestsInvestorAppetiteForAI
20,580 ຄັ້ງທີ່ເບິ່ງ
428 ກຳລັງສົນທະນາ
HuangReportedlyConsidersReturnToNvidia
44,787 ຄັ້ງທີ່ເບິ່ງ
589 ກຳລັງສົນທະນາ