
NASAlgoTrading-COM
4.7k ໂພສ

NASAlgoTrading-COM
ລາຍງານ
ບລັອກຜູ້ໃຊ້
https://nasalgotrading.com does all automagically for you.
0 ກໍາລັງຕິດຕາມ
179 ຜູ້ຕິດຕາມ
160 Liked
ໂພສ
ທັງໝົດ
ວົງຢືມ
ວີດີໂອ
🚀 $ALGO 🟢 Buy : 0.090895 – 0.09275 | Clean
This ALGOUSDT chart just caught my attention.
📊 Technical Analysis (15M):
Here's the deal. Algo is sitting in a tight zone between 0.090895 and 0.09275. Structure speaks for itself. Price is holding above support at 0.0899675, and that's the line. No debate. We've got momentum curling up off the lows, volume ticking in, and the 15M candles are compressing right under resistance at 0.0922816125. Clear that and 0.092740725 is next. Buyers are stepping in. 📊🔥 Sellers had their shot and they missed it. This is a classic continuation — higher lows, tight range, pressure building. That is where I want to be. Not chasing, not guessing. The chart is telling me the direction. I'm just listening.
🎯 Trade Plan:
Range entry: 0.090895-0.09275
Level 1: 0.0922816125
Level 2: 0.092740725
Level 3: 0.0931998375
Level 4: 0.09365895
🔴 Invalidation: 0.0899675
Invalidation sits right at 0.0899675. Clean level. Lose that and the whole falls apart — no reason to stay. Risk there is tight, the upside is stacked in four Levels: . Solid risk-to-reward. I don't argue with the chart. It says hold above, I hold. It says break down, I'm out. Simple.
Discipline is everything here. Stick to the levels. Don't move your invalidation. Don't get greedy past the plan. The market rewards patience, not impulse. Either it plays out or it doesn't. Manage the trade you have, not the one you imagined. Stay sharp and structure.
📌 Crypto Alert
🚀 $ALGO 🟢 Buy : 0.090895 – 0.09275 | Clean
This ALGOUSDT chart just caught my attention.
📊 Technical Analysis (15M):
Here's the deal. Algo is sitting in a tight zone between 0.090895 and 0.09275. Structure speaks for itself. Price is holding above support at 0.0899675, and that's the line. No debate. We've got momentum curling up off the lows, volume ticking in, and the 15M candles are compressing right under resistance at 0.0922816125. Clear that and 0.092740725 is next. Buyers are stepping in. 📊🔥 Sellers had their shot and they missed it. This is a classic continuation — higher lows, tight range, pressure building. That is where I want to be. Not chasing, not guessing. The chart is telling me the direction. I'm just listening.
🎯 Trade Plan:
Range entry: 0.090895-0.09275
Level 1: 0.0922816125
Level 2: 0.092740725
Level 3: 0.0931998375
Level 4: 0.09365895
🔴 Invalidation: 0.0899675
Invalidation sits right at 0.0899675. Clean level. Lose that and the whole falls apart — no reason to stay. Risk there is tight, the upside is stacked in four Levels: . Solid risk-to-reward. I don't argue with the chart. It says hold above, I hold. It says break down, I'm out. Simple.
Discipline is everything here. Stick to the levels. Don't move your invalidation. Don't get greedy past the plan. The market rewards patience, not impulse. Either it plays out or it doesn't. Manage the trade you have, not the one you imagined. Stay sharp and structure.
📌 Crypto Alert
This ALGOUSDT chart just caught my attention.
📊 Technical Analysis (15M):
Here's the deal. Algo is sitting in a tight zone between 0.090895 and 0.09275. Structure speaks for itself. Price is holding above support at 0.0899675, and that's the line. No debate. We've got momentum curling up off the lows, volume ticking in, and the 15M candles are compressing right under resistance at 0.0922816125. Clear that and 0.092740725 is next. Buyers are stepping in. 📊🔥 Sellers had their shot and they missed it. This is a classic continuation — higher lows, tight range, pressure building. That is where I want to be. Not chasing, not guessing. The chart is telling me the direction. I'm just listening.
🎯 Trade Plan:
Range entry: 0.090895-0.09275
Level 1: 0.0922816125
Level 2: 0.092740725
Level 3: 0.0931998375
Level 4: 0.09365895
🔴 Invalidation: 0.0899675
Invalidation sits right at 0.0899675. Clean level. Lose that and the whole falls apart — no reason to stay. Risk there is tight, the upside is stacked in four Levels: . Solid risk-to-reward. I don't argue with the chart. It says hold above, I hold. It says break down, I'm out. Simple.
Discipline is everything here. Stick to the levels. Don't move your invalidation. Don't get greedy past the plan. The market rewards patience, not impulse. Either it plays out or it doesn't. Manage the trade you have, not the one you imagined. Stay sharp and structure.
📌 Crypto Alert
1
🚀 NEW TRADING SIGNAL ALERT
NASAlgoTrading has identified a high-probability trading setup!
Get the latest entry, stop-loss, and take-profit levels.
Like, Share and Follow for more signals!
#NASAlgoTrading #TradingSignals
🚀 NEW TRADING SIGNAL ALERT
NASAlgoTrading has identified a high-probability trading setup!
Get the latest entry, stop-loss, and take-profit levels.
Like, Share and Follow for more signals!
#NASAlgoTrading #TradingSignals
NASAlgoTrading has identified a high-probability trading setup!
Get the latest entry, stop-loss, and take-profit levels.
Like, Share and Follow for more signals!
#NASAlgoTrading #TradingSignals
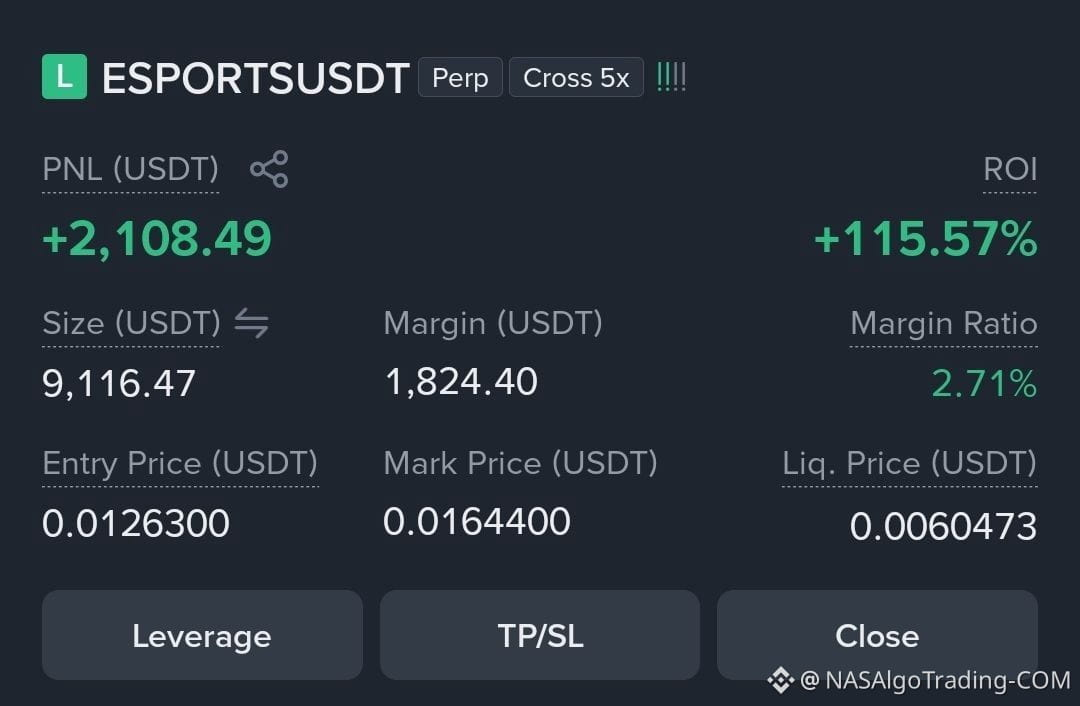
🚀 NEW TRADING SIGNAL ALERT
NASAlgoTrading has identified a high-probability trading setup!
Get the latest entry, stop-loss, and take-profit levels.
Like, Share and Follow for more signals!
#NASAlgoTrading #TradingSignals
🚀 NEW TRADING SIGNAL ALERT
NASAlgoTrading has identified a high-probability trading setup!
Get the latest entry, stop-loss, and take-profit levels.
Like, Share and Follow for more signals!
#NASAlgoTrading #TradingSignals
NASAlgoTrading has identified a high-probability trading setup!
Get the latest entry, stop-loss, and take-profit levels.
Like, Share and Follow for more signals!
#NASAlgoTrading #TradingSignals
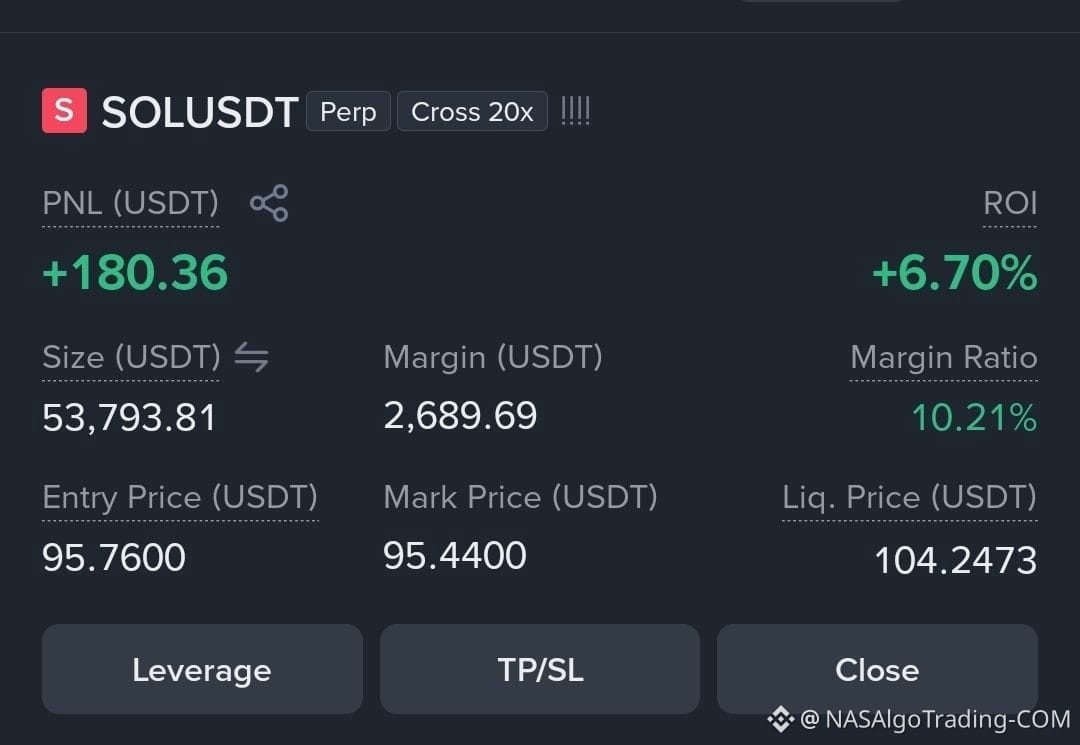
🚀 NEW TRADING SIGNAL ALERT
NASAlgoTrading has identified a high-probability trading setup!
Get the latest entry, stop-loss, and take-profit levels.
Like, Share and Follow for more signals!
#NASAlgoTrading #TradingSignals
🚀 NEW TRADING SIGNAL ALERT
NASAlgoTrading has identified a high-probability trading setup!
Get the latest entry, stop-loss, and take-profit levels.
Like, Share and Follow for more signals!
#NASAlgoTrading #TradingSignals
NASAlgoTrading has identified a high-probability trading setup!
Get the latest entry, stop-loss, and take-profit levels.
Like, Share and Follow for more signals!
#NASAlgoTrading #TradingSignals
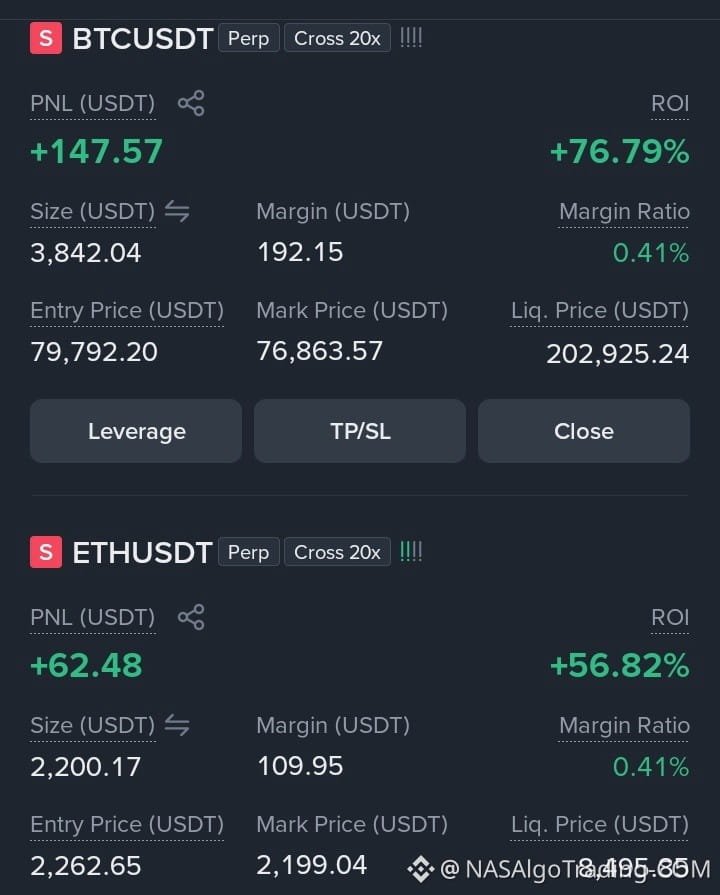
🚀 NEW TRADING SIGNAL ALERT
NASAlgoTrading has identified a high-probability trading setup!
Get the latest entry, stop-loss, and take-profit levels.
Like, Share and Follow for more signals!
#NASAlgoTrading #TradingSignals
🚀 NEW TRADING SIGNAL ALERT
NASAlgoTrading has identified a high-probability trading setup!
Get the latest entry, stop-loss, and take-profit levels.
Like, Share and Follow for more signals!
#NASAlgoTrading #TradingSignals
NASAlgoTrading has identified a high-probability trading setup!
Get the latest entry, stop-loss, and take-profit levels.
Like, Share and Follow for more signals!
#NASAlgoTrading #TradingSignals
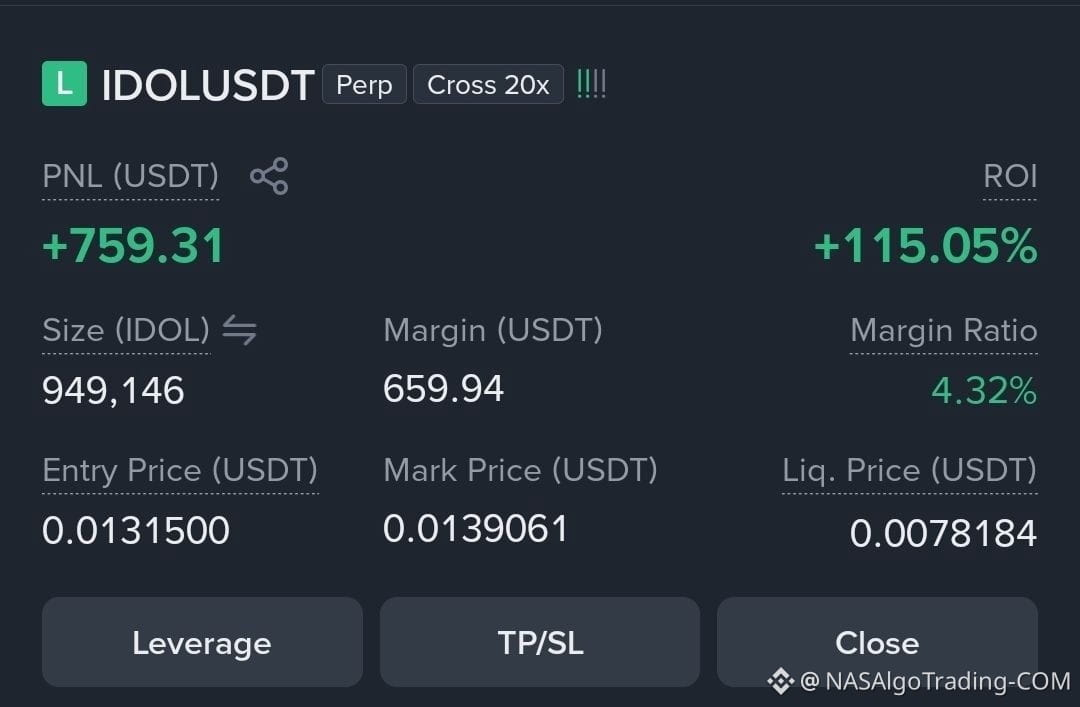
🚀 NEW TRADING SIGNAL ALERT
NASAlgoTrading has identified a high-probability trading setup!
Get the latest entry, stop-loss, and take-profit levels.
Like, Share and Follow for more signals!
#NASAlgoTrading #TradingSignals
🚀 NEW TRADING SIGNAL ALERT
NASAlgoTrading has identified a high-probability trading setup!
Get the latest entry, stop-loss, and take-profit levels.
Like, Share and Follow for more signals!
#NASAlgoTrading #TradingSignals
NASAlgoTrading has identified a high-probability trading setup!
Get the latest entry, stop-loss, and take-profit levels.
Like, Share and Follow for more signals!
#NASAlgoTrading #TradingSignals
1
🚀 NEW TRADING SIGNAL ALERT
NASAlgoTrading has identified a high-probability trading setup!
Get the latest entry, stop-loss, and take-profit levels.
Like, Share and Follow for more signals!
#NASAlgoTrading #TradingSignals
🚀 NEW TRADING SIGNAL ALERT
NASAlgoTrading has identified a high-probability trading setup!
Get the latest entry, stop-loss, and take-profit levels.
Like, Share and Follow for more signals!
#NASAlgoTrading #TradingSignals
NASAlgoTrading has identified a high-probability trading setup!
Get the latest entry, stop-loss, and take-profit levels.
Like, Share and Follow for more signals!
#NASAlgoTrading #TradingSignals
🚀 $ACE 🟢 Buy : 0.128478 – 0.1311 | Clean
ACEUSDT has been building something clean here.
📊 Technical Analysis (15M):
Price is coiling right below 0.1311 and the structure speaks for itself 🔍. Higher lows stacking since the dip, sellers running out of steam. This is what a base looks like before it breaks. No drama, just compression. People keep waiting for a perfect candle. It already printed.
Support at 0.127167 got defended hard 🛡️. Every tap got bought back fast. Volume dried up on the pullbacks, which is exactly what you want to see. Sellers are exhausted. No debate 👊. When support holds and volume fades on red candles, that tells a story. Buyers are sitting, not leaving.
The is simple. Hold above the zone, and buyers push toward the upper range ⚡. If momentum kicks in, we run the ladder. Let's walk the Levels: 🎯
Level 1: 0.130437945 - First hurdle, clears the immediate resistance sitting right on top of us.
Level 2: 0.13108689 - Gatekeeper level. Break this and structure flips 💪.
Level 3: 0.131735835 - Momentum shifts in our favor once we're here. Sellers start folding.
Level 4: 0.13238478 - The runner. This is where the move stretches its legs 🚀.
🔴 Invalidation: 0.127167
Invalidation sits at 0.127167. Lose that and the whole is dead. No catching falling knives. Structure breaks, we walk away. Simple.
📌 Crypto Alert
🚀 $ACE 🟢 Buy : 0.128478 – 0.1311 | Clean
ACEUSDT has been building something clean here.
📊 Technical Analysis (15M):
Price is coiling right below 0.1311 and the structure speaks for itself 🔍. Higher lows stacking since the dip, sellers running out of steam. This is what a base looks like before it breaks. No drama, just compression. People keep waiting for a perfect candle. It already printed.
Support at 0.127167 got defended hard 🛡️. Every tap got bought back fast. Volume dried up on the pullbacks, which is exactly what you want to see. Sellers are exhausted. No debate 👊. When support holds and volume fades on red candles, that tells a story. Buyers are sitting, not leaving.
The is simple. Hold above the zone, and buyers push toward the upper range ⚡. If momentum kicks in, we run the ladder. Let's walk the Levels: 🎯
Level 1: 0.130437945 - First hurdle, clears the immediate resistance sitting right on top of us.
Level 2: 0.13108689 - Gatekeeper level. Break this and structure flips 💪.
Level 3: 0.131735835 - Momentum shifts in our favor once we're here. Sellers start folding.
Level 4: 0.13238478 - The runner. This is where the move stretches its legs 🚀.
🔴 Invalidation: 0.127167
Invalidation sits at 0.127167. Lose that and the whole is dead. No catching falling knives. Structure breaks, we walk away. Simple.
📌 Crypto Alert
ACEUSDT has been building something clean here.
📊 Technical Analysis (15M):
Price is coiling right below 0.1311 and the structure speaks for itself 🔍. Higher lows stacking since the dip, sellers running out of steam. This is what a base looks like before it breaks. No drama, just compression. People keep waiting for a perfect candle. It already printed.
Support at 0.127167 got defended hard 🛡️. Every tap got bought back fast. Volume dried up on the pullbacks, which is exactly what you want to see. Sellers are exhausted. No debate 👊. When support holds and volume fades on red candles, that tells a story. Buyers are sitting, not leaving.
The is simple. Hold above the zone, and buyers push toward the upper range ⚡. If momentum kicks in, we run the ladder. Let's walk the Levels: 🎯
Level 1: 0.130437945 - First hurdle, clears the immediate resistance sitting right on top of us.
Level 2: 0.13108689 - Gatekeeper level. Break this and structure flips 💪.
Level 3: 0.131735835 - Momentum shifts in our favor once we're here. Sellers start folding.
Level 4: 0.13238478 - The runner. This is where the move stretches its legs 🚀.
🔴 Invalidation: 0.127167
Invalidation sits at 0.127167. Lose that and the whole is dead. No catching falling knives. Structure breaks, we walk away. Simple.
📌 Crypto Alert
3
🚀 $SAND 🟢 Buy : 0.0438256 – 0.04472 | Clean
Alright, SANDUSDT is looking interesting here.
📊 Technical Analysis (15M):
SANDUSDT is holding a clean base above 0.0433784 support, and the 15-minute structure is starting to lean . Price is pressing into a tight range between the 0.0438256-0.04472, with sellers failing to push it lower on each retest. Momentum is building quietly — nothing explosive yet, but the higher lows are there for anyone paying attention. The resistance levels at 0.044494164 and 0.044715528 are the first real tests. 📈 If price clears those with volume, the path toward the higher Levels: opens up fast. What I like most is the structure: support is defined and the invalidation is close, so risk stays tight. This is the kind of where patience pays. Let it come to you. 🔍
🎯 Trade Plan:
Range entry: 0.0438256-0.04472
Level 1: 0.044494164
Level 2: 0.044715528
Level 3: 0.044936892
Level 4: 0.045158256
🔴 Invalidation: 0.0433784
The invalidation sits at 0.0433784, just below the base that's been holding this together. If that level breaks, the thesis is dead and there's no reason to stay in the trade. Risk is defined and short, while Levels: extend well above Range entry: . That's a favorable risk-to-reward profile.
Discipline separates the profitable from the hopeful. Stick to the plan, take partials into each Levels: , and let the invalidation be your guide — not emotion. If price respects support, hold. If it doesn't, step aside without hesitation. There will always be another .
📌 Crypto Alert
🚀 $SAND 🟢 Buy : 0.0438256 – 0.04472 | Clean
Alright, SANDUSDT is looking interesting here.
📊 Technical Analysis (15M):
SANDUSDT is holding a clean base above 0.0433784 support, and the 15-minute structure is starting to lean . Price is pressing into a tight range between the 0.0438256-0.04472, with sellers failing to push it lower on each retest. Momentum is building quietly — nothing explosive yet, but the higher lows are there for anyone paying attention. The resistance levels at 0.044494164 and 0.044715528 are the first real tests. 📈 If price clears those with volume, the path toward the higher Levels: opens up fast. What I like most is the structure: support is defined and the invalidation is close, so risk stays tight. This is the kind of where patience pays. Let it come to you. 🔍
🎯 Trade Plan:
Range entry: 0.0438256-0.04472
Level 1: 0.044494164
Level 2: 0.044715528
Level 3: 0.044936892
Level 4: 0.045158256
🔴 Invalidation: 0.0433784
The invalidation sits at 0.0433784, just below the base that's been holding this together. If that level breaks, the thesis is dead and there's no reason to stay in the trade. Risk is defined and short, while Levels: extend well above Range entry: . That's a favorable risk-to-reward profile.
Discipline separates the profitable from the hopeful. Stick to the plan, take partials into each Levels: , and let the invalidation be your guide — not emotion. If price respects support, hold. If it doesn't, step aside without hesitation. There will always be another .
📌 Crypto Alert
Alright, SANDUSDT is looking interesting here.
📊 Technical Analysis (15M):
SANDUSDT is holding a clean base above 0.0433784 support, and the 15-minute structure is starting to lean . Price is pressing into a tight range between the 0.0438256-0.04472, with sellers failing to push it lower on each retest. Momentum is building quietly — nothing explosive yet, but the higher lows are there for anyone paying attention. The resistance levels at 0.044494164 and 0.044715528 are the first real tests. 📈 If price clears those with volume, the path toward the higher Levels: opens up fast. What I like most is the structure: support is defined and the invalidation is close, so risk stays tight. This is the kind of where patience pays. Let it come to you. 🔍
🎯 Trade Plan:
Range entry: 0.0438256-0.04472
Level 1: 0.044494164
Level 2: 0.044715528
Level 3: 0.044936892
Level 4: 0.045158256
🔴 Invalidation: 0.0433784
The invalidation sits at 0.0433784, just below the base that's been holding this together. If that level breaks, the thesis is dead and there's no reason to stay in the trade. Risk is defined and short, while Levels: extend well above Range entry: . That's a favorable risk-to-reward profile.
Discipline separates the profitable from the hopeful. Stick to the plan, take partials into each Levels: , and let the invalidation be your guide — not emotion. If price respects support, hold. If it doesn't, step aside without hesitation. There will always be another .
📌 Crypto Alert
🚀 $MANA 🟢 Buy : 0.0709814 – 0.07243 | Clean
Been watching MANAUSDT closely today and this stood out.
📊 Technical Analysis (15M):
Alright fam, look at this. MANA has been coiling up on the 15-minute, and the structure is starting to look clean. Price is holding above that 0.0702571 support zone, which is the line in the sand here. We've got a tight sitting between 0.0709814 and 0.07243, and honestly the reaction off this region has been steady. Momentum is building, volume is picking up on the push attempts, and the higher lows are telling me buyers are stepping in. First resistance to clear is 0.0720642285, and once we flip that, 0.072422757 opens the door for continuation. The range is compressed, which usually means a move is loading up. I'm watching for a clean break and hold above that first Levels: to confirm the next leg. 👀📈
🎯 Trade Plan:
Range entry: 0.0709814-0.07243
Level 1: 0.0720642285
Level 2: 0.072422757
Level 3: 0.0727812855
Level 4: 0.073139814
🔴 Invalidation: 0.0702571
If price loses 0.0702571, the whole is dead and I'm out. That level is where the structure breaks and buyers lose control. Risk sits right below our zone, so the risk-to-reward here is solid — we're risking a small Lower level: ice for a shot at multiple Levels: stacked above us. No point hoping if that breaks.
Stay disciplined, guys. Don't chase green candles and don't move your invalidation just because you don't want to take the loss. Set the levels, respect the levels, and let the trade come to you. One doesn't define your week — sticking to the plan does. Trade smart. 🧠
📌 Crypto Alert
🚀 $MANA 🟢 Buy : 0.0709814 – 0.07243 | Clean
Been watching MANAUSDT closely today and this stood out.
📊 Technical Analysis (15M):
Alright fam, look at this. MANA has been coiling up on the 15-minute, and the structure is starting to look clean. Price is holding above that 0.0702571 support zone, which is the line in the sand here. We've got a tight sitting between 0.0709814 and 0.07243, and honestly the reaction off this region has been steady. Momentum is building, volume is picking up on the push attempts, and the higher lows are telling me buyers are stepping in. First resistance to clear is 0.0720642285, and once we flip that, 0.072422757 opens the door for continuation. The range is compressed, which usually means a move is loading up. I'm watching for a clean break and hold above that first Levels: to confirm the next leg. 👀📈
🎯 Trade Plan:
Range entry: 0.0709814-0.07243
Level 1: 0.0720642285
Level 2: 0.072422757
Level 3: 0.0727812855
Level 4: 0.073139814
🔴 Invalidation: 0.0702571
If price loses 0.0702571, the whole is dead and I'm out. That level is where the structure breaks and buyers lose control. Risk sits right below our zone, so the risk-to-reward here is solid — we're risking a small Lower level: ice for a shot at multiple Levels: stacked above us. No point hoping if that breaks.
Stay disciplined, guys. Don't chase green candles and don't move your invalidation just because you don't want to take the loss. Set the levels, respect the levels, and let the trade come to you. One doesn't define your week — sticking to the plan does. Trade smart. 🧠
📌 Crypto Alert
Been watching MANAUSDT closely today and this stood out.
📊 Technical Analysis (15M):
Alright fam, look at this. MANA has been coiling up on the 15-minute, and the structure is starting to look clean. Price is holding above that 0.0702571 support zone, which is the line in the sand here. We've got a tight sitting between 0.0709814 and 0.07243, and honestly the reaction off this region has been steady. Momentum is building, volume is picking up on the push attempts, and the higher lows are telling me buyers are stepping in. First resistance to clear is 0.0720642285, and once we flip that, 0.072422757 opens the door for continuation. The range is compressed, which usually means a move is loading up. I'm watching for a clean break and hold above that first Levels: to confirm the next leg. 👀📈
🎯 Trade Plan:
Range entry: 0.0709814-0.07243
Level 1: 0.0720642285
Level 2: 0.072422757
Level 3: 0.0727812855
Level 4: 0.073139814
🔴 Invalidation: 0.0702571
If price loses 0.0702571, the whole is dead and I'm out. That level is where the structure breaks and buyers lose control. Risk sits right below our zone, so the risk-to-reward here is solid — we're risking a small Lower level: ice for a shot at multiple Levels: stacked above us. No point hoping if that breaks.
Stay disciplined, guys. Don't chase green candles and don't move your invalidation just because you don't want to take the loss. Set the levels, respect the levels, and let the trade come to you. One doesn't define your week — sticking to the plan does. Trade smart. 🧠
📌 Crypto Alert
🚀 $ETC 🟢 Buy : 6.8551 – 6.995 | Clean
Been watching ETCUSDT closely today and this stood out.
📊 Technical Analysis (15M):
Alright fam, let me break it down. ETC has been building a nice base here on the 15-minute chart, and I'm seeing higher lows form with buyers stepping in around the 6.8551-6.995 zone. Price dipped into this area earlier and caught a clean bounce, which tells me the bulls are defending this level. ⚡️ Resistance overhead sits at 6.95967525 and 6.9943005, and if we can push through those, it opens the door to a leg up. 📈 Volume is starting to tick up as price consolidates, momentum is shifting on the short term structure. Support at 6.78515 is the line in the sand here. Let me break it down. As long as we hold above this base, I like the odds of continuation. Eyes on the breakout confirmation. 👀
🎯 Trade Plan:
Range entry: 6.8551-6.995
Level 1: 6.95967525
Level 2: 6.9943005
Level 3: 7.02892575
Level 4: 7.063551
🔴 Invalidation: 6.78515
If we lose 6.78515, the is dead and I'm out. That level sits just below our , so the risk is tight and defined. Meanwhile the first Levels: is right in front of us, which gives a clean risk-to-reward from the jump — exactly what you want fam.
Guys, the plan only works if you actually stick to it. Set your levels, respect the invalidation, and don't get emotional if price wiggles. Protect your capital first, let the prove itself, and stay patient. Discipline beats FOMO every single time. Let's get it. 🚀
📌 Crypto Alert
🚀 $ETC 🟢 Buy : 6.8551 – 6.995 | Clean
Been watching ETCUSDT closely today and this stood out.
📊 Technical Analysis (15M):
Alright fam, let me break it down. ETC has been building a nice base here on the 15-minute chart, and I'm seeing higher lows form with buyers stepping in around the 6.8551-6.995 zone. Price dipped into this area earlier and caught a clean bounce, which tells me the bulls are defending this level. ⚡️ Resistance overhead sits at 6.95967525 and 6.9943005, and if we can push through those, it opens the door to a leg up. 📈 Volume is starting to tick up as price consolidates, momentum is shifting on the short term structure. Support at 6.78515 is the line in the sand here. Let me break it down. As long as we hold above this base, I like the odds of continuation. Eyes on the breakout confirmation. 👀
🎯 Trade Plan:
Range entry: 6.8551-6.995
Level 1: 6.95967525
Level 2: 6.9943005
Level 3: 7.02892575
Level 4: 7.063551
🔴 Invalidation: 6.78515
If we lose 6.78515, the is dead and I'm out. That level sits just below our , so the risk is tight and defined. Meanwhile the first Levels: is right in front of us, which gives a clean risk-to-reward from the jump — exactly what you want fam.
Guys, the plan only works if you actually stick to it. Set your levels, respect the invalidation, and don't get emotional if price wiggles. Protect your capital first, let the prove itself, and stay patient. Discipline beats FOMO every single time. Let's get it. 🚀
📌 Crypto Alert
Been watching ETCUSDT closely today and this stood out.
📊 Technical Analysis (15M):
Alright fam, let me break it down. ETC has been building a nice base here on the 15-minute chart, and I'm seeing higher lows form with buyers stepping in around the 6.8551-6.995 zone. Price dipped into this area earlier and caught a clean bounce, which tells me the bulls are defending this level. ⚡️ Resistance overhead sits at 6.95967525 and 6.9943005, and if we can push through those, it opens the door to a leg up. 📈 Volume is starting to tick up as price consolidates, momentum is shifting on the short term structure. Support at 6.78515 is the line in the sand here. Let me break it down. As long as we hold above this base, I like the odds of continuation. Eyes on the breakout confirmation. 👀
🎯 Trade Plan:
Range entry: 6.8551-6.995
Level 1: 6.95967525
Level 2: 6.9943005
Level 3: 7.02892575
Level 4: 7.063551
🔴 Invalidation: 6.78515
If we lose 6.78515, the is dead and I'm out. That level sits just below our , so the risk is tight and defined. Meanwhile the first Levels: is right in front of us, which gives a clean risk-to-reward from the jump — exactly what you want fam.
Guys, the plan only works if you actually stick to it. Set your levels, respect the invalidation, and don't get emotional if price wiggles. Protect your capital first, let the prove itself, and stay patient. Discipline beats FOMO every single time. Let's get it. 🚀
📌 Crypto Alert
3
🚀 $GMT 🟢 Buy : 0.00621026 – 0.006337 | Clean
Let me break down what I'm seeing on GMTUSDT.
📊 Technical Analysis (15M):
Price has been carving out a base after a pullback, and the 15-minute structure is starting to lean constructive. The sits between 0.00621026 and 0.006337, and this is where I want to see buyers step in. Support at 0.00614689 has held twice now, which tells me sellers are losing conviction. Momentum is Lower level: owly shifting, and volume is ticking up on the recent green candles. The first real test is resistance at 0.0063049982, followed by 0.0063363663. A clean reclaim of that second level opens the door higher. 📈 I'm watching for a higher low to form inside this zone before committing. 🎯
🎯 Trade Plan:
Range entry: 0.00621026-0.006337
Level 1: 0.0063049982
Level 2: 0.0063363663
Level 3: 0.0063677345
Level 4: 0.0063991026
🔴 Invalidation: 0.00614689
The invalidation sits at 0.00614689, just below the support shelf that's been holding this base together. If price closes below that, the is dead and I'm out. Risk here is defined and tight. From suggested Range entry: near 0.00627, the stop is only a fraction away, while Level 3: and Level 4: offer a clean multiple on that risk. That's the trade-off I want.
Stay disciplined. One doesn't need to be forced. If price runs without you, that's fine. If invalidation hits, take the loss and move on. The plan is the edge, not the prediction. Execute it the same way every time.
📌 Crypto Alert
🚀 $GMT 🟢 Buy : 0.00621026 – 0.006337 | Clean
Let me break down what I'm seeing on GMTUSDT.
📊 Technical Analysis (15M):
Price has been carving out a base after a pullback, and the 15-minute structure is starting to lean constructive. The sits between 0.00621026 and 0.006337, and this is where I want to see buyers step in. Support at 0.00614689 has held twice now, which tells me sellers are losing conviction. Momentum is Lower level: owly shifting, and volume is ticking up on the recent green candles. The first real test is resistance at 0.0063049982, followed by 0.0063363663. A clean reclaim of that second level opens the door higher. 📈 I'm watching for a higher low to form inside this zone before committing. 🎯
🎯 Trade Plan:
Range entry: 0.00621026-0.006337
Level 1: 0.0063049982
Level 2: 0.0063363663
Level 3: 0.0063677345
Level 4: 0.0063991026
🔴 Invalidation: 0.00614689
The invalidation sits at 0.00614689, just below the support shelf that's been holding this base together. If price closes below that, the is dead and I'm out. Risk here is defined and tight. From suggested Range entry: near 0.00627, the stop is only a fraction away, while Level 3: and Level 4: offer a clean multiple on that risk. That's the trade-off I want.
Stay disciplined. One doesn't need to be forced. If price runs without you, that's fine. If invalidation hits, take the loss and move on. The plan is the edge, not the prediction. Execute it the same way every time.
📌 Crypto Alert
Let me break down what I'm seeing on GMTUSDT.
📊 Technical Analysis (15M):
Price has been carving out a base after a pullback, and the 15-minute structure is starting to lean constructive. The sits between 0.00621026 and 0.006337, and this is where I want to see buyers step in. Support at 0.00614689 has held twice now, which tells me sellers are losing conviction. Momentum is Lower level: owly shifting, and volume is ticking up on the recent green candles. The first real test is resistance at 0.0063049982, followed by 0.0063363663. A clean reclaim of that second level opens the door higher. 📈 I'm watching for a higher low to form inside this zone before committing. 🎯
🎯 Trade Plan:
Range entry: 0.00621026-0.006337
Level 1: 0.0063049982
Level 2: 0.0063363663
Level 3: 0.0063677345
Level 4: 0.0063991026
🔴 Invalidation: 0.00614689
The invalidation sits at 0.00614689, just below the support shelf that's been holding this base together. If price closes below that, the is dead and I'm out. Risk here is defined and tight. From suggested Range entry: near 0.00627, the stop is only a fraction away, while Level 3: and Level 4: offer a clean multiple on that risk. That's the trade-off I want.
Stay disciplined. One doesn't need to be forced. If price runs without you, that's fine. If invalidation hits, take the loss and move on. The plan is the edge, not the prediction. Execute it the same way every time.
📌 Crypto Alert
1
🚀 $OP 🟢 Buy : 0.1076432 – 0.10984 | Clean
I've been tracking OPUSDT and buyers are stepping in.
📊 Technical Analysis (15M):
Notice how price stabilized after the pullback and is now grinding back toward the 0.1076432-0.10984 . Here's what matters: this zone held as support earlier, and the 15M structure is showing higher lows forming above 0.1065448. The reason this works is that momentum is shifting — buyers defending 0.1076432 tells me they're accumulating, not exiting. Watch the volume: it's ticking up on green candles while red candles are shrinking, classic absorption. Resistance sits at 0.109285308, and a clean break there opens the door to 0.109829016 and beyond. 🚀📈 The rewards patience — let price come to you inside the zone rather than chasing green candles.
🎯 Trade Plan:
Range entry: 0.1076432-0.10984
Level 1: 0.109285308
Level 2: 0.109829016
Level 3: 0.110372724
Level 4: 0.110916432
🔴 Invalidation: 0.1065448
The invalidation at 0.1065448 sits right below the structural low that's been holding this bounce together. If price breaks that, the thesis is dead — buyers failed, and the next leg down likely follows. Risk is defined and tight from the , while Levels: step up cleanly toward 0.110916432. The reason this works is the asymmetry: small invalidation, stacked upside.
Discipline matters more than prediction here. Set your levels, let the plan work, and don't chase or move your stop because a candle looks scary. If price hits 0.1065448, accept it and move on — one trade doesn't define your month. Stay patient inside the . 🎯
📌 Crypto Alert
🚀 $OP 🟢 Buy : 0.1076432 – 0.10984 | Clean
I've been tracking OPUSDT and buyers are stepping in.
📊 Technical Analysis (15M):
Notice how price stabilized after the pullback and is now grinding back toward the 0.1076432-0.10984 . Here's what matters: this zone held as support earlier, and the 15M structure is showing higher lows forming above 0.1065448. The reason this works is that momentum is shifting — buyers defending 0.1076432 tells me they're accumulating, not exiting. Watch the volume: it's ticking up on green candles while red candles are shrinking, classic absorption. Resistance sits at 0.109285308, and a clean break there opens the door to 0.109829016 and beyond. 🚀📈 The rewards patience — let price come to you inside the zone rather than chasing green candles.
🎯 Trade Plan:
Range entry: 0.1076432-0.10984
Level 1: 0.109285308
Level 2: 0.109829016
Level 3: 0.110372724
Level 4: 0.110916432
🔴 Invalidation: 0.1065448
The invalidation at 0.1065448 sits right below the structural low that's been holding this bounce together. If price breaks that, the thesis is dead — buyers failed, and the next leg down likely follows. Risk is defined and tight from the , while Levels: step up cleanly toward 0.110916432. The reason this works is the asymmetry: small invalidation, stacked upside.
Discipline matters more than prediction here. Set your levels, let the plan work, and don't chase or move your stop because a candle looks scary. If price hits 0.1065448, accept it and move on — one trade doesn't define your month. Stay patient inside the . 🎯
📌 Crypto Alert
I've been tracking OPUSDT and buyers are stepping in.
📊 Technical Analysis (15M):
Notice how price stabilized after the pullback and is now grinding back toward the 0.1076432-0.10984 . Here's what matters: this zone held as support earlier, and the 15M structure is showing higher lows forming above 0.1065448. The reason this works is that momentum is shifting — buyers defending 0.1076432 tells me they're accumulating, not exiting. Watch the volume: it's ticking up on green candles while red candles are shrinking, classic absorption. Resistance sits at 0.109285308, and a clean break there opens the door to 0.109829016 and beyond. 🚀📈 The rewards patience — let price come to you inside the zone rather than chasing green candles.
🎯 Trade Plan:
Range entry: 0.1076432-0.10984
Level 1: 0.109285308
Level 2: 0.109829016
Level 3: 0.110372724
Level 4: 0.110916432
🔴 Invalidation: 0.1065448
The invalidation at 0.1065448 sits right below the structural low that's been holding this bounce together. If price breaks that, the thesis is dead — buyers failed, and the next leg down likely follows. Risk is defined and tight from the , while Levels: step up cleanly toward 0.110916432. The reason this works is the asymmetry: small invalidation, stacked upside.
Discipline matters more than prediction here. Set your levels, let the plan work, and don't chase or move your stop because a candle looks scary. If price hits 0.1065448, accept it and move on — one trade doesn't define your month. Stay patient inside the . 🎯
📌 Crypto Alert
🚀 $AVAX 🟢 Buy : 8.2908 – 8.46 | Clean
This AVAXUSDT chart just caught my attention.
📊 Technical Analysis (15M):
Alright fam, look at this. AVAX is sitting right in an interesting pocket on the 15-minute, price hovering around 8.37 after a pullback that looks more like a pause than a rejection. Buyers are stepping in quietly here, and the structure is starting to lean again. Nothing explosive yet, but the vibes are shifting 🚀
Here's the key thing guys — that 8.2062 level has been defended hard. Every time price dips near it, wicks come in and snap it back up. That's a sign someone bigger is accumulating down there. Volume on the bounce attempts is picking up too, which tells me sellers are running out of steam 💪
So the is simple: if buyers push through this tight zone, we've got a clean ladder of Levels: stacked above. Let me break it down 👇
Now let's walk the Levels: 🎯
Level 1: 8.417277 — first hurdle, basically the immediate resistance that needs to crack for momentum to build.
Level 2: 8.459154 — this is the bigger test, the gatekeeper that decides if this move has real legs.
Level 3: 8.501031 — if we get here, momentum is officially in our favor and shorts start sweating 🔥
Level 4: 8.542908 — the runner Levels: , where I'd start scaling out and letting the rest ride.
🔴 Invalidation: 8.2062
If we lose 8.2062, the whole thesis falls apart and I'm out. No arguing with the chart, no hoping. That level is the line in the sand, and it's sitting just below our of 8.2908 to 8.46, with 8.3754 as my suggested Range entry: .
📌 Crypto Alert
🚀 $AVAX 🟢 Buy : 8.2908 – 8.46 | Clean
This AVAXUSDT chart just caught my attention.
📊 Technical Analysis (15M):
Alright fam, look at this. AVAX is sitting right in an interesting pocket on the 15-minute, price hovering around 8.37 after a pullback that looks more like a pause than a rejection. Buyers are stepping in quietly here, and the structure is starting to lean again. Nothing explosive yet, but the vibes are shifting 🚀
Here's the key thing guys — that 8.2062 level has been defended hard. Every time price dips near it, wicks come in and snap it back up. That's a sign someone bigger is accumulating down there. Volume on the bounce attempts is picking up too, which tells me sellers are running out of steam 💪
So the is simple: if buyers push through this tight zone, we've got a clean ladder of Levels: stacked above. Let me break it down 👇
Now let's walk the Levels: 🎯
Level 1: 8.417277 — first hurdle, basically the immediate resistance that needs to crack for momentum to build.
Level 2: 8.459154 — this is the bigger test, the gatekeeper that decides if this move has real legs.
Level 3: 8.501031 — if we get here, momentum is officially in our favor and shorts start sweating 🔥
Level 4: 8.542908 — the runner Levels: , where I'd start scaling out and letting the rest ride.
🔴 Invalidation: 8.2062
If we lose 8.2062, the whole thesis falls apart and I'm out. No arguing with the chart, no hoping. That level is the line in the sand, and it's sitting just below our of 8.2908 to 8.46, with 8.3754 as my suggested Range entry: .
📌 Crypto Alert
This AVAXUSDT chart just caught my attention.
📊 Technical Analysis (15M):
Alright fam, look at this. AVAX is sitting right in an interesting pocket on the 15-minute, price hovering around 8.37 after a pullback that looks more like a pause than a rejection. Buyers are stepping in quietly here, and the structure is starting to lean again. Nothing explosive yet, but the vibes are shifting 🚀
Here's the key thing guys — that 8.2062 level has been defended hard. Every time price dips near it, wicks come in and snap it back up. That's a sign someone bigger is accumulating down there. Volume on the bounce attempts is picking up too, which tells me sellers are running out of steam 💪
So the is simple: if buyers push through this tight zone, we've got a clean ladder of Levels: stacked above. Let me break it down 👇
Now let's walk the Levels: 🎯
Level 1: 8.417277 — first hurdle, basically the immediate resistance that needs to crack for momentum to build.
Level 2: 8.459154 — this is the bigger test, the gatekeeper that decides if this move has real legs.
Level 3: 8.501031 — if we get here, momentum is officially in our favor and shorts start sweating 🔥
Level 4: 8.542908 — the runner Levels: , where I'd start scaling out and letting the rest ride.
🔴 Invalidation: 8.2062
If we lose 8.2062, the whole thesis falls apart and I'm out. No arguing with the chart, no hoping. That level is the line in the sand, and it's sitting just below our of 8.2908 to 8.46, with 8.3754 as my suggested Range entry: .
📌 Crypto Alert
1
🚀 $UNI 🟢 Buy : 7.00602 – 7.149 | Clean
Look at this UNIUSDT structure.
📊 Technical Analysis (15M):
Notice how UNI has been building a clean base after that pullback, and here's what matters — price is now pressing into a tight consolidation right around the 7.00602 to 7.149 . The reason this works is that 6.93453 held firm as support on multiple wicks, telling us sellers are running out of steam down there. Watch this level: 7.11289755 is the first ceiling, and once UNI reclaims it with volume, 7.1482851 becomes the next magnet. Momentum on the 15M is curling up, higher lows stacking, and volume is starting to tick in on the green candles. The structure favors a continuation push as long as we don't lose that base. 🚀📈
🎯 Trade Plan:
Range entry: 7.00602-7.149
Level 1: 7.11289755
Level 2: 7.1482851
Level 3: 7.18367265
Level 4: 7.2190602
🔴 Invalidation: 6.93453
The invalidation sits at 6.93453, just below the support shelf that's been defending this range. If price closes under it, the is dead — the higher-low structure breaks and momentum flips. From the 7.07751 suggested Range entry: , that's tight risk against a clean run to Level 1: and beyond, giving you solid risk-to-reward.
Stay disciplined here. Let price come into the zone rather than chasing green candles, and respect the invalidation without hesitation. Take partials at each Levels: , trail the rest, and don't let one trade dictate your emotions. The plan is the edge — .
📌 Crypto Alert
🚀 $UNI 🟢 Buy : 7.00602 – 7.149 | Clean
Look at this UNIUSDT structure.
📊 Technical Analysis (15M):
Notice how UNI has been building a clean base after that pullback, and here's what matters — price is now pressing into a tight consolidation right around the 7.00602 to 7.149 . The reason this works is that 6.93453 held firm as support on multiple wicks, telling us sellers are running out of steam down there. Watch this level: 7.11289755 is the first ceiling, and once UNI reclaims it with volume, 7.1482851 becomes the next magnet. Momentum on the 15M is curling up, higher lows stacking, and volume is starting to tick in on the green candles. The structure favors a continuation push as long as we don't lose that base. 🚀📈
🎯 Trade Plan:
Range entry: 7.00602-7.149
Level 1: 7.11289755
Level 2: 7.1482851
Level 3: 7.18367265
Level 4: 7.2190602
🔴 Invalidation: 6.93453
The invalidation sits at 6.93453, just below the support shelf that's been defending this range. If price closes under it, the is dead — the higher-low structure breaks and momentum flips. From the 7.07751 suggested Range entry: , that's tight risk against a clean run to Level 1: and beyond, giving you solid risk-to-reward.
Stay disciplined here. Let price come into the zone rather than chasing green candles, and respect the invalidation without hesitation. Take partials at each Levels: , trail the rest, and don't let one trade dictate your emotions. The plan is the edge — .
📌 Crypto Alert
Look at this UNIUSDT structure.
📊 Technical Analysis (15M):
Notice how UNI has been building a clean base after that pullback, and here's what matters — price is now pressing into a tight consolidation right around the 7.00602 to 7.149 . The reason this works is that 6.93453 held firm as support on multiple wicks, telling us sellers are running out of steam down there. Watch this level: 7.11289755 is the first ceiling, and once UNI reclaims it with volume, 7.1482851 becomes the next magnet. Momentum on the 15M is curling up, higher lows stacking, and volume is starting to tick in on the green candles. The structure favors a continuation push as long as we don't lose that base. 🚀📈
🎯 Trade Plan:
Range entry: 7.00602-7.149
Level 1: 7.11289755
Level 2: 7.1482851
Level 3: 7.18367265
Level 4: 7.2190602
🔴 Invalidation: 6.93453
The invalidation sits at 6.93453, just below the support shelf that's been defending this range. If price closes under it, the is dead — the higher-low structure breaks and momentum flips. From the 7.07751 suggested Range entry: , that's tight risk against a clean run to Level 1: and beyond, giving you solid risk-to-reward.
Stay disciplined here. Let price come into the zone rather than chasing green candles, and respect the invalidation without hesitation. Take partials at each Levels: , trail the rest, and don't let one trade dictate your emotions. The plan is the edge — .
📌 Crypto Alert
1
🚀 $AAVE 🟢 Buy : 125.2342 – 127.79 | Clean
Alright, AAVEUSDT is looking interesting here.
📊 Technical Analysis (15M):
Price has been grinding in a tight range after the recent pullback, and you can feel the compression building. Sellers pushed it down but couldn't sustain the move below 124, and now we're seeing buyers step back in near the . 📉
The 123.9563 level held firm on multiple retests. That's the line in the sand. Volume picked up on the bounce attempts, which tells me buyers are accumulating here rather than fading. No panic selling, just absorption. That's what you want to see before a push. 👀
This is a classic continuation . Support defended, higher low forming, and if buyers push through 127.79 we open the door to the Levels: below. 🎯
Now let's walk the Levels: 🎯
Level 1: 127.1446605 - First hurdle, immediate resistance where price needs to prove it can hold above the range. 🧱
Level 2: 127.777221 - Bigger test here, this is the gatekeeper that confirms the breakout is real.
Level 3: 128.4097815 - Momentum shifts in our favor if we get here, trend followers start stepping in.
Level 4: 129.042342 - Runner Levels: . This is where I'd consider partials and let the rest ride.
🔴 Invalidation: 123.9563
That's where the breaks. If price closes below 123.9563 on the 15M, the structure is gone and I'm out. No arguing with it. ⛔
📌 Crypto Alert
🚀 $AAVE 🟢 Buy : 125.2342 – 127.79 | Clean
Alright, AAVEUSDT is looking interesting here.
📊 Technical Analysis (15M):
Price has been grinding in a tight range after the recent pullback, and you can feel the compression building. Sellers pushed it down but couldn't sustain the move below 124, and now we're seeing buyers step back in near the . 📉
The 123.9563 level held firm on multiple retests. That's the line in the sand. Volume picked up on the bounce attempts, which tells me buyers are accumulating here rather than fading. No panic selling, just absorption. That's what you want to see before a push. 👀
This is a classic continuation . Support defended, higher low forming, and if buyers push through 127.79 we open the door to the Levels: below. 🎯
Now let's walk the Levels: 🎯
Level 1: 127.1446605 - First hurdle, immediate resistance where price needs to prove it can hold above the range. 🧱
Level 2: 127.777221 - Bigger test here, this is the gatekeeper that confirms the breakout is real.
Level 3: 128.4097815 - Momentum shifts in our favor if we get here, trend followers start stepping in.
Level 4: 129.042342 - Runner Levels: . This is where I'd consider partials and let the rest ride.
🔴 Invalidation: 123.9563
That's where the breaks. If price closes below 123.9563 on the 15M, the structure is gone and I'm out. No arguing with it. ⛔
📌 Crypto Alert
Alright, AAVEUSDT is looking interesting here.
📊 Technical Analysis (15M):
Price has been grinding in a tight range after the recent pullback, and you can feel the compression building. Sellers pushed it down but couldn't sustain the move below 124, and now we're seeing buyers step back in near the . 📉
The 123.9563 level held firm on multiple retests. That's the line in the sand. Volume picked up on the bounce attempts, which tells me buyers are accumulating here rather than fading. No panic selling, just absorption. That's what you want to see before a push. 👀
This is a classic continuation . Support defended, higher low forming, and if buyers push through 127.79 we open the door to the Levels: below. 🎯
Now let's walk the Levels: 🎯
Level 1: 127.1446605 - First hurdle, immediate resistance where price needs to prove it can hold above the range. 🧱
Level 2: 127.777221 - Bigger test here, this is the gatekeeper that confirms the breakout is real.
Level 3: 128.4097815 - Momentum shifts in our favor if we get here, trend followers start stepping in.
Level 4: 129.042342 - Runner Levels: . This is where I'd consider partials and let the rest ride.
🔴 Invalidation: 123.9563
That's where the breaks. If price closes below 123.9563 on the 15M, the structure is gone and I'm out. No arguing with it. ⛔
📌 Crypto Alert
🚀 $ATOM 🔴 Sell : 1.43106 – 1.403 | Clean
Been watching ATOMUSDT closely today and the weakness is obvious.
📊 Technical Analysis (15M):
The story on the 15-minute chart reads like a Lower level: ow surrender. Bulls tried to hold the line near 1.44509, but each bounce came up shorter than the last, a clean sequence of lower highs stacking like falling dominoes. Now price is pressing into the 1.43106 to 1.403 , and sellers are clearly the ones writing the script. Resistance at 1.44509 stands as the ceiling that flipped the narrative , and momentum is leaning down with volume confirming the push rather than fading it. Support at 1.40994485 is the first floor bulls must defend, and beneath it 1.4028597 becomes the real battleground. Until buyers reclaim the invalidation, every rally looks like an offering, not a reversal. The bears are in control here. 🔻📉
🎯 Trade Plan:
Range entry: 1.43106-1.403
Level 1: 1.40994485
Level 2: 1.4028597
Level 3: 1.39577455
Level 4: 1.3886894
🔴 Invalidation: 1.44509
The invalidation sits at 1.44509, right above the resistance shelf that capped every recent bounce. If price closes a 15-minute candle above that level, the thesis breaks and the is dead. Risk stays tight against that ceiling while Levels: run down toward 1.3886894, giving a clean risk-to-reward skew in favor of the short.
Discipline is the whole game here. A can look perfect and still fail, so respect the 1.44509 invalidation without hesitation. Take profits in steps, let the plan lead instead of emotion or noise, and never widen your stop hoping price comes back. Stick to the structure, manage the risk, and let the market do the rest.
📌 Crypto Alert
🚀 $ATOM 🔴 Sell : 1.43106 – 1.403 | Clean
Been watching ATOMUSDT closely today and the weakness is obvious.
📊 Technical Analysis (15M):
The story on the 15-minute chart reads like a Lower level: ow surrender. Bulls tried to hold the line near 1.44509, but each bounce came up shorter than the last, a clean sequence of lower highs stacking like falling dominoes. Now price is pressing into the 1.43106 to 1.403 , and sellers are clearly the ones writing the script. Resistance at 1.44509 stands as the ceiling that flipped the narrative , and momentum is leaning down with volume confirming the push rather than fading it. Support at 1.40994485 is the first floor bulls must defend, and beneath it 1.4028597 becomes the real battleground. Until buyers reclaim the invalidation, every rally looks like an offering, not a reversal. The bears are in control here. 🔻📉
🎯 Trade Plan:
Range entry: 1.43106-1.403
Level 1: 1.40994485
Level 2: 1.4028597
Level 3: 1.39577455
Level 4: 1.3886894
🔴 Invalidation: 1.44509
The invalidation sits at 1.44509, right above the resistance shelf that capped every recent bounce. If price closes a 15-minute candle above that level, the thesis breaks and the is dead. Risk stays tight against that ceiling while Levels: run down toward 1.3886894, giving a clean risk-to-reward skew in favor of the short.
Discipline is the whole game here. A can look perfect and still fail, so respect the 1.44509 invalidation without hesitation. Take profits in steps, let the plan lead instead of emotion or noise, and never widen your stop hoping price comes back. Stick to the structure, manage the risk, and let the market do the rest.
📌 Crypto Alert
Been watching ATOMUSDT closely today and the weakness is obvious.
📊 Technical Analysis (15M):
The story on the 15-minute chart reads like a Lower level: ow surrender. Bulls tried to hold the line near 1.44509, but each bounce came up shorter than the last, a clean sequence of lower highs stacking like falling dominoes. Now price is pressing into the 1.43106 to 1.403 , and sellers are clearly the ones writing the script. Resistance at 1.44509 stands as the ceiling that flipped the narrative , and momentum is leaning down with volume confirming the push rather than fading it. Support at 1.40994485 is the first floor bulls must defend, and beneath it 1.4028597 becomes the real battleground. Until buyers reclaim the invalidation, every rally looks like an offering, not a reversal. The bears are in control here. 🔻📉
🎯 Trade Plan:
Range entry: 1.43106-1.403
Level 1: 1.40994485
Level 2: 1.4028597
Level 3: 1.39577455
Level 4: 1.3886894
🔴 Invalidation: 1.44509
The invalidation sits at 1.44509, right above the resistance shelf that capped every recent bounce. If price closes a 15-minute candle above that level, the thesis breaks and the is dead. Risk stays tight against that ceiling while Levels: run down toward 1.3886894, giving a clean risk-to-reward skew in favor of the short.
Discipline is the whole game here. A can look perfect and still fail, so respect the 1.44509 invalidation without hesitation. Take profits in steps, let the plan lead instead of emotion or noise, and never widen your stop hoping price comes back. Stick to the structure, manage the risk, and let the market do the rest.
📌 Crypto Alert
🚀 $ATOM 🟢 Buy : 1.4161 – 1.445 | Clean
This ATOMUSDT chart just caught my attention.
📊 Technical Analysis (15M):
Notice how price has been grinding sideways after that initial bounce, consolidating right below the 1.44 area. The 15-minute candles are printing smaller bodies now, which usually means sellers are running out of steam and buyers are quietly accumulating. 👀
Here's what matters: support at 1.40165 was tested twice and held both times. The wicks below those candles tell the story — sellers pushed price down but couldn't keep it there. Volume tapered off on the second test too, which suggests selling pressure is fading. That's the kind of behavior you want to see before a continuation move. 📉
The reason this works is the tight range between 1.4161 and 1.445 gives us a clean Range entry: with defined risk. If buyers step in and push through 1.44, the path to higher levels opens quickly. Watch this level. ✅
Now let's walk the Levels: 🎯
Level 1: 1.43770275 - First hurdle and immediate resistance, where early scalpers will likely trim positions.
Level 2: 1.4448555 - Bigger test here; clearing this confirms buyers are actually in control.
Level 3: 1.45200825 - Momentum shifts in our favor if price reaches this zone.
Level 4: 1.459161 - This is the runner Levels: , where the real move extends.
🔴 Invalidation: 1.40165
Invalidation sits right under that defended support at 1.40165. If price closes below it on the 15M, the is dead and we step aside without arguing. Simple as that. No guessing, no hoping.
📌 Crypto Alert
🚀 $ATOM 🟢 Buy : 1.4161 – 1.445 | Clean
This ATOMUSDT chart just caught my attention.
📊 Technical Analysis (15M):
Notice how price has been grinding sideways after that initial bounce, consolidating right below the 1.44 area. The 15-minute candles are printing smaller bodies now, which usually means sellers are running out of steam and buyers are quietly accumulating. 👀
Here's what matters: support at 1.40165 was tested twice and held both times. The wicks below those candles tell the story — sellers pushed price down but couldn't keep it there. Volume tapered off on the second test too, which suggests selling pressure is fading. That's the kind of behavior you want to see before a continuation move. 📉
The reason this works is the tight range between 1.4161 and 1.445 gives us a clean Range entry: with defined risk. If buyers step in and push through 1.44, the path to higher levels opens quickly. Watch this level. ✅
Now let's walk the Levels: 🎯
Level 1: 1.43770275 - First hurdle and immediate resistance, where early scalpers will likely trim positions.
Level 2: 1.4448555 - Bigger test here; clearing this confirms buyers are actually in control.
Level 3: 1.45200825 - Momentum shifts in our favor if price reaches this zone.
Level 4: 1.459161 - This is the runner Levels: , where the real move extends.
🔴 Invalidation: 1.40165
Invalidation sits right under that defended support at 1.40165. If price closes below it on the 15M, the is dead and we step aside without arguing. Simple as that. No guessing, no hoping.
📌 Crypto Alert
This ATOMUSDT chart just caught my attention.
📊 Technical Analysis (15M):
Notice how price has been grinding sideways after that initial bounce, consolidating right below the 1.44 area. The 15-minute candles are printing smaller bodies now, which usually means sellers are running out of steam and buyers are quietly accumulating. 👀
Here's what matters: support at 1.40165 was tested twice and held both times. The wicks below those candles tell the story — sellers pushed price down but couldn't keep it there. Volume tapered off on the second test too, which suggests selling pressure is fading. That's the kind of behavior you want to see before a continuation move. 📉
The reason this works is the tight range between 1.4161 and 1.445 gives us a clean Range entry: with defined risk. If buyers step in and push through 1.44, the path to higher levels opens quickly. Watch this level. ✅
Now let's walk the Levels: 🎯
Level 1: 1.43770275 - First hurdle and immediate resistance, where early scalpers will likely trim positions.
Level 2: 1.4448555 - Bigger test here; clearing this confirms buyers are actually in control.
Level 3: 1.45200825 - Momentum shifts in our favor if price reaches this zone.
Level 4: 1.459161 - This is the runner Levels: , where the real move extends.
🔴 Invalidation: 1.40165
Invalidation sits right under that defended support at 1.40165. If price closes below it on the 15M, the is dead and we step aside without arguing. Simple as that. No guessing, no hoping.
📌 Crypto Alert
2
🚀 $WOO 🔴 Sell : 0.0116178 – 0.01139 | Clean
Here's what's setting up on WOOUSDT for a short.
📊 Technical Analysis (15M):
Alright guys, look at WOO on the 15-minute. Price has been Lower level: iding, making lower highs and struggling to hold any bounce. 😤 Every attempt to recover gets sold into pretty quick. The trend just isn't there for the bulls right now, and it's showing clearly on the chart.
That 0.0117317 level up top is straight-up resistance fam. Bounces keep getting capped right around there and volume dries up on the way up. When buyers can't push through and volume fades, that's usually the market telling you sellers are in control. 👀
Let me break it down. This whole is a lower high rejection play. If sellers step in and push price down through our , we could see a clean cascading move. Sellers show up, we're in business. 🎯
Now let's walk the Levels: 🎯
Level 1: 0.0114463805 - First hurdle here, basically immediate support where price might Lower level: ow down a touch.
Level 2: 0.011388861 - Bigger test, this is the gatekeeper level. Break this and the momentum really shifts.
Level 3: 0.0113313415 - If we reach this, momentum is fully in our favor and sellers are dominating. 🔥
Level 4: 0.011273822 - This is the runner Levels: , where I'd be scaling most of my position off.
🔴 Invalidation: 0.0117317
Invalidation sits at 0.0117317. If price reclaims that level, the whole short thesis breaks down. Bounce above it and I'm out, no questions asked. Don't argue with the chart. ✋
📌 Crypto Alert
🚀 $WOO 🔴 Sell : 0.0116178 – 0.01139 | Clean
Here's what's setting up on WOOUSDT for a short.
📊 Technical Analysis (15M):
Alright guys, look at WOO on the 15-minute. Price has been Lower level: iding, making lower highs and struggling to hold any bounce. 😤 Every attempt to recover gets sold into pretty quick. The trend just isn't there for the bulls right now, and it's showing clearly on the chart.
That 0.0117317 level up top is straight-up resistance fam. Bounces keep getting capped right around there and volume dries up on the way up. When buyers can't push through and volume fades, that's usually the market telling you sellers are in control. 👀
Let me break it down. This whole is a lower high rejection play. If sellers step in and push price down through our , we could see a clean cascading move. Sellers show up, we're in business. 🎯
Now let's walk the Levels: 🎯
Level 1: 0.0114463805 - First hurdle here, basically immediate support where price might Lower level: ow down a touch.
Level 2: 0.011388861 - Bigger test, this is the gatekeeper level. Break this and the momentum really shifts.
Level 3: 0.0113313415 - If we reach this, momentum is fully in our favor and sellers are dominating. 🔥
Level 4: 0.011273822 - This is the runner Levels: , where I'd be scaling most of my position off.
🔴 Invalidation: 0.0117317
Invalidation sits at 0.0117317. If price reclaims that level, the whole short thesis breaks down. Bounce above it and I'm out, no questions asked. Don't argue with the chart. ✋
📌 Crypto Alert
Here's what's setting up on WOOUSDT for a short.
📊 Technical Analysis (15M):
Alright guys, look at WOO on the 15-minute. Price has been Lower level: iding, making lower highs and struggling to hold any bounce. 😤 Every attempt to recover gets sold into pretty quick. The trend just isn't there for the bulls right now, and it's showing clearly on the chart.
That 0.0117317 level up top is straight-up resistance fam. Bounces keep getting capped right around there and volume dries up on the way up. When buyers can't push through and volume fades, that's usually the market telling you sellers are in control. 👀
Let me break it down. This whole is a lower high rejection play. If sellers step in and push price down through our , we could see a clean cascading move. Sellers show up, we're in business. 🎯
Now let's walk the Levels: 🎯
Level 1: 0.0114463805 - First hurdle here, basically immediate support where price might Lower level: ow down a touch.
Level 2: 0.011388861 - Bigger test, this is the gatekeeper level. Break this and the momentum really shifts.
Level 3: 0.0113313415 - If we reach this, momentum is fully in our favor and sellers are dominating. 🔥
Level 4: 0.011273822 - This is the runner Levels: , where I'd be scaling most of my position off.
🔴 Invalidation: 0.0117317
Invalidation sits at 0.0117317. If price reclaims that level, the whole short thesis breaks down. Bounce above it and I'm out, no questions asked. Don't argue with the chart. ✋
📌 Crypto Alert
26
🚀 $XAU 🔴 Sell : 4022.8851 – 3944.005 | Clean
Look at this XAUUSDT breakdown structure.
📊 Technical Analysis (5M):
Alright fam, XAUUSDT is showing clear weakness on the 5M chart. Price pumped into that 4022.8851 to 3944.005 zone and got smacked back down immediately. Now we're hanging around 3983.44505 and honestly it looks like the bounce is already running out of steam. Momentum is shifting, buyers are hesitating, and I don't like how heavy the candles feel up here. 😬
Look at how 4062.32515 is capping every single bounce attempt. Sellers are defending that level aggressively and volume keeps drying up on each push higher. That's a classic sign the buyers are exhausted. Every retest of resistance gets weaker, and the rejection wicks keep stacking up. Guys, this is textbook distribution before a drop. 📉
is simple here: short the weakness, ride the breakdown. If sellers push through 3963 area with real volume, this thing likely cascades down fast. 🎯
Now let's walk the Levels: 🎯
Level 1: 3963.52782475 - First hurdle for the bears, immediate support where we might see a small bounce.
Level 2: 3943.6105995 - Bigger test here, this is the gatekeeper level that keeps us in the trade.
Level 3: 3923.69337425 - Get here and momentum is fully in our favor, trend flips hard.
Level 4: 3903.776149 - The runner Levels: , full breakdown territory if we get the cascade.
🔴 Invalidation: 4062.32515
If price reclaims 4062.32515 on a 5M close, the bias flips and we step aside. That's where the bears lose control, simple as that. No arguments with the chart.
📌 Gold Alert
🚀 $XAU 🔴 Sell : 4022.8851 – 3944.005 | Clean
Look at this XAUUSDT breakdown structure.
📊 Technical Analysis (5M):
Alright fam, XAUUSDT is showing clear weakness on the 5M chart. Price pumped into that 4022.8851 to 3944.005 zone and got smacked back down immediately. Now we're hanging around 3983.44505 and honestly it looks like the bounce is already running out of steam. Momentum is shifting, buyers are hesitating, and I don't like how heavy the candles feel up here. 😬
Look at how 4062.32515 is capping every single bounce attempt. Sellers are defending that level aggressively and volume keeps drying up on each push higher. That's a classic sign the buyers are exhausted. Every retest of resistance gets weaker, and the rejection wicks keep stacking up. Guys, this is textbook distribution before a drop. 📉
is simple here: short the weakness, ride the breakdown. If sellers push through 3963 area with real volume, this thing likely cascades down fast. 🎯
Now let's walk the Levels: 🎯
Level 1: 3963.52782475 - First hurdle for the bears, immediate support where we might see a small bounce.
Level 2: 3943.6105995 - Bigger test here, this is the gatekeeper level that keeps us in the trade.
Level 3: 3923.69337425 - Get here and momentum is fully in our favor, trend flips hard.
Level 4: 3903.776149 - The runner Levels: , full breakdown territory if we get the cascade.
🔴 Invalidation: 4062.32515
If price reclaims 4062.32515 on a 5M close, the bias flips and we step aside. That's where the bears lose control, simple as that. No arguments with the chart.
📌 Gold Alert
Look at this XAUUSDT breakdown structure.
📊 Technical Analysis (5M):
Alright fam, XAUUSDT is showing clear weakness on the 5M chart. Price pumped into that 4022.8851 to 3944.005 zone and got smacked back down immediately. Now we're hanging around 3983.44505 and honestly it looks like the bounce is already running out of steam. Momentum is shifting, buyers are hesitating, and I don't like how heavy the candles feel up here. 😬
Look at how 4062.32515 is capping every single bounce attempt. Sellers are defending that level aggressively and volume keeps drying up on each push higher. That's a classic sign the buyers are exhausted. Every retest of resistance gets weaker, and the rejection wicks keep stacking up. Guys, this is textbook distribution before a drop. 📉
is simple here: short the weakness, ride the breakdown. If sellers push through 3963 area with real volume, this thing likely cascades down fast. 🎯
Now let's walk the Levels: 🎯
Level 1: 3963.52782475 - First hurdle for the bears, immediate support where we might see a small bounce.
Level 2: 3943.6105995 - Bigger test here, this is the gatekeeper level that keeps us in the trade.
Level 3: 3923.69337425 - Get here and momentum is fully in our favor, trend flips hard.
Level 4: 3903.776149 - The runner Levels: , full breakdown territory if we get the cascade.
🔴 Invalidation: 4062.32515
If price reclaims 4062.32515 on a 5M close, the bias flips and we step aside. That's where the bears lose control, simple as that. No arguments with the chart.
📌 Gold Alert
27
ເຂົ້າສູ່ລະບົບເພື່ອສຳຫຼວດເນື້ອຫາເພີ່ມເຕີມ
ເຂົ້າຮ່ວມກຸ່ມຜູ້ໃຊ້ຄຣິບໂຕທົ່ວໂລກໃນ Binance Square.
⚡️ ໄດ້ຮັບຂໍ້ມູນຫຼ້າສຸດ ແລະ ທີ່ມີປະໂຫຍດກ່ຽວກັບຄຣິບໂຕ.
💬 ໄດ້ຮັບຄວາມໄວ້ວາງໃຈຈາກຕະຫຼາດແລກປ່ຽນຄຣິບໂຕທີ່ໃຫຍ່ທີ່ສຸດໃນໂລກ.
👍 ຄົ້ນຫາຂໍ້ມູນເຊີງເລິກທີ່ແທ້ຈາກນັກສ້າງທີ່ໄດ້ຮັບການຢືນຢັນ.
ອີເມວ / ເບີໂທລະສັບ
ຫົວຂໍ້ທີ່ກໍາລັງນິຍົມ
BinanceReopensWithdrawalsForMoreAssets
38,279 ຄັ້ງທີ່ເບິ່ງ
856 ກຳລັງສົນທະນາ
Security Incident | Recovery Update #6: Withdrawals Reopen for More Assets (2026-11-03)
Binance Announcement
·176 ຖືກໃຈ
·485.9k ຄັ້ງທີ່ເບິ່ງ
AppleReportsMixedResults
23,353 ຄັ້ງທີ່ເບິ່ງ
609 ກຳລັງສົນທະນາ
BinanceHourlyDepositsExceedWithdrawals
10,226 ຄັ້ງທີ່ເບິ່ງ
267 ກຳລັງສົນທະນາ