
free crypto for all
1.3k ໂພສ

free crypto for all
ລາຍງານ
ບລັອກຜູ້ໃຊ້
I will give you free signal's and also share airdrop for free 🔗

ຜູ້ຖື EDEN
ຜູ້ຊື້ຂາຍປະຈໍາ
6.3 ປີ
139 ກໍາລັງຕິດຕາມ
709 ຜູ້ຕິດຕາມ
775 Liked
ໂພສ
ທັງໝົດ
ວົງຢືມ
ປັກໝຸດ
"I Told Faheem to Buy Bitcoin at $9,000 – Now He’s Crying"
We all have that one friend who doesn't listen. For me, that friend is Faheem.
It was back when Bitcoin was trading at just $9,000 – the perfect time to get in. I remember telling Faheem clearly, “Bro, this is your moment. Buy Bitcoin. You’ll thank me later.” But Faheem, ever the skeptic, brushed it off with a laugh. “Too risky,” he said. “It’s probably going to crash.”
Fast forward to today, and well… let’s just say Faheem isn’t laughing anymore. In fact, he’s crying (literally and financially).
As Bitcoin soared past $60,000, I kept sending him screenshots. Memes. Charts. You name it. His reaction? A mix of regret, disbelief, and the classic “I should have listened to you.”
We’ve all heard stories like this, but when it hits close to home, it’s a whole new level of painful comedy. Of course, I didn’t rub it in too hard – okay, maybe just a little. But in all seriousness, this story is a reminder: sometimes the best opportunities are the ones that seem risky in the moment.
To Faheem (and all the other Faheems out there), let this be a lesson. Next time someone hands you a golden tip, maybe—just maybe—give it a second thought.
And to those of us who did buy at $9,000... cheers. 🍻
{spot}(BTCUSDT)
{spot}(ETHUSDT)
{spot}(XRPUSDT)
"I Told Faheem to Buy Bitcoin at $9,000 – Now He’s Crying"
We all have that one friend who doesn't listen. For me, that friend is Faheem.
It was back when Bitcoin was trading at just $9,000 – the perfect time to get in. I remember telling Faheem clearly, “Bro, this is your moment. Buy Bitcoin. You’ll thank me later.” But Faheem, ever the skeptic, brushed it off with a laugh. “Too risky,” he said. “It’s probably going to crash.”
Fast forward to today, and well… let’s just say Faheem isn’t laughing anymore. In fact, he’s crying (literally and financially).
As Bitcoin soared past $60,000, I kept sending him screenshots. Memes. Charts. You name it. His reaction? A mix of regret, disbelief, and the classic “I should have listened to you.”
We’ve all heard stories like this, but when it hits close to home, it’s a whole new level of painful comedy. Of course, I didn’t rub it in too hard – okay, maybe just a little. But in all seriousness, this story is a reminder: sometimes the best opportunities are the ones that seem risky in the moment.
To Faheem (and all the other Faheems out there), let this be a lesson. Next time someone hands you a golden tip, maybe—just maybe—give it a second thought.
And to those of us who did buy at $9,000... cheers. 🍻
We all have that one friend who doesn't listen. For me, that friend is Faheem.
It was back when Bitcoin was trading at just $9,000 – the perfect time to get in. I remember telling Faheem clearly, “Bro, this is your moment. Buy Bitcoin. You’ll thank me later.” But Faheem, ever the skeptic, brushed it off with a laugh. “Too risky,” he said. “It’s probably going to crash.”
Fast forward to today, and well… let’s just say Faheem isn’t laughing anymore. In fact, he’s crying (literally and financially).
As Bitcoin soared past $60,000, I kept sending him screenshots. Memes. Charts. You name it. His reaction? A mix of regret, disbelief, and the classic “I should have listened to you.”
We’ve all heard stories like this, but when it hits close to home, it’s a whole new level of painful comedy. Of course, I didn’t rub it in too hard – okay, maybe just a little. But in all seriousness, this story is a reminder: sometimes the best opportunities are the ones that seem risky in the moment.
To Faheem (and all the other Faheems out there), let this be a lesson. Next time someone hands you a golden tip, maybe—just maybe—give it a second thought.
And to those of us who did buy at $9,000... cheers. 🍻

2
1
452
ປັກໝຸດ
·
--
ສັນຍານກະທິງ
[claim banana coin join fast](https://app.binance.com/uni-qr/CmgdMTNR?utm_medium=web_share_copy)
$BANANAS31
$BANANA
claim banana coin join fast
$BANANAS31
$BANANA
$BANANAS31
$BANANA

1
2
3
209
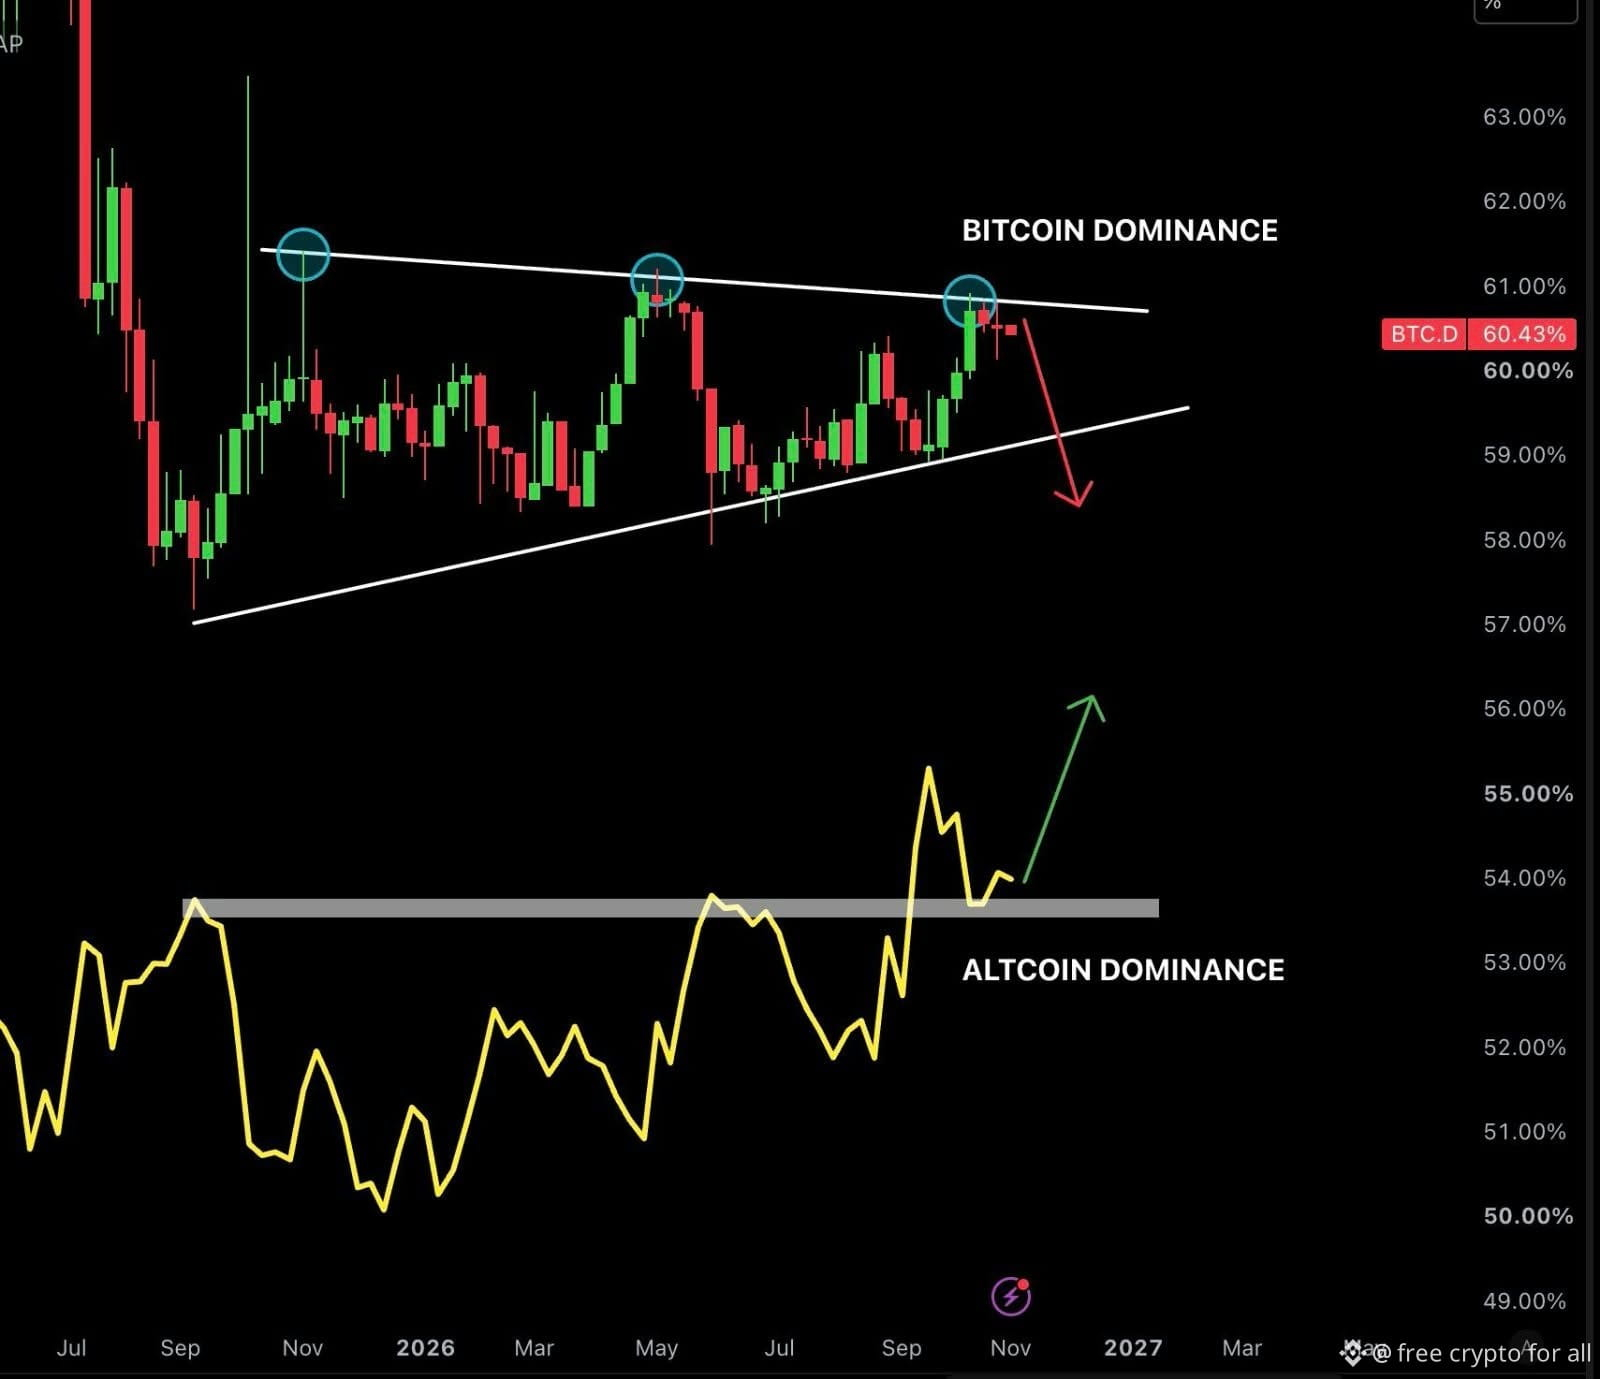
This chart is telling a very clear rotation story. This is the classic setup traders watch for an *Altseason signal.*
*1. Top Chart - BITCOIN DOMINANCE (BTC.D) at 60.43%*
BTC.D is trapped in a *Rising Wedge.*
- It has been rejected 3 times from the upper white trendline, at those blue circled areas. Buyers are failing to push it higher.
- The lower white line is the support.
- Right now it's at 60.43% and the red arrow shows the expectation: if that lower line breaks, BTC.D can drop straight to 58.50% - 58.00%.
When BTC.D falls, it means money is rotating out of Bitcoin and into Altcoins.
*2. Bottom Chart - ALTCOIN DOMINANCE*
This is the most important part.
- Altcoins tested the grey 53.8% resistance line 2-3 times before, and now they have *broken out above it and successfully retested it.*
- Now it's holding above 54% and the green arrow is pointing up. That means the breakout is confirmed.
- If it stays above 54%, the next targets are 56% - 58%.
*In simple terms:*
Bitcoin Dominance is exhausted at the top, Altcoin Dominance has broken out from the bottom. Together they are saying *capital rotation is happening.*
This is not a 100% guarantee, but if BTC.D gives a daily close below 60%, the chances of a sharp move in Altcoins become very high.#altcoins #BTC $BTC
{future}(BTCUSDT)
$BTCDOM
{future}(BTCDOMUSDT)
$ETH
{future}(ETHUSDT)
This chart is telling a very clear rotation story. This is the classic setup traders watch for an *Altseason signal.*
*1. Top Chart - BITCOIN DOMINANCE (BTC.D) at 60.43%*
BTC.D is trapped in a *Rising Wedge.*
- It has been rejected 3 times from the upper white trendline, at those blue circled areas. Buyers are failing to push it higher.
- The lower white line is the support.
- Right now it's at 60.43% and the red arrow shows the expectation: if that lower line breaks, BTC.D can drop straight to 58.50% - 58.00%.
When BTC.D falls, it means money is rotating out of Bitcoin and into Altcoins.
*2. Bottom Chart - ALTCOIN DOMINANCE*
This is the most important part.
- Altcoins tested the grey 53.8% resistance line 2-3 times before, and now they have *broken out above it and successfully retested it.*
- Now it's holding above 54% and the green arrow is pointing up. That means the breakout is confirmed.
- If it stays above 54%, the next targets are 56% - 58%.
*In simple terms:*
Bitcoin Dominance is exhausted at the top, Altcoin Dominance has broken out from the bottom. Together they are saying *capital rotation is happening.*
This is not a 100% guarantee, but if BTC.D gives a daily close below 60%, the chances of a sharp move in Altcoins become very high.#altcoins #BTC $BTC
$BTCDOM
$ETH
*1. Top Chart - BITCOIN DOMINANCE (BTC.D) at 60.43%*
BTC.D is trapped in a *Rising Wedge.*
- It has been rejected 3 times from the upper white trendline, at those blue circled areas. Buyers are failing to push it higher.
- The lower white line is the support.
- Right now it's at 60.43% and the red arrow shows the expectation: if that lower line breaks, BTC.D can drop straight to 58.50% - 58.00%.
When BTC.D falls, it means money is rotating out of Bitcoin and into Altcoins.
*2. Bottom Chart - ALTCOIN DOMINANCE*
This is the most important part.
- Altcoins tested the grey 53.8% resistance line 2-3 times before, and now they have *broken out above it and successfully retested it.*
- Now it's holding above 54% and the green arrow is pointing up. That means the breakout is confirmed.
- If it stays above 54%, the next targets are 56% - 58%.
*In simple terms:*
Bitcoin Dominance is exhausted at the top, Altcoin Dominance has broken out from the bottom. Together they are saying *capital rotation is happening.*
This is not a 100% guarantee, but if BTC.D gives a daily close below 60%, the chances of a sharp move in Altcoins become very high.#altcoins #BTC $BTC
$BTCDOM
$ETH
1
324
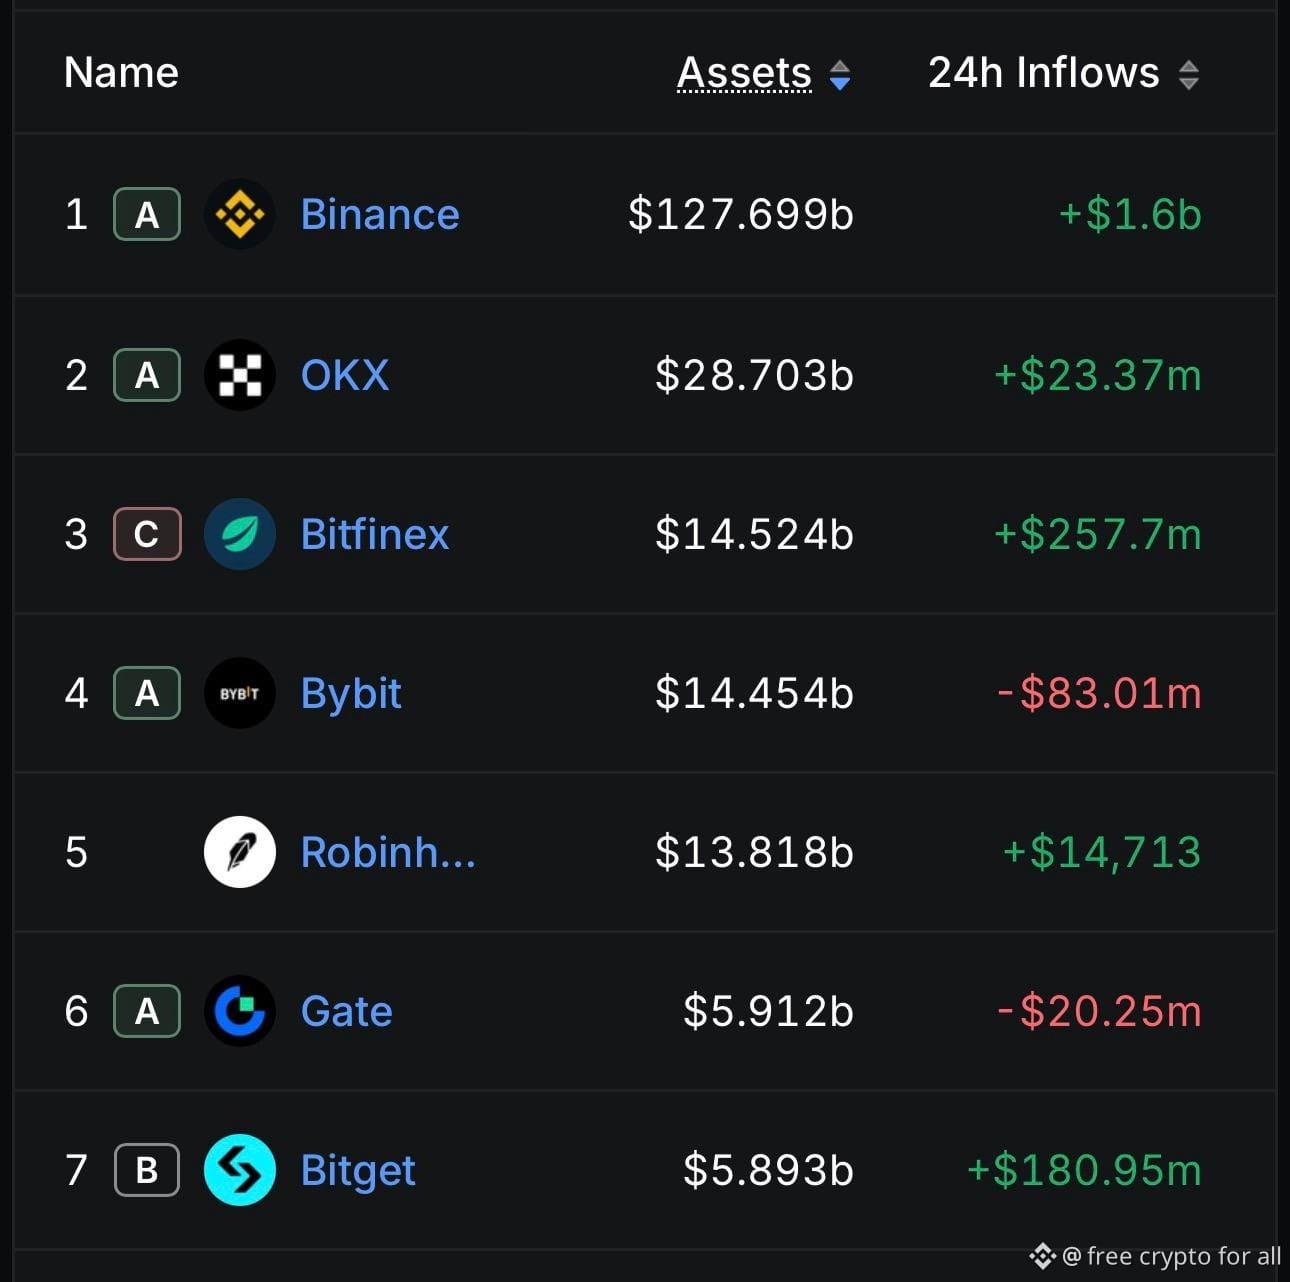
After $7B in withdrawals from Binance, people are starting to return — today +$1.6B…
#BinanceReopensWithdrawalsForMoreAssets #USDT。 $BTC
{future}(BTCUSDT)
$ETH
{future}(ETHUSDT)
$BNB
{future}(BNBUSDT)
After $7B in withdrawals from Binance, people are starting to return — today +$1.6B…
#BinanceReopensWithdrawalsForMoreAssets #USDT。 $BTC
$ETH
$BNB
#BinanceReopensWithdrawalsForMoreAssets #USDT。 $BTC
$ETH
$BNB
156
📊 Trending MEME Coins (Today):
$牛来 28.13%
$GEKKO 12.29%
$MARSCOIN 11.98%
$AI 7.02%
$NPC 4.83%
$CASHCAT 3.98%
$USELESS 3.92%
$PURR 3.66%
$PUMP 2.90%
$MUBARAK 2.61%
📊 Trending MEME Coins (Today):
$牛来 28.13%
$GEKKO 12.29%
$MARSCOIN 11.98%
$AI 7.02%
$NPC 4.83%
$CASHCAT 3.98%
$USELESS 3.92%
$PURR 3.66%
$PUMP 2.90%
$MUBARAK 2.61%
$牛来 28.13%
$GEKKO 12.29%
$MARSCOIN 11.98%
$AI 7.02%
$NPC 4.83%
$CASHCAT 3.98%
$USELESS 3.92%
$PURR 3.66%
$PUMP 2.90%
$MUBARAK 2.61%
3
1.3k
: France is considering a 31.4% tax on crypto-to-stablecoin conversions starting 2027.
$USDT $BTC
{future}(BTCUSDT)
: France is considering a 31.4% tax on crypto-to-stablecoin conversions starting 2027.
$USDT $BTC
$USDT $BTC
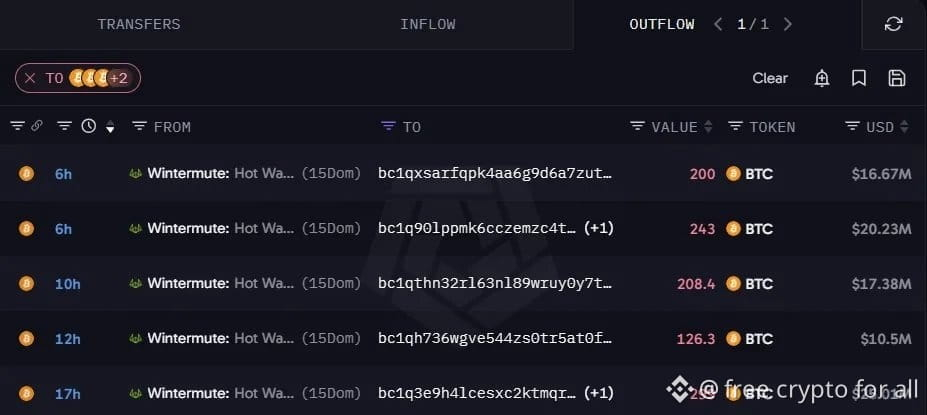
Whales are buying $BTC dip
5 wallets bought 1,076 BTC worth $90.42 million today.
While retail is panicking over every dip, smart money is accumulating non-stop. $BTC
{future}(BTCUSDT)
$ETH
{future}(ETHUSDT)
Whales are buying $BTC dip
5 wallets bought 1,076 BTC worth $90.42 million today.
While retail is panicking over every dip, smart money is accumulating non-stop. $BTC
$ETH
5 wallets bought 1,076 BTC worth $90.42 million today.
While retail is panicking over every dip, smart money is accumulating non-stop. $BTC
$ETH
8
Today's market update - Oct 14, in English:
*Market Overview:*
Bitcoin recovered after dropping below $81,000 yesterday and is now trading around *$83,700*. Yesterday around $774M in long positions were liquidated, which is why the market is still scared.
*Today's Performance:*
Market is in a slight relief rebound:
- *BTC:* +1.21% - back above $83,000
- *ETH:* +1.88% - above $2,500
- *Strongest Sector:* Layer2 +2.90% - OP +19.98% and ZK +10.69%
Everyone is in Wait & See mode because US CPI data is coming today at 8:30 AM ET / 5:30 PM Pakistan time.
*Key Levels:*
- *BTC Support:* $83,200 - $83,400 - This zone MUST hold. If it breaks, next supports are $82,000 and then $81,000.
- *BTC Resistance:* If it closes above $84,000 - $84,300, it can go to $85,000 and then $86,700.
- *ETH Support:* $2,400 - $2,440
- *ETH Resistance:* $2,545 - $2,580
*BERA / USDT - Your coin:*
Currently at $0.224, support is still $0.2075 as I told you. If BTC holds its $83,200 support, BERA can go to $0.235.
This is just a relief rally right now, not a confirmed trend reversal. Today's CPI will decide if the market goes up or retests $81k. $BTC
{future}(BTCUSDT)
Today's market update - Oct 14, in English:
*Market Overview:*
Bitcoin recovered after dropping below $81,000 yesterday and is now trading around *$83,700*. Yesterday around $774M in long positions were liquidated, which is why the market is still scared.
*Today's Performance:*
Market is in a slight relief rebound:
- *BTC:* +1.21% - back above $83,000
- *ETH:* +1.88% - above $2,500
- *Strongest Sector:* Layer2 +2.90% - OP +19.98% and ZK +10.69%
Everyone is in Wait & See mode because US CPI data is coming today at 8:30 AM ET / 5:30 PM Pakistan time.
*Key Levels:*
- *BTC Support:* $83,200 - $83,400 - This zone MUST hold. If it breaks, next supports are $82,000 and then $81,000.
- *BTC Resistance:* If it closes above $84,000 - $84,300, it can go to $85,000 and then $86,700.
- *ETH Support:* $2,400 - $2,440
- *ETH Resistance:* $2,545 - $2,580
*BERA / USDT - Your coin:*
Currently at $0.224, support is still $0.2075 as I told you. If BTC holds its $83,200 support, BERA can go to $0.235.
This is just a relief rally right now, not a confirmed trend reversal. Today's CPI will decide if the market goes up or retests $81k. $BTC
*Market Overview:*
Bitcoin recovered after dropping below $81,000 yesterday and is now trading around *$83,700*. Yesterday around $774M in long positions were liquidated, which is why the market is still scared.
*Today's Performance:*
Market is in a slight relief rebound:
- *BTC:* +1.21% - back above $83,000
- *ETH:* +1.88% - above $2,500
- *Strongest Sector:* Layer2 +2.90% - OP +19.98% and ZK +10.69%
Everyone is in Wait & See mode because US CPI data is coming today at 8:30 AM ET / 5:30 PM Pakistan time.
*Key Levels:*
- *BTC Support:* $83,200 - $83,400 - This zone MUST hold. If it breaks, next supports are $82,000 and then $81,000.
- *BTC Resistance:* If it closes above $84,000 - $84,300, it can go to $85,000 and then $86,700.
- *ETH Support:* $2,400 - $2,440
- *ETH Resistance:* $2,545 - $2,580
*BERA / USDT - Your coin:*
Currently at $0.224, support is still $0.2075 as I told you. If BTC holds its $83,200 support, BERA can go to $0.235.
This is just a relief rally right now, not a confirmed trend reversal. Today's CPI will decide if the market goes up or retests $81k. $BTC

1
241
*BERA / USDT - Live Update - Oct 14, 2026*
*Current Price:* ~ *$0.2249*
*24h Change:* *-0.98%* down
*Exchange Range:* Binance / LBank showing *$0.2154 - $0.2162*
*Market Stats:*
- Market Cap: ∼$58M (small-cap)
- 24h Volume: ∼$23M
- ATH: $14.83
- ATL: $0.1376 - currently trading near ATL zone
Technical Levels
*Resistances:*
- $0.2205 - $0.2352 (Immediate resistance)
- $0.2620 (Major breakout level - daily close above this confirms bullish breakout)
- Next: $0.2953 / $0.3491 / $0.4028
*Supports:*
- $0.2075 (100-day EMA support - key level)
- $0.1716
- $0.1382 - $0.1822 (Strong bottom zone)
*Active Trading Zone:* $0.2030 - $0.2177
My Entry / Exit Plan
*Don't FOMO at $0.2249.* Wait for a dip.
*Buy Zones:*
- *Safe Entry 1:* $0.205 - $0.210
- *Safe Entry 2 (Dip):* $0.172 - $0.175
- *Breakout Entry:* Only if daily candle closes ABOVE $0.2620 with high volume - then buy at $0.262 - $0.27
*Take Profit:*
- TP1: $0.235 (+10%)
- TP2: $0.262 (+20%)
- TP3: $0.349 (+60%)
*Stop Loss:* Daily close below *$0.200* = Exit. If it breaks $0.200, it can drop to $0.17.
*Indicator:* RSI is 67.99 = Near overbought, so a pullback to $0.2075 is expected before next leg up.$BERA
{future}(BERAUSDT)
*BERA / USDT - Live Update - Oct 14, 2026*
*Current Price:* ~ *$0.2249*
*24h Change:* *-0.98%* down
*Exchange Range:* Binance / LBank showing *$0.2154 - $0.2162*
*Market Stats:*
- Market Cap: ∼$58M (small-cap)
- 24h Volume: ∼$23M
- ATH: $14.83
- ATL: $0.1376 - currently trading near ATL zone
Technical Levels
*Resistances:*
- $0.2205 - $0.2352 (Immediate resistance)
- $0.2620 (Major breakout level - daily close above this confirms bullish breakout)
- Next: $0.2953 / $0.3491 / $0.4028
*Supports:*
- $0.2075 (100-day EMA support - key level)
- $0.1716
- $0.1382 - $0.1822 (Strong bottom zone)
*Active Trading Zone:* $0.2030 - $0.2177
My Entry / Exit Plan
*Don't FOMO at $0.2249.* Wait for a dip.
*Buy Zones:*
- *Safe Entry 1:* $0.205 - $0.210
- *Safe Entry 2 (Dip):* $0.172 - $0.175
- *Breakout Entry:* Only if daily candle closes ABOVE $0.2620 with high volume - then buy at $0.262 - $0.27
*Take Profit:*
- TP1: $0.235 (+10%)
- TP2: $0.262 (+20%)
- TP3: $0.349 (+60%)
*Stop Loss:* Daily close below *$0.200* = Exit. If it breaks $0.200, it can drop to $0.17.
*Indicator:* RSI is 67.99 = Near overbought, so a pullback to $0.2075 is expected before next leg up.$BERA
*Current Price:* ~ *$0.2249*
*24h Change:* *-0.98%* down
*Exchange Range:* Binance / LBank showing *$0.2154 - $0.2162*
*Market Stats:*
- Market Cap: ∼$58M (small-cap)
- 24h Volume: ∼$23M
- ATH: $14.83
- ATL: $0.1376 - currently trading near ATL zone
Technical Levels
*Resistances:*
- $0.2205 - $0.2352 (Immediate resistance)
- $0.2620 (Major breakout level - daily close above this confirms bullish breakout)
- Next: $0.2953 / $0.3491 / $0.4028
*Supports:*
- $0.2075 (100-day EMA support - key level)
- $0.1716
- $0.1382 - $0.1822 (Strong bottom zone)
*Active Trading Zone:* $0.2030 - $0.2177
My Entry / Exit Plan
*Don't FOMO at $0.2249.* Wait for a dip.
*Buy Zones:*
- *Safe Entry 1:* $0.205 - $0.210
- *Safe Entry 2 (Dip):* $0.172 - $0.175
- *Breakout Entry:* Only if daily candle closes ABOVE $0.2620 with high volume - then buy at $0.262 - $0.27
*Take Profit:*
- TP1: $0.235 (+10%)
- TP2: $0.262 (+20%)
- TP3: $0.349 (+60%)
*Stop Loss:* Daily close below *$0.200* = Exit. If it breaks $0.200, it can drop to $0.17.
*Indicator:* RSI is 67.99 = Near overbought, so a pullback to $0.2075 is expected before next leg up.$BERA
162
US CPI September 2026: Inflation Expected to Heat Up to 3.7% Before Fed Meeting
The U.S. Bureau of Labor Statistics will publish September consumer price inflation today, Wednesday October 14th at 8:30 AM ET / 13:30 UK time. It is the last major inflation print before the Federal Reserve meets on October 27-28.
What to Expect
Economists are forecasting a hotter headline number driven by energy, but a cooler core reading:
Measure August (Actual) September (Consensus)
Headline CPI y/y 3.4% 3.7%
Headline CPI m/m 0.4% 0.6%
Core CPI y/y 2.4% 2.5%
Core CPI m/m 0.3% 0.2%
Cleveland Fed's nowcast model is slightly more dovish: 3.60% y/y headline and 2.39% y/y core.
Why Headline is Rising
1. Energy Shock: Goldman Sachs estimates headline CPI rose 0.59% in the month, reflecting food (+0.2%) and energy (+5.0%) prices. Brent crude has surged 75% this year to $105 per barrel due to tanker disruptions in the Strait of Hormuz.
2. Gasoline: A nearly 10% jump in gasoline prices alone is expected to add 0.4 percentage point to the headline figure.
In August, headline inflation was already running hot - energy prices were up 16.3% year-over-year.
Why Core is More Important for the Fed
The Fed lifted its target range to 3.75% to 4.00% on September 16th, saying inflation remains elevated.
For the Fed, the split matters:
- If headline is hot at 3.7% but core cools to 0.2% m/m, the Fed can likely hold in October.
- If core surprises to the upside, markets are pricing a chance of an October hike.
Market Watch
Dollar, Treasury yields and Wall Street usually react first to the release, because it feeds directly into expectations for the next Fed move. Investors will also watch rent and used car prices for the underlying trend.
Next data point: PCE inflation - the Fed's preferred gauge - on October 29th.#CPIWatch #USGovernment $BTC
{spot}(BTCUSDT)
US CPI September 2026: Inflation Expected to Heat Up to 3.7% Before Fed Meeting
The U.S. Bureau of Labor Statistics will publish September consumer price inflation today, Wednesday October 14th at 8:30 AM ET / 13:30 UK time. It is the last major inflation print before the Federal Reserve meets on October 27-28.
What to Expect
Economists are forecasting a hotter headline number driven by energy, but a cooler core reading:
Measure August (Actual) September (Consensus)
Headline CPI y/y 3.4% 3.7%
Headline CPI m/m 0.4% 0.6%
Core CPI y/y 2.4% 2.5%
Core CPI m/m 0.3% 0.2%
Cleveland Fed's nowcast model is slightly more dovish: 3.60% y/y headline and 2.39% y/y core.
Why Headline is Rising
1. Energy Shock: Goldman Sachs estimates headline CPI rose 0.59% in the month, reflecting food (+0.2%) and energy (+5.0%) prices. Brent crude has surged 75% this year to $105 per barrel due to tanker disruptions in the Strait of Hormuz.
2. Gasoline: A nearly 10% jump in gasoline prices alone is expected to add 0.4 percentage point to the headline figure.
In August, headline inflation was already running hot - energy prices were up 16.3% year-over-year.
Why Core is More Important for the Fed
The Fed lifted its target range to 3.75% to 4.00% on September 16th, saying inflation remains elevated.
For the Fed, the split matters:
- If headline is hot at 3.7% but core cools to 0.2% m/m, the Fed can likely hold in October.
- If core surprises to the upside, markets are pricing a chance of an October hike.
Market Watch
Dollar, Treasury yields and Wall Street usually react first to the release, because it feeds directly into expectations for the next Fed move. Investors will also watch rent and used car prices for the underlying trend.
Next data point: PCE inflation - the Fed's preferred gauge - on October 29th.#CPIWatch #USGovernment $BTC
The U.S. Bureau of Labor Statistics will publish September consumer price inflation today, Wednesday October 14th at 8:30 AM ET / 13:30 UK time. It is the last major inflation print before the Federal Reserve meets on October 27-28.
What to Expect
Economists are forecasting a hotter headline number driven by energy, but a cooler core reading:
Measure August (Actual) September (Consensus)
Headline CPI y/y 3.4% 3.7%
Headline CPI m/m 0.4% 0.6%
Core CPI y/y 2.4% 2.5%
Core CPI m/m 0.3% 0.2%
Cleveland Fed's nowcast model is slightly more dovish: 3.60% y/y headline and 2.39% y/y core.
Why Headline is Rising
1. Energy Shock: Goldman Sachs estimates headline CPI rose 0.59% in the month, reflecting food (+0.2%) and energy (+5.0%) prices. Brent crude has surged 75% this year to $105 per barrel due to tanker disruptions in the Strait of Hormuz.
2. Gasoline: A nearly 10% jump in gasoline prices alone is expected to add 0.4 percentage point to the headline figure.
In August, headline inflation was already running hot - energy prices were up 16.3% year-over-year.
Why Core is More Important for the Fed
The Fed lifted its target range to 3.75% to 4.00% on September 16th, saying inflation remains elevated.
For the Fed, the split matters:
- If headline is hot at 3.7% but core cools to 0.2% m/m, the Fed can likely hold in October.
- If core surprises to the upside, markets are pricing a chance of an October hike.
Market Watch
Dollar, Treasury yields and Wall Street usually react first to the release, because it feeds directly into expectations for the next Fed move. Investors will also watch rent and used car prices for the underlying trend.
Next data point: PCE inflation - the Fed's preferred gauge - on October 29th.#CPIWatch #USGovernment $BTC

231
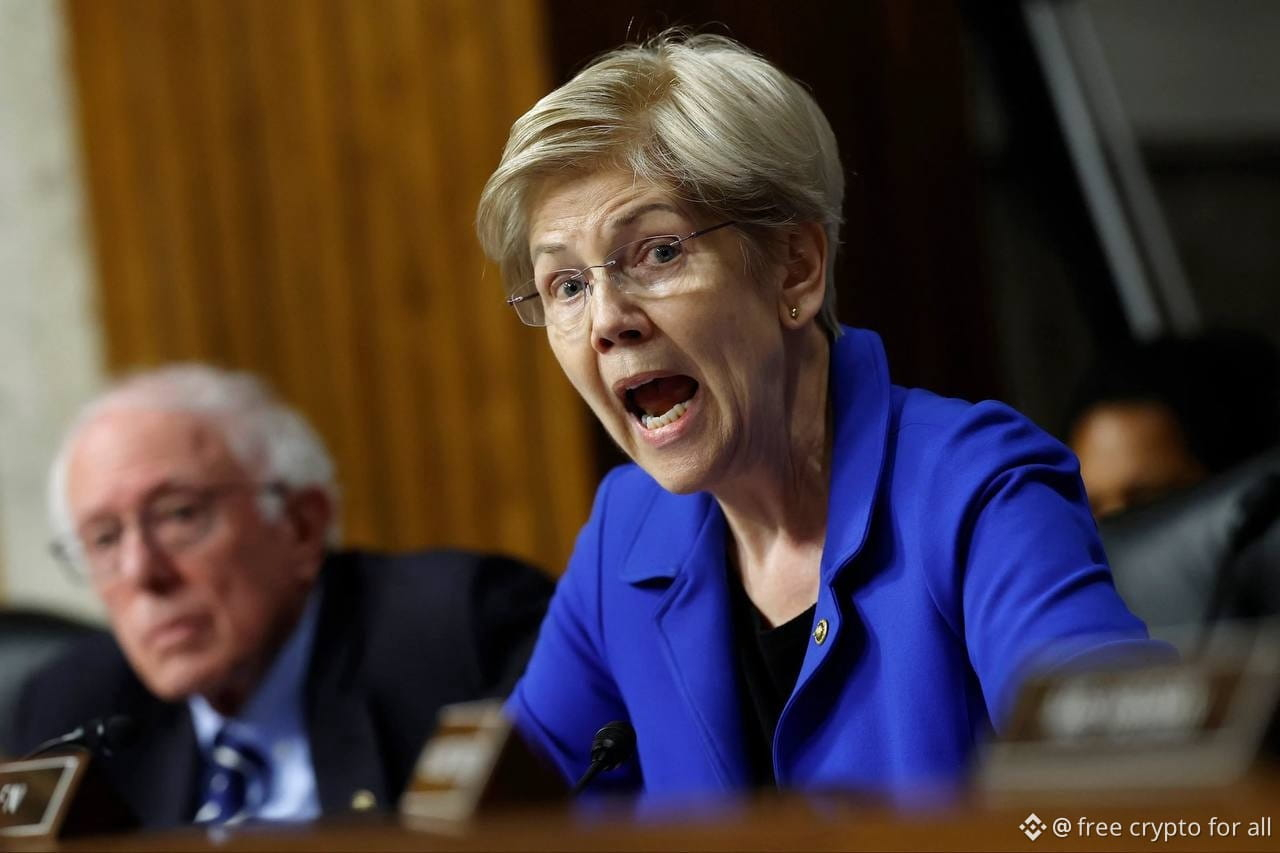
🇺🇸 Senator Elizabeth Warren has repeatedly stated that cryptocurrency is used for money laundering and to avoid sanctions.
Today, the US government fined Bank of America $1.2 billion for violating money laundering regulations and sanctions laws.
#CPIWatch $BTC
{future}(BTCUSDT)
$ETH
{future}(ETHUSDT)
🇺🇸 Senator Elizabeth Warren has repeatedly stated that cryptocurrency is used for money laundering and to avoid sanctions.
Today, the US government fined Bank of America $1.2 billion for violating money laundering regulations and sanctions laws.
#CPIWatch $BTC
$ETH
Today, the US government fined Bank of America $1.2 billion for violating money laundering regulations and sanctions laws.
#CPIWatch $BTC
$ETH
57
Zone Innovation-Zone
GNS $0.755 +111.48% ✨🌀
PEPE $0.00000422 +11.05% 💹💹
GMX $8.56 +9.32% 💹
PENDLE $2.163 +8.37% 💹
SUSHI $0.239 +7.22% 💹
SYN $0.19314 +5.60% 💹
PEOPLE $0.00794 +5.03% 💹
DODO $0.02037 +5.00% 💹
RPL $1.755 +4.65% 💹
FLOKI $0.00002571 +4.22% 💹
SLP $0.000616 +3.88% 💹
G $0.00405 +3.85% 💹
ASR $0.847 +3.80% 💹
AUCTION $3.599 +3.69% 💹
AGLD $0.1892 +3.61% 💹
Zone Innovation-Zone
GNS $0.755 +111.48% ✨🌀
PEPE $0.00000422 +11.05% 💹💹
GMX $8.56 +9.32% 💹
PENDLE $2.163 +8.37% 💹
SUSHI $0.239 +7.22% 💹
SYN $0.19314 +5.60% 💹
PEOPLE $0.00794 +5.03% 💹
DODO $0.02037 +5.00% 💹
RPL $1.755 +4.65% 💹
FLOKI $0.00002571 +4.22% 💹
SLP $0.000616 +3.88% 💹
G $0.00405 +3.85% 💹
ASR $0.847 +3.80% 💹
AUCTION $3.599 +3.69% 💹
AGLD $0.1892 +3.61% 💹
GNS $0.755 +111.48% ✨🌀
PEPE $0.00000422 +11.05% 💹💹
GMX $8.56 +9.32% 💹
PENDLE $2.163 +8.37% 💹
SUSHI $0.239 +7.22% 💹
SYN $0.19314 +5.60% 💹
PEOPLE $0.00794 +5.03% 💹
DODO $0.02037 +5.00% 💹
RPL $1.755 +4.65% 💹
FLOKI $0.00002571 +4.22% 💹
SLP $0.000616 +3.88% 💹
G $0.00405 +3.85% 💹
ASR $0.847 +3.80% 💹
AUCTION $3.599 +3.69% 💹
AGLD $0.1892 +3.61% 💹
265
Zone Layer1_Layer2
S $0.06126 +29.05% ✈🌥
CKB $0.001812 +28.51% ✈🌥
PLUME $0.02267 +19.82% 💹💹
METIS $4.02 +17.89% 💹💹
DYM $0.02112 +14.47% 💹💹
ICP $3.493 +13.96% 💹💹
NEAR $5.913 +11.88% 💹💹
MANTA $0.07369 +11.31% 💹💹
ALGO $0.1305 +10.78% 💹💹
FLOW $0.0355 +10.76% 💹💹
MEGA $0.04722 +9.33% 💹
ZEC $1,344.2 +9.24% 💹
LINEA $0.003116 +8.46% 💹
XTZ $0.3233 +8.45% 💹
VANA $1.124 +7.35% 💹
Zone Layer1_Layer2
S $0.06126 +29.05% ✈🌥
CKB $0.001812 +28.51% ✈🌥
PLUME $0.02267 +19.82% 💹💹
METIS $4.02 +17.89% 💹💹
DYM $0.02112 +14.47% 💹💹
ICP $3.493 +13.96% 💹💹
NEAR $5.913 +11.88% 💹💹
MANTA $0.07369 +11.31% 💹💹
ALGO $0.1305 +10.78% 💹💹
FLOW $0.0355 +10.76% 💹💹
MEGA $0.04722 +9.33% 💹
ZEC $1,344.2 +9.24% 💹
LINEA $0.003116 +8.46% 💹
XTZ $0.3233 +8.45% 💹
VANA $1.124 +7.35% 💹
S $0.06126 +29.05% ✈🌥
CKB $0.001812 +28.51% ✈🌥
PLUME $0.02267 +19.82% 💹💹
METIS $4.02 +17.89% 💹💹
DYM $0.02112 +14.47% 💹💹
ICP $3.493 +13.96% 💹💹
NEAR $5.913 +11.88% 💹💹
MANTA $0.07369 +11.31% 💹💹
ALGO $0.1305 +10.78% 💹💹
FLOW $0.0355 +10.76% 💹💹
MEGA $0.04722 +9.33% 💹
ZEC $1,344.2 +9.24% 💹
LINEA $0.003116 +8.46% 💹
XTZ $0.3233 +8.45% 💹
VANA $1.124 +7.35% 💹
1
1.1k
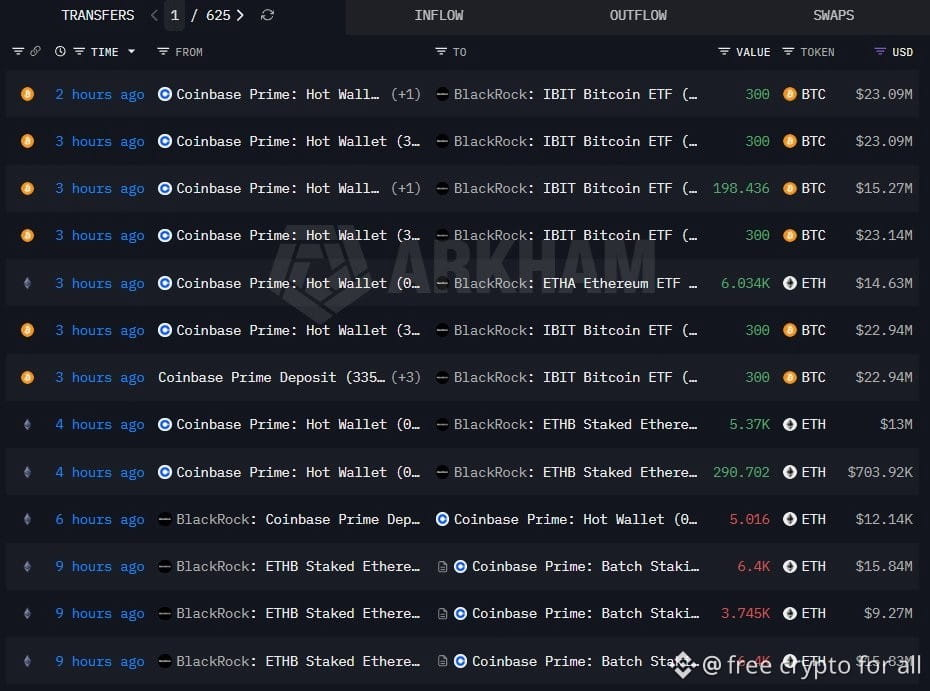
🚨HUGE: BlackRock has bought $1.08 BILLION of Bitcoin over the past 20 days through its IBIT ETF.
Inflows came on 7 of those 20 days, while Grayscale's GBTC net sold $254.7 MILLION in the same period, per Arkham.
🚨HUGE: BlackRock has bought $1.08 BILLION of Bitcoin over the past 20 days through its IBIT ETF.
Inflows came on 7 of those 20 days, while Grayscale's GBTC net sold $254.7 MILLION in the same period, per Arkham.
Inflows came on 7 of those 20 days, while Grayscale's GBTC net sold $254.7 MILLION in the same period, per Arkham.

73
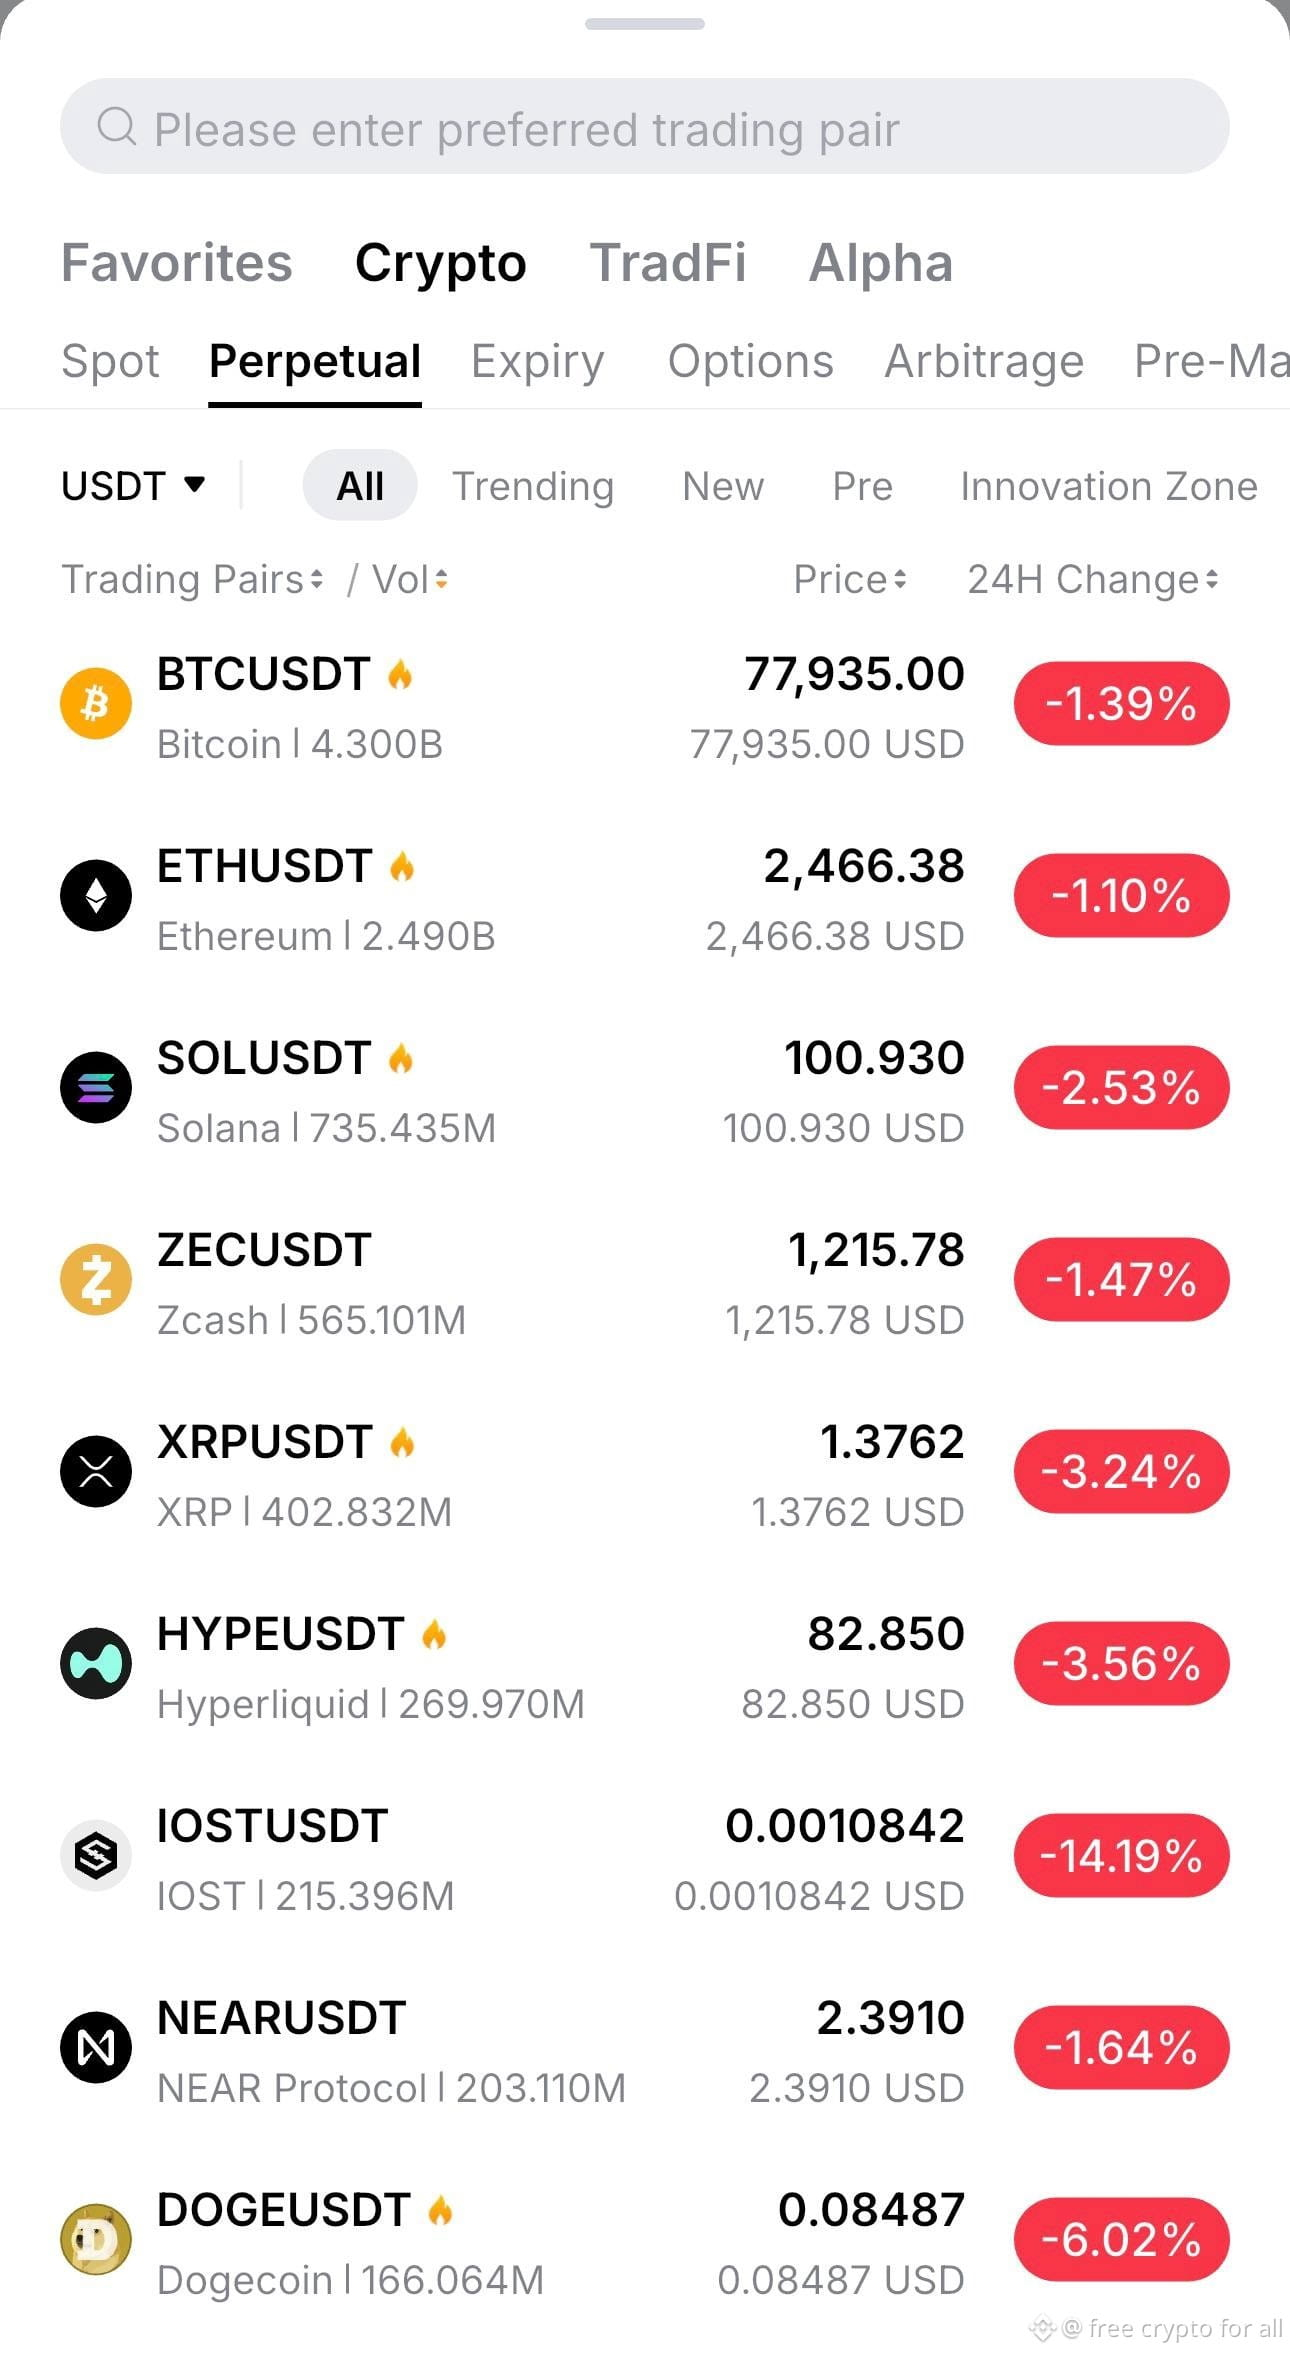
Top 20 Coins Market Cap tracker
# SYMBOL PRICE CAP
━━━━━━━━━━━━━━━
#1 BTC 78,511 1,576.7B
#2 ETH 2,480.9 302.75B
#3 USDT 1 183.39B
#4 BNB 722.92 96.27B
#5 XRP 1.39 87.26B
#6 USDC 1 74.35B
#7 SOL 102.02 59.81B
#8 TRX 0.34 32.33B
#9 HYPE 83.99 21.15B
#10 ZEC 1,236.8 20.86B
#11 DOGE 0.09 13.4B
#12 XMR 516.15 9.71B
#13 LINK 11.86 8.87B
#14 LEO 9.19 8.46B
#15 ADA 0.21 7.87B
#16 XLM 0.18 6.3B
#17 BCH 251.2 5.05B
#18 DAI 1 4.61B
#19 USDe 1 4.48B
#20 USD1 1 4.26B
Coins exited from top 20:
Top 20 Coins Market Cap tracker
# SYMBOL PRICE CAP
━━━━━━━━━━━━━━━
#1 BTC 78,511 1,576.7B
#2 ETH 2,480.9 302.75B
#3 USDT 1 183.39B
#4 BNB 722.92 96.27B
#5 XRP 1.39 87.26B
#6 USDC 1 74.35B
#7 SOL 102.02 59.81B
#8 TRX 0.34 32.33B
#9 HYPE 83.99 21.15B
#10 ZEC 1,236.8 20.86B
#11 DOGE 0.09 13.4B
#12 XMR 516.15 9.71B
#13 LINK 11.86 8.87B
#14 LEO 9.19 8.46B
#15 ADA 0.21 7.87B
#16 XLM 0.18 6.3B
#17 BCH 251.2 5.05B
#18 DAI 1 4.61B
#19 USDe 1 4.48B
#20 USD1 1 4.26B
Coins exited from top 20:
# SYMBOL PRICE CAP
━━━━━━━━━━━━━━━
#1 BTC 78,511 1,576.7B
#2 ETH 2,480.9 302.75B
#3 USDT 1 183.39B
#4 BNB 722.92 96.27B
#5 XRP 1.39 87.26B
#6 USDC 1 74.35B
#7 SOL 102.02 59.81B
#8 TRX 0.34 32.33B
#9 HYPE 83.99 21.15B
#10 ZEC 1,236.8 20.86B
#11 DOGE 0.09 13.4B
#12 XMR 516.15 9.71B
#13 LINK 11.86 8.87B
#14 LEO 9.19 8.46B
#15 ADA 0.21 7.87B
#16 XLM 0.18 6.3B
#17 BCH 251.2 5.05B
#18 DAI 1 4.61B
#19 USDe 1 4.48B
#20 USD1 1 4.26B
Coins exited from top 20:
57
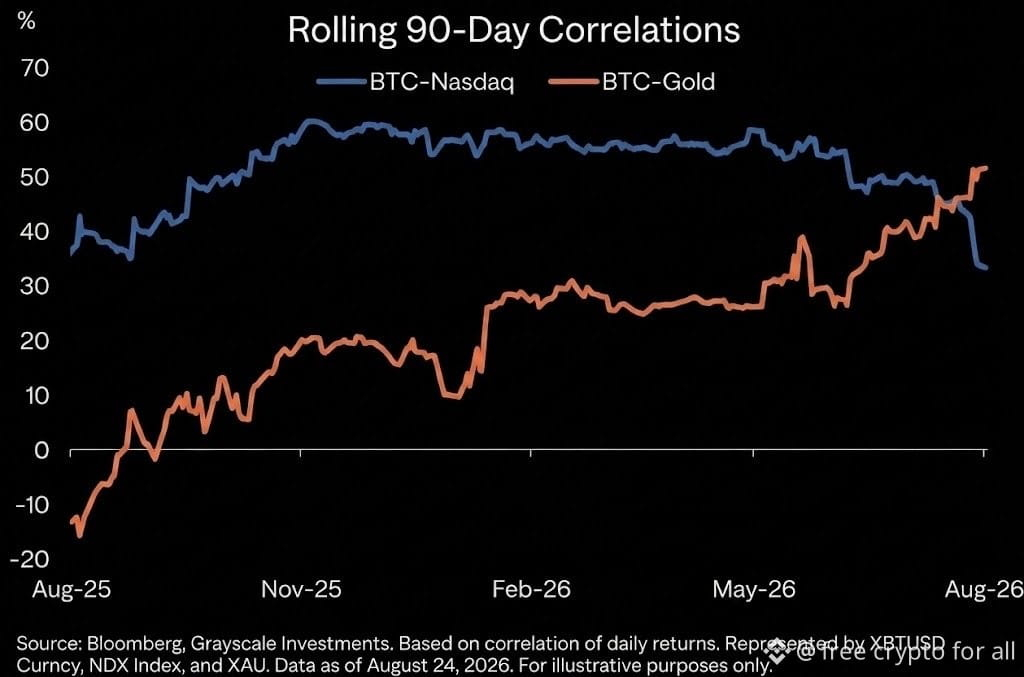
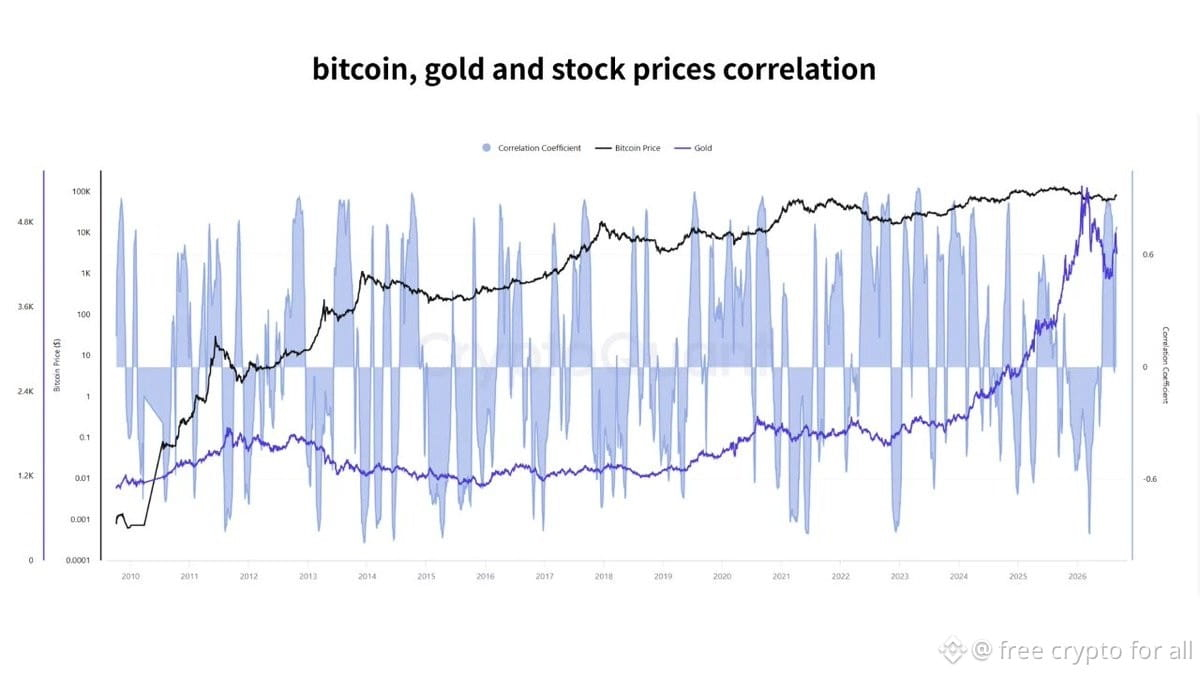
🚨BULLISH: Bitcoin’s correlation with GOLD hits a SIX-YEAR HIGH.
Bitwise says Bitcoin’s 90-day correlation with gold has surged past 50%, its highest level since 2020, when massive COVID-era stimulus reshaped global markets.
At the same time, Bitcoin’s correlation with the Nasdaq has collapsed to 33% from 60%+, signaling a major shift in how BTC is trading.
🚨BULLISH: Bitcoin’s correlation with GOLD hits a SIX-YEAR HIGH.
Bitwise says Bitcoin’s 90-day correlation with gold has surged past 50%, its highest level since 2020, when massive COVID-era stimulus reshaped global markets.
At the same time, Bitcoin’s correlation with the Nasdaq has collapsed to 33% from 60%+, signaling a major shift in how BTC is trading.
Bitwise says Bitcoin’s 90-day correlation with gold has surged past 50%, its highest level since 2020, when massive COVID-era stimulus reshaped global markets.
At the same time, Bitcoin’s correlation with the Nasdaq has collapsed to 33% from 60%+, signaling a major shift in how BTC is trading.

73
Standard Chartered Turns On Institutional BTC and ETH Spot Trading in the UAE.
Standard Chartered Turns On Institutional BTC and ETH Spot Trading in the UAE.

100
ເຂົ້າສູ່ລະບົບເພື່ອສຳຫຼວດເນື້ອຫາເພີ່ມເຕີມ
ເຂົ້າຮ່ວມກຸ່ມຜູ້ໃຊ້ຄຣິບໂຕທົ່ວໂລກໃນ Binance Square.
⚡️ ໄດ້ຮັບຂໍ້ມູນຫຼ້າສຸດ ແລະ ທີ່ມີປະໂຫຍດກ່ຽວກັບຄຣິບໂຕ.
💬 ໄດ້ຮັບຄວາມໄວ້ວາງໃຈຈາກຕະຫຼາດແລກປ່ຽນຄຣິບໂຕທີ່ໃຫຍ່ທີ່ສຸດໃນໂລກ.
👍 ຄົ້ນຫາຂໍ້ມູນເຊີງເລິກທີ່ແທ້ຈາກນັກສ້າງທີ່ໄດ້ຮັບການຢືນຢັນ.
ອີເມວ / ເບີໂທລະສັບ
ຫົວຂໍ້ທີ່ກໍາລັງນິຍົມ
USMidterms-WhatAreMarketsExpecting?
26,107 ຄັ້ງທີ່ເບິ່ງ
372 ກຳລັງສົນທະນາ
Democratic Congressional Sweep Shakes Trump Trades in AI Stocks and Crypto
Binance News
·3 ຖືກໃຈ
·1.5k ຄັ້ງທີ່ເບິ່ງ
USOctoberNFP-AreRateCutsStillPossible
211,722 ຄັ້ງທີ່ເບິ່ງ
1,673 ກຳລັງສົນທະນາ
AMDBeatsExpectations-AINarrativeContinues
4,326 ຄັ້ງທີ່ເບິ່ງ
138 ກຳລັງສົນທະນາ