
الزہرا ٹریڈ
23.4k ໂພສ

الزہرا ٹریڈ
ລາຍງານ
ບລັອກຜູ້ໃຊ້
Crypto Analyst Tracking whale movements
32 ກໍາລັງຕິດຕາມ
880 ຜູ້ຕິດຕາມ
4.5K+ Liked
ໂພສ
·
--
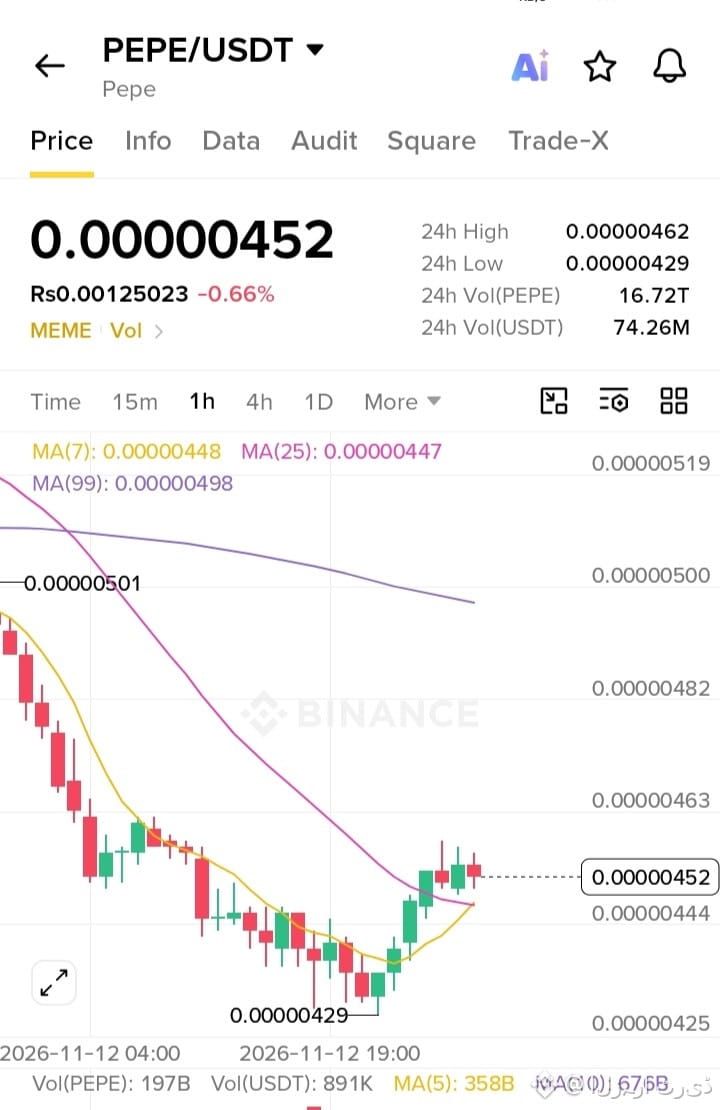
يتداول زوج $PEPE عند مستوى 0.00000452 مسجلاً تراجعاً طفيفاً بنسبة -0.66% خلال 24 ساعة، مع تماسك السعر أعلَى المتوسطين MA(7) عند 0.00000448 وMA(25) عند 0.00000447 واستقراره أدنى المتوسط MA(99) عند 0.00000498 إثر موجة تعافي من قاع 0.00000429.
🔥 الاتجاه: الشراء (Long) لعملة $PEPE
{spot}(PEPEUSDT)
* Entry range: $0.00000440 – $0.00000455
* SL: $0.00000420
* TP 1: $0.00000480
* TP 2: $0.00000510
* TP 3: $0.00000550
تُظهر حركة السعر زخماً تعافياً قريباً ودفاعاً شرائياً أعلَى المتوسطات المتحركة قصيرة الأجل عقب ارتداد السعر من قاعدة الدعم. يحافظ السعر على دعم هيكلي صلب أعلَى خطي MA(7) وMA(25). يدعم هذا الإعداد الفني استمرار الصعود نحو أهداف مقاومة أعلى طالما استمر الدعم الفوري قرب 0.00000430 في الثبات.
يتداول زوج $PEPE عند مستوى 0.00000452 مسجلاً تراجعاً طفيفاً بنسبة -0.66% خلال 24 ساعة، مع تماسك السعر أعلَى المتوسطين MA(7) عند 0.00000448 وMA(25) عند 0.00000447 واستقراره أدنى المتوسط MA(99) عند 0.00000498 إثر موجة تعافي من قاع 0.00000429.
🔥 الاتجاه: الشراء (Long) لعملة $PEPE
* Entry range: $0.00000440 – $0.00000455
* SL: $0.00000420
* TP 1: $0.00000480
* TP 2: $0.00000510
* TP 3: $0.00000550
تُظهر حركة السعر زخماً تعافياً قريباً ودفاعاً شرائياً أعلَى المتوسطات المتحركة قصيرة الأجل عقب ارتداد السعر من قاعدة الدعم. يحافظ السعر على دعم هيكلي صلب أعلَى خطي MA(7) وMA(25). يدعم هذا الإعداد الفني استمرار الصعود نحو أهداف مقاومة أعلى طالما استمر الدعم الفوري قرب 0.00000430 في الثبات.
🔥 الاتجاه: الشراء (Long) لعملة $PEPE
* Entry range: $0.00000440 – $0.00000455
* SL: $0.00000420
* TP 1: $0.00000480
* TP 2: $0.00000510
* TP 3: $0.00000550
تُظهر حركة السعر زخماً تعافياً قريباً ودفاعاً شرائياً أعلَى المتوسطات المتحركة قصيرة الأجل عقب ارتداد السعر من قاعدة الدعم. يحافظ السعر على دعم هيكلي صلب أعلَى خطي MA(7) وMA(25). يدعم هذا الإعداد الفني استمرار الصعود نحو أهداف مقاومة أعلى طالما استمر الدعم الفوري قرب 0.00000430 في الثبات.
4
·
--
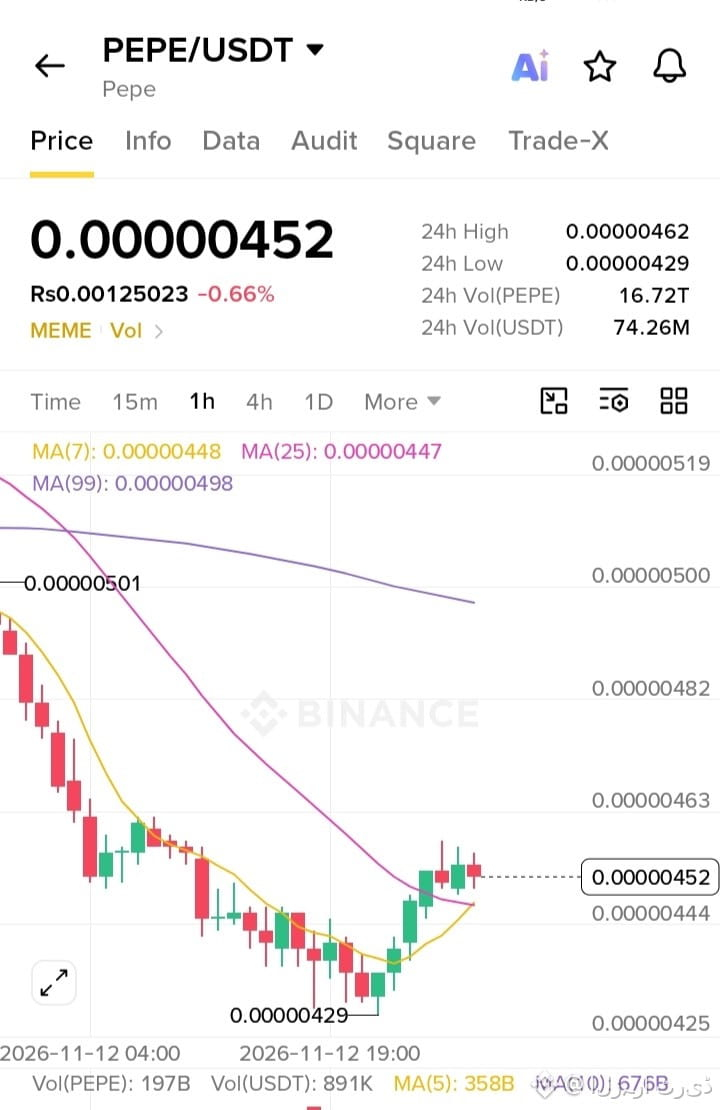
$PEPE is trading at 0.00000452, down -0.66% over the last 24 hours, consolidating above the MA(7) at 0.00000448 and MA(25) at 0.00000447 while remaining below the MA(99) at 0.00000498 following a recovery rally from its 0.00000429 low.
🔥 Bias: Long $PEPE
{spot}(PEPEUSDT)
* Entry range: $0.00000440 – $0.00000455
* SL: $0.00000420
* TP 1: $0.00000480
* TP 2: $0.00000510
* TP 3: $0.00000550
Price action shows solid short-term recovery momentum and buying defense above the short-term moving averages following a bounce from the support base. The asset holds structural support above the MA(7) and MA(25) lines. This technical setup favors continued upward expansion toward higher resistance targets as long as support around 0.00000430 remains defended.
$PEPE is trading at 0.00000452, down -0.66% over the last 24 hours, consolidating above the MA(7) at 0.00000448 and MA(25) at 0.00000447 while remaining below the MA(99) at 0.00000498 following a recovery rally from its 0.00000429 low.
🔥 Bias: Long $PEPE
* Entry range: $0.00000440 – $0.00000455
* SL: $0.00000420
* TP 1: $0.00000480
* TP 2: $0.00000510
* TP 3: $0.00000550
Price action shows solid short-term recovery momentum and buying defense above the short-term moving averages following a bounce from the support base. The asset holds structural support above the MA(7) and MA(25) lines. This technical setup favors continued upward expansion toward higher resistance targets as long as support around 0.00000430 remains defended.
🔥 Bias: Long $PEPE
* Entry range: $0.00000440 – $0.00000455
* SL: $0.00000420
* TP 1: $0.00000480
* TP 2: $0.00000510
* TP 3: $0.00000550
Price action shows solid short-term recovery momentum and buying defense above the short-term moving averages following a bounce from the support base. The asset holds structural support above the MA(7) and MA(25) lines. This technical setup favors continued upward expansion toward higher resistance targets as long as support around 0.00000430 remains defended.
7
·
--
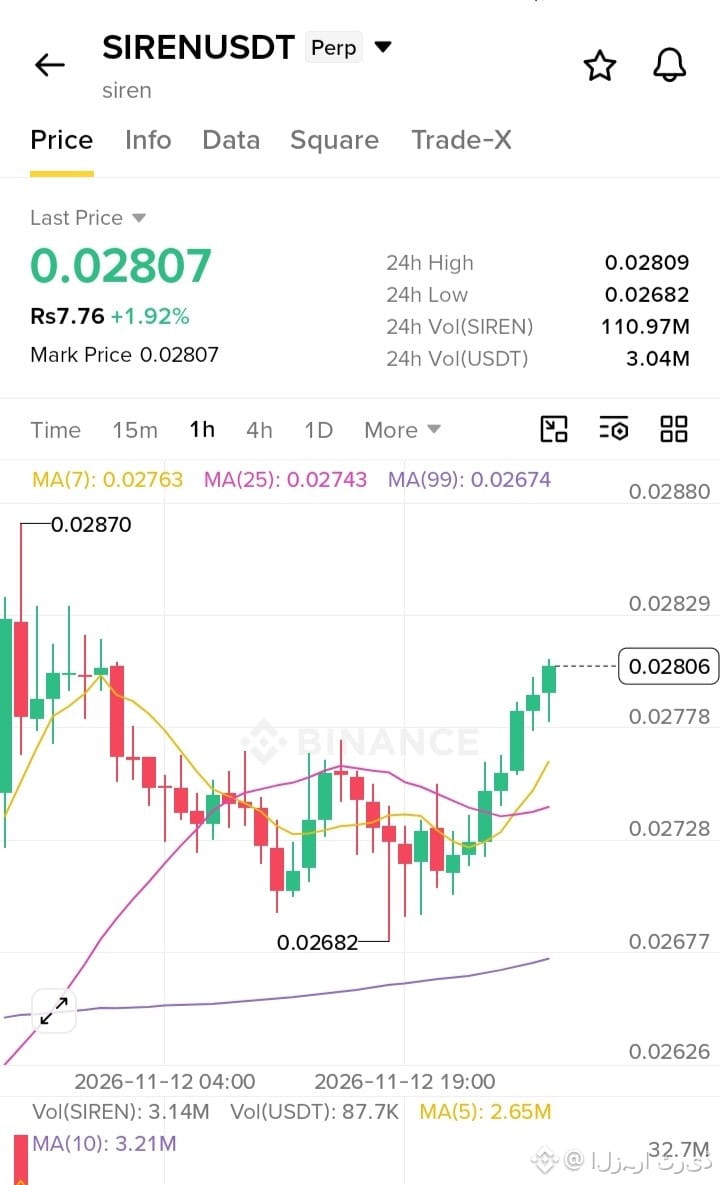
$SIREN is trading at 0.02807, up +1.92% over the last 24 hours, maintaining strong bullish momentum above key moving averages including the MA(7) at 0.02763, MA(25) at 0.02743, and MA(99) at 0.02674 following a robust recovery rally from its 0.02682 low.
🔥 Bias: Long $SIREN
{future}(SIRENUSDT)
* Entry range: $0.02720 – $0.02810
* SL: $0.02580
* TP 1: $0.03000
* TP 2: $0.03250
* TP 3: $0.03550
Price action demonstrates solid upward momentum and buying defense above key short-term and long-term moving averages following a bounce from the support base. The asset holds structural support above the MA(7) and MA(25) lines. This technical setup favors continued upward expansion toward higher resistance targets as long as support around 0.02680 remains defended.
$SIREN is trading at 0.02807, up +1.92% over the last 24 hours, maintaining strong bullish momentum above key moving averages including the MA(7) at 0.02763, MA(25) at 0.02743, and MA(99) at 0.02674 following a robust recovery rally from its 0.02682 low.
🔥 Bias: Long $SIREN
* Entry range: $0.02720 – $0.02810
* SL: $0.02580
* TP 1: $0.03000
* TP 2: $0.03250
* TP 3: $0.03550
Price action demonstrates solid upward momentum and buying defense above key short-term and long-term moving averages following a bounce from the support base. The asset holds structural support above the MA(7) and MA(25) lines. This technical setup favors continued upward expansion toward higher resistance targets as long as support around 0.02680 remains defended.
🔥 Bias: Long $SIREN
* Entry range: $0.02720 – $0.02810
* SL: $0.02580
* TP 1: $0.03000
* TP 2: $0.03250
* TP 3: $0.03550
Price action demonstrates solid upward momentum and buying defense above key short-term and long-term moving averages following a bounce from the support base. The asset holds structural support above the MA(7) and MA(25) lines. This technical setup favors continued upward expansion toward higher resistance targets as long as support around 0.02680 remains defended.
11
·
--
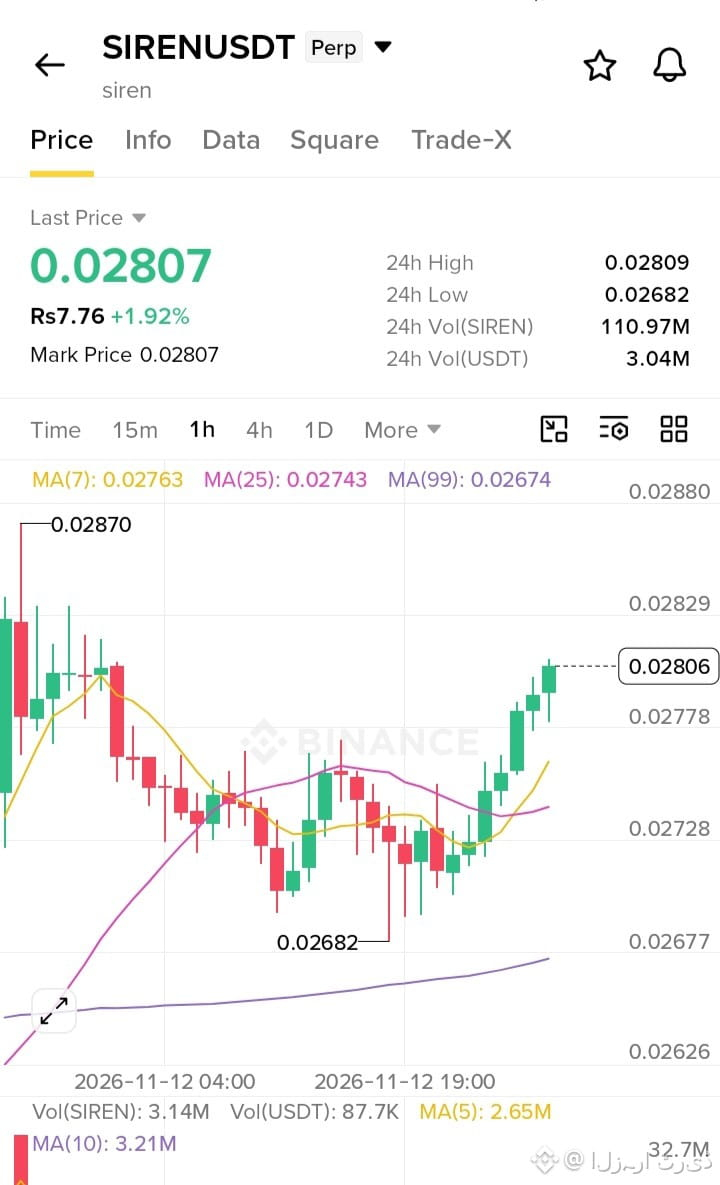
يتداول زوج $SIREN عند مستوى 0.02807 مسجلاً ارتفاعاً بنسبة +1.92% خلال 24 ساعة، مع الحفاظ على زخم صعودي قوي أعلَى المتوسطات المتحركة الرئيسية بما فيها MA(7) عند 0.02763 وMA(25) عند 0.02743 وMA(99) عند 0.02674 إثر موجة تعافي قوية من قاع 0.02682.
🔥 الاتجاه: الشراء (Long) لعملة $SIREN
{future}(SIRENUSDT)
* Entry range: $0.02720 – $0.02810
* SL: $0.02580
* TP 1: $0.03000
* TP 2: $0.03250
* TP 3: $0.03550
تُظهر حركة السعر زخماً صعودياً متماسكاً ودفاعاً شرائياً أعلَى المتوسطات المتحركة قصيرة وطويلة الأجل عقب الارتداد من قاعدة الدعم. يحافظ السعر على دعم هيكلي صلب أعلَى خطي MA(7) وMA(25). يدعم هذا الإعداد الفني استمرار الصعود نحو أهداف مقاومة أعلى طالما استمر الدعم الفوري قرب 0.02680 في الثبات.
يتداول زوج $SIREN عند مستوى 0.02807 مسجلاً ارتفاعاً بنسبة +1.92% خلال 24 ساعة، مع الحفاظ على زخم صعودي قوي أعلَى المتوسطات المتحركة الرئيسية بما فيها MA(7) عند 0.02763 وMA(25) عند 0.02743 وMA(99) عند 0.02674 إثر موجة تعافي قوية من قاع 0.02682.
🔥 الاتجاه: الشراء (Long) لعملة $SIREN
* Entry range: $0.02720 – $0.02810
* SL: $0.02580
* TP 1: $0.03000
* TP 2: $0.03250
* TP 3: $0.03550
تُظهر حركة السعر زخماً صعودياً متماسكاً ودفاعاً شرائياً أعلَى المتوسطات المتحركة قصيرة وطويلة الأجل عقب الارتداد من قاعدة الدعم. يحافظ السعر على دعم هيكلي صلب أعلَى خطي MA(7) وMA(25). يدعم هذا الإعداد الفني استمرار الصعود نحو أهداف مقاومة أعلى طالما استمر الدعم الفوري قرب 0.02680 في الثبات.
🔥 الاتجاه: الشراء (Long) لعملة $SIREN
* Entry range: $0.02720 – $0.02810
* SL: $0.02580
* TP 1: $0.03000
* TP 2: $0.03250
* TP 3: $0.03550
تُظهر حركة السعر زخماً صعودياً متماسكاً ودفاعاً شرائياً أعلَى المتوسطات المتحركة قصيرة وطويلة الأجل عقب الارتداد من قاعدة الدعم. يحافظ السعر على دعم هيكلي صلب أعلَى خطي MA(7) وMA(25). يدعم هذا الإعداد الفني استمرار الصعود نحو أهداف مقاومة أعلى طالما استمر الدعم الفوري قرب 0.02680 في الثبات.
8
·
--
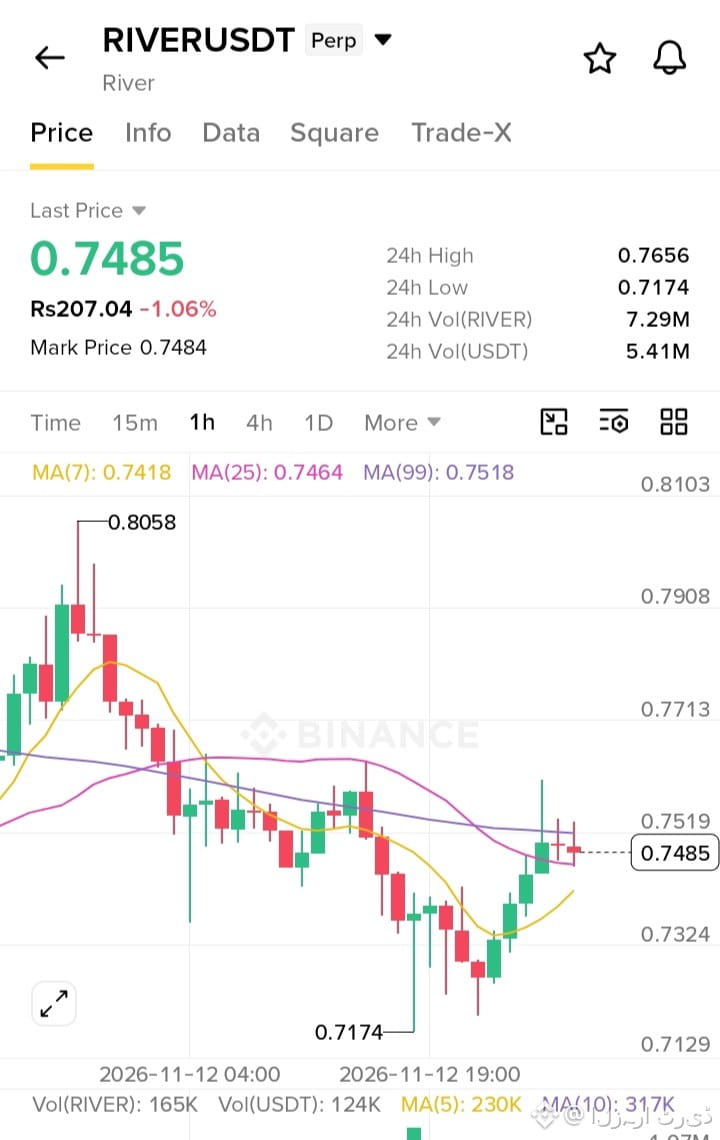
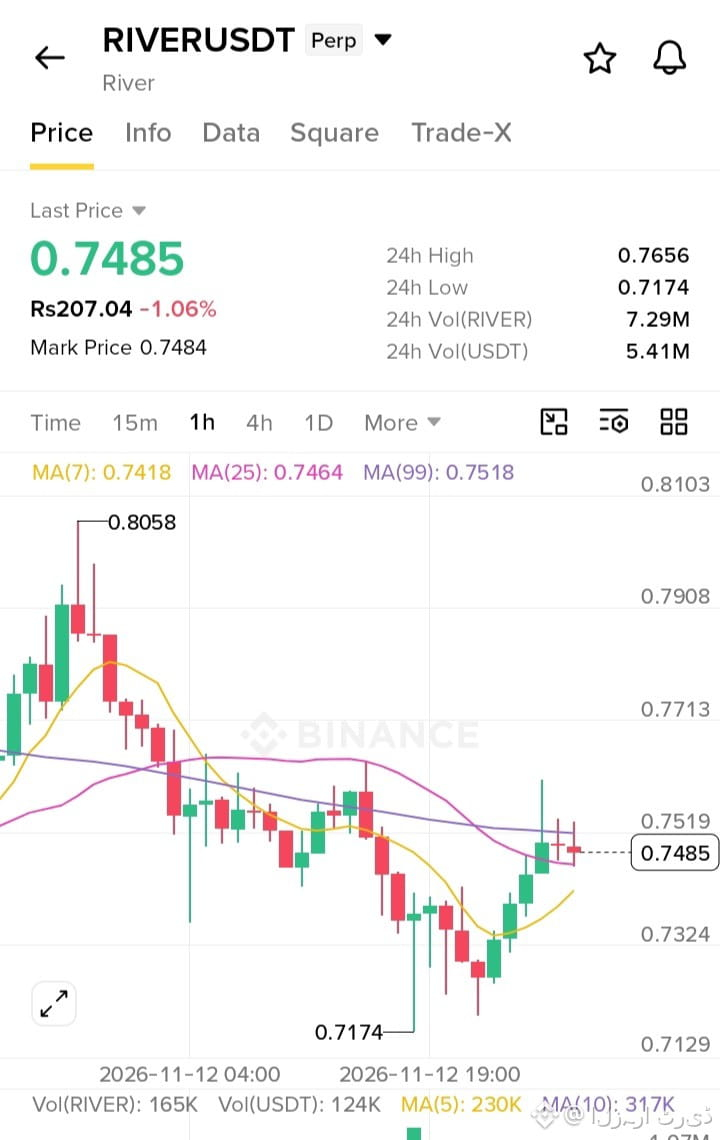
يتداول زوج $RIVER عند مستوى 0.7485 مسجلاً تراجعاً بنسبة -1.06% خلال 24 ساعة، مع تماسك السعر بالقرب من المتوسطين MA(7) عند 0.7418 وMA(25) عند 0.7464 واستقراره أدنى المتوسط MA(99) عند 0.7518 إثر موجة تعافي من قاع 0.7174.
🔻 الاتجاه: البيع (Short) لعملة $RIVER
{future}(RIVERUSDT)
* Entry range: $0.7420 – $0.7550
* SL: $0.7850
* TP 1: $0.7150
* TP 2: $0.6800
* TP 3: $0.6400
تُظهر حركة السعر ضغوطاً بيعية خفيفة عقب الرفض من مناطق التجميع المرتفعة، حيث يستقر السعر أدنى المتوسطات المتحركة الرئيسية. تدعم محاولات التعافي الضعيفة والمقاومة العلوية استمرار الاتجاه الهابط طالما ظلت المقاومة القريبة قرب 0.7650 صامدة.
يتداول زوج $RIVER عند مستوى 0.7485 مسجلاً تراجعاً بنسبة -1.06% خلال 24 ساعة، مع تماسك السعر بالقرب من المتوسطين MA(7) عند 0.7418 وMA(25) عند 0.7464 واستقراره أدنى المتوسط MA(99) عند 0.7518 إثر موجة تعافي من قاع 0.7174.
🔻 الاتجاه: البيع (Short) لعملة $RIVER
* Entry range: $0.7420 – $0.7550
* SL: $0.7850
* TP 1: $0.7150
* TP 2: $0.6800
* TP 3: $0.6400
تُظهر حركة السعر ضغوطاً بيعية خفيفة عقب الرفض من مناطق التجميع المرتفعة، حيث يستقر السعر أدنى المتوسطات المتحركة الرئيسية. تدعم محاولات التعافي الضعيفة والمقاومة العلوية استمرار الاتجاه الهابط طالما ظلت المقاومة القريبة قرب 0.7650 صامدة.
🔻 الاتجاه: البيع (Short) لعملة $RIVER
* Entry range: $0.7420 – $0.7550
* SL: $0.7850
* TP 1: $0.7150
* TP 2: $0.6800
* TP 3: $0.6400
تُظهر حركة السعر ضغوطاً بيعية خفيفة عقب الرفض من مناطق التجميع المرتفعة، حيث يستقر السعر أدنى المتوسطات المتحركة الرئيسية. تدعم محاولات التعافي الضعيفة والمقاومة العلوية استمرار الاتجاه الهابط طالما ظلت المقاومة القريبة قرب 0.7650 صامدة.
2
·
--
$RIVER is trading at 0.7485, down -1.06% over the last 24 hours, consolidating near the MA(7) at 0.7418 and MA(25) at 0.7464 while remaining below the MA(99) at 0.7518 following a recovery rally from its 0.7174 low.
🔻 Bias: Short $RIVER
{future}(RIVERUSDT)
* Entry range: $0.7420 – $0.7550
* SL: $0.7850
* TP 1: $0.7150
* TP 2: $0.6800
* TP 3: $0.6400
Price action shows mild downward pressure following a rejection from higher consolidation zones, remaining below major moving averages. Weak recovery attempts and overhead resistance favor continued downside movement as long as resistance near 0.7650 holds firm.
$RIVER is trading at 0.7485, down -1.06% over the last 24 hours, consolidating near the MA(7) at 0.7418 and MA(25) at 0.7464 while remaining below the MA(99) at 0.7518 following a recovery rally from its 0.7174 low.
🔻 Bias: Short $RIVER
* Entry range: $0.7420 – $0.7550
* SL: $0.7850
* TP 1: $0.7150
* TP 2: $0.6800
* TP 3: $0.6400
Price action shows mild downward pressure following a rejection from higher consolidation zones, remaining below major moving averages. Weak recovery attempts and overhead resistance favor continued downside movement as long as resistance near 0.7650 holds firm.
🔻 Bias: Short $RIVER
* Entry range: $0.7420 – $0.7550
* SL: $0.7850
* TP 1: $0.7150
* TP 2: $0.6800
* TP 3: $0.6400
Price action shows mild downward pressure following a rejection from higher consolidation zones, remaining below major moving averages. Weak recovery attempts and overhead resistance favor continued downside movement as long as resistance near 0.7650 holds firm.
6
·
--
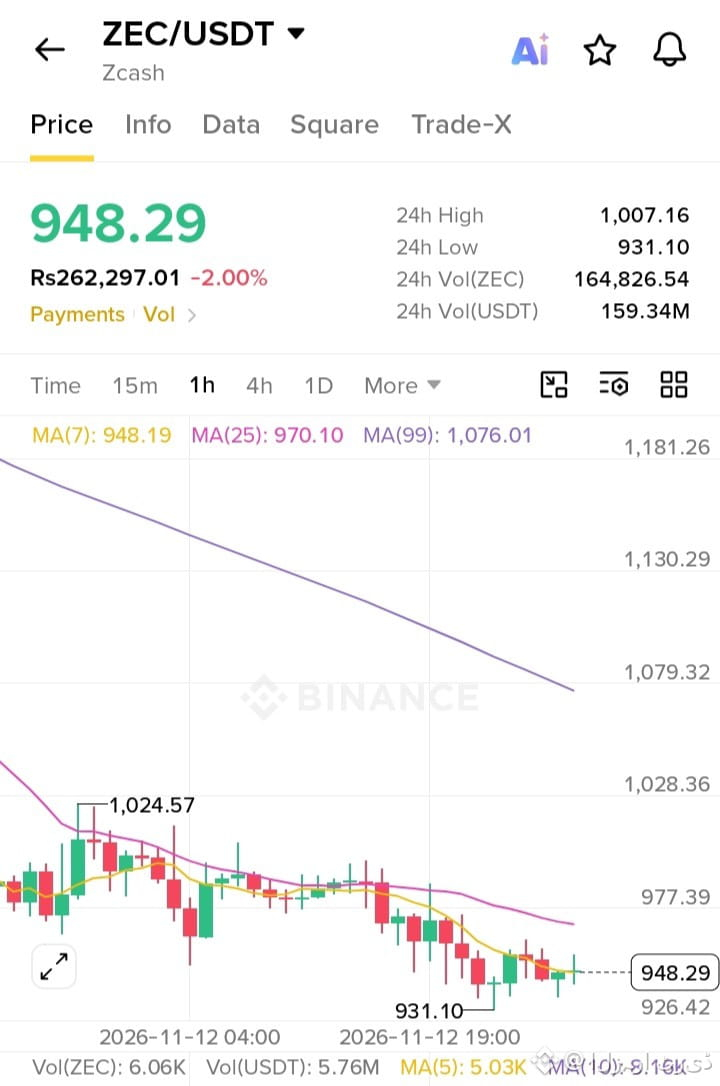
$ZEC is trading at 948.29, down -2.00% over the last 24 hours, consolidating near its support low of 931.10 and remaining below key moving averages including the MA(7) at 948.19, MA(25) at 970.10, and MA(99) at 1,076.01 following a pullback from higher levels.
🔻 Bias: Short $ZEC
{future}(ZECUSDT)
* Entry range: $940.00 – $965.00
* SL: $1,010.00
* TP 1: $915.00
* TP 2: $885.00
* TP 3: $850.00
Price action shows mild downward pressure following a rejection from higher consolidation zones, remaining below major moving averages. Weak recovery attempts and overhead resistance favor continued downside movement as long as resistance near 975.00 holds firm.
$ZEC is trading at 948.29, down -2.00% over the last 24 hours, consolidating near its support low of 931.10 and remaining below key moving averages including the MA(7) at 948.19, MA(25) at 970.10, and MA(99) at 1,076.01 following a pullback from higher levels.
🔻 Bias: Short $ZEC
* Entry range: $940.00 – $965.00
* SL: $1,010.00
* TP 1: $915.00
* TP 2: $885.00
* TP 3: $850.00
Price action shows mild downward pressure following a rejection from higher consolidation zones, remaining below major moving averages. Weak recovery attempts and overhead resistance favor continued downside movement as long as resistance near 975.00 holds firm.
🔻 Bias: Short $ZEC
* Entry range: $940.00 – $965.00
* SL: $1,010.00
* TP 1: $915.00
* TP 2: $885.00
* TP 3: $850.00
Price action shows mild downward pressure following a rejection from higher consolidation zones, remaining below major moving averages. Weak recovery attempts and overhead resistance favor continued downside movement as long as resistance near 975.00 holds firm.
7
·
--
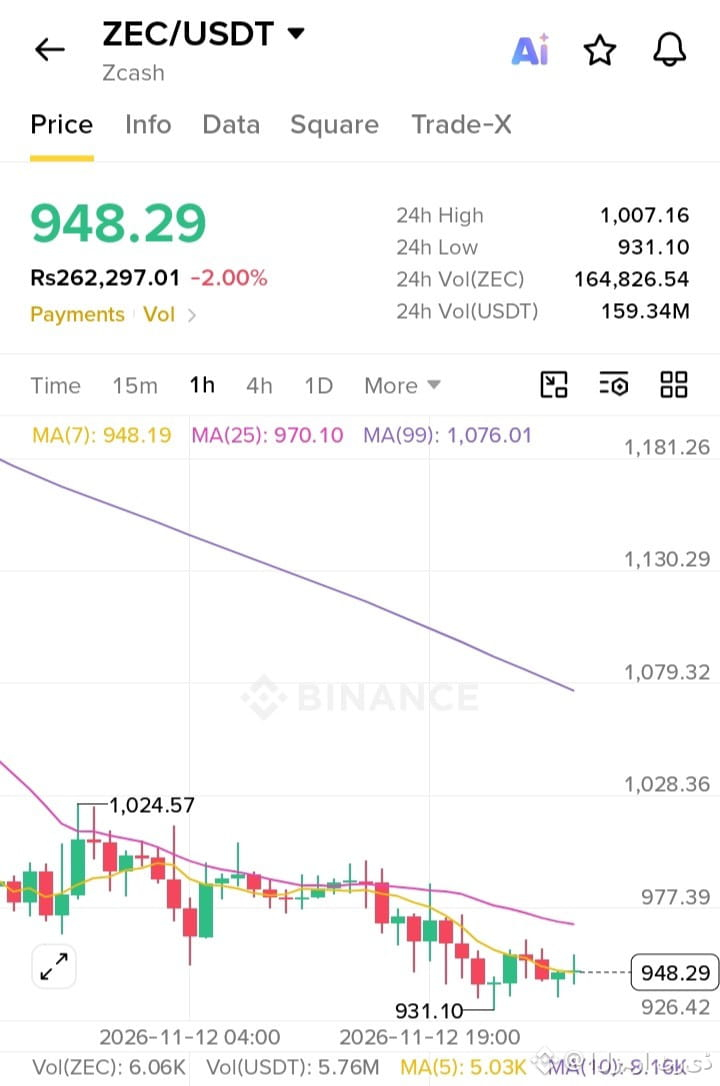
يتداول زوج $ZEC عند مستوى 948.29 مسجلاً تراجعاً بنسبة -2.00% خلال 24 ساعة، مع تماسك السعر بالقرب من قاع الدعم عند 931.10 واستقراره أدنى المتوسطات المتحركة الرئيسية بما فيها MA(7) عند 948.19 وMA(25) عند 970.10 وMA(99) عند 1,076.01 إثر تراجع طفيف من مستويات أعلى.
🔻 الاتجاه: البيع (Short) لعملة $ZEC
{future}(ZECUSDT)
* Entry range: $940.00 – $965.00
* SL: $1,010.00
* TP 1: $915.00
* TP 2: $885.00
* TP 3: $850.00
تُظهر حركة السعر ضغوطاً بيعية خفيفة عقب الرفض من مناطق التجميع المرتفعة، حيث يستقر السعر أدنى المتوسطات المتحركة الرئيسية. تدعم محاولات التعافي الضعيفة والمقاومة العلوية استمرار الاتجاه الهابط طالما ظلت المقاومة القريبة قرب 975.00 صامدة.
يتداول زوج $ZEC عند مستوى 948.29 مسجلاً تراجعاً بنسبة -2.00% خلال 24 ساعة، مع تماسك السعر بالقرب من قاع الدعم عند 931.10 واستقراره أدنى المتوسطات المتحركة الرئيسية بما فيها MA(7) عند 948.19 وMA(25) عند 970.10 وMA(99) عند 1,076.01 إثر تراجع طفيف من مستويات أعلى.
🔻 الاتجاه: البيع (Short) لعملة $ZEC
* Entry range: $940.00 – $965.00
* SL: $1,010.00
* TP 1: $915.00
* TP 2: $885.00
* TP 3: $850.00
تُظهر حركة السعر ضغوطاً بيعية خفيفة عقب الرفض من مناطق التجميع المرتفعة، حيث يستقر السعر أدنى المتوسطات المتحركة الرئيسية. تدعم محاولات التعافي الضعيفة والمقاومة العلوية استمرار الاتجاه الهابط طالما ظلت المقاومة القريبة قرب 975.00 صامدة.
🔻 الاتجاه: البيع (Short) لعملة $ZEC
* Entry range: $940.00 – $965.00
* SL: $1,010.00
* TP 1: $915.00
* TP 2: $885.00
* TP 3: $850.00
تُظهر حركة السعر ضغوطاً بيعية خفيفة عقب الرفض من مناطق التجميع المرتفعة، حيث يستقر السعر أدنى المتوسطات المتحركة الرئيسية. تدعم محاولات التعافي الضعيفة والمقاومة العلوية استمرار الاتجاه الهابط طالما ظلت المقاومة القريبة قرب 975.00 صامدة.
7
·
--
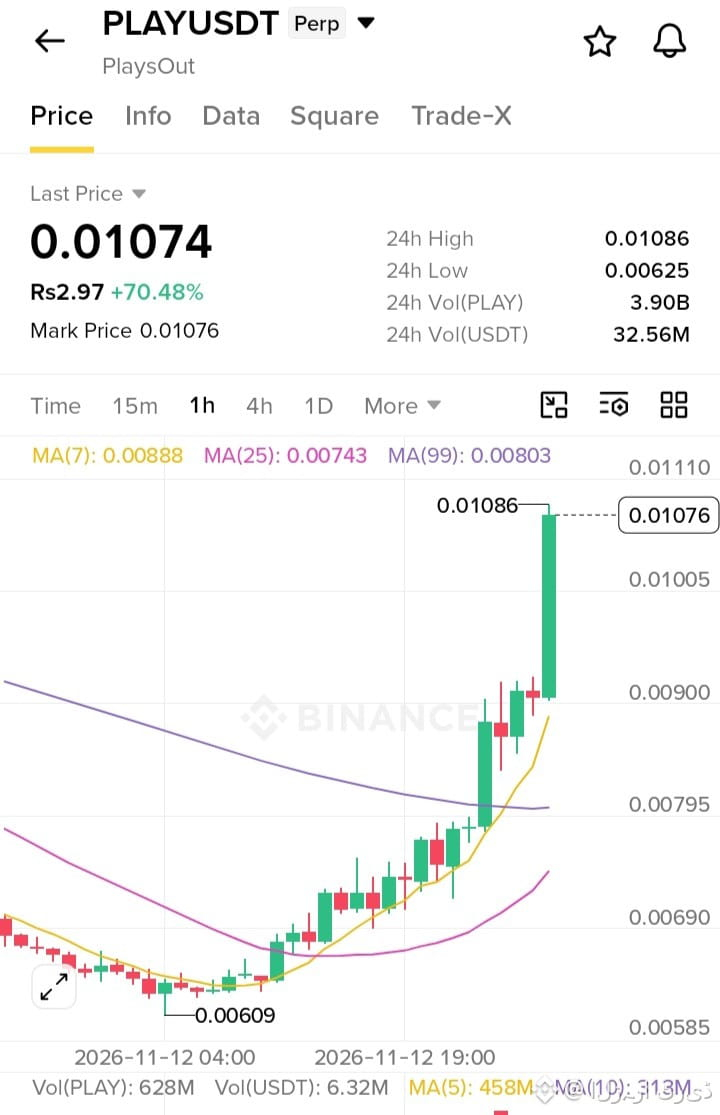
يتداول زوج $PLAY عند مستوى 0.01074 مسجلاً ارتفاعاً بنسبة +70.48% خلال 24 ساعة، مع الحفاظ على زخم صعودي قوي أعلَى المتوسطات المتحركة الرئيسية بما فيها MA(7) عند 0.00888 وMA(25) عند 0.00743 وMA(99) عند 0.00803 إثر انطلاقة انفجارية نحو قمة 0.01086.
🔥 الاتجاه: الشراء (Long) لعملة $PLAY
{future}(PLAYUSDT)
* Entry range: $0.01000 – $0.01080
* SL: $0.00850
* TP 1: $0.01250
* TP 2: $0.01450
* TP 3: $0.01700
تُظهر حركة السعر اندفاعاً صعودياً جارحاً وحجم تداول شرائي كثيف عقب اختراق صاعد قوي من قاعدة الدعم عند 0.00609. يحافظ السعر على دعم هيكلي صلب أعلَى المتوسطات المتحركة قصيرة وطويلة الأجل. يدعم هذا الإعداد الفني استمرار الصعود نحو أهداف مقاومة أعلى طالما استمر الدعم الفوري قرب 0.00900 في الثبات.
يتداول زوج $PLAY عند مستوى 0.01074 مسجلاً ارتفاعاً بنسبة +70.48% خلال 24 ساعة، مع الحفاظ على زخم صعودي قوي أعلَى المتوسطات المتحركة الرئيسية بما فيها MA(7) عند 0.00888 وMA(25) عند 0.00743 وMA(99) عند 0.00803 إثر انطلاقة انفجارية نحو قمة 0.01086.
🔥 الاتجاه: الشراء (Long) لعملة $PLAY
* Entry range: $0.01000 – $0.01080
* SL: $0.00850
* TP 1: $0.01250
* TP 2: $0.01450
* TP 3: $0.01700
تُظهر حركة السعر اندفاعاً صعودياً جارحاً وحجم تداول شرائي كثيف عقب اختراق صاعد قوي من قاعدة الدعم عند 0.00609. يحافظ السعر على دعم هيكلي صلب أعلَى المتوسطات المتحركة قصيرة وطويلة الأجل. يدعم هذا الإعداد الفني استمرار الصعود نحو أهداف مقاومة أعلى طالما استمر الدعم الفوري قرب 0.00900 في الثبات.
🔥 الاتجاه: الشراء (Long) لعملة $PLAY
* Entry range: $0.01000 – $0.01080
* SL: $0.00850
* TP 1: $0.01250
* TP 2: $0.01450
* TP 3: $0.01700
تُظهر حركة السعر اندفاعاً صعودياً جارحاً وحجم تداول شرائي كثيف عقب اختراق صاعد قوي من قاعدة الدعم عند 0.00609. يحافظ السعر على دعم هيكلي صلب أعلَى المتوسطات المتحركة قصيرة وطويلة الأجل. يدعم هذا الإعداد الفني استمرار الصعود نحو أهداف مقاومة أعلى طالما استمر الدعم الفوري قرب 0.00900 في الثبات.
3
·
--
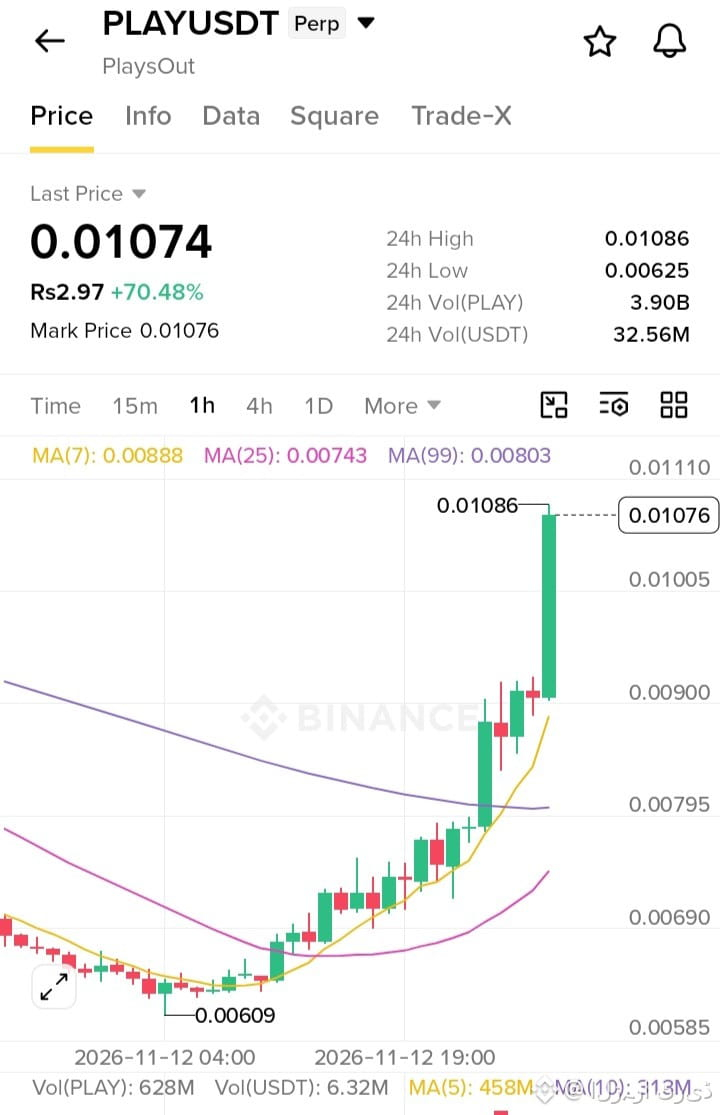
$PLAY is trading at 0.01074, up +70.48% over the last 24 hours, maintaining strong bullish momentum well above key moving averages including the MA(7) at 0.00888, MA(25) at 0.00743, and MA(99) at 0.00803 following an explosive breakout rally toward its 0.01086 high.
🔥 Bias: Long $PLAY
{future}(PLAYUSDT)
* Entry range: $0.01000 – $0.01080
* SL: $0.00850
* TP 1: $0.01250
* TP 2: $0.01450
* TP 3: $0.01700
Price action demonstrates aggressive upward momentum and heavy buying volume following a powerful breakout from the 0.00609 support base. The asset holds strong structural support above short-term and long-term moving averages. This technical setup favors continued upward expansion toward higher resistance targets as long as support around 0.00900 remains defended.
$PLAY is trading at 0.01074, up +70.48% over the last 24 hours, maintaining strong bullish momentum well above key moving averages including the MA(7) at 0.00888, MA(25) at 0.00743, and MA(99) at 0.00803 following an explosive breakout rally toward its 0.01086 high.
🔥 Bias: Long $PLAY
* Entry range: $0.01000 – $0.01080
* SL: $0.00850
* TP 1: $0.01250
* TP 2: $0.01450
* TP 3: $0.01700
Price action demonstrates aggressive upward momentum and heavy buying volume following a powerful breakout from the 0.00609 support base. The asset holds strong structural support above short-term and long-term moving averages. This technical setup favors continued upward expansion toward higher resistance targets as long as support around 0.00900 remains defended.
🔥 Bias: Long $PLAY
* Entry range: $0.01000 – $0.01080
* SL: $0.00850
* TP 1: $0.01250
* TP 2: $0.01450
* TP 3: $0.01700
Price action demonstrates aggressive upward momentum and heavy buying volume following a powerful breakout from the 0.00609 support base. The asset holds strong structural support above short-term and long-term moving averages. This technical setup favors continued upward expansion toward higher resistance targets as long as support around 0.00900 remains defended.
22
·
--
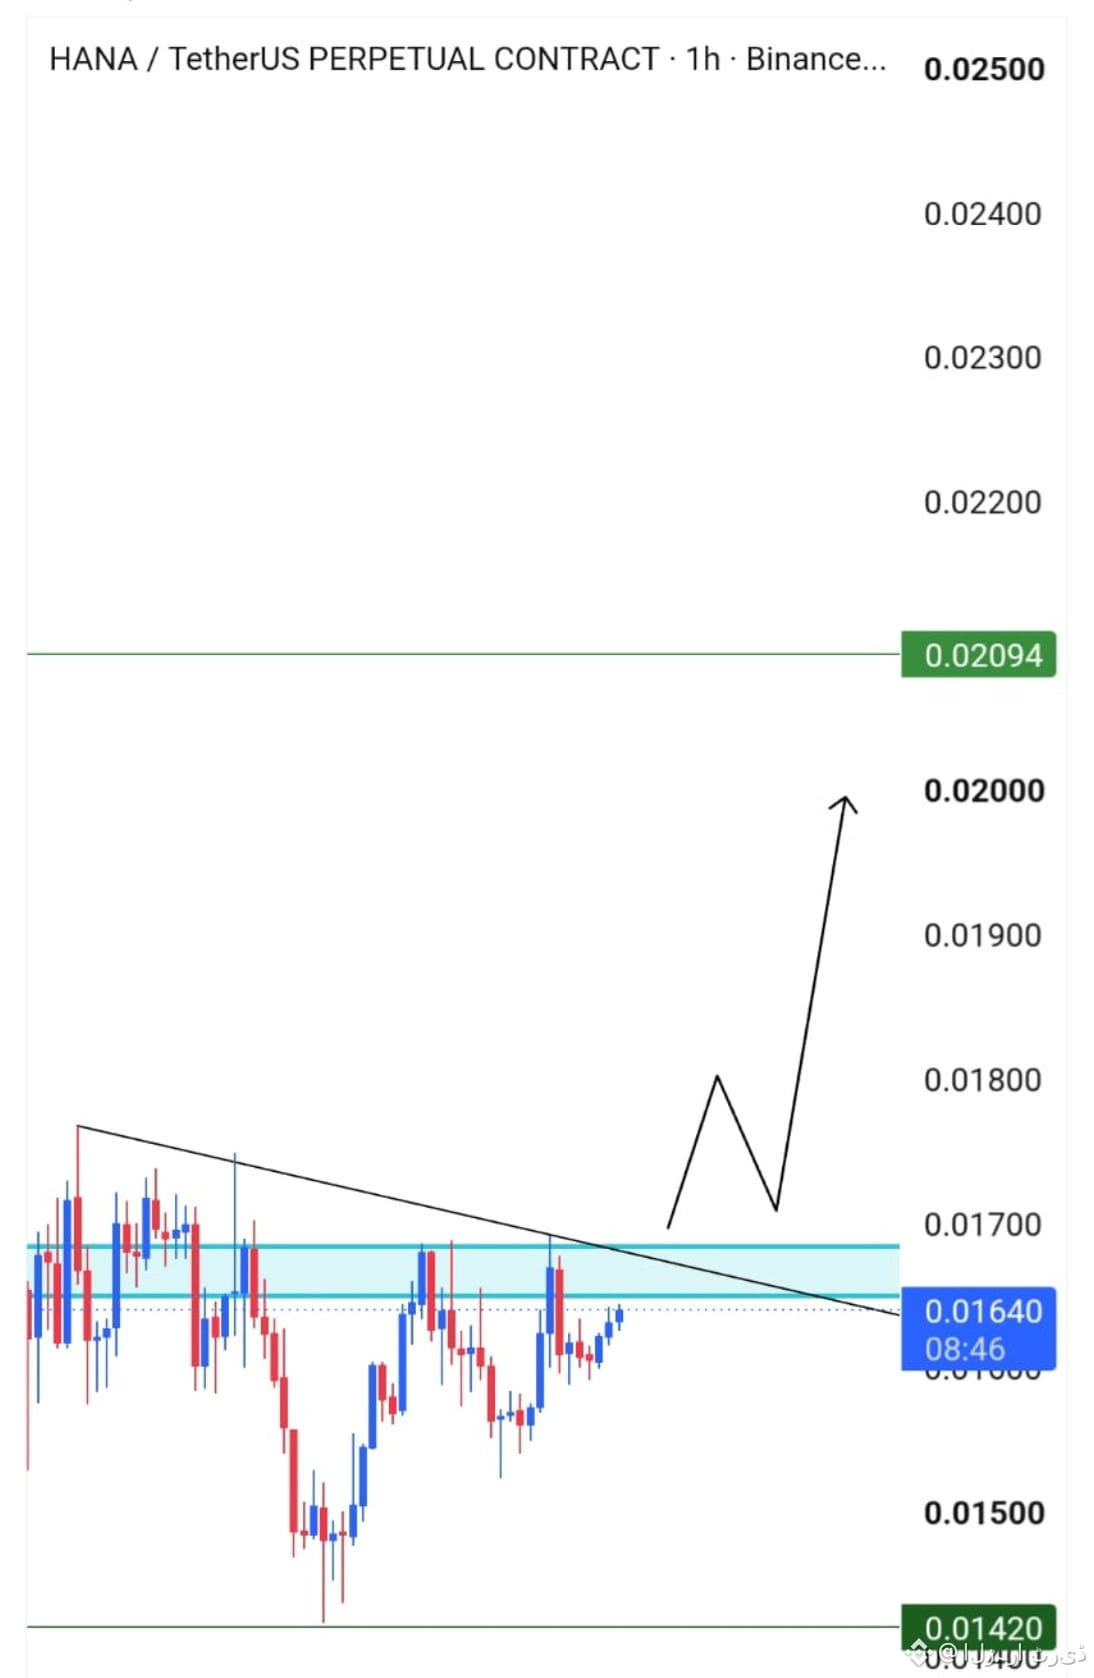
$HANA 🔥 READY FOR THE NEXT BIG MOVE!
$HANA
{future}(HANAUSDT)
is consolidating around its entry zone, building momentum for a potential breakout.
If the 4H candle closes above the trendline, it could confirm bullish continuation and open the door for another upward move. 🚀
Keep watching the breakout level!
$HANA 🔥 READY FOR THE NEXT BIG MOVE!
$HANA
is consolidating around its entry zone, building momentum for a potential breakout.
If the 4H candle closes above the trendline, it could confirm bullish continuation and open the door for another upward move. 🚀
Keep watching the breakout level!
$HANA
is consolidating around its entry zone, building momentum for a potential breakout.
If the 4H candle closes above the trendline, it could confirm bullish continuation and open the door for another upward move. 🚀
Keep watching the breakout level!
6
·
--
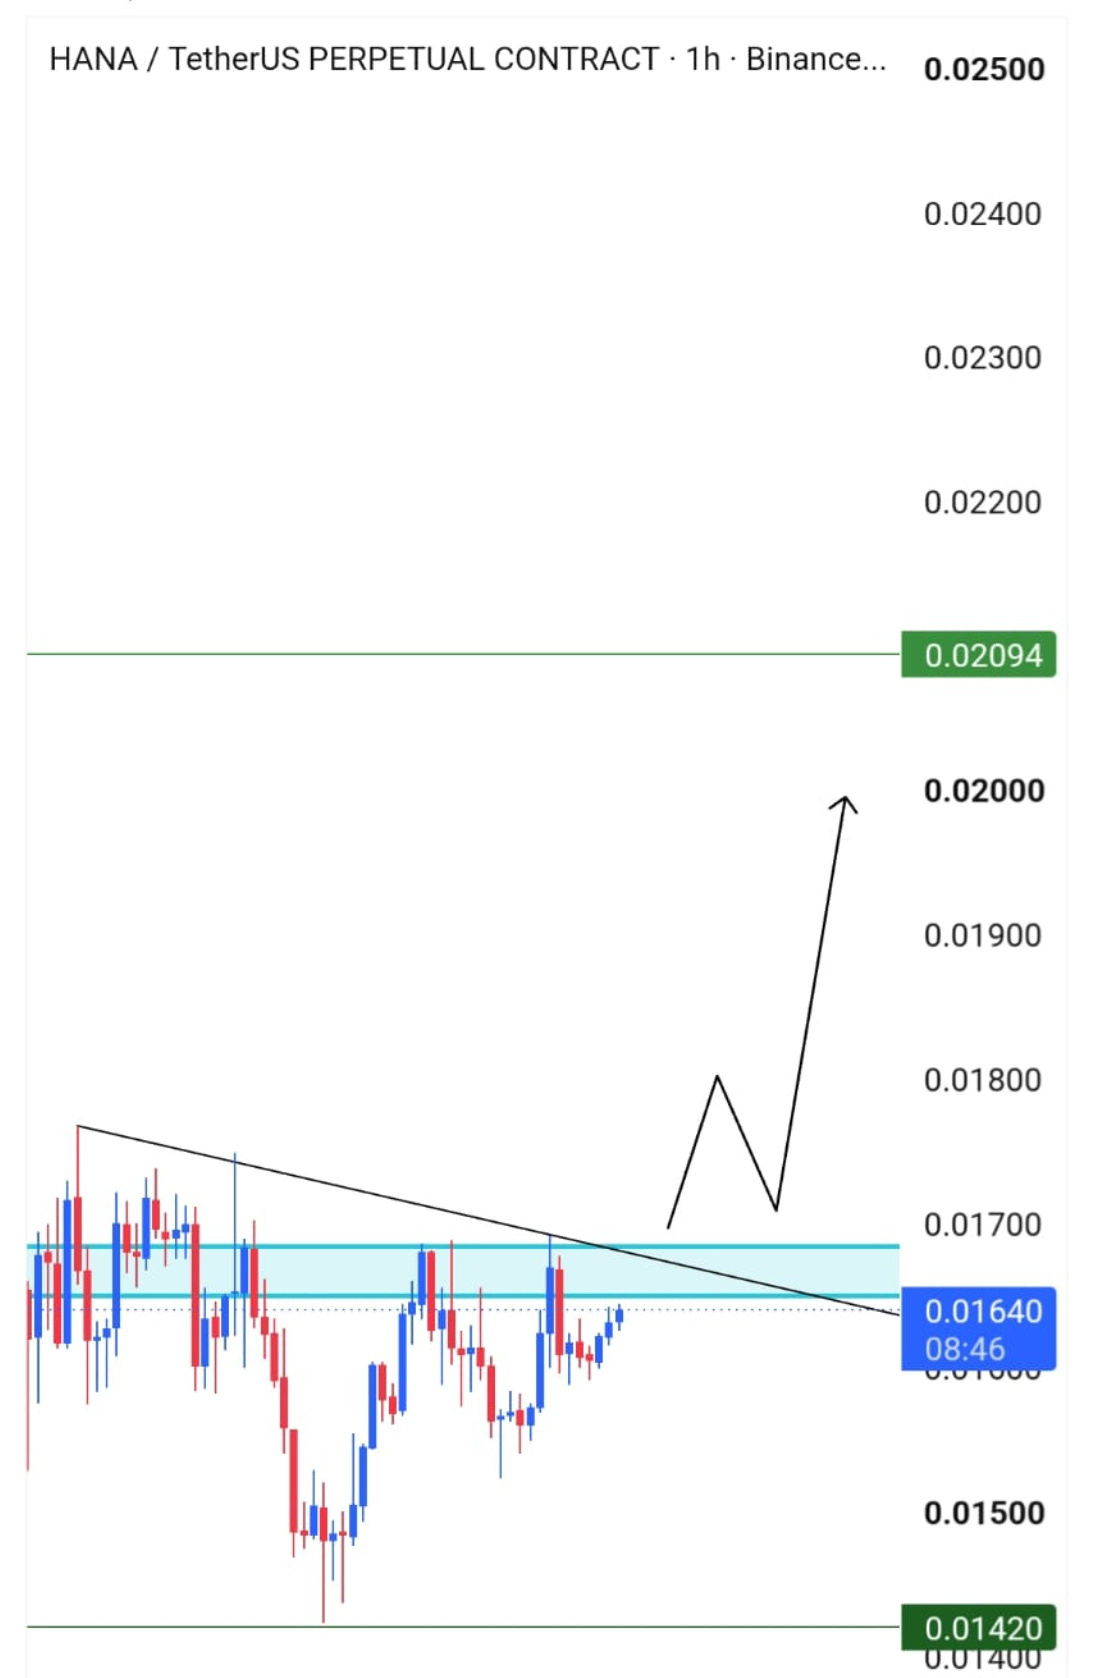
$HANA 🔥 تستعد لحركة صعودية قوية!
تتحرك عملة $HANA
{future}(HANAUSDT)
حاليًا في مرحلة تجميع بالقرب من منطقة الدخول، مع احتمال بناء زخم لاختراق جديد.
إذا أغلقت شمعة الأربع ساعات فوق خط الاتجاه، فقد يؤكد ذلك استمرار الاتجاه الصاعد ويفتح المجال لموجة ارتفاع جديدة. 🚀
راقبوا مستوى الاختراق جيدًا!
$HANA 🔥 تستعد لحركة صعودية قوية!
تتحرك عملة $HANA
حاليًا في مرحلة تجميع بالقرب من منطقة الدخول، مع احتمال بناء زخم لاختراق جديد.
إذا أغلقت شمعة الأربع ساعات فوق خط الاتجاه، فقد يؤكد ذلك استمرار الاتجاه الصاعد ويفتح المجال لموجة ارتفاع جديدة. 🚀
راقبوا مستوى الاختراق جيدًا!
تتحرك عملة $HANA
حاليًا في مرحلة تجميع بالقرب من منطقة الدخول، مع احتمال بناء زخم لاختراق جديد.
إذا أغلقت شمعة الأربع ساعات فوق خط الاتجاه، فقد يؤكد ذلك استمرار الاتجاه الصاعد ويفتح المجال لموجة ارتفاع جديدة. 🚀
راقبوا مستوى الاختراق جيدًا!
2
·
--
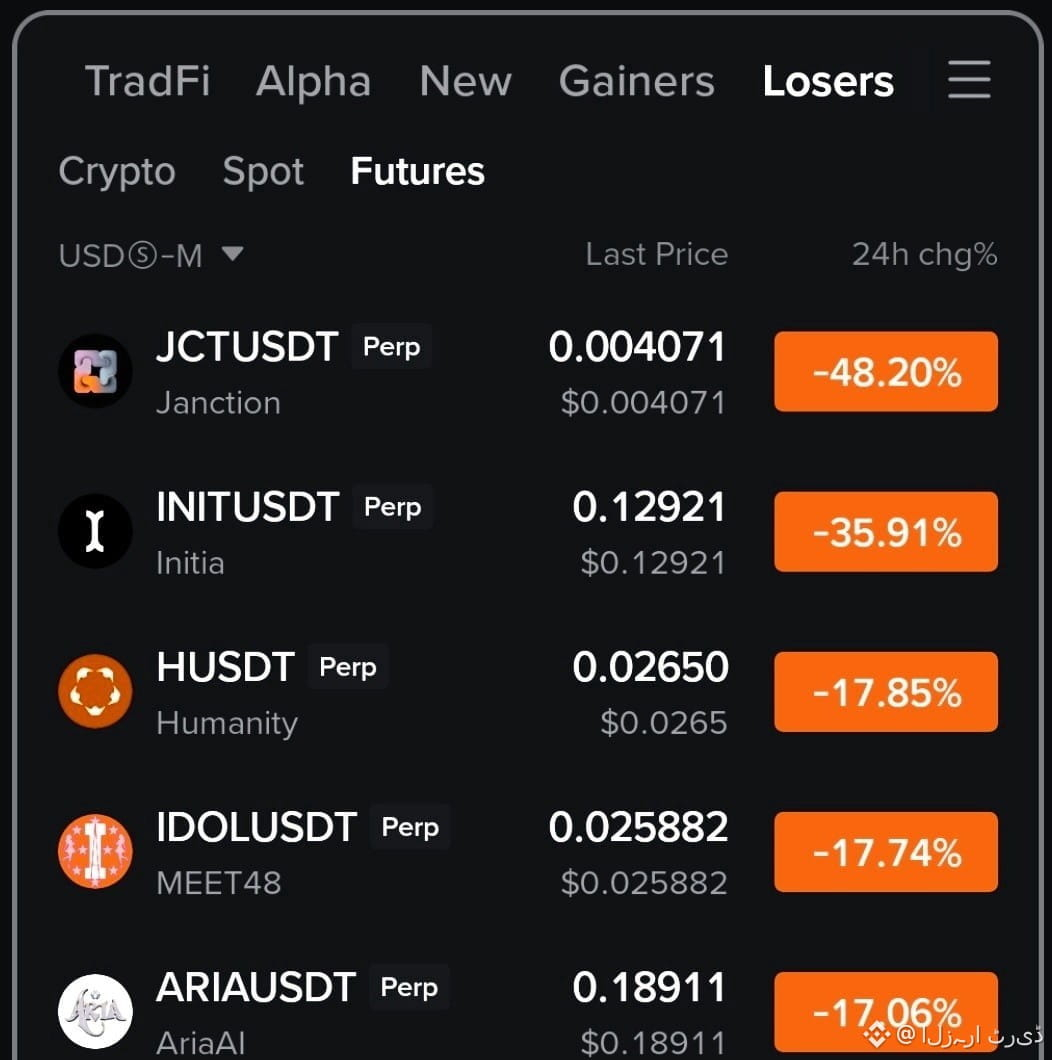
🔥 LOSERS OF THE DAY 🔆
Today's Top 3 Trending Losers:
🔻 $JCT
{future}(JCTUSDT)
🔻 $INIT
{future}(INITUSDT)
🔻 $ARIA
{future}(ARIAUSDT)
Keep an eye on these movers and watch for potential market opportunities! 📉
🔥 LOSERS OF THE DAY 🔆
Today's Top 3 Trending Losers:
🔻 $JCT
🔻 $INIT
🔻 $ARIA
Keep an eye on these movers and watch for potential market opportunities! 📉
Today's Top 3 Trending Losers:
🔻 $JCT
🔻 $INIT
🔻 $ARIA
Keep an eye on these movers and watch for potential market opportunities! 📉
20
·
--
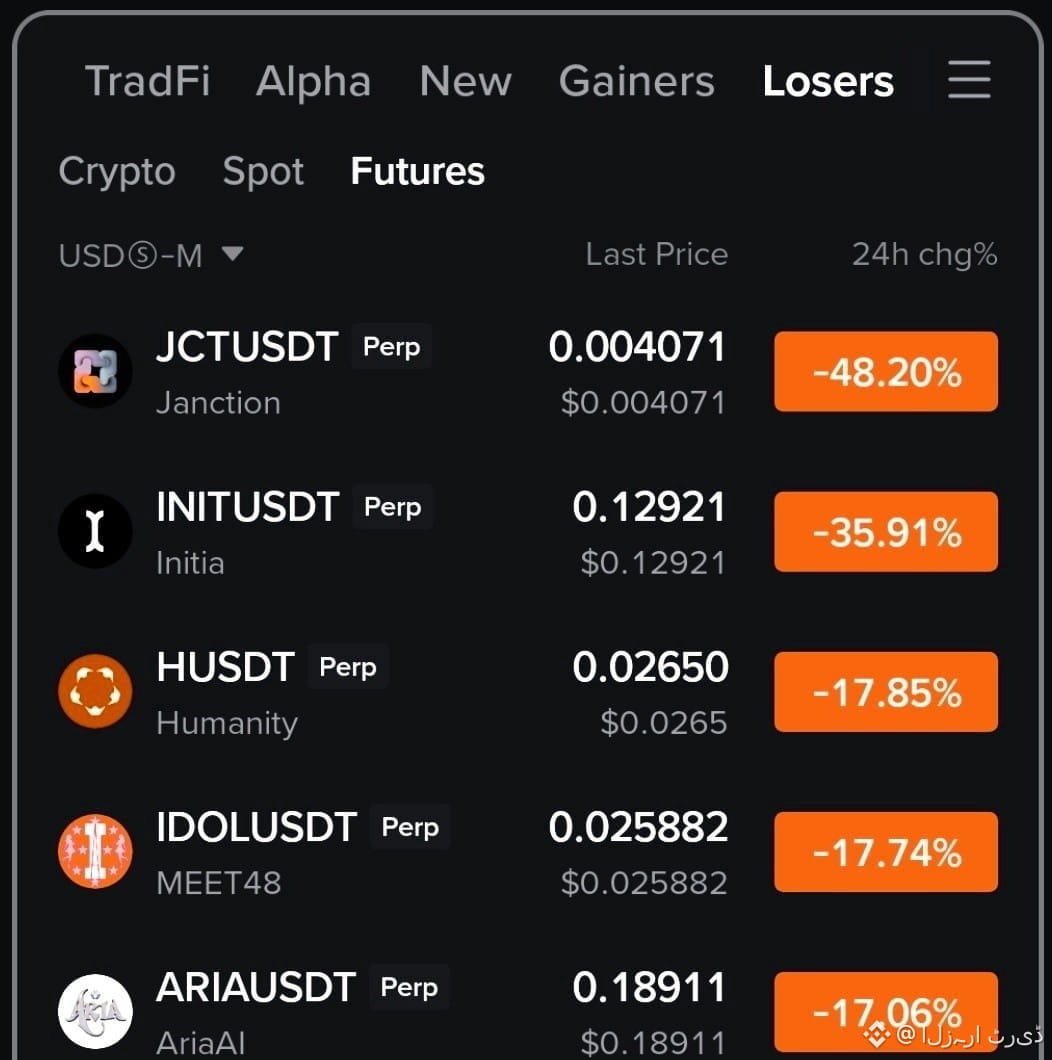
🔥 أكبر الخاسرين اليوم 🔆
أبرز 3 عملات تسجل تراجعًا اليوم:
🔻 $JCT
{future}(JCTUSDT)
🔻 $INIT
{future}(INITUSDT)
🔻 $ARIA
{future}(ARIAUSDT)
راقبوا حركة هذه العملات وابحثوا عن الفرص المحتملة في السوق! 📉
🔥 أكبر الخاسرين اليوم 🔆
أبرز 3 عملات تسجل تراجعًا اليوم:
🔻 $JCT
🔻 $INIT
🔻 $ARIA
راقبوا حركة هذه العملات وابحثوا عن الفرص المحتملة في السوق! 📉
أبرز 3 عملات تسجل تراجعًا اليوم:
🔻 $JCT
🔻 $INIT
🔻 $ARIA
راقبوا حركة هذه العملات وابحثوا عن الفرص المحتملة في السوق! 📉
27
·
--
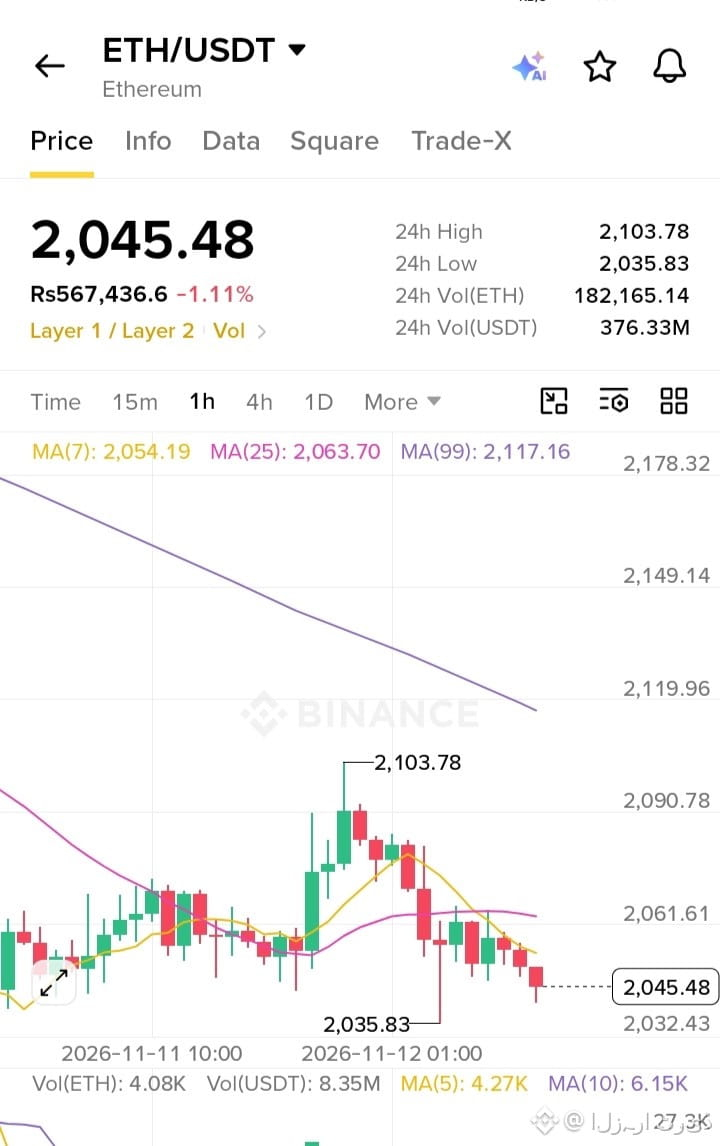
$ETH is trading at 2,045.48, down -1.11% over the last 24 hours, consolidating near its support low of 2,035.83 and remaining below key moving averages including the MA(7) at 2,054.19, MA(25) at 2,063.70, and MA(99) at 2,117.16 following a pullback from higher levels.
🔻 Bias: Short $ETH
{future}(ETHUSDT)
* Entry range: $2,040.00 – $2,065.00
* SL: $2,120.00
* TP 1: $1,980.00
* TP 2: $1,920.00
* TP 3: $1,850.00
Price action shows mild downward pressure following a rejection from higher consolidation zones, remaining below major moving averages. Weak recovery attempts and overhead resistance favor continued downside movement as long as resistance near 2,080.00 holds firm.
$ETH is trading at 2,045.48, down -1.11% over the last 24 hours, consolidating near its support low of 2,035.83 and remaining below key moving averages including the MA(7) at 2,054.19, MA(25) at 2,063.70, and MA(99) at 2,117.16 following a pullback from higher levels.
🔻 Bias: Short $ETH
* Entry range: $2,040.00 – $2,065.00
* SL: $2,120.00
* TP 1: $1,980.00
* TP 2: $1,920.00
* TP 3: $1,850.00
Price action shows mild downward pressure following a rejection from higher consolidation zones, remaining below major moving averages. Weak recovery attempts and overhead resistance favor continued downside movement as long as resistance near 2,080.00 holds firm.
🔻 Bias: Short $ETH
* Entry range: $2,040.00 – $2,065.00
* SL: $2,120.00
* TP 1: $1,980.00
* TP 2: $1,920.00
* TP 3: $1,850.00
Price action shows mild downward pressure following a rejection from higher consolidation zones, remaining below major moving averages. Weak recovery attempts and overhead resistance favor continued downside movement as long as resistance near 2,080.00 holds firm.
4
·
--
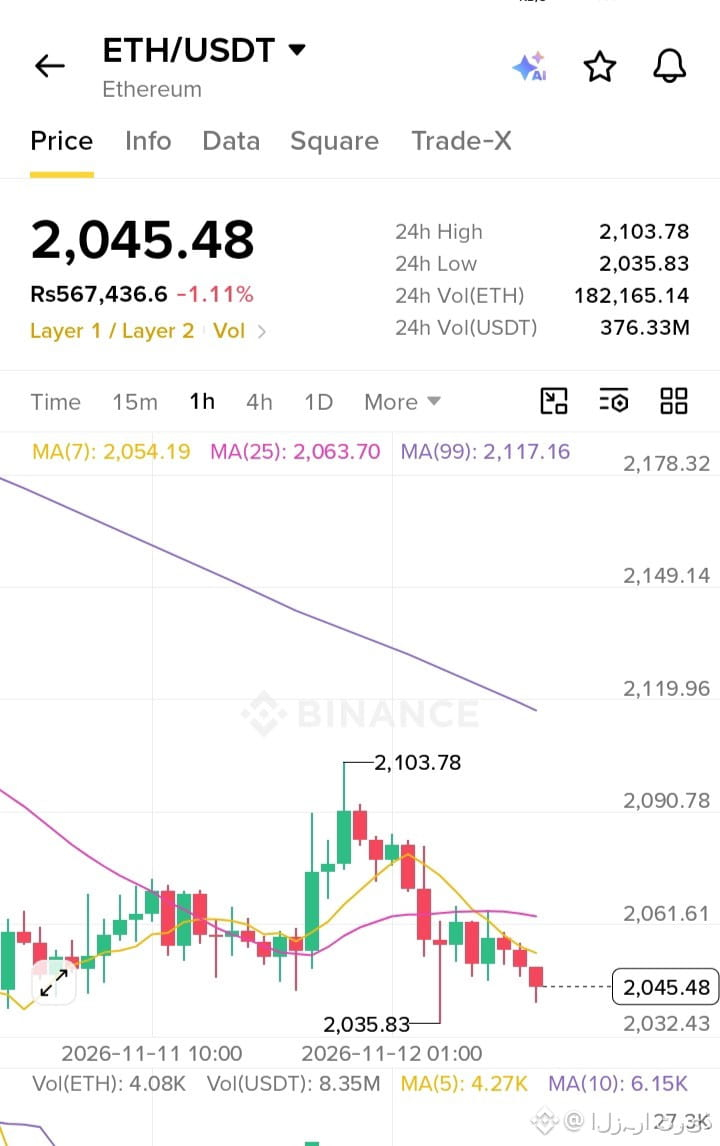
يتداول زوج $ETH عند مستوى 2,045.48 مسجلاً تراجعاً بنسبة -1.11% خلال 24 ساعة، مع تماسك السعر بالقرب من قاع الدعم عند 2,035.83 واستقراره أدنى المتوسطات المتحركة الرئيسية بما فيها MA(7) عند 2,054.19 وMA(25) عند 2,063.70 وMA(99) عند 2,117.16 إثر تراجع طفيف من مستويات أعلى.
🔻 الاتجاه: البيع (Short) لعملة $ETH
{future}(ETHUSDT)
* Entry range: $2,040.00 – $2,065.00
* SL: $2,120.00
* TP 1: $1,980.00
* TP 2: $1,920.00
* TP 3: $1,850.00
تُظهر حركة السعر ضغوطاً بيعية خفيفة عقب الرفض من مناطق التجميع المرتفعة، حيث يستقر السعر أدنى المتوسطات المتحركة الرئيسية. تدعم محاولات التعافي الضعيفة والمقاومة العلوية استمرار الاتجاه الهابط طالما ظلت المقاومة القريبة قرب 2,080.00 صامدة.
يتداول زوج $ETH عند مستوى 2,045.48 مسجلاً تراجعاً بنسبة -1.11% خلال 24 ساعة، مع تماسك السعر بالقرب من قاع الدعم عند 2,035.83 واستقراره أدنى المتوسطات المتحركة الرئيسية بما فيها MA(7) عند 2,054.19 وMA(25) عند 2,063.70 وMA(99) عند 2,117.16 إثر تراجع طفيف من مستويات أعلى.
🔻 الاتجاه: البيع (Short) لعملة $ETH
* Entry range: $2,040.00 – $2,065.00
* SL: $2,120.00
* TP 1: $1,980.00
* TP 2: $1,920.00
* TP 3: $1,850.00
تُظهر حركة السعر ضغوطاً بيعية خفيفة عقب الرفض من مناطق التجميع المرتفعة، حيث يستقر السعر أدنى المتوسطات المتحركة الرئيسية. تدعم محاولات التعافي الضعيفة والمقاومة العلوية استمرار الاتجاه الهابط طالما ظلت المقاومة القريبة قرب 2,080.00 صامدة.
🔻 الاتجاه: البيع (Short) لعملة $ETH
* Entry range: $2,040.00 – $2,065.00
* SL: $2,120.00
* TP 1: $1,980.00
* TP 2: $1,920.00
* TP 3: $1,850.00
تُظهر حركة السعر ضغوطاً بيعية خفيفة عقب الرفض من مناطق التجميع المرتفعة، حيث يستقر السعر أدنى المتوسطات المتحركة الرئيسية. تدعم محاولات التعافي الضعيفة والمقاومة العلوية استمرار الاتجاه الهابط طالما ظلت المقاومة القريبة قرب 2,080.00 صامدة.
4
·
--
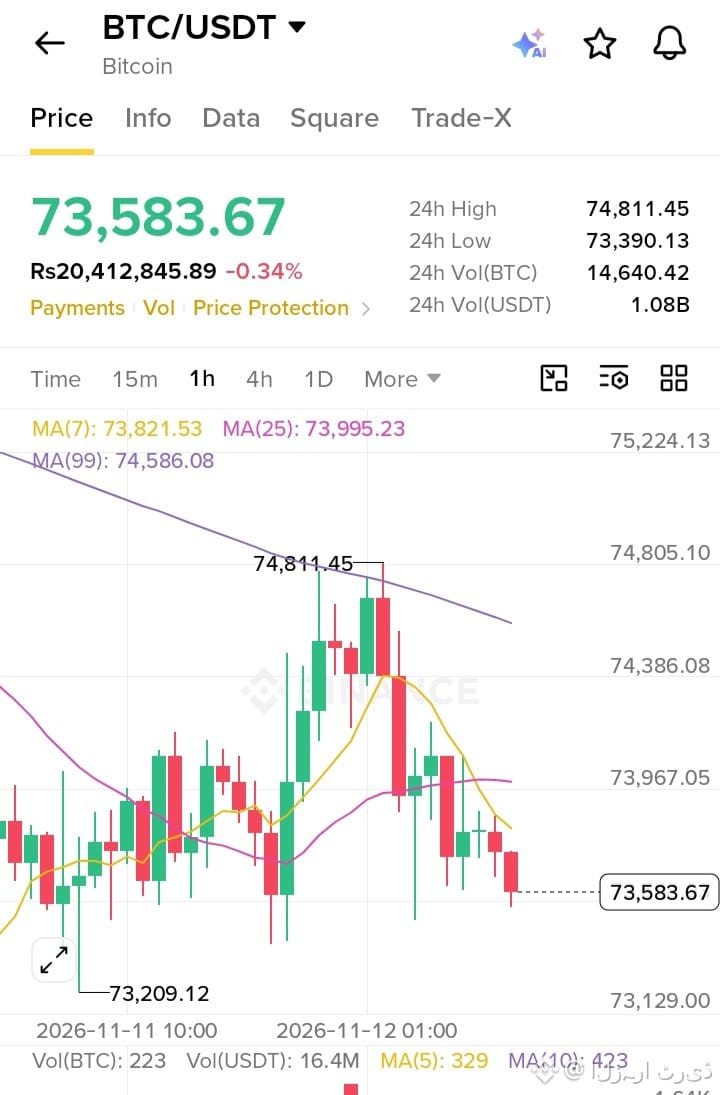
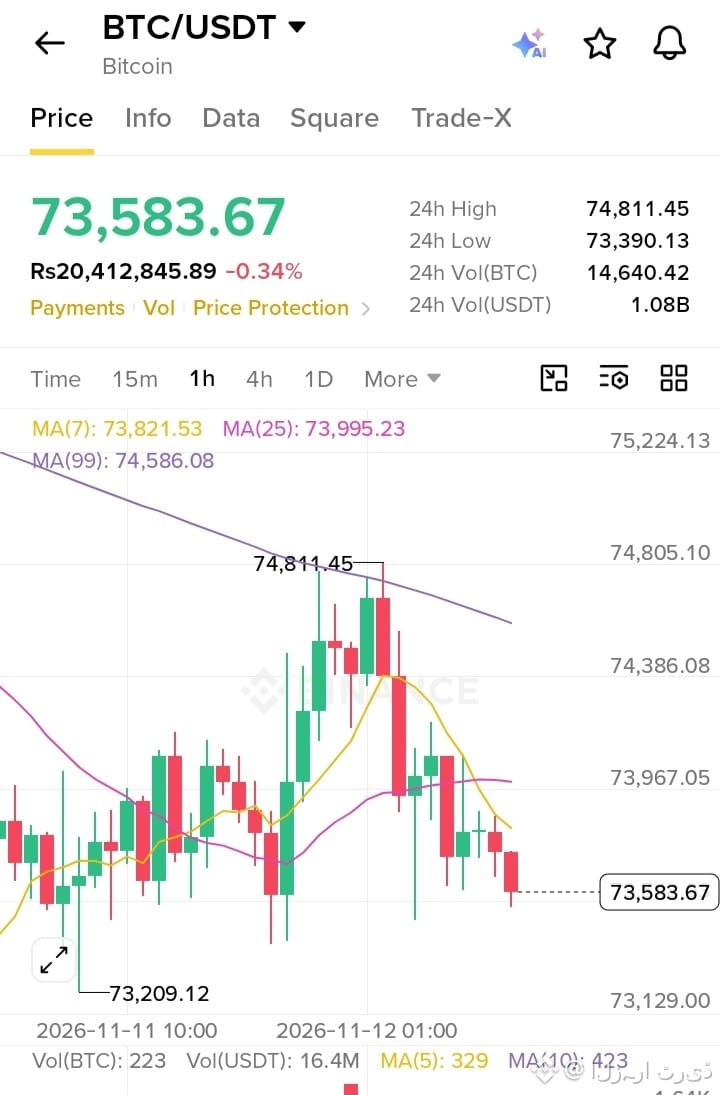
يتداول زوج $BTC عند مستوى 73,583.67 مسجلاً تراجعاً طفيفاً بنسبة -0.34% خلال 24 ساعة، مع تماسك السعر بالقرب من قاع الدعم عند 73,209.12 واستقراره أدنى المتوسطات المتحركة الرئيسية بما فيها MA(7) عند 73,821.53 وMA(25) عند 73,995.23 وMA(99) عند 74,586.08 إثر تراجع طفيف من مستويات أعلى.
🔻 الاتجاه: البيع (Short) لعملة $BTC
{future}(BTCUSDT)
* Entry range: $73,300 – $74,000
* SL: $75,200
* TP 1: $72,500
* TP 2: $71,200
* TP 3: $69,800
تُظهر حركة السعر ضغوطاً بيعية خفيفة عقب الرفض من مناطق التجميع المرتفعة، حيث يستقر السعر أدنى المتوسطات المتحركة الرئيسية. تدعم محاولات التعافي الضعيفة والمقاومة العلوية استمرار الاتجاه الهابط طالما ظلت المقاومة القريبة قرب 74,500 صامدة.
يتداول زوج $BTC عند مستوى 73,583.67 مسجلاً تراجعاً طفيفاً بنسبة -0.34% خلال 24 ساعة، مع تماسك السعر بالقرب من قاع الدعم عند 73,209.12 واستقراره أدنى المتوسطات المتحركة الرئيسية بما فيها MA(7) عند 73,821.53 وMA(25) عند 73,995.23 وMA(99) عند 74,586.08 إثر تراجع طفيف من مستويات أعلى.
🔻 الاتجاه: البيع (Short) لعملة $BTC
* Entry range: $73,300 – $74,000
* SL: $75,200
* TP 1: $72,500
* TP 2: $71,200
* TP 3: $69,800
تُظهر حركة السعر ضغوطاً بيعية خفيفة عقب الرفض من مناطق التجميع المرتفعة، حيث يستقر السعر أدنى المتوسطات المتحركة الرئيسية. تدعم محاولات التعافي الضعيفة والمقاومة العلوية استمرار الاتجاه الهابط طالما ظلت المقاومة القريبة قرب 74,500 صامدة.
🔻 الاتجاه: البيع (Short) لعملة $BTC
* Entry range: $73,300 – $74,000
* SL: $75,200
* TP 1: $72,500
* TP 2: $71,200
* TP 3: $69,800
تُظهر حركة السعر ضغوطاً بيعية خفيفة عقب الرفض من مناطق التجميع المرتفعة، حيث يستقر السعر أدنى المتوسطات المتحركة الرئيسية. تدعم محاولات التعافي الضعيفة والمقاومة العلوية استمرار الاتجاه الهابط طالما ظلت المقاومة القريبة قرب 74,500 صامدة.
6
·
--
$BTC is trading at 73,583.67, down -0.34% over the last 24 hours, consolidating near its support low of 73,209.12 and remaining below key moving averages including the MA(7) at 73,821.53, MA(25) at 73,995.23, and MA(99) at 74,586.08 following a pullback from higher levels.
🔻 Bias: Short $BTC
{future}(BTCUSDT)
* Entry range: $73,300 – $74,000
* SL: $75,200
* TP 1: $72,500
* TP 2: $71,200
* TP 3: $69,800
Price action shows mild downward pressure following a rejection from higher consolidation zones, remaining below major moving averages. Weak recovery attempts and overhead resistance favor continued downside movement as long as resistance near 74,500 holds firm.
$BTC is trading at 73,583.67, down -0.34% over the last 24 hours, consolidating near its support low of 73,209.12 and remaining below key moving averages including the MA(7) at 73,821.53, MA(25) at 73,995.23, and MA(99) at 74,586.08 following a pullback from higher levels.
🔻 Bias: Short $BTC
* Entry range: $73,300 – $74,000
* SL: $75,200
* TP 1: $72,500
* TP 2: $71,200
* TP 3: $69,800
Price action shows mild downward pressure following a rejection from higher consolidation zones, remaining below major moving averages. Weak recovery attempts and overhead resistance favor continued downside movement as long as resistance near 74,500 holds firm.
🔻 Bias: Short $BTC
* Entry range: $73,300 – $74,000
* SL: $75,200
* TP 1: $72,500
* TP 2: $71,200
* TP 3: $69,800
Price action shows mild downward pressure following a rejection from higher consolidation zones, remaining below major moving averages. Weak recovery attempts and overhead resistance favor continued downside movement as long as resistance near 74,500 holds firm.
5
·
--
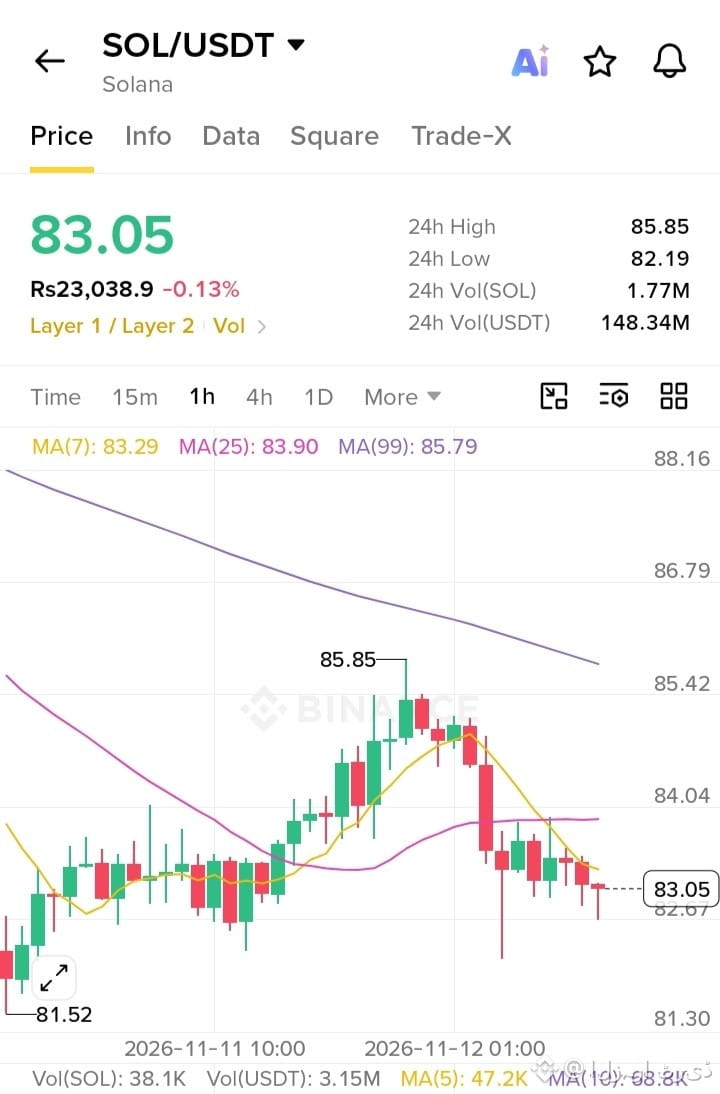
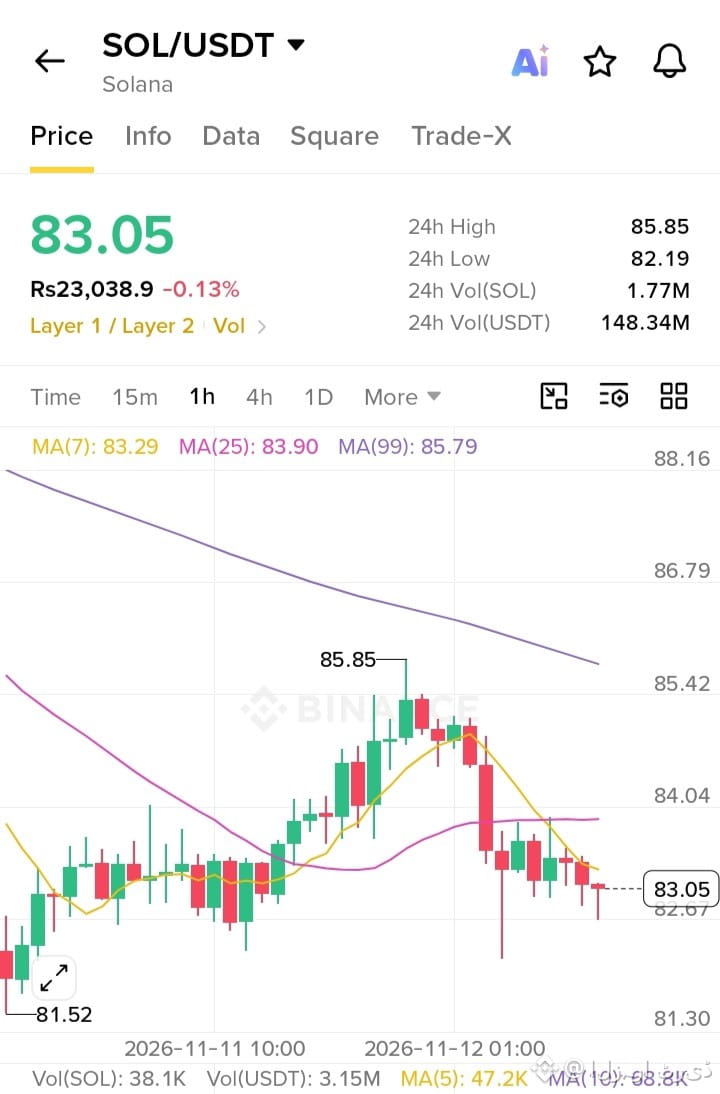
$SOL is trading at 83.05, down -0.13% over the last 24 hours, consolidating near its support low of 81.52 and remaining below key moving averages including the MA(7) at 83.29, MA(25) at 83.90, and MA(99) at 85.79 following a pullback from higher levels.
🔻 Bias: Short $SOL
{future}(SOLUSDT)
* Entry range: $82.50 – $84.00
* SL: $86.50
* TP 1: $80.00
* TP 2: $77.50
* TP 3: $74.50
Price action shows mild downward pressure following a rejection from higher consolidation zones, remaining below major moving averages. Weak recovery attempts and overhead resistance favor continued downside movement as long as resistance near 84.50 holds firm.
$SOL is trading at 83.05, down -0.13% over the last 24 hours, consolidating near its support low of 81.52 and remaining below key moving averages including the MA(7) at 83.29, MA(25) at 83.90, and MA(99) at 85.79 following a pullback from higher levels.
🔻 Bias: Short $SOL
* Entry range: $82.50 – $84.00
* SL: $86.50
* TP 1: $80.00
* TP 2: $77.50
* TP 3: $74.50
Price action shows mild downward pressure following a rejection from higher consolidation zones, remaining below major moving averages. Weak recovery attempts and overhead resistance favor continued downside movement as long as resistance near 84.50 holds firm.
🔻 Bias: Short $SOL
* Entry range: $82.50 – $84.00
* SL: $86.50
* TP 1: $80.00
* TP 2: $77.50
* TP 3: $74.50
Price action shows mild downward pressure following a rejection from higher consolidation zones, remaining below major moving averages. Weak recovery attempts and overhead resistance favor continued downside movement as long as resistance near 84.50 holds firm.
2
·
--
يتداول زوج $SOL عند مستوى 83.05 مسجلاً تراجعاً طفيفاً بنسبة -0.13% خلال 24 ساعة، مع تماسك السعر بالقرب من قاع الدعم عند 81.52 واستقراره أدنى المتوسطات المتحركة الرئيسية بما فيها MA(7) عند 83.29 وMA(25) عند 83.90 وMA(99) عند 85.79 إثر تراجع طفيف من مستويات أعلى.
🔻 الاتجاه: البيع (Short) لعملة $SOL
{future}(SOLUSDT)
* Entry range: $82.50 – $84.00
* SL: $86.50
* TP 1: $80.00
* TP 2: $77.50
* TP 3: $74.50
تُظهر حركة السعر ضغوطاً بيعية خفيفة عقب الرفض من مناطق التجميع المرتفعة، حيث يستقر السعر أدنى المتوسطات المتحركة الرئيسية. تدعم محاولات التعافي الضعيفة والمقاومة العلوية استمرار الاتجاه الهابط طالما ظلت المقاومة القريبة قرب 84.50 صامدة.
يتداول زوج $SOL عند مستوى 83.05 مسجلاً تراجعاً طفيفاً بنسبة -0.13% خلال 24 ساعة، مع تماسك السعر بالقرب من قاع الدعم عند 81.52 واستقراره أدنى المتوسطات المتحركة الرئيسية بما فيها MA(7) عند 83.29 وMA(25) عند 83.90 وMA(99) عند 85.79 إثر تراجع طفيف من مستويات أعلى.
🔻 الاتجاه: البيع (Short) لعملة $SOL
* Entry range: $82.50 – $84.00
* SL: $86.50
* TP 1: $80.00
* TP 2: $77.50
* TP 3: $74.50
تُظهر حركة السعر ضغوطاً بيعية خفيفة عقب الرفض من مناطق التجميع المرتفعة، حيث يستقر السعر أدنى المتوسطات المتحركة الرئيسية. تدعم محاولات التعافي الضعيفة والمقاومة العلوية استمرار الاتجاه الهابط طالما ظلت المقاومة القريبة قرب 84.50 صامدة.
🔻 الاتجاه: البيع (Short) لعملة $SOL
* Entry range: $82.50 – $84.00
* SL: $86.50
* TP 1: $80.00
* TP 2: $77.50
* TP 3: $74.50
تُظهر حركة السعر ضغوطاً بيعية خفيفة عقب الرفض من مناطق التجميع المرتفعة، حيث يستقر السعر أدنى المتوسطات المتحركة الرئيسية. تدعم محاولات التعافي الضعيفة والمقاومة العلوية استمرار الاتجاه الهابط طالما ظلت المقاومة القريبة قرب 84.50 صامدة.
5
ເຂົ້າສູ່ລະບົບເພື່ອສຳຫຼວດເນື້ອຫາເພີ່ມເຕີມ
ເຂົ້າຮ່ວມກຸ່ມຜູ້ໃຊ້ຄຣິບໂຕທົ່ວໂລກໃນ Binance Square.
⚡️ ໄດ້ຮັບຂໍ້ມູນຫຼ້າສຸດ ແລະ ທີ່ມີປະໂຫຍດກ່ຽວກັບຄຣິບໂຕ.
💬 ໄດ້ຮັບຄວາມໄວ້ວາງໃຈຈາກຕະຫຼາດແລກປ່ຽນຄຣິບໂຕທີ່ໃຫຍ່ທີ່ສຸດໃນໂລກ.
👍 ຄົ້ນຫາຂໍ້ມູນເຊີງເລິກທີ່ແທ້ຈາກນັກສ້າງທີ່ໄດ້ຮັບການຢືນຢັນ.
ອີເມວ / ເບີໂທລະສັບ
ຫົວຂໍ້ທີ່ກໍາລັງນິຍົມ
WhatWillDriveCryptoandStocks’NextRebound?
42,180 ຄັ້ງທີ່ເບິ່ງ
624 ກຳລັງສົນທະນາ
Bitcoin Slips Below $70,000 as Dollar Index Hits 19-Month High
Binance News
·15 ຖືກໃຈ
·33.8k ຄັ້ງທີ່ເບິ່ງ
Anthropic’s6xIPODemandSignalsPotentialRecordRaise
13,426 ຄັ້ງທີ່ເບິ່ງ
297 ກຳລັງສົນທະນາ
JaneStreetNearlyOctuplesFidelityBitcoinETFHoldings
891 ຄັ້ງທີ່ເບິ່ງ
40 ກຳລັງສົນທະນາ