

MRT Trader
3.5k ໂພສ

MRT Trader
ລາຍງານ
ບລັອກຜູ້ໃຊ້
Follow for Insights and Signal. Lunching our own Crypto Assets.
ເປີດການຊື້ຂາຍ
ຜູ້ຊື້ຂາຍຊົ່ວຄາວ
3 ປີ
144 ກໍາລັງຕິດຕາມ
5.2K+ ຜູ້ຕິດຕາມ
5.6K+ Liked
ໂພສ
Portfolio
ທັງໝົດ
ວົງຢືມ
ວີດີໂອ
ຖ່າຍທອດສົດ
ປັກໝຸດ
·
--
ບົດຄວາມ
A Beginner’s Guide to Candlestick PatternsThere are two basic forms of information that traders rely on: fundamental analysis (FA), the study of a company’s financial books and ratios, and technical analysis (TA), the study of a stock’s price behavior. With FA, the aim is to identify undervalued companies that should grow in the future, while TA aims to predict future price action based on past behavior. To do this, traders track candlestick patterns. In this article, we’ll explain how to read candles and cover the 37 most essential patterns that every active trader and chartist needs to know.
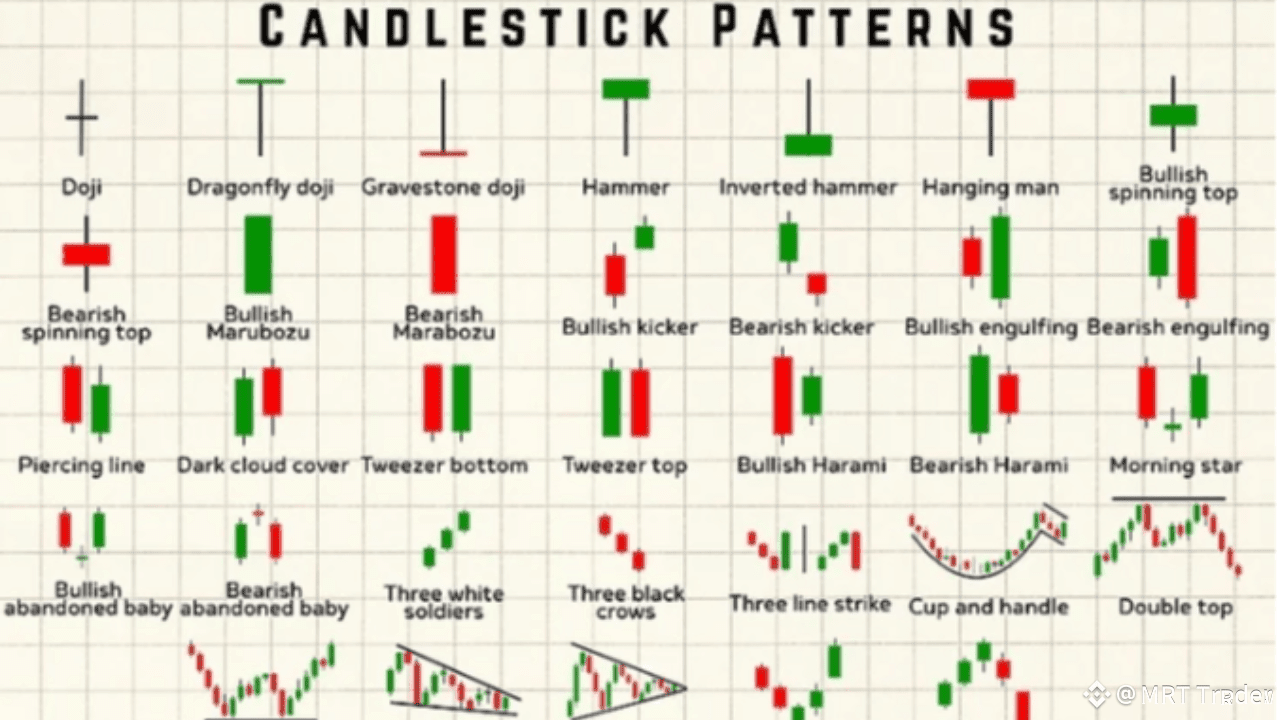
Common Candlestick Patterns Cheat Sheet
What is a candlestick pattern?
To understand candle patterns, you must know how to read a candle.Candlesticks themselves contain a wealth of information. Ever since they were invented in the 1700s by Japanese rice traders, they’ve helped investors and traders everywhere visualize price action. Here are the components of a candle:[1]Duration. This one isn’t actually on the candle, but the duration of your chart determines the duration of the candle, so it’s important to keep in mind. For example, on a weekly chart, a single candle represents one week. On a daily chart, a candle represents one day, etc.Body. The body of the candle refers to the filled-in blocky part that makes up most of the candle itself.The top and bottom of a candle represent where the price started and closed.Color. The color of the candle determines whether the price went up or down.A red candle started the trading period at the top of the candle and closed the trading period at the bottom.A green candle is the opposite. The bottom of the candle is where trading started and the trading period closed at the top of the body.Size. The size tells you how far the price moved from open to close.A small candle represents relatively little price movement.A large candle represents a lot of price movement.Wick. The wick is the little line that pops out of the top and bottom of the candle’s body. Wicks represent the peaks of that trading period’s price level.A short wick means the price didn’t move very far away from the opening or closing price (depending on the color).A long wick means the price moved well outside of the range of the open or close (depending on the color).
Single Candlestick Patterns
DojiA doji has basically no body, indicating the open and close price were basically identical. The size of the wick may indicate how much volatility occurred over the session, but this neutral candle often indicates uncertainty (or lack of trading interest).[2]Bullish or bearish? Neutral.Dragonfly dojiA dragonfly doji refers to a doji with an extremely long bottom-side wick, indicating there was a of intrasession price action below the open and close.Bullish or bearish? Bullish.Gravestone dojiAlso known as the inverted dragonfly, this doji has a long wick above the body. This is universally noted as bearish, since it means there was a larger attempt for the price to move higher that ultimately failed.Bullish or bearish? Bearish.HammerA hammer is always green. It has a small body with a wick sticking out through the bottom of the candle. That wick may be relatively short or kind of on the longer side.[3]Bullish or bearish? Bullish.Inverted hammerPeople assume the inverted hammer is bearish since it’s the “opposite” of a hammer, but it’s not. The green body with the wick on top indicates the market is trying to push the price higher, even if there might have been a return to lower levels heading into close.Bullish or bearish? Bullish.Hanging manThe hanging man looks identical to the hammer except it can be red or green. The key with the hanging man is when it appears. It only counts as a hanging man candle if it appears after a dedicated uptrend.Bullish or bearish? Bearish.The hanging man is often considered a potential reversal indicator, meaning that it’s possible the uptrend will become a downtrend.Bullish spinning topNicknamed the spinning top after its shape (it looks kind of like a children’s top), the bullish spinning top has a small, green body and a wick sticking out of both ends. It can only appear after a prolonged downtrend.Bullish or bearish? Bullish. Also, a reversal indicator.Bearish spinning topThe bearish spinning top is the inverse of a bullish spinning top—it’s just a red body and it appears after a prolonged uptrend.Bullish or bearish? Bearish. Also, a reversal indicator.Bullish MarubozuThe bullish Marubozu stands out prominently on charts. It's got a very large body and no wick on either side (or an extremely tiny wick). The bullish Marubozu is a huge sign that the market is moving with conviction in one direction.[4]Bullish or bearish? Bullish.Bearish MarubozuThe only difference between the bullish and the bearish Marubozu is the color of the body. The bullish version is green; the bearish version is red.[5]Bullish or bearish? Bearish.
Double Candlestick Patterns
Bullish kickerThe bullish kicker occurs when a red candle is followed immediately by a green candle with a gap between the two.[6]Bullish or bearish? Bullish.What is a gap? A gap refers to a specific phenomenon that occurs between candlesticks. Normally, one candle overlaps with the next one, indicating that the price is moving in increments. A gap occurs when there’s open space separating one candle and another. This occurs when the price jumps way up (or way down) between sessions.Bearish kickerA bearish kicker is the opposite of a bullish kicker—a green candle is followed by a red candle that gaps down.[7]Bullish or bearish? Bearish.Bullish engulfingA bullish engulfing candle occurs when a green candle follows a red candle. The “engulfing” part is where the green candle is bigger than the red candle in terms of the body. The green candle has a lower low and a higher high.[8]Bullish or bearish? Bullish. This is also considered a reversal pattern.Bearish engulfingThe bearish engulfing candle occurs when a green candle is completely engulfed by a larger red candle.Bullish or bearish? Bearish. This is widely accepted as a reversal pattern.Piercing lineThe piercing line is one of the more difficult patterns to spot just because it seems kind of innocuous at first. It requires a long red candle with short wicks, followed by a smaller green candle that punctures the base of the previous candle’s bottom.[9]Bullish or bearish? Bullish. This is also considered a reversal pattern.Dark cloud coverDark cloud cover is the opposite of a piercing line—a green candle with a large body is followed by a red candle with a smaller body. The top of the red candle must be higher than the top of the green candle, and the bottom of the red candle must hit roughly around the midpoint of the green candle.[10]Bullish or bearish? Bearish. This is also a reversal pattern.Tweezer bottomThe tweezer bottom is easy to spot by the two long wicks that stop at the same price level. This pattern also must occur at the bottom of a downtrend, and the two candles must have relatively similar tops. The first candle must be red and the second candle must be green.[11]Bullish or bearish? Bullish. This is also considered to be a reversal pattern.Tweezer topThe tweezer top is the inverse of the tweezer bottom. Two long wicks must sit at the same price level, the first candle must be green, and the second candle must be red. Also, this pattern only counts if it appears at the top of an uptrend.[12]Bullish or bearish? Bearish. This is a reversal pattern.Bullish HaramiThe bullish Harami is noted by its large red candle, followed by an engulfed green candle. The green candle must be small, and there must be a wick hanging from the bottom of the candle.[13]Bullish or bearish? Bullish.Bearish HaramiThe bearish Harami requires a large green candle followed by an engulfed red candle with a tiny wick on top.[14]Bullish or bearish? Bearish.
Triple Candlestick Patterns
Morning starThe morning star pattern is considered a classic reversal pattern. It is noted by a substantial red candle, a smaller green candle that gaps down, and a larger green candle that gaps up. The last candle must close higher than the midpoint of the first candle.[15]Bullish or bearish? Bullish.Bullish abandoned babyIf you see a substantial red candle and a gap down to a green doji followed by a gap up and a huge green candle, you’re looking at a bullish abandoned baby. You can remember this pattern by noting that the tiny doji looks like it has been “abandoned” by the red and green “parents” above it.[16]Bullish or bearish? Bullish.Bearish abandoned babyThe bearish abandoned baby is the reverse of the bullish abandoned baby. The first candle is green, the “baby” will be a doji floating above, and the last candle below will be red.[17]Bullish or bearish? Bearish.Three white soldiersThree white soldiers is pretty easy to remember because it's just three green candles. The candles must all be green and either matching or drifting upwards.[18]Bullish or bearish? Bullish. This is considered one of the more consistent patterns in TA.Three black crowsThree black crows is the opposite of three white soldiers. You’ve got three red candles with large bodies all matching levels or slowly drifting downward.[19]Bullish or bearish? Bearish.Three line strikeThree line strike is actually a four-candle pattern. It is sort of an extension of the three black crows or three white soldiers and is considered a reversal pattern. It occurs when a large engulfing candle overtakes the three previous candles of a different color. So, with three white soldiers, you’d need a large red candle to overtake the previous three. With three black crows, you’d need a giant green candle to overtake the previous three.[20]Bullish or bearish? Depends on the trend.
Larger Patterns
Cup and handleThe cup and handle is a larger pattern consisting usually of 20+ candles. It appears kind of like an old school coffee cup: there’s a large downtrend that smooths out at the bottom of the “cup.” Then, there’s an uptrend that matches the downtrend symmetrically. At the end of the “cup,” a sharp downturn marks the “handle,” which is often followed by a new bullish trend.[21]Bullish or bearish? Bullish.Double topA double top simply refers to any extended series of candles where the peak of the uptrend stops at a specific price level twice. These are typically easy to spot because the wicks will poke out from the chart and touch the same price level twice.[22]Bullish or bearish? Bearish.Double bottomThe inverse of the double top is the double bottom. It’s any pattern where two wicks in a channel touch down at the same price level.[23]Bullish or bearish? Bullish.WedgeWedges are a type of channel. They are noted by an upward or downward trend where the channel slowly feeds down into a narrower point. As the wedge tightens, it gets closer to a decision area where the trend can break up or down.[24]Bullish or bearish? Neutral. The shape of the wedge can help you identify confirmations and reversals, but the wedges themselves aren’t bearish or bullish.What is a channel? A channel is sort of like a lane on a road. It refers to two lines that contain all of the price action in an area. The edges of a channel are often the source of resistance or support points.FlagFlags, also known as pennants, are a kind of extremely tight wedge that often appears after large moves up or down. The shape of the flag is more of a triangular boat flag as opposed to a standard national flag.[25]Bullish or bearish? Neutral. Flags don’t signal anything other than decision points where investors and traders are unsure of what to do.
Confirmation Patterns
Rising windowThe rising window is a two-candle confirmation signal that occurs when a candle gaps up past a support or resistance line following an uptrend.[26]Bullish or bearish? Bullish.What is a confirmation? In technical analysis, a confirmation refers to any event which affirms the previous signal. So, take three white soldiers—a classic bullish signal. If the three white soldiers sit on a resistance line and then a rising window breaks that line, it is considered a confirmation—the bullish trend is set to continue.Falling windowThe falling window (sometimes casually and incorrectly called a falling dagger) is the reverse of a rising window. It’s a two-candle confirmation that breaks a trend or support/resistance line by gapping down past it.[27]Bullish or bearish? Bearish.Three inside upFollowing a period of consolidation or a downward trend, you can spot a reversal confirmation with the three inside up pattern. This is a large red candle, a smaller green candle that sits around the base of the first candle, and then a green candle rising above the first candle's high.[28]Bullish or bearish? Bullish.Three inside downThree inside down is the bearish version of the three inside up. A large green candle is followed by a rising red candle, then a red candle that breaks the previous low of the initial green candle.[29]Bullish or bearish? Bearish.Three outside upThree outside up is a bullish confirmation signal that requires a red candle, an engulfing green candle, and a third green candle with a midpoint higher than the top of the previous candle.[30]Bullish or bearish? Bullish.Three outside downThree outside down is the reverse of the three outside up. A green candle is engulfed by a large red candle, then there’s a third red candle trending down and passing the base of the engulfing candle.Bullish or bearish? Bearish.
$ETH
{spot}(ETHUSDT)
$BTC
{spot}(BTCUSDT)
A Beginner’s Guide to Candlestick Patterns
There are two basic forms of information that traders rely on: fundamental analysis (FA), the study of a company’s financial books and ratios, and technical analysis (TA), the study of a stock’s price behavior. With FA, the aim is to identify undervalued companies that should grow in the future, while TA aims to predict future price action based on past behavior. To do this, traders track candlestick patterns. In this article, we’ll explain how to read candles and cover the 37 most essential patterns that every active trader and chartist needs to know.
Common Candlestick Patterns Cheat Sheet
What is a candlestick pattern?
To understand candle patterns, you must know how to read a candle.Candlesticks themselves contain a wealth of information. Ever since they were invented in the 1700s by Japanese rice traders, they’ve helped investors and traders everywhere visualize price action. Here are the components of a candle:[1]Duration. This one isn’t actually on the candle, but the duration of your chart determines the duration of the candle, so it’s important to keep in mind. For example, on a weekly chart, a single candle represents one week. On a daily chart, a candle represents one day, etc.Body. The body of the candle refers to the filled-in blocky part that makes up most of the candle itself.The top and bottom of a candle represent where the price started and closed.Color. The color of the candle determines whether the price went up or down.A red candle started the trading period at the top of the candle and closed the trading period at the bottom.A green candle is the opposite. The bottom of the candle is where trading started and the trading period closed at the top of the body.Size. The size tells you how far the price moved from open to close.A small candle represents relatively little price movement.A large candle represents a lot of price movement.Wick. The wick is the little line that pops out of the top and bottom of the candle’s body. Wicks represent the peaks of that trading period’s price level.A short wick means the price didn’t move very far away from the opening or closing price (depending on the color).A long wick means the price moved well outside of the range of the open or close (depending on the color).
Single Candlestick Patterns
DojiA doji has basically no body, indicating the open and close price were basically identical. The size of the wick may indicate how much volatility occurred over the session, but this neutral candle often indicates uncertainty (or lack of trading interest).[2]Bullish or bearish? Neutral.Dragonfly dojiA dragonfly doji refers to a doji with an extremely long bottom-side wick, indicating there was a of intrasession price action below the open and close.Bullish or bearish? Bullish.Gravestone dojiAlso known as the inverted dragonfly, this doji has a long wick above the body. This is universally noted as bearish, since it means there was a larger attempt for the price to move higher that ultimately failed.Bullish or bearish? Bearish.HammerA hammer is always green. It has a small body with a wick sticking out through the bottom of the candle. That wick may be relatively short or kind of on the longer side.[3]Bullish or bearish? Bullish.Inverted hammerPeople assume the inverted hammer is bearish since it’s the “opposite” of a hammer, but it’s not. The green body with the wick on top indicates the market is trying to push the price higher, even if there might have been a return to lower levels heading into close.Bullish or bearish? Bullish.Hanging manThe hanging man looks identical to the hammer except it can be red or green. The key with the hanging man is when it appears. It only counts as a hanging man candle if it appears after a dedicated uptrend.Bullish or bearish? Bearish.The hanging man is often considered a potential reversal indicator, meaning that it’s possible the uptrend will become a downtrend.Bullish spinning topNicknamed the spinning top after its shape (it looks kind of like a children’s top), the bullish spinning top has a small, green body and a wick sticking out of both ends. It can only appear after a prolonged downtrend.Bullish or bearish? Bullish. Also, a reversal indicator.Bearish spinning topThe bearish spinning top is the inverse of a bullish spinning top—it’s just a red body and it appears after a prolonged uptrend.Bullish or bearish? Bearish. Also, a reversal indicator.Bullish MarubozuThe bullish Marubozu stands out prominently on charts. It's got a very large body and no wick on either side (or an extremely tiny wick). The bullish Marubozu is a huge sign that the market is moving with conviction in one direction.[4]Bullish or bearish? Bullish.Bearish MarubozuThe only difference between the bullish and the bearish Marubozu is the color of the body. The bullish version is green; the bearish version is red.[5]Bullish or bearish? Bearish.
Double Candlestick Patterns
Bullish kickerThe bullish kicker occurs when a red candle is followed immediately by a green candle with a gap between the two.[6]Bullish or bearish? Bullish.What is a gap? A gap refers to a specific phenomenon that occurs between candlesticks. Normally, one candle overlaps with the next one, indicating that the price is moving in increments. A gap occurs when there’s open space separating one candle and another. This occurs when the price jumps way up (or way down) between sessions.Bearish kickerA bearish kicker is the opposite of a bullish kicker—a green candle is followed by a red candle that gaps down.[7]Bullish or bearish? Bearish.Bullish engulfingA bullish engulfing candle occurs when a green candle follows a red candle. The “engulfing” part is where the green candle is bigger than the red candle in terms of the body. The green candle has a lower low and a higher high.[8]Bullish or bearish? Bullish. This is also considered a reversal pattern.Bearish engulfingThe bearish engulfing candle occurs when a green candle is completely engulfed by a larger red candle.Bullish or bearish? Bearish. This is widely accepted as a reversal pattern.Piercing lineThe piercing line is one of the more difficult patterns to spot just because it seems kind of innocuous at first. It requires a long red candle with short wicks, followed by a smaller green candle that punctures the base of the previous candle’s bottom.[9]Bullish or bearish? Bullish. This is also considered a reversal pattern.Dark cloud coverDark cloud cover is the opposite of a piercing line—a green candle with a large body is followed by a red candle with a smaller body. The top of the red candle must be higher than the top of the green candle, and the bottom of the red candle must hit roughly around the midpoint of the green candle.[10]Bullish or bearish? Bearish. This is also a reversal pattern.Tweezer bottomThe tweezer bottom is easy to spot by the two long wicks that stop at the same price level. This pattern also must occur at the bottom of a downtrend, and the two candles must have relatively similar tops. The first candle must be red and the second candle must be green.[11]Bullish or bearish? Bullish. This is also considered to be a reversal pattern.Tweezer topThe tweezer top is the inverse of the tweezer bottom. Two long wicks must sit at the same price level, the first candle must be green, and the second candle must be red. Also, this pattern only counts if it appears at the top of an uptrend.[12]Bullish or bearish? Bearish. This is a reversal pattern.Bullish HaramiThe bullish Harami is noted by its large red candle, followed by an engulfed green candle. The green candle must be small, and there must be a wick hanging from the bottom of the candle.[13]Bullish or bearish? Bullish.Bearish HaramiThe bearish Harami requires a large green candle followed by an engulfed red candle with a tiny wick on top.[14]Bullish or bearish? Bearish.
Triple Candlestick Patterns
Morning starThe morning star pattern is considered a classic reversal pattern. It is noted by a substantial red candle, a smaller green candle that gaps down, and a larger green candle that gaps up. The last candle must close higher than the midpoint of the first candle.[15]Bullish or bearish? Bullish.Bullish abandoned babyIf you see a substantial red candle and a gap down to a green doji followed by a gap up and a huge green candle, you’re looking at a bullish abandoned baby. You can remember this pattern by noting that the tiny doji looks like it has been “abandoned” by the red and green “parents” above it.[16]Bullish or bearish? Bullish.Bearish abandoned babyThe bearish abandoned baby is the reverse of the bullish abandoned baby. The first candle is green, the “baby” will be a doji floating above, and the last candle below will be red.[17]Bullish or bearish? Bearish.Three white soldiersThree white soldiers is pretty easy to remember because it's just three green candles. The candles must all be green and either matching or drifting upwards.[18]Bullish or bearish? Bullish. This is considered one of the more consistent patterns in TA.Three black crowsThree black crows is the opposite of three white soldiers. You’ve got three red candles with large bodies all matching levels or slowly drifting downward.[19]Bullish or bearish? Bearish.Three line strikeThree line strike is actually a four-candle pattern. It is sort of an extension of the three black crows or three white soldiers and is considered a reversal pattern. It occurs when a large engulfing candle overtakes the three previous candles of a different color. So, with three white soldiers, you’d need a large red candle to overtake the previous three. With three black crows, you’d need a giant green candle to overtake the previous three.[20]Bullish or bearish? Depends on the trend.
Larger Patterns
Cup and handleThe cup and handle is a larger pattern consisting usually of 20+ candles. It appears kind of like an old school coffee cup: there’s a large downtrend that smooths out at the bottom of the “cup.” Then, there’s an uptrend that matches the downtrend symmetrically. At the end of the “cup,” a sharp downturn marks the “handle,” which is often followed by a new bullish trend.[21]Bullish or bearish? Bullish.Double topA double top simply refers to any extended series of candles where the peak of the uptrend stops at a specific price level twice. These are typically easy to spot because the wicks will poke out from the chart and touch the same price level twice.[22]Bullish or bearish? Bearish.Double bottomThe inverse of the double top is the double bottom. It’s any pattern where two wicks in a channel touch down at the same price level.[23]Bullish or bearish? Bullish.WedgeWedges are a type of channel. They are noted by an upward or downward trend where the channel slowly feeds down into a narrower point. As the wedge tightens, it gets closer to a decision area where the trend can break up or down.[24]Bullish or bearish? Neutral. The shape of the wedge can help you identify confirmations and reversals, but the wedges themselves aren’t bearish or bullish.What is a channel? A channel is sort of like a lane on a road. It refers to two lines that contain all of the price action in an area. The edges of a channel are often the source of resistance or support points.FlagFlags, also known as pennants, are a kind of extremely tight wedge that often appears after large moves up or down. The shape of the flag is more of a triangular boat flag as opposed to a standard national flag.[25]Bullish or bearish? Neutral. Flags don’t signal anything other than decision points where investors and traders are unsure of what to do.
Confirmation Patterns
Rising windowThe rising window is a two-candle confirmation signal that occurs when a candle gaps up past a support or resistance line following an uptrend.[26]Bullish or bearish? Bullish.What is a confirmation? In technical analysis, a confirmation refers to any event which affirms the previous signal. So, take three white soldiers—a classic bullish signal. If the three white soldiers sit on a resistance line and then a rising window breaks that line, it is considered a confirmation—the bullish trend is set to continue.Falling windowThe falling window (sometimes casually and incorrectly called a falling dagger) is the reverse of a rising window. It’s a two-candle confirmation that breaks a trend or support/resistance line by gapping down past it.[27]Bullish or bearish? Bearish.Three inside upFollowing a period of consolidation or a downward trend, you can spot a reversal confirmation with the three inside up pattern. This is a large red candle, a smaller green candle that sits around the base of the first candle, and then a green candle rising above the first candle's high.[28]Bullish or bearish? Bullish.Three inside downThree inside down is the bearish version of the three inside up. A large green candle is followed by a rising red candle, then a red candle that breaks the previous low of the initial green candle.[29]Bullish or bearish? Bearish.Three outside upThree outside up is a bullish confirmation signal that requires a red candle, an engulfing green candle, and a third green candle with a midpoint higher than the top of the previous candle.[30]Bullish or bearish? Bullish.Three outside downThree outside down is the reverse of the three outside up. A green candle is engulfed by a large red candle, then there’s a third red candle trending down and passing the base of the engulfing candle.Bullish or bearish? Bearish.
$ETH
$BTC
Common Candlestick Patterns Cheat Sheet
What is a candlestick pattern?
To understand candle patterns, you must know how to read a candle.Candlesticks themselves contain a wealth of information. Ever since they were invented in the 1700s by Japanese rice traders, they’ve helped investors and traders everywhere visualize price action. Here are the components of a candle:[1]Duration. This one isn’t actually on the candle, but the duration of your chart determines the duration of the candle, so it’s important to keep in mind. For example, on a weekly chart, a single candle represents one week. On a daily chart, a candle represents one day, etc.Body. The body of the candle refers to the filled-in blocky part that makes up most of the candle itself.The top and bottom of a candle represent where the price started and closed.Color. The color of the candle determines whether the price went up or down.A red candle started the trading period at the top of the candle and closed the trading period at the bottom.A green candle is the opposite. The bottom of the candle is where trading started and the trading period closed at the top of the body.Size. The size tells you how far the price moved from open to close.A small candle represents relatively little price movement.A large candle represents a lot of price movement.Wick. The wick is the little line that pops out of the top and bottom of the candle’s body. Wicks represent the peaks of that trading period’s price level.A short wick means the price didn’t move very far away from the opening or closing price (depending on the color).A long wick means the price moved well outside of the range of the open or close (depending on the color).
Single Candlestick Patterns
DojiA doji has basically no body, indicating the open and close price were basically identical. The size of the wick may indicate how much volatility occurred over the session, but this neutral candle often indicates uncertainty (or lack of trading interest).[2]Bullish or bearish? Neutral.Dragonfly dojiA dragonfly doji refers to a doji with an extremely long bottom-side wick, indicating there was a of intrasession price action below the open and close.Bullish or bearish? Bullish.Gravestone dojiAlso known as the inverted dragonfly, this doji has a long wick above the body. This is universally noted as bearish, since it means there was a larger attempt for the price to move higher that ultimately failed.Bullish or bearish? Bearish.HammerA hammer is always green. It has a small body with a wick sticking out through the bottom of the candle. That wick may be relatively short or kind of on the longer side.[3]Bullish or bearish? Bullish.Inverted hammerPeople assume the inverted hammer is bearish since it’s the “opposite” of a hammer, but it’s not. The green body with the wick on top indicates the market is trying to push the price higher, even if there might have been a return to lower levels heading into close.Bullish or bearish? Bullish.Hanging manThe hanging man looks identical to the hammer except it can be red or green. The key with the hanging man is when it appears. It only counts as a hanging man candle if it appears after a dedicated uptrend.Bullish or bearish? Bearish.The hanging man is often considered a potential reversal indicator, meaning that it’s possible the uptrend will become a downtrend.Bullish spinning topNicknamed the spinning top after its shape (it looks kind of like a children’s top), the bullish spinning top has a small, green body and a wick sticking out of both ends. It can only appear after a prolonged downtrend.Bullish or bearish? Bullish. Also, a reversal indicator.Bearish spinning topThe bearish spinning top is the inverse of a bullish spinning top—it’s just a red body and it appears after a prolonged uptrend.Bullish or bearish? Bearish. Also, a reversal indicator.Bullish MarubozuThe bullish Marubozu stands out prominently on charts. It's got a very large body and no wick on either side (or an extremely tiny wick). The bullish Marubozu is a huge sign that the market is moving with conviction in one direction.[4]Bullish or bearish? Bullish.Bearish MarubozuThe only difference between the bullish and the bearish Marubozu is the color of the body. The bullish version is green; the bearish version is red.[5]Bullish or bearish? Bearish.
Double Candlestick Patterns
Bullish kickerThe bullish kicker occurs when a red candle is followed immediately by a green candle with a gap between the two.[6]Bullish or bearish? Bullish.What is a gap? A gap refers to a specific phenomenon that occurs between candlesticks. Normally, one candle overlaps with the next one, indicating that the price is moving in increments. A gap occurs when there’s open space separating one candle and another. This occurs when the price jumps way up (or way down) between sessions.Bearish kickerA bearish kicker is the opposite of a bullish kicker—a green candle is followed by a red candle that gaps down.[7]Bullish or bearish? Bearish.Bullish engulfingA bullish engulfing candle occurs when a green candle follows a red candle. The “engulfing” part is where the green candle is bigger than the red candle in terms of the body. The green candle has a lower low and a higher high.[8]Bullish or bearish? Bullish. This is also considered a reversal pattern.Bearish engulfingThe bearish engulfing candle occurs when a green candle is completely engulfed by a larger red candle.Bullish or bearish? Bearish. This is widely accepted as a reversal pattern.Piercing lineThe piercing line is one of the more difficult patterns to spot just because it seems kind of innocuous at first. It requires a long red candle with short wicks, followed by a smaller green candle that punctures the base of the previous candle’s bottom.[9]Bullish or bearish? Bullish. This is also considered a reversal pattern.Dark cloud coverDark cloud cover is the opposite of a piercing line—a green candle with a large body is followed by a red candle with a smaller body. The top of the red candle must be higher than the top of the green candle, and the bottom of the red candle must hit roughly around the midpoint of the green candle.[10]Bullish or bearish? Bearish. This is also a reversal pattern.Tweezer bottomThe tweezer bottom is easy to spot by the two long wicks that stop at the same price level. This pattern also must occur at the bottom of a downtrend, and the two candles must have relatively similar tops. The first candle must be red and the second candle must be green.[11]Bullish or bearish? Bullish. This is also considered to be a reversal pattern.Tweezer topThe tweezer top is the inverse of the tweezer bottom. Two long wicks must sit at the same price level, the first candle must be green, and the second candle must be red. Also, this pattern only counts if it appears at the top of an uptrend.[12]Bullish or bearish? Bearish. This is a reversal pattern.Bullish HaramiThe bullish Harami is noted by its large red candle, followed by an engulfed green candle. The green candle must be small, and there must be a wick hanging from the bottom of the candle.[13]Bullish or bearish? Bullish.Bearish HaramiThe bearish Harami requires a large green candle followed by an engulfed red candle with a tiny wick on top.[14]Bullish or bearish? Bearish.
Triple Candlestick Patterns
Morning starThe morning star pattern is considered a classic reversal pattern. It is noted by a substantial red candle, a smaller green candle that gaps down, and a larger green candle that gaps up. The last candle must close higher than the midpoint of the first candle.[15]Bullish or bearish? Bullish.Bullish abandoned babyIf you see a substantial red candle and a gap down to a green doji followed by a gap up and a huge green candle, you’re looking at a bullish abandoned baby. You can remember this pattern by noting that the tiny doji looks like it has been “abandoned” by the red and green “parents” above it.[16]Bullish or bearish? Bullish.Bearish abandoned babyThe bearish abandoned baby is the reverse of the bullish abandoned baby. The first candle is green, the “baby” will be a doji floating above, and the last candle below will be red.[17]Bullish or bearish? Bearish.Three white soldiersThree white soldiers is pretty easy to remember because it's just three green candles. The candles must all be green and either matching or drifting upwards.[18]Bullish or bearish? Bullish. This is considered one of the more consistent patterns in TA.Three black crowsThree black crows is the opposite of three white soldiers. You’ve got three red candles with large bodies all matching levels or slowly drifting downward.[19]Bullish or bearish? Bearish.Three line strikeThree line strike is actually a four-candle pattern. It is sort of an extension of the three black crows or three white soldiers and is considered a reversal pattern. It occurs when a large engulfing candle overtakes the three previous candles of a different color. So, with three white soldiers, you’d need a large red candle to overtake the previous three. With three black crows, you’d need a giant green candle to overtake the previous three.[20]Bullish or bearish? Depends on the trend.
Larger Patterns
Cup and handleThe cup and handle is a larger pattern consisting usually of 20+ candles. It appears kind of like an old school coffee cup: there’s a large downtrend that smooths out at the bottom of the “cup.” Then, there’s an uptrend that matches the downtrend symmetrically. At the end of the “cup,” a sharp downturn marks the “handle,” which is often followed by a new bullish trend.[21]Bullish or bearish? Bullish.Double topA double top simply refers to any extended series of candles where the peak of the uptrend stops at a specific price level twice. These are typically easy to spot because the wicks will poke out from the chart and touch the same price level twice.[22]Bullish or bearish? Bearish.Double bottomThe inverse of the double top is the double bottom. It’s any pattern where two wicks in a channel touch down at the same price level.[23]Bullish or bearish? Bullish.WedgeWedges are a type of channel. They are noted by an upward or downward trend where the channel slowly feeds down into a narrower point. As the wedge tightens, it gets closer to a decision area where the trend can break up or down.[24]Bullish or bearish? Neutral. The shape of the wedge can help you identify confirmations and reversals, but the wedges themselves aren’t bearish or bullish.What is a channel? A channel is sort of like a lane on a road. It refers to two lines that contain all of the price action in an area. The edges of a channel are often the source of resistance or support points.FlagFlags, also known as pennants, are a kind of extremely tight wedge that often appears after large moves up or down. The shape of the flag is more of a triangular boat flag as opposed to a standard national flag.[25]Bullish or bearish? Neutral. Flags don’t signal anything other than decision points where investors and traders are unsure of what to do.
Confirmation Patterns
Rising windowThe rising window is a two-candle confirmation signal that occurs when a candle gaps up past a support or resistance line following an uptrend.[26]Bullish or bearish? Bullish.What is a confirmation? In technical analysis, a confirmation refers to any event which affirms the previous signal. So, take three white soldiers—a classic bullish signal. If the three white soldiers sit on a resistance line and then a rising window breaks that line, it is considered a confirmation—the bullish trend is set to continue.Falling windowThe falling window (sometimes casually and incorrectly called a falling dagger) is the reverse of a rising window. It’s a two-candle confirmation that breaks a trend or support/resistance line by gapping down past it.[27]Bullish or bearish? Bearish.Three inside upFollowing a period of consolidation or a downward trend, you can spot a reversal confirmation with the three inside up pattern. This is a large red candle, a smaller green candle that sits around the base of the first candle, and then a green candle rising above the first candle's high.[28]Bullish or bearish? Bullish.Three inside downThree inside down is the bearish version of the three inside up. A large green candle is followed by a rising red candle, then a red candle that breaks the previous low of the initial green candle.[29]Bullish or bearish? Bearish.Three outside upThree outside up is a bullish confirmation signal that requires a red candle, an engulfing green candle, and a third green candle with a midpoint higher than the top of the previous candle.[30]Bullish or bearish? Bullish.Three outside downThree outside down is the reverse of the three outside up. A green candle is engulfed by a large red candle, then there’s a third red candle trending down and passing the base of the engulfing candle.Bullish or bearish? Bearish.
$ETH
$BTC
25
17
61
243
·
--
ສັນຍານໝີ
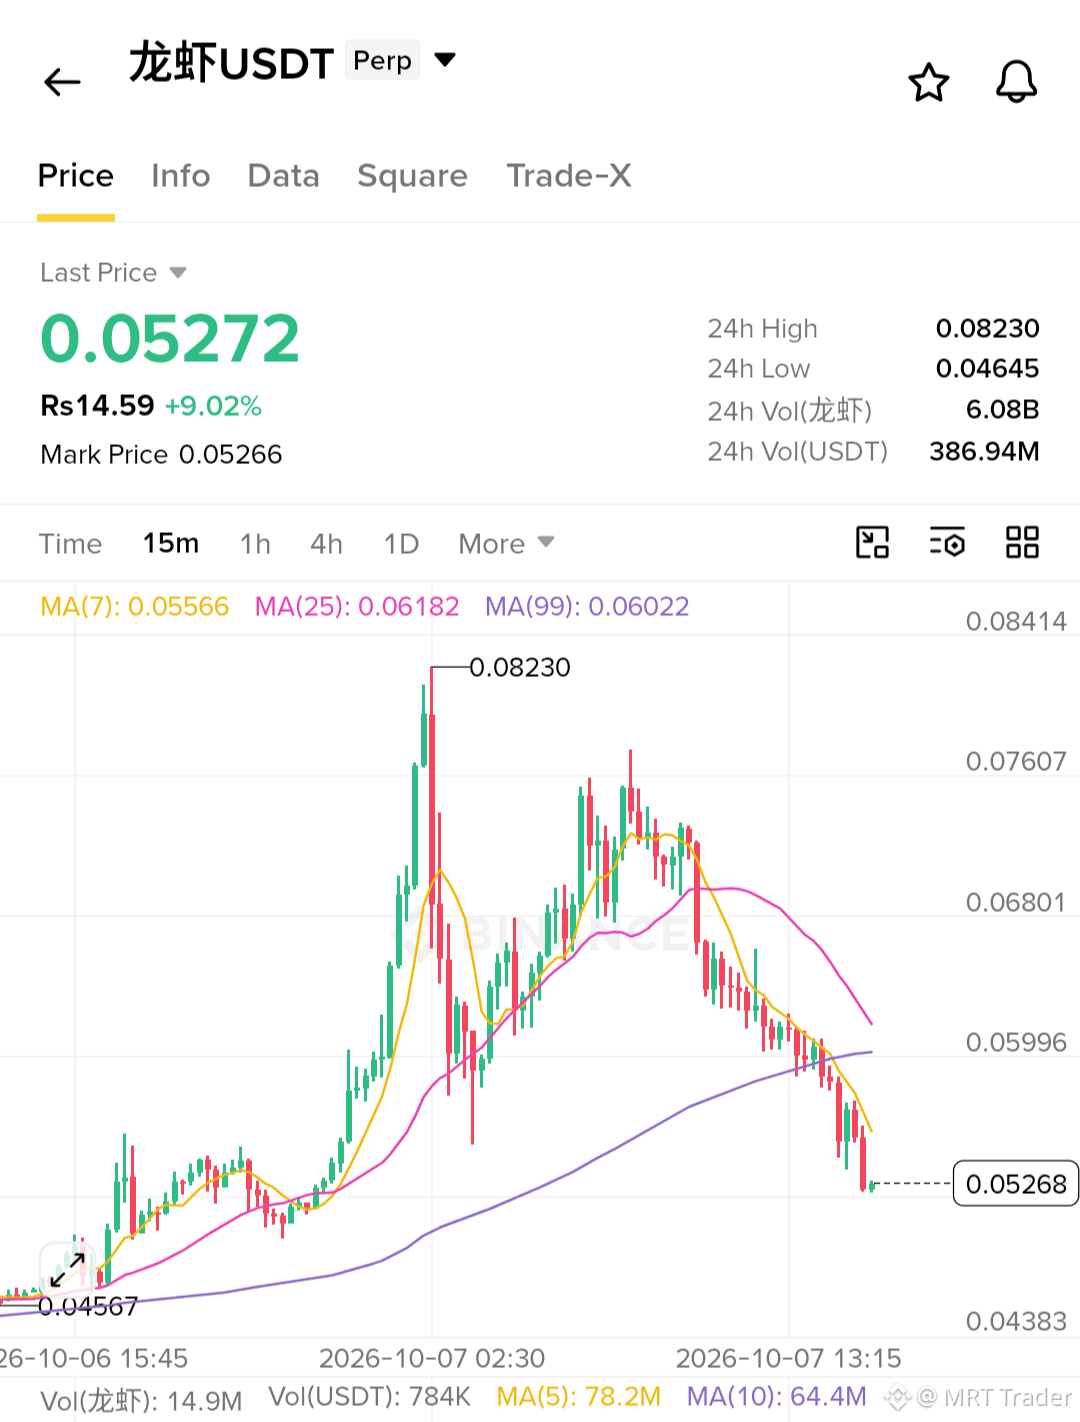
**$龙虾 ** reversed sharply off the $0.075 area and is now pressing the $0.0535 region. Sellers still in control while price stays below the recent breakdown zone.
Short Entry: $0.0537–$0.0552
TP1: $0.0522
TP2: $0.0502
TP3: $0.0472
🛑 SL: $0.0572
Momentum is strongly bearish. Confirmation below $0.0535 and this accelerates toward TP1 quickly. Only take it inside the zone — reclaim $0.0572 and the short thesis is dead, I'm out.
**$龙虾 ** reversed sharply off the $0.075 area and is now pressing the $0.0535 region. Sellers still in control while price stays below the recent breakdown zone.
Short Entry: $0.0537–$0.0552
TP1: $0.0522
TP2: $0.0502
TP3: $0.0472
🛑 SL: $0.0572
Momentum is strongly bearish. Confirmation below $0.0535 and this accelerates toward TP1 quickly. Only take it inside the zone — reclaim $0.0572 and the short thesis is dead, I'm out.
Short Entry: $0.0537–$0.0552
TP1: $0.0522
TP2: $0.0502
TP3: $0.0472
🛑 SL: $0.0572
Momentum is strongly bearish. Confirmation below $0.0535 and this accelerates toward TP1 quickly. Only take it inside the zone — reclaim $0.0572 and the short thesis is dead, I'm out.
116
·
--
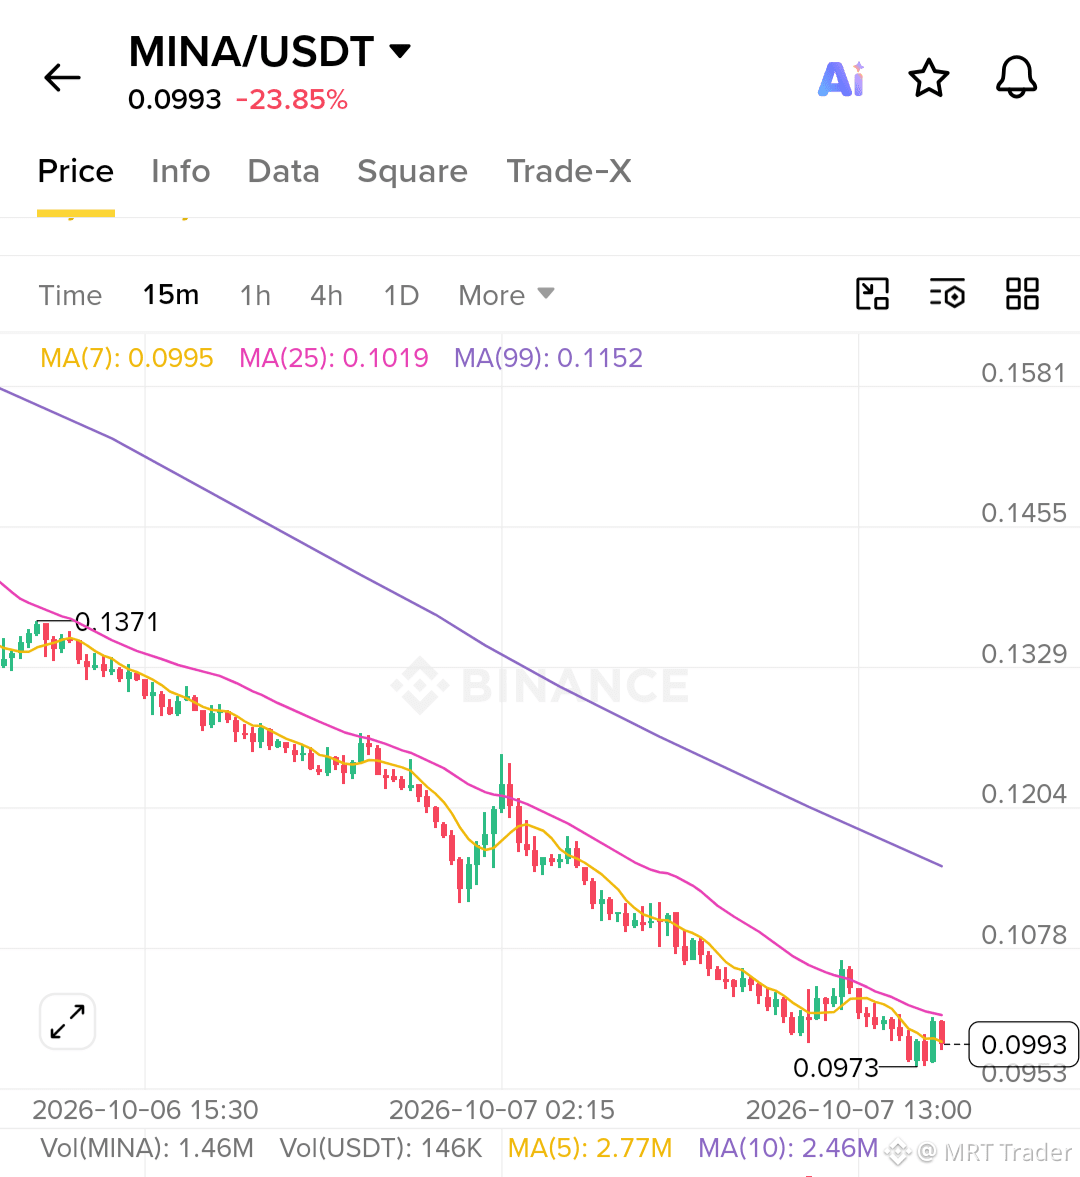
$MINA SHORT SETUP | 1H
Breakout area being revisited as a potential short entry.
Entry zone: 0.09914–0.10008
Stop loss: 0.10253
Targets: TP1 0.09696 (0.91R) / TP2 0.09365 (2.04R) / TP3 0.09034 (3.17R)
Scale out: 25% / 25% / 50%
Considerations: Estimated EV comes in at -0.48R, below my active threshold. That negative EV is the real issue here, not the level itself. This one showed up in recent scans, but the math doesn't justify a live entry yet.
Status: Watchlist only. Wait for confirmation before considering this one.
#MINA
{future}(MINAUSDT)
$MINA SHORT SETUP | 1H
Breakout area being revisited as a potential short entry.
Entry zone: 0.09914–0.10008
Stop loss: 0.10253
Targets: TP1 0.09696 (0.91R) / TP2 0.09365 (2.04R) / TP3 0.09034 (3.17R)
Scale out: 25% / 25% / 50%
Considerations: Estimated EV comes in at -0.48R, below my active threshold. That negative EV is the real issue here, not the level itself. This one showed up in recent scans, but the math doesn't justify a live entry yet.
Status: Watchlist only. Wait for confirmation before considering this one.
#MINA
Breakout area being revisited as a potential short entry.
Entry zone: 0.09914–0.10008
Stop loss: 0.10253
Targets: TP1 0.09696 (0.91R) / TP2 0.09365 (2.04R) / TP3 0.09034 (3.17R)
Scale out: 25% / 25% / 50%
Considerations: Estimated EV comes in at -0.48R, below my active threshold. That negative EV is the real issue here, not the level itself. This one showed up in recent scans, but the math doesn't justify a live entry yet.
Status: Watchlist only. Wait for confirmation before considering this one.
#MINA
2
·
--
ສັນຍານໝີ
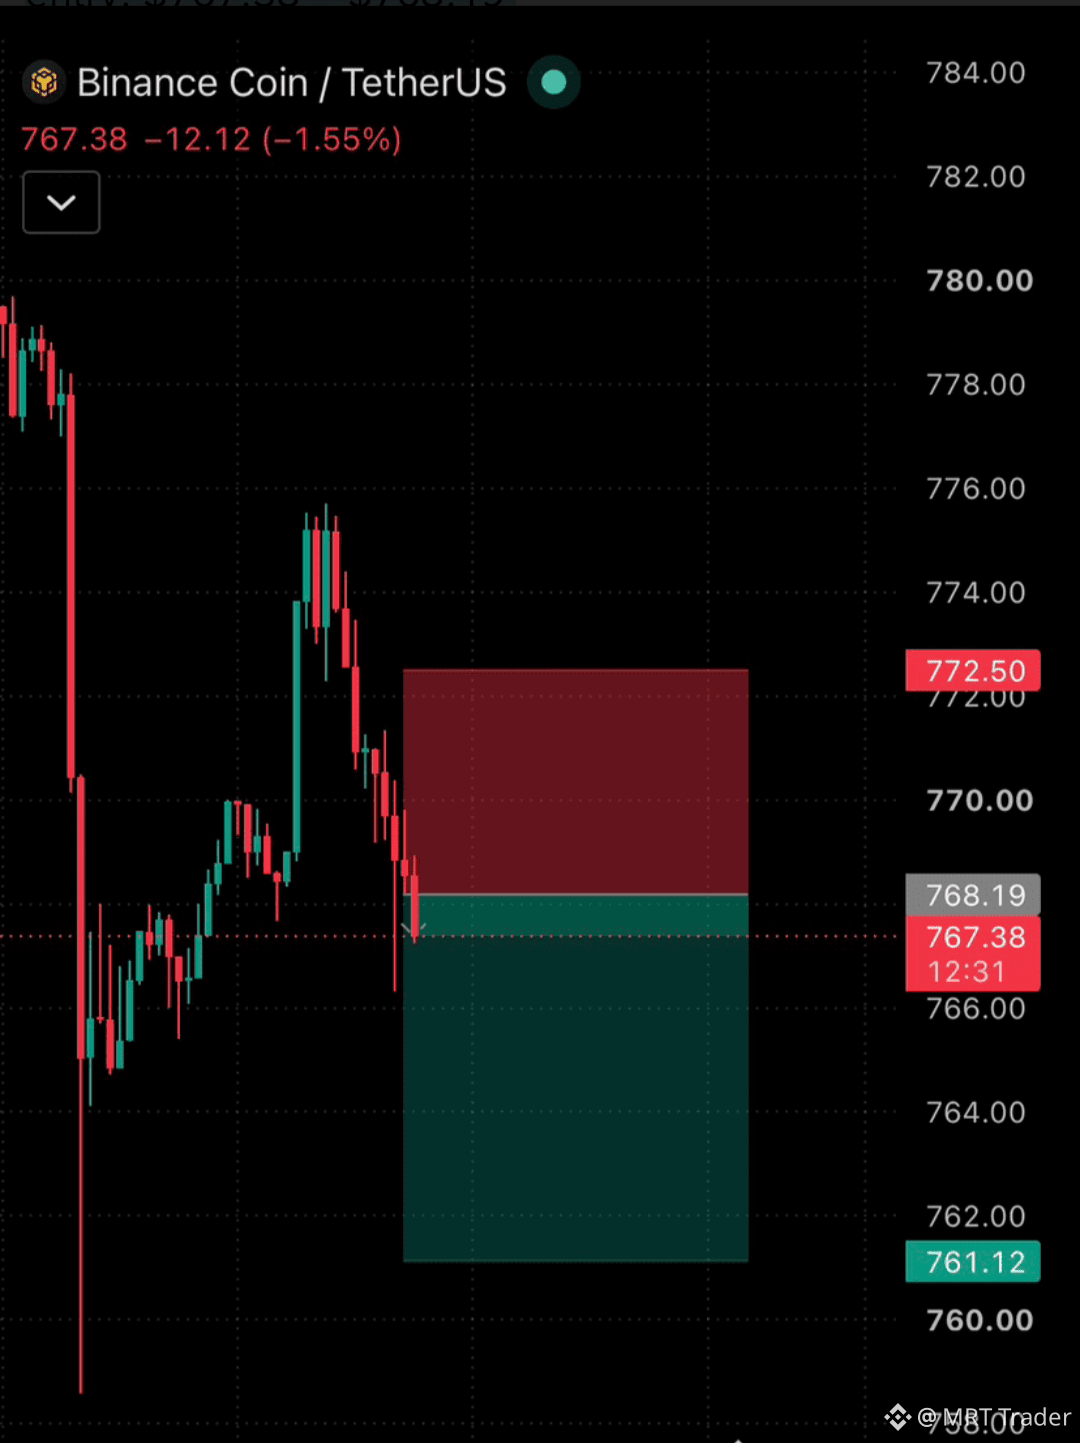
Attention traders ‼️ $BNB is dropping again and the downside pressure is still heavy.
I'm short here — watching for another leg down.
Entry: $767.52 – $768.33
Targets: $765.14 / $763.14 / $761.26
🛑 SL: $772.64
Only take it inside the zone. Reclaim $772.64 and the drop thesis is dead — I'm out, no arguing.
Click here to Trade 👇
#BNB
Attention traders ‼️ $BNB is dropping again and the downside pressure is still heavy.
I'm short here — watching for another leg down.
Entry: $767.52 – $768.33
Targets: $765.14 / $763.14 / $761.26
🛑 SL: $772.64
Only take it inside the zone. Reclaim $772.64 and the drop thesis is dead — I'm out, no arguing.
Click here to Trade 👇
#BNB
I'm short here — watching for another leg down.
Entry: $767.52 – $768.33
Targets: $765.14 / $763.14 / $761.26
🛑 SL: $772.64
Only take it inside the zone. Reclaim $772.64 and the drop thesis is dead — I'm out, no arguing.
Click here to Trade 👇
#BNB
5
·
--
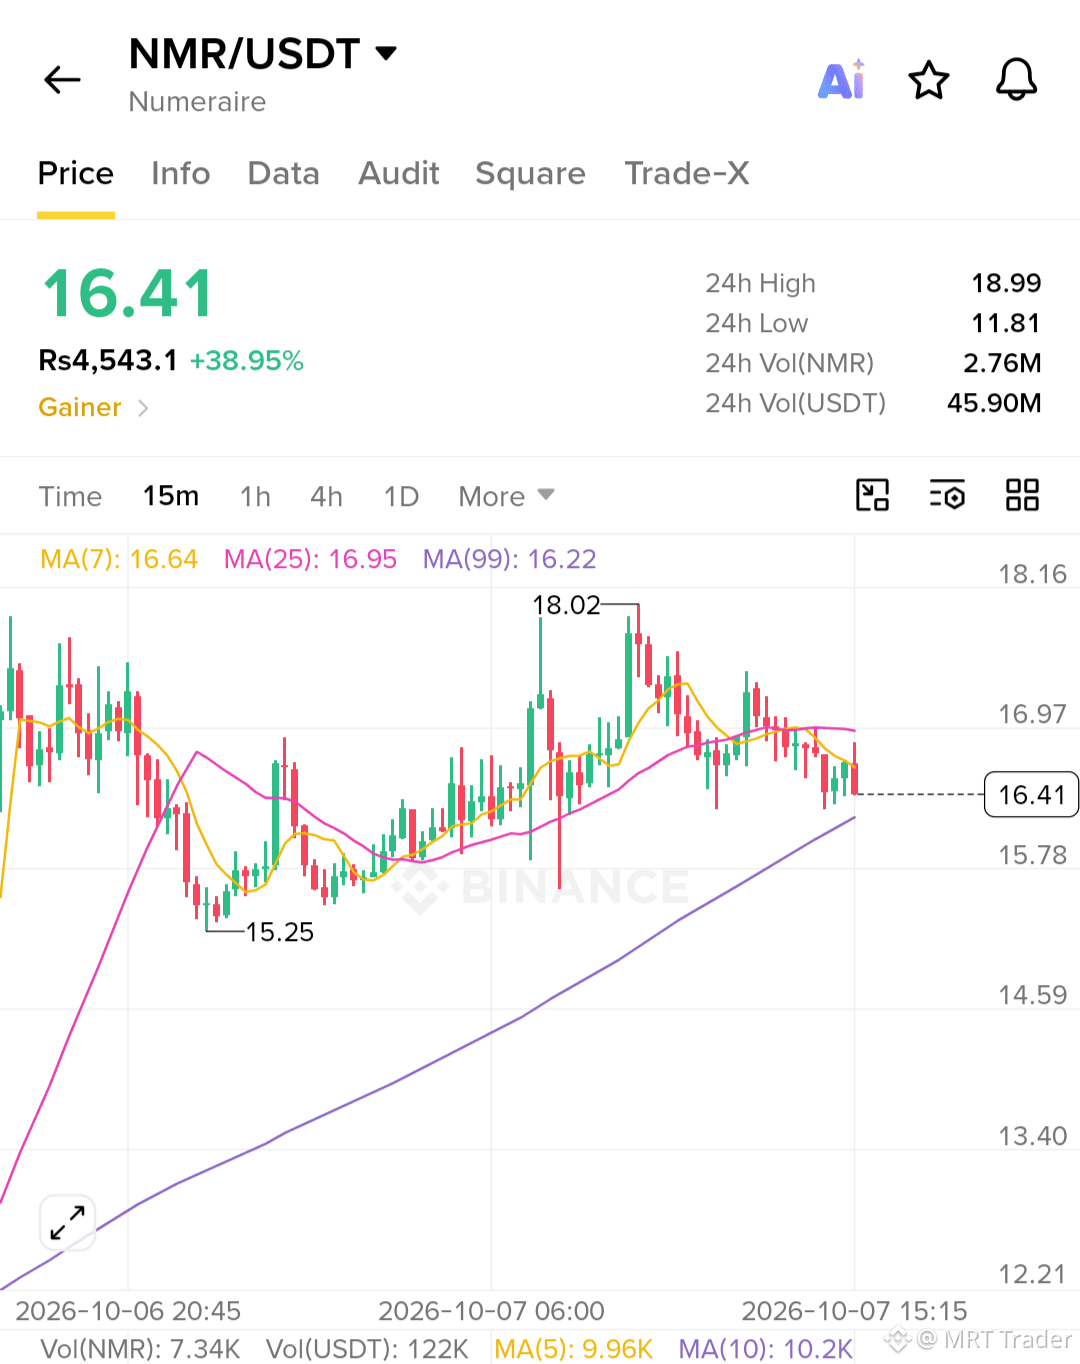
Let's zoom out a bit on $NMR 🤔 Al
The move from $11 to $17+ in a single day looks fascinating, yeah. But the deeper picture is what's actually interesting.
Since those $54 highs, #NMR has been printing a clear lower highs structure on the higher timeframe. First major attempt got rejected around $28, second one around $23. Both failed, price went back down each time.
So for this current pump, I'm watching $20 first, then that $23 area. That's where it gets interesting.
Rejection around $19–$20 and we're likely watching the same pattern repeat — back down again. But if buyers push through $20 and break that $23 resistance, the lower-high structure starts getting challenged and NMR could have room for a much bigger move
For now, +38% in a day is already a massive move. Chasing it blindly here? Nope 😅 Let's see how this one plays out — $20–$23 is the zone I'm watching.
NMRUSDT
Perp
Let's zoom out a bit on $NMR 🤔 Al
The move from $11 to $17+ in a single day looks fascinating, yeah. But the deeper picture is what's actually interesting.
Since those $54 highs, #NMR has been printing a clear lower highs structure on the higher timeframe. First major attempt got rejected around $28, second one around $23. Both failed, price went back down each time.
So for this current pump, I'm watching $20 first, then that $23 area. That's where it gets interesting.
Rejection around $19–$20 and we're likely watching the same pattern repeat — back down again. But if buyers push through $20 and break that $23 resistance, the lower-high structure starts getting challenged and NMR could have room for a much bigger move
For now, +38% in a day is already a massive move. Chasing it blindly here? Nope 😅 Let's see how this one plays out — $20–$23 is the zone I'm watching.
NMRUSDT
Perp
The move from $11 to $17+ in a single day looks fascinating, yeah. But the deeper picture is what's actually interesting.
Since those $54 highs, #NMR has been printing a clear lower highs structure on the higher timeframe. First major attempt got rejected around $28, second one around $23. Both failed, price went back down each time.
So for this current pump, I'm watching $20 first, then that $23 area. That's where it gets interesting.
Rejection around $19–$20 and we're likely watching the same pattern repeat — back down again. But if buyers push through $20 and break that $23 resistance, the lower-high structure starts getting challenged and NMR could have room for a much bigger move
For now, +38% in a day is already a massive move. Chasing it blindly here? Nope 😅 Let's see how this one plays out — $20–$23 is the zone I'm watching.
NMRUSDT
Perp
20
·
--
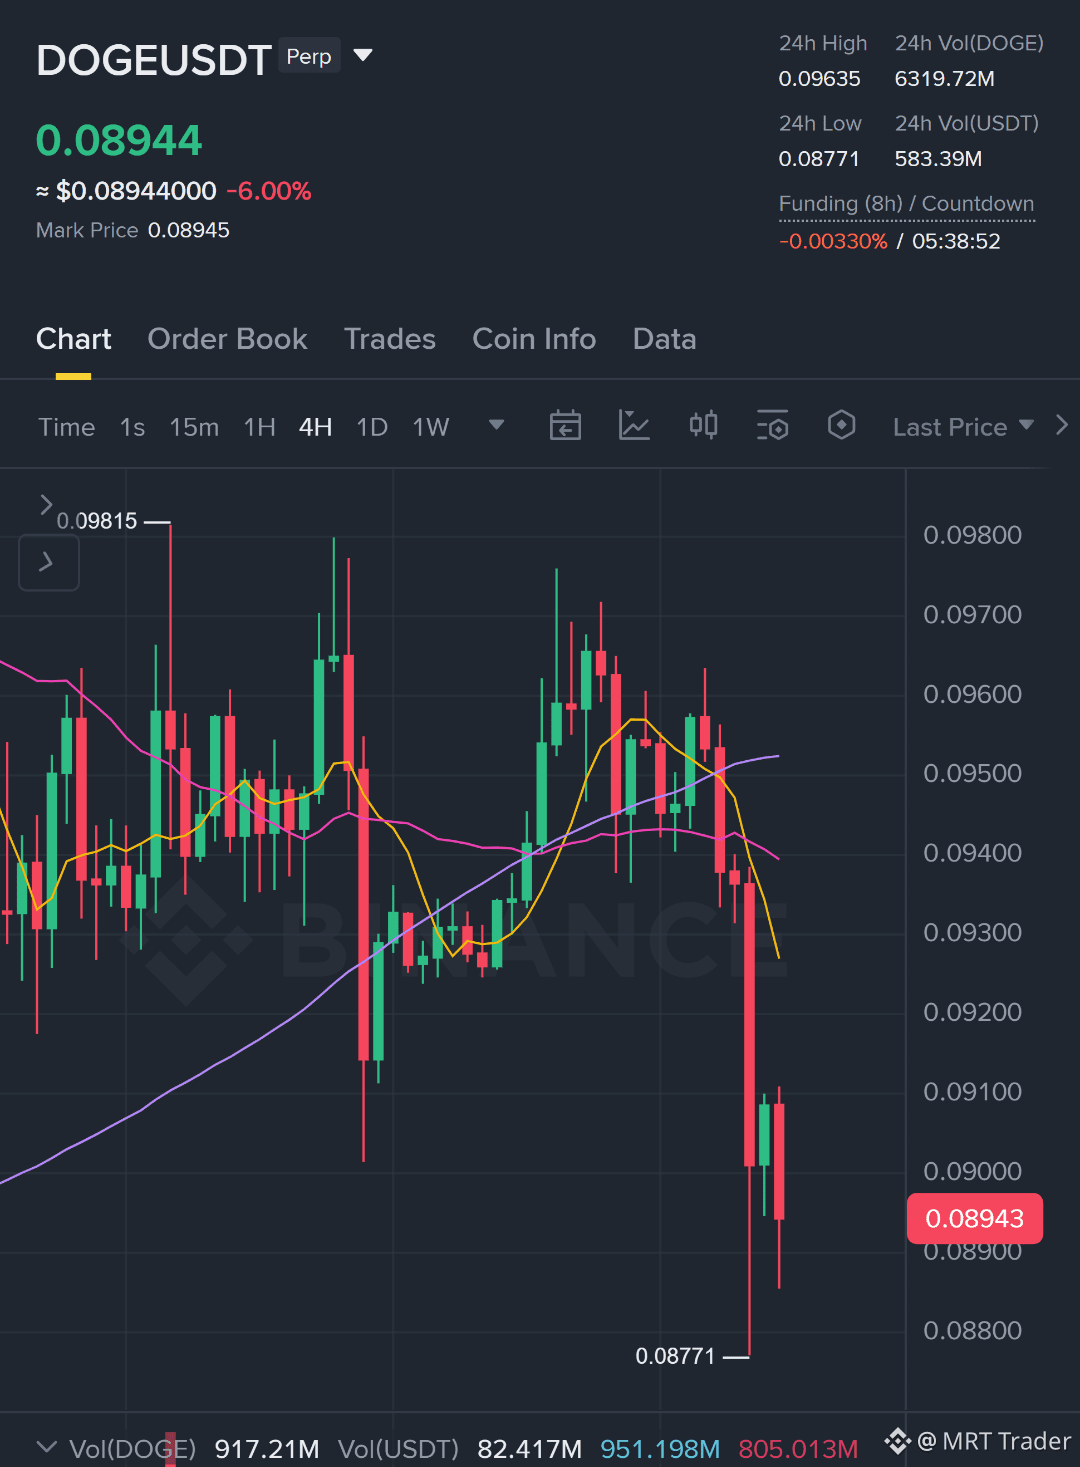
$DOGE SHORT SETUP | 1H
Continuation opportunity developing in the direction of the trend.
Entry zone: 0.09035–0.09051
Stop loss: 0.09131
Targets: TP1 0.08955 (1R) / TP2 0.08780 (2.99R) / TP3 0.08714 (3.74R)
Scale out: 20% / 30% / 50%
Considerations: The 15M entry confirmation isn't complete yet, and price is sitting away from the planned entry. It may need a retest before this is valid. The incomplete confirmation is the real issue here, not the levels.
Status: Watchlist only. Wait for confirmation before considering this one.
#DOGE
{future}(DOGEUSDT)
$DOGE SHORT SETUP | 1H
Continuation opportunity developing in the direction of the trend.
Entry zone: 0.09035–0.09051
Stop loss: 0.09131
Targets: TP1 0.08955 (1R) / TP2 0.08780 (2.99R) / TP3 0.08714 (3.74R)
Scale out: 20% / 30% / 50%
Considerations: The 15M entry confirmation isn't complete yet, and price is sitting away from the planned entry. It may need a retest before this is valid. The incomplete confirmation is the real issue here, not the levels.
Status: Watchlist only. Wait for confirmation before considering this one.
#DOGE
Continuation opportunity developing in the direction of the trend.
Entry zone: 0.09035–0.09051
Stop loss: 0.09131
Targets: TP1 0.08955 (1R) / TP2 0.08780 (2.99R) / TP3 0.08714 (3.74R)
Scale out: 20% / 30% / 50%
Considerations: The 15M entry confirmation isn't complete yet, and price is sitting away from the planned entry. It may need a retest before this is valid. The incomplete confirmation is the real issue here, not the levels.
Status: Watchlist only. Wait for confirmation before considering this one.
#DOGE
7
·
--
ສັນຍານກະທິງ
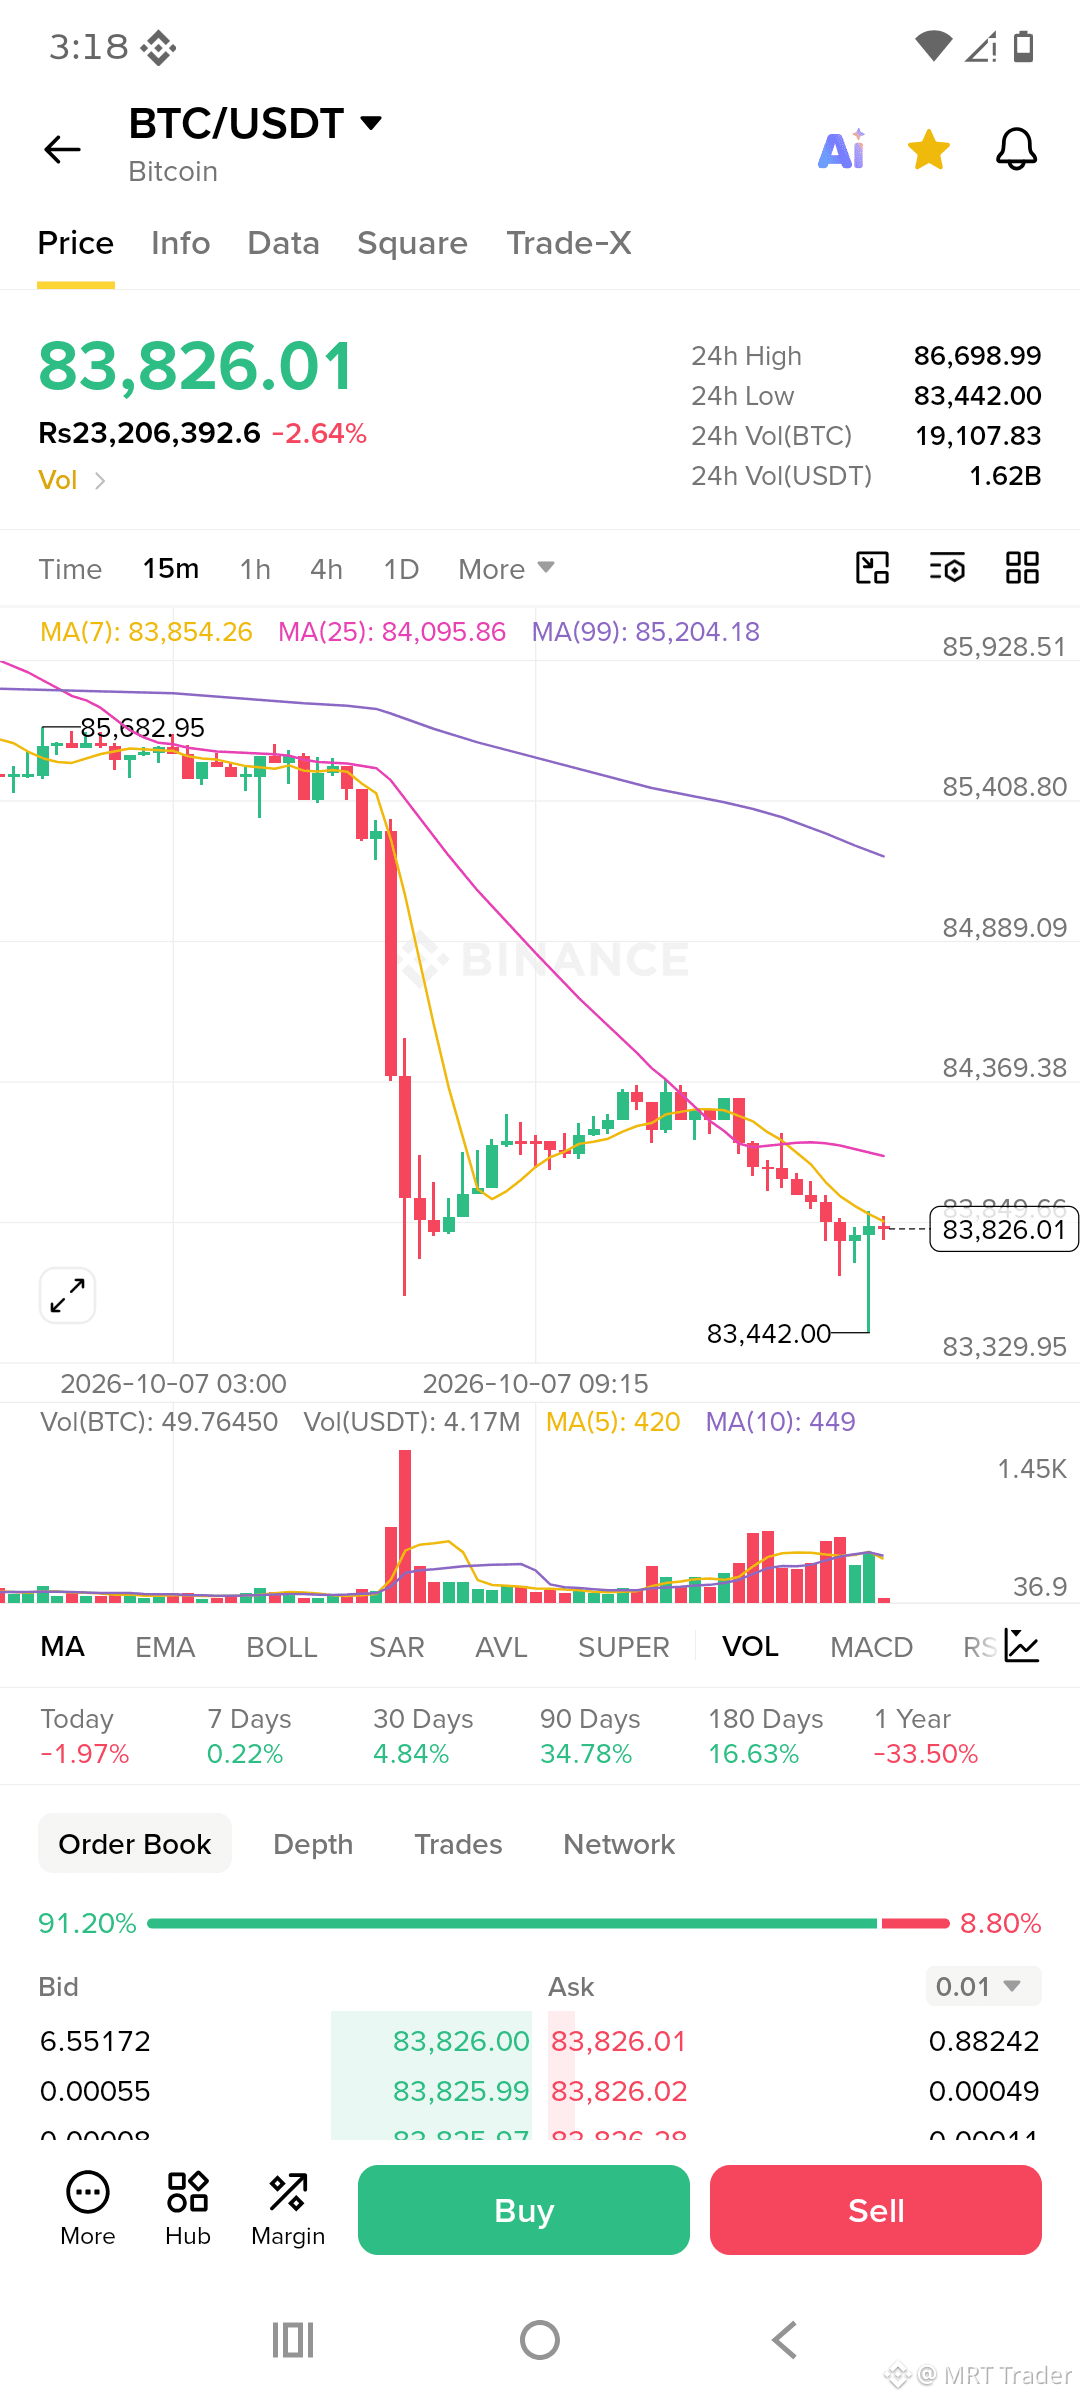
Everyone, **$BTC ** is reacting off the $83.65K support area.
Quick scalp long is ready — I'm in. But this is a risky trade, so size it small and manage it carefully.
Entry: $83,851 – $83,914
Targets: $84,084 / $84,334 / $84,634
🛑 SL: $83,421
Only take it inside the zone. Lose $83,421 and the bounce is dead — I'm out, no holding and hoping.
Click here to Trade 👇
#BTC
{future}(BTCUSDT)
Everyone, **$BTC ** is reacting off the $83.65K support area.
Quick scalp long is ready — I'm in. But this is a risky trade, so size it small and manage it carefully.
Entry: $83,851 – $83,914
Targets: $84,084 / $84,334 / $84,634
🛑 SL: $83,421
Only take it inside the zone. Lose $83,421 and the bounce is dead — I'm out, no holding and hoping.
Click here to Trade 👇
#BTC
Quick scalp long is ready — I'm in. But this is a risky trade, so size it small and manage it carefully.
Entry: $83,851 – $83,914
Targets: $84,084 / $84,334 / $84,634
🛑 SL: $83,421
Only take it inside the zone. Lose $83,421 and the bounce is dead — I'm out, no holding and hoping.
Click here to Trade 👇
#BTC
5
·
--
ສັນຍານກະທິງ
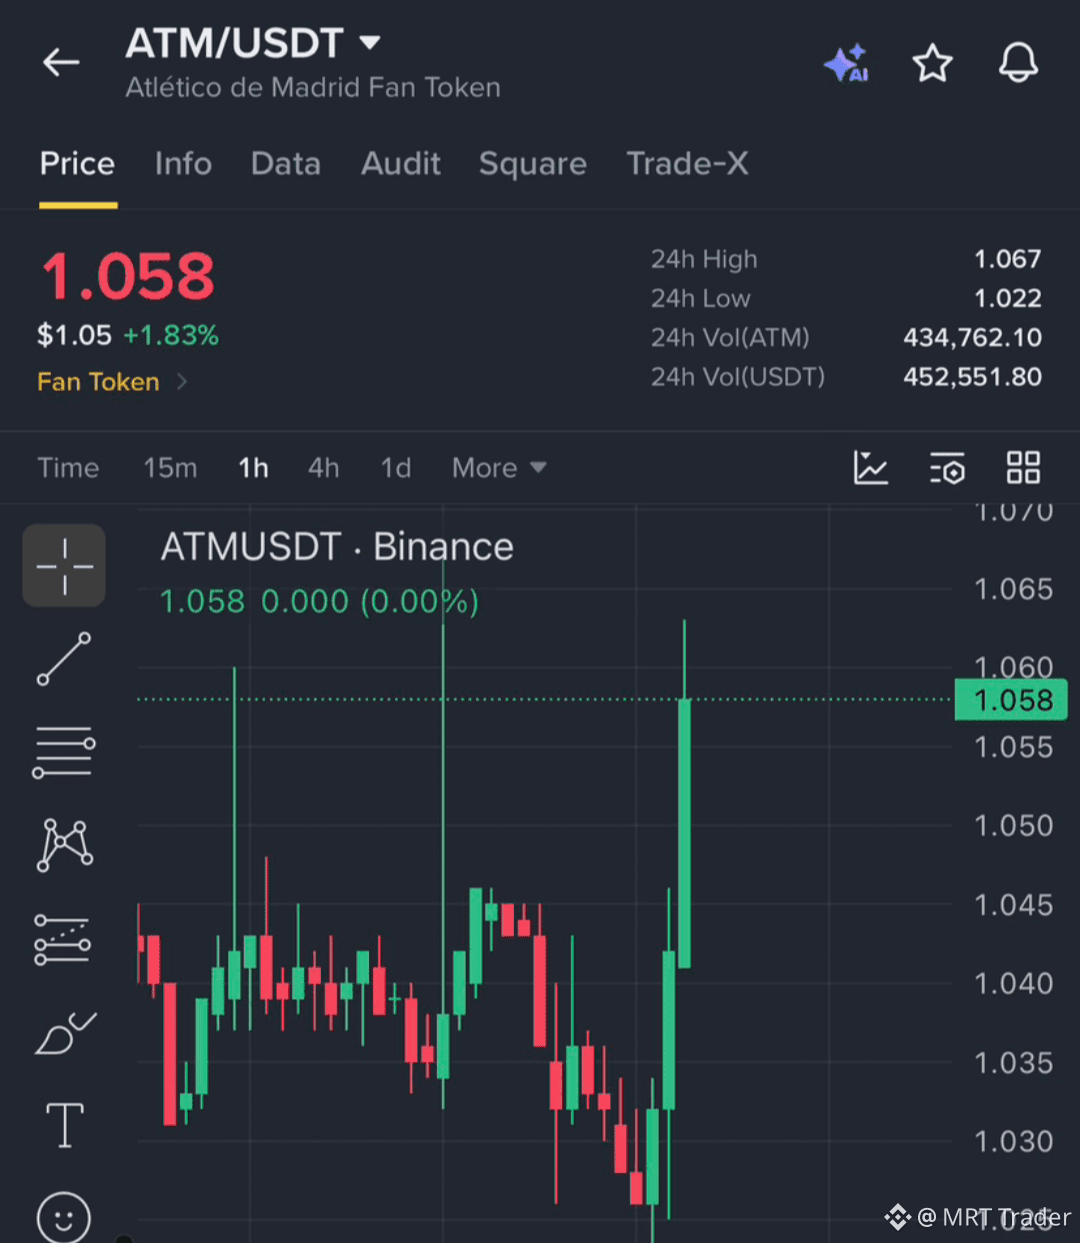
$ATM — sharp reversal off the lows with a strong breakout candle.
I'm long, but keeping risk tight after a move this sudden.
Entry: $1.047 – $1.060
Targets: $1.069 / $1.077 / $1.087
🛑 SL: $1.032
Only take it inside the zone. Lose $1.032 and the reversal is dead — I'm out, no holding and hoping.
Click here to Trade 👇
#ATM
{spot}(ATMUSDT)
$ATM — sharp reversal off the lows with a strong breakout candle.
I'm long, but keeping risk tight after a move this sudden.
Entry: $1.047 – $1.060
Targets: $1.069 / $1.077 / $1.087
🛑 SL: $1.032
Only take it inside the zone. Lose $1.032 and the reversal is dead — I'm out, no holding and hoping.
Click here to Trade 👇
#ATM
I'm long, but keeping risk tight after a move this sudden.
Entry: $1.047 – $1.060
Targets: $1.069 / $1.077 / $1.087
🛑 SL: $1.032
Only take it inside the zone. Lose $1.032 and the reversal is dead — I'm out, no holding and hoping.
Click here to Trade 👇
#ATM
1
3
·
--
ສັນຍານໝີ
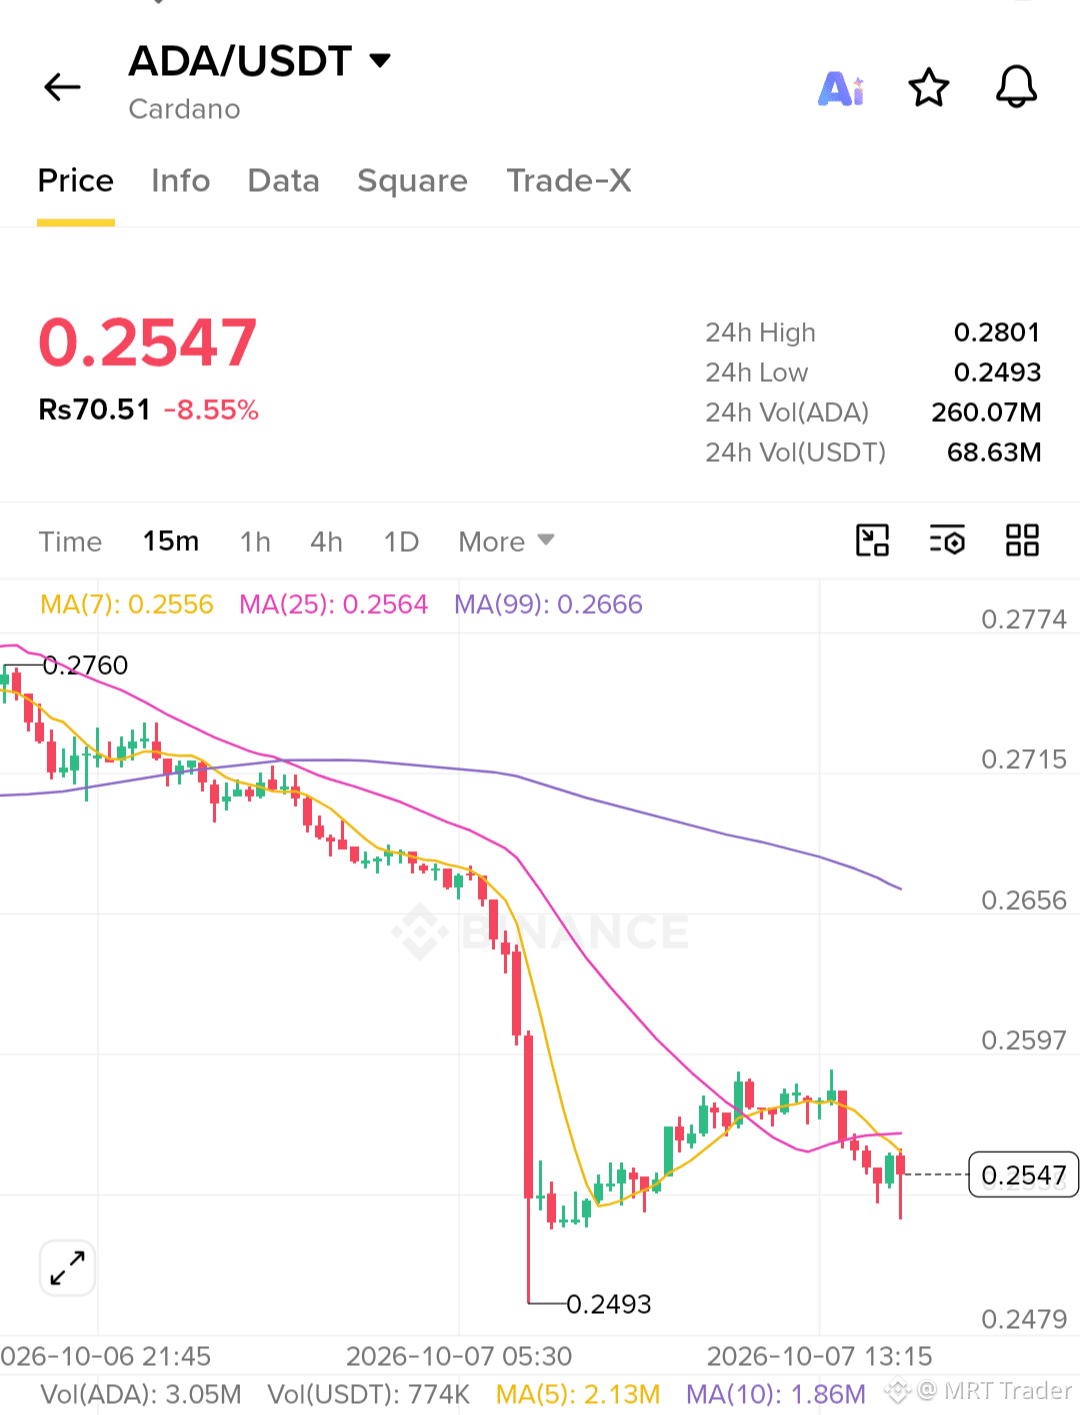
$ADA short — 0.255 is the line. Break it and we're looking at 0.250, then 0.247. Past 0.259 and it's over.
What I'm seeing:
• 4H price at 0.255, just below the EMA50 at 0.256 — trend structure still favors sellers
• Risk 1.8% to SL vs 2.9% to TP3 — roughly 1.6R if the full move plays out
🔴 SHORT · Entry 0.2546–0.2554 · TP 0.2522 / 0.2503 / 0.2475 · 🛑 SL 0.2597
Only take it inside the zone. Reclaim 0.2597 and the short thesis is dead — I'm out, no arguing.
#ADA
{future}(ADAUSDT)
$ADA short — 0.255 is the line. Break it and we're looking at 0.250, then 0.247. Past 0.259 and it's over.
What I'm seeing:
• 4H price at 0.255, just below the EMA50 at 0.256 — trend structure still favors sellers
• Risk 1.8% to SL vs 2.9% to TP3 — roughly 1.6R if the full move plays out
🔴 SHORT · Entry 0.2546–0.2554 · TP 0.2522 / 0.2503 / 0.2475 · 🛑 SL 0.2597
Only take it inside the zone. Reclaim 0.2597 and the short thesis is dead — I'm out, no arguing.
#ADA
What I'm seeing:
• 4H price at 0.255, just below the EMA50 at 0.256 — trend structure still favors sellers
• Risk 1.8% to SL vs 2.9% to TP3 — roughly 1.6R if the full move plays out
🔴 SHORT · Entry 0.2546–0.2554 · TP 0.2522 / 0.2503 / 0.2475 · 🛑 SL 0.2597
Only take it inside the zone. Reclaim 0.2597 and the short thesis is dead — I'm out, no arguing.
#ADA
1
3
·
--
ສັນຍານກະທິງ
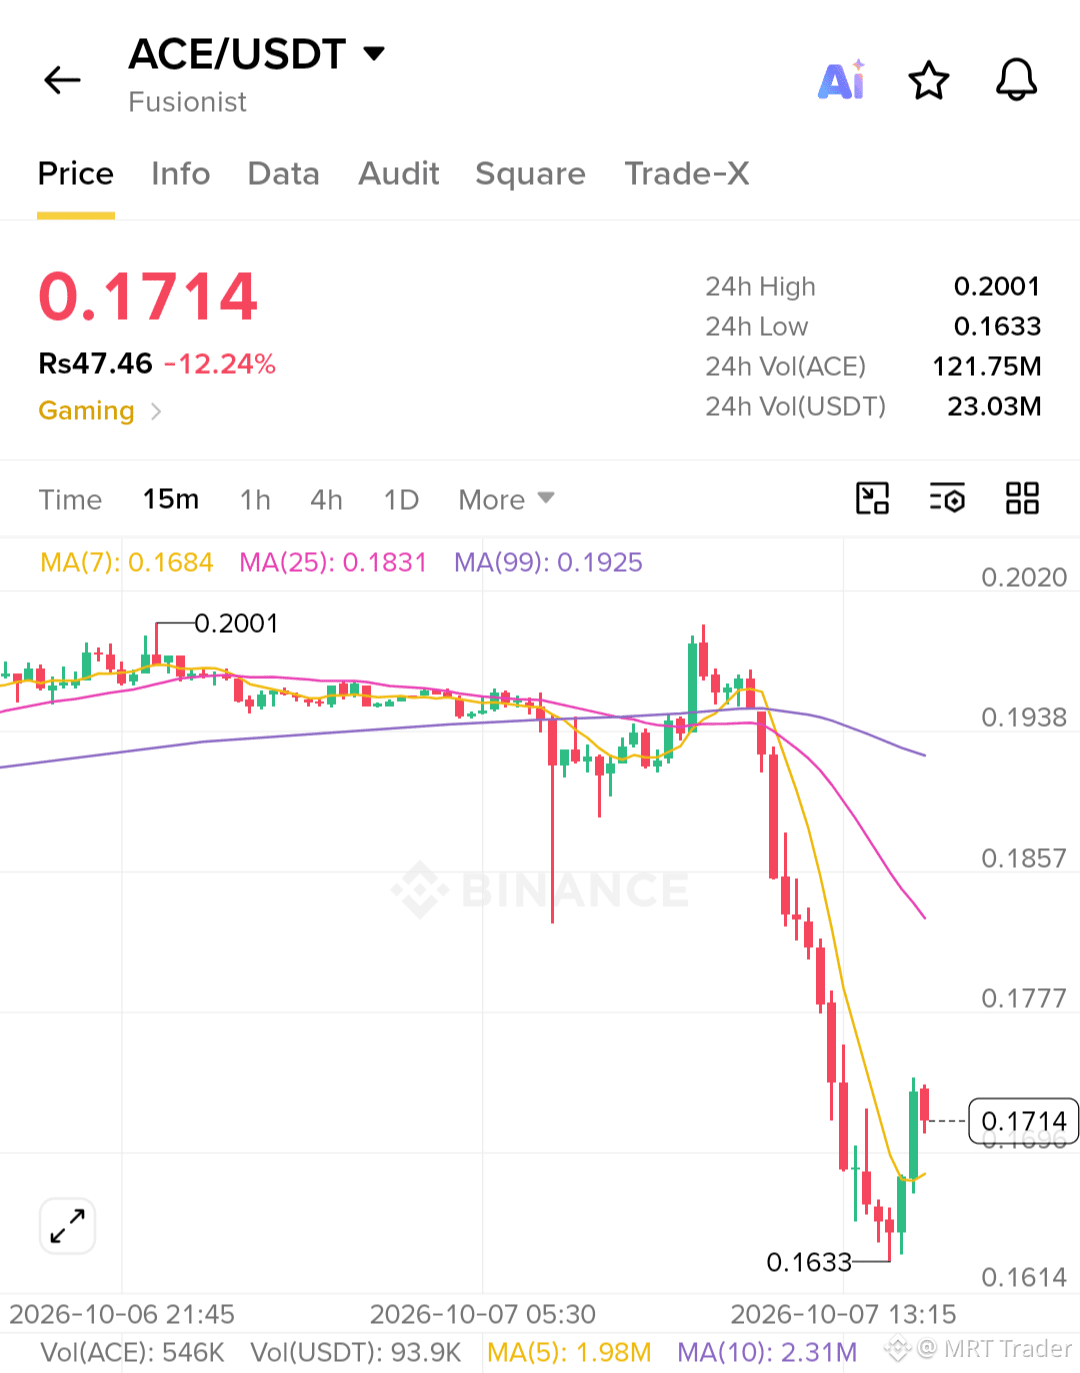
$ACE long — 0.172 is the 4H support buyers need to hold 👀
Hold 0.172 and we're looking at 0.187, then 0.195. Lose 0.158 and the idea's off the table. I want to see buyers actually defend this level and push back up — no defense, no trade.
What I'm seeing:
• Daily is above the EMA200 at 0.155 — bigger trend is on this side
• 1H RSI at 29 — momentum has reset, room to bounce from here
• Risk 8.3% to SL vs 13.1% to TP3 — roughly 1.6R if the full move plays out
🟢 LONG · Entry 0.1719–0.1738 · TP 0.1813 / 0.1870 / 0.1955 · 🛑 SL 0.1586
Only take it inside the zone. Lose 0.1586 and the setup is dead — I'm out, no averaging down.
NFA · DYOR#ACE
{future}(ACEUSDT)
$ACE long — 0.172 is the 4H support buyers need to hold 👀
Hold 0.172 and we're looking at 0.187, then 0.195. Lose 0.158 and the idea's off the table. I want to see buyers actually defend this level and push back up — no defense, no trade.
What I'm seeing:
• Daily is above the EMA200 at 0.155 — bigger trend is on this side
• 1H RSI at 29 — momentum has reset, room to bounce from here
• Risk 8.3% to SL vs 13.1% to TP3 — roughly 1.6R if the full move plays out
🟢 LONG · Entry 0.1719–0.1738 · TP 0.1813 / 0.1870 / 0.1955 · 🛑 SL 0.1586
Only take it inside the zone. Lose 0.1586 and the setup is dead — I'm out, no averaging down.
NFA · DYOR#ACE
Hold 0.172 and we're looking at 0.187, then 0.195. Lose 0.158 and the idea's off the table. I want to see buyers actually defend this level and push back up — no defense, no trade.
What I'm seeing:
• Daily is above the EMA200 at 0.155 — bigger trend is on this side
• 1H RSI at 29 — momentum has reset, room to bounce from here
• Risk 8.3% to SL vs 13.1% to TP3 — roughly 1.6R if the full move plays out
🟢 LONG · Entry 0.1719–0.1738 · TP 0.1813 / 0.1870 / 0.1955 · 🛑 SL 0.1586
Only take it inside the zone. Lose 0.1586 and the setup is dead — I'm out, no averaging down.
NFA · DYOR#ACE
1
3
·
--
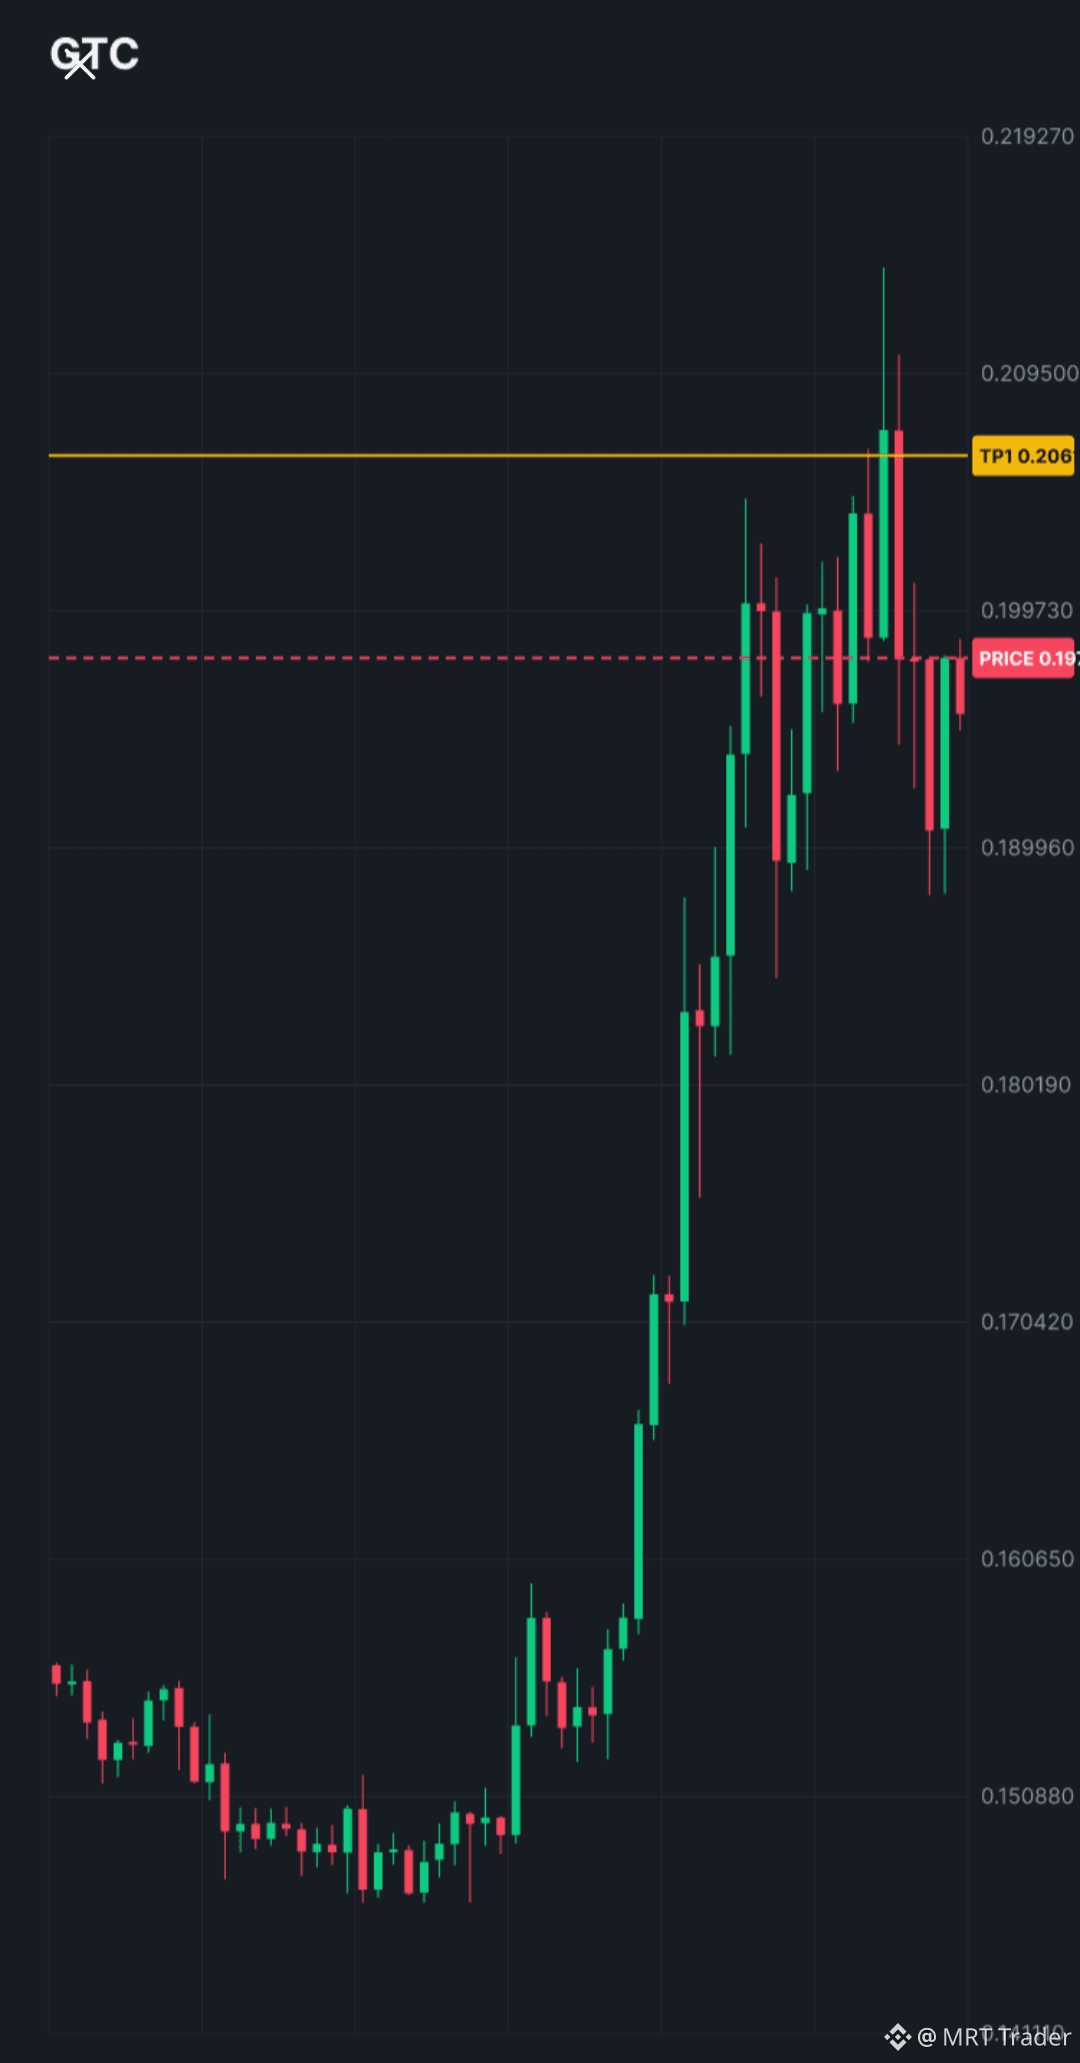
Whoa… $GTC is lining up for a move ⁉
$GTC LONG
Entry: 0.198186
TP1: 0.206519 | TP2: 0.210973
SL: 0.187052
DYOR — manage risk carefully. Only take it inside the zone. Lose 0.187052 and the setup is dead — I'm out, no holding and hoping.
Whoa… $GTC is lining up for a move ⁉
$GTC LONG
Entry: 0.198186
TP1: 0.206519 | TP2: 0.210973
SL: 0.187052
DYOR — manage risk carefully. Only take it inside the zone. Lose 0.187052 and the setup is dead — I'm out, no holding and hoping.
$GTC LONG
Entry: 0.198186
TP1: 0.206519 | TP2: 0.210973
SL: 0.187052
DYOR — manage risk carefully. Only take it inside the zone. Lose 0.187052 and the setup is dead — I'm out, no holding and hoping.
1
17
·
--
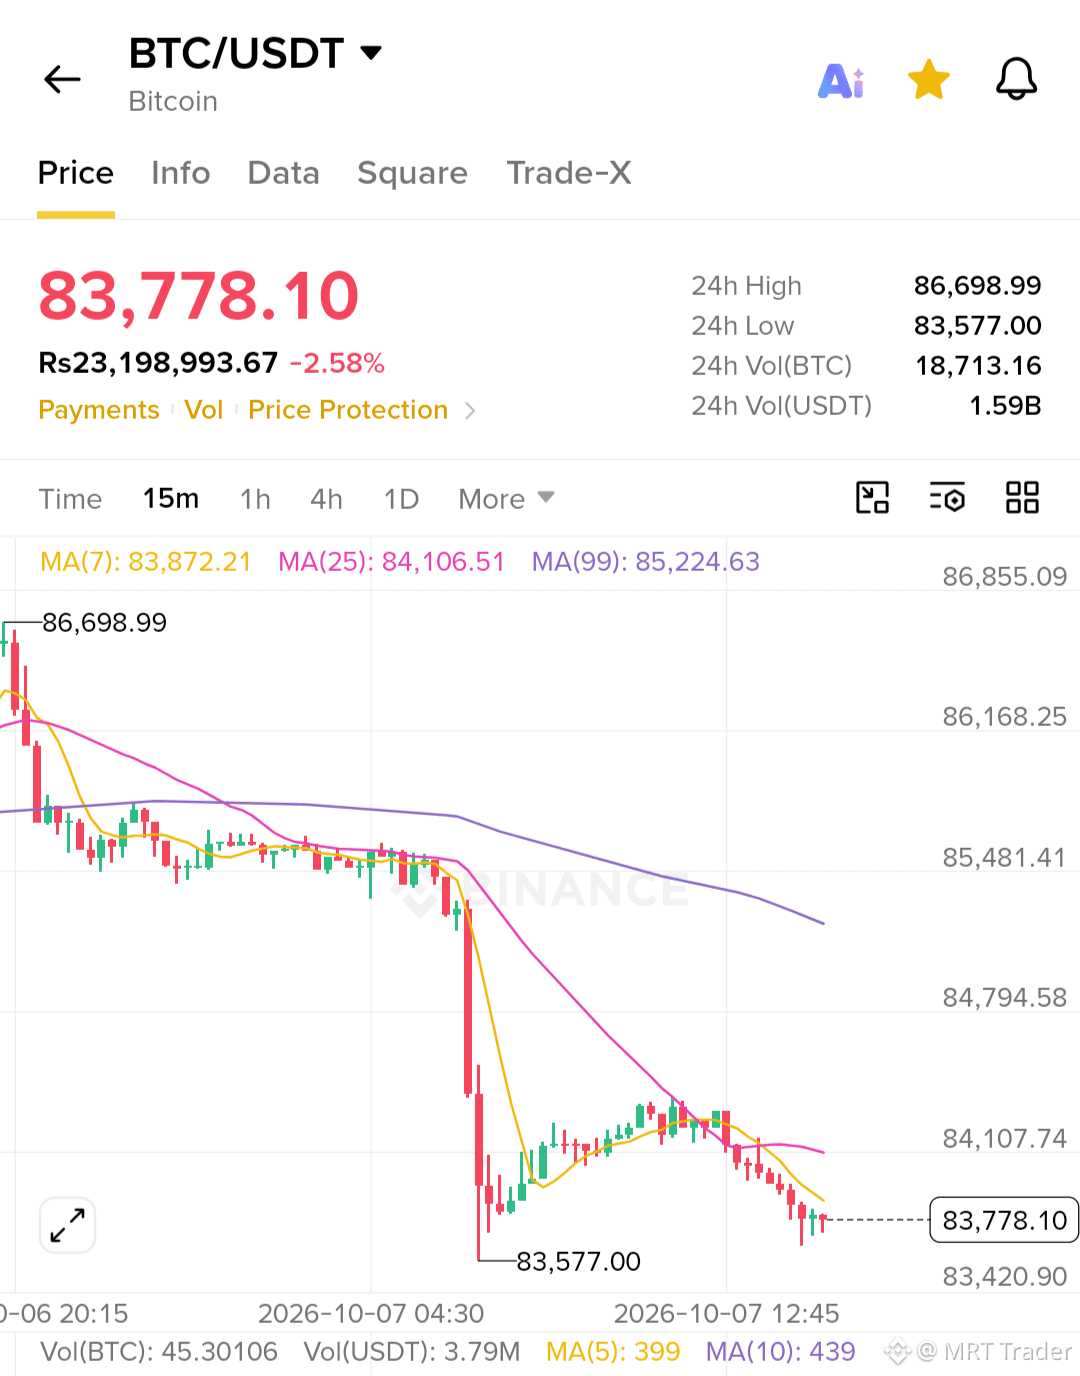
$BTC — preparing to test the lower support of the parallel channel again. That zone has held before, and it may offer another entry.
Bitcoin is trading around 83,800.
Chart structure hasn't changed from what I've been saying — price keeps fluctuating inside this parallel channel. We're now heading toward the lower boundary, which lines up with the 0.386 Fibonacci retracement around 82,500–83,000. That confluence is what makes it worth watching.
Worth remembering: last time price bounced around inside this channel between roughly 75,000 and 82,000 before breaking sharply upward. Same structure, same resolution.
My view hasn't changed — the broader trend is still a bull market. After this consolidation, price should break upward out of the channel. So a pullback into that strong support zone is an opportunity to go long, not a reason to panic.
$ETH $PUMP
$BTC — preparing to test the lower support of the parallel channel again. That zone has held before, and it may offer another entry.
Bitcoin is trading around 83,800.
Chart structure hasn't changed from what I've been saying — price keeps fluctuating inside this parallel channel. We're now heading toward the lower boundary, which lines up with the 0.386 Fibonacci retracement around 82,500–83,000. That confluence is what makes it worth watching.
Worth remembering: last time price bounced around inside this channel between roughly 75,000 and 82,000 before breaking sharply upward. Same structure, same resolution.
My view hasn't changed — the broader trend is still a bull market. After this consolidation, price should break upward out of the channel. So a pullback into that strong support zone is an opportunity to go long, not a reason to panic.
$ETH $PUMP
Bitcoin is trading around 83,800.
Chart structure hasn't changed from what I've been saying — price keeps fluctuating inside this parallel channel. We're now heading toward the lower boundary, which lines up with the 0.386 Fibonacci retracement around 82,500–83,000. That confluence is what makes it worth watching.
Worth remembering: last time price bounced around inside this channel between roughly 75,000 and 82,000 before breaking sharply upward. Same structure, same resolution.
My view hasn't changed — the broader trend is still a bull market. After this consolidation, price should break upward out of the channel. So a pullback into that strong support zone is an opportunity to go long, not a reason to panic.
$ETH $PUMP
1
57
·
--
ສັນຍານໝີ
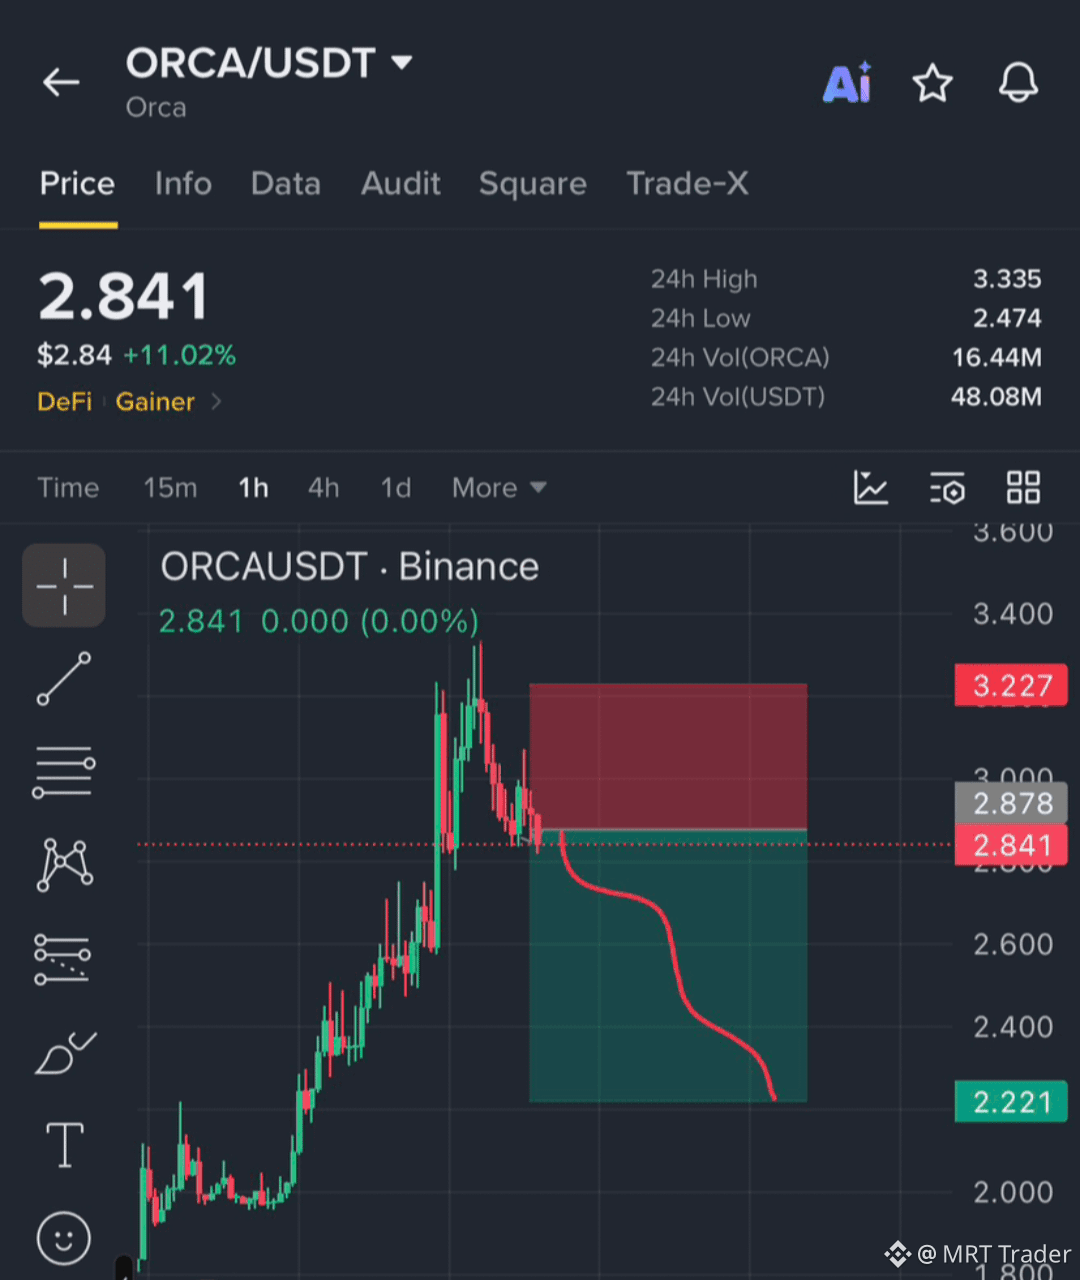
$ORCA tried to push higher, but sellers are taking control ‼️
Watching for a bigger drop from here. I'm short.
Entry: $2.844 – $2.884
Targets: $2.654 / $2.424 / $2.224
🛑 SL: $3.234
Only take it inside the zone. Reclaim $3.234 and the short thesis is dead — I'm out, no arguing.
Click here to Trade 👇
#ORCA
$ORCA tried to push higher, but sellers are taking control ‼️
Watching for a bigger drop from here. I'm short.
Entry: $2.844 – $2.884
Targets: $2.654 / $2.424 / $2.224
🛑 SL: $3.234
Only take it inside the zone. Reclaim $3.234 and the short thesis is dead — I'm out, no arguing.
Click here to Trade 👇
#ORCA
Watching for a bigger drop from here. I'm short.
Entry: $2.844 – $2.884
Targets: $2.654 / $2.424 / $2.224
🛑 SL: $3.234
Only take it inside the zone. Reclaim $3.234 and the short thesis is dead — I'm out, no arguing.
Click here to Trade 👇
#ORCA
1
10
·
--
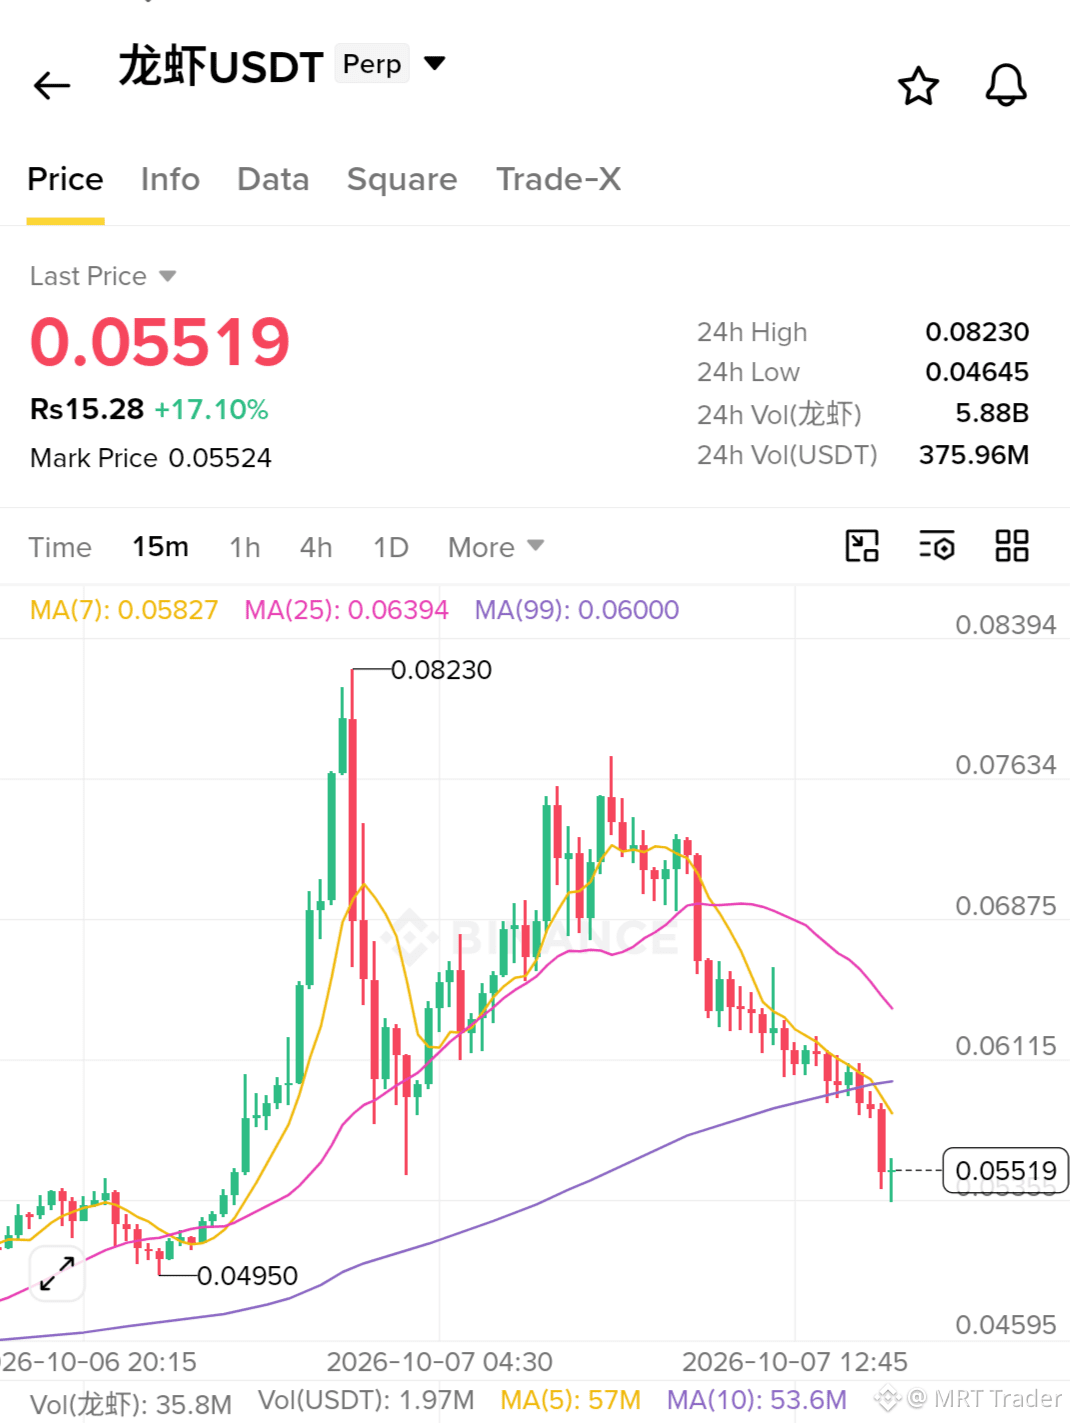
Guys, our $龙虾
long already hit — now price is dropping hard from the top.
Flipping short here. Another drop looks likely.
Entry: $0.0566 – $0.0594
Targets: $0.0523 / $0.0473 / $0.0426
🛑 SL: $0.0698
Only take it inside the zone. Reclaim $0.0698 and the drop thesis is dead — I'm out, no arguing.
Click here to Trade 👇
#龙虾
{future}(龙虾USDT)
Guys, our $龙虾
long already hit — now price is dropping hard from the top.
Flipping short here. Another drop looks likely.
Entry: $0.0566 – $0.0594
Targets: $0.0523 / $0.0473 / $0.0426
🛑 SL: $0.0698
Only take it inside the zone. Reclaim $0.0698 and the drop thesis is dead — I'm out, no arguing.
Click here to Trade 👇
#龙虾
long already hit — now price is dropping hard from the top.
Flipping short here. Another drop looks likely.
Entry: $0.0566 – $0.0594
Targets: $0.0523 / $0.0473 / $0.0426
🛑 SL: $0.0698
Only take it inside the zone. Reclaim $0.0698 and the drop thesis is dead — I'm out, no arguing.
Click here to Trade 👇
#龙虾
2
137
·
--
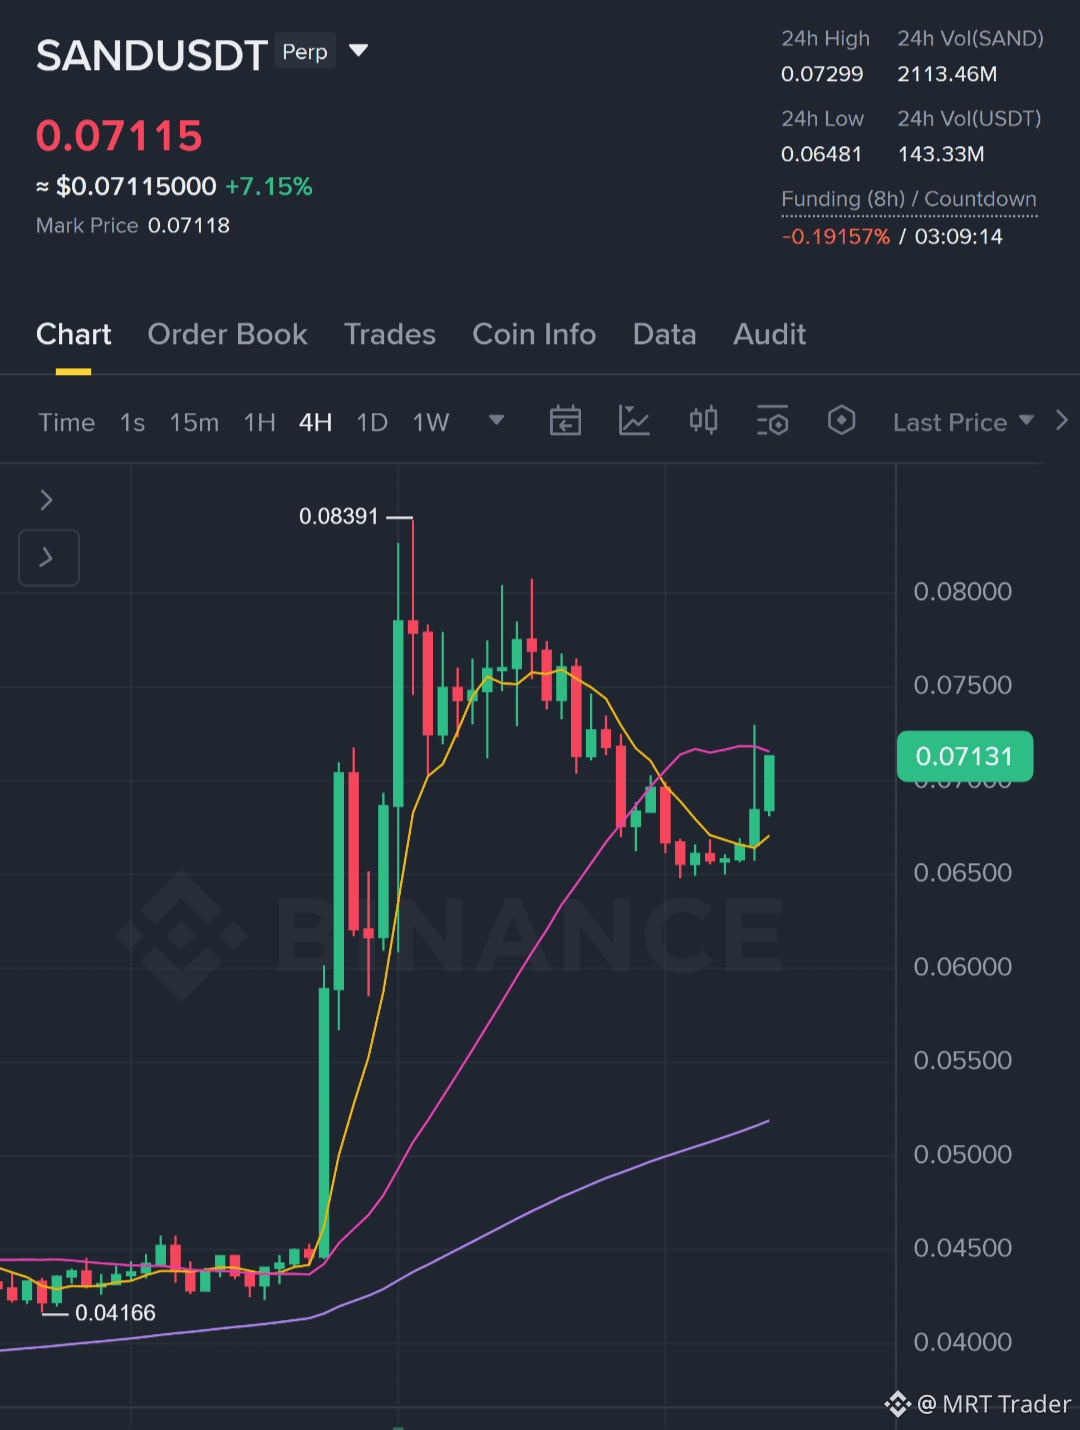
$SAND LONG SETUP | 1H
Controlled retracement forming a potential long entry here.
Entry zone: 0.06873–0.06920
Stop loss: 0.06789
Targets: TP1 0.07137 (2.22R) / TP2 0.07306 (3.79R) / TP3 0.08085 (10.99R)
Scale out: 20% / 30% / 50%
Considerations: Price is sitting away from the planned entry and may need a retest before it's valid. Estimated EV comes in at -0.22R — below my active threshold. That negative EV is the real issue, not the level itself.
Status: Watchlist only. Wait for confirmation before considering this one.#SAND
$SAND LONG SETUP | 1H
Controlled retracement forming a potential long entry here.
Entry zone: 0.06873–0.06920
Stop loss: 0.06789
Targets: TP1 0.07137 (2.22R) / TP2 0.07306 (3.79R) / TP3 0.08085 (10.99R)
Scale out: 20% / 30% / 50%
Considerations: Price is sitting away from the planned entry and may need a retest before it's valid. Estimated EV comes in at -0.22R — below my active threshold. That negative EV is the real issue, not the level itself.
Status: Watchlist only. Wait for confirmation before considering this one.#SAND
Controlled retracement forming a potential long entry here.
Entry zone: 0.06873–0.06920
Stop loss: 0.06789
Targets: TP1 0.07137 (2.22R) / TP2 0.07306 (3.79R) / TP3 0.08085 (10.99R)
Scale out: 20% / 30% / 50%
Considerations: Price is sitting away from the planned entry and may need a retest before it's valid. Estimated EV comes in at -0.22R — below my active threshold. That negative EV is the real issue, not the level itself.
Status: Watchlist only. Wait for confirmation before considering this one.#SAND
2
12
·
--
ສັນຍານໝີ
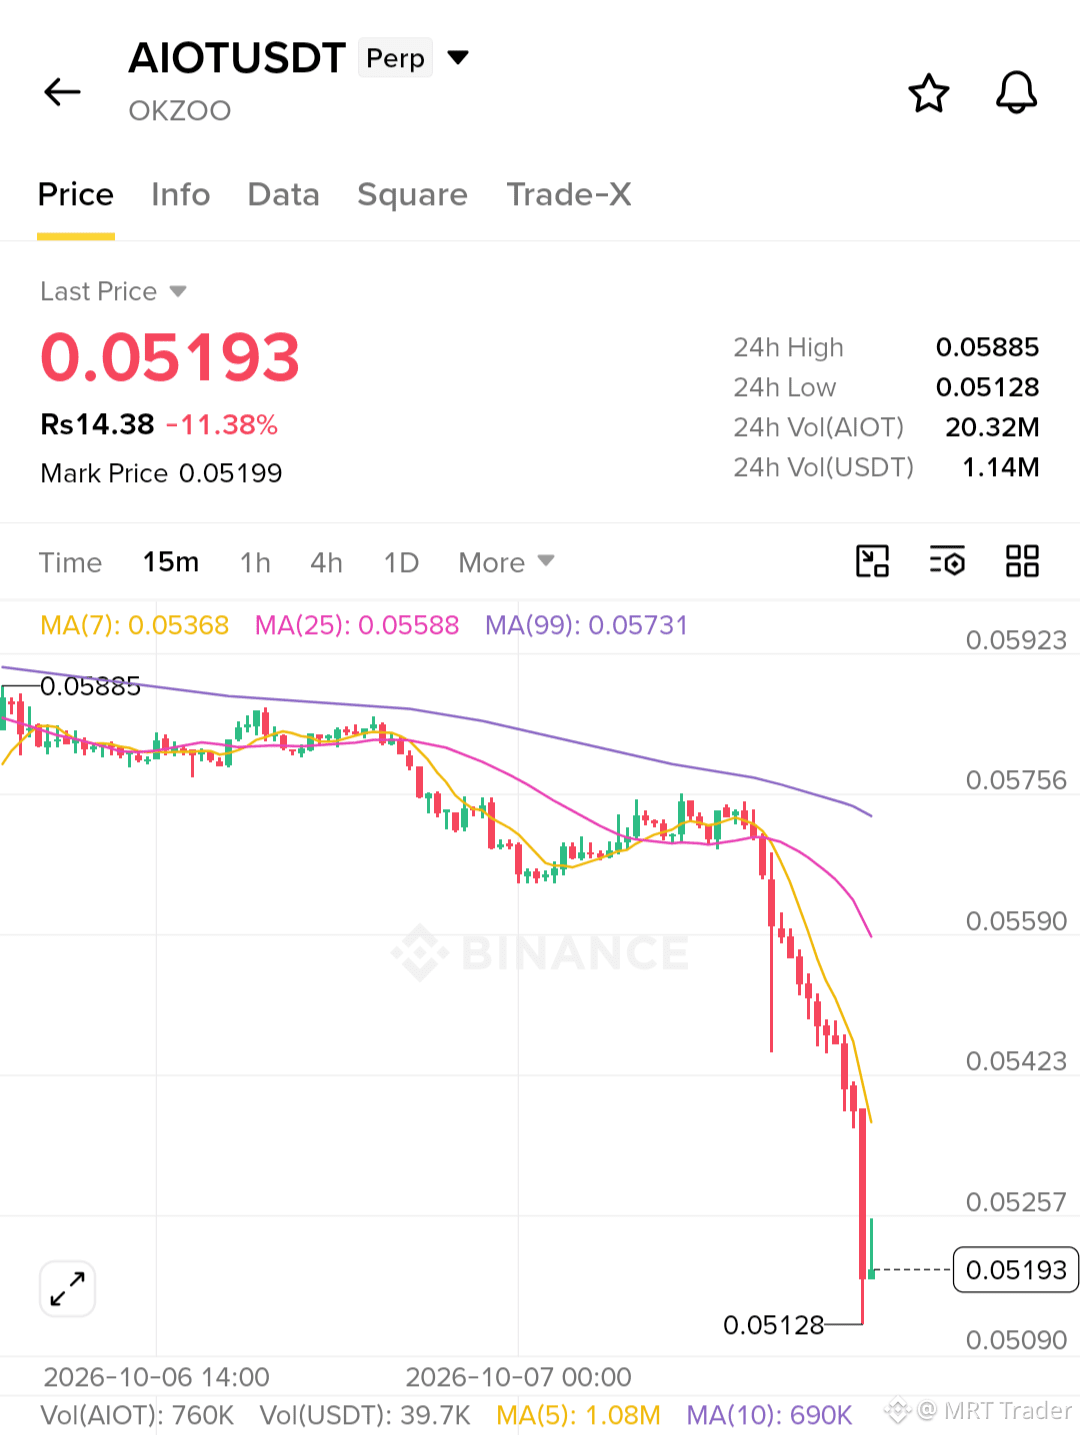
$AIOT — volatility alert.
Support: $0.0510
Resistance: $0.0535
Target/TP: $0.0550
🛑 Stop-Loss: $0.0500
$3.48K in longs just got liquidated at $0.05211. That's forced selling hitting the book, and it's building pressure right at this zone.
AIOT is sitting at a critical level — clean break above $0.0535 and the squeeze can run toward $0.0550. Lose $0.0510 and it flushes toward the stop. Watch the breakout, this one's coiled.
$AIOT
{future}(AIOTUSDT)
$AIOT — volatility alert.
Support: $0.0510
Resistance: $0.0535
Target/TP: $0.0550
🛑 Stop-Loss: $0.0500
$3.48K in longs just got liquidated at $0.05211. That's forced selling hitting the book, and it's building pressure right at this zone.
AIOT is sitting at a critical level — clean break above $0.0535 and the squeeze can run toward $0.0550. Lose $0.0510 and it flushes toward the stop. Watch the breakout, this one's coiled.
$AIOT
Support: $0.0510
Resistance: $0.0535
Target/TP: $0.0550
🛑 Stop-Loss: $0.0500
$3.48K in longs just got liquidated at $0.05211. That's forced selling hitting the book, and it's building pressure right at this zone.
AIOT is sitting at a critical level — clean break above $0.0535 and the squeeze can run toward $0.0550. Lose $0.0510 and it flushes toward the stop. Watch the breakout, this one's coiled.
$AIOT
1
9
·
--
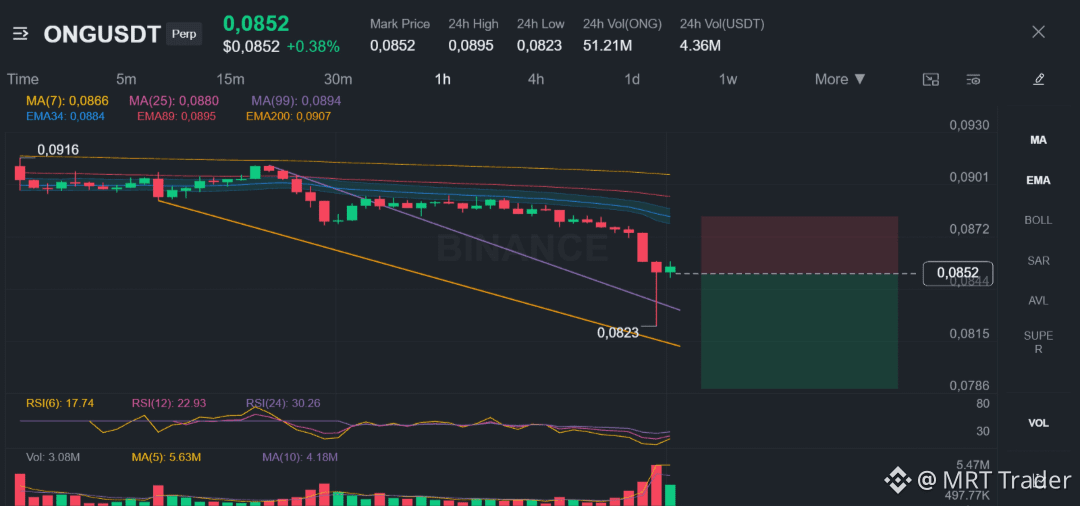
$ONG /USDT — sellers are in charge short term. Here's the short.
Bias: SHORT · Leaning, not conviction.
Entry: 0.0851650 – 0.0854262
TP1: 0.0829145 (-2.8%)
TP2: 0.0813268 (-4.7%)
TP3: 0.0789451 (-7.4%)
🛑 SL: 0.0884712 (+3.7%)
How I'm playing it:
Only enter inside the zone — no chasing. Take half off at TP1, then slide my stop up to entry so the rest rides clean.
Caution: This is counter-trend and backed by 6 signals only. Smaller size, hard stop. No widening it if price runs against you.
Why I'm leaning short:
• 4h: price < EMA50 < EMA200 — bearish stack, swing trend is down
• 1h: same stack — short-term trend agrees
• 15m ADX/DI: ADX 66.0 with sellers in control (DI+ 6.9 vs DI− 49.5) — extreme reading, sellers are driving hard
What's working against me:
1h RSI is at 24.9. Deeply oversold. Price is washed out, and bounces from readings like this are common — sometimes sharp ones. That's the main risk, and it's why I'm taking half at TP1 instead of holding for TP3.
The read is simple: 1h and 4h are both below their EMAs, and ADX confirms sellers have control. But this is a counter-trend bet against the daily bullish trend, so size down and respect the stop.
Click here to Trade 👇
#ONG
$ONG /USDT — sellers are in charge short term. Here's the short.
Bias: SHORT · Leaning, not conviction.
Entry: 0.0851650 – 0.0854262
TP1: 0.0829145 (-2.8%)
TP2: 0.0813268 (-4.7%)
TP3: 0.0789451 (-7.4%)
🛑 SL: 0.0884712 (+3.7%)
How I'm playing it:
Only enter inside the zone — no chasing. Take half off at TP1, then slide my stop up to entry so the rest rides clean.
Caution: This is counter-trend and backed by 6 signals only. Smaller size, hard stop. No widening it if price runs against you.
Why I'm leaning short:
• 4h: price < EMA50 < EMA200 — bearish stack, swing trend is down
• 1h: same stack — short-term trend agrees
• 15m ADX/DI: ADX 66.0 with sellers in control (DI+ 6.9 vs DI− 49.5) — extreme reading, sellers are driving hard
What's working against me:
1h RSI is at 24.9. Deeply oversold. Price is washed out, and bounces from readings like this are common — sometimes sharp ones. That's the main risk, and it's why I'm taking half at TP1 instead of holding for TP3.
The read is simple: 1h and 4h are both below their EMAs, and ADX confirms sellers have control. But this is a counter-trend bet against the daily bullish trend, so size down and respect the stop.
Click here to Trade 👇
#ONG
Bias: SHORT · Leaning, not conviction.
Entry: 0.0851650 – 0.0854262
TP1: 0.0829145 (-2.8%)
TP2: 0.0813268 (-4.7%)
TP3: 0.0789451 (-7.4%)
🛑 SL: 0.0884712 (+3.7%)
How I'm playing it:
Only enter inside the zone — no chasing. Take half off at TP1, then slide my stop up to entry so the rest rides clean.
Caution: This is counter-trend and backed by 6 signals only. Smaller size, hard stop. No widening it if price runs against you.
Why I'm leaning short:
• 4h: price < EMA50 < EMA200 — bearish stack, swing trend is down
• 1h: same stack — short-term trend agrees
• 15m ADX/DI: ADX 66.0 with sellers in control (DI+ 6.9 vs DI− 49.5) — extreme reading, sellers are driving hard
What's working against me:
1h RSI is at 24.9. Deeply oversold. Price is washed out, and bounces from readings like this are common — sometimes sharp ones. That's the main risk, and it's why I'm taking half at TP1 instead of holding for TP3.
The read is simple: 1h and 4h are both below their EMAs, and ADX confirms sellers have control. But this is a counter-trend bet against the daily bullish trend, so size down and respect the stop.
Click here to Trade 👇
#ONG
1
4
·
--
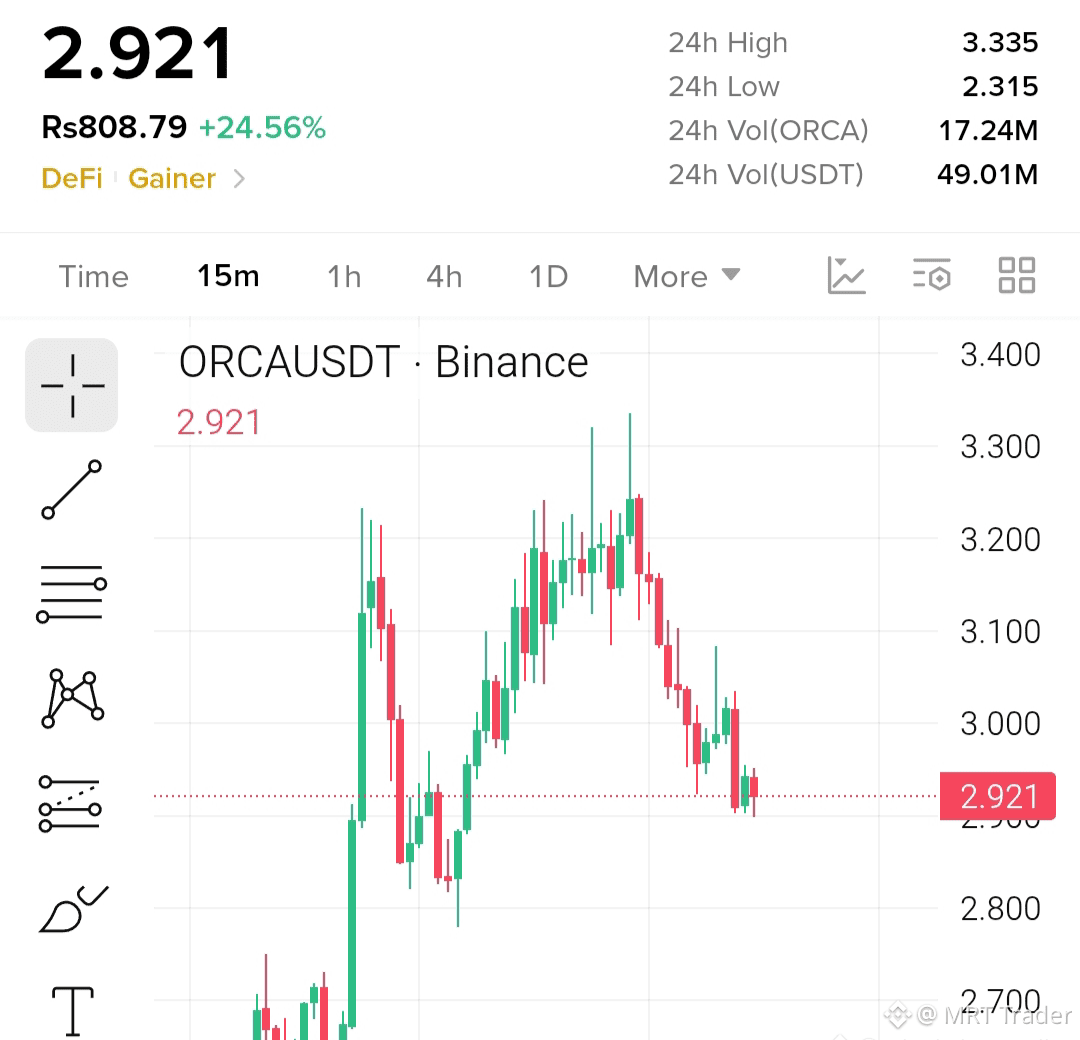
guy's, opening a $ORCA short with 20x leverage max.
Entry: $2.913 – $2.953
TP1: $2.853 | TP2: $2.783 | TP3: $2.703
🛑 SL: $3.053
If ORCA stays below $3.00, I'm looking for more downside. Only take it inside the zone. Reclaim $3.053 and the short thesis is dead — I'm out, no arguing.
Click here to Trade 👇
#ORCA
{future}(ORCAUSDT)
guy's, opening a $ORCA short with 20x leverage max.
Entry: $2.913 – $2.953
TP1: $2.853 | TP2: $2.783 | TP3: $2.703
🛑 SL: $3.053
If ORCA stays below $3.00, I'm looking for more downside. Only take it inside the zone. Reclaim $3.053 and the short thesis is dead — I'm out, no arguing.
Click here to Trade 👇
#ORCA
Entry: $2.913 – $2.953
TP1: $2.853 | TP2: $2.783 | TP3: $2.703
🛑 SL: $3.053
If ORCA stays below $3.00, I'm looking for more downside. Only take it inside the zone. Reclaim $3.053 and the short thesis is dead — I'm out, no arguing.
Click here to Trade 👇
#ORCA
1
8
·
--
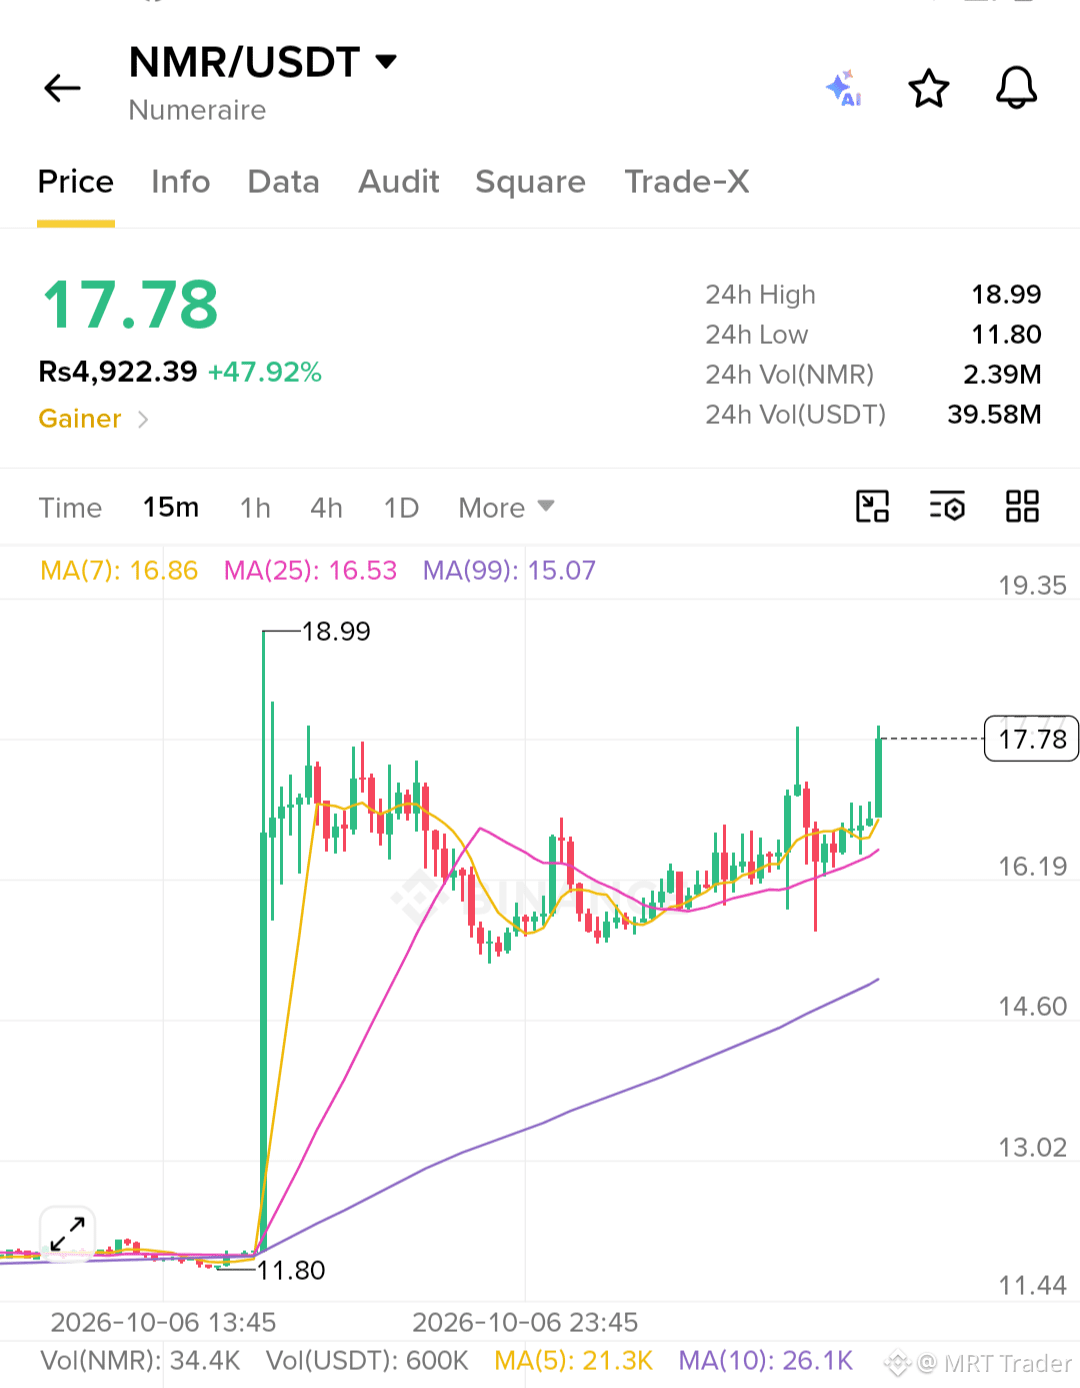
The $NMR correction looks done, and buyers are stepping in here 🚀
Price is holding firmly above the key support level, absorbing sell orders in this zone. That's usually what sets up the next leg up. Hold this level and the path opens toward a second wave through resistance.
$NMR — Long 🟢
Entry range: 16.63–16.97
🛑 Stop loss: 15.86
🎯 TP1: 17.88
🎯 TP2: 19.03
🎯 TP3: 20.04
Only take it inside the zone. Lose 15.86 and the support structure is broken — I'm out, no holding and hoping.
I'm positioned here. If it works, great — if it doesn't, the stop handles it. You'll thank me later 📈🔥
{future}(NMRUSDT)
The $NMR correction looks done, and buyers are stepping in here 🚀
Price is holding firmly above the key support level, absorbing sell orders in this zone. That's usually what sets up the next leg up. Hold this level and the path opens toward a second wave through resistance.
$NMR — Long 🟢
Entry range: 16.63–16.97
🛑 Stop loss: 15.86
🎯 TP1: 17.88
🎯 TP2: 19.03
🎯 TP3: 20.04
Only take it inside the zone. Lose 15.86 and the support structure is broken — I'm out, no holding and hoping.
I'm positioned here. If it works, great — if it doesn't, the stop handles it. You'll thank me later 📈🔥
Price is holding firmly above the key support level, absorbing sell orders in this zone. That's usually what sets up the next leg up. Hold this level and the path opens toward a second wave through resistance.
$NMR — Long 🟢
Entry range: 16.63–16.97
🛑 Stop loss: 15.86
🎯 TP1: 17.88
🎯 TP2: 19.03
🎯 TP3: 20.04
Only take it inside the zone. Lose 15.86 and the support structure is broken — I'm out, no holding and hoping.
I'm positioned here. If it works, great — if it doesn't, the stop handles it. You'll thank me later 📈🔥
1
57
·
--
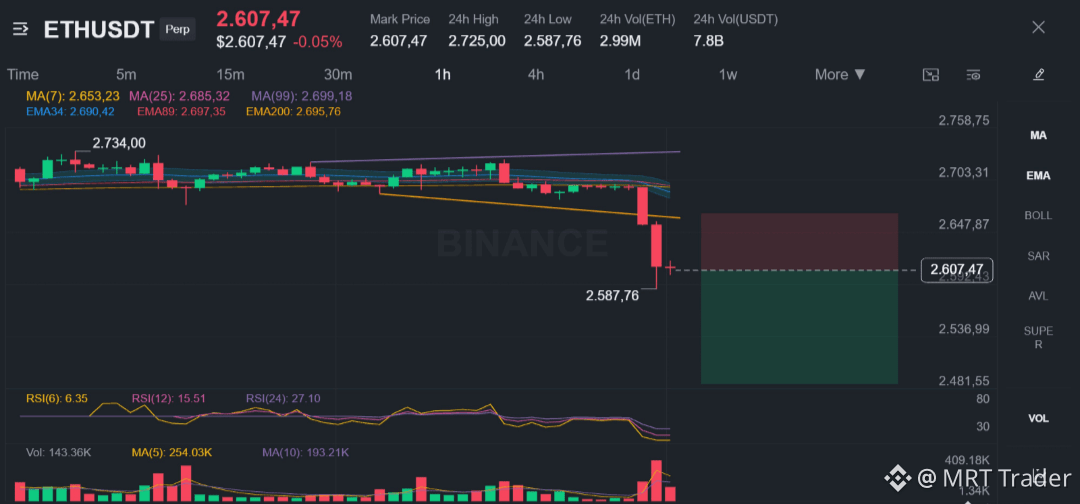
$ETH /USDT — shorting ETH isn't always a bad idea.
Bias: SHORT · Leaning, not conviction.
Entry: 2607.22 – 2611.82
TP1: 2564.13 (-1.7%)
TP2: 2533.85 (-2.9%)
TP3: 2488.45 (-4.6%)
🛑 SL: 2670.06 (+2.3%)
How I'm playing it:
Only enter inside the zone — no chasing. Take half off at TP1, then slide my stop up to entry so the rest rides clean.
Caution: This is counter-trend, and it's backed by 6 signals only. Smaller size and a hard stop — no widening it if price runs against you.
Why I'm leaning short:
• 1h: price < EMA50 < EMA200 — bearish stack, short-term trend is down
• 15m ADX/DI: ADX 58.8 with sellers in control (DI+ 4.1 vs DI− 51.8) — that's an extreme reading, sellers are driving hard
• BTC backdrop: bearish trend and 0.83 correlation — BTC falls, this follows
What's working against me:
1h RSI is at 17.7. That's deeply oversold. Price is washed out, and bounces from readings like this are common — sometimes violent ones. That's the main risk here, and it's why I'm taking half at TP1 instead of holding for TP3.
Fair questions:
Why short when the daily is up? Because the 1h bearish stack has price below both EMAs, so the short-term trend is down. I'm trading the timeframe I'm looking at, not the daily.
Why not wait for a lower entry? Because RSI at 16.82 means price is already oversold. Waiting for a lower fill risks missing the move entirely if it bounces first.
Where do you take profits on this #ETH short?
{future}(ETHUSDT)
$ETH /USDT — shorting ETH isn't always a bad idea.
Bias: SHORT · Leaning, not conviction.
Entry: 2607.22 – 2611.82
TP1: 2564.13 (-1.7%)
TP2: 2533.85 (-2.9%)
TP3: 2488.45 (-4.6%)
🛑 SL: 2670.06 (+2.3%)
How I'm playing it:
Only enter inside the zone — no chasing. Take half off at TP1, then slide my stop up to entry so the rest rides clean.
Caution: This is counter-trend, and it's backed by 6 signals only. Smaller size and a hard stop — no widening it if price runs against you.
Why I'm leaning short:
• 1h: price < EMA50 < EMA200 — bearish stack, short-term trend is down
• 15m ADX/DI: ADX 58.8 with sellers in control (DI+ 4.1 vs DI− 51.8) — that's an extreme reading, sellers are driving hard
• BTC backdrop: bearish trend and 0.83 correlation — BTC falls, this follows
What's working against me:
1h RSI is at 17.7. That's deeply oversold. Price is washed out, and bounces from readings like this are common — sometimes violent ones. That's the main risk here, and it's why I'm taking half at TP1 instead of holding for TP3.
Fair questions:
Why short when the daily is up? Because the 1h bearish stack has price below both EMAs, so the short-term trend is down. I'm trading the timeframe I'm looking at, not the daily.
Why not wait for a lower entry? Because RSI at 16.82 means price is already oversold. Waiting for a lower fill risks missing the move entirely if it bounces first.
Where do you take profits on this #ETH short?
Bias: SHORT · Leaning, not conviction.
Entry: 2607.22 – 2611.82
TP1: 2564.13 (-1.7%)
TP2: 2533.85 (-2.9%)
TP3: 2488.45 (-4.6%)
🛑 SL: 2670.06 (+2.3%)
How I'm playing it:
Only enter inside the zone — no chasing. Take half off at TP1, then slide my stop up to entry so the rest rides clean.
Caution: This is counter-trend, and it's backed by 6 signals only. Smaller size and a hard stop — no widening it if price runs against you.
Why I'm leaning short:
• 1h: price < EMA50 < EMA200 — bearish stack, short-term trend is down
• 15m ADX/DI: ADX 58.8 with sellers in control (DI+ 4.1 vs DI− 51.8) — that's an extreme reading, sellers are driving hard
• BTC backdrop: bearish trend and 0.83 correlation — BTC falls, this follows
What's working against me:
1h RSI is at 17.7. That's deeply oversold. Price is washed out, and bounces from readings like this are common — sometimes violent ones. That's the main risk here, and it's why I'm taking half at TP1 instead of holding for TP3.
Fair questions:
Why short when the daily is up? Because the 1h bearish stack has price below both EMAs, so the short-term trend is down. I'm trading the timeframe I'm looking at, not the daily.
Why not wait for a lower entry? Because RSI at 16.82 means price is already oversold. Waiting for a lower fill risks missing the move entirely if it bounces first.
Where do you take profits on this #ETH short?
1
6
ເຂົ້າສູ່ລະບົບເພື່ອສຳຫຼວດເນື້ອຫາເພີ່ມເຕີມ
ເຂົ້າຮ່ວມກຸ່ມຜູ້ໃຊ້ຄຣິບໂຕທົ່ວໂລກໃນ Binance Square.
⚡️ ໄດ້ຮັບຂໍ້ມູນຫຼ້າສຸດ ແລະ ທີ່ມີປະໂຫຍດກ່ຽວກັບຄຣິບໂຕ.
💬 ໄດ້ຮັບຄວາມໄວ້ວາງໃຈຈາກຕະຫຼາດແລກປ່ຽນຄຣິບໂຕທີ່ໃຫຍ່ທີ່ສຸດໃນໂລກ.
👍 ຄົ້ນຫາຂໍ້ມູນເຊີງເລິກທີ່ແທ້ຈາກນັກສ້າງທີ່ໄດ້ຮັບການຢືນຢັນ.
ອີເມວ / ເບີໂທລະສັບ
ຫົວຂໍ້ທີ່ກໍາລັງນິຍົມ
FedMinutesFocusOnOctoberPause
1,186 views
96 ກຳລັງສົນທະນາ
#fedminutesfocusonoctoberpause
🚨 FED MINUTES PUT OCTOBER PAUSE IN FOCUS! 🇺🇸
The latest Federal Reserve minutes are putting fresh attention on the possibility of an October rate pause. 👀
Markets are now watching closely for clues about what the Fed could do next.
Why crypto traders care:
🔹 A rate pause could support risk assets
🔹 Lower rate expectations can boost liquidity sentiment
🔹 Bitcoin and altcoins could react sharply to Fed signals
🔹 The dollar and Treasury yields remain key factors
🔥 If the Fed signals a pause while inflation continues cooling, could this become another catalyst for crypto?
WHAT DO YOU THINK HAPPENS NEXT? 👇
🟢 Fed pauses → BTC rallies 🚀
🟡 Fed stays cautious
🔴 Hawkish Fed → crypto dumps
#Fed #bitcoin #crypto
Faizan Crypto Learner
·1 ຖືກໃຈ
·590 views
BinanceLaunchesBinanceIntelligence
876,435 views
5,361 ກຳລັງສົນທະນາ
RobinhoodAdds$25MInBitcoinToBalanceSheet
173 views
11 ກຳລັງສົນທະນາ