
Mr_KING01
131 ໂພສ

Mr_KING01
ລາຍງານ
ບລັອກຜູ້ໃຊ້
0 ກໍາລັງຕິດຕາມ
7 ຜູ້ຕິດຕາມ
34 Liked
ໂພສ
·
--
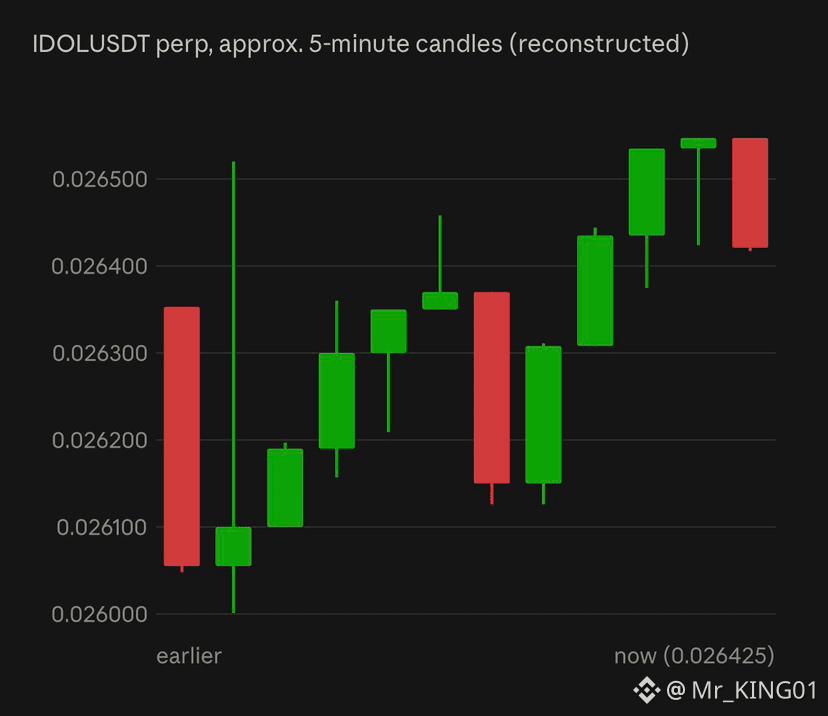
$IDOL is trading at 0.026425 USDT with a mark price of 0.026418. It is up 27.50% over 24h (+15.29% “Today”), with a range of 0.018500–0.027477 and about 239.38M USDT (10.25B IDOL) in volume. The medium-term gains are very large: +236.71% over 7 days, +149.76% over 30 days and +51.17% over 90 days, while the 180-day (+0.55%) and 1-year (-20.93%) figures are flat to negative. In the visible window, price dipped to about 0.02600 early, then climbed in a rising pattern, dipping once around the middle before pushing to a window high near 0.02655 and easing slightly. It is above the MA60 (0.026324), which is rising, and the order book is heavily buyer-leaning (75.20% bids vs 24.80% asks), so momentum currently favors buyers. Support is at the MA60 (0.026324), then 0.02620, and resistance is around 0.02655, then the 24h high of 0.027477, which is only about 4% above the current price. A coin that has run up this far this fast, on a leveraged perp, can reverse sharply, so a drop below the MA60 would be the first warning sign.
{future}(IDOLUSDT)
$IDOL is trading at 0.026425 USDT with a mark price of 0.026418. It is up 27.50% over 24h (+15.29% “Today”), with a range of 0.018500–0.027477 and about 239.38M USDT (10.25B IDOL) in volume. The medium-term gains are very large: +236.71% over 7 days, +149.76% over 30 days and +51.17% over 90 days, while the 180-day (+0.55%) and 1-year (-20.93%) figures are flat to negative. In the visible window, price dipped to about 0.02600 early, then climbed in a rising pattern, dipping once around the middle before pushing to a window high near 0.02655 and easing slightly. It is above the MA60 (0.026324), which is rising, and the order book is heavily buyer-leaning (75.20% bids vs 24.80% asks), so momentum currently favors buyers. Support is at the MA60 (0.026324), then 0.02620, and resistance is around 0.02655, then the 24h high of 0.027477, which is only about 4% above the current price. A coin that has run up this far this fast, on a leveraged perp, can reverse sharply, so a drop below the MA60 would be the first warning sign.
293
·
--
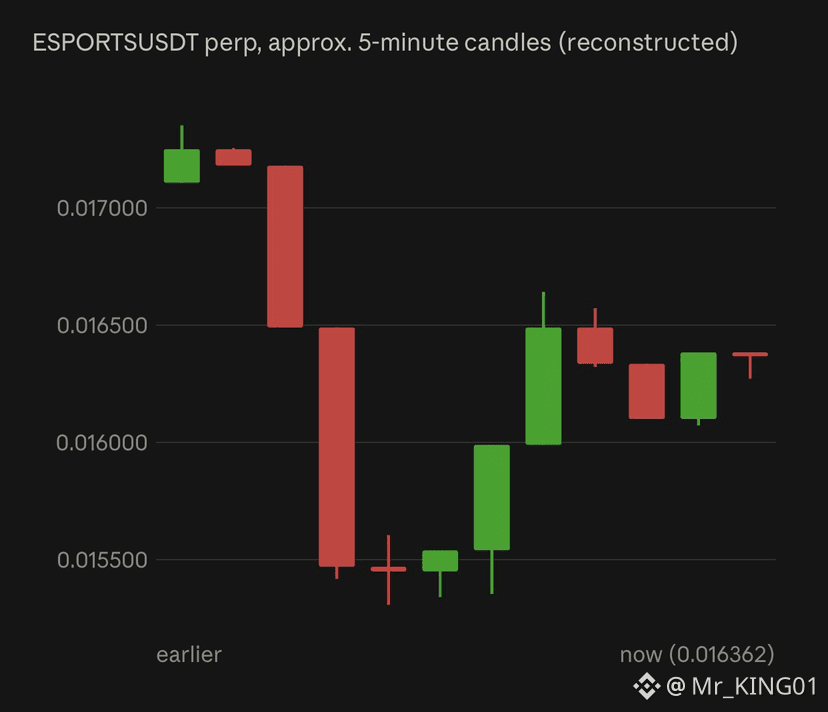
$ESPORTS is trading at 0.016362 USDT with a mark price of 0.016375. It is up 44.95% over 24h, while “Today” shows -18.48%. The 24h range is wide at 0.010410–0.022484, on about 776.36M USDT (47.63B ESPORTS) in volume. Returns are very mixed: +109.72% over 7 days and +44.41% over 30 days, but -7.24% over 90 days, -95.76% over 180 days and -92.53% over 1 year. In the visible window, price peaked near 0.01735, crashed steeply to about 0.01531 on a large red volume spike, then rebounded sharply to about 0.01664 and has since drifted lower. It is below the MA60 (0.016491), which is sloping down, and the order book is balanced (51.58% bids vs 48.42% asks), so there is no clear short-term direction. Support is near 0.01531–0.01540, then the 24h low of 0.010410, and resistance is at the MA60 (0.016491), then 0.01664 and 0.01735, with the 24h high of 0.022484 well above. A close above the MA60 would be the first sign the rebound has traction, while a break below 0.0153 would reopen the downside. Moves this large on a leveraged perp can liquidate positions quickly.
{future}(ESPORTSUSDT)
$ESPORTS is trading at 0.016362 USDT with a mark price of 0.016375. It is up 44.95% over 24h, while “Today” shows -18.48%. The 24h range is wide at 0.010410–0.022484, on about 776.36M USDT (47.63B ESPORTS) in volume. Returns are very mixed: +109.72% over 7 days and +44.41% over 30 days, but -7.24% over 90 days, -95.76% over 180 days and -92.53% over 1 year. In the visible window, price peaked near 0.01735, crashed steeply to about 0.01531 on a large red volume spike, then rebounded sharply to about 0.01664 and has since drifted lower. It is below the MA60 (0.016491), which is sloping down, and the order book is balanced (51.58% bids vs 48.42% asks), so there is no clear short-term direction. Support is near 0.01531–0.01540, then the 24h low of 0.010410, and resistance is at the MA60 (0.016491), then 0.01664 and 0.01735, with the 24h high of 0.022484 well above. A close above the MA60 would be the first sign the rebound has traction, while a break below 0.0153 would reopen the downside. Moves this large on a leveraged perp can liquidate positions quickly.
315
·
--
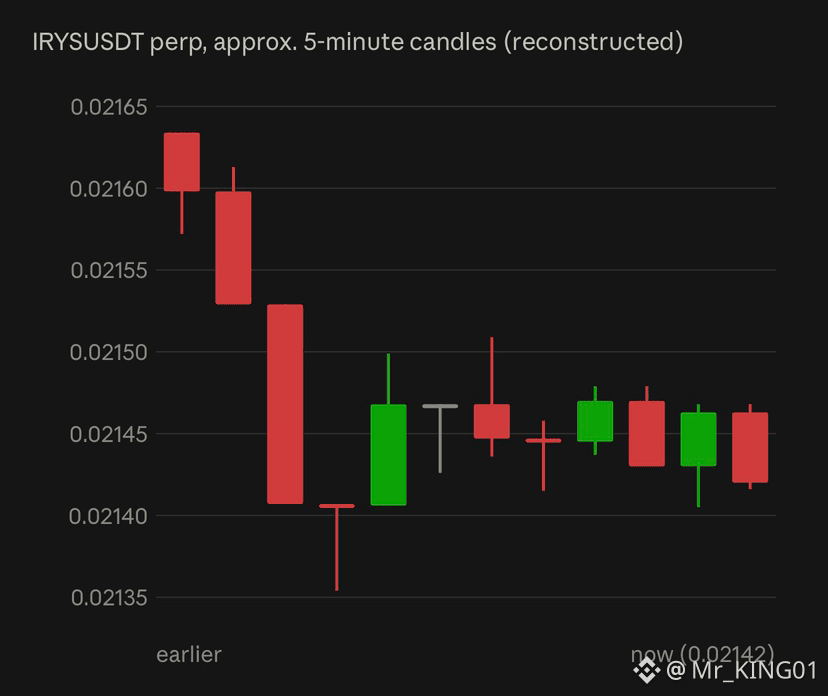
$IRYS is trading at 0.02142 USDT with a mark price of 0.02142. It is down 4.97% in 24h (-7.23% “Today”), with a range of 0.02132–0.02439 and about 20.21M USDT (881.9M IRYS) in volume. That is about 77% below the 0.09246 level in your earlier IRYS screenshot. The trend has turned sharply negative: -49.94% over 7 days and -45.51% over 180 days, though it is still +33.13% over 30 days and +33.29% over 90 days, and no 1-year figure is shown. In the visible window, price fell from about 0.02163 to a low near 0.02135, then moved in a choppy sideways range of about 0.02140–0.02150, and is now only about 0.5% above the 24h low. It is below the MA60 (0.02149), which is sloping down, so sellers still have the edge. The order book is evenly split (50.57% bids vs 49.43% asks). Support is near 0.02135, then the 24h low of 0.02132, and resistance is at the MA60 (0.02149), then 0.02160 and the 24h high of 0.02439. A break below 0.02132 would set a new 24h low, while a close above the MA60 would be the first sign the decline is easing. A leveraged perp that has already moved this far can swing sharply in either direction.
{future}(IRYSUSDT)
$IRYS is trading at 0.02142 USDT with a mark price of 0.02142. It is down 4.97% in 24h (-7.23% “Today”), with a range of 0.02132–0.02439 and about 20.21M USDT (881.9M IRYS) in volume. That is about 77% below the 0.09246 level in your earlier IRYS screenshot. The trend has turned sharply negative: -49.94% over 7 days and -45.51% over 180 days, though it is still +33.13% over 30 days and +33.29% over 90 days, and no 1-year figure is shown. In the visible window, price fell from about 0.02163 to a low near 0.02135, then moved in a choppy sideways range of about 0.02140–0.02150, and is now only about 0.5% above the 24h low. It is below the MA60 (0.02149), which is sloping down, so sellers still have the edge. The order book is evenly split (50.57% bids vs 49.43% asks). Support is near 0.02135, then the 24h low of 0.02132, and resistance is at the MA60 (0.02149), then 0.02160 and the 24h high of 0.02439. A break below 0.02132 would set a new 24h low, while a close above the MA60 would be the first sign the decline is easing. A leveraged perp that has already moved this far can swing sharply in either direction.
482
·
--
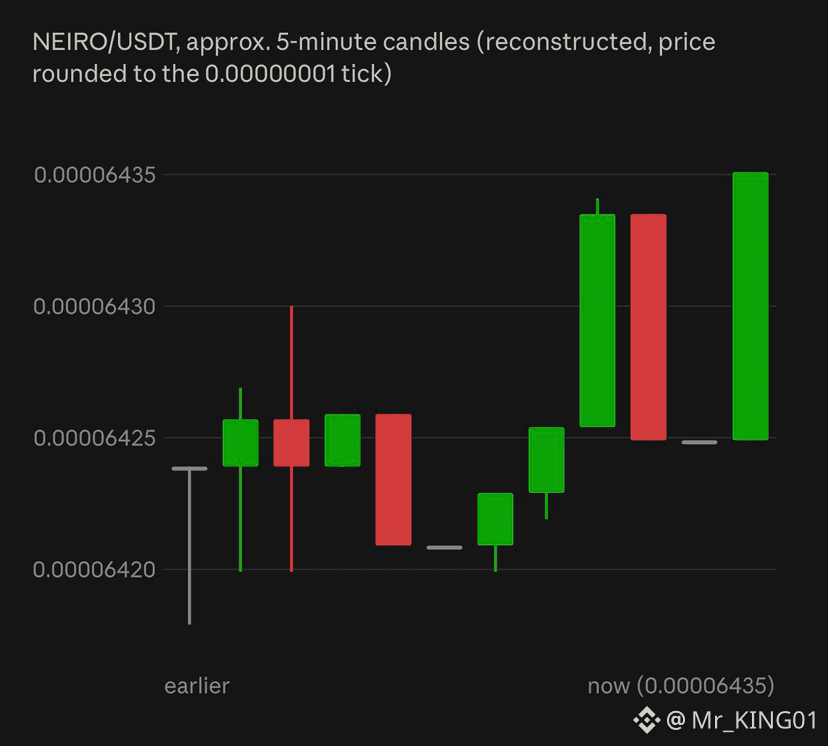
$NEIRO is trading at 0.00006435 USDT, up 0.72% in 24h (the “Today” figure shows +0.16%), with a range of 0.00006322–0.00006473 and about 338.5K USDT (5.29B NEIRO) in volume. The longer-term trend is weak: -4.51% over 7 days, -29.50% over 30 days, -31.55% over 180 days and -63.43% over 1 year, with only the 90-day figure positive (+2.34%). In the visible window, price stayed in a narrow range of about 0.00006418–0.00006426 for most of the time, spiked to about 0.00006434 in the middle, then dropped back and jumped to the window high at the very end. The whole window spans only about 0.3%, so the chart exaggerates the moves. Price is just above the MA60 (0.00006425), which is flat, and the order book leans toward buyers (62.94% bids vs 37.06% asks). Support is at the MA60 (0.00006425), then 0.00006420 and the 24h low of 0.00006322, and resistance is at 0.00006435–0.00006436, then the 24h high of 0.00006473. A hold above 0.00006435 would keep the late jump intact, while a drop back below the MA60 would suggest it was a short spike.
{spot}(NEIROUSDT)
$NEIRO is trading at 0.00006435 USDT, up 0.72% in 24h (the “Today” figure shows +0.16%), with a range of 0.00006322–0.00006473 and about 338.5K USDT (5.29B NEIRO) in volume. The longer-term trend is weak: -4.51% over 7 days, -29.50% over 30 days, -31.55% over 180 days and -63.43% over 1 year, with only the 90-day figure positive (+2.34%). In the visible window, price stayed in a narrow range of about 0.00006418–0.00006426 for most of the time, spiked to about 0.00006434 in the middle, then dropped back and jumped to the window high at the very end. The whole window spans only about 0.3%, so the chart exaggerates the moves. Price is just above the MA60 (0.00006425), which is flat, and the order book leans toward buyers (62.94% bids vs 37.06% asks). Support is at the MA60 (0.00006425), then 0.00006420 and the 24h low of 0.00006322, and resistance is at 0.00006435–0.00006436, then the 24h high of 0.00006473. A hold above 0.00006435 would keep the late jump intact, while a drop back below the MA60 would suggest it was a short spike.
120
·
--
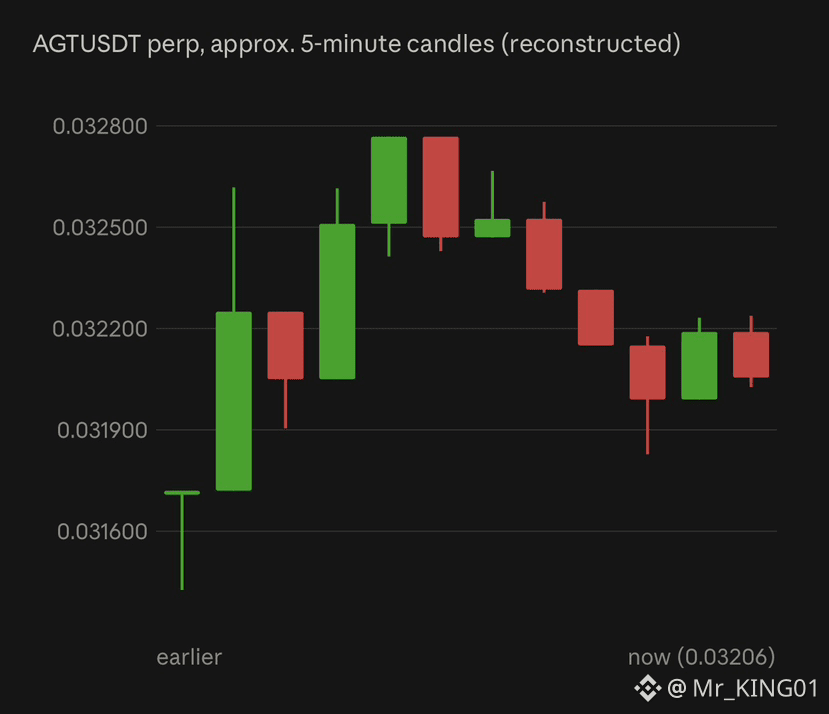
$AGT is trading at 0.03206 USDT with a mark price of 0.03202. It is down 10.20% in 24h (-9.46% “Today”), with a range of 0.02992–0.03741 and about 10.84M USDT (330.37M AGT) in volume. That is about 58% below the 0.075573 level in your earlier AGT screenshot. The short-term picture is weak: -59.38% over 7 days. Longer periods remain strongly positive: +34.83% over 30 days, +96.42% over 90 days, +82.56% over 180 days and +712.67% over 1 year. In the visible window, price jumped from about 0.03143 to a peak near 0.03277, faded back to about 0.03183, and has since recovered partway. It is just below the MA60 (0.032183), which is sloping up and now acting as resistance, and the order book is balanced with a slight buyer lean (51.74% bids vs 48.26% asks). Support is near 0.03183, then the 24h low of 0.02992, and resistance is at the MA60 (0.03218), then 0.0327 and the 24h high of 0.03741. A close above the MA60 would be the first sign the decline is easing, while a break below 0.02992 would set a new 24h low. After a drop this large, a leveraged perp can swing sharply in either direction.
{future}(AGTUSDT)
$AGT is trading at 0.03206 USDT with a mark price of 0.03202. It is down 10.20% in 24h (-9.46% “Today”), with a range of 0.02992–0.03741 and about 10.84M USDT (330.37M AGT) in volume. That is about 58% below the 0.075573 level in your earlier AGT screenshot. The short-term picture is weak: -59.38% over 7 days. Longer periods remain strongly positive: +34.83% over 30 days, +96.42% over 90 days, +82.56% over 180 days and +712.67% over 1 year. In the visible window, price jumped from about 0.03143 to a peak near 0.03277, faded back to about 0.03183, and has since recovered partway. It is just below the MA60 (0.032183), which is sloping up and now acting as resistance, and the order book is balanced with a slight buyer lean (51.74% bids vs 48.26% asks). Support is near 0.03183, then the 24h low of 0.02992, and resistance is at the MA60 (0.03218), then 0.0327 and the 24h high of 0.03741. A close above the MA60 would be the first sign the decline is easing, while a break below 0.02992 would set a new 24h low. After a drop this large, a leveraged perp can swing sharply in either direction.
344
·
--
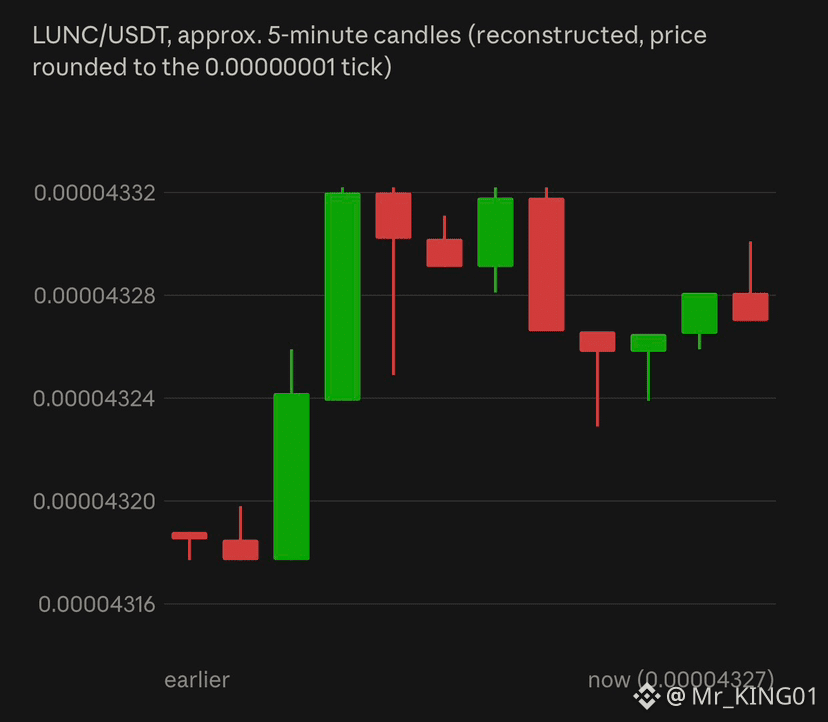
$LUNC is trading at 0.00004327 USDT, down 0.16% in 24h (the “Today” figure shows +1.36%), with a range of 0.00004253–0.00004368 and about 714.2K USDT (16.57B LUNC) in volume. That is up slightly from the 0.00004310 in your last LUNC screenshot. Returns are weak over most periods: -5.71% over 7 days, -17.74% over 30 days, -10.93% over 90 days and -47.12% over 180 days, though it is +5.59% over 1 year. In the visible window, price started near 0.00004318, jumped to about 0.00004332, pulled back to about 0.00004323, recovered to about 0.00004330, and has since eased slightly. It is sitting just above the MA60 (0.00004324), which is rising, but the order book leans heavily toward sellers (64.48% asks vs 35.52% bids), which could cap further gains. Each 0.00000001 tick is a visible move on this coin’s chart. Support is at the MA60 (0.00004324), then 0.00004317–0.00004319 and the 24h low of 0.00004253, and resistance is at 0.00004330–0.00004332, then the 24h high of 0.00004368. A move above 0.00004332 would be the first sign of strength, while a drop below the MA60 would put the early-window lows back in play.
{spot}(LUNCUSDT)
$LUNC is trading at 0.00004327 USDT, down 0.16% in 24h (the “Today” figure shows +1.36%), with a range of 0.00004253–0.00004368 and about 714.2K USDT (16.57B LUNC) in volume. That is up slightly from the 0.00004310 in your last LUNC screenshot. Returns are weak over most periods: -5.71% over 7 days, -17.74% over 30 days, -10.93% over 90 days and -47.12% over 180 days, though it is +5.59% over 1 year. In the visible window, price started near 0.00004318, jumped to about 0.00004332, pulled back to about 0.00004323, recovered to about 0.00004330, and has since eased slightly. It is sitting just above the MA60 (0.00004324), which is rising, but the order book leans heavily toward sellers (64.48% asks vs 35.52% bids), which could cap further gains. Each 0.00000001 tick is a visible move on this coin’s chart. Support is at the MA60 (0.00004324), then 0.00004317–0.00004319 and the 24h low of 0.00004253, and resistance is at 0.00004330–0.00004332, then the 24h high of 0.00004368. A move above 0.00004332 would be the first sign of strength, while a drop below the MA60 would put the early-window lows back in play.
4
680
·
--
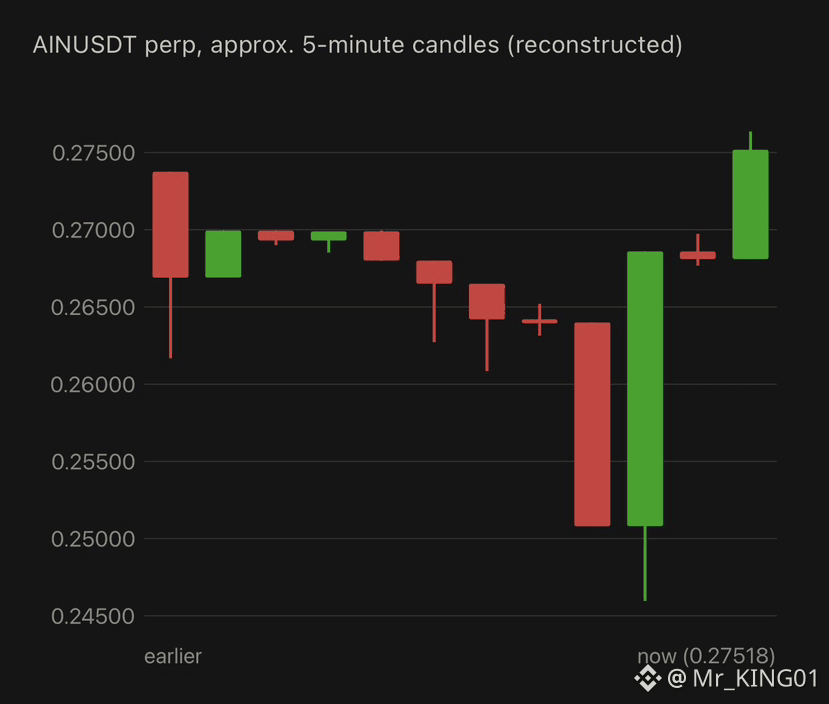
$AIN is trading at 0.27518 USDT with a mark price of 0.27638. It is up 86.30% in 24h (+51.12% “Today”), with a range of 0.14060–0.29270 and about 314.39M USDT (1.51B AIN) in volume. The longer-term gains are extreme: +619.61% over 7 days, +1,079.01% over 30 days, +270.81% over 90 days, +175.10% over 180 days and +106.78% over 1 year. In the visible window, price held a range of about 0.2617–0.2700, then slid to about 0.2460 and rebounded almost vertically to a spike near 0.2764. Price is above the MA60 (0.26606), which is flat to slightly rising, and the order book is heavily buyer-leaning (81.15% bids vs 18.85% asks), so momentum currently favors buyers. Support is at the MA60 (0.26606), then 0.2617 and 0.2460, and resistance is around 0.2764, then the 24h high of 0.29270. A coin that has gained this much this fast, on a leveraged perp, can reverse sharply, as the dip to 0.2460 within the same window shows.
{future}(AINUSDT)
$AIN is trading at 0.27518 USDT with a mark price of 0.27638. It is up 86.30% in 24h (+51.12% “Today”), with a range of 0.14060–0.29270 and about 314.39M USDT (1.51B AIN) in volume. The longer-term gains are extreme: +619.61% over 7 days, +1,079.01% over 30 days, +270.81% over 90 days, +175.10% over 180 days and +106.78% over 1 year. In the visible window, price held a range of about 0.2617–0.2700, then slid to about 0.2460 and rebounded almost vertically to a spike near 0.2764. Price is above the MA60 (0.26606), which is flat to slightly rising, and the order book is heavily buyer-leaning (81.15% bids vs 18.85% asks), so momentum currently favors buyers. Support is at the MA60 (0.26606), then 0.2617 and 0.2460, and resistance is around 0.2764, then the 24h high of 0.29270. A coin that has gained this much this fast, on a leveraged perp, can reverse sharply, as the dip to 0.2460 within the same window shows.
556
·
--
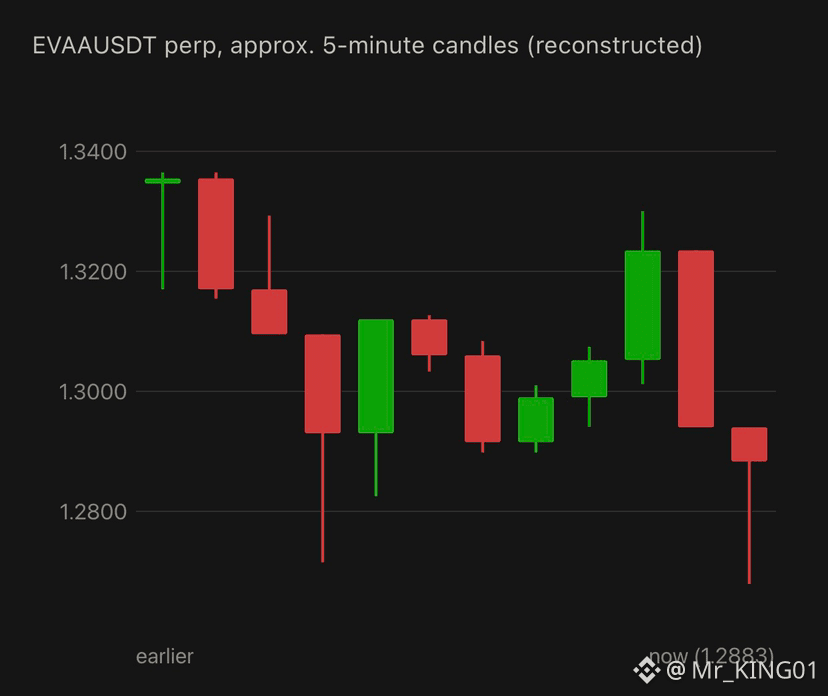
$EVAA is trading at 1.2883 USDT with a mark price of 1.2869. It is up 1.28% over 24h, while “Today” shows +16.30%. The 24h range is wide at 1.0800–1.4998, on about 107.44M USDT (87.54M EVAA) in volume. Returns are strongly positive over most periods: +151.03% over 7 days, +95.73% over 30 days, +49.59% over 90 days and +119.70% over 180 days, though it is still -88.02% over 1 year. In the visible window, price swung widely: it fell from about 1.3365 to about 1.2715, rebounded to about 1.3127, spiked to about 1.3300, then dropped again to about 1.2679 before bouncing to the current level. Price is below the MA60 (1.3080), which is sloping down, and the order book leans toward sellers (59.73% asks vs 40.27% bids), so sellers have the short-term edge. Support is near 1.2679–1.2715, then the 24h low of 1.0800, and resistance is at the MA60 (1.3080), then 1.3300 and the 24h high of 1.4998. A move back above the MA60 would show buyers regaining control, while a break below 1.2679 would extend the pullback. Swings this large on a leveraged perp can liquidate positions quickly.
{future}(EVAAUSDT)
$EVAA is trading at 1.2883 USDT with a mark price of 1.2869. It is up 1.28% over 24h, while “Today” shows +16.30%. The 24h range is wide at 1.0800–1.4998, on about 107.44M USDT (87.54M EVAA) in volume. Returns are strongly positive over most periods: +151.03% over 7 days, +95.73% over 30 days, +49.59% over 90 days and +119.70% over 180 days, though it is still -88.02% over 1 year. In the visible window, price swung widely: it fell from about 1.3365 to about 1.2715, rebounded to about 1.3127, spiked to about 1.3300, then dropped again to about 1.2679 before bouncing to the current level. Price is below the MA60 (1.3080), which is sloping down, and the order book leans toward sellers (59.73% asks vs 40.27% bids), so sellers have the short-term edge. Support is near 1.2679–1.2715, then the 24h low of 1.0800, and resistance is at the MA60 (1.3080), then 1.3300 and the 24h high of 1.4998. A move back above the MA60 would show buyers regaining control, while a break below 1.2679 would extend the pullback. Swings this large on a leveraged perp can liquidate positions quickly.
81
·
--
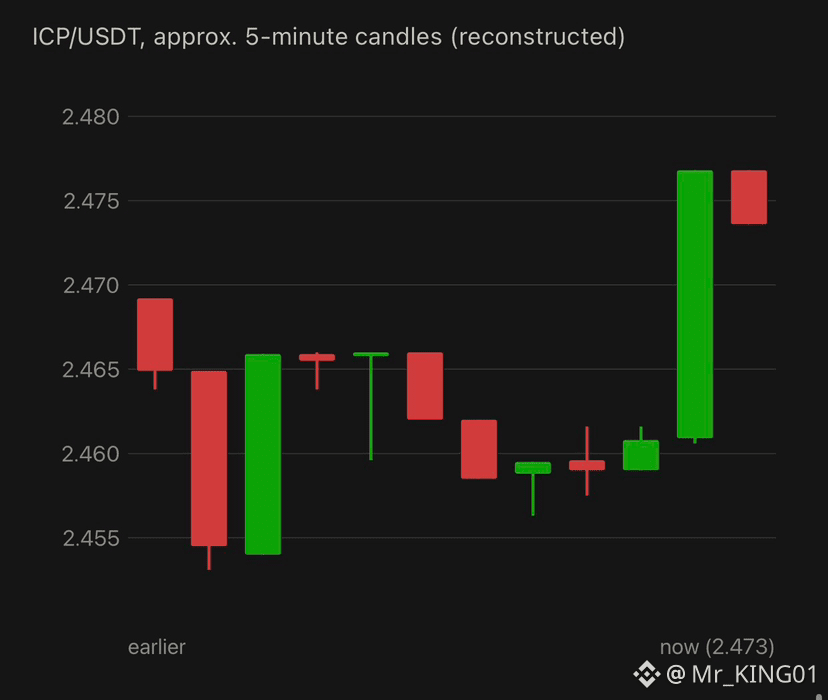
$ICP is trading at 2.473 USDT, down 2.18% in 24h (the “Today” figure shows -3.25%), with a range of 2.272–2.642 and about 10.00M USDT in volume. That is about 12% below the 2.817 level in your earlier ICP screenshot. Returns are weak over most periods: -9.21% over 7 days, -27.29% over 30 days and -20.38% over 1 year, while the 90-day (+19.35%) and 180-day (+4.52%) figures are positive. In the visible window, price dipped to about 2.453, then moved in a choppy range between about 2.456 and 2.466. It broke out sharply near the end to about 2.477 and has pulled back slightly. It is now above the MA60 (2.464), which is flat, and the order book leans toward buyers (62.09% bids vs 37.91% asks), so the short-term bias is mildly positive after the breakout. Support is at the MA60 (2.464), then 2.458 and 2.453, and resistance is at 2.477, then the 24h high of 2.642. A hold above 2.464 would keep the breakout intact, while a drop back into the 2.456–2.466 range would suggest it was a short spike.
{spot}(ICPUSDT)
$ICP is trading at 2.473 USDT, down 2.18% in 24h (the “Today” figure shows -3.25%), with a range of 2.272–2.642 and about 10.00M USDT in volume. That is about 12% below the 2.817 level in your earlier ICP screenshot. Returns are weak over most periods: -9.21% over 7 days, -27.29% over 30 days and -20.38% over 1 year, while the 90-day (+19.35%) and 180-day (+4.52%) figures are positive. In the visible window, price dipped to about 2.453, then moved in a choppy range between about 2.456 and 2.466. It broke out sharply near the end to about 2.477 and has pulled back slightly. It is now above the MA60 (2.464), which is flat, and the order book leans toward buyers (62.09% bids vs 37.91% asks), so the short-term bias is mildly positive after the breakout. Support is at the MA60 (2.464), then 2.458 and 2.453, and resistance is at 2.477, then the 24h high of 2.642. A hold above 2.464 would keep the breakout intact, while a drop back into the 2.456–2.466 range would suggest it was a short spike.
2
540
·
--
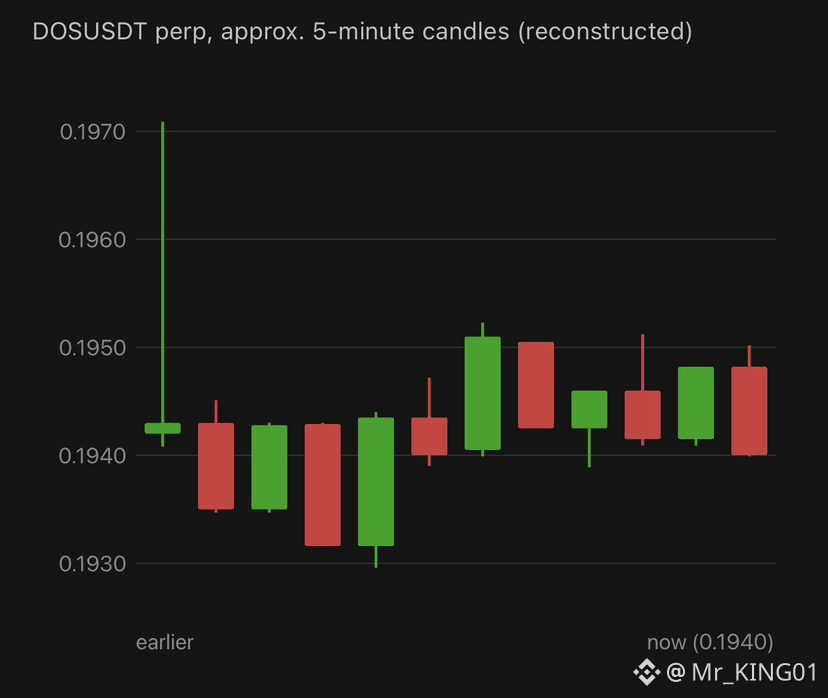
$DOS is trading at 0.1940 USDT with a mark price of 0.1941. It is down 12.10% over 24h, while “Today” shows +2.00%. The 24h range is wide at 0.1801–0.2261, on about 23.64M USDT (118.29M DOS) in volume. Only the 7-day (-10.43%) and 30-day (-10.64%) returns are shown, with no 90-day, 180-day or 1-year data, which means a short trading history. In the visible window, price spiked to about 0.1971 at the very start, then settled into a choppy range of about 0.1930–0.1952, with a low near 0.1930 and a second peak near 0.1952. It is trading right at the MA60 (0.1942), and the order book is evenly split (50.39% asks vs 49.61% bids), so there is no clear short-term direction. Support is near 0.1930, then the 24h low of 0.1801, and resistance is at the MA60 (0.1942), then 0.1952 and the 24h high of 0.2261. A move above 0.1952 would be the first sign of strength, while a drop below 0.1930 would reopen the downside. A coin with a short history on a leveraged perp can swing sharply in either direction.
{future}(DOSUSDT)
$DOS is trading at 0.1940 USDT with a mark price of 0.1941. It is down 12.10% over 24h, while “Today” shows +2.00%. The 24h range is wide at 0.1801–0.2261, on about 23.64M USDT (118.29M DOS) in volume. Only the 7-day (-10.43%) and 30-day (-10.64%) returns are shown, with no 90-day, 180-day or 1-year data, which means a short trading history. In the visible window, price spiked to about 0.1971 at the very start, then settled into a choppy range of about 0.1930–0.1952, with a low near 0.1930 and a second peak near 0.1952. It is trading right at the MA60 (0.1942), and the order book is evenly split (50.39% asks vs 49.61% bids), so there is no clear short-term direction. Support is near 0.1930, then the 24h low of 0.1801, and resistance is at the MA60 (0.1942), then 0.1952 and the 24h high of 0.2261. A move above 0.1952 would be the first sign of strength, while a drop below 0.1930 would reopen the downside. A coin with a short history on a leveraged perp can swing sharply in either direction.
580
·
--
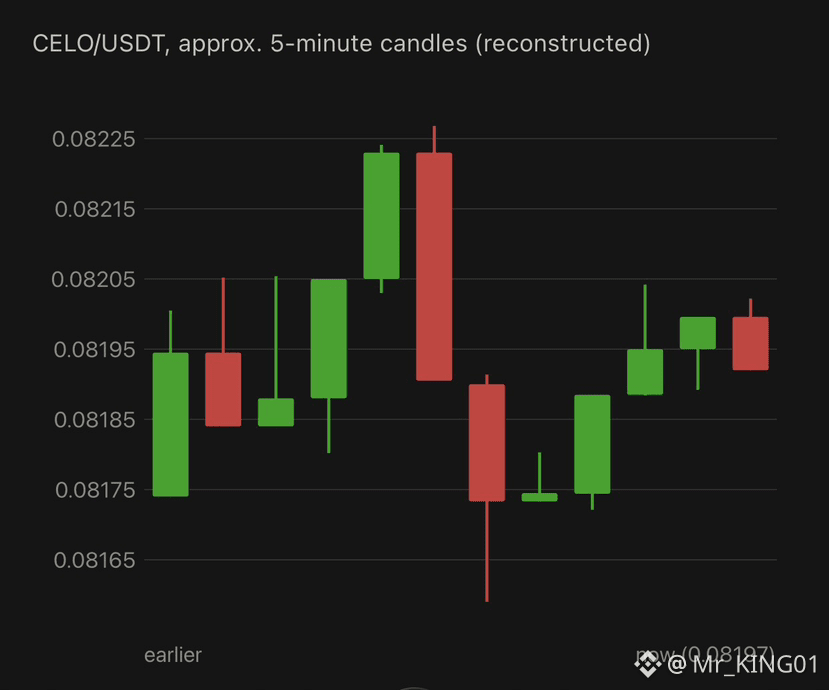
$CELO is trading at 0.08197 USDT, up 1.64% in 24h (the “Today” figure shows +1.25%), with a range of 0.07763–0.08235 and about 11.42M USDT (142.28M CELO) in volume. Returns are mixed: -5.07% over 7 days, -11.53% over 30 days, +31.43% over 90 days, -6.55% over 180 days and -67.78% over 1 year. In the visible window, price rallied to a peak near 0.08227, dropped sharply to about 0.08159, built a base around 0.08172–0.08178, and then recovered to the current level. It is sitting right at the MA60 (0.08191), which is rising, so the short-term picture is neutral to slightly positive. The order book leans heavily toward sellers (71.74% asks vs 28.26% bids), which could cap further gains near the highs. Support is at the MA60 (0.08191), then 0.08172 and the 24h low of 0.07763, and resistance is at 0.08227, then the 24h high of 0.08235. A clean move above 0.08227 would be the first sign of strength, while a drop below 0.08172 would put the lower part of the range back in play.
{spot}(CELOUSDT)
$CELO is trading at 0.08197 USDT, up 1.64% in 24h (the “Today” figure shows +1.25%), with a range of 0.07763–0.08235 and about 11.42M USDT (142.28M CELO) in volume. Returns are mixed: -5.07% over 7 days, -11.53% over 30 days, +31.43% over 90 days, -6.55% over 180 days and -67.78% over 1 year. In the visible window, price rallied to a peak near 0.08227, dropped sharply to about 0.08159, built a base around 0.08172–0.08178, and then recovered to the current level. It is sitting right at the MA60 (0.08191), which is rising, so the short-term picture is neutral to slightly positive. The order book leans heavily toward sellers (71.74% asks vs 28.26% bids), which could cap further gains near the highs. Support is at the MA60 (0.08191), then 0.08172 and the 24h low of 0.07763, and resistance is at 0.08227, then the 24h high of 0.08235. A clean move above 0.08227 would be the first sign of strength, while a drop below 0.08172 would put the lower part of the range back in play.
206
·
--
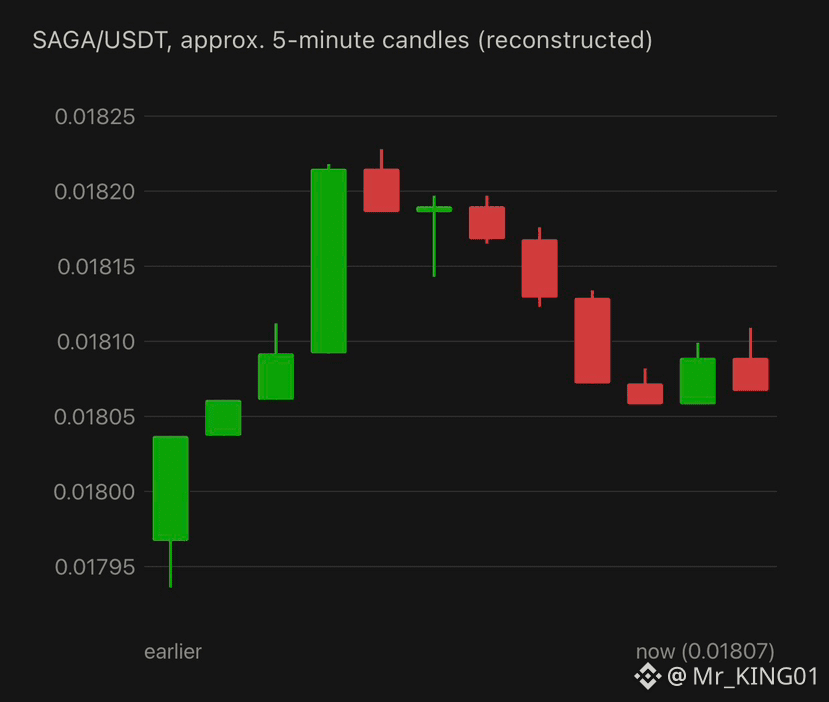
$SAGA is trading at 0.01807 USDT, down 2.80% in 24h (the “Today” figure shows -2.11%), with a range of 0.01781–0.01891 and about 991.5K USDT (54.07M SAGA) in volume. The longer-term trend is weak: -9.60% over 7 days, -32.57% over 30 days and -83.38% over 1 year, with only the 90-day (+48.48%) and 180-day (+3.97%) figures positive. In the visible window, price rallied from about 0.01794 to a peak near 0.01823, then faded back to roughly where it started the climb’s midpoint. It has since moved sideways around 0.01806–0.01811 with a small bounce. Price is just below the MA60 (0.01811), and the order book is balanced (50.62% bids vs 49.38% asks), so there is no clear short-term direction. Support is near 0.01805 and 0.01798, then the 24h low of 0.01781, and resistance is at the MA60 (0.01811), then 0.01820 and the 24h high of 0.01891. A move back above 0.01811 would show buyers regaining control, while a drop below 0.01798 would extend the decline.
{spot}(SAGAUSDT)
$SAGA is trading at 0.01807 USDT, down 2.80% in 24h (the “Today” figure shows -2.11%), with a range of 0.01781–0.01891 and about 991.5K USDT (54.07M SAGA) in volume. The longer-term trend is weak: -9.60% over 7 days, -32.57% over 30 days and -83.38% over 1 year, with only the 90-day (+48.48%) and 180-day (+3.97%) figures positive. In the visible window, price rallied from about 0.01794 to a peak near 0.01823, then faded back to roughly where it started the climb’s midpoint. It has since moved sideways around 0.01806–0.01811 with a small bounce. Price is just below the MA60 (0.01811), and the order book is balanced (50.62% bids vs 49.38% asks), so there is no clear short-term direction. Support is near 0.01805 and 0.01798, then the 24h low of 0.01781, and resistance is at the MA60 (0.01811), then 0.01820 and the 24h high of 0.01891. A move back above 0.01811 would show buyers regaining control, while a drop below 0.01798 would extend the decline.
439
·
--
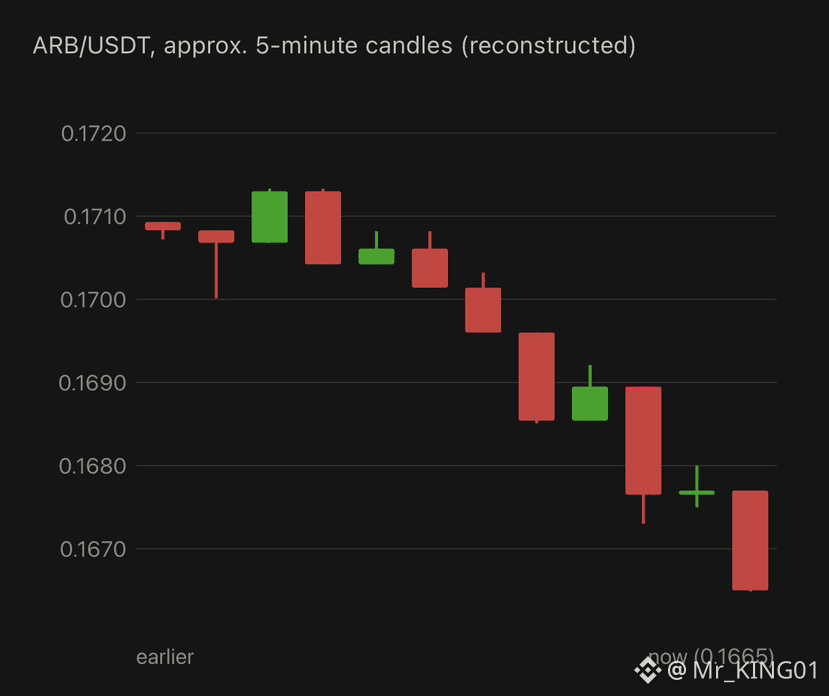
$ARB is trading at 0.1665 USDT, down 1.83% in 24h (the “Today” figure shows -2.97%), with a range of 0.1634–0.1786 and about 13.69M USDT (80.52M ARB) in volume. The trend is weak over most periods: -14.53% over 7 days, -19.53% over 30 days and -48.88% over 1 year, while the 90-day (+113.46%) and 180-day (+32.99%) figures remain positive. In the visible window, price peaked near 0.1713 early, then drifted lower in steps and slid steeply in the second half to the window low at the current price. It is well below the MA60 (0.1696), which is sloping down, so sellers have the clear short-term edge. The order book leans slightly toward buyers (56.43% bids vs 43.57% asks), but that has not stopped the decline. Support is near 0.1660 and the 24h low of 0.1634, and resistance is at 0.1674 and 0.1685, then the MA60 (0.1696) and the 24h high of 0.1786. A bounce back above 0.1685 would show buyers regaining control, while a break below 0.1634 would set a new 24h low.
{spot}(ARBUSDT)
$ARB is trading at 0.1665 USDT, down 1.83% in 24h (the “Today” figure shows -2.97%), with a range of 0.1634–0.1786 and about 13.69M USDT (80.52M ARB) in volume. The trend is weak over most periods: -14.53% over 7 days, -19.53% over 30 days and -48.88% over 1 year, while the 90-day (+113.46%) and 180-day (+32.99%) figures remain positive. In the visible window, price peaked near 0.1713 early, then drifted lower in steps and slid steeply in the second half to the window low at the current price. It is well below the MA60 (0.1696), which is sloping down, so sellers have the clear short-term edge. The order book leans slightly toward buyers (56.43% bids vs 43.57% asks), but that has not stopped the decline. Support is near 0.1660 and the 24h low of 0.1634, and resistance is at 0.1674 and 0.1685, then the MA60 (0.1696) and the 24h high of 0.1786. A bounce back above 0.1685 would show buyers regaining control, while a break below 0.1634 would set a new 24h low.
1
383
·
--
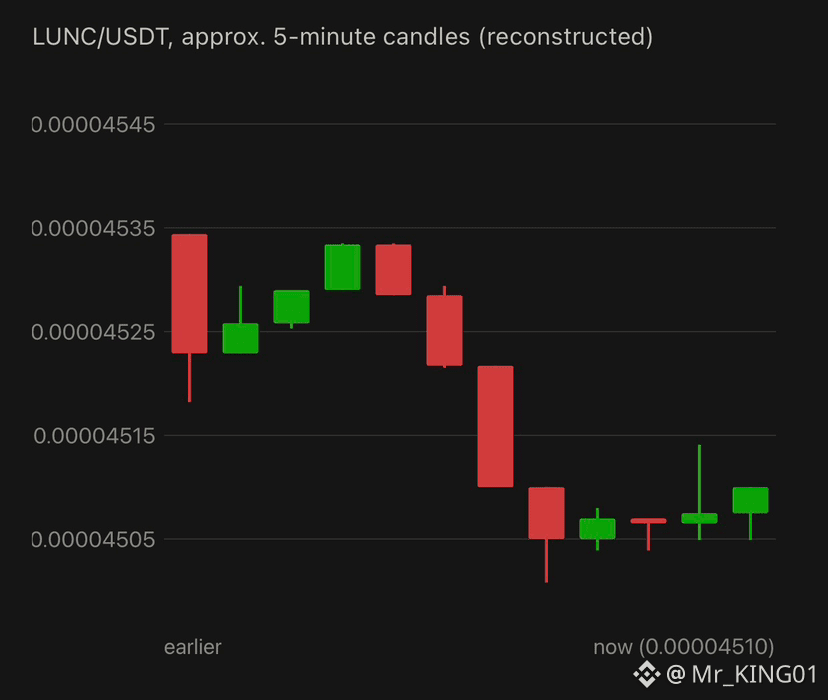
$LUNC is trading at 0.00004510 USDT, up 1.19% in 24h (the “Today” figure shows +0.31%), with a range of 0.00004451–0.00004567 and about 587.6K USDT (13.02B LUNC) in volume. That is about 3.6% below the 0.00004677 level in your earlier LUNC screenshot. The longer-term trend is weak: -3.16% over 7 days, -19.94% over 30 days, -10.90% over 90 days, -39.95% over 180 days and -2.47% over 1 year. In the visible window, price chopped near 0.00004525–0.00004533 for the first half, then dropped sharply to about 0.00004501 on a large red volume spike and has since bounced only slightly. Price is below the MA60 (0.00004520), which is sloping down, and the order book is heavily sell-side (69.38% asks vs 30.62% bids), so sellers are still in control. Support is at 0.00004500, then the 24h low of 0.00004451, and resistance is at the MA60 (0.00004520), then 0.00004533 and the 24h high of 0.00004567. A recovery above the MA60 would be the first sign the drop is fading, while a break below 0.00004500 would extend the decline.
{spot}(LUNCUSDT)
$LUNC is trading at 0.00004510 USDT, up 1.19% in 24h (the “Today” figure shows +0.31%), with a range of 0.00004451–0.00004567 and about 587.6K USDT (13.02B LUNC) in volume. That is about 3.6% below the 0.00004677 level in your earlier LUNC screenshot. The longer-term trend is weak: -3.16% over 7 days, -19.94% over 30 days, -10.90% over 90 days, -39.95% over 180 days and -2.47% over 1 year. In the visible window, price chopped near 0.00004525–0.00004533 for the first half, then dropped sharply to about 0.00004501 on a large red volume spike and has since bounced only slightly. Price is below the MA60 (0.00004520), which is sloping down, and the order book is heavily sell-side (69.38% asks vs 30.62% bids), so sellers are still in control. Support is at 0.00004500, then the 24h low of 0.00004451, and resistance is at the MA60 (0.00004520), then 0.00004533 and the 24h high of 0.00004567. A recovery above the MA60 would be the first sign the drop is fading, while a break below 0.00004500 would extend the decline.
3
340
·
--
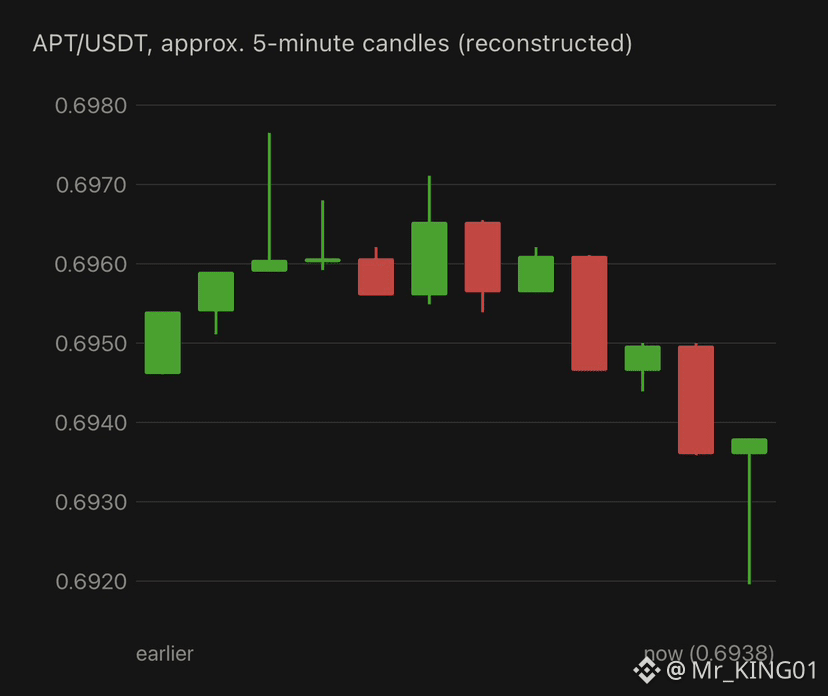
$APT is trading at 0.6938 USDT, up 1.48% in 24h (the “Today” figure shows +0.81%), with a range of 0.6740–0.7045 and about 4.09M USDT in volume. That is about 9% below the 0.7653 level in your earlier APT screenshot. The trend is weak over most periods: -16.37% over 7 days, -19.39% over 30 days, -30.06% over 180 days and -80.28% over 1 year, with only the 90-day figure positive (+21.08%). In the visible window, price moved in a choppy range of about 0.6935–0.6977, peaking near 0.6977 and then sliding below the MA60. It dropped to about 0.6920 late in the window before a sharp rebound to the current level. Price is still below the MA60 (0.6953), which is flat, so the short-term trend remains cautious. The order book leans toward buyers (62.27% bids vs 37.73% asks), which helped fuel the late bounce. Support is near 0.6920, then the 24h low of 0.6740, and resistance is at the MA60 (0.6953), then 0.6977 and the 24h high of 0.7045. A close back above 0.6953 would show the rebound has traction, while a drop below 0.6920 would reopen the lower end of the 24h range.
{spot}(APTUSDT)
$APT is trading at 0.6938 USDT, up 1.48% in 24h (the “Today” figure shows +0.81%), with a range of 0.6740–0.7045 and about 4.09M USDT in volume. That is about 9% below the 0.7653 level in your earlier APT screenshot. The trend is weak over most periods: -16.37% over 7 days, -19.39% over 30 days, -30.06% over 180 days and -80.28% over 1 year, with only the 90-day figure positive (+21.08%). In the visible window, price moved in a choppy range of about 0.6935–0.6977, peaking near 0.6977 and then sliding below the MA60. It dropped to about 0.6920 late in the window before a sharp rebound to the current level. Price is still below the MA60 (0.6953), which is flat, so the short-term trend remains cautious. The order book leans toward buyers (62.27% bids vs 37.73% asks), which helped fuel the late bounce. Support is near 0.6920, then the 24h low of 0.6740, and resistance is at the MA60 (0.6953), then 0.6977 and the 24h high of 0.7045. A close back above 0.6953 would show the rebound has traction, while a drop below 0.6920 would reopen the lower end of the 24h range.
355
·
--
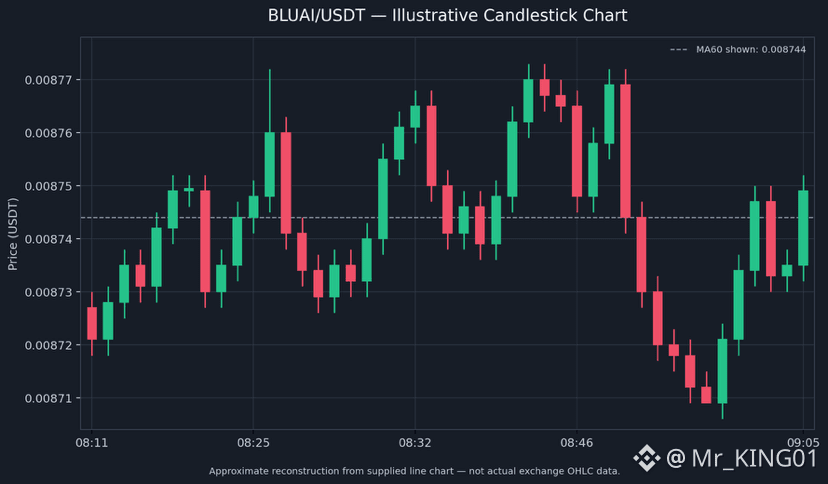
$BLUAI is showing short-term volatility with a slight bearish bias. the current price is $0.008749, down approximately 1.66%, with a 24-hour high of $0.008992 and a low of $0.008618. The price experienced several fluctuations before recovering from a recent dip near $0.008709. The current price is slightly above the MA60 level of $0.008744, suggesting a possible short-term recovery, although selling pressure remains significant. Immediate support is around $0.008721–$0.008709, while resistance is near $0.008761–$0.008774. A breakout above resistance could support further upward movement, while a drop below support may signal additional weakness.
{future}(BLUAIUSDT)
$BLUAI is showing short-term volatility with a slight bearish bias. the current price is $0.008749, down approximately 1.66%, with a 24-hour high of $0.008992 and a low of $0.008618. The price experienced several fluctuations before recovering from a recent dip near $0.008709. The current price is slightly above the MA60 level of $0.008744, suggesting a possible short-term recovery, although selling pressure remains significant. Immediate support is around $0.008721–$0.008709, while resistance is near $0.008761–$0.008774. A breakout above resistance could support further upward movement, while a drop below support may signal additional weakness.
681
·
--
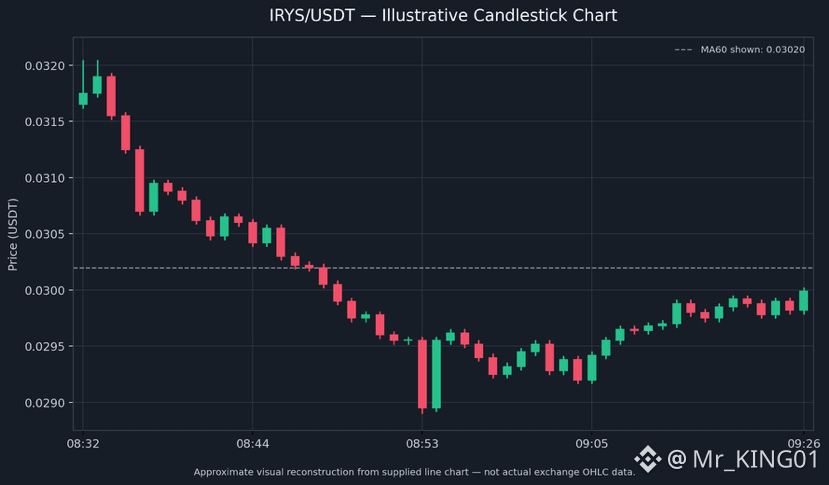
$IRYS is showing bearish short-term momentum, despite a recent attempt at recovery. According to your screenshot, the current price is $0.02999, down approximately 16.32%, with a 24-hour high of $0.03600 and a low of $0.02556. The price has declined significantly from its recent high before recovering slightly from around $0.02890. The current price remains below the MA60 level of $0.03020, suggesting continued selling pressure. Immediate support is around $0.02890–$0.02900, while resistance lies near $0.03020–$0.03050. A move above resistance could support a recovery, while a break below support may lead to further weakness.
{future}(IRYSUSDT)
$IRYS is showing bearish short-term momentum, despite a recent attempt at recovery. According to your screenshot, the current price is $0.02999, down approximately 16.32%, with a 24-hour high of $0.03600 and a low of $0.02556. The price has declined significantly from its recent high before recovering slightly from around $0.02890. The current price remains below the MA60 level of $0.03020, suggesting continued selling pressure. Immediate support is around $0.02890–$0.02900, while resistance lies near $0.03020–$0.03050. A move above resistance could support a recovery, while a break below support may lead to further weakness.
350
·
--
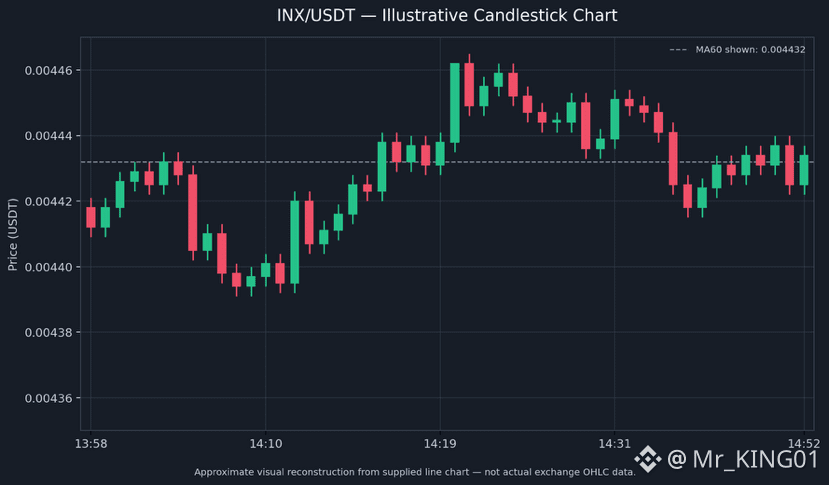
$INX is showing mixed price action with slight bearish pressure, according to your screenshot. The current price is $0.004434, down approximately 2.72%, with a 24-hour high of $0.004753 and a low of $0.004223. The price recently recovered from a local dip but remains below its recent peak. The MA60 is around $0.004432, placing the current price very close to the moving average. Immediate support is around $0.004420–$0.004400, while resistance lies near $0.004441–$0.004460. A move above resistance could support a short-term recovery, while a break below support may indicate further weakness.
{future}(INXUSDT)
$INX is showing mixed price action with slight bearish pressure, according to your screenshot. The current price is $0.004434, down approximately 2.72%, with a 24-hour high of $0.004753 and a low of $0.004223. The price recently recovered from a local dip but remains below its recent peak. The MA60 is around $0.004432, placing the current price very close to the moving average. Immediate support is around $0.004420–$0.004400, while resistance lies near $0.004441–$0.004460. A move above resistance could support a short-term recovery, while a break below support may indicate further weakness.
457
·
--
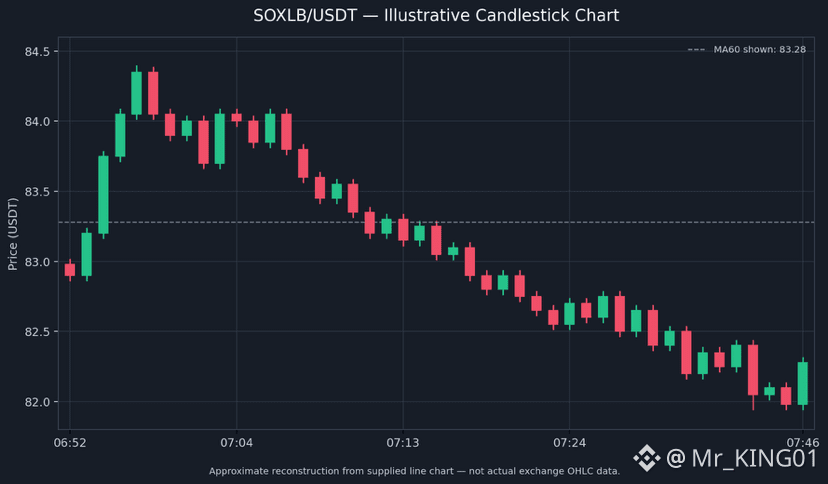
$SOXLB is showing strong bearish momentum according to your screenshot. The current price is $82.28, down approximately 3.10%, after falling from a recent high near $84.35. The price is now below the MA60 level of $83.28, indicating continued selling pressure. Immediate support is around $81.94–$82.00, while resistance lies near $82.98–$83.28. If the price breaks below support, further downside is possible. However, a recovery above $83.28 could indicate a short-term rebound. Trading volume has increased during the decline, suggesting stronger selling activity.
{spot}(SOXLBUSDT)
$SOXLB is showing strong bearish momentum according to your screenshot. The current price is $82.28, down approximately 3.10%, after falling from a recent high near $84.35. The price is now below the MA60 level of $83.28, indicating continued selling pressure. Immediate support is around $81.94–$82.00, while resistance lies near $82.98–$83.28. If the price breaks below support, further downside is possible. However, a recovery above $83.28 could indicate a short-term rebound. Trading volume has increased during the decline, suggesting stronger selling activity.
170
·
--
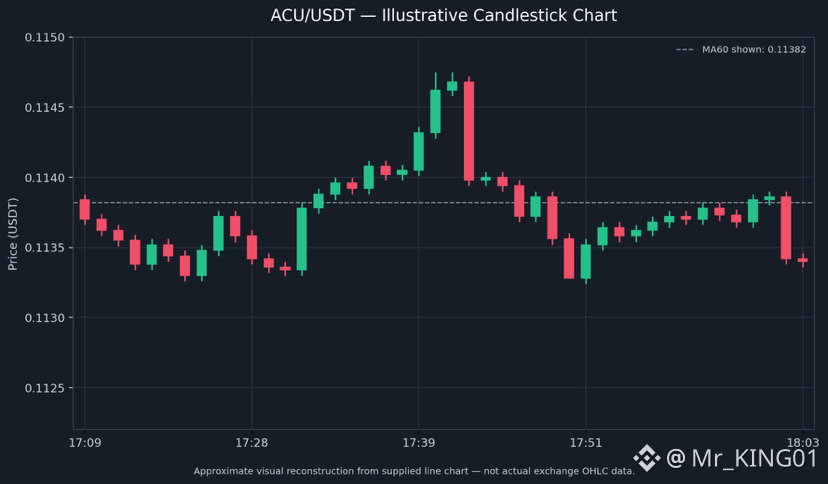
$ACU is showing slightly bearish short-term momentum, trading at $0.11340, down approximately 1.18%, according to your screenshot. The price experienced a brief rally toward $0.11475 before pulling back, indicating selling pressure near higher levels. The current price is slightly below the MA60 level of $0.11382, suggesting that buyers have not yet regained control. Immediate support is around $0.11330–$0.11340, while resistance lies near $0.11380–$0.11400. A break below support could lead to further weakness, whereas a recovery above resistance may signal a short-term rebound.
{future}(ACUUSDT)
$ACU is showing slightly bearish short-term momentum, trading at $0.11340, down approximately 1.18%, according to your screenshot. The price experienced a brief rally toward $0.11475 before pulling back, indicating selling pressure near higher levels. The current price is slightly below the MA60 level of $0.11382, suggesting that buyers have not yet regained control. Immediate support is around $0.11330–$0.11340, while resistance lies near $0.11380–$0.11400. A break below support could lead to further weakness, whereas a recovery above resistance may signal a short-term rebound.
345
ເຂົ້າສູ່ລະບົບເພື່ອສຳຫຼວດເນື້ອຫາເພີ່ມເຕີມ
ເຂົ້າຮ່ວມກຸ່ມຜູ້ໃຊ້ຄຣິບໂຕທົ່ວໂລກໃນ Binance Square.
⚡️ ໄດ້ຮັບຂໍ້ມູນຫຼ້າສຸດ ແລະ ທີ່ມີປະໂຫຍດກ່ຽວກັບຄຣິບໂຕ.
💬 ໄດ້ຮັບຄວາມໄວ້ວາງໃຈຈາກຕະຫຼາດແລກປ່ຽນຄຣິບໂຕທີ່ໃຫຍ່ທີ່ສຸດໃນໂລກ.
👍 ຄົ້ນຫາຂໍ້ມູນເຊີງເລິກທີ່ແທ້ຈາກນັກສ້າງທີ່ໄດ້ຮັບການຢືນຢັນ.
ອີເມວ / ເບີໂທລະສັບ
ຫົວຂໍ້ທີ່ກໍາລັງນິຍົມ
BinanceWithdrawalScamWarning
29,858 ຄັ້ງທີ່ເບິ່ງ
582 ກຳລັງສົນທະນາ
Binance Warns Users of Withdrawal Scams as Services Resume: It Will Never Charge Fees, Sell Queue Spots or Ask You to Move Funds to a “Vault”
Binance News
·13 ຖືກໃຈ
·7.7k ຄັ້ງທີ່ເບິ່ງ
USMidtermElections
588,837 ຄັ້ງທີ່ເບິ່ງ
3,155 ກຳລັງສົນທະນາ
USOctoberNFP-AreRateCutsStillPossible
38,110 ຄັ້ງທີ່ເບິ່ງ
488 ກຳລັງສົນທະນາ