
mkeshari
909 ໂພສ

mkeshari
ລາຍງານ
ບລັອກຜູ້ໃຊ້
Blockchain | AI | Web3 - Software Developer @mkeshari on X. I’m not giving financial advice. Always DYOR and consider your risk tolerance.
ເປີດການຊື້ຂາຍ
ຜູ້ຊື້ຂາຍປະຈໍາ
5.4 ປີ
17 ກໍາລັງຕິດຕາມ
3.7K+ ຜູ້ຕິດຕາມ
4.1K+ Liked
ໂພສ
Portfolio
ທັງໝົດ
ວົງຢືມ
ວີດີໂອ
·
--
Just remember, markets are cyclical.
When you’re thinking about giving up is when you should be paying most attention for opportunities. 💯
$BTC $ETH
{spot}(ETHUSDT)
{spot}(BTCUSDT)
Just remember, markets are cyclical.
When you’re thinking about giving up is when you should be paying most attention for opportunities. 💯
$BTC $ETH
When you’re thinking about giving up is when you should be paying most attention for opportunities. 💯
$BTC $ETH
1
69
·
--
I told you early, but you didn't believe me.. - DUMP BELOW $75,000 WILL BE BRUTAL for $BTC 🚨
I told you early, but you didn't believe me.. - DUMP BELOW $75,000 WILL BE BRUTAL for $BTC 🚨
mkeshari
·
--
🚨 DUMP BELOW $75,000 WILL BE BRUTAL for $BTC 🚨
Right now Bitcoin is hanging around the low $81Ks… but make no mistake.
$75K isn’t just another number.
It’s the last major line of defense.
Break it cleanly and we’re looking at:
- Cascading liquidations
- Alts getting absolutely wrecked
- Weak hands getting flushed hard
- Sentiment flipping from “mild correction” to full panic mode
We’ve already seen how brutal these moves can get. Once the big support zones crack, the next stop is rarely gentle.
This isn’t FUD - this is risk management.
The market doesn’t care about your feelings or your average buy price.
Stay sharp.
Protect your capital.
And remember… the real money is usually made on the other side of the bloodbath.
Who’s watching that $75K level like a hawk? 👀
#Bitcoin #BTC
Right now Bitcoin is hanging around the low $81Ks… but make no mistake.
$75K isn’t just another number.
It’s the last major line of defense.
Break it cleanly and we’re looking at:
- Cascading liquidations
- Alts getting absolutely wrecked
- Weak hands getting flushed hard
- Sentiment flipping from “mild correction” to full panic mode
We’ve already seen how brutal these moves can get. Once the big support zones crack, the next stop is rarely gentle.
This isn’t FUD - this is risk management.
The market doesn’t care about your feelings or your average buy price.
Stay sharp.
Protect your capital.
And remember… the real money is usually made on the other side of the bloodbath.
Who’s watching that $75K level like a hawk? 👀
#Bitcoin #BTC
1
61
·
--
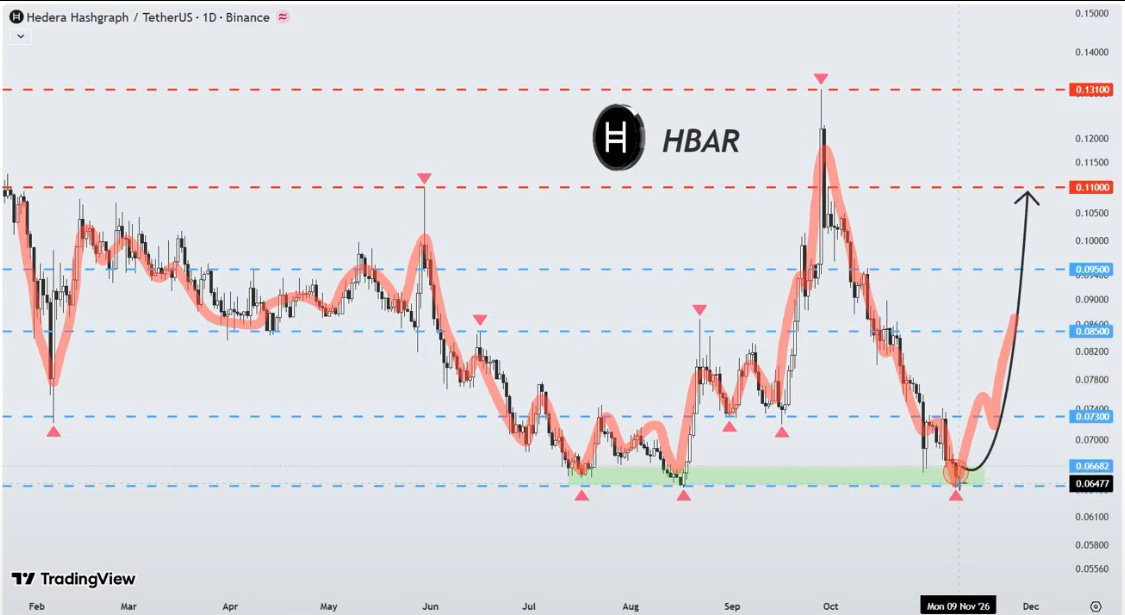
$HBAR At Daily Support
Hedera is holding the support zone on the daily chart, and the network is quietly printing a new all-time high in transaction volume.
- 8 transactions per second.
- 21 million transactions in 30 days.
- 46 Robinhood stock tokens, including Apple and Nvidia.
Enterprise adoption is accelerating while the price is in the discount zone.
Target levels after a confirmed rebound:
🎯 $0.073
🎯 $0.085
🎯 $0.095
🎯 $0.110
$HBAR At Daily Support
Hedera is holding the support zone on the daily chart, and the network is quietly printing a new all-time high in transaction volume.
- 8 transactions per second.
- 21 million transactions in 30 days.
- 46 Robinhood stock tokens, including Apple and Nvidia.
Enterprise adoption is accelerating while the price is in the discount zone.
Target levels after a confirmed rebound:
🎯 $0.073
🎯 $0.085
🎯 $0.095
🎯 $0.110
Hedera is holding the support zone on the daily chart, and the network is quietly printing a new all-time high in transaction volume.
- 8 transactions per second.
- 21 million transactions in 30 days.
- 46 Robinhood stock tokens, including Apple and Nvidia.
Enterprise adoption is accelerating while the price is in the discount zone.
Target levels after a confirmed rebound:
🎯 $0.073
🎯 $0.085
🎯 $0.095
🎯 $0.110
1
91
·
--
ສັນຍານກະທິງ
Altcoins bottomed in Nov. Which Altcoins are you most bullish in and why?
$INJ $BNB $QNT
{spot}(QNTUSDT)
{spot}(BNBUSDT)
{spot}(INJUSDT)
Altcoins bottomed in Nov. Which Altcoins are you most bullish in and why?
$INJ $BNB $QNT
$INJ $BNB $QNT
$INJ
$BNB
$QNT
All Three
1 ມື້ທີ່ຍັງເຫຼືອ
1
1.2k
·
--
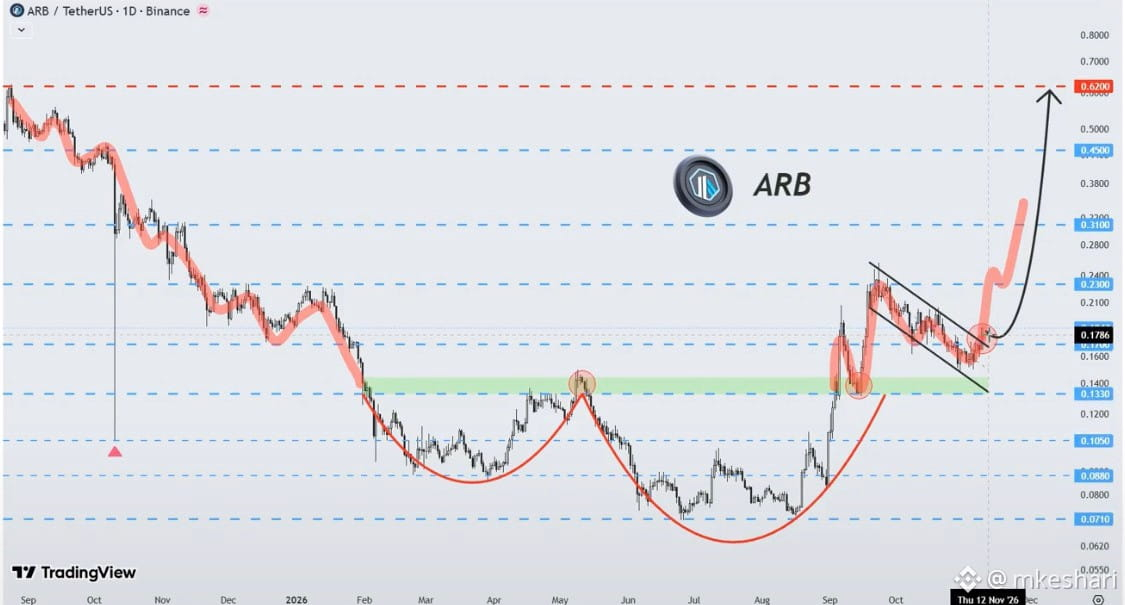
$ARB Bullish Flag Breakout With Real Catalysts Behind It 💥
Arbitrum has broken out of the bullish flag on the daily timeframe, and this time, the momentum is backed by more than just chart structure.
- Robinhood chose Arbitrum to build its real-world asset chain;
- Elysium is live;
- The Variational TGE is on the way.
The ecosystem is moving fast and the market is starting to notice.
Target levels:
🎯 $0.23
🎯 $0.31
🎯 $0.45
🎯 $0.62
{spot}(ARBUSDT)
$ARB Bullish Flag Breakout With Real Catalysts Behind It 💥
Arbitrum has broken out of the bullish flag on the daily timeframe, and this time, the momentum is backed by more than just chart structure.
- Robinhood chose Arbitrum to build its real-world asset chain;
- Elysium is live;
- The Variational TGE is on the way.
The ecosystem is moving fast and the market is starting to notice.
Target levels:
🎯 $0.23
🎯 $0.31
🎯 $0.45
🎯 $0.62
Arbitrum has broken out of the bullish flag on the daily timeframe, and this time, the momentum is backed by more than just chart structure.
- Robinhood chose Arbitrum to build its real-world asset chain;
- Elysium is live;
- The Variational TGE is on the way.
The ecosystem is moving fast and the market is starting to notice.
Target levels:
🎯 $0.23
🎯 $0.31
🎯 $0.45
🎯 $0.62
2
847
·
--
ຢືນຢັນແລ້ວ
Good NEWS for $AVAX 👍
The New York Stock Exchange said Monday that it would settle tokenized stocks on its upcoming 24/7 trading platform exclusively using the Avalanche blockchain.
{spot}(AVAXUSDT)
Good NEWS for $AVAX 👍
The New York Stock Exchange said Monday that it would settle tokenized stocks on its upcoming 24/7 trading platform exclusively using the Avalanche blockchain.
The New York Stock Exchange said Monday that it would settle tokenized stocks on its upcoming 24/7 trading platform exclusively using the Avalanche blockchain.
6
1.5k
·
--
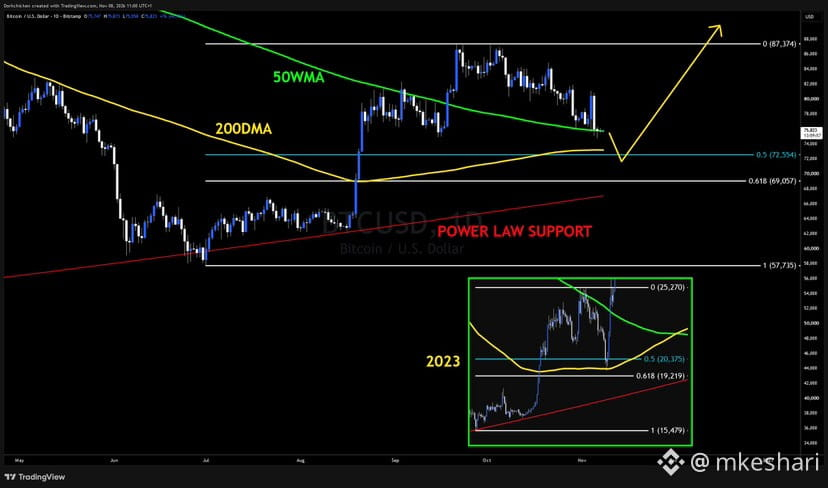
$BTC is currently clinging to the 50WMA, and on the lower timeframes the price action is rhyming with 2023 remarkably well so far.
Don't be surprised if we get a sweep below the September lows to tag some major Fibonacci levels before the next leg higher.
{spot}(BTCUSDT)
$BTC is currently clinging to the 50WMA, and on the lower timeframes the price action is rhyming with 2023 remarkably well so far.
Don't be surprised if we get a sweep below the September lows to tag some major Fibonacci levels before the next leg higher.
Don't be surprised if we get a sweep below the September lows to tag some major Fibonacci levels before the next leg higher.
1
474
·
--
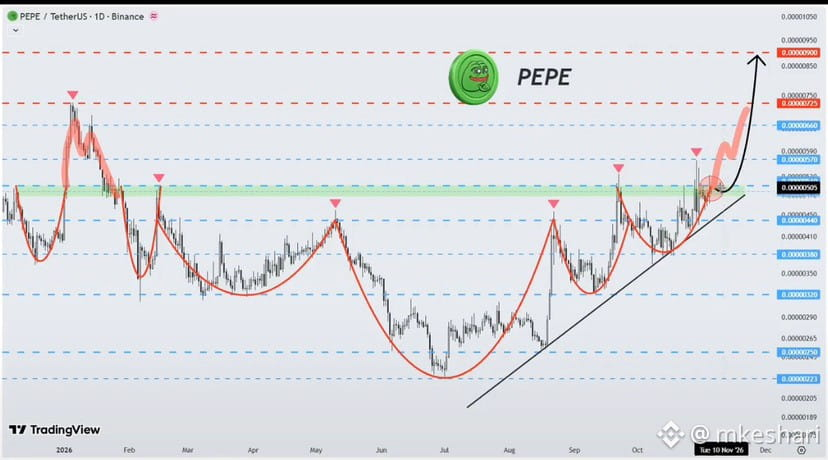
$PEPE Did Not Care About Market Bleading 🧐
Pepe just hit 600,000 holders and was one of the best-performing cryptocurrencies during a stormy market week.
Meanwhile, Justin Sun quietly accumulated $51.25 million worth of tokens.
The price is now challenging the upper border of the ascending triangle on the daily timeframe, and breakout conditions are in place.
Target levels:
🎯 $0.00000570
🎯 $0.00000660
🎯 $0.00000725
🎯 $0.00000900
{spot}(PEPEUSDT)
$PEPE Did Not Care About Market Bleading 🧐
Pepe just hit 600,000 holders and was one of the best-performing cryptocurrencies during a stormy market week.
Meanwhile, Justin Sun quietly accumulated $51.25 million worth of tokens.
The price is now challenging the upper border of the ascending triangle on the daily timeframe, and breakout conditions are in place.
Target levels:
🎯 $0.00000570
🎯 $0.00000660
🎯 $0.00000725
🎯 $0.00000900
Pepe just hit 600,000 holders and was one of the best-performing cryptocurrencies during a stormy market week.
Meanwhile, Justin Sun quietly accumulated $51.25 million worth of tokens.
The price is now challenging the upper border of the ascending triangle on the daily timeframe, and breakout conditions are in place.
Target levels:
🎯 $0.00000570
🎯 $0.00000660
🎯 $0.00000725
🎯 $0.00000900
1
118
·
--
ສັນຍານກະທິງ
🚨 $XRP trading volume just EXPLODED 160% to a staggering $5.73 BILLION in 24 HOURS.
🚨 $XRP trading volume just EXPLODED 160% to a staggering $5.73 BILLION in 24 HOURS.
2
160
·
--
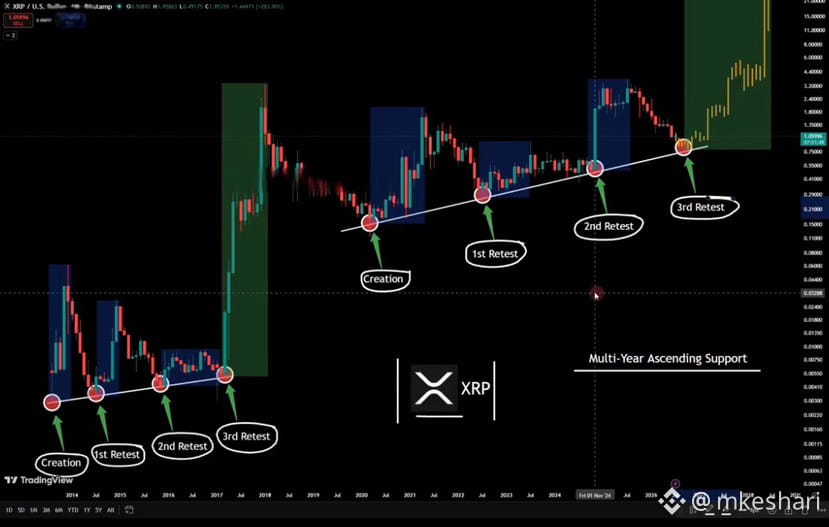
$XRP is replicating the exact same trendline from 2017.
History is repeating itself.
Just like before the 70,000% explosive surge.
The path to the next bull market:
Scenario 1: (August–September)
$1.10 → $0.97 → $1.80
Scenario 2: (November–December)
$1.80 → $2.70 → $3.20
Scenario 3: (January–February)
$3.20 → $6.50 → $13.00
Once the third pullback holds, the expansion phase begins.
Save this chart before it's too late.
Look back at this in a few months.
#XRP #Ripple
{spot}(XRPUSDT)
$XRP is replicating the exact same trendline from 2017.
History is repeating itself.
Just like before the 70,000% explosive surge.
The path to the next bull market:
Scenario 1: (August–September)
$1.10 → $0.97 → $1.80
Scenario 2: (November–December)
$1.80 → $2.70 → $3.20
Scenario 3: (January–February)
$3.20 → $6.50 → $13.00
Once the third pullback holds, the expansion phase begins.
Save this chart before it's too late.
Look back at this in a few months.
#XRP #Ripple
History is repeating itself.
Just like before the 70,000% explosive surge.
The path to the next bull market:
Scenario 1: (August–September)
$1.10 → $0.97 → $1.80
Scenario 2: (November–December)
$1.80 → $2.70 → $3.20
Scenario 3: (January–February)
$3.20 → $6.50 → $13.00
Once the third pullback holds, the expansion phase begins.
Save this chart before it's too late.
Look back at this in a few months.
#XRP #Ripple
5
21
13k
·
--
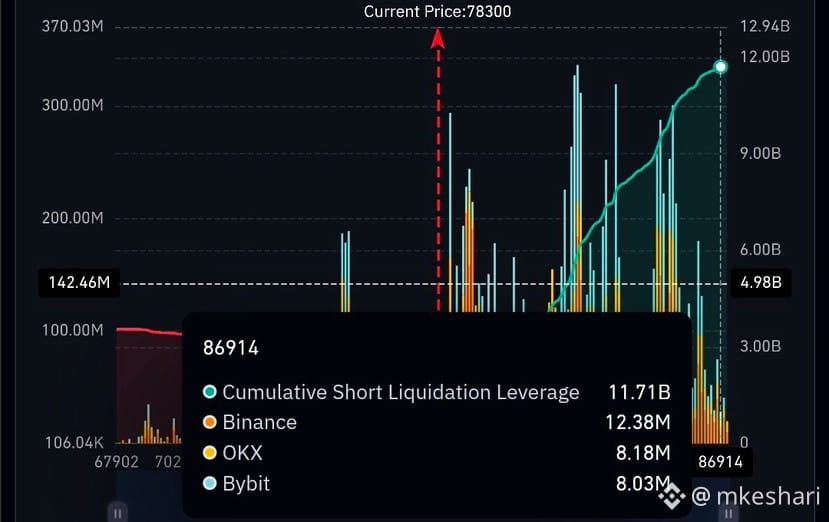
The bears are shaking right now 🔥🔥🔥
$BTC
{spot}(BTCUSDT)
The bears are shaking right now 🔥🔥🔥
$BTC
$BTC
1
400
·
--
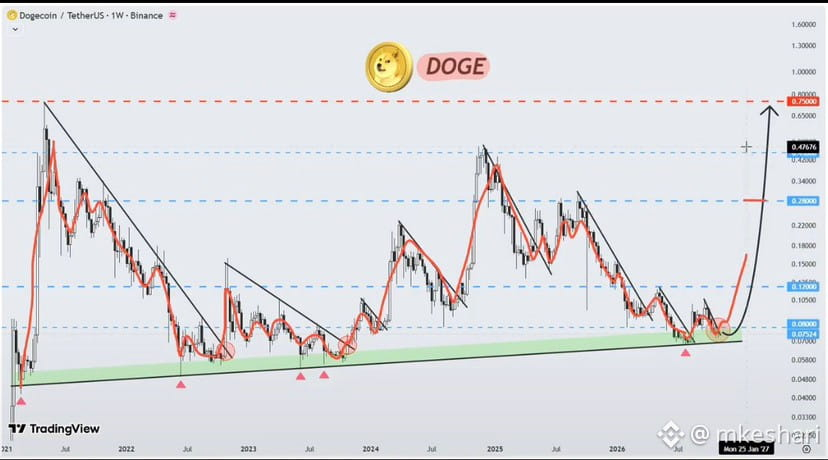
$DOGE Whales Are Accumulating at The Key Support 👩💻
Dogecoin is retesting the key support zone on the weekly chart, and the whales are loading up like never before.
The 149 largest wallets have quietly amassed a combined total of 108.52 billion #DOGE, setting a new record for their holdings.
Target levels after a confirmed bounce:
🎯 $0.12
🎯 $0.28
🎯 $0.45
🎯 $0.75
{spot}(DOGEUSDT)
$DOGE Whales Are Accumulating at The Key Support 👩💻
Dogecoin is retesting the key support zone on the weekly chart, and the whales are loading up like never before.
The 149 largest wallets have quietly amassed a combined total of 108.52 billion #DOGE, setting a new record for their holdings.
Target levels after a confirmed bounce:
🎯 $0.12
🎯 $0.28
🎯 $0.45
🎯 $0.75
Dogecoin is retesting the key support zone on the weekly chart, and the whales are loading up like never before.
The 149 largest wallets have quietly amassed a combined total of 108.52 billion #DOGE, setting a new record for their holdings.
Target levels after a confirmed bounce:
🎯 $0.12
🎯 $0.28
🎯 $0.45
🎯 $0.75
89
·
--
🚨 You don't have enough $XRP
A warning from a former Barclays executive is going viral, saying XRP holders might be unprepared for what's coming next week!
There are price predictions claiming XRP could reach $3,000 to $21,000, with links to Bank of America.
Also, the global real estate market—worth an estimated $654.39 trillion—could open up huge new opportunities for REAL Token.
* Buy REAL TOKEN on MEXC
* Buy REAL TOKEN on XRPL DEX
💥 This is huge!
Imagine if REAL Token jumps from $0.003 to over $100!
{spot}(XRPUSDT)
🚨 You don't have enough $XRP
A warning from a former Barclays executive is going viral, saying XRP holders might be unprepared for what's coming next week!
There are price predictions claiming XRP could reach $3,000 to $21,000, with links to Bank of America.
Also, the global real estate market—worth an estimated $654.39 trillion—could open up huge new opportunities for REAL Token.
* Buy REAL TOKEN on MEXC
* Buy REAL TOKEN on XRPL DEX
💥 This is huge!
Imagine if REAL Token jumps from $0.003 to over $100!
A warning from a former Barclays executive is going viral, saying XRP holders might be unprepared for what's coming next week!
There are price predictions claiming XRP could reach $3,000 to $21,000, with links to Bank of America.
Also, the global real estate market—worth an estimated $654.39 trillion—could open up huge new opportunities for REAL Token.
* Buy REAL TOKEN on MEXC
* Buy REAL TOKEN on XRPL DEX
💥 This is huge!
Imagine if REAL Token jumps from $0.003 to over $100!
1
74
·
--
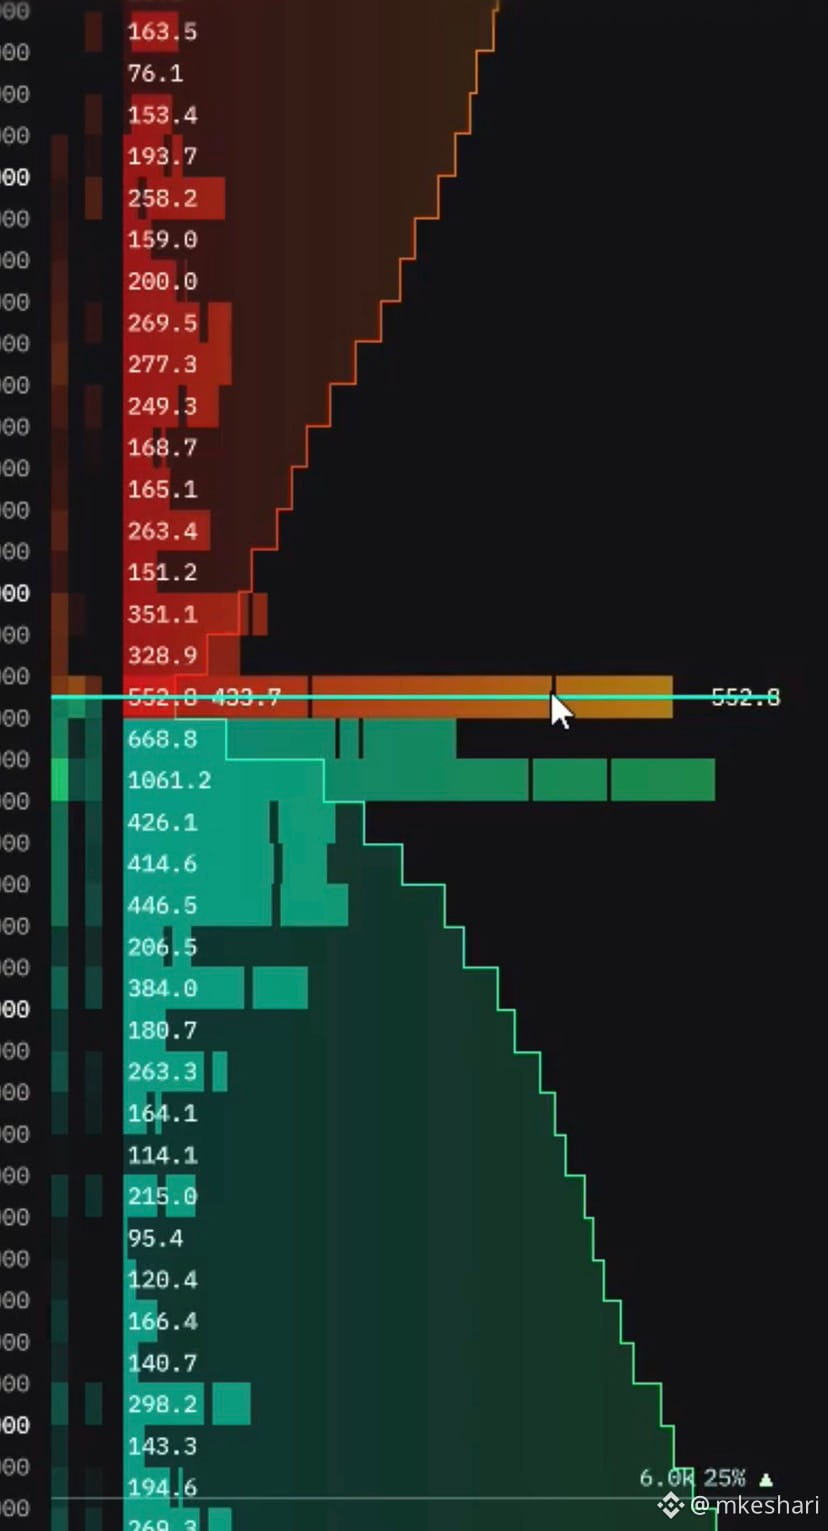
The sell wall above is getting replenished on $BTC still
Somebody wants to hold the ball under water into Midterms
75K bids are also thick absorbing the selling pressure for now. Price is stable around 77.4K into US open.
{spot}(BTCUSDT)
The sell wall above is getting replenished on $BTC still
Somebody wants to hold the ball under water into Midterms
75K bids are also thick absorbing the selling pressure for now. Price is stable around 77.4K into US open.
Somebody wants to hold the ball under water into Midterms
75K bids are also thick absorbing the selling pressure for now. Price is stable around 77.4K into US open.
1
2
675
·
--
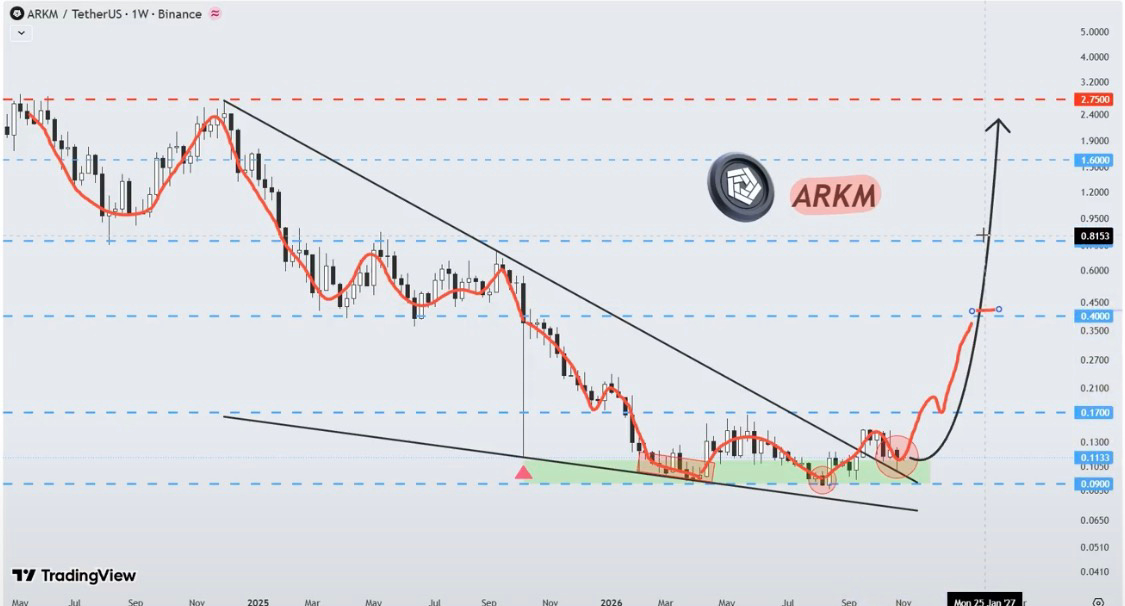
$ARKM Wedge Retest Confirmed. Buyers Are Stepping In 📈
Arkham is poised to rebound from the broken falling wedge on the weekly chart, as solid buyer demand is building at this zone.
The structure is clean, the retest is holding, and the growing buying pressure is impossible to ignore.
Target levels after a bounce:
🎯 $0.17
🎯 $0.40
🎯 $0.78
🎯 $1.60
🎯 $2.75
{spot}(ARKMUSDT)
$ARKM Wedge Retest Confirmed. Buyers Are Stepping In 📈
Arkham is poised to rebound from the broken falling wedge on the weekly chart, as solid buyer demand is building at this zone.
The structure is clean, the retest is holding, and the growing buying pressure is impossible to ignore.
Target levels after a bounce:
🎯 $0.17
🎯 $0.40
🎯 $0.78
🎯 $1.60
🎯 $2.75
Arkham is poised to rebound from the broken falling wedge on the weekly chart, as solid buyer demand is building at this zone.
The structure is clean, the retest is holding, and the growing buying pressure is impossible to ignore.
Target levels after a bounce:
🎯 $0.17
🎯 $0.40
🎯 $0.78
🎯 $1.60
🎯 $2.75
3
239
·
--
mkeshari
·
--
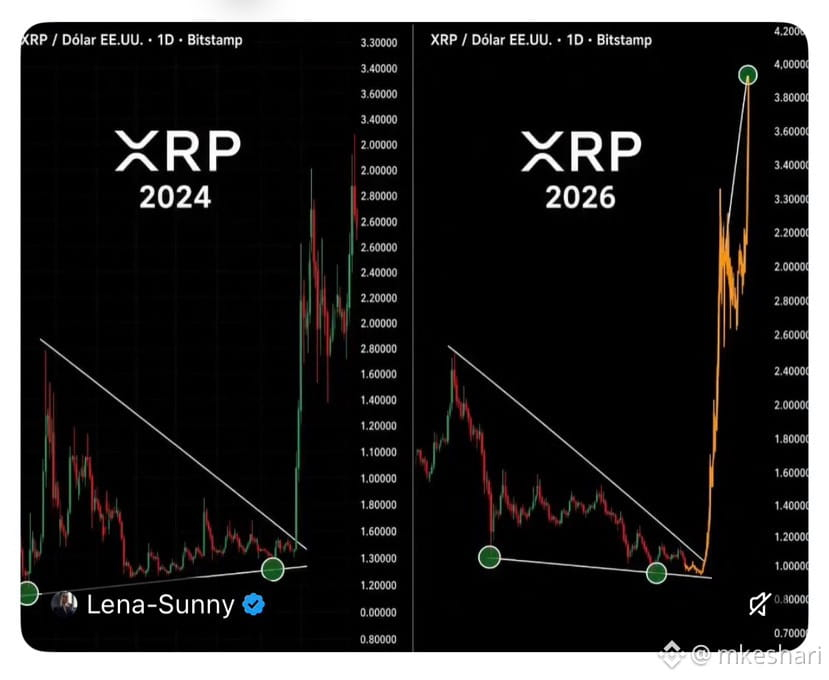
I changed my 2026-27 Stragedy for $XRP #XRPRealityCheck
2
69
·
--
I changed my 2026-27 Stragedy for $XRP #XRPRealityCheck
I changed my 2026-27 Stragedy for $XRP #XRPRealityCheck
1
3
251
·
--
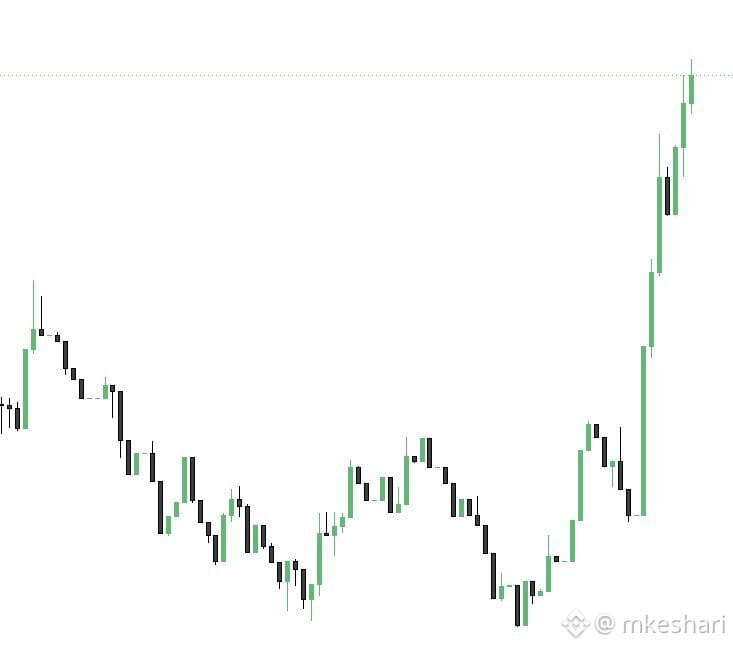
Look at $QNT pumping on the latest US–Iran war news. 👍
{spot}(QNTUSDT)
Look at $QNT pumping on the latest US–Iran war news. 👍
2
2
821
·
--
🚀 $MITO Bullish Momentum Builds – But Can It Break Resistance?
$MITO has shown impressive short-term momentum, driven by strong capital inflows and increased buying activity.
📊 What’s Driving the Move?
🟢 Strong Capital Inflows: Net spot inflows surged to +$277K, including +$109K from large orders, pushing the price to an intraday high of $0.00899.
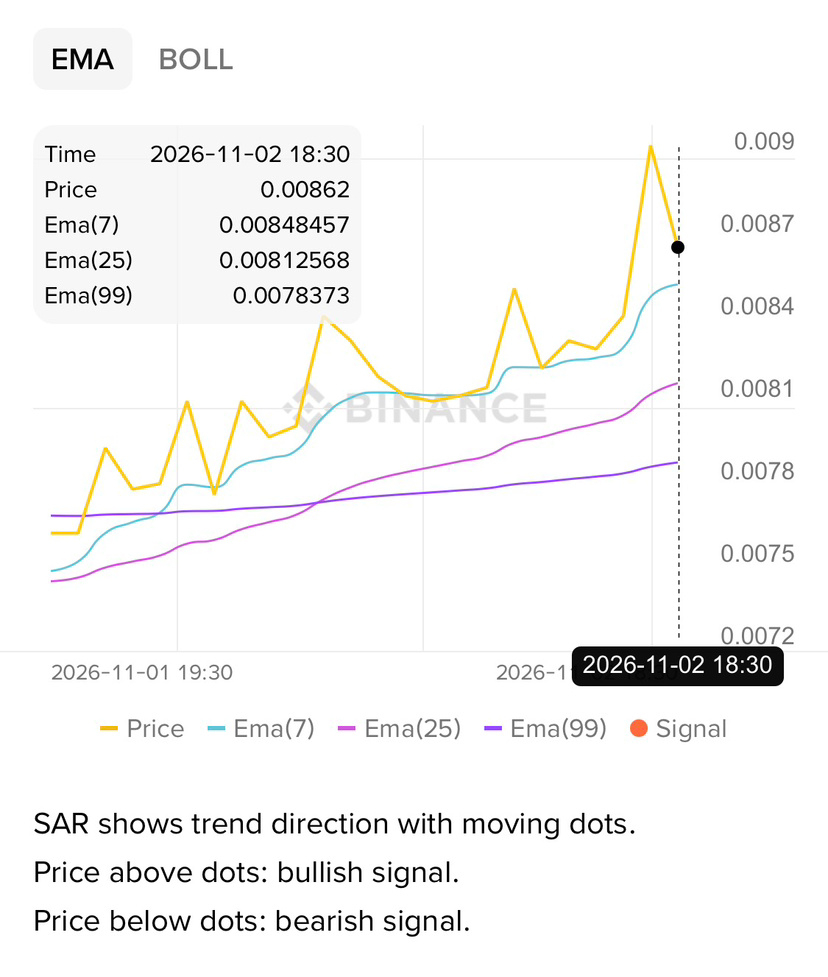
🟢 Bullish EMA Structure: Price is trading above all three key EMAs:
* EMA 7: $0.00848
* EMA 25: $0.00813
* EMA 99: $0.00784
This alignment indicates a positive short-term trend.
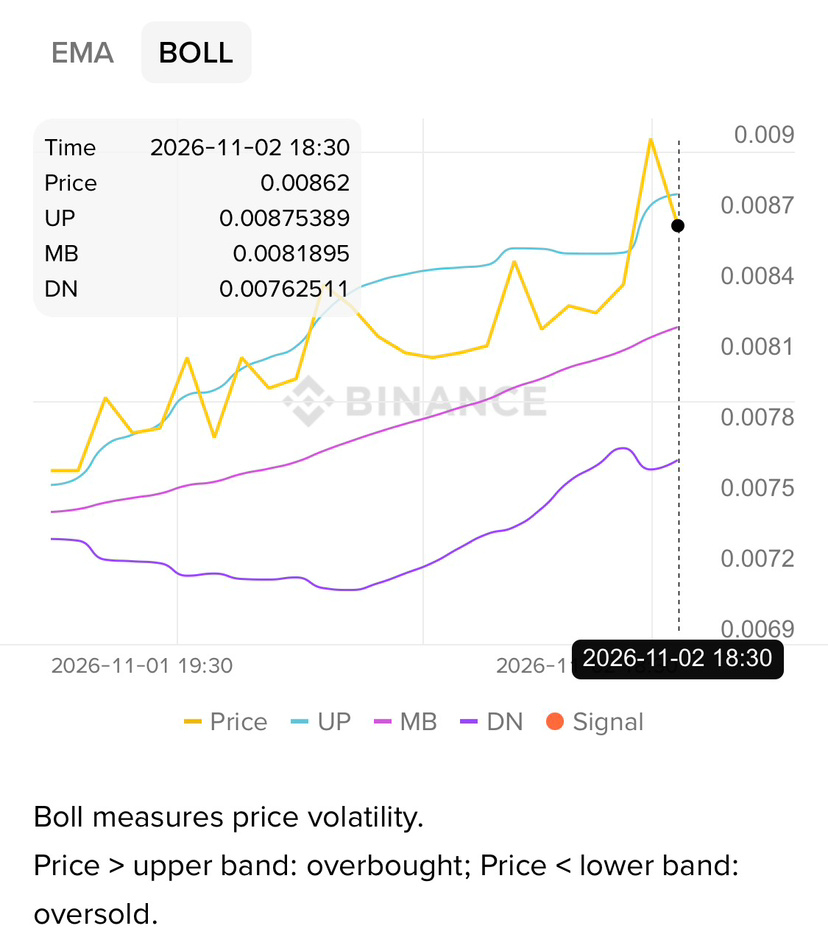
🟢 Bollinger Band Momentum: Price moved above the upper Bollinger Band, signalling strong buying pressure, although a pullback followed.
⚠️ Key Risks to Watch:
* Recent rejection near $0.00899 suggests potential resistance.
* Supply overhang remains a concern, with over 51.2% of total supply still locked.
* Declining TVL and liquidity could affect long-term ecosystem growth.
* Profit-taking may increase following the recent rally.
🎯 Key Price Levels to Watch:
* Resistance: $0.00899
* Current reference price: $0.00862
* EMA 7 support: $0.00848
* EMA 25 support: $0.00813
* EMA 99 support: $0.00784
Our Take: $MITO currently maintains a bullish short-term technical structure, but the recent pullback shows that volatility remains high. A sustained move above $0.00899 could strengthen the bullish case, while losing key EMA support levels may invite further downside.
🔥 The next move could be crucial. Watch volume, capital flows and price reaction around resistance.
Are you bullish or bearish on $MITO?
👇 Share your thoughts!
#MITO
{spot}(MITOUSDT)
🚀 $MITO Bullish Momentum Builds – But Can It Break Resistance?
$MITO has shown impressive short-term momentum, driven by strong capital inflows and increased buying activity.
📊 What’s Driving the Move?
🟢 Strong Capital Inflows: Net spot inflows surged to +$277K, including +$109K from large orders, pushing the price to an intraday high of $0.00899.
🟢 Bullish EMA Structure: Price is trading above all three key EMAs:
* EMA 7: $0.00848
* EMA 25: $0.00813
* EMA 99: $0.00784
This alignment indicates a positive short-term trend.
🟢 Bollinger Band Momentum: Price moved above the upper Bollinger Band, signalling strong buying pressure, although a pullback followed.
⚠️ Key Risks to Watch:
* Recent rejection near $0.00899 suggests potential resistance.
* Supply overhang remains a concern, with over 51.2% of total supply still locked.
* Declining TVL and liquidity could affect long-term ecosystem growth.
* Profit-taking may increase following the recent rally.
🎯 Key Price Levels to Watch:
* Resistance: $0.00899
* Current reference price: $0.00862
* EMA 7 support: $0.00848
* EMA 25 support: $0.00813
* EMA 99 support: $0.00784
Our Take: $MITO currently maintains a bullish short-term technical structure, but the recent pullback shows that volatility remains high. A sustained move above $0.00899 could strengthen the bullish case, while losing key EMA support levels may invite further downside.
🔥 The next move could be crucial. Watch volume, capital flows and price reaction around resistance.
Are you bullish or bearish on $MITO ?
👇 Share your thoughts!
#MITO
$MITO has shown impressive short-term momentum, driven by strong capital inflows and increased buying activity.
📊 What’s Driving the Move?
🟢 Strong Capital Inflows: Net spot inflows surged to +$277K, including +$109K from large orders, pushing the price to an intraday high of $0.00899.
🟢 Bullish EMA Structure: Price is trading above all three key EMAs:
* EMA 7: $0.00848
* EMA 25: $0.00813
* EMA 99: $0.00784
This alignment indicates a positive short-term trend.
🟢 Bollinger Band Momentum: Price moved above the upper Bollinger Band, signalling strong buying pressure, although a pullback followed.
⚠️ Key Risks to Watch:
* Recent rejection near $0.00899 suggests potential resistance.
* Supply overhang remains a concern, with over 51.2% of total supply still locked.
* Declining TVL and liquidity could affect long-term ecosystem growth.
* Profit-taking may increase following the recent rally.
🎯 Key Price Levels to Watch:
* Resistance: $0.00899
* Current reference price: $0.00862
* EMA 7 support: $0.00848
* EMA 25 support: $0.00813
* EMA 99 support: $0.00784
Our Take: $MITO currently maintains a bullish short-term technical structure, but the recent pullback shows that volatility remains high. A sustained move above $0.00899 could strengthen the bullish case, while losing key EMA support levels may invite further downside.
🔥 The next move could be crucial. Watch volume, capital flows and price reaction around resistance.
Are you bullish or bearish on $MITO ?
👇 Share your thoughts!
#MITO
2
184
·
--
Suggest me the best coin to invest 700 USDT in next 2 days 😌
$QNT $SHIB $BTC
{spot}(BTCUSDT)
{spot}(SHIBUSDT)
{spot}(QNTUSDT)
Suggest me the best coin to invest 700 USDT in next 2 days 😌
$QNT $SHIB $BTC
$QNT $SHIB $BTC
QNT
65%
SHIB
17%
BTC
15%
Suggest Me 😐
3%
117 ຄະແນນສຽງ • ປິດລົງຄະແນນສຽງ
2
3
2k
ເຂົ້າສູ່ລະບົບເພື່ອສຳຫຼວດເນື້ອຫາເພີ່ມເຕີມ
ເຂົ້າຮ່ວມກຸ່ມຜູ້ໃຊ້ຄຣິບໂຕທົ່ວໂລກໃນ Binance Square.
⚡️ ໄດ້ຮັບຂໍ້ມູນຫຼ້າສຸດ ແລະ ທີ່ມີປະໂຫຍດກ່ຽວກັບຄຣິບໂຕ.
💬 ໄດ້ຮັບຄວາມໄວ້ວາງໃຈຈາກຕະຫຼາດແລກປ່ຽນຄຣິບໂຕທີ່ໃຫຍ່ທີ່ສຸດໃນໂລກ.
👍 ຄົ້ນຫາຂໍ້ມູນເຊີງເລິກທີ່ແທ້ຈາກນັກສ້າງທີ່ໄດ້ຮັບການຢືນຢັນ.
ອີເມວ / ເບີໂທລະສັບ
ຫົວຂໍ້ທີ່ກໍາລັງນິຍົມ
CPITestsDecemberRateOutlook
733,970 ຄັ້ງທີ່ເບິ່ງ
3,530 ກຳລັງສົນທະນາ
October CPI Seen Up 0.3%, Keeping Fed on Course for December Rate Increase
Binance News
·8 ຖືກໃຈ
·9.4k ຄັ້ງທີ່ເບິ່ງ
NvidiaInvestigatesAfterHuang’sAffairApology
289,991 ຄັ້ງທີ່ເບິ່ງ
2,274 ກຳລັງສົນທະນາ
AnthropicRejectsIPODelayValuationinQuestion
78,363 ຄັ້ງທີ່ເບິ່ງ
729 ກຳລັງສົນທະນາ