
MarOne1
17 ໂພສ

MarOne1
Web3 Content Strategist //Crypto Trader/Analyst 📈 // KOL // Ambassador
ເປີດການຊື້ຂາຍ
ຜູ້ຊື້ຂາຍຊົ່ວຄາວ
4.9 ປີ
34 ກໍາລັງຕິດຕາມ
24 ຜູ້ຕິດຕາມ
38 Liked
ໂພສ
Portfolio
How Liquidity and Farming on STON.fi Works
Ever swap a token and watch the price move before it even confirms? That happens when a pool lacks liquidity.
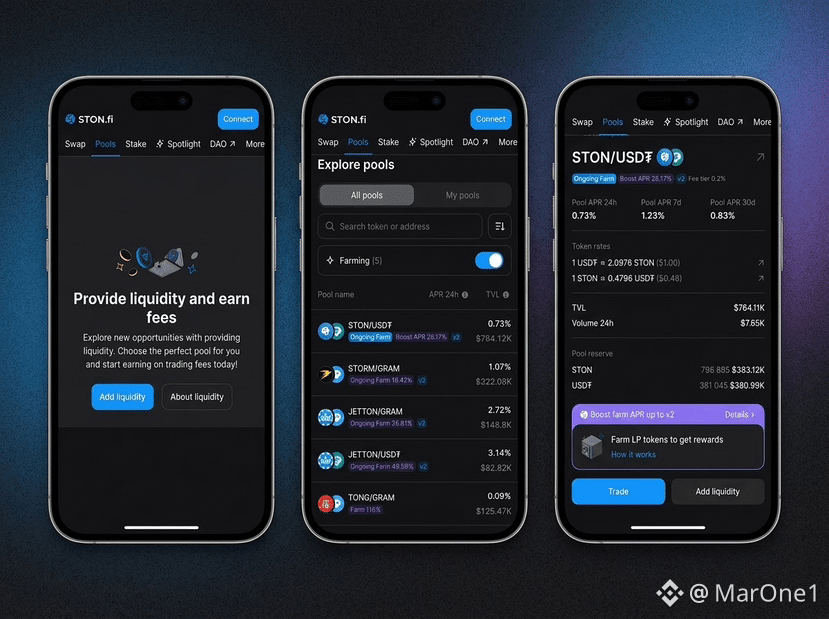
On STON.fi, users deposit two tokens into a pool, and traders swap against that liquidity. In return, providers earn a share of the fees. But fees alone are usually small, so STON.fi adds farming on top, extra rewards for keeping liquidity in instead of pulling it out early.
Example: STON/USDT offers a farm boost of 28.17 percent, backed by around $764,000 in liquidity. Solid combination. Compare that to a pool with a 49.58 percent farm rate but only $83,000 locked. Higher reward, higher risk.
The lesson: don't just chase the biggest APR. Check how deep the pool actually is before adding liquidity.
Farming isn't free yield. It's a reward for helping keep the market liquid. Always check the terms before committing funds. Not financial advice.
Explore STONfi: app.ston.fi
Try STONfi Pools: app.ston.fi/pools?
#GRAM #STONfi
Ever swap a token and watch the price move before it even confirms? That happens when a pool lacks liquidity.
On STON.fi, users deposit two tokens into a pool, and traders swap against that liquidity. In return, providers earn a share of the fees. But fees alone are usually small, so STON.fi adds farming on top, extra rewards for keeping liquidity in instead of pulling it out early.
Example: STON/USDT offers a farm boost of 28.17 percent, backed by around $764,000 in liquidity. Solid combination. Compare that to a pool with a 49.58 percent farm rate but only $83,000 locked. Higher reward, higher risk.
The lesson: don't just chase the biggest APR. Check how deep the pool actually is before adding liquidity.
Farming isn't free yield. It's a reward for helping keep the market liquid. Always check the terms before committing funds. Not financial advice.
Explore STONfi: app.ston.fi
Try STONfi Pools: app.ston.fi/pools?
#GRAM #STONfi
Hyperliquid perpetual futures are now accessible directly through Telegram via WenLong.
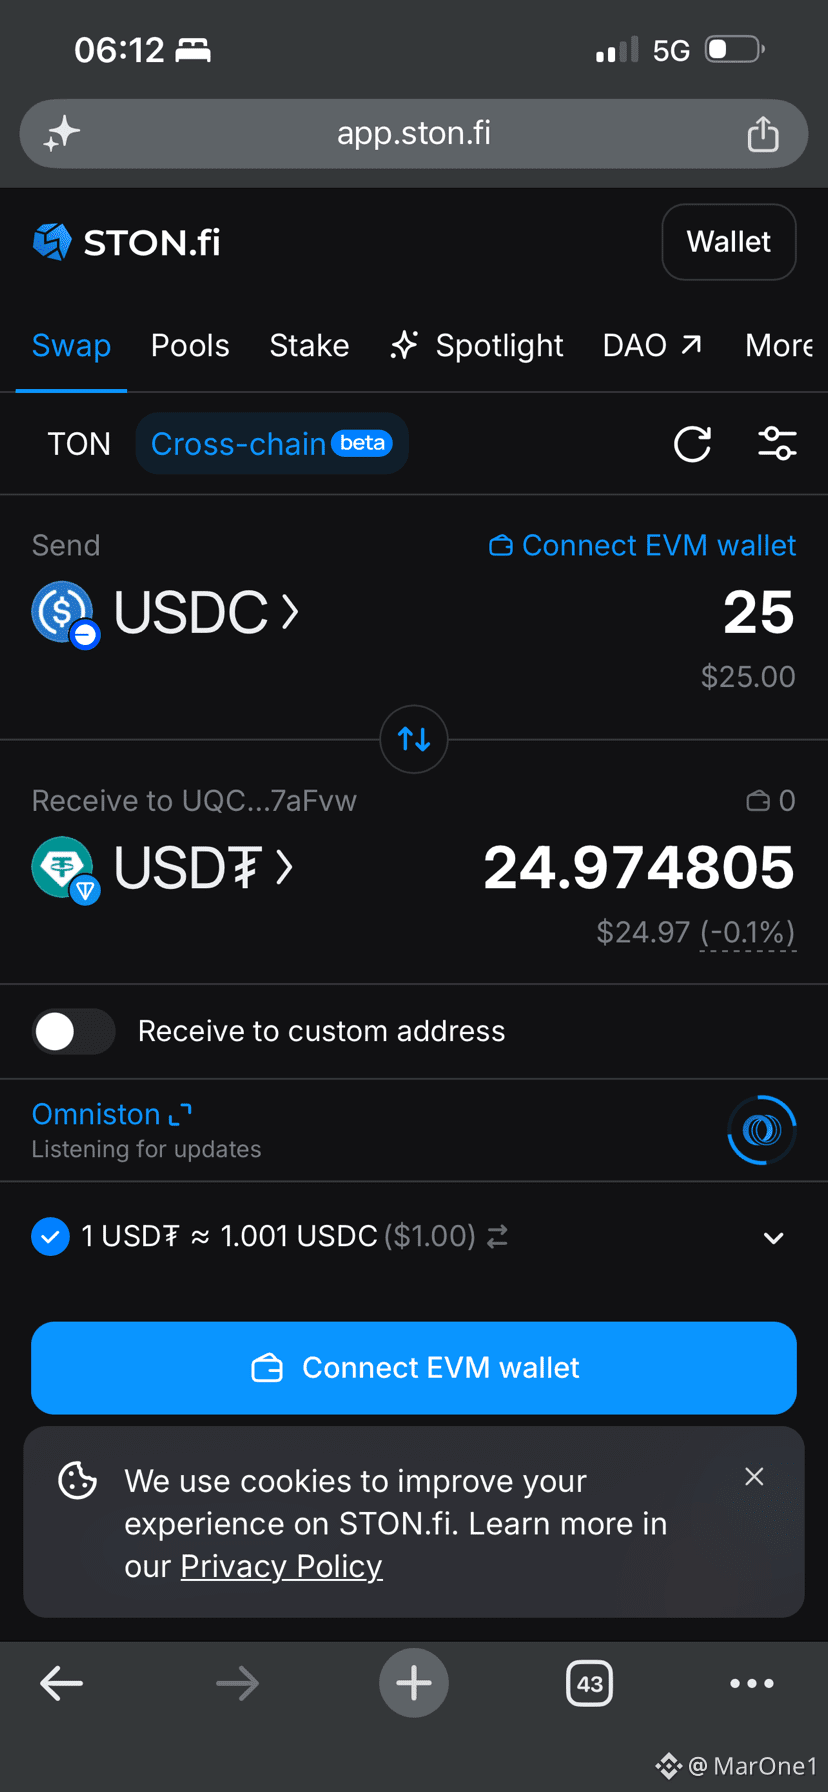
Users can deposit USDT or GRAM on TON and open leveraged positions in a single flow. Behind the scenes, STON.fi’s Omniston handles the cross-chain routing, including converting TON USDT to USDC on Arbitrum and moving the funds into Hyperliquid.
What stands out to me is how infrastructure like this can remove some of the friction that often comes with moving assets across networks.
Instead of users having to deal with multiple bridges, swaps, and separate steps, the underlying infrastructure takes care of the complexity in the background. That is the kind of progress that can make Web3 applications feel much more accessible.
WenLong is an independent application using STON.fi infrastructure. STON.fi is not affiliated with or endorsing WenLong.
Perpetual futures involve significant risk. Always do your own research.
👉 https://t.me/whenlongbot
👉 app.ston.fi
#STONfi
Users can deposit USDT or GRAM on TON and open leveraged positions in a single flow. Behind the scenes, STON.fi’s Omniston handles the cross-chain routing, including converting TON USDT to USDC on Arbitrum and moving the funds into Hyperliquid.
What stands out to me is how infrastructure like this can remove some of the friction that often comes with moving assets across networks.
Instead of users having to deal with multiple bridges, swaps, and separate steps, the underlying infrastructure takes care of the complexity in the background. That is the kind of progress that can make Web3 applications feel much more accessible.
WenLong is an independent application using STON.fi infrastructure. STON.fi is not affiliated with or endorsing WenLong.
Perpetual futures involve significant risk. Always do your own research.
👉 https://t.me/whenlongbot
👉 app.ston.fi
#STONfi

I used to check multiple TON DEXs manually to find the best swap rate.
That changed when I started using Omniston on STON.fi.
Omniston aggregates liquidity from multiple sources, including STON.fi pools, TON AMMs and dedicated resolvers. It compares available quotes and routes your swap through the best executable option.
The key benefits:
➠ Better pricing and lower slippage
➠ Multiple liquidity sources in one interface
➠ Supports both TON and cross-chain swaps
➠ Cross-chain swaps use atomic HTLC settlement, so funds either complete the swap or can be refunded
➠ No wrapped tokens or custodial bridges
The process is simple: choose your assets, enter the amount, review the best quote and confirm in your wallet.
For anyone trading on TON or moving assets across chains, Omniston is a useful layer to understand.
Always check the quote before confirming and DYOR.
👉 Explore Swaps/Cross Chain: app.ston.fi/swap
👉 Explore STONFI: app.ston.fi
That changed when I started using Omniston on STON.fi.
Omniston aggregates liquidity from multiple sources, including STON.fi pools, TON AMMs and dedicated resolvers. It compares available quotes and routes your swap through the best executable option.
The key benefits:
➠ Better pricing and lower slippage
➠ Multiple liquidity sources in one interface
➠ Supports both TON and cross-chain swaps
➠ Cross-chain swaps use atomic HTLC settlement, so funds either complete the swap or can be refunded
➠ No wrapped tokens or custodial bridges
The process is simple: choose your assets, enter the amount, review the best quote and confirm in your wallet.
For anyone trading on TON or moving assets across chains, Omniston is a useful layer to understand.
Always check the quote before confirming and DYOR.
👉 Explore Swaps/Cross Chain: app.ston.fi/swap
👉 Explore STONFI: app.ston.fi
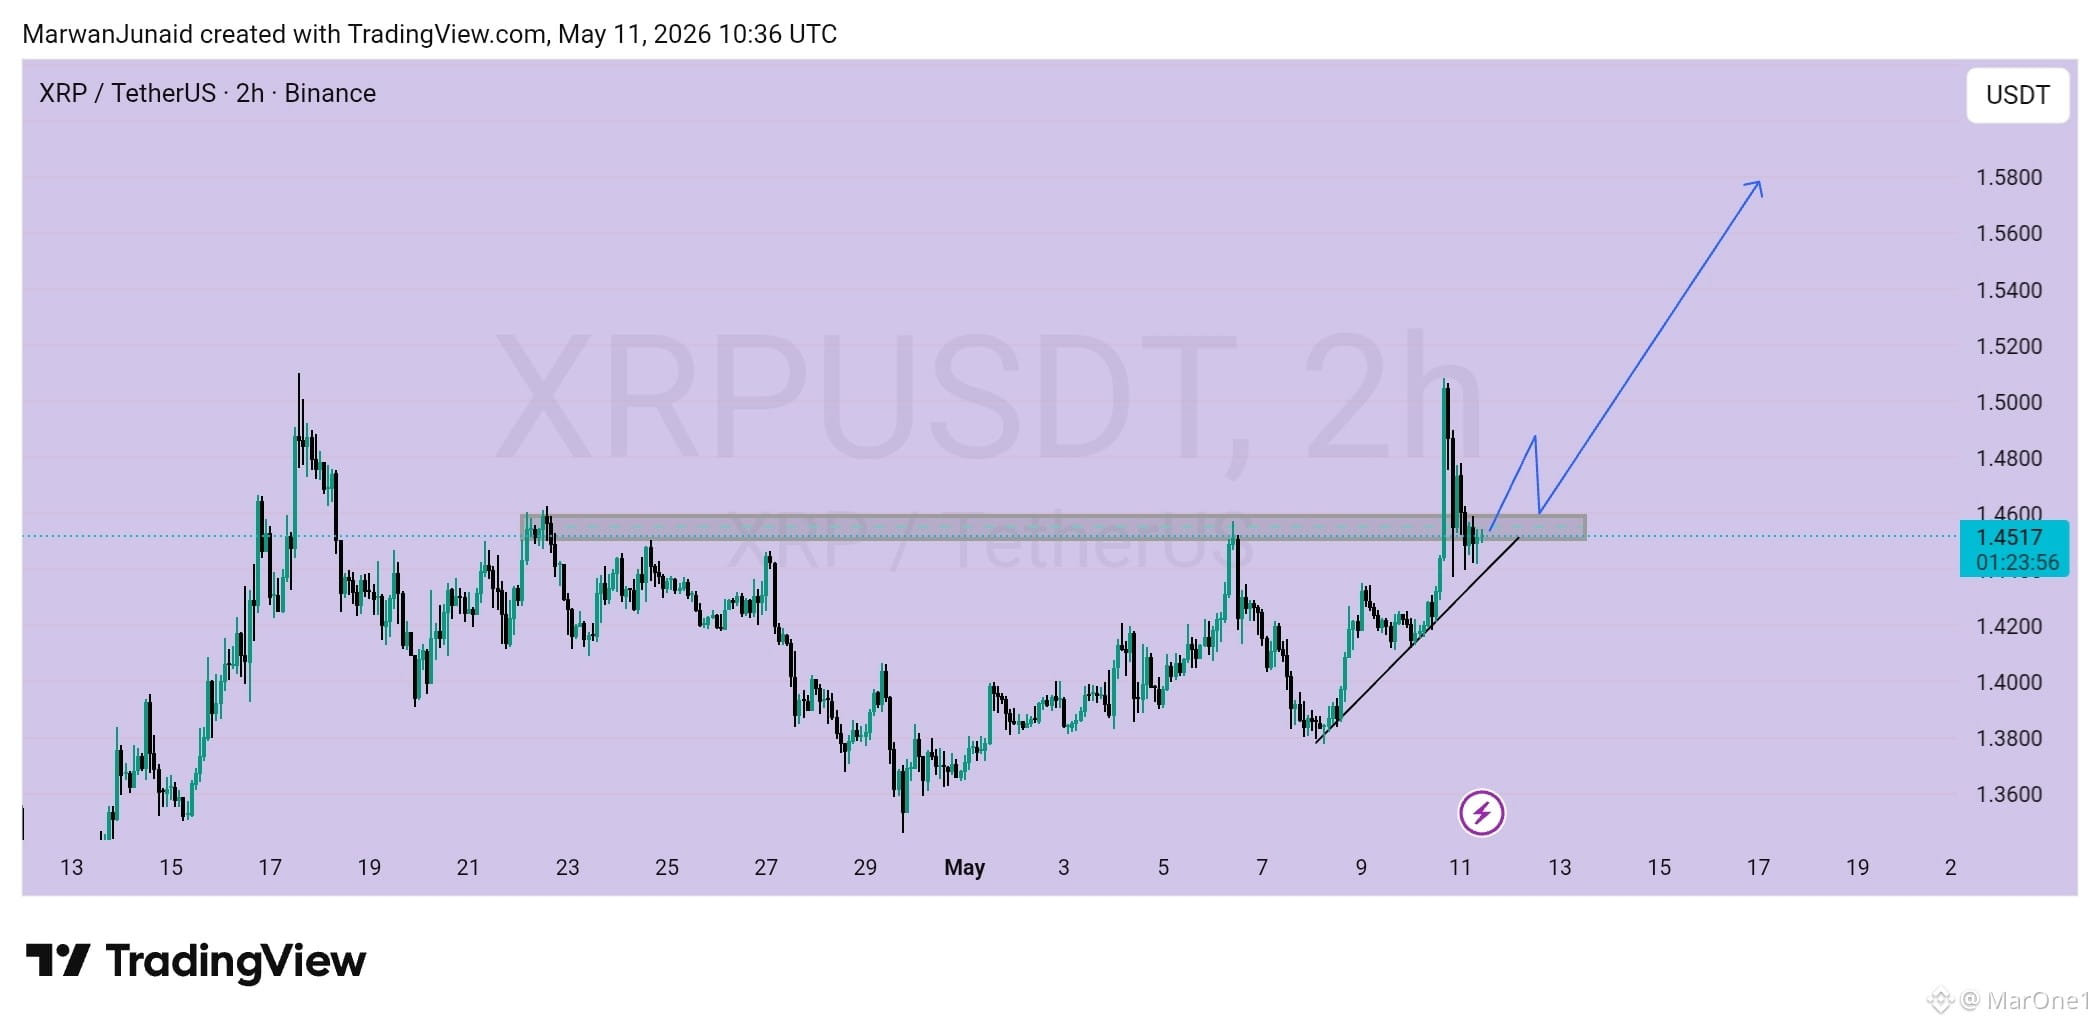
The $XRP 2h chart shows an aggressive breakout above a long-term resistance zone, followed by a retest. The price is currently holding above the $1.45 support level, forming a potential "break and retest" bullish pattern.
Market Analysis:
After a sharp rally to $1.50, the price has pulled back to validate the previous resistance zone (gray box) as new support. This coincides with a rising local trendline, suggesting strong buying interest at this level.
- Bullish Case: Staying above $1.45 confirms the breakout. If the price holds this support and moves past the recent peak, it validates the blue projection line toward higher targets.
- Bearish Case: A break back below $1.44 would suggest a fakeout, likely leading to a drop toward the next support at $1.40.
Trade Setup:
- Entry: Buy positions are ideal at the current retest level ($1.45) or on a bounce from the ascending trendline.
- Take Profit (TP 1): $1.51 (Recent local high).
- Take Profit (TP 2): $1.58 (Projected target based on the breakout momentum).
- Stop Loss (SL): $1.42. This is set below the support zone and trendline to exit if the bullish structure fails.
Market Analysis:
After a sharp rally to $1.50, the price has pulled back to validate the previous resistance zone (gray box) as new support. This coincides with a rising local trendline, suggesting strong buying interest at this level.
- Bullish Case: Staying above $1.45 confirms the breakout. If the price holds this support and moves past the recent peak, it validates the blue projection line toward higher targets.
- Bearish Case: A break back below $1.44 would suggest a fakeout, likely leading to a drop toward the next support at $1.40.
Trade Setup:
- Entry: Buy positions are ideal at the current retest level ($1.45) or on a bounce from the ascending trendline.
- Take Profit (TP 1): $1.51 (Recent local high).
- Take Profit (TP 2): $1.58 (Projected target based on the breakout momentum).
- Stop Loss (SL): $1.42. This is set below the support zone and trendline to exit if the bullish structure fails.
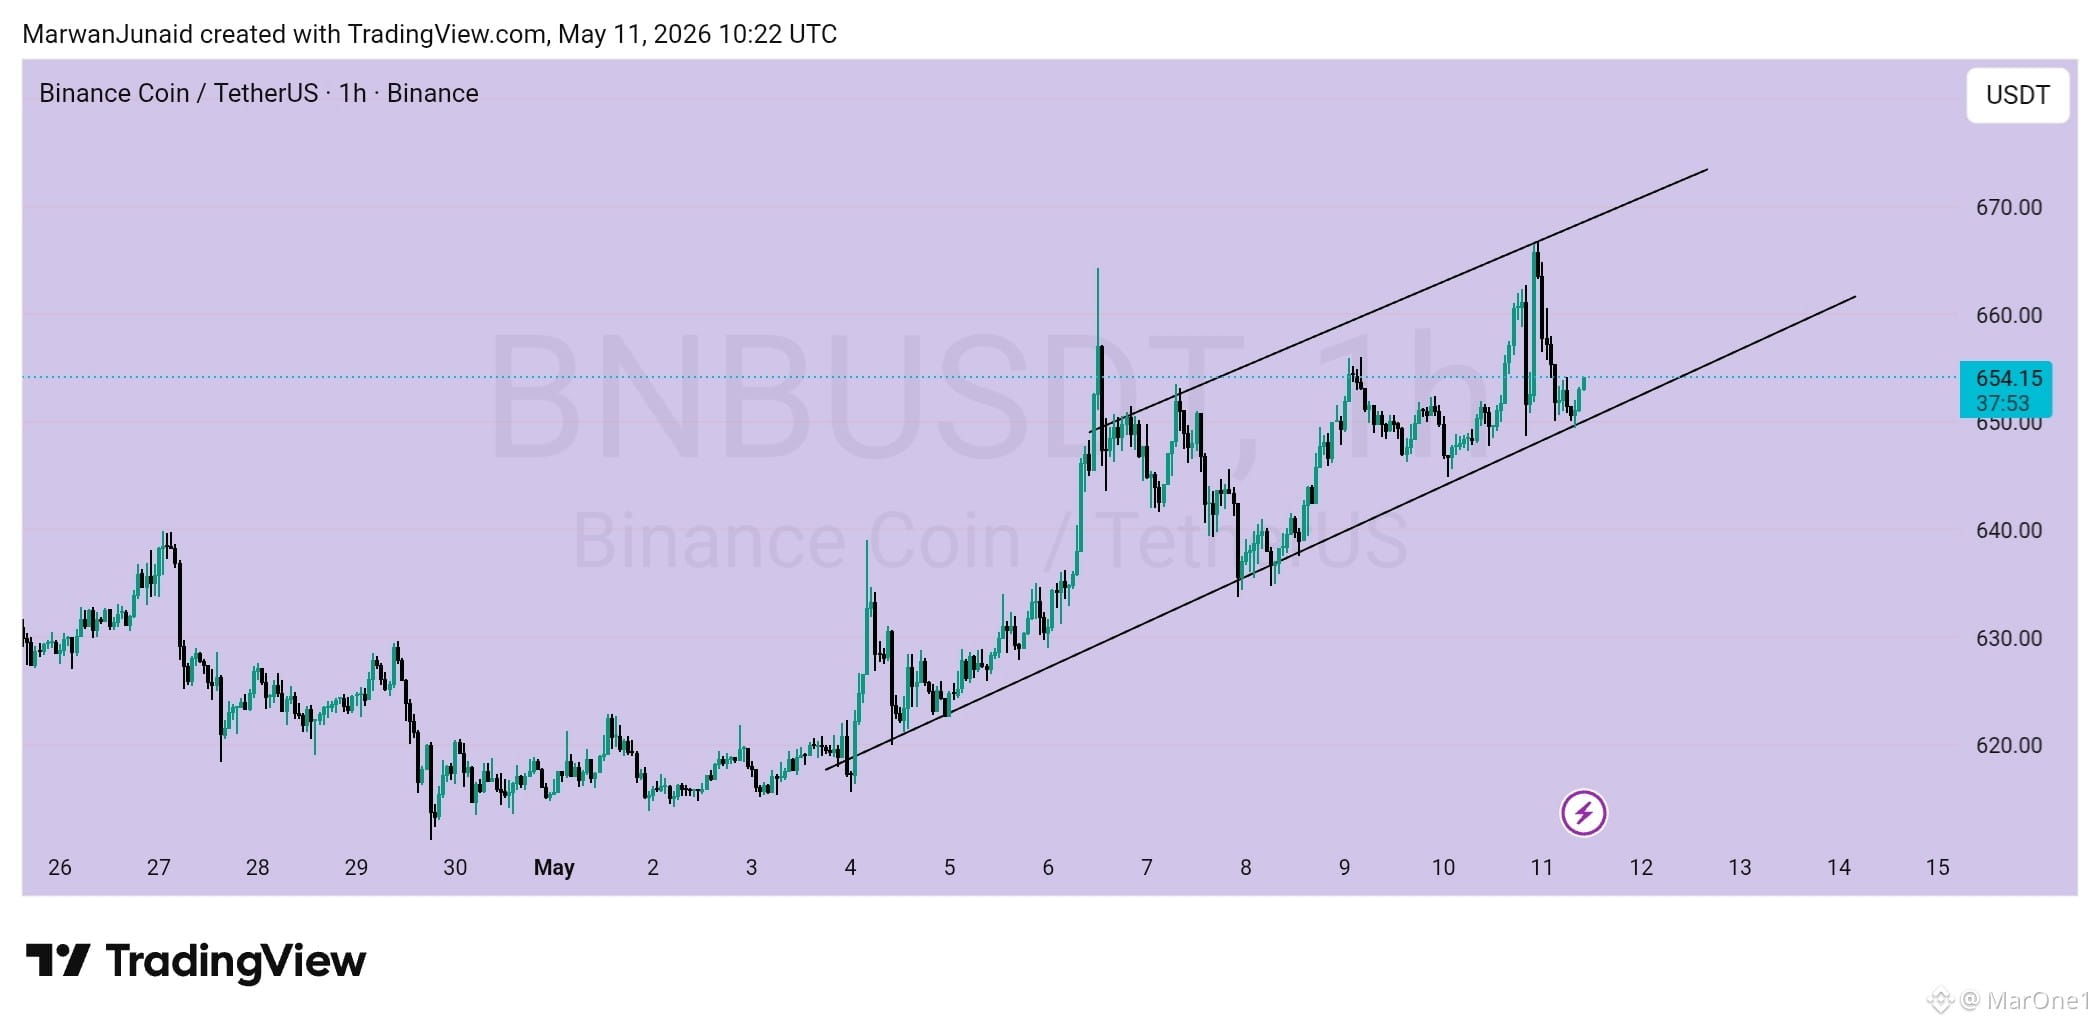
The $BNB 1h chart shows the price moving within an ascending channel, characterized by higher highs and higher lows since early May. The price is currently reacting to the lower support trendline.
Market Analysis:
The price recently faced rejection at the upper boundary near $665 and pulled back to the channel support. It is currently hovering around $654, attempting to maintain its bullish structure.
- Bullish Case: A successful bounce from this lower trendline confirms the continuation of the trend, targeting the mid-line and eventually the upper resistance.
- Bearish Case: A decisive break and close below $650 would signal a breakdown of the channel, potentially leading to a deeper correction toward the $635 support zone.
Trade Setup:
- Entry: Buy positions are favorable at the current support level ($650 - $654) or on a confirmed bounce candle from the trendline.
- Take Profit (TP 1): $665 (Previous swing high and upper channel resistance).
- Take Profit (TP 2): $675 (Extension target if the breakout gains momentum).
- Stop Loss (SL): $644. This is positioned below the recent wick lows and the channel support to protect against a trend reversal.
Market Analysis:
The price recently faced rejection at the upper boundary near $665 and pulled back to the channel support. It is currently hovering around $654, attempting to maintain its bullish structure.
- Bullish Case: A successful bounce from this lower trendline confirms the continuation of the trend, targeting the mid-line and eventually the upper resistance.
- Bearish Case: A decisive break and close below $650 would signal a breakdown of the channel, potentially leading to a deeper correction toward the $635 support zone.
Trade Setup:
- Entry: Buy positions are favorable at the current support level ($650 - $654) or on a confirmed bounce candle from the trendline.
- Take Profit (TP 1): $665 (Previous swing high and upper channel resistance).
- Take Profit (TP 2): $675 (Extension target if the breakout gains momentum).
- Stop Loss (SL): $644. This is positioned below the recent wick lows and the channel support to protect against a trend reversal.
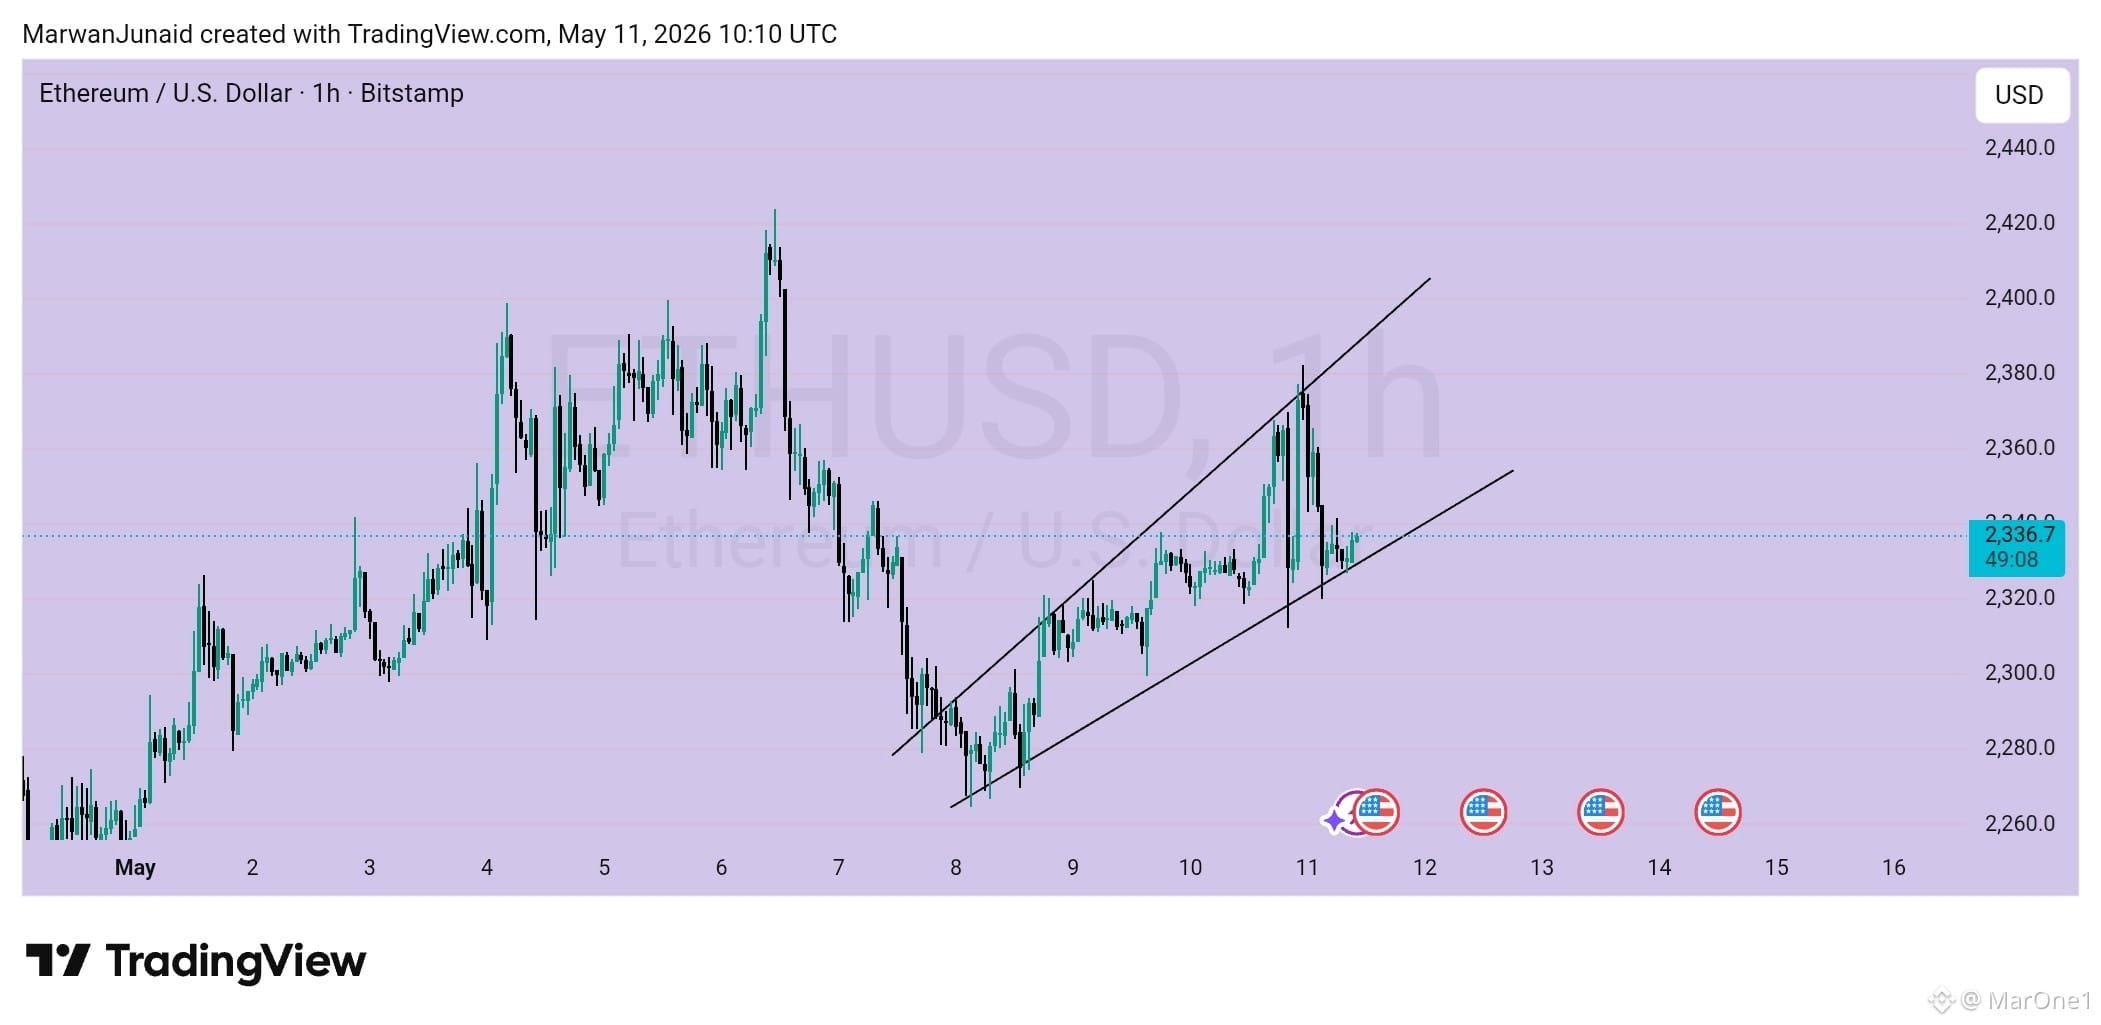
The $ETH 1h chart shows Ethereum trading within an ascending parallel channel, maintaining a bullish structure despite a recent sharp rejection from the upper boundary.
Market Analysis
The price recently touched the top of the channel near $2,380 before pulling back sharply. It is currently finding support at the channel's mid-line (median) around $2,336.
- Bullish Case: If the price holds this mid-level or the bottom trendline, we could see another push to test the channel's resistance.
- Bearish Case: A break below the lower trendline ($2,320 region) would invalidate the ascending structure and likely lead to a retest of the $2,280 support floor.
Trade Setup
- Entry: Long positions can be considered on a successful bounce from the current level ($2,336) or a deeper touch of the lower support line at $2,325.
- Take Profit (TP 1): $2,380 (Recent swing high / Upper channel resistance).
- Take Profit (TP 2): $2,420 (Major horizontal resistance visible from early May).
- Stop Loss (SL): $2,310. This is placed safely below the channel support and the previous minor swing low to account for market volatility.
Market Analysis
The price recently touched the top of the channel near $2,380 before pulling back sharply. It is currently finding support at the channel's mid-line (median) around $2,336.
- Bullish Case: If the price holds this mid-level or the bottom trendline, we could see another push to test the channel's resistance.
- Bearish Case: A break below the lower trendline ($2,320 region) would invalidate the ascending structure and likely lead to a retest of the $2,280 support floor.
Trade Setup
- Entry: Long positions can be considered on a successful bounce from the current level ($2,336) or a deeper touch of the lower support line at $2,325.
- Take Profit (TP 1): $2,380 (Recent swing high / Upper channel resistance).
- Take Profit (TP 2): $2,420 (Major horizontal resistance visible from early May).
- Stop Loss (SL): $2,310. This is placed safely below the channel support and the previous minor swing low to account for market volatility.
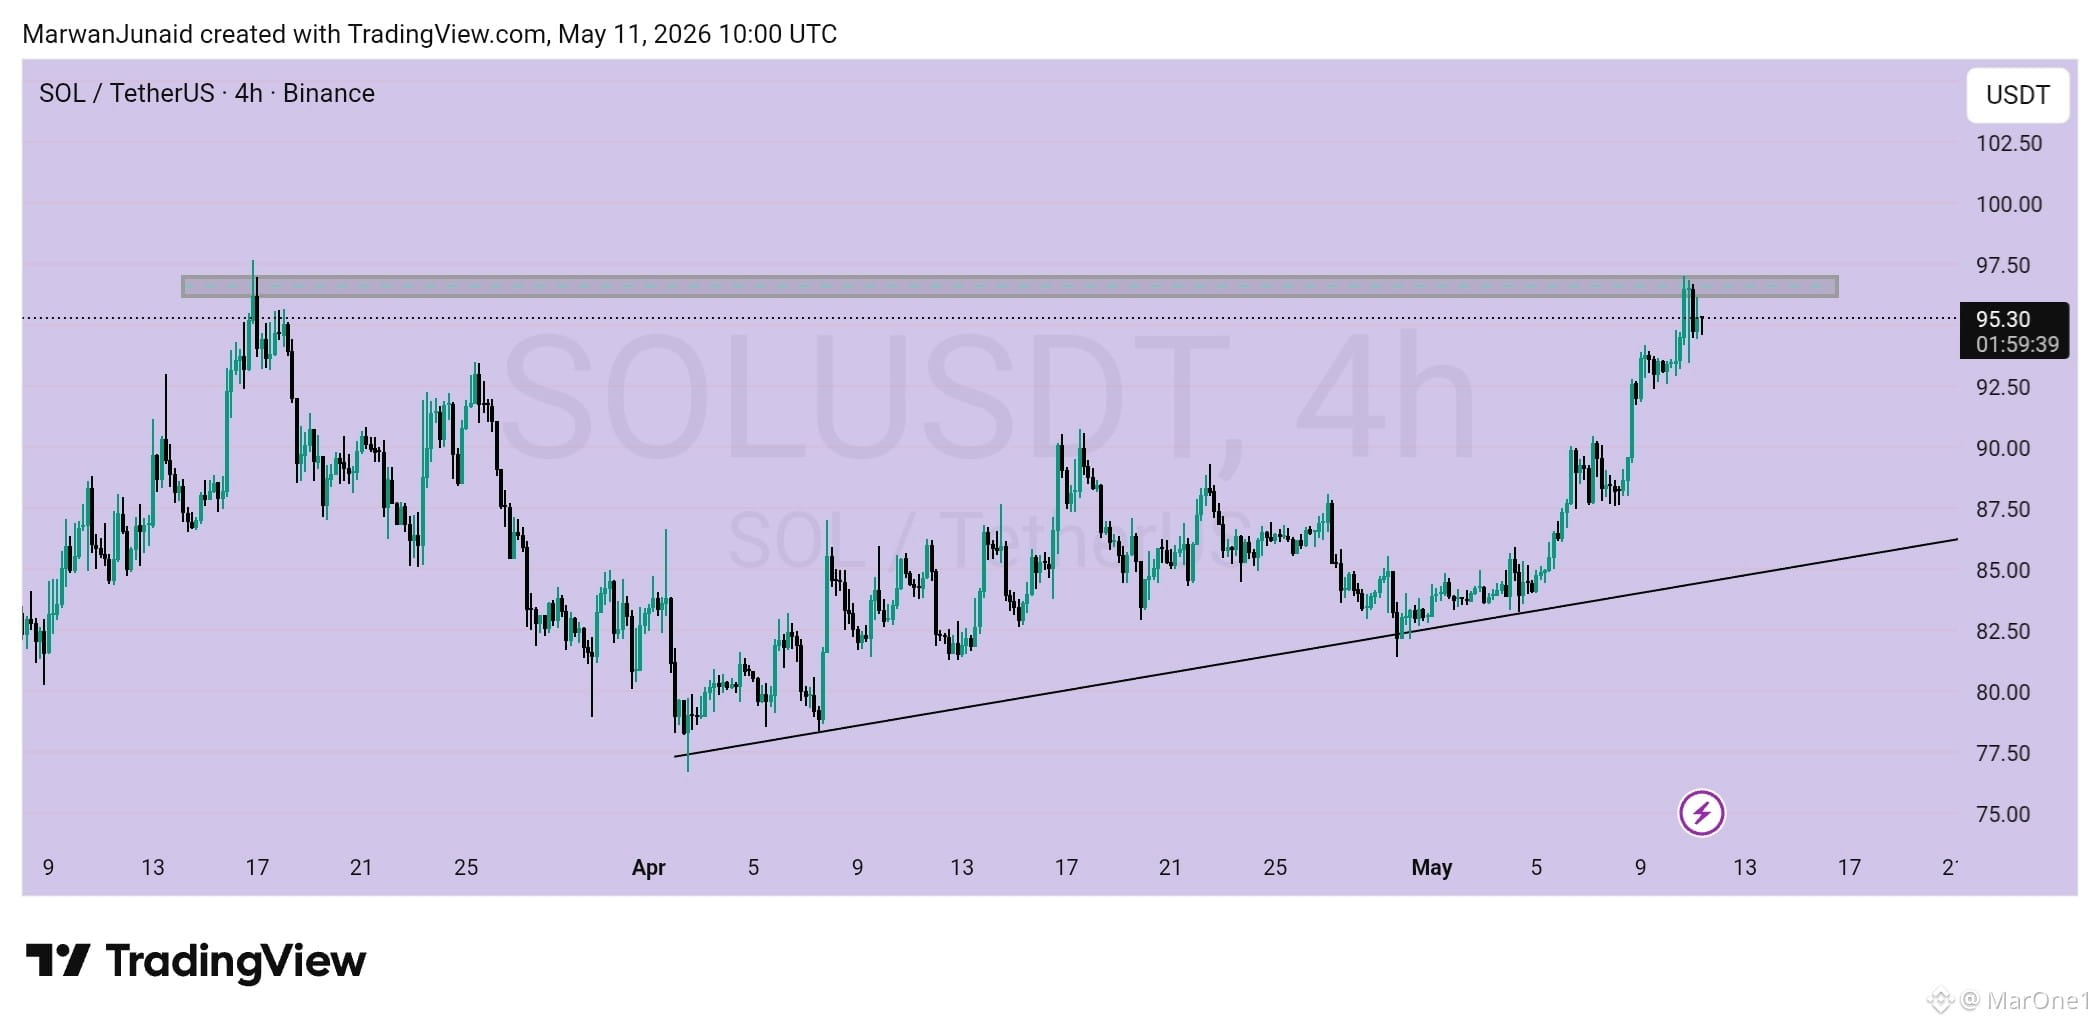
The 4h chart shows $SOL testing a major supply zone between $96.50 and $97.50 after a consistent rally from the ascending trendline.
Analysis: Price is currently consolidating just below resistance; a clean close above $97.5 confirms a breakout, while a rejection could lead to a retest of the lower trendline near $85
Take Profits (TP): Target $102.50 (psychological resistance) and $110.00 if momentum sustains.
Stop Loss (SL): Place below the recent swing low at $89 to protect against a false breakout.
Analysis: Price is currently consolidating just below resistance; a clean close above $97.5 confirms a breakout, while a rejection could lead to a retest of the lower trendline near $85
Take Profits (TP): Target $102.50 (psychological resistance) and $110.00 if momentum sustains.
Stop Loss (SL): Place below the recent swing low at $89 to protect against a false breakout.
GN Everyone!
Blockchain: Building the Future of Finance
Crypto isn’t just hype, it’s changing how people interact with money.
For years, we’ve relied on banks and middlemen to manage everything. Blockchain offers a different path, where you have more control, more transparency, and fewer barriers to access.
It’s not perfect, and it can be confusing at first. But that’s how every big shift starts. What matters is paying attention, learning as you go, and understanding where things are headed.
At the end of the day, blockchain is about giving people more ownership and freedom in a system that hasn’t always been fair.
And the truth is, this is only the beginning.
#BinanceLaunchesGoldvs.BTCTradingCompetition #ADPPayrollsSurge #LayerZeroCEOAdmitsProtocolFailures
Blockchain: Building the Future of Finance
Crypto isn’t just hype, it’s changing how people interact with money.
For years, we’ve relied on banks and middlemen to manage everything. Blockchain offers a different path, where you have more control, more transparency, and fewer barriers to access.
It’s not perfect, and it can be confusing at first. But that’s how every big shift starts. What matters is paying attention, learning as you go, and understanding where things are headed.
At the end of the day, blockchain is about giving people more ownership and freedom in a system that hasn’t always been fair.
And the truth is, this is only the beginning.
#BinanceLaunchesGoldvs.BTCTradingCompetition #ADPPayrollsSurge #LayerZeroCEOAdmitsProtocolFailures

ເຂົ້າສູ່ລະບົບເພື່ອສຳຫຼວດເນື້ອຫາເພີ່ມເຕີມ