

TheChartQueen
4.1k ໂພສ

TheChartQueen
ລາຍງານ
ບລັອກຜູ້ໃຊ້
Trading raw data so you don't have to 📊 A girl, her charts & daily setups. Tips are never expected, but they fuel my 3AM analysis!
ຜູ້ຊື້ຂາຍປະຈໍາ
4.9 ປີ
12 ກໍາລັງຕິດຕາມ
563 ຜູ້ຕິດຕາມ
736 Liked
ໂພສ
ທັງໝົດ
ວົງຢືມ
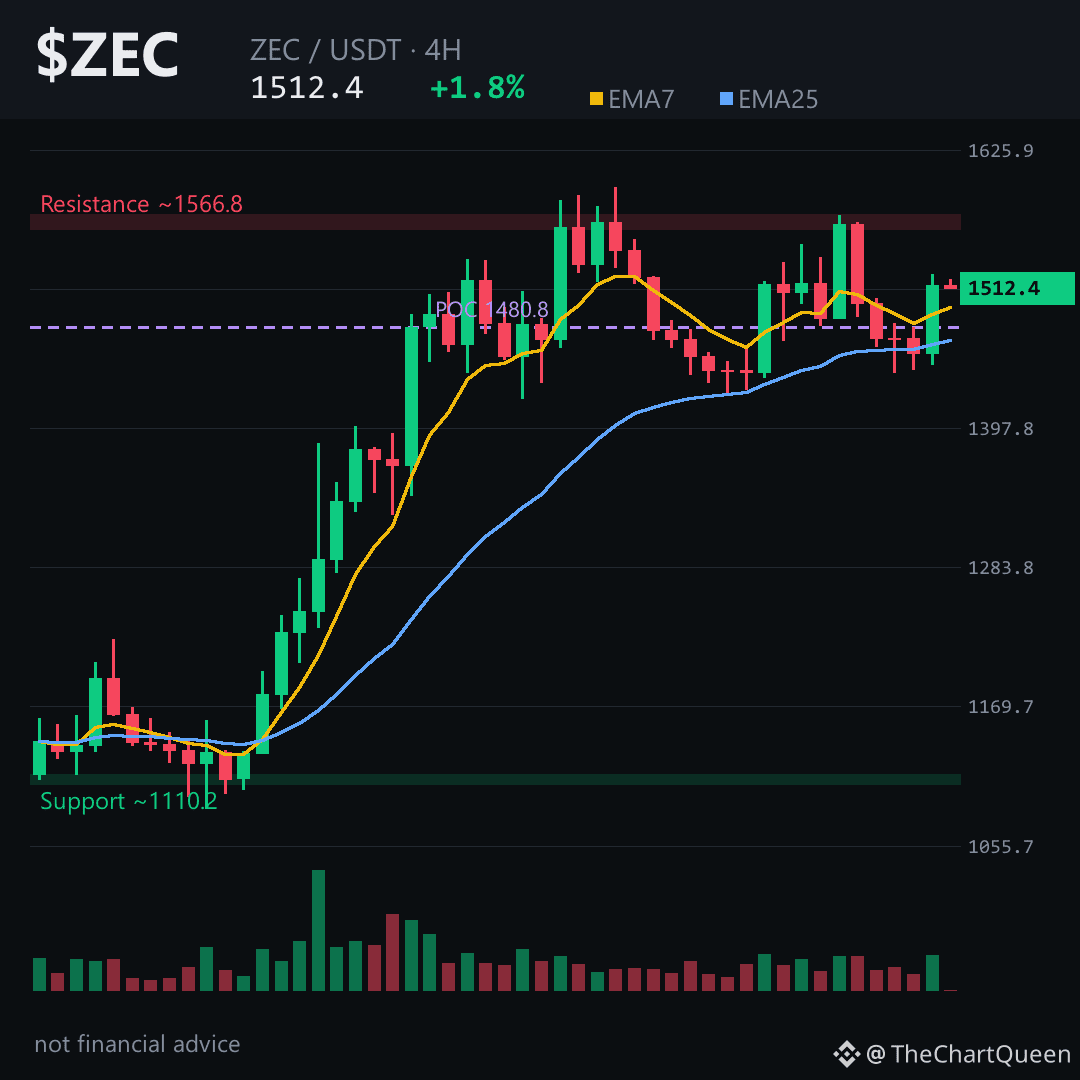
$ZEC printed a 5% 4-hour candle yesterday — and gave back nearly all of it in the next two.
That kind of volatility usually means one thing: the market is deciding whether this level is real.
Price sits around 1508, just above the point of control near 1480 — where the most volume has traded recently. That’s the floor this setup leans on.
Momentum is fading, but the daily shows a large unfilled bullish gap from ~1385 to 1422. That zone acts as a vacuum if 1480 fails.
Funding is slightly positive, but the long/short ratio sits well under one — a contrarian signal that could support a squeeze higher.
The invalidation is clear:
A 4H close below the ~1433 zone and this bullish read is off the table.
Until then, the path of least resistance leans toward ~1644.
Tap $ZEC to pull up the chart and check the 1480 pivot yourself — it has been tested multiple times in the last 48 hours.
My read: structure favors continuation, but only if 1480 holds. Lose that, and the gap near 1400 becomes the real story.
What level are you watching most closely on $ZEC right now? 👇
Follow for the next read on this chart.
⚠️ Not financial advice. DYOR.
#ZEC #Zcash #Crypto #BinanceSquare
$ZEC printed a 5% 4-hour candle yesterday — and gave back nearly all of it in the next two.
That kind of volatility usually means one thing: the market is deciding whether this level is real.
Price sits around 1508, just above the point of control near 1480 — where the most volume has traded recently. That’s the floor this setup leans on.
Momentum is fading, but the daily shows a large unfilled bullish gap from ~1385 to 1422. That zone acts as a vacuum if 1480 fails.
Funding is slightly positive, but the long/short ratio sits well under one — a contrarian signal that could support a squeeze higher.
The invalidation is clear:
A 4H close below the ~1433 zone and this bullish read is off the table.
Until then, the path of least resistance leans toward ~1644.
Tap $ZEC to pull up the chart and check the 1480 pivot yourself — it has been tested multiple times in the last 48 hours.
My read: structure favors continuation, but only if 1480 holds. Lose that, and the gap near 1400 becomes the real story.
What level are you watching most closely on $ZEC right now? 👇
Follow for the next read on this chart.
⚠️ Not financial advice. DYOR.
#ZEC #Zcash #Crypto #BinanceSquare
That kind of volatility usually means one thing: the market is deciding whether this level is real.
Price sits around 1508, just above the point of control near 1480 — where the most volume has traded recently. That’s the floor this setup leans on.
Momentum is fading, but the daily shows a large unfilled bullish gap from ~1385 to 1422. That zone acts as a vacuum if 1480 fails.
Funding is slightly positive, but the long/short ratio sits well under one — a contrarian signal that could support a squeeze higher.
The invalidation is clear:
A 4H close below the ~1433 zone and this bullish read is off the table.
Until then, the path of least resistance leans toward ~1644.
Tap $ZEC to pull up the chart and check the 1480 pivot yourself — it has been tested multiple times in the last 48 hours.
My read: structure favors continuation, but only if 1480 holds. Lose that, and the gap near 1400 becomes the real story.
What level are you watching most closely on $ZEC right now? 👇
Follow for the next read on this chart.
⚠️ Not financial advice. DYOR.
#ZEC #Zcash #Crypto #BinanceSquare
161
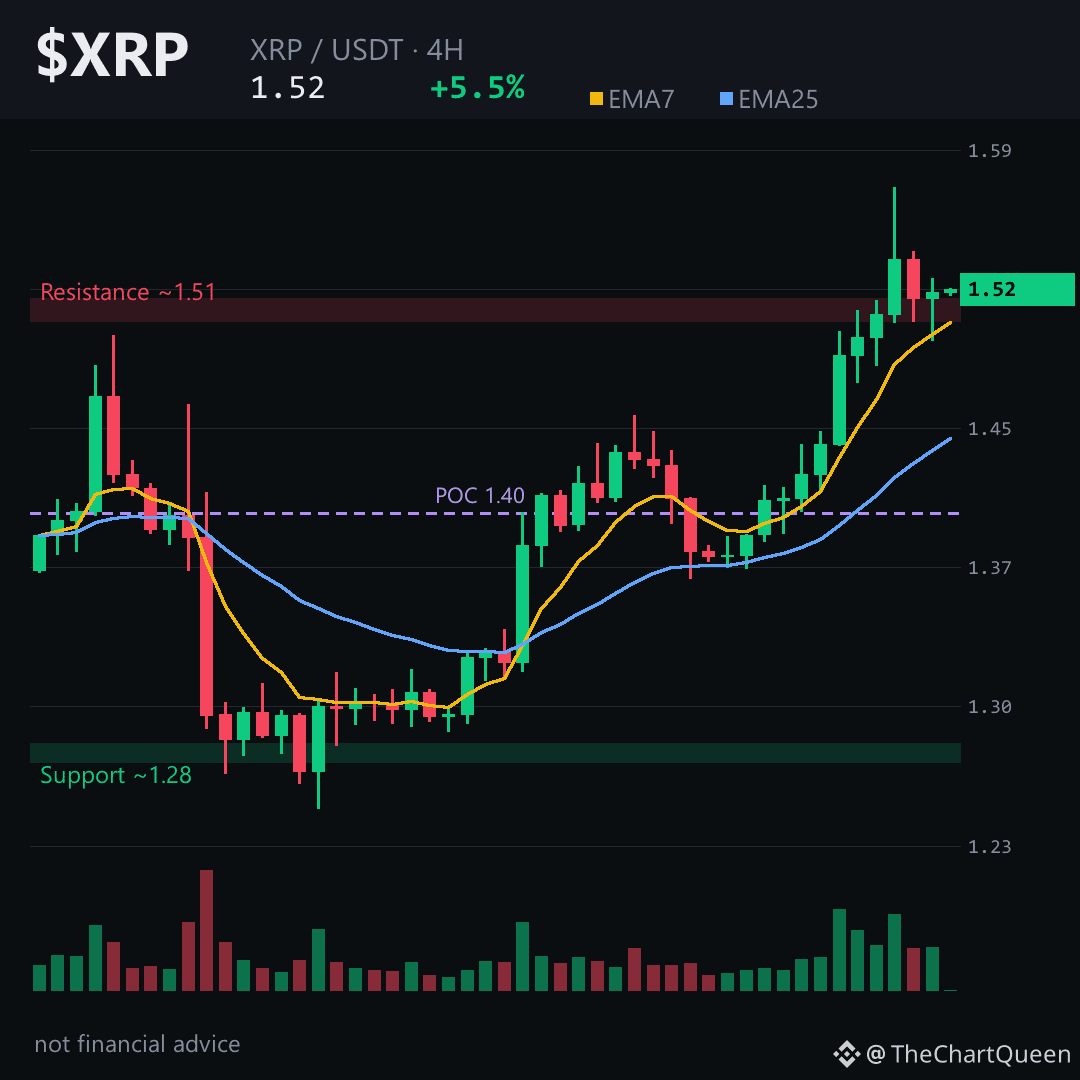
$XRP is up 5.4% in 24 hours and just tagged a 9-month high — but the real story is hiding in that long/short ratio.
Eleven of the last twelve 4H candles closed green. That’s not a grind, that’s an engine. Price broke clean through the daily EMA structure and left an unfilled bullish gap just below — the kind of zone that often acts like a magnet before the next leg.
Here’s the tension: the futures crowd is stacked long, and funding has flipped positive. When everyone’s already leaning one way, the easy move is rarely the one that prints next. That doesn’t kill the trend — but it does raise the stakes on any pullback.
The 4H is the cleanest read. As long as $XRP holds the 1.44 area on a closing basis, the structure stays intact. That’s the line where the thesis breaks — lose it and the unfilled gap below becomes the target instead of the launchpad. If momentum persists, the 1.62 zone is the next logical place price could stretch toward.
My read: the trend is real, but it’s late-stage momentum, not fresh fuel. The risk sits in chasing strength after an 11-candle sprint — patience around the 1.44–1.47 retest zone likely offers better odds than FOMO at the highs.
Tap $XRP to pull up the chart and see these levels yourself.
What’s the one level you’re watching most closely on XRP right now? 👇
Not financial advice. DYOR.
Follow for the next read on this chart.
#XRP #Ripple #Crypto #BinanceSquare
$XRP is up 5.4% in 24 hours and just tagged a 9-month high — but the real story is hiding in that long/short ratio.
Eleven of the last twelve 4H candles closed green. That’s not a grind, that’s an engine. Price broke clean through the daily EMA structure and left an unfilled bullish gap just below — the kind of zone that often acts like a magnet before the next leg.
Here’s the tension: the futures crowd is stacked long, and funding has flipped positive. When everyone’s already leaning one way, the easy move is rarely the one that prints next. That doesn’t kill the trend — but it does raise the stakes on any pullback.
The 4H is the cleanest read. As long as $XRP holds the 1.44 area on a closing basis, the structure stays intact. That’s the line where the thesis breaks — lose it and the unfilled gap below becomes the target instead of the launchpad. If momentum persists, the 1.62 zone is the next logical place price could stretch toward.
My read: the trend is real, but it’s late-stage momentum, not fresh fuel. The risk sits in chasing strength after an 11-candle sprint — patience around the 1.44–1.47 retest zone likely offers better odds than FOMO at the highs.
Tap $XRP to pull up the chart and see these levels yourself.
What’s the one level you’re watching most closely on XRP right now? 👇
Not financial advice. DYOR.
Follow for the next read on this chart.
#XRP #Ripple #Crypto #BinanceSquare
Eleven of the last twelve 4H candles closed green. That’s not a grind, that’s an engine. Price broke clean through the daily EMA structure and left an unfilled bullish gap just below — the kind of zone that often acts like a magnet before the next leg.
Here’s the tension: the futures crowd is stacked long, and funding has flipped positive. When everyone’s already leaning one way, the easy move is rarely the one that prints next. That doesn’t kill the trend — but it does raise the stakes on any pullback.
The 4H is the cleanest read. As long as $XRP holds the 1.44 area on a closing basis, the structure stays intact. That’s the line where the thesis breaks — lose it and the unfilled gap below becomes the target instead of the launchpad. If momentum persists, the 1.62 zone is the next logical place price could stretch toward.
My read: the trend is real, but it’s late-stage momentum, not fresh fuel. The risk sits in chasing strength after an 11-candle sprint — patience around the 1.44–1.47 retest zone likely offers better odds than FOMO at the highs.
Tap $XRP to pull up the chart and see these levels yourself.
What’s the one level you’re watching most closely on XRP right now? 👇
Not financial advice. DYOR.
Follow for the next read on this chart.
#XRP #Ripple #Crypto #BinanceSquare
33
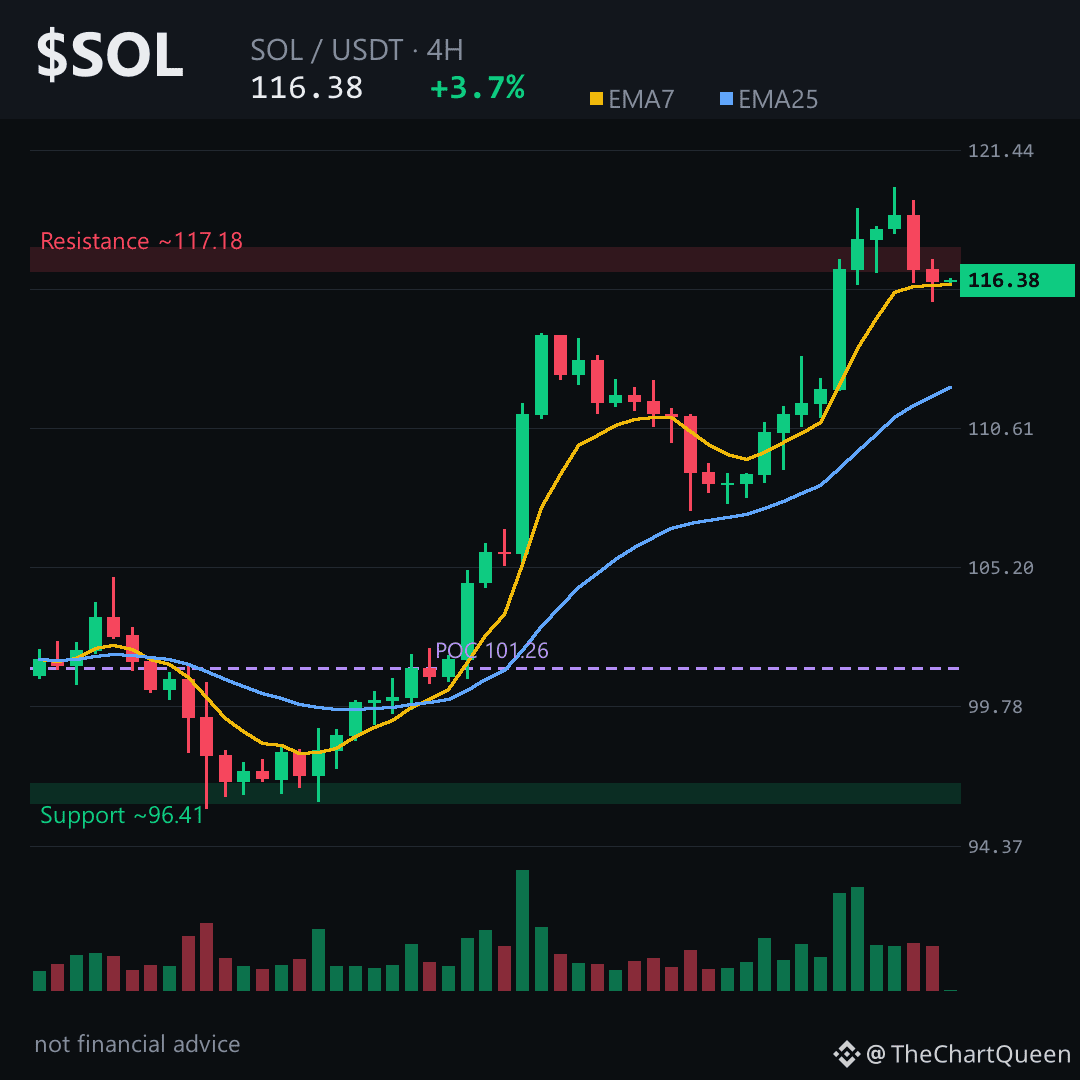
Every green candle on $SOL since 108 has been built on thin air.
That bearish gap from 117.2 to 118.2 never got filled with real volume — price floated through it to 120, then got rejected hard. Now we're at 116.4, and the last 12 hours have been pure chop.
4H structure is still technically bullish: EMA7 at 116.2 above EMA25 at 112.1, RSI at 66 with room, and volume stacked down at 101 — the market's memory of fair value.
But the short-term trend has flipped. That 120 rejection was a failed auction above the unfilled gap. Buyers found no resting orders and got pulled back to where liquidity actually sits at 116.
Funding is barely positive, but the long/short ratio leans heavy at 1.65 — a lot of conviction with little behind it. If 116 fails, latecomers get shaken out fast.
The level that matters is 112 — the 4H invalidation zone, right on the EMA25. Lose that on a 4H close and the bullish read is off, with 108 next. Above, 123 is the real test — price needs to prove it can hold above the 120 rejection wick. Tap $SOL to see how clean that rejection was.
My read: daily trend intact, but 4H momentum is stalling. The risk isn't direction — it's being early at the wrong level.
Follow if you want the read when 112 or 123 actually gets tested, not after the move already happened. What's your honest take on that 120 rejection — healthy pullback or exhaustion signal? $SOL 👇
⚠️ Not financial advice. DYOR.
#SOL #Solana #Crypto #BinanceSquare
Every green candle on $SOL since 108 has been built on thin air.
That bearish gap from 117.2 to 118.2 never got filled with real volume — price floated through it to 120, then got rejected hard. Now we're at 116.4, and the last 12 hours have been pure chop.
4H structure is still technically bullish: EMA7 at 116.2 above EMA25 at 112.1, RSI at 66 with room, and volume stacked down at 101 — the market's memory of fair value.
But the short-term trend has flipped. That 120 rejection was a failed auction above the unfilled gap. Buyers found no resting orders and got pulled back to where liquidity actually sits at 116.
Funding is barely positive, but the long/short ratio leans heavy at 1.65 — a lot of conviction with little behind it. If 116 fails, latecomers get shaken out fast.
The level that matters is 112 — the 4H invalidation zone, right on the EMA25. Lose that on a 4H close and the bullish read is off, with 108 next. Above, 123 is the real test — price needs to prove it can hold above the 120 rejection wick. Tap $SOL to see how clean that rejection was.
My read: daily trend intact, but 4H momentum is stalling. The risk isn't direction — it's being early at the wrong level.
Follow if you want the read when 112 or 123 actually gets tested, not after the move already happened. What's your honest take on that 120 rejection — healthy pullback or exhaustion signal? $SOL 👇
⚠️ Not financial advice. DYOR.
#SOL #Solana #Crypto #BinanceSquare
That bearish gap from 117.2 to 118.2 never got filled with real volume — price floated through it to 120, then got rejected hard. Now we're at 116.4, and the last 12 hours have been pure chop.
4H structure is still technically bullish: EMA7 at 116.2 above EMA25 at 112.1, RSI at 66 with room, and volume stacked down at 101 — the market's memory of fair value.
But the short-term trend has flipped. That 120 rejection was a failed auction above the unfilled gap. Buyers found no resting orders and got pulled back to where liquidity actually sits at 116.
Funding is barely positive, but the long/short ratio leans heavy at 1.65 — a lot of conviction with little behind it. If 116 fails, latecomers get shaken out fast.
The level that matters is 112 — the 4H invalidation zone, right on the EMA25. Lose that on a 4H close and the bullish read is off, with 108 next. Above, 123 is the real test — price needs to prove it can hold above the 120 rejection wick. Tap $SOL to see how clean that rejection was.
My read: daily trend intact, but 4H momentum is stalling. The risk isn't direction — it's being early at the wrong level.
Follow if you want the read when 112 or 123 actually gets tested, not after the move already happened. What's your honest take on that 120 rejection — healthy pullback or exhaustion signal? $SOL 👇
⚠️ Not financial advice. DYOR.
#SOL #Solana #Crypto #BinanceSquare
56
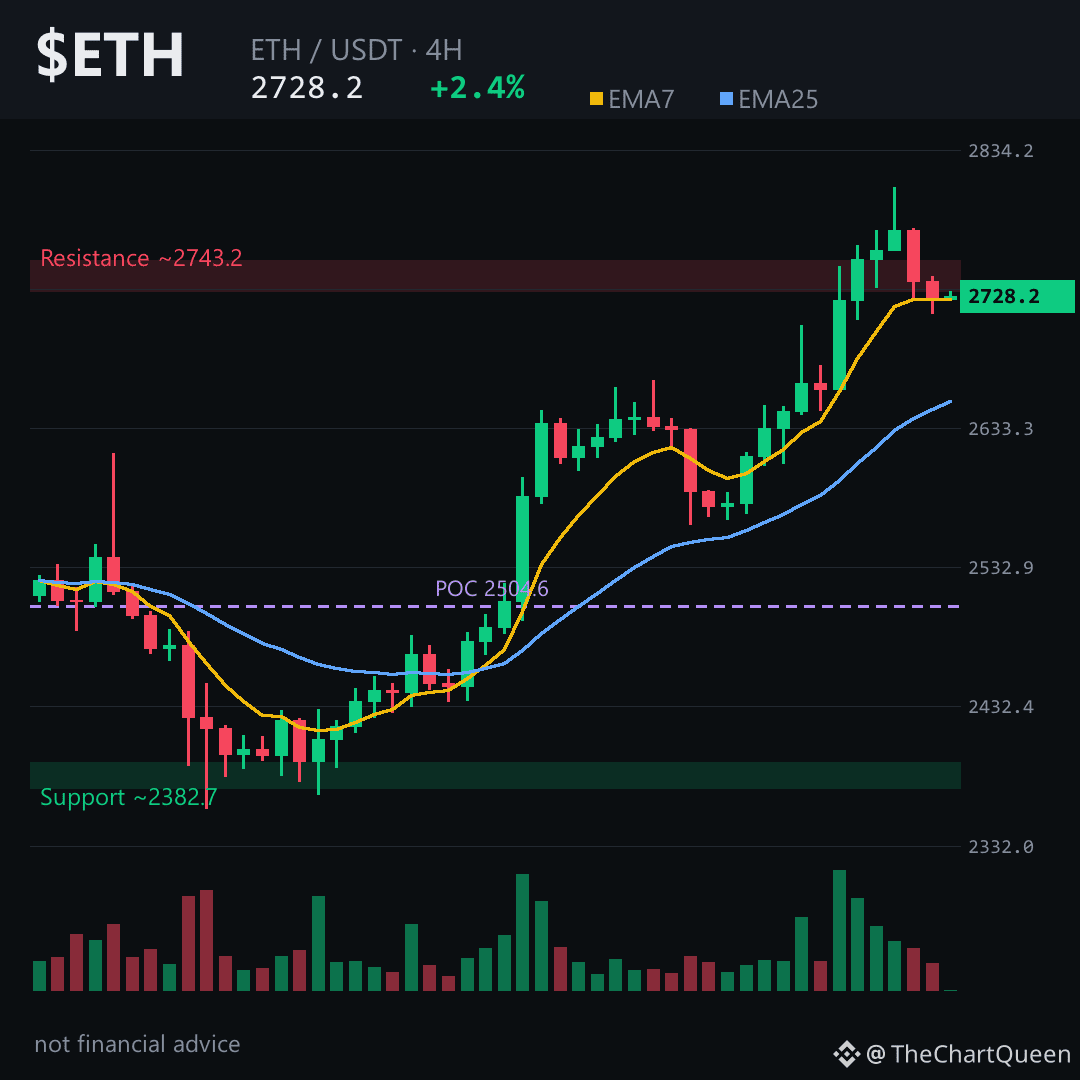
$ETH just printed a 24-hour range of 5.39% — yet the last three 4H candles are red. That divergence is the entire story right now.
Price pushed to 2807, failed, and has been leaking lower. The 4H EMA7 at 2726 is now the pivot — price is sitting directly on it. The unmitigated bearish FVG between 2743 and 2761 rejected price twice in the last 12 hours, flipping the short-term trend to DOWNTREND.
But the internals whisper otherwise. Funding is positive at 0.0095% — longs are paying to hold. The Long/Short ratio at 2.38 means the crowd is heavily net long. That one-sided positioning often gets tested before a real move.
The invalidation zone sits around 2633 — lose that on a 4H close and the bullish structure is off. Until then, the objective near 2862 stays viable, but only if price reclaims and holds above the 2743–2761 supply. Right now it can't.
My read: the longer price sits below 2743 without reclaiming it, the more likely a test of the 2660s comes before any push higher.
Tap $ETH to pull up the chart and read these levels yourself.
Which zone are you watching more closely — the 2743 supply above or the 2660 support below? 👇
Follow for the next read on this chart.
⚠️ Not financial advice. DYOR.
#ETH #Ethereum #Crypto #BinanceSquare
$ETH just printed a 24-hour range of 5.39% — yet the last three 4H candles are red. That divergence is the entire story right now.
Price pushed to 2807, failed, and has been leaking lower. The 4H EMA7 at 2726 is now the pivot — price is sitting directly on it. The unmitigated bearish FVG between 2743 and 2761 rejected price twice in the last 12 hours, flipping the short-term trend to DOWNTREND.
But the internals whisper otherwise. Funding is positive at 0.0095% — longs are paying to hold. The Long/Short ratio at 2.38 means the crowd is heavily net long. That one-sided positioning often gets tested before a real move.
The invalidation zone sits around 2633 — lose that on a 4H close and the bullish structure is off. Until then, the objective near 2862 stays viable, but only if price reclaims and holds above the 2743–2761 supply. Right now it can't.
My read: the longer price sits below 2743 without reclaiming it, the more likely a test of the 2660s comes before any push higher.
Tap $ETH to pull up the chart and read these levels yourself.
Which zone are you watching more closely — the 2743 supply above or the 2660 support below? 👇
Follow for the next read on this chart.
⚠️ Not financial advice. DYOR.
#ETH #Ethereum #Crypto #BinanceSquare
Price pushed to 2807, failed, and has been leaking lower. The 4H EMA7 at 2726 is now the pivot — price is sitting directly on it. The unmitigated bearish FVG between 2743 and 2761 rejected price twice in the last 12 hours, flipping the short-term trend to DOWNTREND.
But the internals whisper otherwise. Funding is positive at 0.0095% — longs are paying to hold. The Long/Short ratio at 2.38 means the crowd is heavily net long. That one-sided positioning often gets tested before a real move.
The invalidation zone sits around 2633 — lose that on a 4H close and the bullish structure is off. Until then, the objective near 2862 stays viable, but only if price reclaims and holds above the 2743–2761 supply. Right now it can't.
My read: the longer price sits below 2743 without reclaiming it, the more likely a test of the 2660s comes before any push higher.
Tap $ETH to pull up the chart and read these levels yourself.
Which zone are you watching more closely — the 2743 supply above or the 2660 support below? 👇
Follow for the next read on this chart.
⚠️ Not financial advice. DYOR.
#ETH #Ethereum #Crypto #BinanceSquare
60
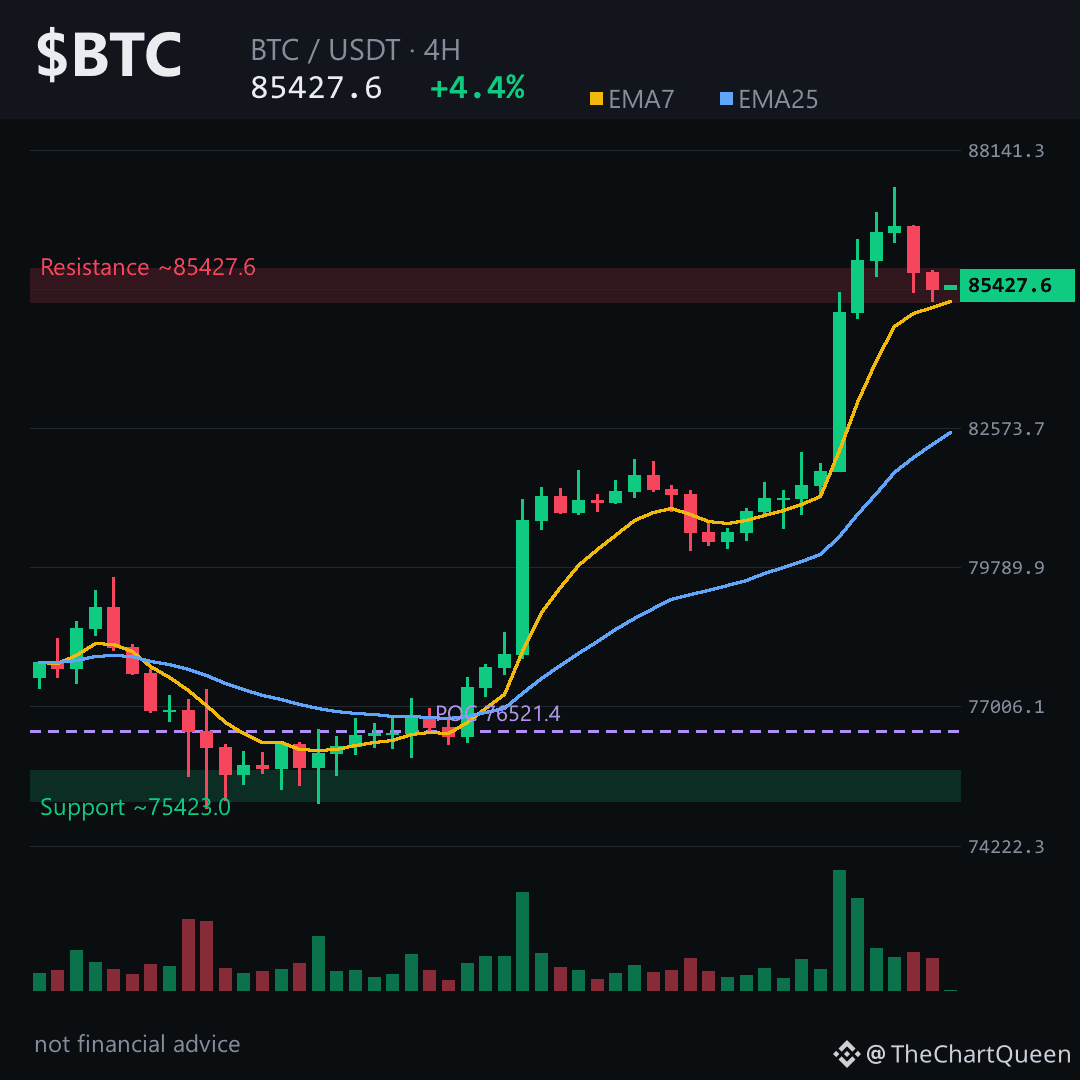
72.66.
That RSI reading on the 4H isn't a signal — it's a warning label. Price pushed into the mid-85s, but now sits inside an unfilled bearish gap just above: roughly 85.7K to 86.3K that never got properly traded through on the way down. The chart left a hole, and the next few candles decide whether it gets filled or rejected.
The broader structure still leans bullish — daily and weekly moving averages are aligned, momentum intact. But the 4H is drifting lower. Ten green candles out of twelve sounds impressive until you notice the two red ones arrived at the top of the range.
Futures metrics add texture. Funding is only marginally positive. The long/short ratio sits below 1 — slightly net short while price is near local highs. That's mildly contrarian-bullish: not crowded with longs, leaving room for continuation rather than a sharp unwind.
The level that matters most is 83.1K on the 4H. Lose that zone on a 4H close and the bullish read here is simply wrong. If it holds, the objective is 88.6K, with the unfilled gap overhead acting as the first test. Tap $BTC to pull up the chart.
My read: a strong uptrend taking a breather near resistance, not a top forming. The real risk isn't the pullback — it's chasing strength into an unfilled gap without a clear reaction first.
I'll post a follow-up if the 83.1K floor or the 88.6K ceiling gets tested — follow so it lands on your feed.
Which level are you watching more closely on $BTC — the gap overhead or the structural floor below 👇
⚠️ Not financial advice. DYOR.
#BTC #Bitcoin #Crypto #BinanceSquare
72.66.
That RSI reading on the 4H isn't a signal — it's a warning label. Price pushed into the mid-85s, but now sits inside an unfilled bearish gap just above: roughly 85.7K to 86.3K that never got properly traded through on the way down. The chart left a hole, and the next few candles decide whether it gets filled or rejected.
The broader structure still leans bullish — daily and weekly moving averages are aligned, momentum intact. But the 4H is drifting lower. Ten green candles out of twelve sounds impressive until you notice the two red ones arrived at the top of the range.
Futures metrics add texture. Funding is only marginally positive. The long/short ratio sits below 1 — slightly net short while price is near local highs. That's mildly contrarian-bullish: not crowded with longs, leaving room for continuation rather than a sharp unwind.
The level that matters most is 83.1K on the 4H. Lose that zone on a 4H close and the bullish read here is simply wrong. If it holds, the objective is 88.6K, with the unfilled gap overhead acting as the first test. Tap $BTC to pull up the chart.
My read: a strong uptrend taking a breather near resistance, not a top forming. The real risk isn't the pullback — it's chasing strength into an unfilled gap without a clear reaction first.
I'll post a follow-up if the 83.1K floor or the 88.6K ceiling gets tested — follow so it lands on your feed.
Which level are you watching more closely on $BTC — the gap overhead or the structural floor below 👇
⚠️ Not financial advice. DYOR.
#BTC #Bitcoin #Crypto #BinanceSquare
That RSI reading on the 4H isn't a signal — it's a warning label. Price pushed into the mid-85s, but now sits inside an unfilled bearish gap just above: roughly 85.7K to 86.3K that never got properly traded through on the way down. The chart left a hole, and the next few candles decide whether it gets filled or rejected.
The broader structure still leans bullish — daily and weekly moving averages are aligned, momentum intact. But the 4H is drifting lower. Ten green candles out of twelve sounds impressive until you notice the two red ones arrived at the top of the range.
Futures metrics add texture. Funding is only marginally positive. The long/short ratio sits below 1 — slightly net short while price is near local highs. That's mildly contrarian-bullish: not crowded with longs, leaving room for continuation rather than a sharp unwind.
The level that matters most is 83.1K on the 4H. Lose that zone on a 4H close and the bullish read here is simply wrong. If it holds, the objective is 88.6K, with the unfilled gap overhead acting as the first test. Tap $BTC to pull up the chart.
My read: a strong uptrend taking a breather near resistance, not a top forming. The real risk isn't the pullback — it's chasing strength into an unfilled gap without a clear reaction first.
I'll post a follow-up if the 83.1K floor or the 88.6K ceiling gets tested — follow so it lands on your feed.
Which level are you watching more closely on $BTC — the gap overhead or the structural floor below 👇
⚠️ Not financial advice. DYOR.
#BTC #Bitcoin #Crypto #BinanceSquare
48
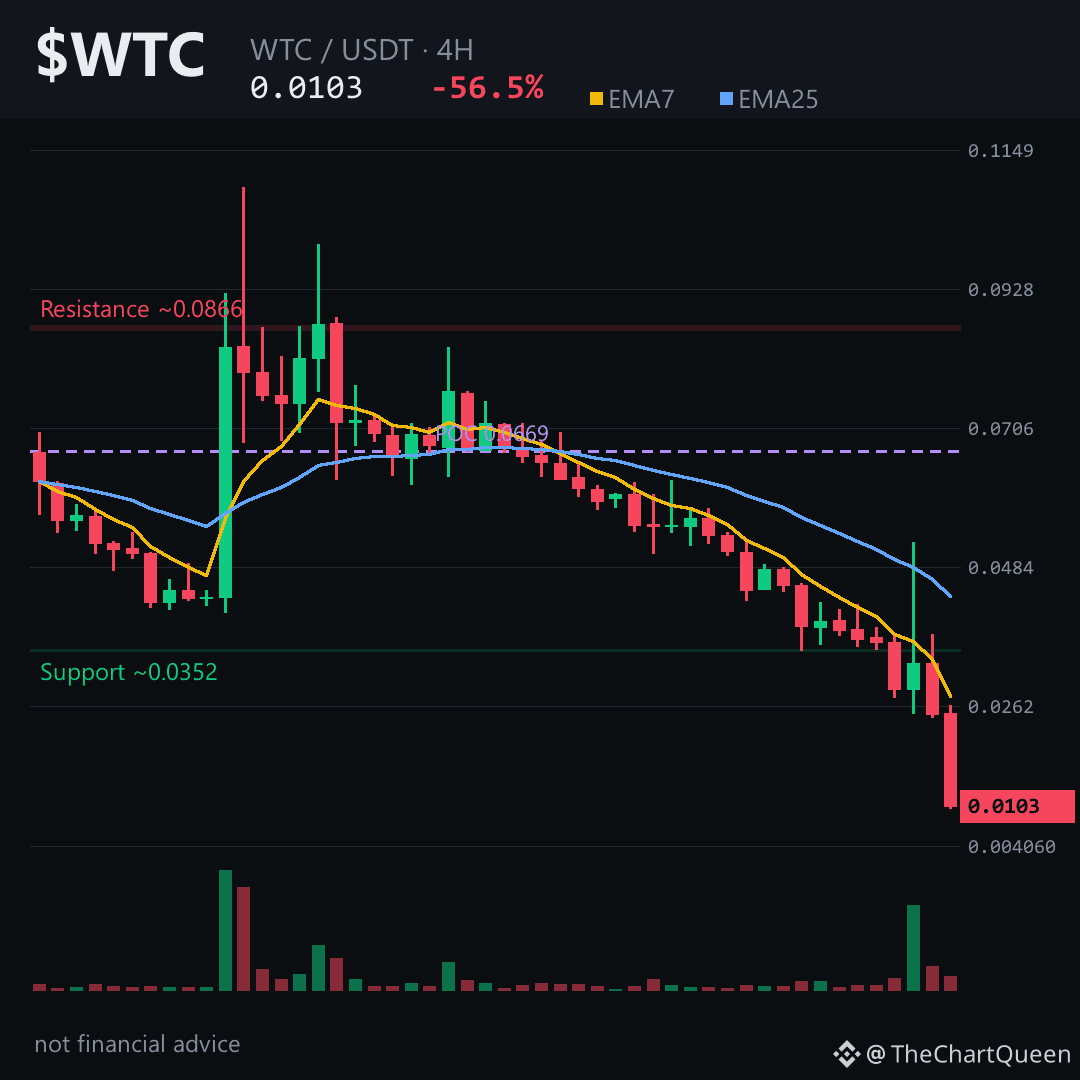
A 58% single-candle collapse isn't a dip. It's a structural break.
Futures on $WTC are empty—zero OI, zero funding, no leveraged unwind. This is pure spot capitulation, so the bleed can run farther.
The 4‑hour chart is the only story: nine red candles in twelve, the last fell off a cliff. RSI sits in the low‑20s, but low RSI in a vacuum doesn’t signal reversal—it shows organic sell pressure.
Key levels: price clings to the 0.0103 pivot. A 4‑hour close below it opens the next thin‑air demand zone near 0.0094. Invalidation is a 4‑hour close above 0.0109, turning the breakdown into a failed flush.
With no futures positioning, this isn’t a liquidation cascade—it’s genuine distribution, slower and messier. If 0.0103 breaks, watch whether 0.0094 holds as demand or just a pause.
Follow if you want that read without the noise.
What level are you watching on $WTC right now, and why does it matter to you? 👇
Not financial advice. DYOR.
#WTC #Crypto #BinanceSquare
A 58% single-candle collapse isn't a dip. It's a structural break.
Futures on $WTC are empty—zero OI, zero funding, no leveraged unwind. This is pure spot capitulation, so the bleed can run farther.
The 4‑hour chart is the only story: nine red candles in twelve, the last fell off a cliff. RSI sits in the low‑20s, but low RSI in a vacuum doesn’t signal reversal—it shows organic sell pressure.
Key levels: price clings to the 0.0103 pivot. A 4‑hour close below it opens the next thin‑air demand zone near 0.0094. Invalidation is a 4‑hour close above 0.0109, turning the breakdown into a failed flush.
With no futures positioning, this isn’t a liquidation cascade—it’s genuine distribution, slower and messier. If 0.0103 breaks, watch whether 0.0094 holds as demand or just a pause.
Follow if you want that read without the noise.
What level are you watching on $WTC right now, and why does it matter to you? 👇
Not financial advice. DYOR.
#WTC #Crypto #BinanceSquare
Futures on $WTC are empty—zero OI, zero funding, no leveraged unwind. This is pure spot capitulation, so the bleed can run farther.
The 4‑hour chart is the only story: nine red candles in twelve, the last fell off a cliff. RSI sits in the low‑20s, but low RSI in a vacuum doesn’t signal reversal—it shows organic sell pressure.
Key levels: price clings to the 0.0103 pivot. A 4‑hour close below it opens the next thin‑air demand zone near 0.0094. Invalidation is a 4‑hour close above 0.0109, turning the breakdown into a failed flush.
With no futures positioning, this isn’t a liquidation cascade—it’s genuine distribution, slower and messier. If 0.0103 breaks, watch whether 0.0094 holds as demand or just a pause.
Follow if you want that read without the noise.
What level are you watching on $WTC right now, and why does it matter to you? 👇
Not financial advice. DYOR.
#WTC #Crypto #BinanceSquare
4
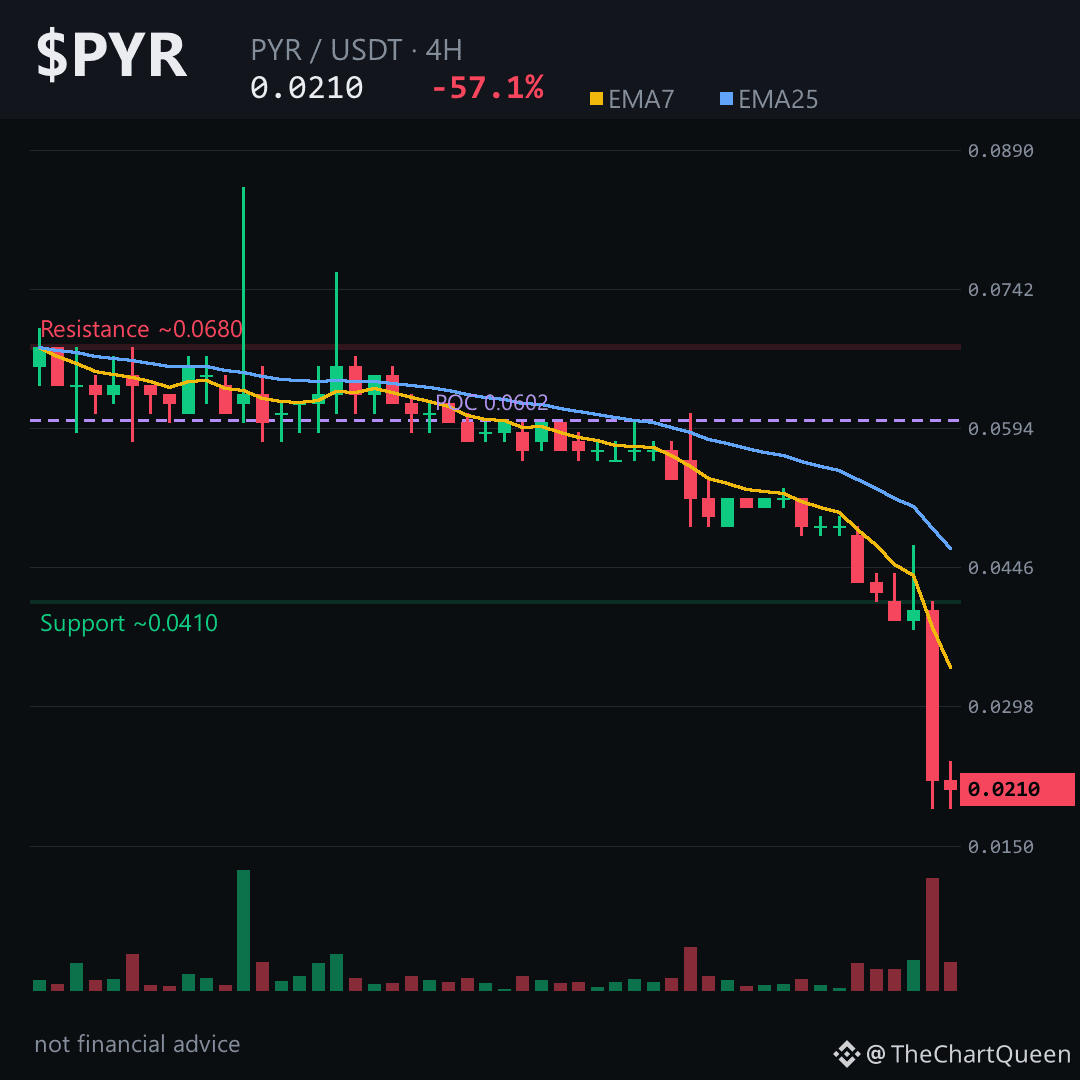
A 45% single-candle wipe on the 4H. That’s not a correction, that’s a liquidation event. And when a chart does that, the next move isn’t usually a clean bounce — it’s a slow bleed while the market decides if anything is left to save.
RSI on the 4H is near 12. On paper, that screams “oversold bounce.” But oversold in a downtrend with zero funding and zero open interest isn’t a reversal signal. It’s a vacuum. No leverage to unwind, no crowded short to squeeze. Just apathy.
$PYR is holding 0.021 after carving a fresh low near 0.019. The old demand zone from earlier this week — 0.044 to 0.048 — is now a bearish gap overhead. Price would need to reclaim that entire zone just to prove it’s not dead.
The level that matters: as long as price stays below 0.022 on a 4H close, path of least resistance points toward 0.019, and a failure there opens the low 0.017s. A close back above 0.022 invalidates this read.
My read: a falling knife with no hand under it. The only real risk to the downside is a short-squeeze that can’t happen without leverage in the system.
I’ll be watching whether 0.019 holds or folds — follow for the update when that level gets tested.
What level are you watching on $PYR 👇
Not financial advice. DYOR.
#PYR #VulcanForged #Crypto #BinanceSquare
A 45% single-candle wipe on the 4H. That’s not a correction, that’s a liquidation event. And when a chart does that, the next move isn’t usually a clean bounce — it’s a slow bleed while the market decides if anything is left to save.
RSI on the 4H is near 12. On paper, that screams “oversold bounce.” But oversold in a downtrend with zero funding and zero open interest isn’t a reversal signal. It’s a vacuum. No leverage to unwind, no crowded short to squeeze. Just apathy.
$PYR is holding 0.021 after carving a fresh low near 0.019. The old demand zone from earlier this week — 0.044 to 0.048 — is now a bearish gap overhead. Price would need to reclaim that entire zone just to prove it’s not dead.
The level that matters: as long as price stays below 0.022 on a 4H close, path of least resistance points toward 0.019, and a failure there opens the low 0.017s. A close back above 0.022 invalidates this read.
My read: a falling knife with no hand under it. The only real risk to the downside is a short-squeeze that can’t happen without leverage in the system.
I’ll be watching whether 0.019 holds or folds — follow for the update when that level gets tested.
What level are you watching on $PYR 👇
Not financial advice. DYOR.
#PYR #VulcanForged #Crypto #BinanceSquare
RSI on the 4H is near 12. On paper, that screams “oversold bounce.” But oversold in a downtrend with zero funding and zero open interest isn’t a reversal signal. It’s a vacuum. No leverage to unwind, no crowded short to squeeze. Just apathy.
$PYR is holding 0.021 after carving a fresh low near 0.019. The old demand zone from earlier this week — 0.044 to 0.048 — is now a bearish gap overhead. Price would need to reclaim that entire zone just to prove it’s not dead.
The level that matters: as long as price stays below 0.022 on a 4H close, path of least resistance points toward 0.019, and a failure there opens the low 0.017s. A close back above 0.022 invalidates this read.
My read: a falling knife with no hand under it. The only real risk to the downside is a short-squeeze that can’t happen without leverage in the system.
I’ll be watching whether 0.019 holds or folds — follow for the update when that level gets tested.
What level are you watching on $PYR 👇
Not financial advice. DYOR.
#PYR #VulcanForged #Crypto #BinanceSquare
7
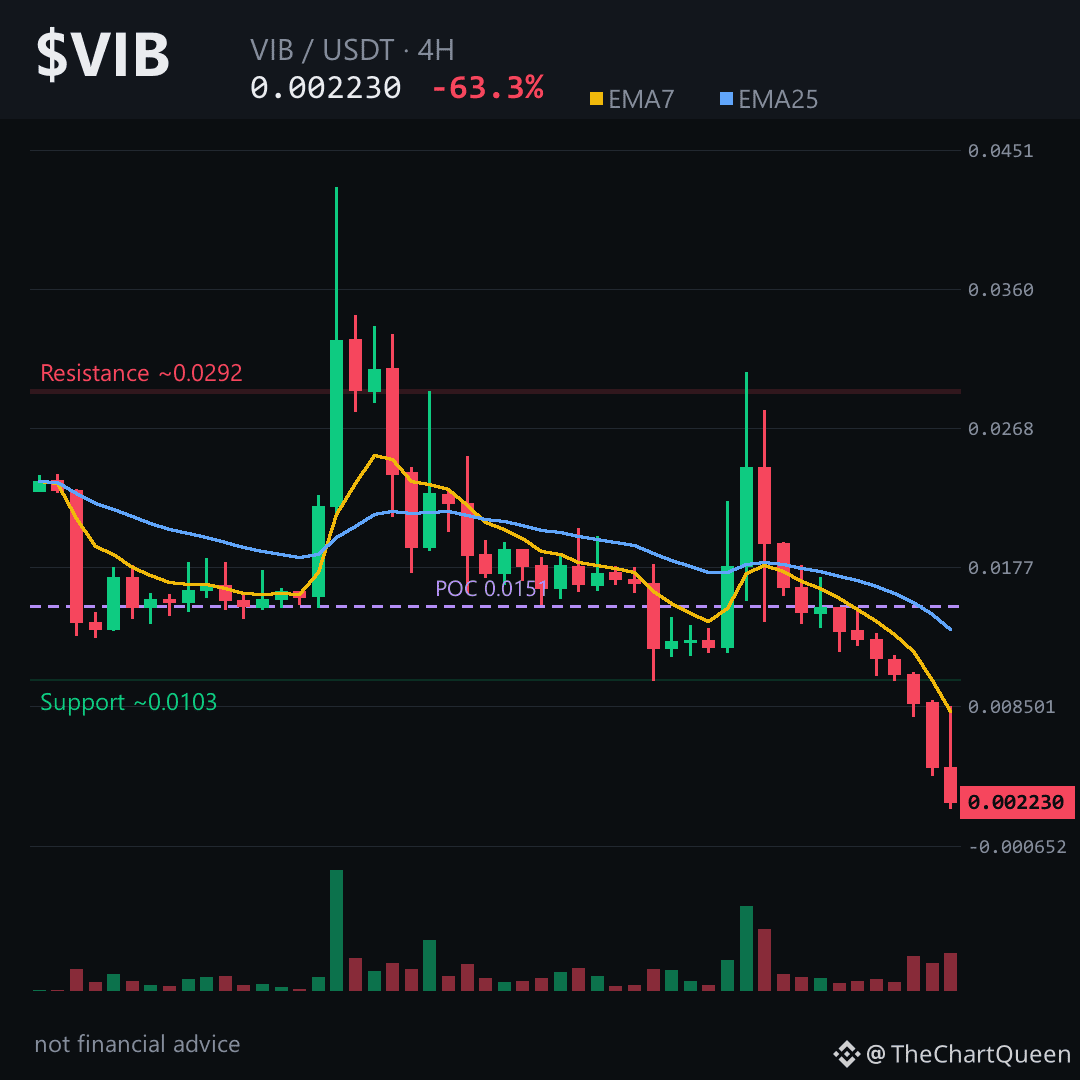
63% gone in 24 hours. And the 4H chart still hasn't found its floor.
$VIB printed a 288% range in a single day. That's not a correction — that's a full-scale liquidity event. Last two 4H sessions closed down 49% and 50% back-to-back. Volume is thin at ~380K USDT, so any bounce is fighting a tape that's mostly air.
RSI on the 4H is at 28 — deep oversold, but on a -63% day, oversold is just a word. EMA7 has completely detached from EMA25. The trend is broken, not bending. And there's an unfilled bearish gap between roughly 0.0089 and 0.0102 — a potential ceiling if price ever tries to recover.
My levels on the 4H: pivot around 0.00224, invalidation just above it near 0.00235. If that upper zone holds as resistance, the path of least resistance points toward 0.00204 — and honestly, given the momentum, that might be optimistic. The real tell is whether $VIB can reclaim 0.00235 on a 4H close. Until then, every bounce looks like a gift to sellers, not a reversal. Tap $VIB to pull up the chart and see the damage yourself.
My read: this is a falling knife with no clear hand to catch it yet. The risk isn't missing the bottom — it's catching a bounce that never comes.
I'll be watching whether that 0.00235 area flips from ceiling to floor or holds as the lid — follow along if you want the update when it happens. What's the one level you're watching on VIB right now 👇
⚠️ Not financial advice. DYOR.
#VIB #Crypto #Altcoins #BinanceSquare
63% gone in 24 hours. And the 4H chart still hasn't found its floor.
$VIB printed a 288% range in a single day. That's not a correction — that's a full-scale liquidity event. Last two 4H sessions closed down 49% and 50% back-to-back. Volume is thin at ~380K USDT, so any bounce is fighting a tape that's mostly air.
RSI on the 4H is at 28 — deep oversold, but on a -63% day, oversold is just a word. EMA7 has completely detached from EMA25. The trend is broken, not bending. And there's an unfilled bearish gap between roughly 0.0089 and 0.0102 — a potential ceiling if price ever tries to recover.
My levels on the 4H: pivot around 0.00224, invalidation just above it near 0.00235. If that upper zone holds as resistance, the path of least resistance points toward 0.00204 — and honestly, given the momentum, that might be optimistic. The real tell is whether $VIB can reclaim 0.00235 on a 4H close. Until then, every bounce looks like a gift to sellers, not a reversal. Tap $VIB to pull up the chart and see the damage yourself.
My read: this is a falling knife with no clear hand to catch it yet. The risk isn't missing the bottom — it's catching a bounce that never comes.
I'll be watching whether that 0.00235 area flips from ceiling to floor or holds as the lid — follow along if you want the update when it happens. What's the one level you're watching on VIB right now 👇
⚠️ Not financial advice. DYOR.
#VIB #Crypto #Altcoins #BinanceSquare
$VIB printed a 288% range in a single day. That's not a correction — that's a full-scale liquidity event. Last two 4H sessions closed down 49% and 50% back-to-back. Volume is thin at ~380K USDT, so any bounce is fighting a tape that's mostly air.
RSI on the 4H is at 28 — deep oversold, but on a -63% day, oversold is just a word. EMA7 has completely detached from EMA25. The trend is broken, not bending. And there's an unfilled bearish gap between roughly 0.0089 and 0.0102 — a potential ceiling if price ever tries to recover.
My levels on the 4H: pivot around 0.00224, invalidation just above it near 0.00235. If that upper zone holds as resistance, the path of least resistance points toward 0.00204 — and honestly, given the momentum, that might be optimistic. The real tell is whether $VIB can reclaim 0.00235 on a 4H close. Until then, every bounce looks like a gift to sellers, not a reversal. Tap $VIB to pull up the chart and see the damage yourself.
My read: this is a falling knife with no clear hand to catch it yet. The risk isn't missing the bottom — it's catching a bounce that never comes.
I'll be watching whether that 0.00235 area flips from ceiling to floor or holds as the lid — follow along if you want the update when it happens. What's the one level you're watching on VIB right now 👇
⚠️ Not financial advice. DYOR.
#VIB #Crypto #Altcoins #BinanceSquare
1
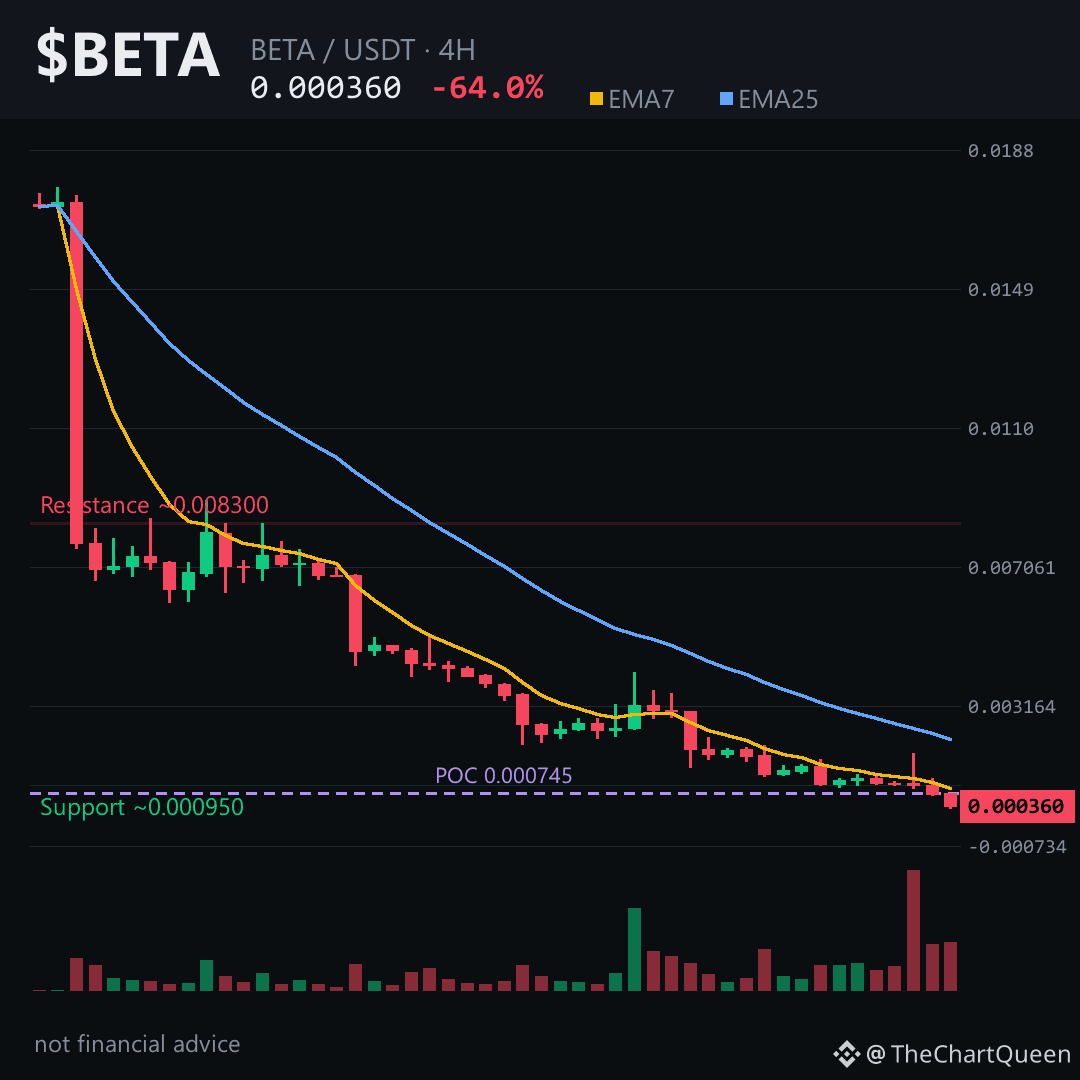
-64% in one day. $BETA just printed a candle that belongs in a horror movie 🩸
The 4H RSI is so low it’s practically frozen, yet the structure still can’t find a floor. That’s not normal selling. That’s abandonment.
Price keeps slicing through support like paper. The last 48 hours gave us 8 red candles against 4 green, and the most recent one closed down over 50% in a single 4H window. Buyers are showing up for dead-cat bounces, not reversals.
The volume profile tells the story nobody wants to hear — the heaviest traded zone sits way above current price, meaning most holders are underwater and every bounce is being sold into. The bearish FVG near 0.0023 is acting like a ceiling.
If this keeps bleeding, the objective zone sits around 0.00033 on the 4H. Lose that and we’re looking at fresh lows.
The one level that matters right now is 0.00038. A 4H close back above that and this bearish read starts to crack. Until then, the path of least resistance is still down.
My read: this is a falling knife wrapped in a liquidation cascade. The only edge here is patience — waiting for structure to stop making lower lows before trusting any bounce.
Tap $BETA to pull up the chart and see how far that FVG is from current price — it’s the gap keeping pressure on every rally.
I’ll update this read if price starts reclaiming 0.00038 — follow so you see it when the structure actually shifts.
Which level are you watching more closely on $BETA — the 0.00033 floor or the 0.00038 ceiling? 👇
⚠️ Not financial advice. DYOR.
#BETA #Crypto #BinanceSquare
-64% in one day. $BETA just printed a candle that belongs in a horror movie 🩸
The 4H RSI is so low it’s practically frozen, yet the structure still can’t find a floor. That’s not normal selling. That’s abandonment.
Price keeps slicing through support like paper. The last 48 hours gave us 8 red candles against 4 green, and the most recent one closed down over 50% in a single 4H window. Buyers are showing up for dead-cat bounces, not reversals.
The volume profile tells the story nobody wants to hear — the heaviest traded zone sits way above current price, meaning most holders are underwater and every bounce is being sold into. The bearish FVG near 0.0023 is acting like a ceiling.
If this keeps bleeding, the objective zone sits around 0.00033 on the 4H. Lose that and we’re looking at fresh lows.
The one level that matters right now is 0.00038. A 4H close back above that and this bearish read starts to crack. Until then, the path of least resistance is still down.
My read: this is a falling knife wrapped in a liquidation cascade. The only edge here is patience — waiting for structure to stop making lower lows before trusting any bounce.
Tap $BETA to pull up the chart and see how far that FVG is from current price — it’s the gap keeping pressure on every rally.
I’ll update this read if price starts reclaiming 0.00038 — follow so you see it when the structure actually shifts.
Which level are you watching more closely on $BETA — the 0.00033 floor or the 0.00038 ceiling? 👇
⚠️ Not financial advice. DYOR.
#BETA #Crypto #BinanceSquare
The 4H RSI is so low it’s practically frozen, yet the structure still can’t find a floor. That’s not normal selling. That’s abandonment.
Price keeps slicing through support like paper. The last 48 hours gave us 8 red candles against 4 green, and the most recent one closed down over 50% in a single 4H window. Buyers are showing up for dead-cat bounces, not reversals.
The volume profile tells the story nobody wants to hear — the heaviest traded zone sits way above current price, meaning most holders are underwater and every bounce is being sold into. The bearish FVG near 0.0023 is acting like a ceiling.
If this keeps bleeding, the objective zone sits around 0.00033 on the 4H. Lose that and we’re looking at fresh lows.
The one level that matters right now is 0.00038. A 4H close back above that and this bearish read starts to crack. Until then, the path of least resistance is still down.
My read: this is a falling knife wrapped in a liquidation cascade. The only edge here is patience — waiting for structure to stop making lower lows before trusting any bounce.
Tap $BETA to pull up the chart and see how far that FVG is from current price — it’s the gap keeping pressure on every rally.
I’ll update this read if price starts reclaiming 0.00038 — follow so you see it when the structure actually shifts.
Which level are you watching more closely on $BETA — the 0.00033 floor or the 0.00038 ceiling? 👇
⚠️ Not financial advice. DYOR.
#BETA #Crypto #BinanceSquare
2
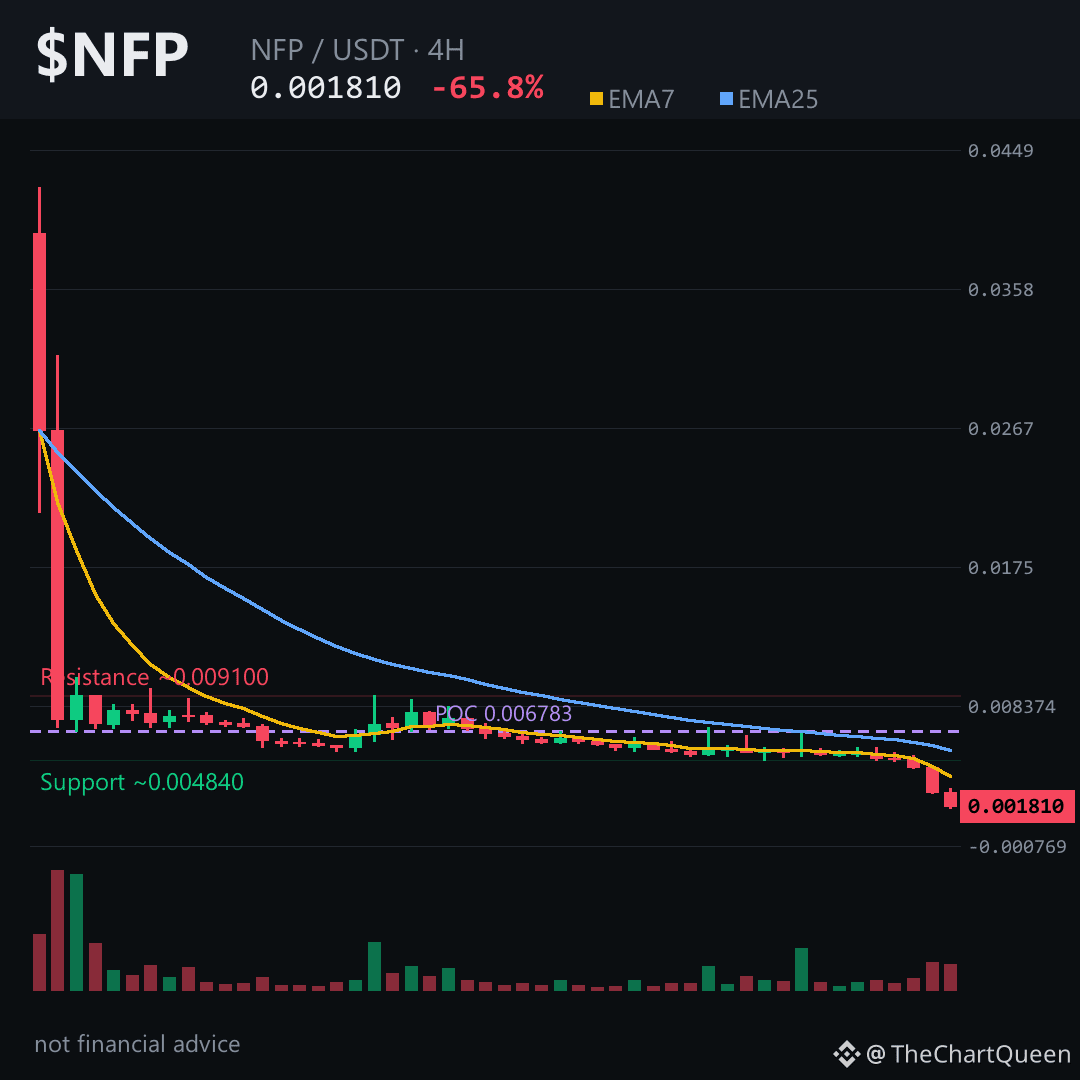
What if the real story isn't the -66% crash, but the silence after it? That's the question I keep coming back to with $NFP.
Volume is dead. Futures interest is at zero. No funding, no open contracts. This isn't a normal sell-off — it's an abandonment. The market isn't fighting over this coin anymore; it's walking away. That often means one thing: price can drift lower for a lot longer than feels fair.
The 4H chart tells a simple, heavy story. Price collapsed from the mid-5s down near 0.0018, and now the EMAs are stacked in the wrong order — the short-term average is far below the longer one. RSI is in deep single digits, but in a falling market that's not automatically a bounce signal. It's just a measure of how fast the rug got pulled.
The level that matters most is ~0.00191. That's where the last minor pivot sits, and it's also the ceiling of the bearish gap left behind between 0.00445 and 0.00479 — a zone price never revisited. If $NFP can't even reclaim the low 19s, the path of least resistance stays down toward 0.00165. A close back above 0.00191 on the 4H would tell me this read is wrong, at least for the short term. Tap $NFP to pull up the chart and see how clean that gap looks.
My read: this is a falling knife with no hands underneath it. No futures positioning means no forced squeeze to save it — just gravity and apathy. The risk isn't a reversal; it's that the drift continues quietly.
I'll be watching whether the 0.00165 zone actually gets tested or if price just chops sideways for days — follow me so we can read that next move together. What's the first sign you look for when deciding a coin has truly bottomed on NFP? 👇
⚠️ Not financial advice. DYOR.
#NFP #Crypto #BinanceSquare #Altcoins
What if the real story isn't the -66% crash, but the silence after it? That's the question I keep coming back to with $NFP.
Volume is dead. Futures interest is at zero. No funding, no open contracts. This isn't a normal sell-off — it's an abandonment. The market isn't fighting over this coin anymore; it's walking away. That often means one thing: price can drift lower for a lot longer than feels fair.
The 4H chart tells a simple, heavy story. Price collapsed from the mid-5s down near 0.0018, and now the EMAs are stacked in the wrong order — the short-term average is far below the longer one. RSI is in deep single digits, but in a falling market that's not automatically a bounce signal. It's just a measure of how fast the rug got pulled.
The level that matters most is ~0.00191. That's where the last minor pivot sits, and it's also the ceiling of the bearish gap left behind between 0.00445 and 0.00479 — a zone price never revisited. If $NFP can't even reclaim the low 19s, the path of least resistance stays down toward 0.00165. A close back above 0.00191 on the 4H would tell me this read is wrong, at least for the short term. Tap $NFP to pull up the chart and see how clean that gap looks.
My read: this is a falling knife with no hands underneath it. No futures positioning means no forced squeeze to save it — just gravity and apathy. The risk isn't a reversal; it's that the drift continues quietly.
I'll be watching whether the 0.00165 zone actually gets tested or if price just chops sideways for days — follow me so we can read that next move together. What's the first sign you look for when deciding a coin has truly bottomed on NFP? 👇
⚠️ Not financial advice. DYOR.
#NFP #Crypto #BinanceSquare #Altcoins
Volume is dead. Futures interest is at zero. No funding, no open contracts. This isn't a normal sell-off — it's an abandonment. The market isn't fighting over this coin anymore; it's walking away. That often means one thing: price can drift lower for a lot longer than feels fair.
The 4H chart tells a simple, heavy story. Price collapsed from the mid-5s down near 0.0018, and now the EMAs are stacked in the wrong order — the short-term average is far below the longer one. RSI is in deep single digits, but in a falling market that's not automatically a bounce signal. It's just a measure of how fast the rug got pulled.
The level that matters most is ~0.00191. That's where the last minor pivot sits, and it's also the ceiling of the bearish gap left behind between 0.00445 and 0.00479 — a zone price never revisited. If $NFP can't even reclaim the low 19s, the path of least resistance stays down toward 0.00165. A close back above 0.00191 on the 4H would tell me this read is wrong, at least for the short term. Tap $NFP to pull up the chart and see how clean that gap looks.
My read: this is a falling knife with no hands underneath it. No futures positioning means no forced squeeze to save it — just gravity and apathy. The risk isn't a reversal; it's that the drift continues quietly.
I'll be watching whether the 0.00165 zone actually gets tested or if price just chops sideways for days — follow me so we can read that next move together. What's the first sign you look for when deciding a coin has truly bottomed on NFP? 👇
⚠️ Not financial advice. DYOR.
#NFP #Crypto #BinanceSquare #Altcoins
2
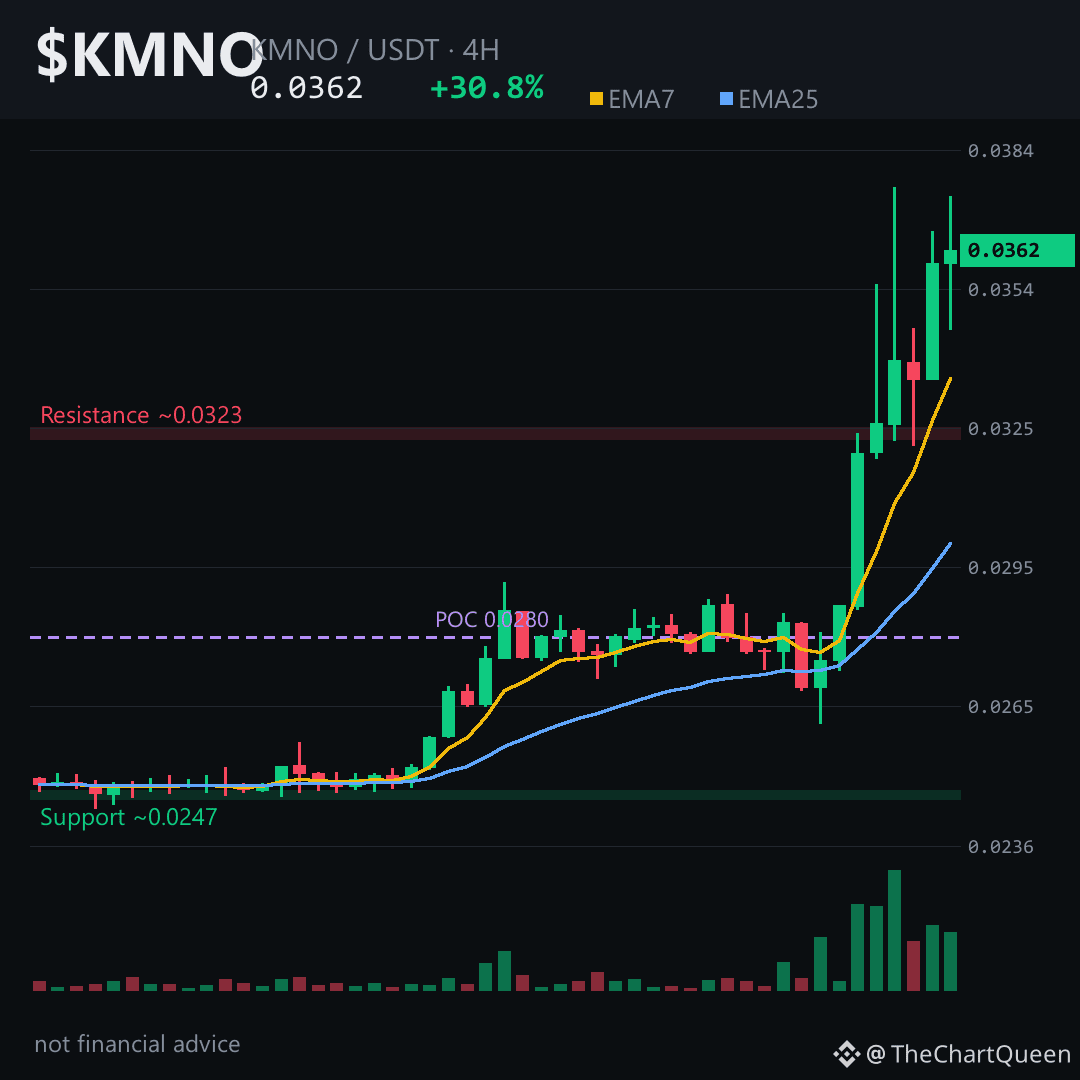
+30.77% in 24 hours.
That number either means momentum or exhaustion — and the chart is hinting at which one.
$KMNO has ripped from the low 0.027s to nearly 0.037 in two days. The 4H structure is clean: higher lows, higher highs, with a bullish gap sitting between 0.0287 and 0.0318 that hasn't been tested since price broke through it. That zone is the story now.
Here's what stands out. RSI on both the 4H and daily is above 81 — stretched, but in parabolic extensions that can stay hot longer than feels comfortable. Funding is only mildly positive, suggesting longs aren't aggressively crowded yet. Open interest is substantial, which means real liquidity is behind this move, not just a thin orderbook.
The level that matters most: around 0.0342. That's the invalidation floor on the 4H. If $KMNO holds above it, the path toward the 0.039 area stays open. Lose it on a 4H close and this read is off the table.
My read: the trend is bullish, but the easy money was made in the 0.028–0.033 range. Chasing above 0.036 carries more heat than edge. The real risk sits in that unfilled gap below — if momentum stalls, price has a magnet to revisit.
Tap $KMNO to pull up the chart and see these levels yourself.
What's your honest read on the 0.034 area — support or just a pause?
Follow for the next read on this chart.
⚠️ Not financial advice. DYOR.
#KMNO #Kamino #Crypto #BinanceSquare
+30.77% in 24 hours.
That number either means momentum or exhaustion — and the chart is hinting at which one.
$KMNO has ripped from the low 0.027s to nearly 0.037 in two days. The 4H structure is clean: higher lows, higher highs, with a bullish gap sitting between 0.0287 and 0.0318 that hasn't been tested since price broke through it. That zone is the story now.
Here's what stands out. RSI on both the 4H and daily is above 81 — stretched, but in parabolic extensions that can stay hot longer than feels comfortable. Funding is only mildly positive, suggesting longs aren't aggressively crowded yet. Open interest is substantial, which means real liquidity is behind this move, not just a thin orderbook.
The level that matters most: around 0.0342. That's the invalidation floor on the 4H. If $KMNO holds above it, the path toward the 0.039 area stays open. Lose it on a 4H close and this read is off the table.
My read: the trend is bullish, but the easy money was made in the 0.028–0.033 range. Chasing above 0.036 carries more heat than edge. The real risk sits in that unfilled gap below — if momentum stalls, price has a magnet to revisit.
Tap $KMNO to pull up the chart and see these levels yourself.
What's your honest read on the 0.034 area — support or just a pause?
Follow for the next read on this chart.
⚠️ Not financial advice. DYOR.
#KMNO #Kamino #Crypto #BinanceSquare
That number either means momentum or exhaustion — and the chart is hinting at which one.
$KMNO has ripped from the low 0.027s to nearly 0.037 in two days. The 4H structure is clean: higher lows, higher highs, with a bullish gap sitting between 0.0287 and 0.0318 that hasn't been tested since price broke through it. That zone is the story now.
Here's what stands out. RSI on both the 4H and daily is above 81 — stretched, but in parabolic extensions that can stay hot longer than feels comfortable. Funding is only mildly positive, suggesting longs aren't aggressively crowded yet. Open interest is substantial, which means real liquidity is behind this move, not just a thin orderbook.
The level that matters most: around 0.0342. That's the invalidation floor on the 4H. If $KMNO holds above it, the path toward the 0.039 area stays open. Lose it on a 4H close and this read is off the table.
My read: the trend is bullish, but the easy money was made in the 0.028–0.033 range. Chasing above 0.036 carries more heat than edge. The real risk sits in that unfilled gap below — if momentum stalls, price has a magnet to revisit.
Tap $KMNO to pull up the chart and see these levels yourself.
What's your honest read on the 0.034 area — support or just a pause?
Follow for the next read on this chart.
⚠️ Not financial advice. DYOR.
#KMNO #Kamino #Crypto #BinanceSquare
16
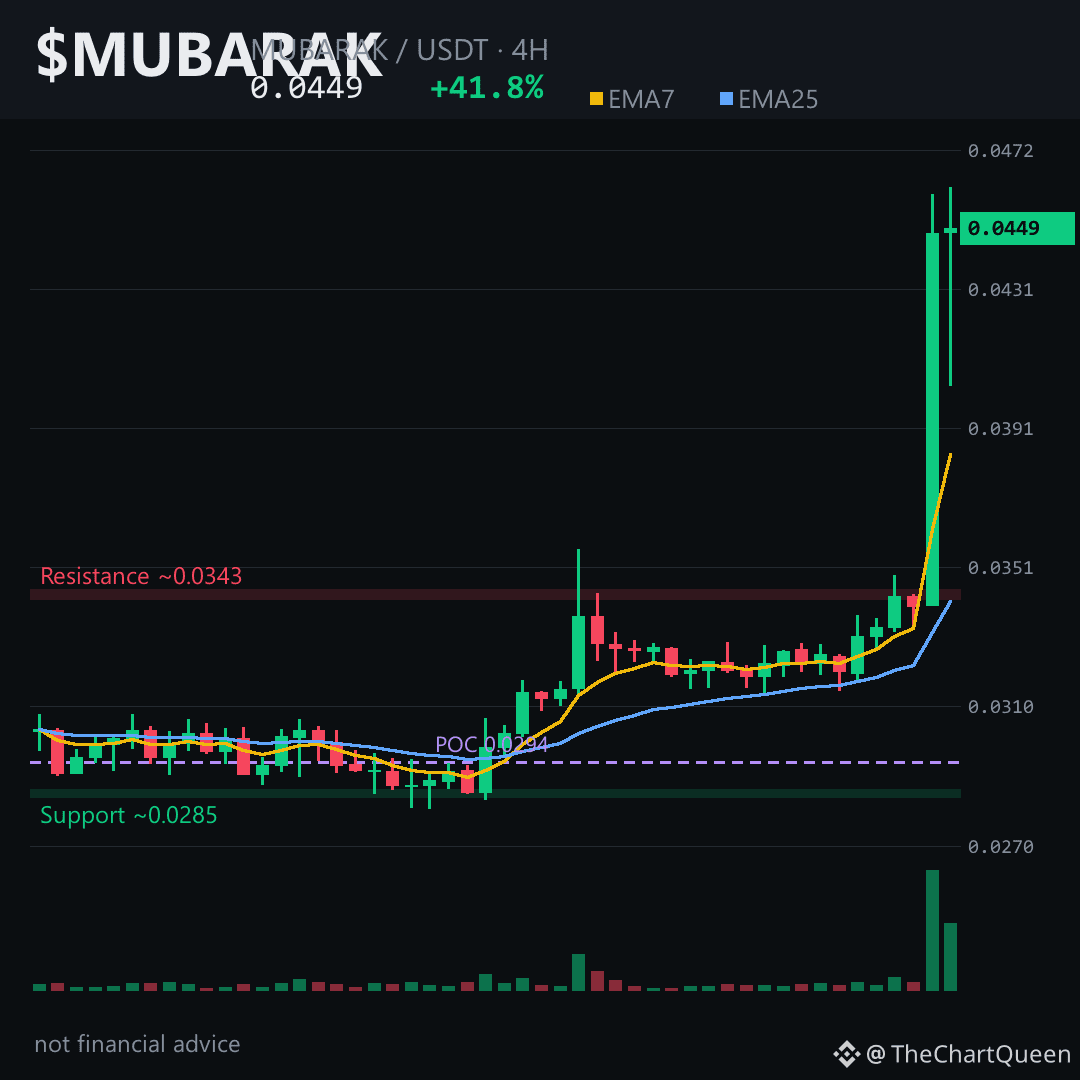
A single 4H candle just ate 32% in one bite.
That’s the kind of move that makes a chart feel less like a market and more like a slingshot snapping after being pulled back all week. And honestly? That’s exactly what this looks like.
$MUBARAK had been coiling quietly near the low 0.032s — barely moving, just breathing. Then the 08:00 candle ripped from 0.033960 to 0.045900, straight through every level that mattered, and it hasn’t given much back since.
Here’s the part worth slowing down for: the 4H chart is bullish, but it’s also stretched. RSI is deep in overbought territory, and the volume profile shows most historical interest much lower — around 0.029. That gap between price now and where liquidity used to live is the real story.
So the read is simple: momentum is real, but gravity hasn’t left the room.
The level I’m watching on the 4H is the current pivot around 0.0446. As long as $MUBARAK holds above the 0.0424 area on a closing basis, the bullish structure stays intact — and the next natural zone sits near 0.0486.
Lose 0.0424, though, and this read is off the table. That’s the line where the slingshot runs out of tension.
Funding is slightly positive, open interest is healthy, not euphoric. The crowd is leaning long, but not dangerously so.
My read: the trend is up, but the easy part of this move may already be done. The risk isn’t the direction — it’s the location.
I’ll keep an eye on how price behaves around that 0.0424–0.0446 pocket and post my next read as the structure develops. Follow along if you want the update.
What level are you watching most closely on $MUBARAK — the old breakout zone or the new highs? 👇
⚠️ Not financial advice. DYOR.
#MUBARAK #Crypto #BinanceSquare #MemeCoin #Altcoins
A single 4H candle just ate 32% in one bite.
That’s the kind of move that makes a chart feel less like a market and more like a slingshot snapping after being pulled back all week. And honestly? That’s exactly what this looks like.
$MUBARAK had been coiling quietly near the low 0.032s — barely moving, just breathing. Then the 08:00 candle ripped from 0.033960 to 0.045900, straight through every level that mattered, and it hasn’t given much back since.
Here’s the part worth slowing down for: the 4H chart is bullish, but it’s also stretched. RSI is deep in overbought territory, and the volume profile shows most historical interest much lower — around 0.029. That gap between price now and where liquidity used to live is the real story.
So the read is simple: momentum is real, but gravity hasn’t left the room.
The level I’m watching on the 4H is the current pivot around 0.0446. As long as $MUBARAK holds above the 0.0424 area on a closing basis, the bullish structure stays intact — and the next natural zone sits near 0.0486.
Lose 0.0424, though, and this read is off the table. That’s the line where the slingshot runs out of tension.
Funding is slightly positive, open interest is healthy, not euphoric. The crowd is leaning long, but not dangerously so.
My read: the trend is up, but the easy part of this move may already be done. The risk isn’t the direction — it’s the location.
I’ll keep an eye on how price behaves around that 0.0424–0.0446 pocket and post my next read as the structure develops. Follow along if you want the update.
What level are you watching most closely on $MUBARAK — the old breakout zone or the new highs? 👇
⚠️ Not financial advice. DYOR.
#MUBARAK #Crypto #BinanceSquare #MemeCoin #Altcoins
That’s the kind of move that makes a chart feel less like a market and more like a slingshot snapping after being pulled back all week. And honestly? That’s exactly what this looks like.
$MUBARAK had been coiling quietly near the low 0.032s — barely moving, just breathing. Then the 08:00 candle ripped from 0.033960 to 0.045900, straight through every level that mattered, and it hasn’t given much back since.
Here’s the part worth slowing down for: the 4H chart is bullish, but it’s also stretched. RSI is deep in overbought territory, and the volume profile shows most historical interest much lower — around 0.029. That gap between price now and where liquidity used to live is the real story.
So the read is simple: momentum is real, but gravity hasn’t left the room.
The level I’m watching on the 4H is the current pivot around 0.0446. As long as $MUBARAK holds above the 0.0424 area on a closing basis, the bullish structure stays intact — and the next natural zone sits near 0.0486.
Lose 0.0424, though, and this read is off the table. That’s the line where the slingshot runs out of tension.
Funding is slightly positive, open interest is healthy, not euphoric. The crowd is leaning long, but not dangerously so.
My read: the trend is up, but the easy part of this move may already be done. The risk isn’t the direction — it’s the location.
I’ll keep an eye on how price behaves around that 0.0424–0.0446 pocket and post my next read as the structure develops. Follow along if you want the update.
What level are you watching most closely on $MUBARAK — the old breakout zone or the new highs? 👇
⚠️ Not financial advice. DYOR.
#MUBARAK #Crypto #BinanceSquare #MemeCoin #Altcoins
41
+62.79% range in 24 hours.
That’s not a trend — that’s a liquidation cascade looking for a resting place.
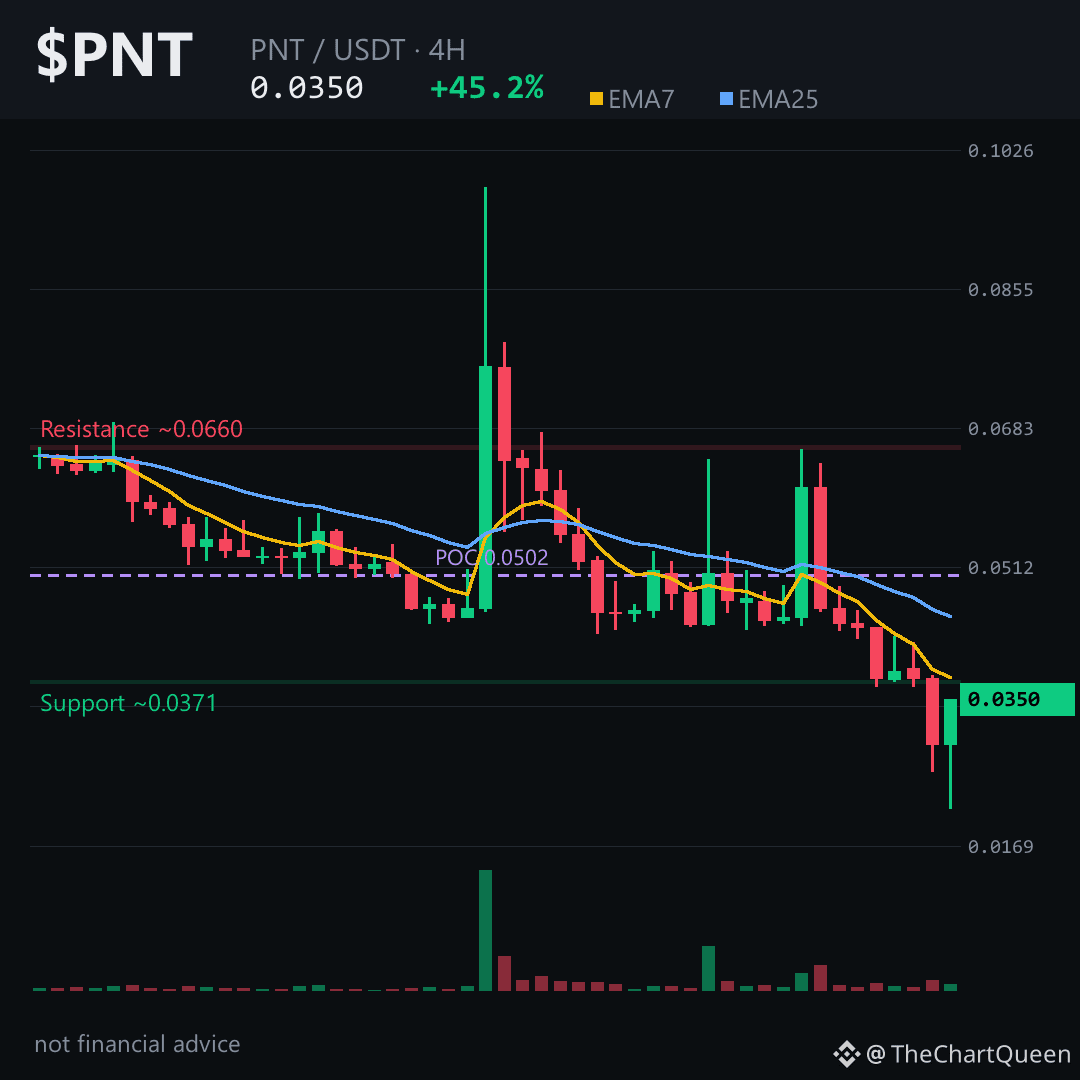
$PNT printed a 35% green candle, then gave back 24% in the next 4H close. Daily RSI sits at 27.65 — deep oversold, but on this volatility, oversold can outlast most accounts.
4H structure is the cleanest read. Price hovers near 0.035, with the 7 EMA still below the 25 EMA — textbook bearish alignment. Every bounce in 48 hours has been sold.
Volume profile POC sits near 0.050 — bulk of recent trading happened far above current price. That overhead supply is now resistance.
Invalidation zone is tight: a 4H close back above 0.037 signals the bounce has legs. Until then, path of least resistance points toward 0.032, with lower levels possible if momentum stalls.
My read: the bounce off 0.0215 is real, but it’s a relief rally inside a larger downtrend — not a reversal. The risk isn’t missing the bottom; it’s mistaking a dead-cat bounce for trend change.
Tap $PNT to pull up the chart and see these levels yourself.
I’ll keep tracking whether 0.032 gets tested or 0.037 invalidation holds first — follow so the next read lands in your feed.
Which level are you watching more closely on $PNT right now — the bounce zone or the breakdown zone? 👇
⚠️ Not financial advice. DYOR.
#PNT #Crypto #BinanceSquare
+62.79% range in 24 hours.
That’s not a trend — that’s a liquidation cascade looking for a resting place.
$PNT printed a 35% green candle, then gave back 24% in the next 4H close. Daily RSI sits at 27.65 — deep oversold, but on this volatility, oversold can outlast most accounts.
4H structure is the cleanest read. Price hovers near 0.035, with the 7 EMA still below the 25 EMA — textbook bearish alignment. Every bounce in 48 hours has been sold.
Volume profile POC sits near 0.050 — bulk of recent trading happened far above current price. That overhead supply is now resistance.
Invalidation zone is tight: a 4H close back above 0.037 signals the bounce has legs. Until then, path of least resistance points toward 0.032, with lower levels possible if momentum stalls.
My read: the bounce off 0.0215 is real, but it’s a relief rally inside a larger downtrend — not a reversal. The risk isn’t missing the bottom; it’s mistaking a dead-cat bounce for trend change.
Tap $PNT to pull up the chart and see these levels yourself.
I’ll keep tracking whether 0.032 gets tested or 0.037 invalidation holds first — follow so the next read lands in your feed.
Which level are you watching more closely on $PNT right now — the bounce zone or the breakdown zone? 👇
⚠️ Not financial advice. DYOR.
#PNT #Crypto #BinanceSquare
That’s not a trend — that’s a liquidation cascade looking for a resting place.
$PNT printed a 35% green candle, then gave back 24% in the next 4H close. Daily RSI sits at 27.65 — deep oversold, but on this volatility, oversold can outlast most accounts.
4H structure is the cleanest read. Price hovers near 0.035, with the 7 EMA still below the 25 EMA — textbook bearish alignment. Every bounce in 48 hours has been sold.
Volume profile POC sits near 0.050 — bulk of recent trading happened far above current price. That overhead supply is now resistance.
Invalidation zone is tight: a 4H close back above 0.037 signals the bounce has legs. Until then, path of least resistance points toward 0.032, with lower levels possible if momentum stalls.
My read: the bounce off 0.0215 is real, but it’s a relief rally inside a larger downtrend — not a reversal. The risk isn’t missing the bottom; it’s mistaking a dead-cat bounce for trend change.
Tap $PNT to pull up the chart and see these levels yourself.
I’ll keep tracking whether 0.032 gets tested or 0.037 invalidation holds first — follow so the next read lands in your feed.
Which level are you watching more closely on $PNT right now — the bounce zone or the breakdown zone? 👇
⚠️ Not financial advice. DYOR.
#PNT #Crypto #BinanceSquare
5
+62% in 24 hours. And that’s the calm part.
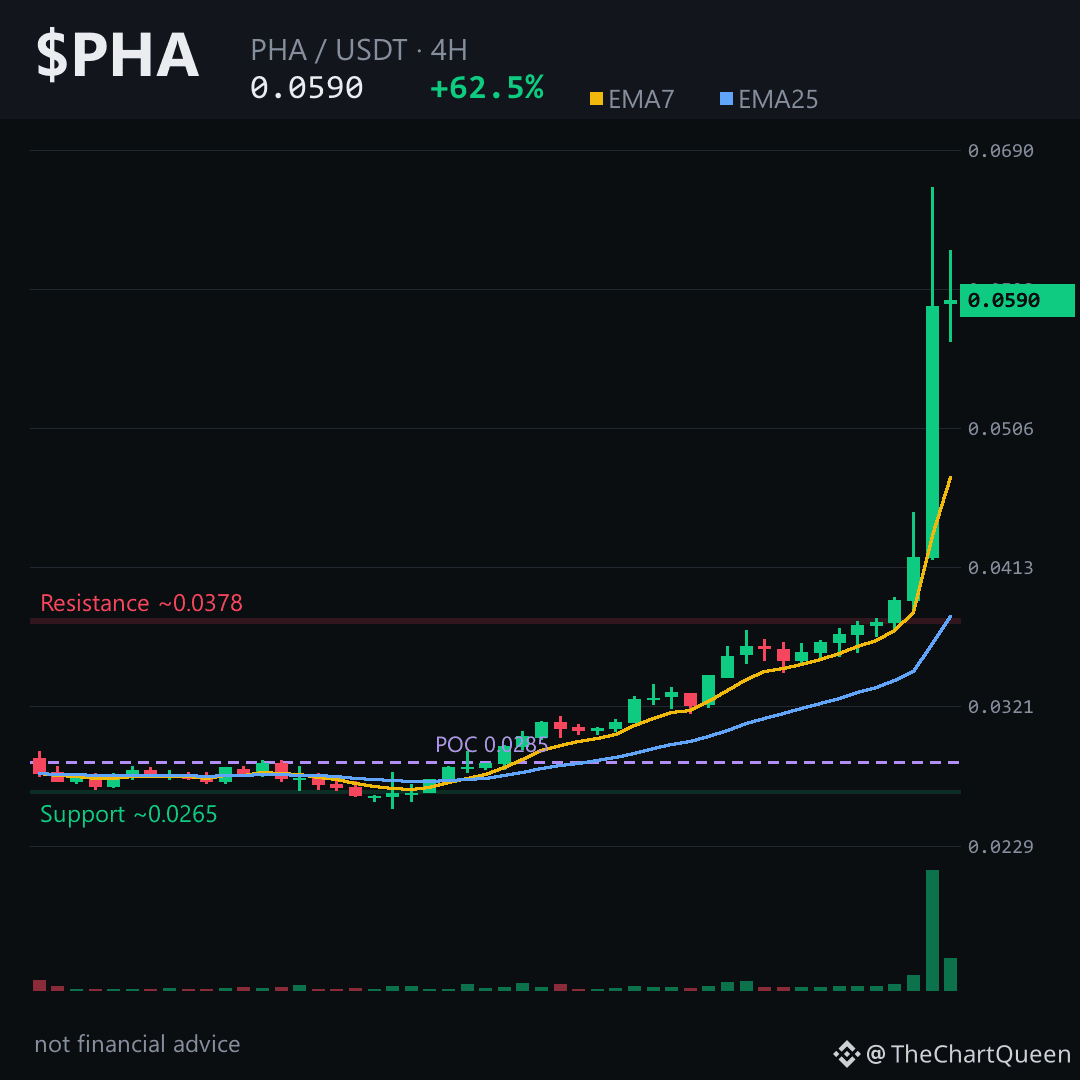
$PHA just printed a 4H candle with a 39% body — the kind of move that resets every level on the chart. Price broke out of a multi-day base near 0.036, sliced through 0.041–0.042, and is now consolidating around 0.059. Volume confirms participation. RSI on 4H and daily is above 90 — not a sell signal by itself, but the margin for error is thin.
Futures internals: funding slightly negative, long/short mildly long. Rally isn’t crowded with leveraged chasers yet. Open interest near $119M — liquid, but it can unwind fast if structure breaks.
The level I’m watching on 4H is ~0.056. That’s the invalidation — a 4H close below it signals the breakout is fading and 0.041 becomes the next magnet. If it holds, objective sits around 0.064.
My read: trend is unambiguously up, but easy money was already made. Risk sits squarely at losing 0.056.
Tap $PHA and check whether price respects that 0.056 shelf — it’s the line separating continuation from exhaustion.
Follow me for the updated read if this level gets tested.
What’s your confidence level on $PHA holding above 0.056 on the next 4H close? 👇
⚠️ Not financial advice. DYOR.
#PHA #Crypto #BinanceSquare
+62% in 24 hours. And that’s the calm part.
$PHA just printed a 4H candle with a 39% body — the kind of move that resets every level on the chart. Price broke out of a multi-day base near 0.036, sliced through 0.041–0.042, and is now consolidating around 0.059. Volume confirms participation. RSI on 4H and daily is above 90 — not a sell signal by itself, but the margin for error is thin.
Futures internals: funding slightly negative, long/short mildly long. Rally isn’t crowded with leveraged chasers yet. Open interest near $119M — liquid, but it can unwind fast if structure breaks.
The level I’m watching on 4H is ~0.056. That’s the invalidation — a 4H close below it signals the breakout is fading and 0.041 becomes the next magnet. If it holds, objective sits around 0.064.
My read: trend is unambiguously up, but easy money was already made. Risk sits squarely at losing 0.056.
Tap $PHA and check whether price respects that 0.056 shelf — it’s the line separating continuation from exhaustion.
Follow me for the updated read if this level gets tested.
What’s your confidence level on $PHA holding above 0.056 on the next 4H close? 👇
⚠️ Not financial advice. DYOR.
#PHA #Crypto #BinanceSquare
$PHA just printed a 4H candle with a 39% body — the kind of move that resets every level on the chart. Price broke out of a multi-day base near 0.036, sliced through 0.041–0.042, and is now consolidating around 0.059. Volume confirms participation. RSI on 4H and daily is above 90 — not a sell signal by itself, but the margin for error is thin.
Futures internals: funding slightly negative, long/short mildly long. Rally isn’t crowded with leveraged chasers yet. Open interest near $119M — liquid, but it can unwind fast if structure breaks.
The level I’m watching on 4H is ~0.056. That’s the invalidation — a 4H close below it signals the breakout is fading and 0.041 becomes the next magnet. If it holds, objective sits around 0.064.
My read: trend is unambiguously up, but easy money was already made. Risk sits squarely at losing 0.056.
Tap $PHA and check whether price respects that 0.056 shelf — it’s the line separating continuation from exhaustion.
Follow me for the updated read if this level gets tested.
What’s your confidence level on $PHA holding above 0.056 on the next 4H close? 👇
⚠️ Not financial advice. DYOR.
#PHA #Crypto #BinanceSquare
29
Imagine a coin that just woke up from a coma and sprinted 84% in one candle — then stopped right below a wall it's been afraid of for months. That's $CREAM right now.
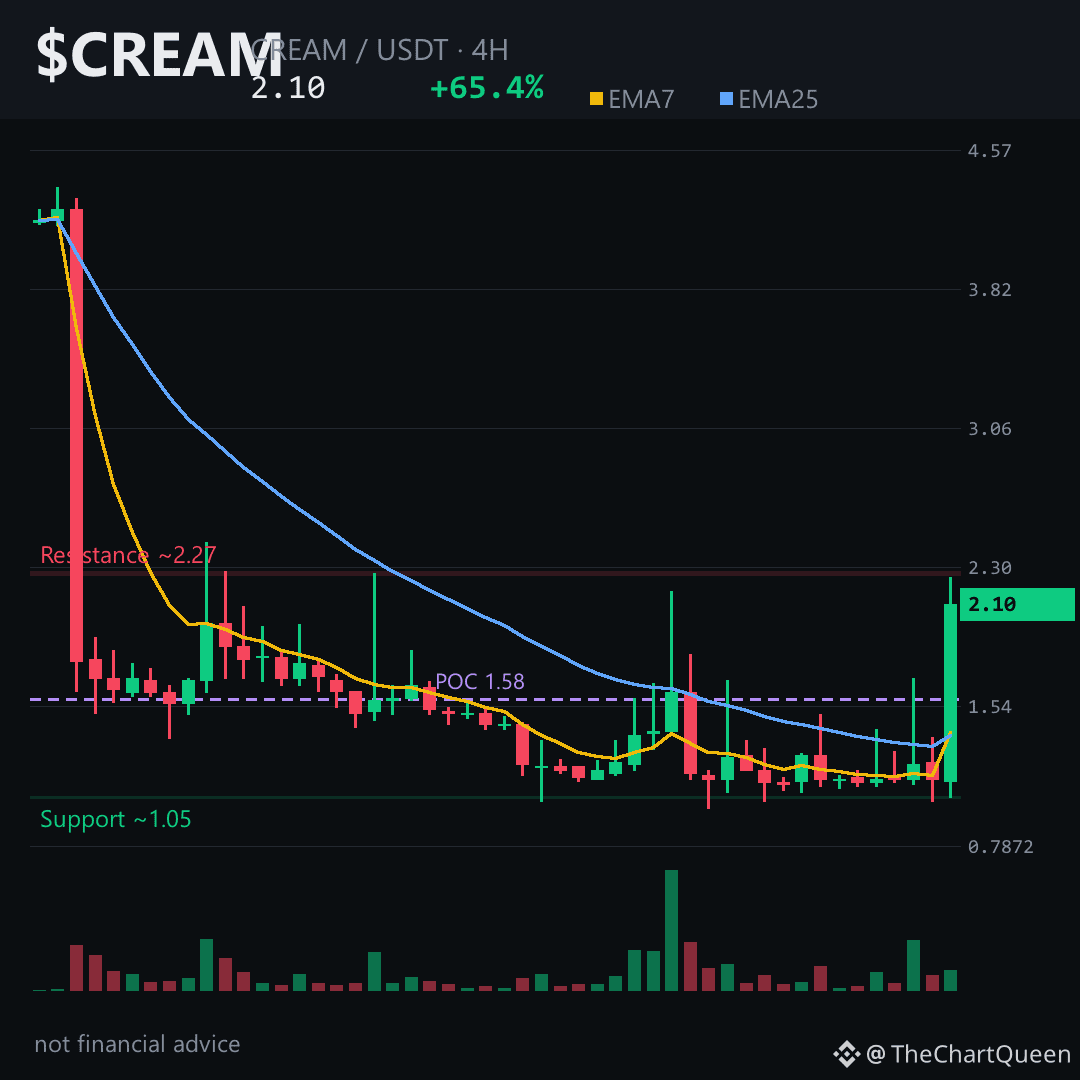
Daily chart still shows a massive unfilled gap from 2.44 to 3.63. Price is at 2.10 — that gap is breathing down its neck. The 4-hour looks alive: momentum curling up, RSI at 65 with room to run. But the bigger picture is still a downtrend that hasn't proven it's over.
My read: bounce inside a downtrend, not a reversal yet. While price holds above 1.99, the 4-hour leans bullish. Push through 2.28 and it knocks on the gap's lower edge. Lose 1.99 on a 4-hour close and the bounce narrative falls apart — 1.80 becomes the next spot buyers might show up.
Futures are empty — zero funding, zero open interest. Spot-driven, thin, emotional. The 84% range in 24 hours says it all.
Tap $CREAM to pull up the chart and see that gap. I'm watching whether price respects 1.99 or gets rejected at the gap's edge — follow and we'll track it together. What's your read on that unfilled gap above? 👇
⚠️ Not financial advice. DYOR.
#CREAM #Crypto #BinanceSquare
Imagine a coin that just woke up from a coma and sprinted 84% in one candle — then stopped right below a wall it's been afraid of for months. That's $CREAM right now.
Daily chart still shows a massive unfilled gap from 2.44 to 3.63. Price is at 2.10 — that gap is breathing down its neck. The 4-hour looks alive: momentum curling up, RSI at 65 with room to run. But the bigger picture is still a downtrend that hasn't proven it's over.
My read: bounce inside a downtrend, not a reversal yet. While price holds above 1.99, the 4-hour leans bullish. Push through 2.28 and it knocks on the gap's lower edge. Lose 1.99 on a 4-hour close and the bounce narrative falls apart — 1.80 becomes the next spot buyers might show up.
Futures are empty — zero funding, zero open interest. Spot-driven, thin, emotional. The 84% range in 24 hours says it all.
Tap $CREAM to pull up the chart and see that gap. I'm watching whether price respects 1.99 or gets rejected at the gap's edge — follow and we'll track it together. What's your read on that unfilled gap above? 👇
⚠️ Not financial advice. DYOR.
#CREAM #Crypto #BinanceSquare
Daily chart still shows a massive unfilled gap from 2.44 to 3.63. Price is at 2.10 — that gap is breathing down its neck. The 4-hour looks alive: momentum curling up, RSI at 65 with room to run. But the bigger picture is still a downtrend that hasn't proven it's over.
My read: bounce inside a downtrend, not a reversal yet. While price holds above 1.99, the 4-hour leans bullish. Push through 2.28 and it knocks on the gap's lower edge. Lose 1.99 on a 4-hour close and the bounce narrative falls apart — 1.80 becomes the next spot buyers might show up.
Futures are empty — zero funding, zero open interest. Spot-driven, thin, emotional. The 84% range in 24 hours says it all.
Tap $CREAM to pull up the chart and see that gap. I'm watching whether price respects 1.99 or gets rejected at the gap's edge — follow and we'll track it together. What's your read on that unfilled gap above? 👇
⚠️ Not financial advice. DYOR.
#CREAM #Crypto #BinanceSquare
1
Everyone thinks this $SOL breakout is the start of a clean run to 120.
The chart disagrees — the real move is hiding in a gap most people won't see.
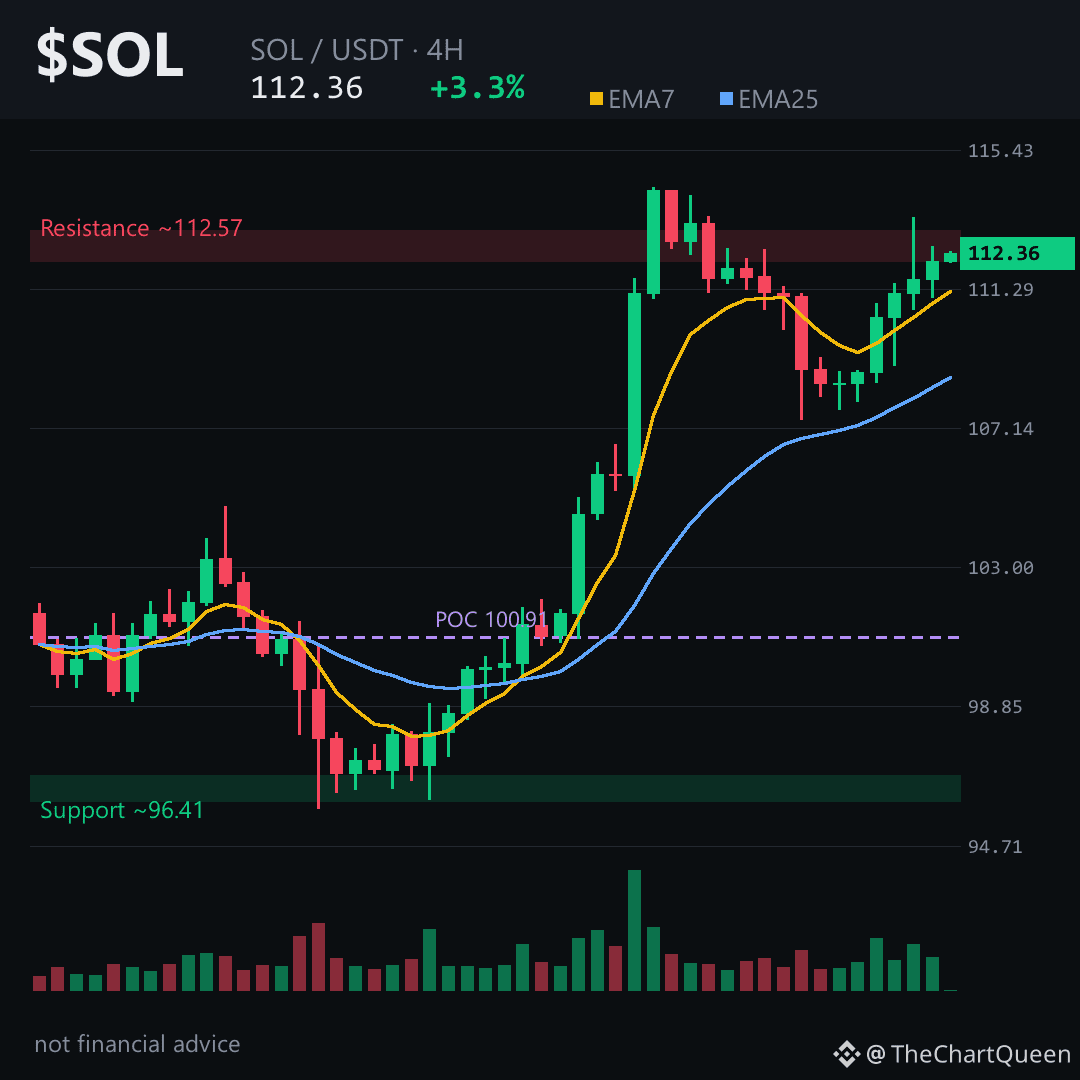
That 4H candle at 00:00 dumped 111 → 107.4, then price climbed back through 109 in under eight hours. Classic liquidity grab, not conviction. The crowd is now heavily long — funding positive, longs nearly 2-to-1. When the majority leans this hard, the easy money is usually the other direction.
The 4H tells the cleanest story. Support sits around 109 — the unfilled bullish gap. Lose 108 on a 4H close and structure weakens fast, next leg toward 105. Above, a push through 112.5 opens 117–118, where the last real supply sits. Tap $SOL to pull up the chart.
My read: momentum continuation running on borrowed fuel. Expect a pullback before any serious extension.
I'll be watching whether the 109 gap holds or fills — follow so you see that read when it lands.
Which level are you trusting more on $SOL right now, the gap at 109 or the breakout above 112.5? 👇
Not financial advice. DYOR.
#SOL #Solana #Crypto #BinanceSquare
Everyone thinks this $SOL breakout is the start of a clean run to 120.
The chart disagrees — the real move is hiding in a gap most people won't see.
That 4H candle at 00:00 dumped 111 → 107.4, then price climbed back through 109 in under eight hours. Classic liquidity grab, not conviction. The crowd is now heavily long — funding positive, longs nearly 2-to-1. When the majority leans this hard, the easy money is usually the other direction.
The 4H tells the cleanest story. Support sits around 109 — the unfilled bullish gap. Lose 108 on a 4H close and structure weakens fast, next leg toward 105. Above, a push through 112.5 opens 117–118, where the last real supply sits. Tap $SOL to pull up the chart.
My read: momentum continuation running on borrowed fuel. Expect a pullback before any serious extension.
I'll be watching whether the 109 gap holds or fills — follow so you see that read when it lands.
Which level are you trusting more on $SOL right now, the gap at 109 or the breakout above 112.5? 👇
Not financial advice. DYOR.
#SOL #Solana #Crypto #BinanceSquare
The chart disagrees — the real move is hiding in a gap most people won't see.
That 4H candle at 00:00 dumped 111 → 107.4, then price climbed back through 109 in under eight hours. Classic liquidity grab, not conviction. The crowd is now heavily long — funding positive, longs nearly 2-to-1. When the majority leans this hard, the easy money is usually the other direction.
The 4H tells the cleanest story. Support sits around 109 — the unfilled bullish gap. Lose 108 on a 4H close and structure weakens fast, next leg toward 105. Above, a push through 112.5 opens 117–118, where the last real supply sits. Tap $SOL to pull up the chart.
My read: momentum continuation running on borrowed fuel. Expect a pullback before any serious extension.
I'll be watching whether the 109 gap holds or fills — follow so you see that read when it lands.
Which level are you trusting more on $SOL right now, the gap at 109 or the breakout above 112.5? 👇
Not financial advice. DYOR.
#SOL #Solana #Crypto #BinanceSquare
35
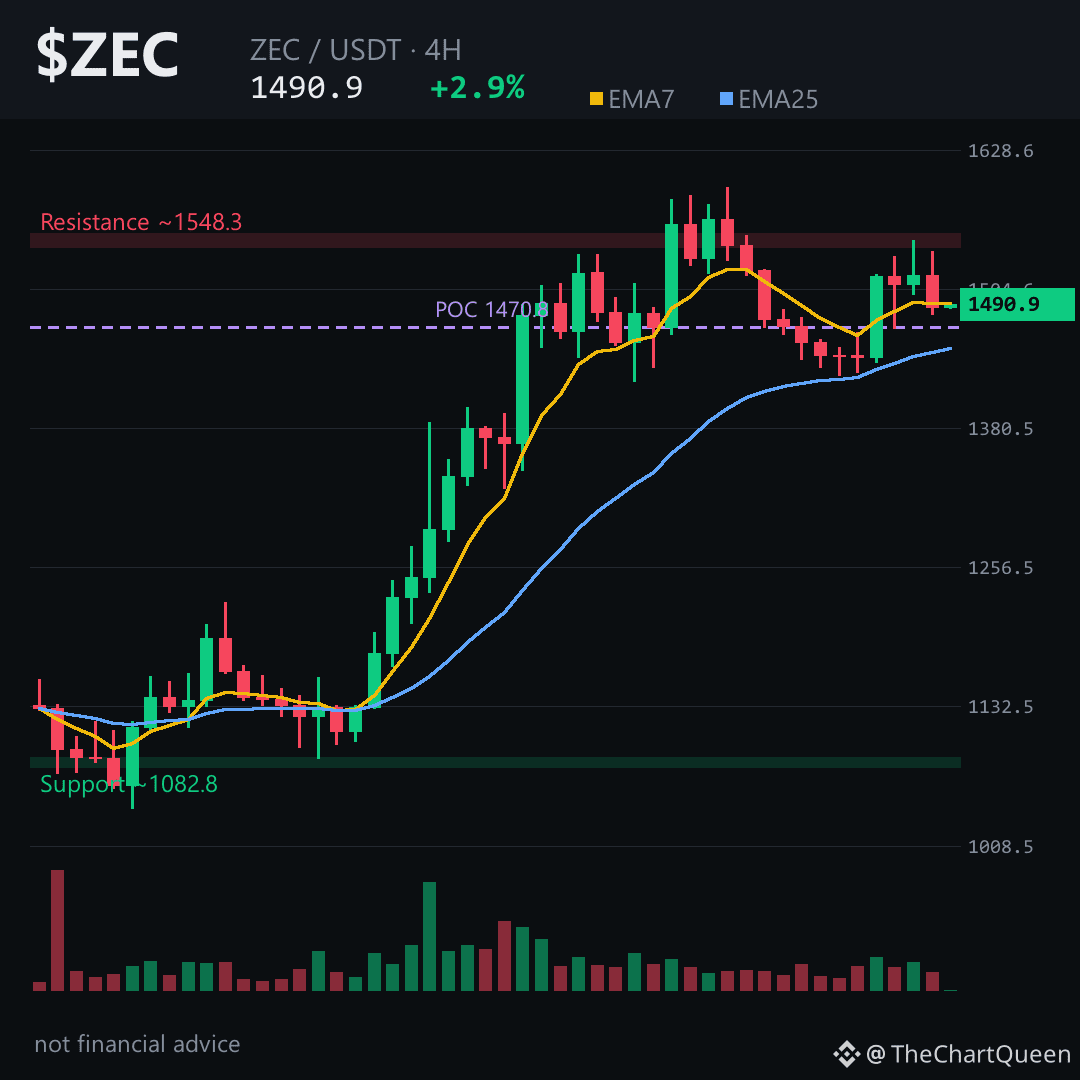
$ZEC just printed a 5% four-hour candle, then gave half of it back. That’s not weakness — that’s a retest in progress.
Daily chart: price sits above a bullish gap from the mid‑1380s, short‑term averages favor continuation. Futures positioning is heavily short, long/short ratio <1, yet funding stays positive – shorts are paying to be short while price climbs.
On the 4H, the volume point of control sits near 1470, acting as a magnet. As long as $ZEC holds the 1400 area, the bias stays bullish. Lose that zone on a 4H close and the read flips.
If it holds, the next upside target is near the 1600 area, aligning with the macro objective. The risk is a slow bleed back into the low‑1400s, shaking out late longs.
Follow me for the updated read once price either reclaims 1500 or loses the 1400 zone. Which level are you trusting more right now on $ZEC 👇
⚠️ Not financial advice. DYOR.
#ZEC #Zcash #Crypto #BinanceSquare
$ZEC just printed a 5% four-hour candle, then gave half of it back. That’s not weakness — that’s a retest in progress.
Daily chart: price sits above a bullish gap from the mid‑1380s, short‑term averages favor continuation. Futures positioning is heavily short, long/short ratio <1, yet funding stays positive – shorts are paying to be short while price climbs.
On the 4H, the volume point of control sits near 1470, acting as a magnet. As long as $ZEC holds the 1400 area, the bias stays bullish. Lose that zone on a 4H close and the read flips.
If it holds, the next upside target is near the 1600 area, aligning with the macro objective. The risk is a slow bleed back into the low‑1400s, shaking out late longs.
Follow me for the updated read once price either reclaims 1500 or loses the 1400 zone. Which level are you trusting more right now on $ZEC 👇
⚠️ Not financial advice. DYOR.
#ZEC #Zcash #Crypto #BinanceSquare
Daily chart: price sits above a bullish gap from the mid‑1380s, short‑term averages favor continuation. Futures positioning is heavily short, long/short ratio <1, yet funding stays positive – shorts are paying to be short while price climbs.
On the 4H, the volume point of control sits near 1470, acting as a magnet. As long as $ZEC holds the 1400 area, the bias stays bullish. Lose that zone on a 4H close and the read flips.
If it holds, the next upside target is near the 1600 area, aligning with the macro objective. The risk is a slow bleed back into the low‑1400s, shaking out late longs.
Follow me for the updated read once price either reclaims 1500 or loses the 1400 zone. Which level are you trusting more right now on $ZEC 👇
⚠️ Not financial advice. DYOR.
#ZEC #Zcash #Crypto #BinanceSquare
1
92
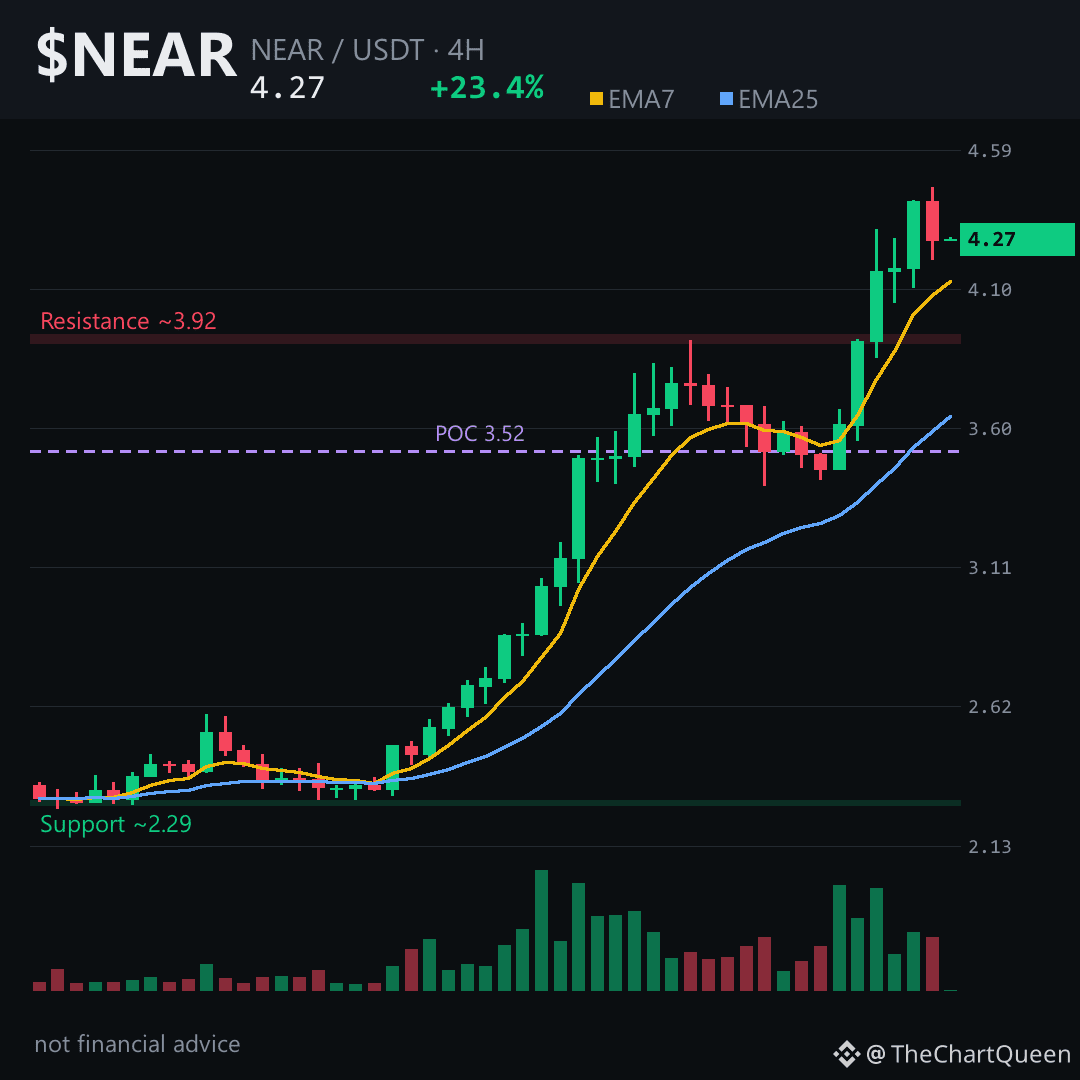
Imagine walking into a coffee shop and the barista hands you a triple espresso you didn’t order. That’s $NEAR right now — up over 23% in a day, and the chart is buzzing like it had one too many shots.
The 4-hour picture is clean. Price exploded from the low 3.40s through 4.00, leaving an unfilled bullish gap between roughly 3.92 and 4.05 — a pocket the market often revisits before deciding if it’s truly done. Price is hovering around 4.27, moving averages stacked bullishly. But RSI is deep in overbought territory — usually meaning a sideways pause or a quick dip toward that gap.
Futures add a wrinkle. Funding is slightly positive, long/short ratio leans heavily long — around 1.85. That’s a crowded boat, which can make the next shakeout feel sharper.
The level that matters most on the 4-hour is 4.03–4.05. That’s the floor of the gap and the last big breakout shelf. If $NEAR holds above there on any pullback, the path toward 4.63 stays open. Lose that shelf on a solid 4-hour close, and the momentum read shifts from bullish to “let’s wait and see.”
My read: trend is undeniably up, but the easy part may be behind us. A cool-down near 4.05 would build a healthier base than another straight-up leg.
Tap $NEAR to pull up the chart and see how clean that gap really looks.
I’ll be updating this read as the gap gets tested or left behind — follow so it lands on your feed.
Which zone are you watching more closely on NEAR right now — the gap below or the high above? 👇
⚠️ Not financial advice. DYOR.
#NEAR #NEARProtocol #Crypto #BinanceSquare
Imagine walking into a coffee shop and the barista hands you a triple espresso you didn’t order. That’s $NEAR right now — up over 23% in a day, and the chart is buzzing like it had one too many shots.
The 4-hour picture is clean. Price exploded from the low 3.40s through 4.00, leaving an unfilled bullish gap between roughly 3.92 and 4.05 — a pocket the market often revisits before deciding if it’s truly done. Price is hovering around 4.27, moving averages stacked bullishly. But RSI is deep in overbought territory — usually meaning a sideways pause or a quick dip toward that gap.
Futures add a wrinkle. Funding is slightly positive, long/short ratio leans heavily long — around 1.85. That’s a crowded boat, which can make the next shakeout feel sharper.
The level that matters most on the 4-hour is 4.03–4.05. That’s the floor of the gap and the last big breakout shelf. If $NEAR holds above there on any pullback, the path toward 4.63 stays open. Lose that shelf on a solid 4-hour close, and the momentum read shifts from bullish to “let’s wait and see.”
My read: trend is undeniably up, but the easy part may be behind us. A cool-down near 4.05 would build a healthier base than another straight-up leg.
Tap $NEAR to pull up the chart and see how clean that gap really looks.
I’ll be updating this read as the gap gets tested or left behind — follow so it lands on your feed.
Which zone are you watching more closely on NEAR right now — the gap below or the high above? 👇
⚠️ Not financial advice. DYOR.
#NEAR #NEARProtocol #Crypto #BinanceSquare
The 4-hour picture is clean. Price exploded from the low 3.40s through 4.00, leaving an unfilled bullish gap between roughly 3.92 and 4.05 — a pocket the market often revisits before deciding if it’s truly done. Price is hovering around 4.27, moving averages stacked bullishly. But RSI is deep in overbought territory — usually meaning a sideways pause or a quick dip toward that gap.
Futures add a wrinkle. Funding is slightly positive, long/short ratio leans heavily long — around 1.85. That’s a crowded boat, which can make the next shakeout feel sharper.
The level that matters most on the 4-hour is 4.03–4.05. That’s the floor of the gap and the last big breakout shelf. If $NEAR holds above there on any pullback, the path toward 4.63 stays open. Lose that shelf on a solid 4-hour close, and the momentum read shifts from bullish to “let’s wait and see.”
My read: trend is undeniably up, but the easy part may be behind us. A cool-down near 4.05 would build a healthier base than another straight-up leg.
Tap $NEAR to pull up the chart and see how clean that gap really looks.
I’ll be updating this read as the gap gets tested or left behind — follow so it lands on your feed.
Which zone are you watching more closely on NEAR right now — the gap below or the high above? 👇
⚠️ Not financial advice. DYOR.
#NEAR #NEARProtocol #Crypto #BinanceSquare
60
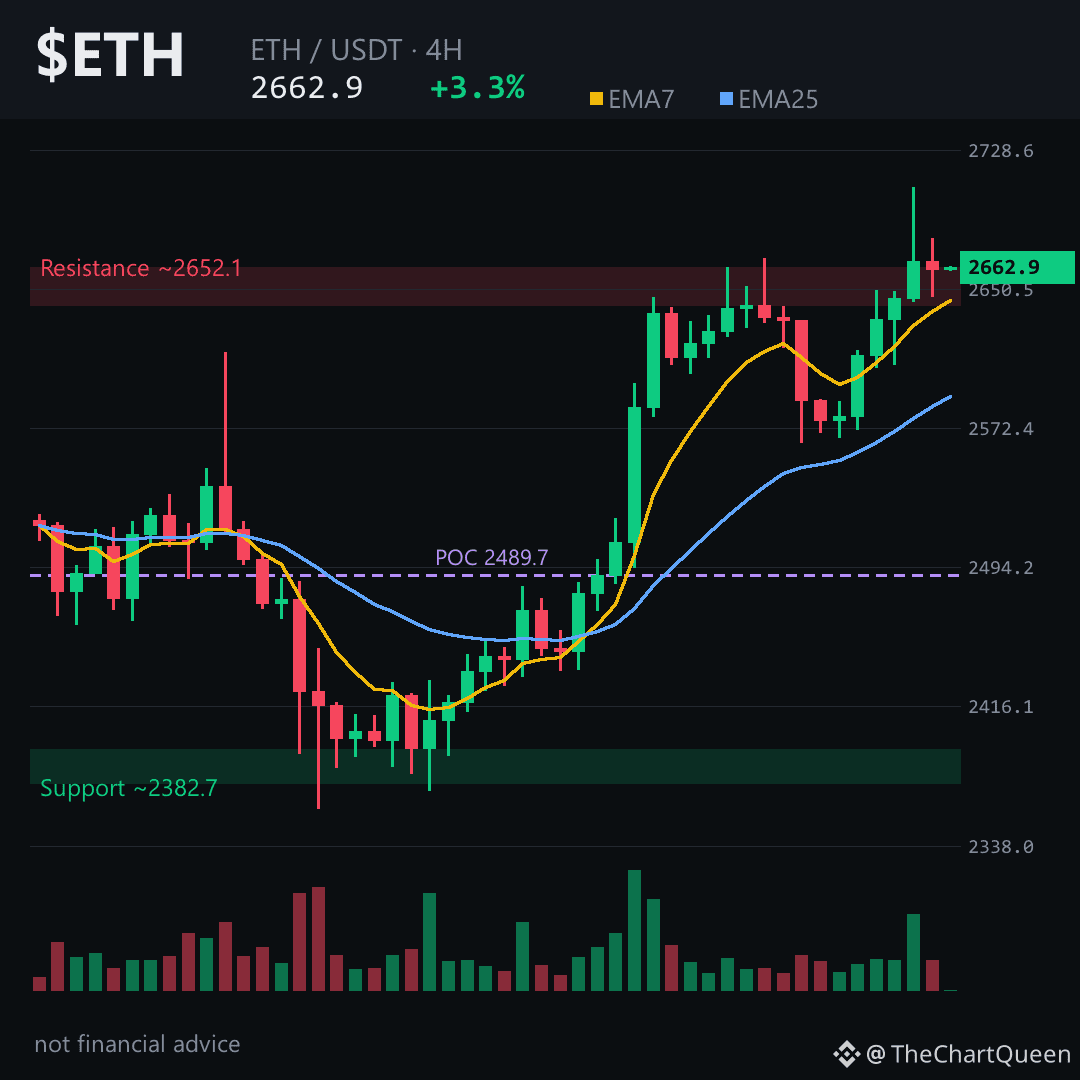
24 hours ago $ETH was sitting near 2,567. Right now it’s knocking on 2,660 — a nearly 4% climb while most of the market chops sideways. That kind of relative strength usually means something.
Price looks strong, but internals are flashing caution. Funding is positive — longs are paying shorts. Normal in an uptrend, but it means the rally is crowded. When too many people lean the same way, pullbacks come faster and cut deeper. Not a reason to fade it. Just respect your levels.
The 4H chart tells the cleanest story. Price broke back above 2,607 — the top of an unfilled bullish gap — and it held as support on the retest. That separates a real bid from a dead-cat bounce. As long as $ETH holds the 2,570 zone on a 4H close, the path of least resistance points toward 2,780. Lose that zone, and the read is simply off the table.
My read: momentum is real, but it’s running on borrowed conviction. 2,570 is the line that matters — above it, bulls stay in control; below it, the crowded trade unwinds fast.
Tap $ETH to pull up the chart and see these levels for yourself — sometimes the price action tells you more than any indicator will.
What’s the level you’re watching most closely on ETH right now 👇
Follow for the next read on this chart.
⚠️ Not financial advice. DYOR.
#ETH #Ethereum #Crypto #BinanceSquare
24 hours ago $ETH was sitting near 2,567. Right now it’s knocking on 2,660 — a nearly 4% climb while most of the market chops sideways. That kind of relative strength usually means something.
Price looks strong, but internals are flashing caution. Funding is positive — longs are paying shorts. Normal in an uptrend, but it means the rally is crowded. When too many people lean the same way, pullbacks come faster and cut deeper. Not a reason to fade it. Just respect your levels.
The 4H chart tells the cleanest story. Price broke back above 2,607 — the top of an unfilled bullish gap — and it held as support on the retest. That separates a real bid from a dead-cat bounce. As long as $ETH holds the 2,570 zone on a 4H close, the path of least resistance points toward 2,780. Lose that zone, and the read is simply off the table.
My read: momentum is real, but it’s running on borrowed conviction. 2,570 is the line that matters — above it, bulls stay in control; below it, the crowded trade unwinds fast.
Tap $ETH to pull up the chart and see these levels for yourself — sometimes the price action tells you more than any indicator will.
What’s the level you’re watching most closely on ETH right now 👇
Follow for the next read on this chart.
⚠️ Not financial advice. DYOR.
#ETH #Ethereum #Crypto #BinanceSquare
Price looks strong, but internals are flashing caution. Funding is positive — longs are paying shorts. Normal in an uptrend, but it means the rally is crowded. When too many people lean the same way, pullbacks come faster and cut deeper. Not a reason to fade it. Just respect your levels.
The 4H chart tells the cleanest story. Price broke back above 2,607 — the top of an unfilled bullish gap — and it held as support on the retest. That separates a real bid from a dead-cat bounce. As long as $ETH holds the 2,570 zone on a 4H close, the path of least resistance points toward 2,780. Lose that zone, and the read is simply off the table.
My read: momentum is real, but it’s running on borrowed conviction. 2,570 is the line that matters — above it, bulls stay in control; below it, the crowded trade unwinds fast.
Tap $ETH to pull up the chart and see these levels for yourself — sometimes the price action tells you more than any indicator will.
What’s the level you’re watching most closely on ETH right now 👇
Follow for the next read on this chart.
⚠️ Not financial advice. DYOR.
#ETH #Ethereum #Crypto #BinanceSquare
65
$81713.
The last 48 hours printed 8 green candles against 4 red, yet the 4-hour RSI sits at 70.81 — momentum is stretched, but the structure hasn't cracked.
The read: price is grinding higher inside a rising channel, but the futures market is quietly leaning short. The long/short ratio reads 0.87 — below 1 — while funding is barely positive. That combo often precedes a squeeze, but not necessarily an immediate one. The daily chart holds the cleaner story: a bullish gap sits unfilled between roughly 77.2K and 80.8K, and price is currently trading just above its upper edge.
The levels that matter: on the 4-hour picture, the pivot zone is around 81.2K. If $BTC holds that area, the objective extends toward the 84.1K zone. Lose the 79.6K area on a 4-hour close and the bullish read is off the table — that's where the gap starts to absorb price. Tap $BTC to pull up the chart and read these levels yourself.
My read: the daily trend remains intact, but chasing strength above 81K with RSI this hot carries asymmetric downside. I'd rather see a flush back into the low 80s before trusting continuation.
Follow me for the updated read if price tests that unfilled zone — the reaction there tells the real story.
Which level are you watching more closely on $BTC right now — the 84K objective or the 79.6K invalidation? 👇
⚠️ Not financial advice. DYOR.
#BTC #Bitcoin #Crypto #BinanceSquare
$81713.
The last 48 hours printed 8 green candles against 4 red, yet the 4-hour RSI sits at 70.81 — momentum is stretched, but the structure hasn't cracked.
The read: price is grinding higher inside a rising channel, but the futures market is quietly leaning short. The long/short ratio reads 0.87 — below 1 — while funding is barely positive. That combo often precedes a squeeze, but not necessarily an immediate one. The daily chart holds the cleaner story: a bullish gap sits unfilled between roughly 77.2K and 80.8K, and price is currently trading just above its upper edge.
The levels that matter: on the 4-hour picture, the pivot zone is around 81.2K. If $BTC holds that area, the objective extends toward the 84.1K zone. Lose the 79.6K area on a 4-hour close and the bullish read is off the table — that's where the gap starts to absorb price. Tap $BTC to pull up the chart and read these levels yourself.
My read: the daily trend remains intact, but chasing strength above 81K with RSI this hot carries asymmetric downside. I'd rather see a flush back into the low 80s before trusting continuation.
Follow me for the updated read if price tests that unfilled zone — the reaction there tells the real story.
Which level are you watching more closely on $BTC right now — the 84K objective or the 79.6K invalidation? 👇
⚠️ Not financial advice. DYOR.
#BTC #Bitcoin #Crypto #BinanceSquare
The last 48 hours printed 8 green candles against 4 red, yet the 4-hour RSI sits at 70.81 — momentum is stretched, but the structure hasn't cracked.
The read: price is grinding higher inside a rising channel, but the futures market is quietly leaning short. The long/short ratio reads 0.87 — below 1 — while funding is barely positive. That combo often precedes a squeeze, but not necessarily an immediate one. The daily chart holds the cleaner story: a bullish gap sits unfilled between roughly 77.2K and 80.8K, and price is currently trading just above its upper edge.
The levels that matter: on the 4-hour picture, the pivot zone is around 81.2K. If $BTC holds that area, the objective extends toward the 84.1K zone. Lose the 79.6K area on a 4-hour close and the bullish read is off the table — that's where the gap starts to absorb price. Tap $BTC to pull up the chart and read these levels yourself.
My read: the daily trend remains intact, but chasing strength above 81K with RSI this hot carries asymmetric downside. I'd rather see a flush back into the low 80s before trusting continuation.
Follow me for the updated read if price tests that unfilled zone — the reaction there tells the real story.
Which level are you watching more closely on $BTC right now — the 84K objective or the 79.6K invalidation? 👇
⚠️ Not financial advice. DYOR.
#BTC #Bitcoin #Crypto #BinanceSquare
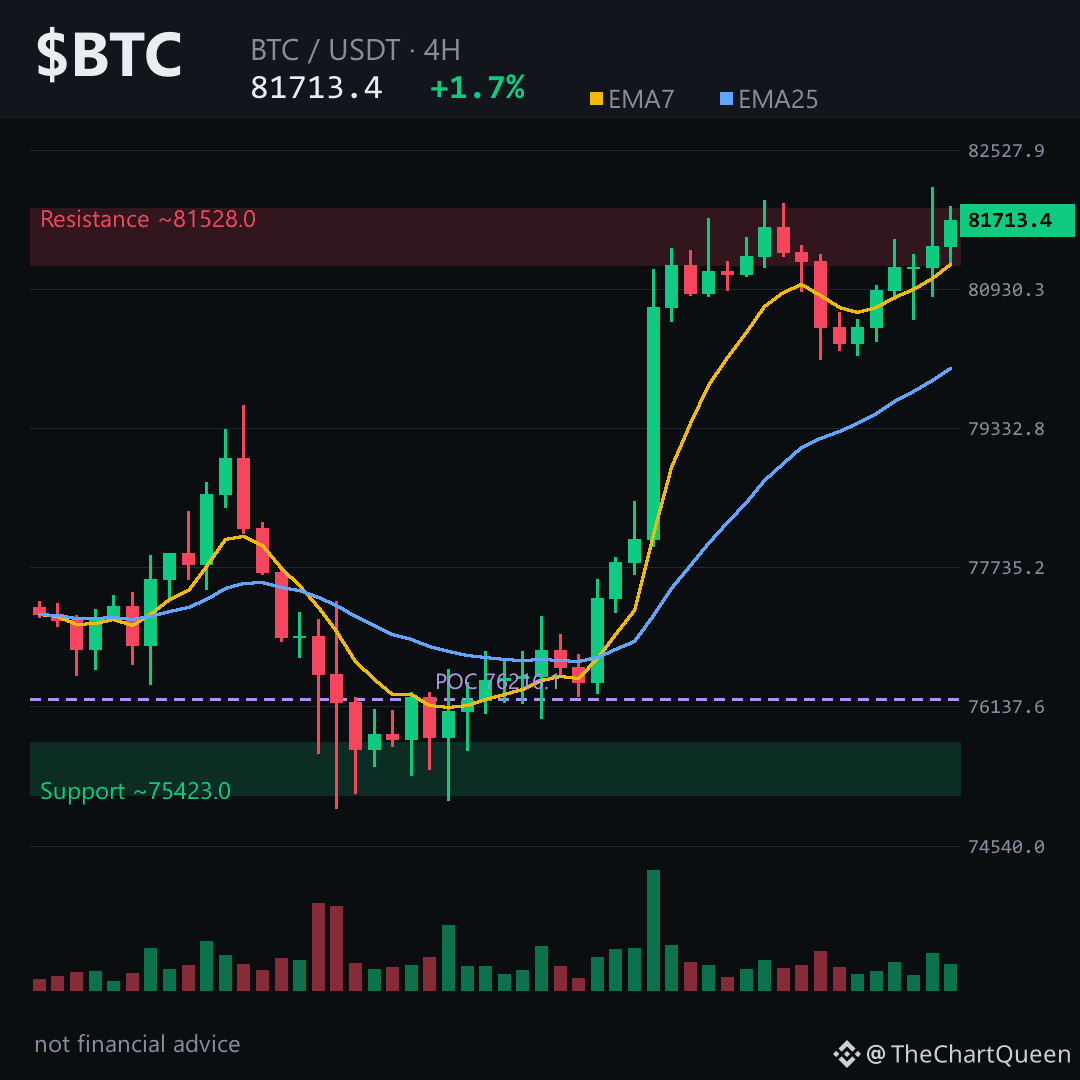
79
ເຂົ້າສູ່ລະບົບເພື່ອສຳຫຼວດເນື້ອຫາເພີ່ມເຕີມ
ເຂົ້າຮ່ວມກຸ່ມຜູ້ໃຊ້ຄຣິບໂຕທົ່ວໂລກໃນ Binance Square.
⚡️ ໄດ້ຮັບຂໍ້ມູນຫຼ້າສຸດ ແລະ ທີ່ມີປະໂຫຍດກ່ຽວກັບຄຣິບໂຕ.
💬 ໄດ້ຮັບຄວາມໄວ້ວາງໃຈຈາກຕະຫຼາດແລກປ່ຽນຄຣິບໂຕທີ່ໃຫຍ່ທີ່ສຸດໃນໂລກ.
👍 ຄົ້ນຫາຂໍ້ມູນເຊີງເລິກທີ່ແທ້ຈາກນັກສ້າງທີ່ໄດ້ຮັບການຢືນຢັນ.
ອີເມວ / ເບີໂທລະສັບ
ຫົວຂໍ້ທີ່ກໍາລັງນິຍົມ
GoldFallsTo$4144
1,256 views
35 ກຳລັງສົນທະນາ
#GoldFallsTo$4144 🚨 GOLD JUST GOT HIT HARD. $4,144 IS THE LEVEL TO WATCH! 🥇📉
Gold prices took a drop now trading near $4,144 per ounce as traders rethink the Federal Reserve’s path on interest rates.
What’s pushing gold lower? Here’s what’s happening:
🔴 Fed hike bets are rising → When interest rates go up holding gold becomes more expensive because it doesn’t pay any interest. That makes bonds or savings accounts look better by comparison.
🛢️ Oil prices are climbing → Higher oil means inflation risks. That pushes banks to keep rates higher for longer which hurts gold.
💵 Yields and dollar strength → When bond yields rise—especially U.S. Treasuries—and the dollar strengthens investors often move out of gold into assets that earn returns.
So the big debate now: Is this a short-term correction after golds massive rally in 2026… or is it the start of a deeper trend reversal?
👀 Traders need to keep an eye on two levels:
- $4,200. A potential support zone
- $4,144. A critical level where price action could shift either way
Will gold bounce back, from here?. Will we see more downside pressure ahead?
#GOLD #Khan62 #trading #Investing
$PAXG · $BTC · $XAG
Khan 62
·0 ຖືກໃຈ
·103 views
QNTFallsOver40%FromMorningHigh
7,693 views
285 ກຳລັງສົນທະນາ
KospiFalls2.7%SamsungSKHynixDropOver5%
370 views
65 ກຳລັງສົນທະນາ