

Giannis Andreou
1.3k ໂພສ

Giannis Andreou
ລາຍງານ
ບລັອກຜູ້ໃຊ້
Crypto analyst. 2000 Video content on YouTube - Giannis Andreou | Bitmern Mining Founder & CEO | Author
1.4K+ ກໍາລັງຕິດຕາມ
29.3K+ ຜູ້ຕິດຕາມ
19.9K+ Liked
ໂພສ
ທັງໝົດ
ວົງຢືມ
ວີດີໂອ
ຖ່າຍທອດສົດ
ປັກໝຸດ
🔥 Throwback to One of My Most Insightful Crypto Conversations! 🔥
Two years ago, I had the chance to sit down with CZ for a deep dive into the future of Web3, the challenges of global adoption, and the mindset behind building in a fast-moving crypto world.
From discussing Bitcoin’s resilience 🟧, to the rise of BNB 🚀, to exploring how stablecoins would reshape global finance 💴 → it was one of those conversations that sticks with you long after the cameras stop rolling.
If you missed it back then, now’s the perfect time to revisit it— the insights are still gold. ✨
$BTC $ETH $BNB
🔥 Throwback to One of My Most Insightful Crypto Conversations! 🔥
Two years ago, I had the chance to sit down with CZ for a deep dive into the future of Web3, the challenges of global adoption, and the mindset behind building in a fast-moving crypto world.
From discussing Bitcoin’s resilience 🟧, to the rise of BNB 🚀, to exploring how stablecoins would reshape global finance 💴 → it was one of those conversations that sticks with you long after the cameras stop rolling.
If you missed it back then, now’s the perfect time to revisit it— the insights are still gold. ✨
$BTC $ETH $BNB
Two years ago, I had the chance to sit down with CZ for a deep dive into the future of Web3, the challenges of global adoption, and the mindset behind building in a fast-moving crypto world.
From discussing Bitcoin’s resilience 🟧, to the rise of BNB 🚀, to exploring how stablecoins would reshape global finance 💴 → it was one of those conversations that sticks with you long after the cameras stop rolling.
If you missed it back then, now’s the perfect time to revisit it— the insights are still gold. ✨
$BTC $ETH $BNB
26
18
159
51.5k
🟢 $ONDO STILL HAS A CLEAR ROADMAP
$ONDO is pulling back, but the bigger structure on my chart is still intact.
As long as the rising trendline keeps holding, I’m watching the next major levels at:
$0.64 → $0.77 → $0.86 → $1.13
A short-term correction here would not surprise me.
But if buyers defend the structure and reclaim momentum, $ONDO could start working through these resistance levels one by one.
🟢 $ONDO STILL HAS A CLEAR ROADMAP
$ONDO is pulling back, but the bigger structure on my chart is still intact.
As long as the rising trendline keeps holding, I’m watching the next major levels at:
$0.64 → $0.77 → $0.86 → $1.13
A short-term correction here would not surprise me.
But if buyers defend the structure and reclaim momentum, $ONDO could start working through these resistance levels one by one.
$ONDO is pulling back, but the bigger structure on my chart is still intact.
As long as the rising trendline keeps holding, I’m watching the next major levels at:
$0.64 → $0.77 → $0.86 → $1.13
A short-term correction here would not surprise me.
But if buyers defend the structure and reclaim momentum, $ONDO could start working through these resistance levels one by one.
1
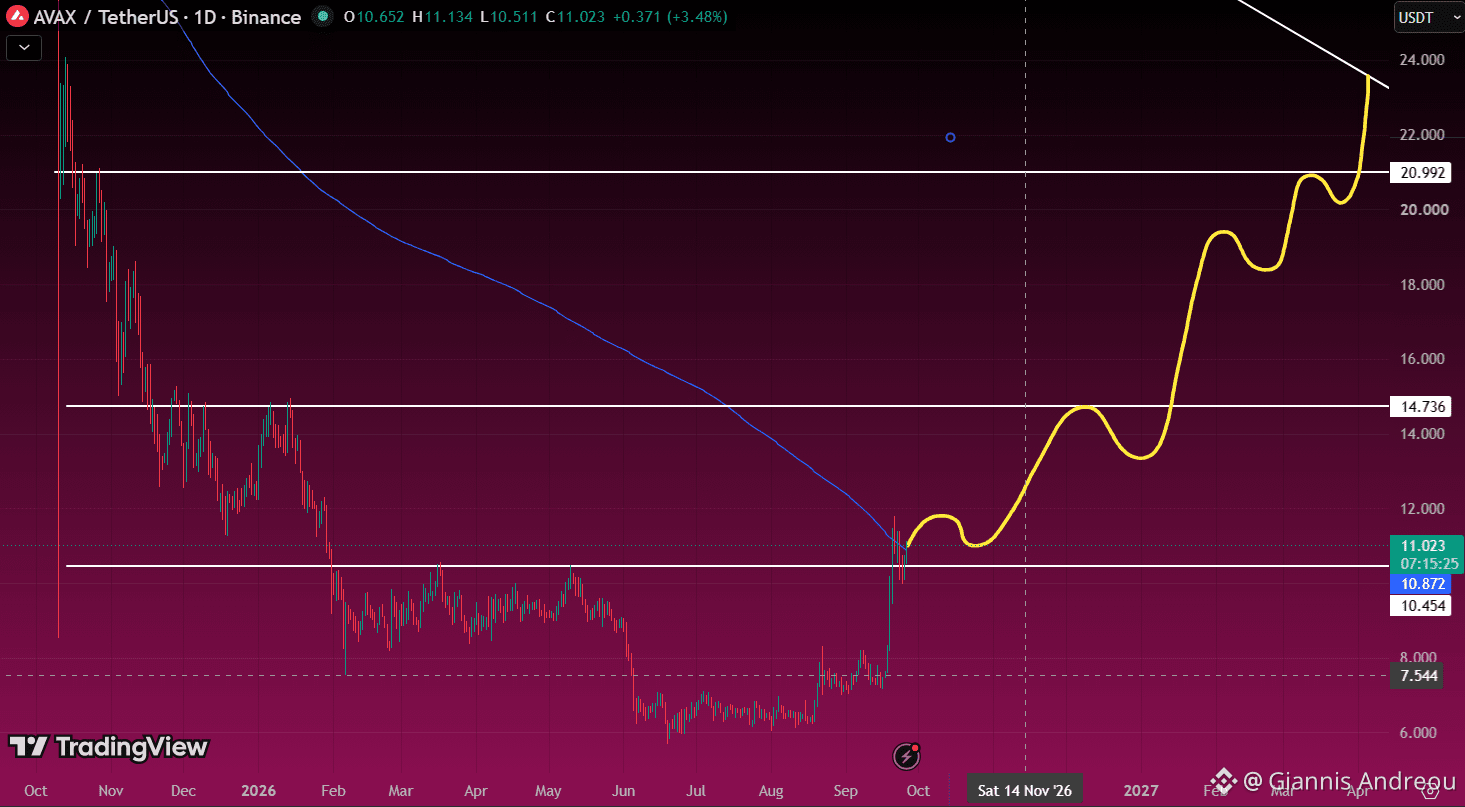
🔺 $AVAX IS FIGHTING THE 360 SMA RIGHT NOW
This is the level I’ve been waiting for.
$AVAX is trying to reclaim the 360 SMA around $10.87.
If we get a clean breakout and hold above it, the next levels on my chart are:
$14.7 → $21 → $23-$24 trendline
A successful reclaim here could completely change the short-term structure.
First break the 360 SMA.
Then things can start moving fast.
🔺 $AVAX IS FIGHTING THE 360 SMA RIGHT NOW
This is the level I’ve been waiting for.
$AVAX is trying to reclaim the 360 SMA around $10.87.
If we get a clean breakout and hold above it, the next levels on my chart are:
$14.7 → $21 → $23-$24 trendline
A successful reclaim here could completely change the short-term structure.
First break the 360 SMA.
Then things can start moving fast.
This is the level I’ve been waiting for.
$AVAX is trying to reclaim the 360 SMA around $10.87.
If we get a clean breakout and hold above it, the next levels on my chart are:
$14.7 → $21 → $23-$24 trendline
A successful reclaim here could completely change the short-term structure.
First break the 360 SMA.
Then things can start moving fast.
58
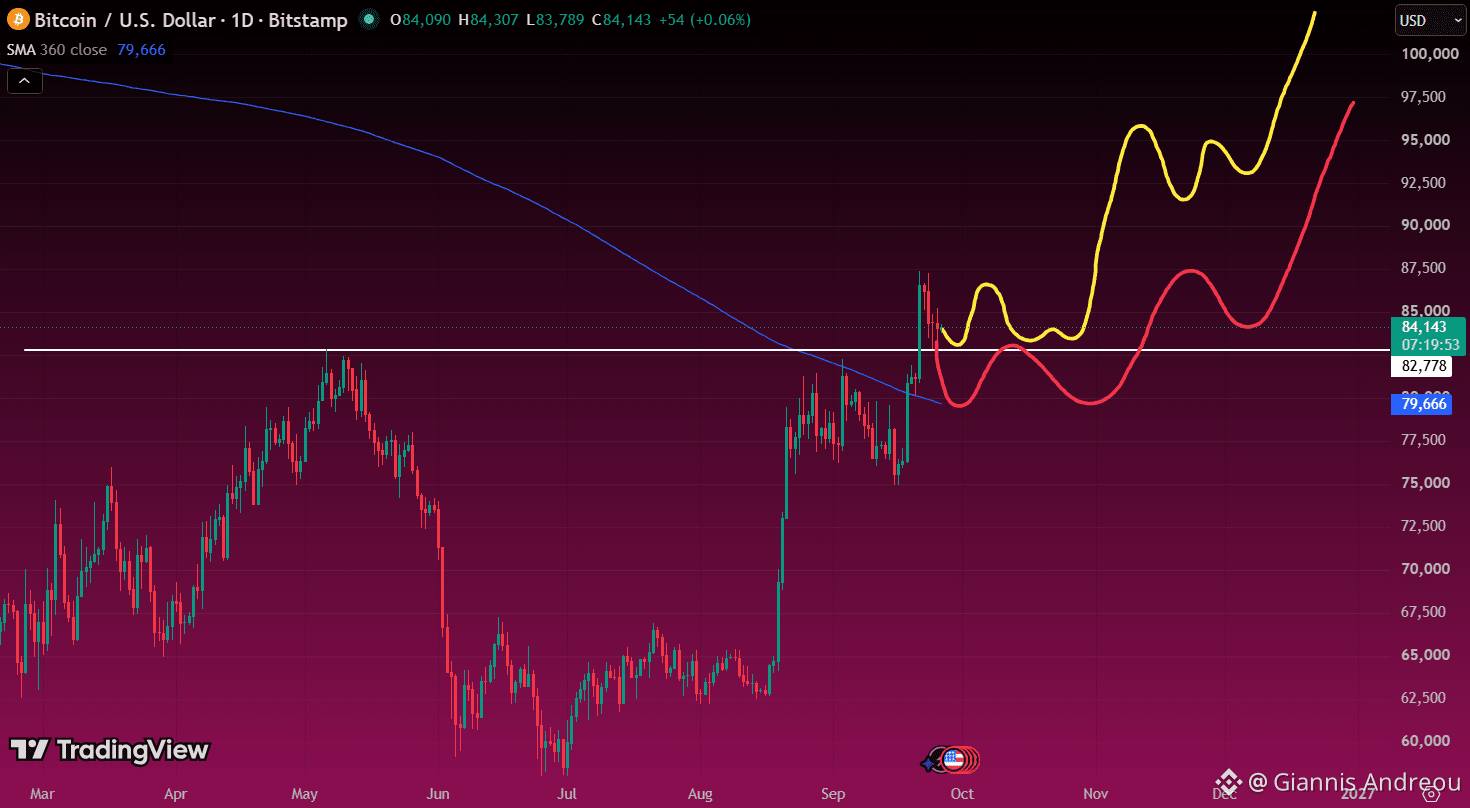
🟠 $BTC HAS TWO CLEAR PATHS FROM
Bitcoin is sitting right above the $82.8K support area.
Scenario 1:
BTC holds this level, buyers step in and price starts pushing higher again.
Scenario 2:
BTC loses $82.8K, drops into the 360 SMA around $79.7K, finds support there and then resumes higher.
Either way, these are the two levels I’m watching:
$82.8K first.
360 SMA second.
Hold one of them, and the bullish structure stays alive.
🟠 $BTC HAS TWO CLEAR PATHS FROM
Bitcoin is sitting right above the $82.8K support area.
Scenario 1:
BTC holds this level, buyers step in and price starts pushing higher again.
Scenario 2:
BTC loses $82.8K, drops into the 360 SMA around $79.7K, finds support there and then resumes higher.
Either way, these are the two levels I’m watching:
$82.8K first.
360 SMA second.
Hold one of them, and the bullish structure stays alive.
Bitcoin is sitting right above the $82.8K support area.
Scenario 1:
BTC holds this level, buyers step in and price starts pushing higher again.
Scenario 2:
BTC loses $82.8K, drops into the 360 SMA around $79.7K, finds support there and then resumes higher.
Either way, these are the two levels I’m watching:
$82.8K first.
360 SMA second.
Hold one of them, and the bullish structure stays alive.
166
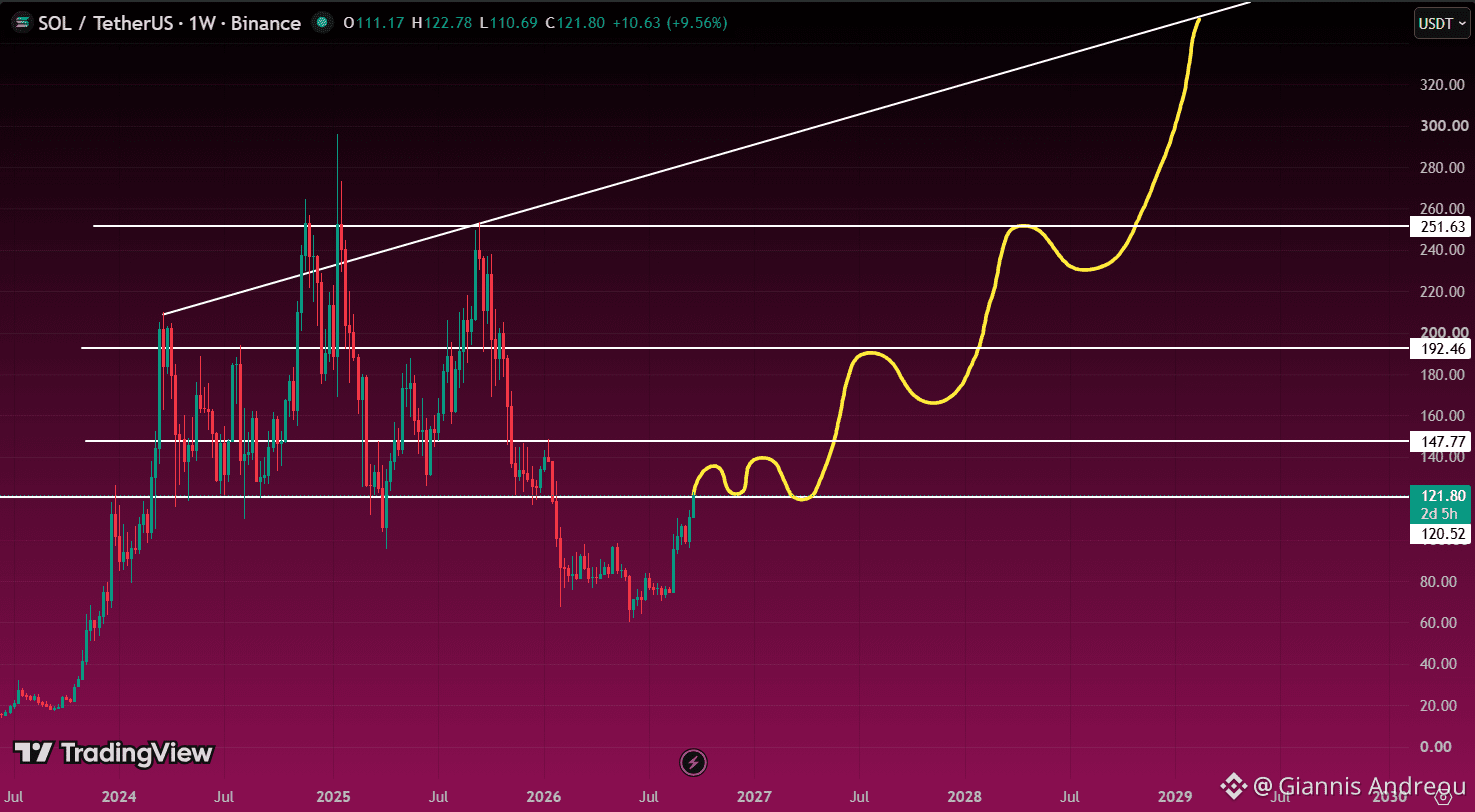
🟣 $SOL IS FIGHTING FOR A MAJOR BREAKOUT
$SOL is now trying to break above the $120-$121 resistance area.
If price can close above it and hold, the next levels I’m watching are:
$148 → $192 → $252
Above $252, the chart starts opening up much more aggressively toward the long-term upper trendline.
For now, everything starts with this breakout.
Break $120. Hold it. Then the bigger move can begin.
🟣 $SOL IS FIGHTING FOR A MAJOR BREAKOUT
$SOL is now trying to break above the $120-$121 resistance area.
If price can close above it and hold, the next levels I’m watching are:
$148 → $192 → $252
Above $252, the chart starts opening up much more aggressively toward the long-term upper trendline.
For now, everything starts with this breakout.
Break $120. Hold it. Then the bigger move can begin.
$SOL is now trying to break above the $120-$121 resistance area.
If price can close above it and hold, the next levels I’m watching are:
$148 → $192 → $252
Above $252, the chart starts opening up much more aggressively toward the long-term upper trendline.
For now, everything starts with this breakout.
Break $120. Hold it. Then the bigger move can begin.
81
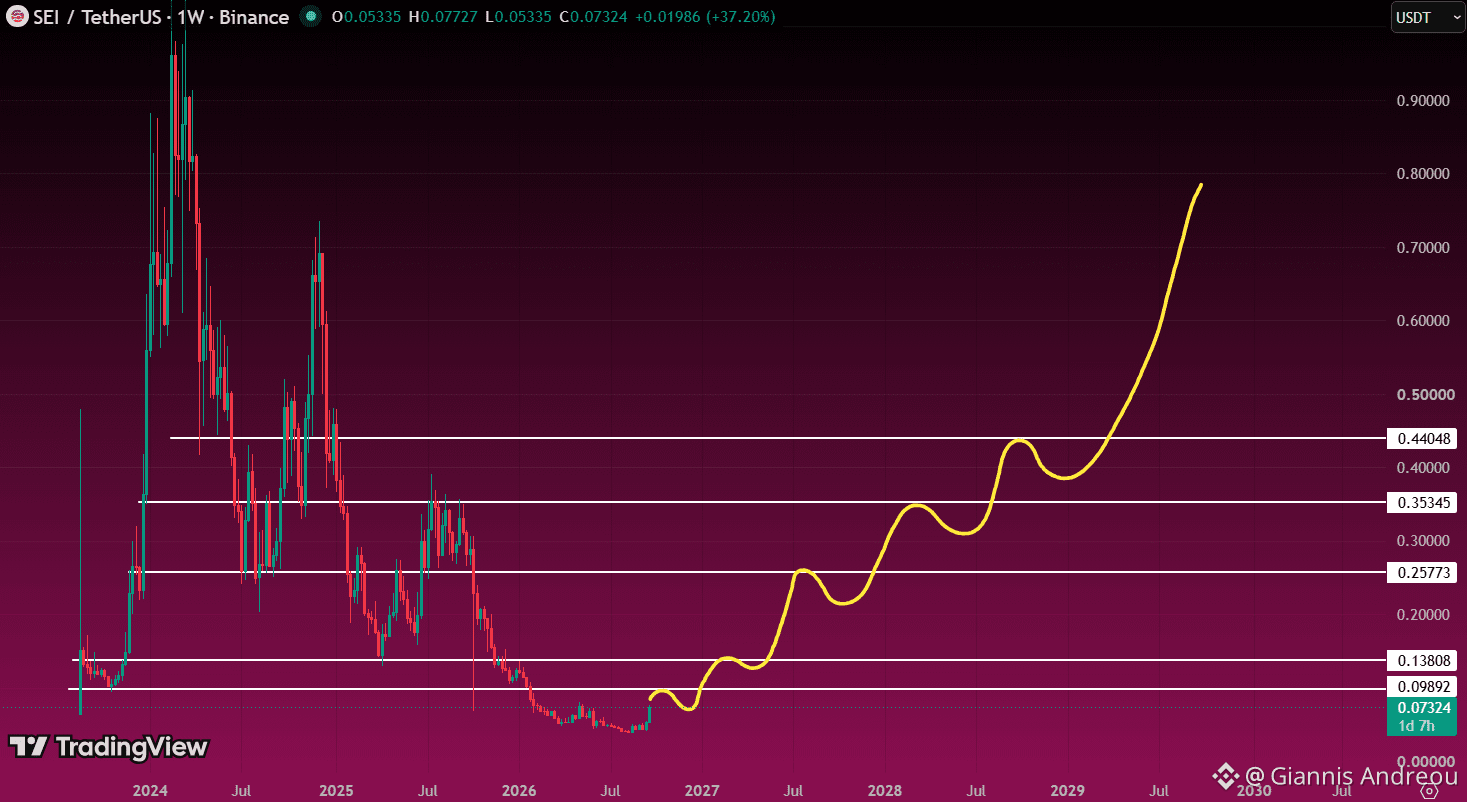
🔴 $SEI STILL HAS A LOT TO PROVE
$SEI is still trading very low compared with its previous cycle highs.
The problem is that there are multiple major resistance levels sitting above price.
The first levels I’m watching are:
$0.10 → $0.14 → $0.26 → $0.35 → $0.44
That is a lot of structure to reclaim before I start getting seriously bullish.
Could SEI recover strongly? Yes.
But right now, there are still too many obstacles in front of it.
One level at a time.
🔴 $SEI STILL HAS A LOT TO PROVE
$SEI is still trading very low compared with its previous cycle highs.
The problem is that there are multiple major resistance levels sitting above price.
The first levels I’m watching are:
$0.10 → $0.14 → $0.26 → $0.35 → $0.44
That is a lot of structure to reclaim before I start getting seriously bullish.
Could SEI recover strongly? Yes.
But right now, there are still too many obstacles in front of it.
One level at a time.
$SEI is still trading very low compared with its previous cycle highs.
The problem is that there are multiple major resistance levels sitting above price.
The first levels I’m watching are:
$0.10 → $0.14 → $0.26 → $0.35 → $0.44
That is a lot of structure to reclaim before I start getting seriously bullish.
Could SEI recover strongly? Yes.
But right now, there are still too many obstacles in front of it.
One level at a time.
35
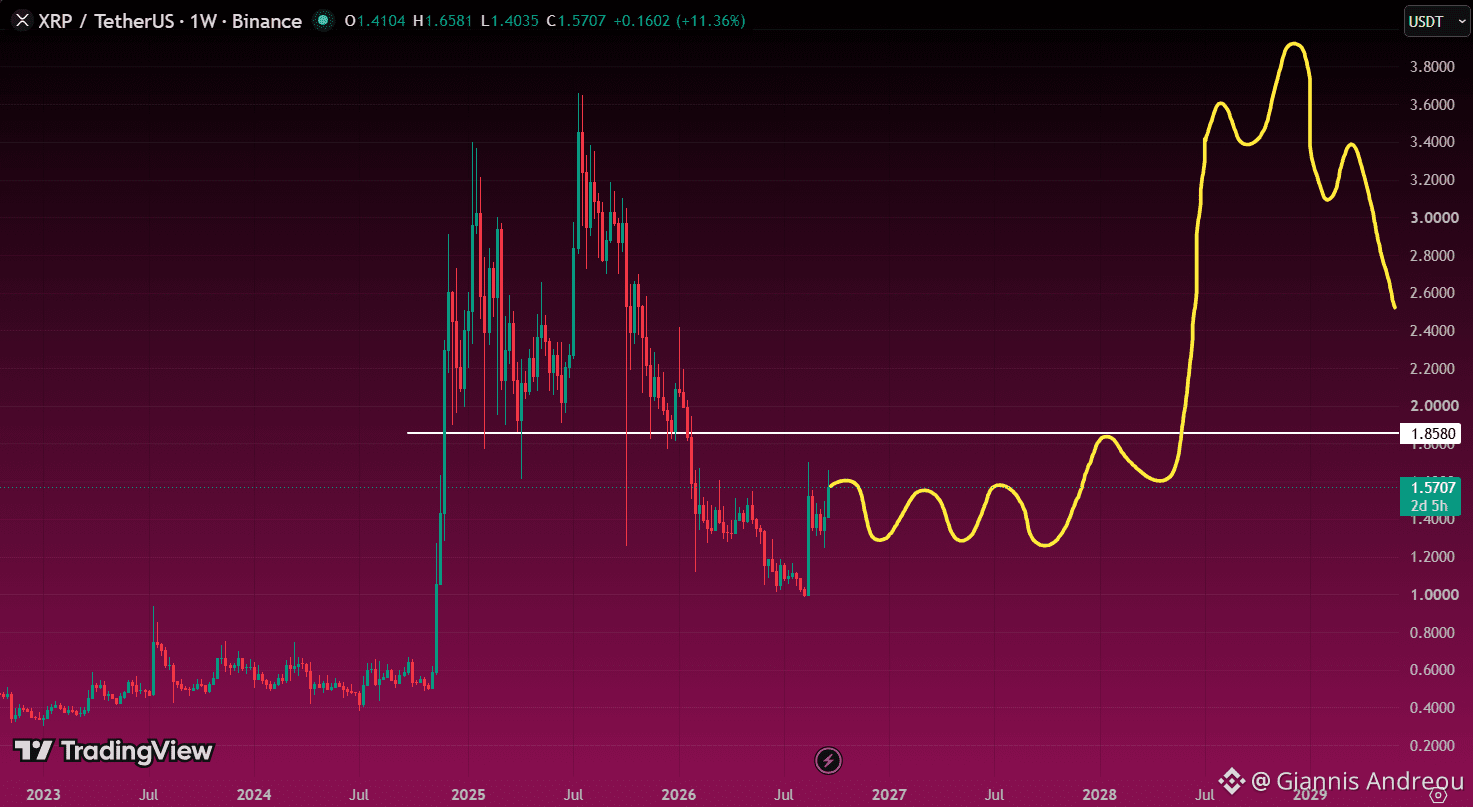
⚫ $XRP IS DOING WHAT IT DID BEFORE
While the rest of the market keeps moving, $XRP has been relatively quiet and stuck in a broad range.
We saw something similar in the previous cycle.
Long periods of boring price action… then one explosive move changed everything.
The key level on my chart is around $1.85.
If $XRP finally breaks above it and holds, I think the move could accelerate very quickly.
Sometimes the quietest chart becomes the loudest one.
⚫ $XRP IS DOING WHAT IT DID BEFORE
While the rest of the market keeps moving, $XRP has been relatively quiet and stuck in a broad range.
We saw something similar in the previous cycle.
Long periods of boring price action… then one explosive move changed everything.
The key level on my chart is around $1.85.
If $XRP finally breaks above it and holds, I think the move could accelerate very quickly.
Sometimes the quietest chart becomes the loudest one.
While the rest of the market keeps moving, $XRP has been relatively quiet and stuck in a broad range.
We saw something similar in the previous cycle.
Long periods of boring price action… then one explosive move changed everything.
The key level on my chart is around $1.85.
If $XRP finally breaks above it and holds, I think the move could accelerate very quickly.
Sometimes the quietest chart becomes the loudest one.
55
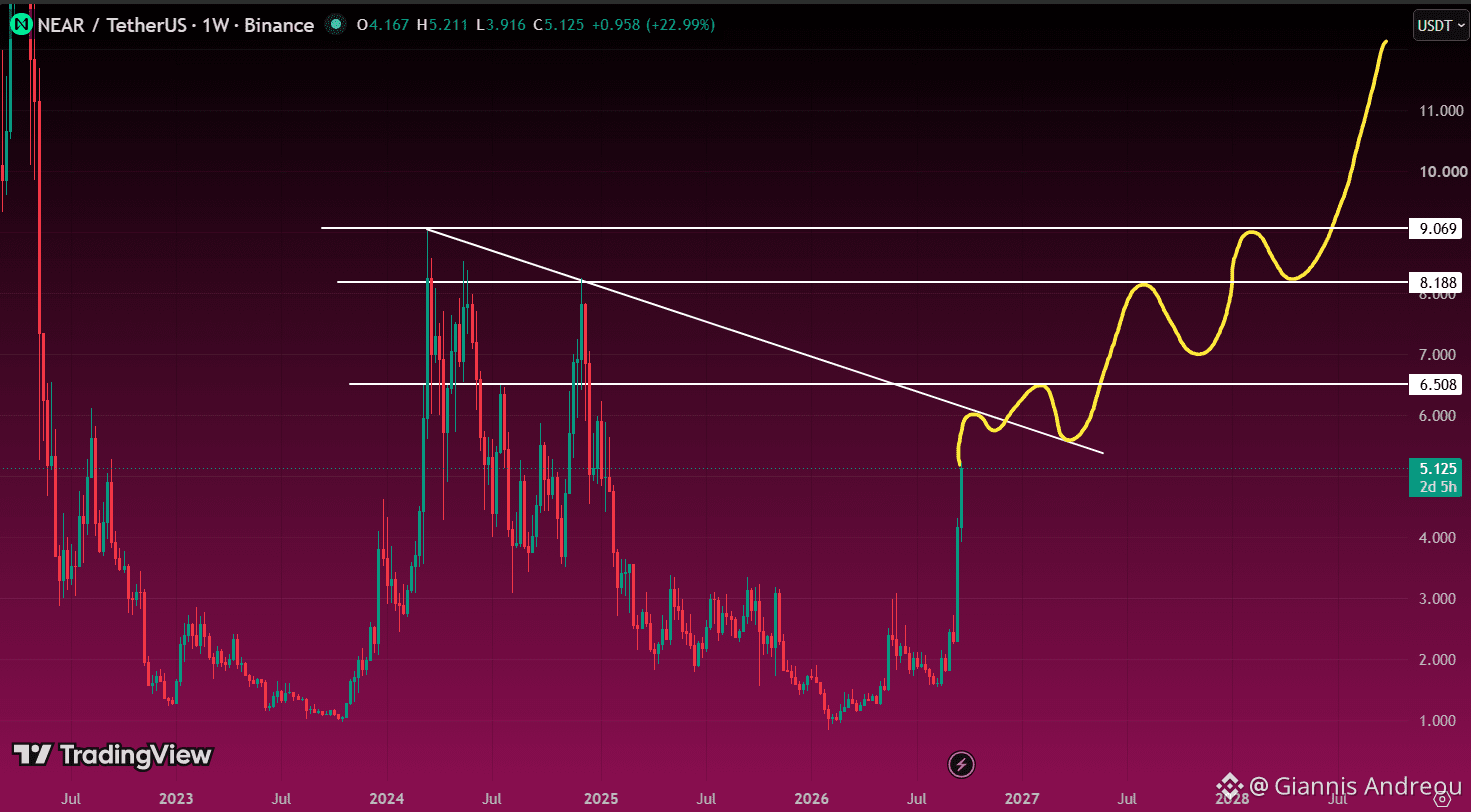
🌐 $NEAR IS GETTING VERY CLOSE TO A MAJOR BREAKOUT
$NEAR has already made a huge move, but the real test is still ahead.
Price is now approaching the long-term descending trendline that has capped every major rally since 2024.
If $NEAR breaks this trendline cleanly and holds above it, I think the move could accelerate fast.
The next levels on my chart are:
$6.50 → $8.20 → $9.00+
This is the breakout I’ve been waiting for.
If that trendline goes, $NEAR could really start flying.
🌐 $NEAR IS GETTING VERY CLOSE TO A MAJOR BREAKOUT
$NEAR has already made a huge move, but the real test is still ahead.
Price is now approaching the long-term descending trendline that has capped every major rally since 2024.
If $NEAR breaks this trendline cleanly and holds above it, I think the move could accelerate fast.
The next levels on my chart are:
$6.50 → $8.20 → $9.00+
This is the breakout I’ve been waiting for.
If that trendline goes, $NEAR could really start flying.
$NEAR has already made a huge move, but the real test is still ahead.
Price is now approaching the long-term descending trendline that has capped every major rally since 2024.
If $NEAR breaks this trendline cleanly and holds above it, I think the move could accelerate fast.
The next levels on my chart are:
$6.50 → $8.20 → $9.00+
This is the breakout I’ve been waiting for.
If that trendline goes, $NEAR could really start flying.
67
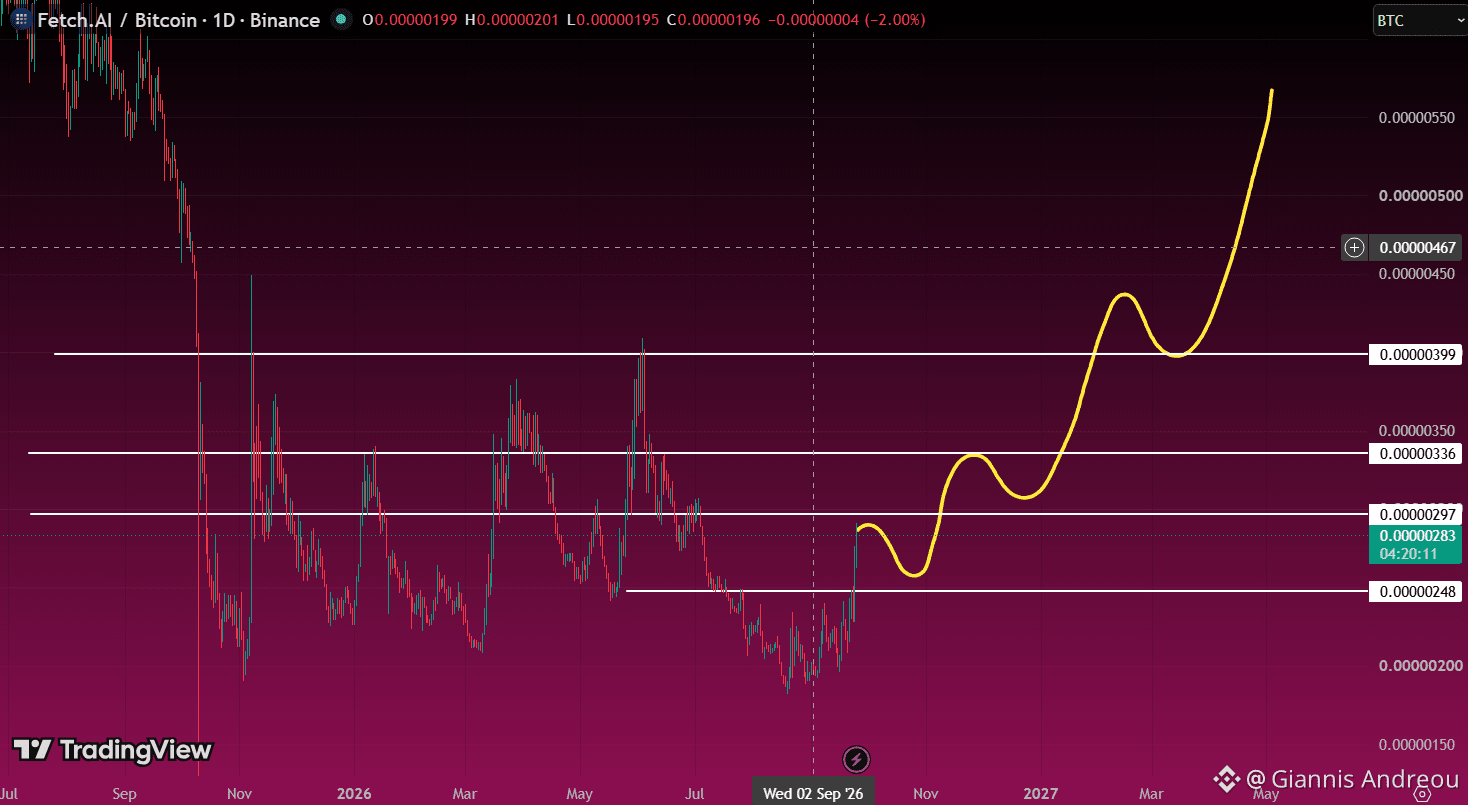
🤖 $FET/BTC IS APPROACHING A KEY BREAKOUT
$FET has bounced strongly against Bitcoin and is now pushing into the next resistance around 0.00000297 BTC.
If that level breaks and holds, the next areas I’m watching are:
0.00000336 → 0.00000399 → 0.00000467
The structure is starting to improve, but this first resistance is the level that matters most right now.
Break it, hold it, and $FET could start outperforming $BTC much more aggressively.
🤖 $FET/BTC IS APPROACHING A KEY BREAKOUT
$FET has bounced strongly against Bitcoin and is now pushing into the next resistance around 0.00000297 BTC.
If that level breaks and holds, the next areas I’m watching are:
0.00000336 → 0.00000399 → 0.00000467
The structure is starting to improve, but this first resistance is the level that matters most right now.
Break it, hold it, and $FET could start outperforming $BTC much more aggressively.
$FET has bounced strongly against Bitcoin and is now pushing into the next resistance around 0.00000297 BTC.
If that level breaks and holds, the next areas I’m watching are:
0.00000336 → 0.00000399 → 0.00000467
The structure is starting to improve, but this first resistance is the level that matters most right now.
Break it, hold it, and $FET could start outperforming $BTC much more aggressively.
86
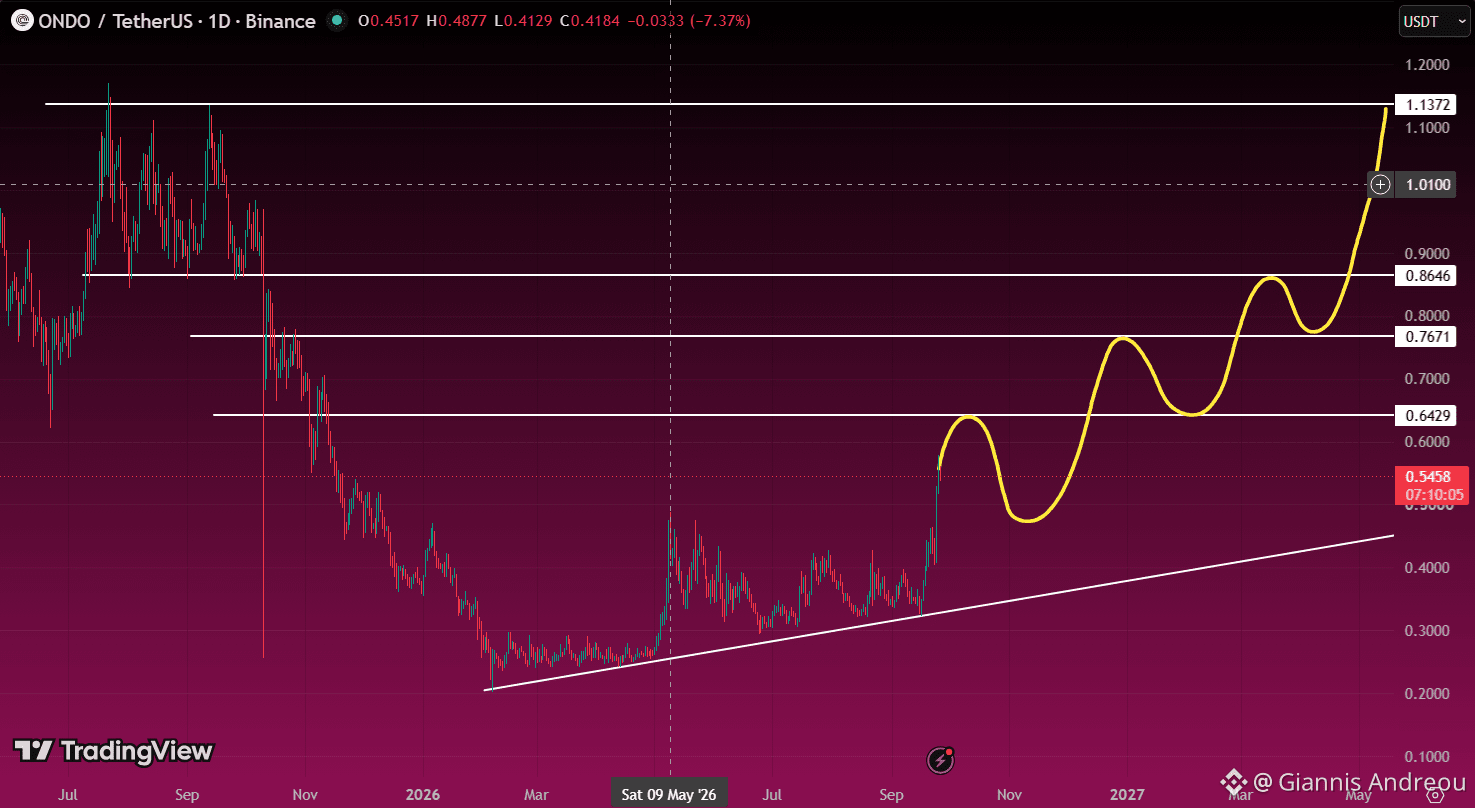
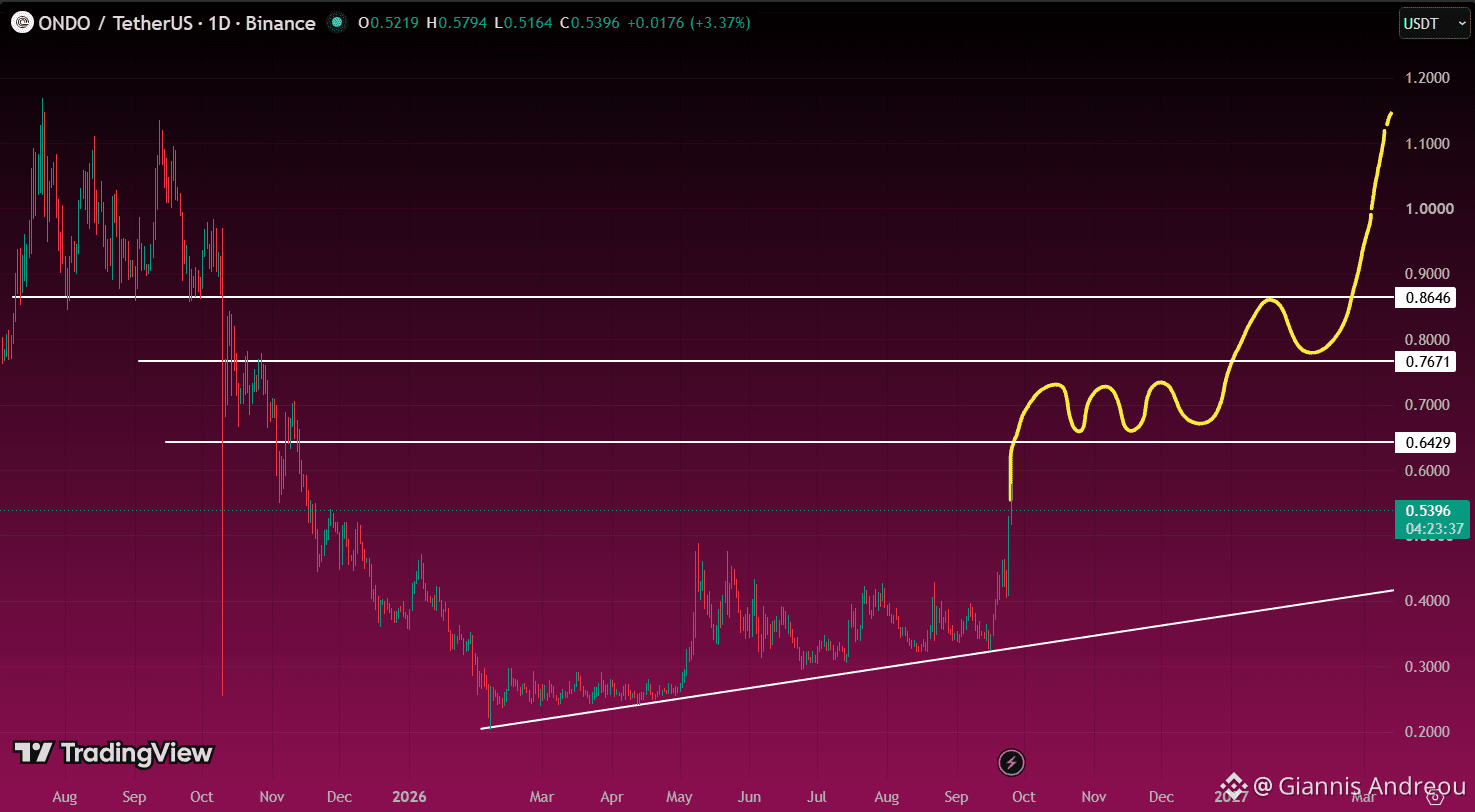
🟢 $ONDO IS BUILDING MOMENTUM
$ONDO has pushed higher again and the structure is starting to look much stronger.
The next resistance I’m watching is around $0.64.
If that breaks and holds, the next major levels on my chart are:
$0.77 → $0.86
Above $0.86, the move could start accelerating toward the $1+ area.
The rising trendline below is still supporting the bigger structure.
For now, the roadmap is simple:
Break $0.64. Hold it. Then attack the next resistance.
🟢 $ONDO IS BUILDING MOMENTUM
$ONDO has pushed higher again and the structure is starting to look much stronger.
The next resistance I’m watching is around $0.64.
If that breaks and holds, the next major levels on my chart are:
$0.77 → $0.86
Above $0.86, the move could start accelerating toward the $1+ area.
The rising trendline below is still supporting the bigger structure.
For now, the roadmap is simple:
Break $0.64. Hold it. Then attack the next resistance.
$ONDO has pushed higher again and the structure is starting to look much stronger.
The next resistance I’m watching is around $0.64.
If that breaks and holds, the next major levels on my chart are:
$0.77 → $0.86
Above $0.86, the move could start accelerating toward the $1+ area.
The rising trendline below is still supporting the bigger structure.
For now, the roadmap is simple:
Break $0.64. Hold it. Then attack the next resistance.
71
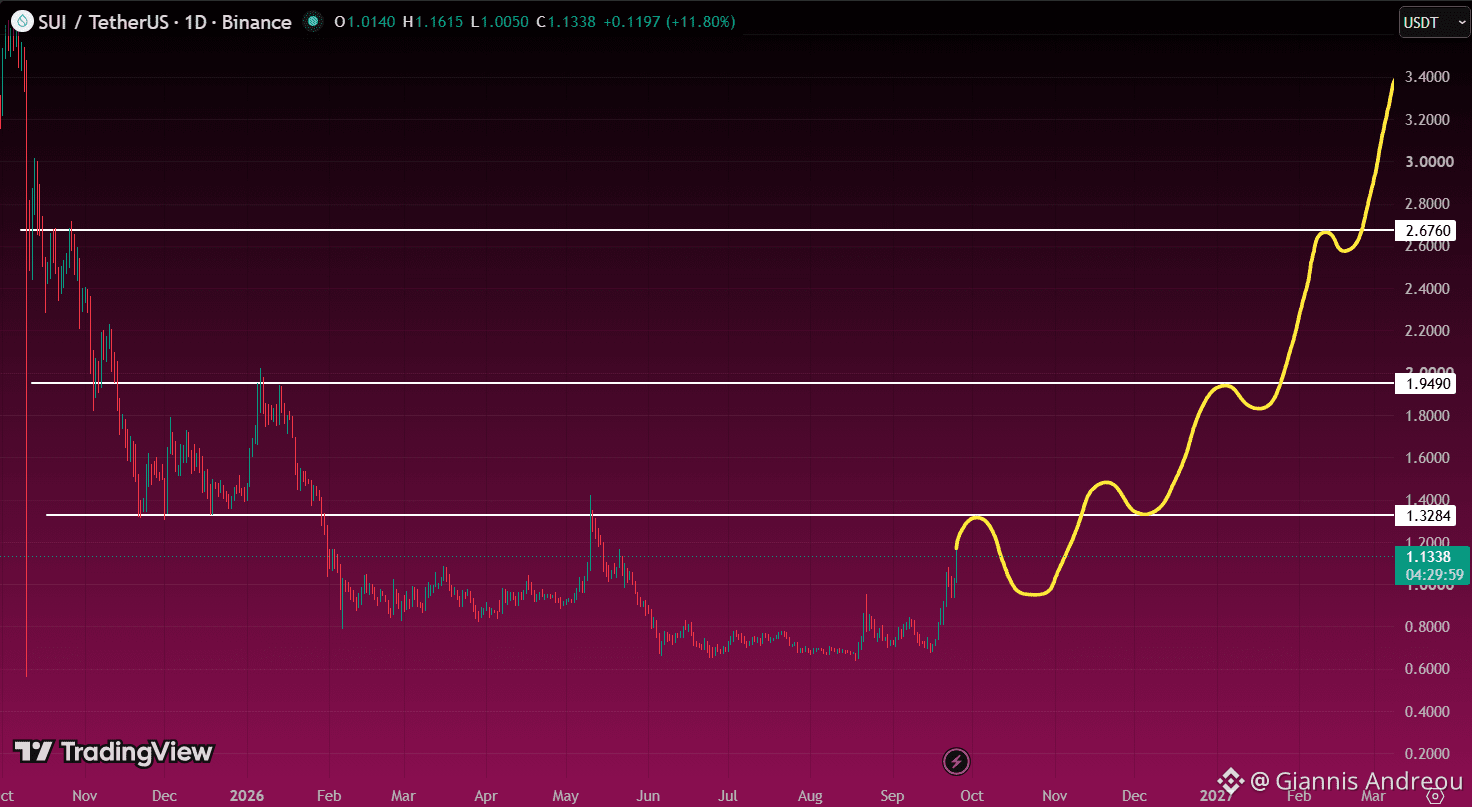
💧 $SUI IS APPROACHING ITS FIRST BIG TEST
$SUI has pushed higher, but the next move depends on how price reacts to these resistance levels.
The first level I’m watching is around $1.33.
If SUI breaks and holds above it, the next major areas on my chart are:
$1.95 → $2.67
Above $2.67, the structure could open up much more aggressively.
For now, the roadmap is simple:
Break resistance. Hold it. Move to the next level.
💧 $SUI IS APPROACHING ITS FIRST BIG TEST
$SUI has pushed higher, but the next move depends on how price reacts to these resistance levels.
The first level I’m watching is around $1.33.
If SUI breaks and holds above it, the next major areas on my chart are:
$1.95 → $2.67
Above $2.67, the structure could open up much more aggressively.
For now, the roadmap is simple:
Break resistance. Hold it. Move to the next level.
$SUI has pushed higher, but the next move depends on how price reacts to these resistance levels.
The first level I’m watching is around $1.33.
If SUI breaks and holds above it, the next major areas on my chart are:
$1.95 → $2.67
Above $2.67, the structure could open up much more aggressively.
For now, the roadmap is simple:
Break resistance. Hold it. Move to the next level.
143
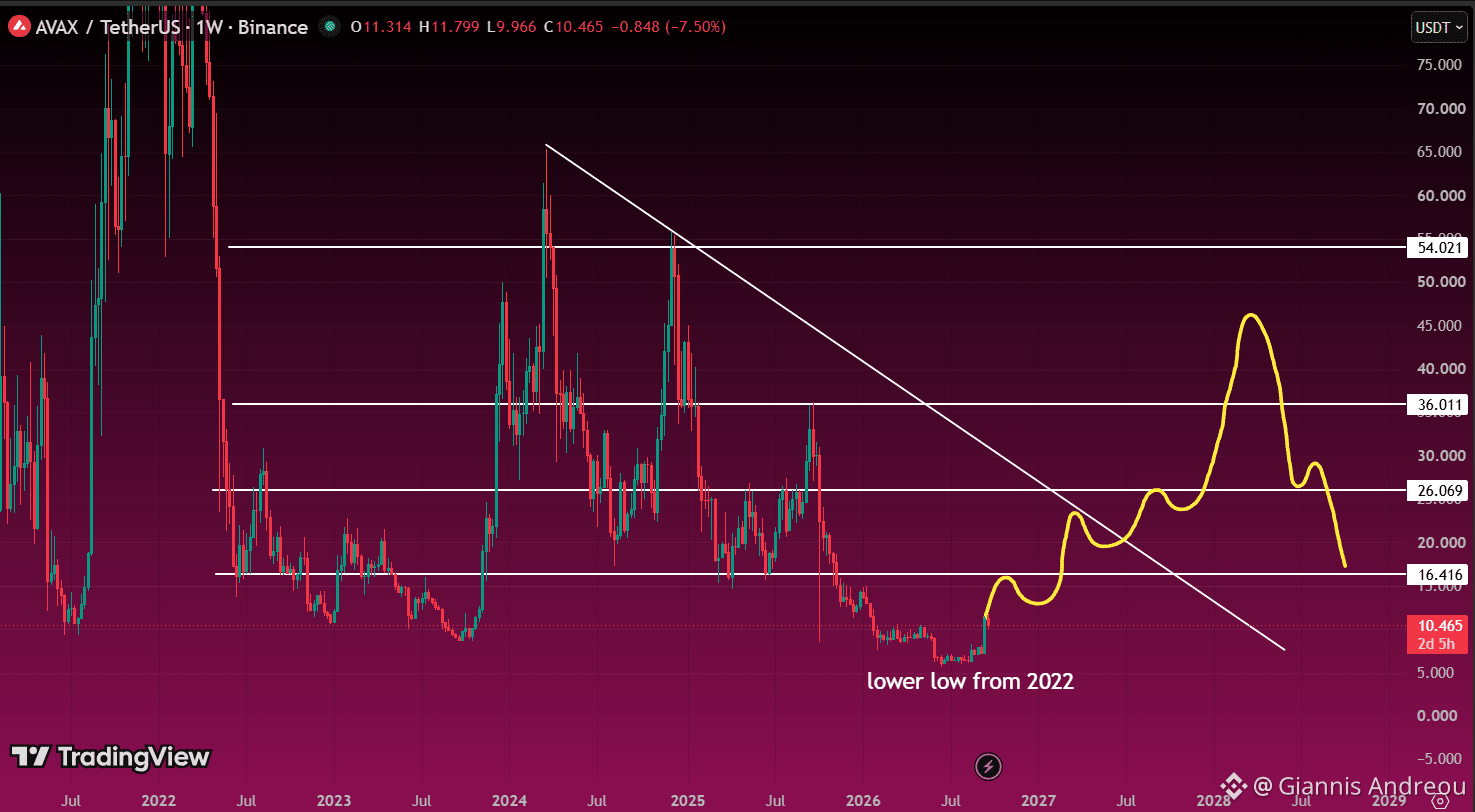
🔺 $AVAX: I’M NOT BUYING THE NEW-HIGH NARRATIVE YET
A lot of people are turning bullish on $AVAX after the recent move and expecting it to eventually trade above its 2024 high.
I see it differently.
AVAX has already printed a lower low compared with 2022, while the long-term descending trendline is still intact.
The levels I’m watching are:
$16.4 → $26 → $36
I can absolutely see a strong recovery, even a move into the $40-$45 area.
But unless $AVAX can reclaim the long-term trendline and eventually break above the $54 region, I would still treat that move as a macro lower high, not the start of a new ATH trend.
Sometimes a big rally is still just a rally.
🔺 $AVAX: I’M NOT BUYING THE NEW-HIGH NARRATIVE YET
A lot of people are turning bullish on $AVAX after the recent move and expecting it to eventually trade above its 2024 high.
I see it differently.
AVAX has already printed a lower low compared with 2022, while the long-term descending trendline is still intact.
The levels I’m watching are:
$16.4 → $26 → $36
I can absolutely see a strong recovery, even a move into the $40-$45 area.
But unless $AVAX can reclaim the long-term trendline and eventually break above the $54 region, I would still treat that move as a macro lower high, not the start of a new ATH trend.
Sometimes a big rally is still just a rally.
A lot of people are turning bullish on $AVAX after the recent move and expecting it to eventually trade above its 2024 high.
I see it differently.
AVAX has already printed a lower low compared with 2022, while the long-term descending trendline is still intact.
The levels I’m watching are:
$16.4 → $26 → $36
I can absolutely see a strong recovery, even a move into the $40-$45 area.
But unless $AVAX can reclaim the long-term trendline and eventually break above the $54 region, I would still treat that move as a macro lower high, not the start of a new ATH trend.
Sometimes a big rally is still just a rally.
1
91
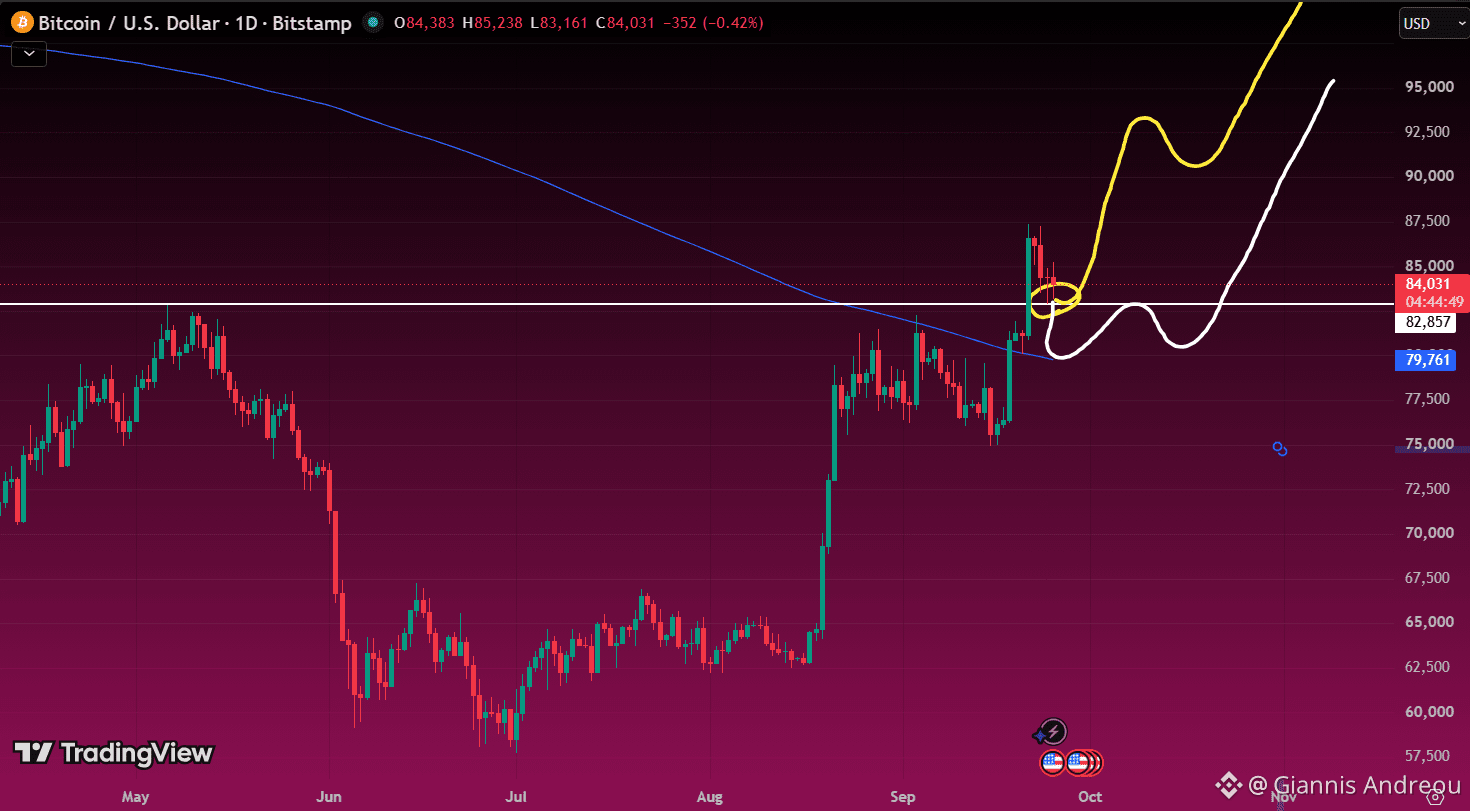
🟠 $BTC JUST REACTED FROM A KEY SUPPORT
Bitcoin tapped the $82.8K support area and bounced slightly higher.
For now, that level is doing its job.
If BTC loses it, the next major support I’m watching is the 360 SMA around $79.7K.
Hold support here, and the bullish structure stays intact.
Lose it, and the 360 SMA becomes the next key level to defend.
🟠 $BTC JUST REACTED FROM A KEY SUPPORT
Bitcoin tapped the $82.8K support area and bounced slightly higher.
For now, that level is doing its job.
If BTC loses it, the next major support I’m watching is the 360 SMA around $79.7K.
Hold support here, and the bullish structure stays intact.
Lose it, and the 360 SMA becomes the next key level to defend.
Bitcoin tapped the $82.8K support area and bounced slightly higher.
For now, that level is doing its job.
If BTC loses it, the next major support I’m watching is the 360 SMA around $79.7K.
Hold support here, and the bullish structure stays intact.
Lose it, and the 360 SMA becomes the next key level to defend.
165
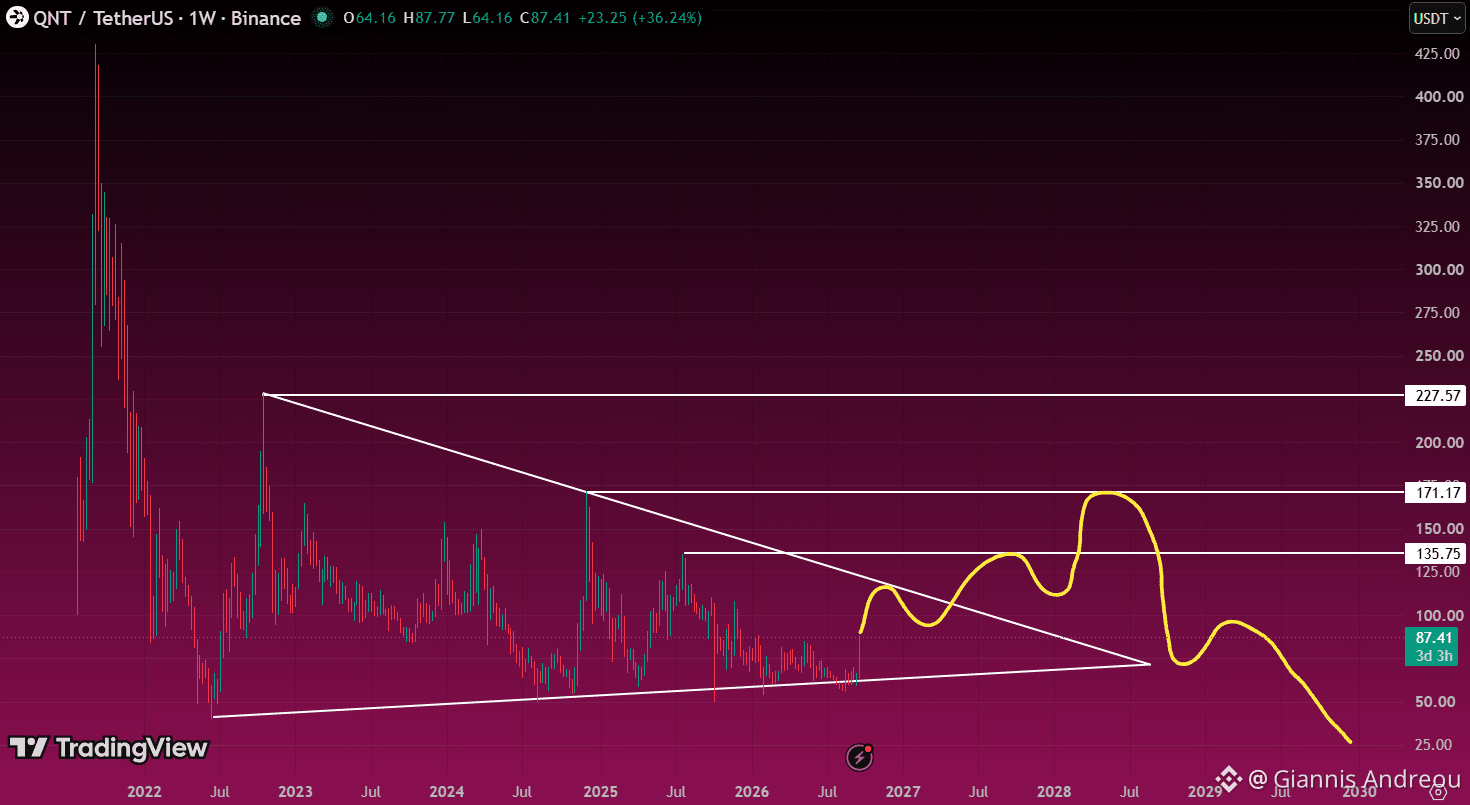
⚪ $QNT: A BIG BOUNCE INSIDE A BIGGER SQUEEZE
$QNT is rebounding from its rising support line, but price remains inside the multi-year triangle. The descending trendline is the next major test.
A weekly breakout and successful retest would strengthen the case for $135.75, followed by $171.17.
My drawn scenario allows that recovery before a potential rejection. A sustained break above $171.17 would challenge that bearish second leg and bring $227.57 into focus.
Lose the rising support near $60–$65 instead, and the recovery setup weakens.
The weekly candle is still open. The projected path is conditional, not a timetable.
Nothing is guaranteed. Do Your Own Research.
⚪ $QNT: A BIG BOUNCE INSIDE A BIGGER SQUEEZE
$QNT is rebounding from its rising support line, but price remains inside the multi-year triangle. The descending trendline is the next major test.
A weekly breakout and successful retest would strengthen the case for $135.75, followed by $171.17.
My drawn scenario allows that recovery before a potential rejection. A sustained break above $171.17 would challenge that bearish second leg and bring $227.57 into focus.
Lose the rising support near $60–$65 instead, and the recovery setup weakens.
The weekly candle is still open. The projected path is conditional, not a timetable.
Nothing is guaranteed. Do Your Own Research.
$QNT is rebounding from its rising support line, but price remains inside the multi-year triangle. The descending trendline is the next major test.
A weekly breakout and successful retest would strengthen the case for $135.75, followed by $171.17.
My drawn scenario allows that recovery before a potential rejection. A sustained break above $171.17 would challenge that bearish second leg and bring $227.57 into focus.
Lose the rising support near $60–$65 instead, and the recovery setup weakens.
The weekly candle is still open. The projected path is conditional, not a timetable.
Nothing is guaranteed. Do Your Own Research.
1
218
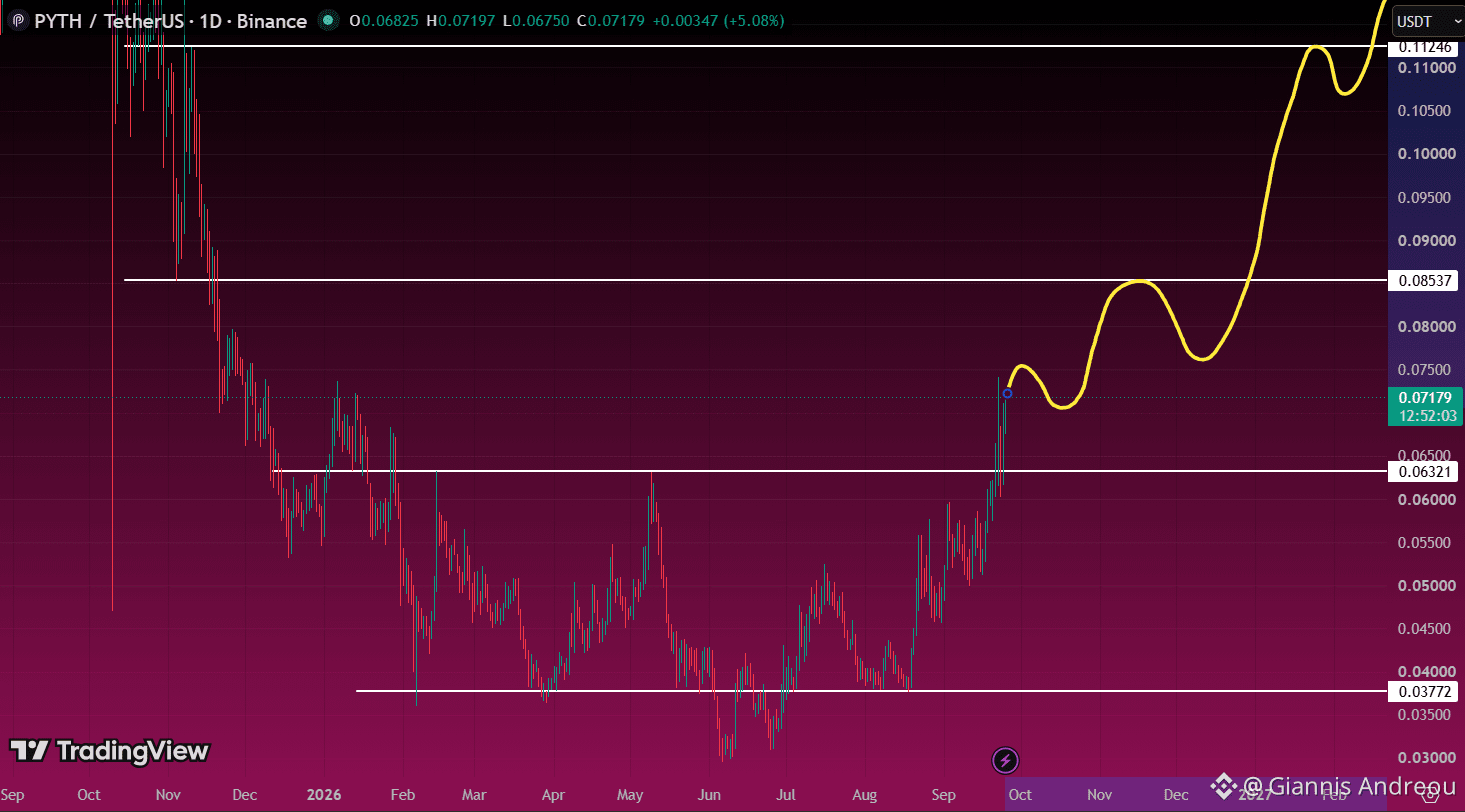
🟣 $PYTH: THE RECOVERY HAS ITS FIRST REAL TEST.
PYTH has pushed above $0.0632 after building a base around $0.0377.
Now the key is holding that reclaimed level on a pullback. If buyers defend it, $0.0854 becomes the next resistance to watch.
Break above that and hold the retest, and $0.1125 comes into focus.
Lose $0.0632, and the bullish setup weakens, bringing $0.050 back into play.
The yellow path is a scenario. Each breakout still needs confirmation.
Nothing is guaranteed. Do Your Own Research.
🟣 $PYTH: THE RECOVERY HAS ITS FIRST REAL TEST.
PYTH has pushed above $0.0632 after building a base around $0.0377.
Now the key is holding that reclaimed level on a pullback. If buyers defend it, $0.0854 becomes the next resistance to watch.
Break above that and hold the retest, and $0.1125 comes into focus.
Lose $0.0632, and the bullish setup weakens, bringing $0.050 back into play.
The yellow path is a scenario. Each breakout still needs confirmation.
Nothing is guaranteed. Do Your Own Research.
PYTH has pushed above $0.0632 after building a base around $0.0377.
Now the key is holding that reclaimed level on a pullback. If buyers defend it, $0.0854 becomes the next resistance to watch.
Break above that and hold the retest, and $0.1125 comes into focus.
Lose $0.0632, and the bullish setup weakens, bringing $0.050 back into play.
The yellow path is a scenario. Each breakout still needs confirmation.
Nothing is guaranteed. Do Your Own Research.
63
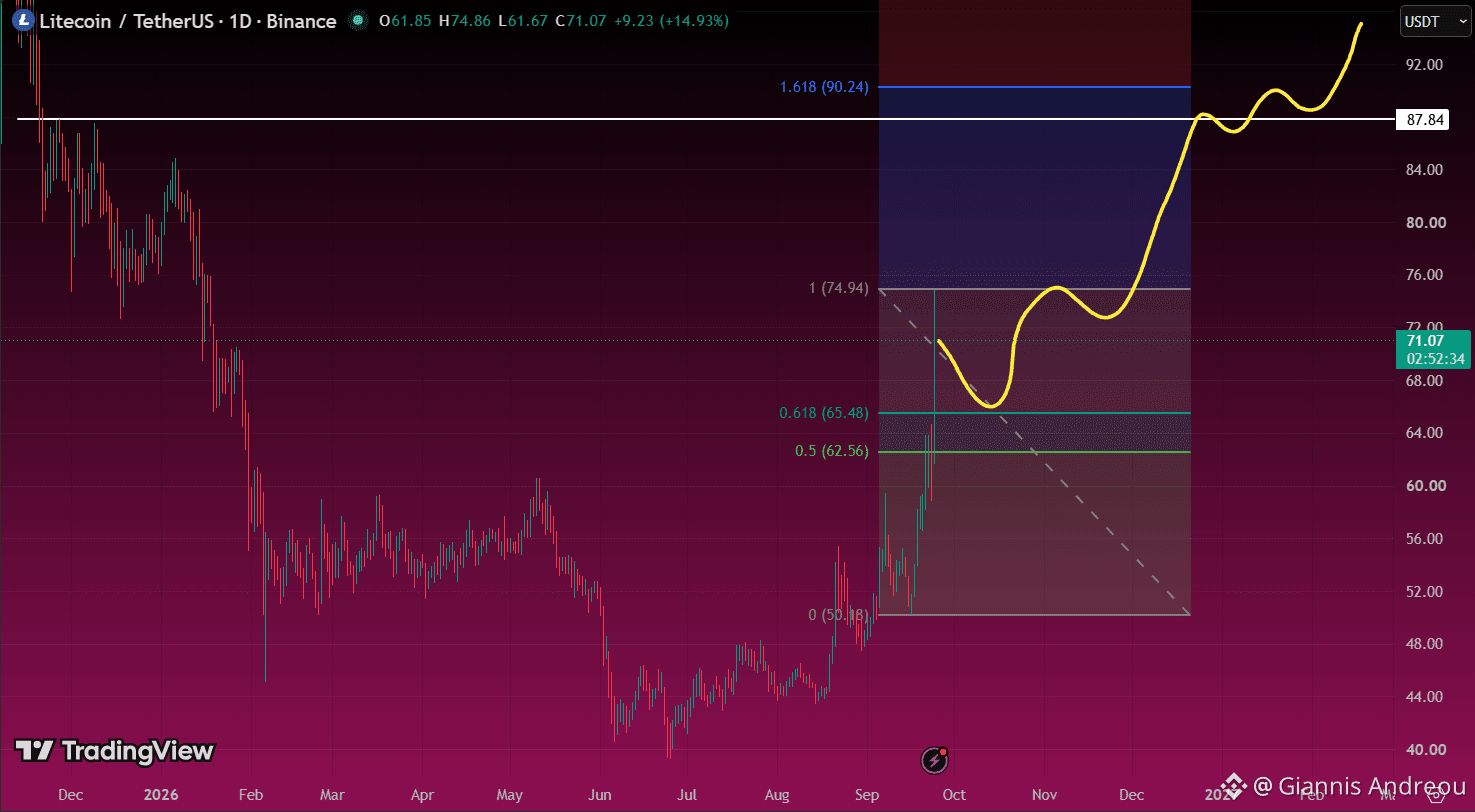
⚡ $LTC: THE NEXT DIP COULD BE THE REAL TEST
After a sharp rally, I’m watching a potential pullback toward $65.48. The broader support zone sits at $62.56–$65.48, matching the marked 0.5–0.618 Fibonacci levels.
Hold that zone and reclaim $74.94, and $87.84–$90.24 becomes the next major area to watch. Historical resistance and the 1.618 extension sit close together there.
My bullish scenario is a retest first, then continuation. A daily close below $62.56 would weaken that setup.
The current daily candle is still open. Let the close confirm the move.
Nothing is guaranteed. Do Your Own Research.
⚡ $LTC: THE NEXT DIP COULD BE THE REAL TEST
After a sharp rally, I’m watching a potential pullback toward $65.48. The broader support zone sits at $62.56–$65.48, matching the marked 0.5–0.618 Fibonacci levels.
Hold that zone and reclaim $74.94, and $87.84–$90.24 becomes the next major area to watch. Historical resistance and the 1.618 extension sit close together there.
My bullish scenario is a retest first, then continuation. A daily close below $62.56 would weaken that setup.
The current daily candle is still open. Let the close confirm the move.
Nothing is guaranteed. Do Your Own Research.
After a sharp rally, I’m watching a potential pullback toward $65.48. The broader support zone sits at $62.56–$65.48, matching the marked 0.5–0.618 Fibonacci levels.
Hold that zone and reclaim $74.94, and $87.84–$90.24 becomes the next major area to watch. Historical resistance and the 1.618 extension sit close together there.
My bullish scenario is a retest first, then continuation. A daily close below $62.56 would weaken that setup.
The current daily candle is still open. Let the close confirm the move.
Nothing is guaranteed. Do Your Own Research.
52
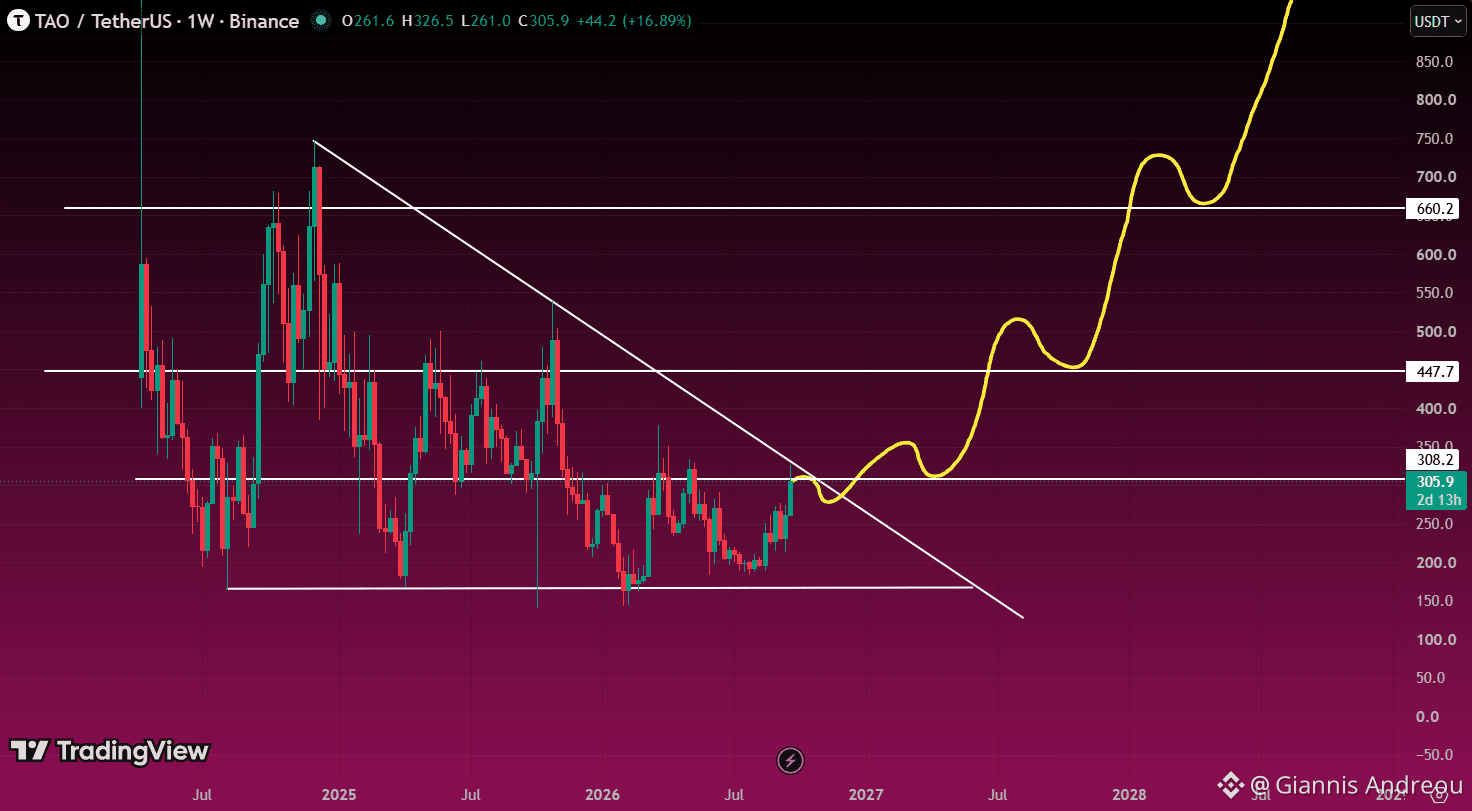
⚪ $TAO: WAITING FOR THE TRIANGLE TO BREAK.
TAO is approaching descending resistance on the weekly chart, with $308.2 adding another hurdle nearby.
I’m waiting for a weekly close above both, followed by a retest that holds.
That would strengthen the bullish scenario toward $447.7, then $660.2. Turning those levels into support could open the path toward the previous highs.
Until the breakout confirms, price remains inside the triangle. Rejection keeps another move toward $200–$165 in play.
Nothing is guaranteed. Do Your Own Research.
⚪ $TAO: WAITING FOR THE TRIANGLE TO BREAK.
TAO is approaching descending resistance on the weekly chart, with $308.2 adding another hurdle nearby.
I’m waiting for a weekly close above both, followed by a retest that holds.
That would strengthen the bullish scenario toward $447.7, then $660.2. Turning those levels into support could open the path toward the previous highs.
Until the breakout confirms, price remains inside the triangle. Rejection keeps another move toward $200–$165 in play.
Nothing is guaranteed. Do Your Own Research.
TAO is approaching descending resistance on the weekly chart, with $308.2 adding another hurdle nearby.
I’m waiting for a weekly close above both, followed by a retest that holds.
That would strengthen the bullish scenario toward $447.7, then $660.2. Turning those levels into support could open the path toward the previous highs.
Until the breakout confirms, price remains inside the triangle. Rejection keeps another move toward $200–$165 in play.
Nothing is guaranteed. Do Your Own Research.
99
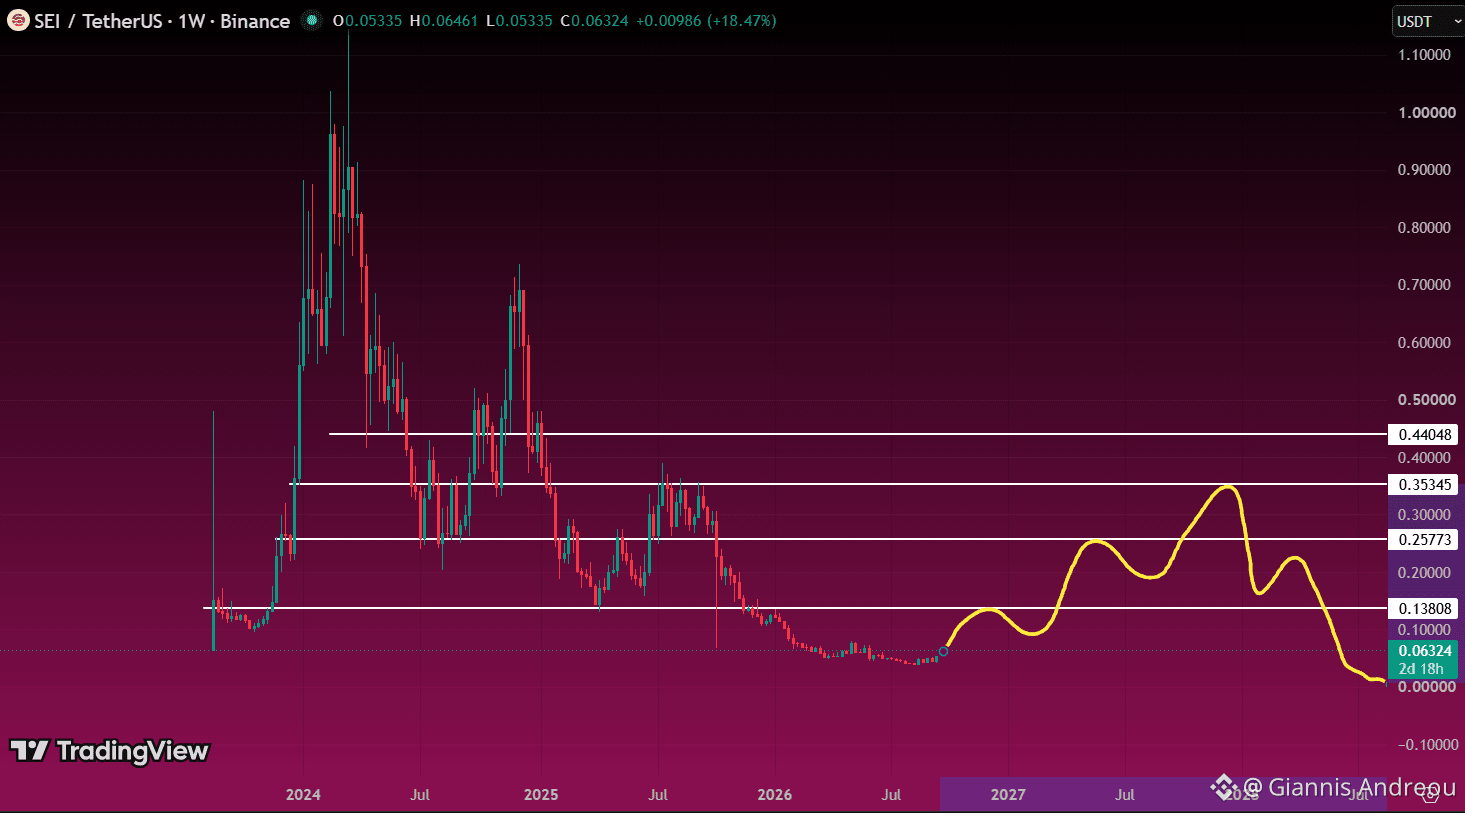
🔴 $SEI: A BIG RALLY CAN STILL END IN A LOWER HIGH.
My drawn scenario starts with a recovery toward $0.138. A weekly breakout and successful retest would bring $0.258, then $0.353 into focus.
That’s where I’d watch closely for exhaustion. Even reaching those levels would leave SEI well below its previous cycle peak.
Rejection followed by a lower high could set up another major decline. Sustained strength above $0.353–$0.440 would challenge that bearish second leg.
The yellow path is a scenario, not a prediction of zero.
Nothing is guaranteed. Do Your Own Research.
🔴 $SEI: A BIG RALLY CAN STILL END IN A LOWER HIGH.
My drawn scenario starts with a recovery toward $0.138. A weekly breakout and successful retest would bring $0.258, then $0.353 into focus.
That’s where I’d watch closely for exhaustion. Even reaching those levels would leave SEI well below its previous cycle peak.
Rejection followed by a lower high could set up another major decline. Sustained strength above $0.353–$0.440 would challenge that bearish second leg.
The yellow path is a scenario, not a prediction of zero.
Nothing is guaranteed. Do Your Own Research.
My drawn scenario starts with a recovery toward $0.138. A weekly breakout and successful retest would bring $0.258, then $0.353 into focus.
That’s where I’d watch closely for exhaustion. Even reaching those levels would leave SEI well below its previous cycle peak.
Rejection followed by a lower high could set up another major decline. Sustained strength above $0.353–$0.440 would challenge that bearish second leg.
The yellow path is a scenario, not a prediction of zero.
Nothing is guaranteed. Do Your Own Research.
1
70
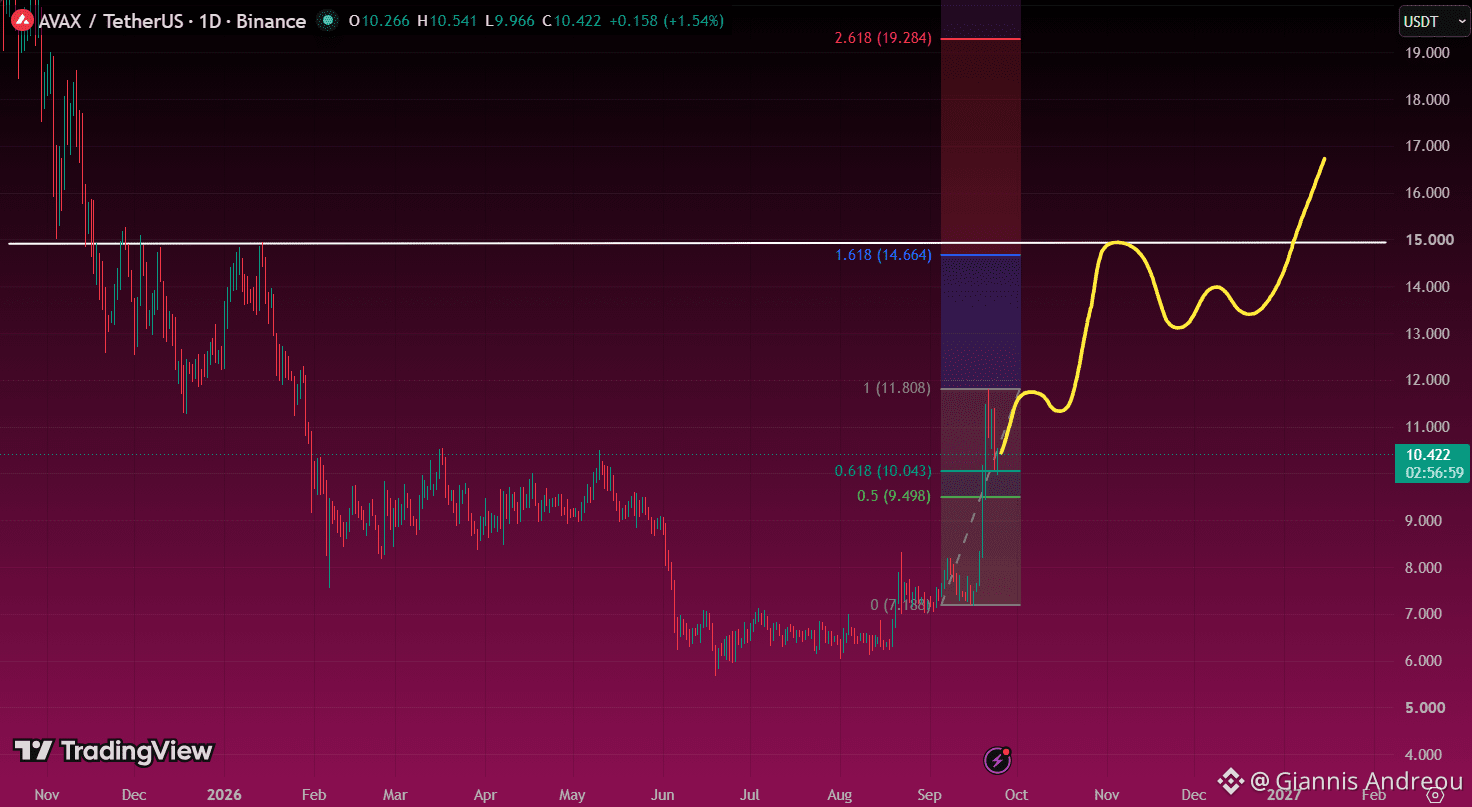
🔺 $AVAX: THE PULLBACK THAT COULD SET UP ROUND TWO
$AVAX is testing the $10 area after its sharp rally. I’m watching $9.50–$10.04 as the support zone for this setup.
Hold that zone and reclaim $11.81, and the next upside area is $14.66–$15.00, where the 1.618 Fibonacci extension meets historical resistance.
That’s where I’d expect a tougher test. A breakout and successful retest would strengthen the case for $16–$17.
A daily close below $9.50 would weaken this scenario and put the breakout base near $7.20 back on the radar.
Nothing is guaranteed. Do Your Own Research.
🔺 $AVAX: THE PULLBACK THAT COULD SET UP ROUND TWO
$AVAX is testing the $10 area after its sharp rally. I’m watching $9.50–$10.04 as the support zone for this setup.
Hold that zone and reclaim $11.81, and the next upside area is $14.66–$15.00, where the 1.618 Fibonacci extension meets historical resistance.
That’s where I’d expect a tougher test. A breakout and successful retest would strengthen the case for $16–$17.
A daily close below $9.50 would weaken this scenario and put the breakout base near $7.20 back on the radar.
Nothing is guaranteed. Do Your Own Research.
$AVAX is testing the $10 area after its sharp rally. I’m watching $9.50–$10.04 as the support zone for this setup.
Hold that zone and reclaim $11.81, and the next upside area is $14.66–$15.00, where the 1.618 Fibonacci extension meets historical resistance.
That’s where I’d expect a tougher test. A breakout and successful retest would strengthen the case for $16–$17.
A daily close below $9.50 would weaken this scenario and put the breakout base near $7.20 back on the radar.
Nothing is guaranteed. Do Your Own Research.
35
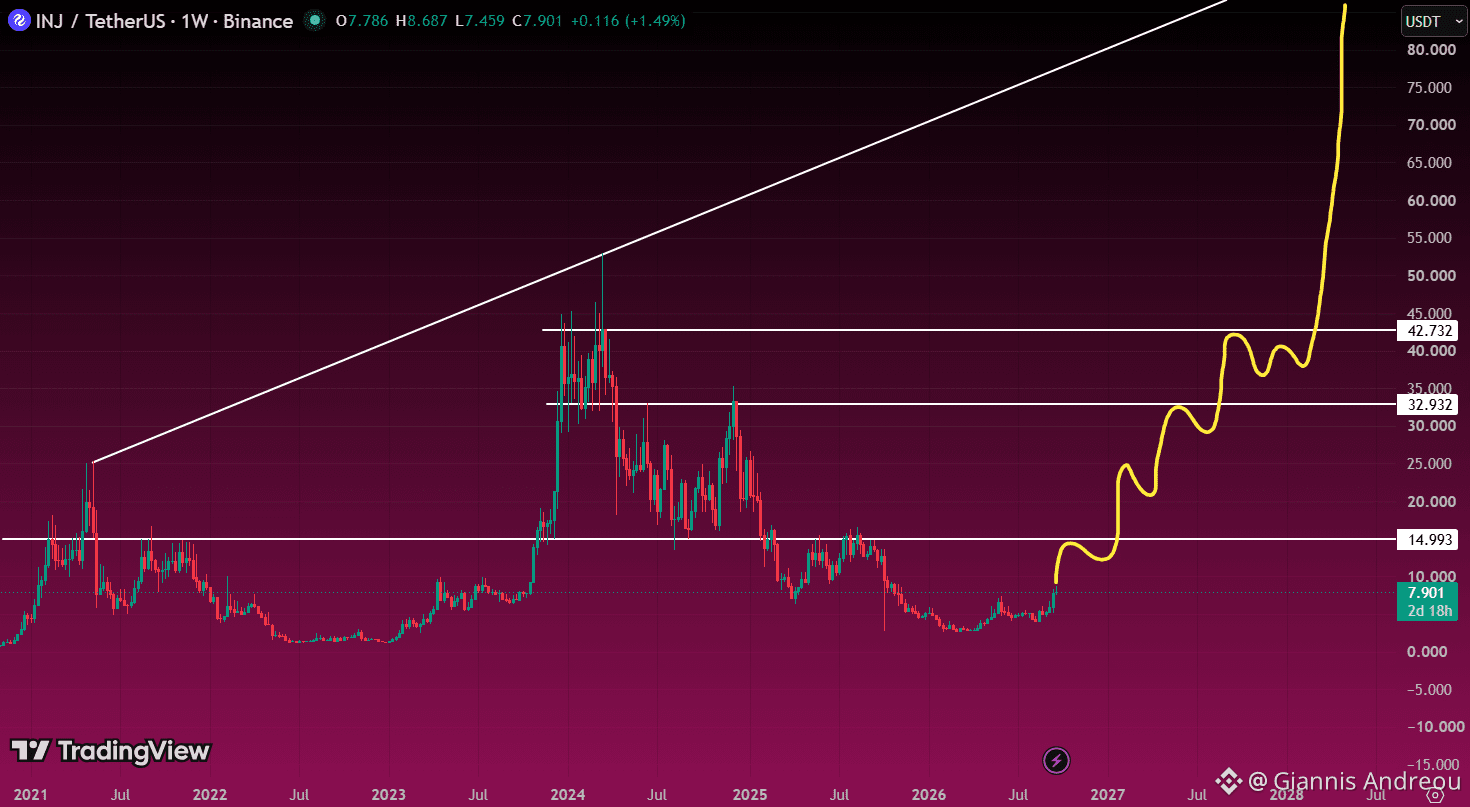
🔵 $INJ: THE COMEBACK HAS LEVELS TO CLEAR.
INJ is recovering from its recent base, but $15 remains the first major resistance on this weekly chart.
Reclaim it and hold the retest, and the recovery could extend toward $20–$25, then $32.93 and $42.73.
My bullish scenario builds through those levels before challenging the previous peak near $53. The drawn $80+ extension depends on that breakout actually happening.
Losing the recent base around $3–$4 would undermine the setup.
Nothing is guaranteed. Do Your Own Research.
🔵 $INJ: THE COMEBACK HAS LEVELS TO CLEAR.
INJ is recovering from its recent base, but $15 remains the first major resistance on this weekly chart.
Reclaim it and hold the retest, and the recovery could extend toward $20–$25, then $32.93 and $42.73.
My bullish scenario builds through those levels before challenging the previous peak near $53. The drawn $80+ extension depends on that breakout actually happening.
Losing the recent base around $3–$4 would undermine the setup.
Nothing is guaranteed. Do Your Own Research.
INJ is recovering from its recent base, but $15 remains the first major resistance on this weekly chart.
Reclaim it and hold the retest, and the recovery could extend toward $20–$25, then $32.93 and $42.73.
My bullish scenario builds through those levels before challenging the previous peak near $53. The drawn $80+ extension depends on that breakout actually happening.
Losing the recent base around $3–$4 would undermine the setup.
Nothing is guaranteed. Do Your Own Research.
1
71
ເຂົ້າສູ່ລະບົບເພື່ອສຳຫຼວດເນື້ອຫາເພີ່ມເຕີມ
ເຂົ້າຮ່ວມກຸ່ມຜູ້ໃຊ້ຄຣິບໂຕທົ່ວໂລກໃນ Binance Square.
⚡️ ໄດ້ຮັບຂໍ້ມູນຫຼ້າສຸດ ແລະ ທີ່ມີປະໂຫຍດກ່ຽວກັບຄຣິບໂຕ.
💬 ໄດ້ຮັບຄວາມໄວ້ວາງໃຈຈາກຕະຫຼາດແລກປ່ຽນຄຣິບໂຕທີ່ໃຫຍ່ທີ່ສຸດໃນໂລກ.
👍 ຄົ້ນຫາຂໍ້ມູນເຊີງເລິກທີ່ແທ້ຈາກນັກສ້າງທີ່ໄດ້ຮັບການຢືນຢັນ.
ອີເມວ / ເບີໂທລະສັບ
ຫົວຂໍ້ທີ່ກໍາລັງນິຍົມ
StrategyStriveAdd2305BitcoinThisWeek
13,217 views
483 ກຳລັງສົນທະນາ
#strategystriveadd2305bitcointhisweek 🚨 2,305 BTC just moved into treasuries
While most traders were focused on the Bitcoin price rebound two public companies quietly made big moves. 👀
Strategy and Strive together bought 2,305 BTC for 182.7 million Dollar.
🔹 Strategy bought 950 BTC for 75.7 million dollar
🔹 Strive bought 1,355 BTC for around 107.7 million dollar
This brings their total holdings to:
📊 Strategy. 846,000 BTC
📊 Strive. 26,355 BTC
But the real story isn't the amount of Bitcoin they bought.
It's how they paid for it.
Strategy used cash it already had.
Strive used its stock financing model to fund the purchase. Meaning it’s growing its Bitcoin treasury without relying only on cash flow.
This difference matters.
For traders and investors it adds a layer of analysis: how much Bitcoin is being added, how it’s being funded and what it means for long-term value, per share.
The cost of capital BTC accumulation and share value. These factors are starting to shape the market in ways.
Corporate treasury demand is no longer a side note.
It’s becoming a part of the Bitcoin ecosystem.
💬 What do you think?
Will more companies start buying Bitcoin the way?
Will this trend grow?
#bitcoin #Khan62 #BTC #trading
$MSTR
$MARA $BMNR
Khan 62
·4 ຖືກໃຈ
·2.7k views
TrumpRejectsIranHormuzReopening
17,067 views
472 ກຳລັງສົນທະນາ
CircleTetherFreezeBitgetHackerWallet
37,833 views
598 ກຳລັງສົນທະນາ