
GAS WOLF
8.9k ໂພສ

GAS WOLF
ລາຍງານ
ບລັອກຜູ້ໃຊ້
I’m driven by purpose. I’m building something bigger than a moment..
ເປີດການຊື້ຂາຍ
ຜູ້ຊື້ຂາຍປະຈໍາ
1.9 ປີ
154 ກໍາລັງຕິດຕາມ
22.1K+ ຜູ້ຕິດຕາມ
18.4K+ Liked
ໂພສ
Portfolio
ທັງໝົດ
ວົງຢືມ
ຖ່າຍທອດສົດ
·
--
ສັນຍານກະທິງ
ເບິ່ງການແປ
CPI day always brings a different kind of tension to the market.
Everything can look calm for hours, and then one inflation number changes the entire conversation in minutes.
What makes this interesting is that the market is not only watching whether inflation goes up or down. The bigger question is whether the result comes in above or below expectations.
A softer CPI number could give markets more confidence that inflation is cooling. A hotter number could do the opposite and bring back concerns about interest rates staying higher for longer.
That’s why I’m not getting too excited about every small move before the release.
I’ve seen markets become noisy ahead of major economic data. Traders start positioning early, prices move back and forth, and everyone tries to guess what will happen next.
Then the actual number arrives.
The first reaction can be fast and messy, but the more important move is often what happens after the market has had time to understand the data.
For me, this is one of those moments where watching carefully makes more sense than forcing a prediction.
The numbers will tell one story.
The market’s reaction will tell another.
#CPIWatch #CPI #NFP #FedWatch
$NES
{alpha}(560x097acf27503753e77bca940277806156c5925b81)
$TFUEL
{spot}(TFUELUSDT)
$LAB
{alpha}(560x7ec43cf65f1663f820427c62a5780b8f2e25593a)
CPI day always brings a different kind of tension to the market.
Everything can look calm for hours, and then one inflation number changes the entire conversation in minutes.
What makes this interesting is that the market is not only watching whether inflation goes up or down. The bigger question is whether the result comes in above or below expectations.
A softer CPI number could give markets more confidence that inflation is cooling. A hotter number could do the opposite and bring back concerns about interest rates staying higher for longer.
That’s why I’m not getting too excited about every small move before the release.
I’ve seen markets become noisy ahead of major economic data. Traders start positioning early, prices move back and forth, and everyone tries to guess what will happen next.
Then the actual number arrives.
The first reaction can be fast and messy, but the more important move is often what happens after the market has had time to understand the data.
For me, this is one of those moments where watching carefully makes more sense than forcing a prediction.
The numbers will tell one story.
The market’s reaction will tell another.
#CPIWatch #CPI #NFP #FedWatch
$NES
$TFUEL
$LAB
Everything can look calm for hours, and then one inflation number changes the entire conversation in minutes.
What makes this interesting is that the market is not only watching whether inflation goes up or down. The bigger question is whether the result comes in above or below expectations.
A softer CPI number could give markets more confidence that inflation is cooling. A hotter number could do the opposite and bring back concerns about interest rates staying higher for longer.
That’s why I’m not getting too excited about every small move before the release.
I’ve seen markets become noisy ahead of major economic data. Traders start positioning early, prices move back and forth, and everyone tries to guess what will happen next.
Then the actual number arrives.
The first reaction can be fast and messy, but the more important move is often what happens after the market has had time to understand the data.
For me, this is one of those moments where watching carefully makes more sense than forcing a prediction.
The numbers will tell one story.
The market’s reaction will tell another.
#CPIWatch #CPI #NFP #FedWatch
$NES
$TFUEL
$LAB

1
2
377
·
--
ສັນຍານກະທິງ
ເບິ່ງການແປ
$DEBIT is showing strong momentum after a +23.7% move, but the 1-minute chart is currently consolidating around $1.557.
Entry Zone: $1.550–$1.558
TP1: $1.570
TP2: $1.578
TP3: $1.585
SL: $1.548
Key level: $1.562. A clean breakout and hold above it could open the path toward the higher targets.
{alpha}(560x66661c7229901f568f16bd1551b3ba826f83ce49)
$DEBIT is showing strong momentum after a +23.7% move, but the 1-minute chart is currently consolidating around $1.557.
Entry Zone: $1.550–$1.558
TP1: $1.570
TP2: $1.578
TP3: $1.585
SL: $1.548
Key level: $1.562. A clean breakout and hold above it could open the path toward the higher targets.
Entry Zone: $1.550–$1.558
TP1: $1.570
TP2: $1.578
TP3: $1.585
SL: $1.548
Key level: $1.562. A clean breakout and hold above it could open the path toward the higher targets.
1
286
·
--
ສັນຍານກະທິງ
ເບິ່ງການແປ
$DOS is showing a short-term bounce after dropping to $0.28574, with price recovering toward $0.28736.
Entry Zone: $0.2865–$0.2880
TP1: $0.2895
TP2: $0.2920
TP3: $0.2960
SL: $0.2848
The immediate test is around $0.2888–$0.2895. A clean break and hold above that area could give the bounce more room to run.
If $0.2857 breaks again, the bullish setup weakens significantly.
{spot}(DOGSUSDT)
$DOS is showing a short-term bounce after dropping to $0.28574, with price recovering toward $0.28736.
Entry Zone: $0.2865–$0.2880
TP1: $0.2895
TP2: $0.2920
TP3: $0.2960
SL: $0.2848
The immediate test is around $0.2888–$0.2895. A clean break and hold above that area could give the bounce more room to run.
If $0.2857 breaks again, the bullish setup weakens significantly.
Entry Zone: $0.2865–$0.2880
TP1: $0.2895
TP2: $0.2920
TP3: $0.2960
SL: $0.2848
The immediate test is around $0.2888–$0.2895. A clean break and hold above that area could give the bounce more room to run.
If $0.2857 breaks again, the bullish setup weakens significantly.
333
·
--
ສັນຍານກະທິງ
$TWT ກຳລັງສະແດງແນວໂນ້ມຂຶ້ນທີ່ມັ່ນຄົງ.
Entry: 0.460–0.500
TP1: 0.560
TP2: 0.650
TP3: 0.780
SL: 0.395
ຊຸດການນີ້ຍັງແຂງແຮງກວ່າ ໃນເມື່ອລາຄາຮັກສາເຂດ entry ແລະແນວໂນ້ມສືບຕໍ່.
$TWT
{future}(TWTUSDT)
$TWT ກຳລັງສະແດງແນວໂນ້ມຂຶ້ນທີ່ມັ່ນຄົງ.
Entry: 0.460–0.500
TP1: 0.560
TP2: 0.650
TP3: 0.780
SL: 0.395
ຊຸດການນີ້ຍັງແຂງແຮງກວ່າ ໃນເມື່ອລາຄາຮັກສາເຂດ entry ແລະແນວໂນ້ມສືບຕໍ່.
$TWT
Entry: 0.460–0.500
TP1: 0.560
TP2: 0.650
TP3: 0.780
SL: 0.395
ຊຸດການນີ້ຍັງແຂງແຮງກວ່າ ໃນເມື່ອລາຄາຮັກສາເຂດ entry ແລະແນວໂນ້ມສືບຕໍ່.
$TWT
72
·
--
ສັນຍານກະທິງ
ເບິ່ງການແປ
$COOKIE is holding a potentially interesting continuation zone.
Entry: 0.0120–0.0135
TP1: 0.0148
TP2: 0.0162
TP3: 0.0185
SL: 0.0105
A sustained hold above 0.012 could keep the bullish structure intact.$COOKIE
{future}(COOKIEUSDT)
$COOKIE is holding a potentially interesting continuation zone.
Entry: 0.0120–0.0135
TP1: 0.0148
TP2: 0.0162
TP3: 0.0185
SL: 0.0105
A sustained hold above 0.012 could keep the bullish structure intact.$COOKIE
Entry: 0.0120–0.0135
TP1: 0.0148
TP2: 0.0162
TP3: 0.0185
SL: 0.0105
A sustained hold above 0.012 could keep the bullish structure intact.$COOKIE
135
·
--
ສັນຍານກະທິງ
ເບິ່ງການແປ
$GIGGLE continues to attract momentum after its strong move.
Entry: 38.50–41.50
TP1: 45.50
TP2: 52.00
TP3: 60.00
SL: 34.00
This is a momentum setup, so waiting for a dip can offer better risk control than chasing.
$GIGGLE
{future}(GIGGLEUSDT)
$GIGGLE continues to attract momentum after its strong move.
Entry: 38.50–41.50
TP1: 45.50
TP2: 52.00
TP3: 60.00
SL: 34.00
This is a momentum setup, so waiting for a dip can offer better risk control than chasing.
$GIGGLE
Entry: 38.50–41.50
TP1: 45.50
TP2: 52.00
TP3: 60.00
SL: 34.00
This is a momentum setup, so waiting for a dip can offer better risk control than chasing.
$GIGGLE
94
·
--
ສັນຍານກະທິງ
ເບິ່ງການແປ
$ZKP is showing improving structure with higher lows.
Entry: 0.0460–0.0505
TP1: 0.0560
TP2: 0.0620
TP3: 0.0720
SL: 0.0410
The key area is the 0.046–0.0505 zone. Losing support invalidates the setup.$ZKP
{future}(ZKPUSDT)
$ZKP is showing improving structure with higher lows.
Entry: 0.0460–0.0505
TP1: 0.0560
TP2: 0.0620
TP3: 0.0720
SL: 0.0410
The key area is the 0.046–0.0505 zone. Losing support invalidates the setup.$ZKP
Entry: 0.0460–0.0505
TP1: 0.0560
TP2: 0.0620
TP3: 0.0720
SL: 0.0410
The key area is the 0.046–0.0505 zone. Losing support invalidates the setup.$ZKP
1
129
·
--
ສັນຍານກະທິງ
ເບິ່ງການແປ
$OPG is attempting a breakout from its recent structure.
Entry: 0.0940–0.1010
TP1: 0.112
TP2: 0.128
TP3: 0.150
SL: 0.0820
A clean hold above resistance would strengthen the bullish setup.
{spot}(OPGUSDT)
$OPG is attempting a breakout from its recent structure.
Entry: 0.0940–0.1010
TP1: 0.112
TP2: 0.128
TP3: 0.150
SL: 0.0820
A clean hold above resistance would strengthen the bullish setup.
Entry: 0.0940–0.1010
TP1: 0.112
TP2: 0.128
TP3: 0.150
SL: 0.0820
A clean hold above resistance would strengthen the bullish setup.
145
·
--
ສັນຍານກະທິງ
ເບິ່ງການແປ
$BROCCOLI714 is moving aggressively with strong short-term momentum.
Entry: 0.0185–0.0205
TP1: 0.0225
TP2: 0.0250
TP3: 0.0290
SL: 0.0165
Low-priced momentum trades can move fast both ways. Confirmation matters.
$BROCCOLI714
{future}(BROCCOLI714USDT)
$BROCCOLI714 is moving aggressively with strong short-term momentum.
Entry: 0.0185–0.0205
TP1: 0.0225
TP2: 0.0250
TP3: 0.0290
SL: 0.0165
Low-priced momentum trades can move fast both ways. Confirmation matters.
$BROCCOLI714
Entry: 0.0185–0.0205
TP1: 0.0225
TP2: 0.0250
TP3: 0.0290
SL: 0.0165
Low-priced momentum trades can move fast both ways. Confirmation matters.
$BROCCOLI714
145
·
--
ສັນຍານກະທິງ
$NIL ກຳລັງສະແດງການເລັ່ງຕົວແບບແຂງແກ່ນ.
Entry: 0.0550–0.0600
TP1: 0.0670
TP2: 0.0750
TP3: 0.0880
SL: 0.0490
ການຖືຢູ່ເໜືອ 0.055 ສາມາດຮັກສາໃຫ້ຂັ້ນຕອນການສືບຕໍ່ມີຄວາມຖືກຕ້ອງ.
{spot}(NILUSDT)
$NIL ກຳລັງສະແດງການເລັ່ງຕົວແບບແຂງແກ່ນ.
Entry: 0.0550–0.0600
TP1: 0.0670
TP2: 0.0750
TP3: 0.0880
SL: 0.0490
ການຖືຢູ່ເໜືອ 0.055 ສາມາດຮັກສາໃຫ້ຂັ້ນຕອນການສືບຕໍ່ມີຄວາມຖືກຕ້ອງ.
Entry: 0.0550–0.0600
TP1: 0.0670
TP2: 0.0750
TP3: 0.0880
SL: 0.0490
ການຖືຢູ່ເໜືອ 0.055 ສາມາດຮັກສາໃຫ້ຂັ້ນຕອນການສືບຕໍ່ມີຄວາມຖືກຕ້ອງ.
147
·
--
ສັນຍານກະທິງ
ເບິ່ງການແປ
$PROMPT is leading the board with strong momentum.
Entry: 6.40–6.85
TP1: 7.40
TP2: 8.20
TP3: 9.10
SL: 5.80
Best approach: wait for a pullback/retest rather than chasing the vertical move.$PROMPT
{alpha}(10x28d38df637db75533bd3f71426f3410a82041544)
$PROMPT is leading the board with strong momentum.
Entry: 6.40–6.85
TP1: 7.40
TP2: 8.20
TP3: 9.10
SL: 5.80
Best approach: wait for a pullback/retest rather than chasing the vertical move.$PROMPT
Entry: 6.40–6.85
TP1: 7.40
TP2: 8.20
TP3: 9.10
SL: 5.80
Best approach: wait for a pullback/retest rather than chasing the vertical move.$PROMPT
197
·
--
ສັນຍານກະທິງ
ເບິ່ງການແປ
I’ve been watching the WTI move higher, with crude up 1.6% to around $84, and my first reaction was pretty simple: inflation pressure could be coming back into the room.
But then I dug a little deeper.
The headline is bullish for oil producers and potentially uncomfortable for risk assets. Higher crude can feed directly into transportation, manufacturing and consumer costs, which makes the “higher oil = higher inflation” narrative look fairly clean.
That’s where I paused.
A stronger oil price doesn’t automatically mean stronger underlying demand. Crude can rise because of supply constraints, geopolitical risk, inventory expectations or positioning. Price is telling me what the market is paying right now, not necessarily what the global economy is consuming tomorrow.
Then it clicked: $84 is an important number, but the more interesting question is what is happening underneath it.
If physical demand is genuinely improving, I’d expect the confirmation to show up beyond the futures price — inventories, refinery utilization, transportation demand and broader economic activity should start lining up.
If those signals don’t follow, the move becomes much harder to read. It could simply be a tighter supply narrative getting priced aggressively.
That distinction matters for crypto too.
Bitcoin and DeFi often trade on liquidity expectations, but an oil-driven inflation impulse can complicate the rate-cut narrative at exactly the wrong time.
So I’m not treating $84 as a clean bullish signal.
The metric I’m watching next is U.S. crude inventories versus refinery demand.
If demand confirms the price, $84 may be the beginning of a bigger macro shift.
If it doesn’t, the market might just be paying more for the same barrel.
$BLESS
{alpha}(560x7c8217517ed4711fe2deccdfeffe8d906b9ae11f)
$HEMI
{future}(HEMIUSDT)
$MOVR
I’ve been watching the WTI move higher, with crude up 1.6% to around $84, and my first reaction was pretty simple: inflation pressure could be coming back into the room.
But then I dug a little deeper.
The headline is bullish for oil producers and potentially uncomfortable for risk assets. Higher crude can feed directly into transportation, manufacturing and consumer costs, which makes the “higher oil = higher inflation” narrative look fairly clean.
That’s where I paused.
A stronger oil price doesn’t automatically mean stronger underlying demand. Crude can rise because of supply constraints, geopolitical risk, inventory expectations or positioning. Price is telling me what the market is paying right now, not necessarily what the global economy is consuming tomorrow.
Then it clicked: $84 is an important number, but the more interesting question is what is happening underneath it.
If physical demand is genuinely improving, I’d expect the confirmation to show up beyond the futures price — inventories, refinery utilization, transportation demand and broader economic activity should start lining up.
If those signals don’t follow, the move becomes much harder to read. It could simply be a tighter supply narrative getting priced aggressively.
That distinction matters for crypto too.
Bitcoin and DeFi often trade on liquidity expectations, but an oil-driven inflation impulse can complicate the rate-cut narrative at exactly the wrong time.
So I’m not treating $84 as a clean bullish signal.
The metric I’m watching next is U.S. crude inventories versus refinery demand.
If demand confirms the price, $84 may be the beginning of a bigger macro shift.
If it doesn’t, the market might just be paying more for the same barrel.
$BLESS
$HEMI
$MOVR
But then I dug a little deeper.
The headline is bullish for oil producers and potentially uncomfortable for risk assets. Higher crude can feed directly into transportation, manufacturing and consumer costs, which makes the “higher oil = higher inflation” narrative look fairly clean.
That’s where I paused.
A stronger oil price doesn’t automatically mean stronger underlying demand. Crude can rise because of supply constraints, geopolitical risk, inventory expectations or positioning. Price is telling me what the market is paying right now, not necessarily what the global economy is consuming tomorrow.
Then it clicked: $84 is an important number, but the more interesting question is what is happening underneath it.
If physical demand is genuinely improving, I’d expect the confirmation to show up beyond the futures price — inventories, refinery utilization, transportation demand and broader economic activity should start lining up.
If those signals don’t follow, the move becomes much harder to read. It could simply be a tighter supply narrative getting priced aggressively.
That distinction matters for crypto too.
Bitcoin and DeFi often trade on liquidity expectations, but an oil-driven inflation impulse can complicate the rate-cut narrative at exactly the wrong time.
So I’m not treating $84 as a clean bullish signal.
The metric I’m watching next is U.S. crude inventories versus refinery demand.
If demand confirms the price, $84 may be the beginning of a bigger macro shift.
If it doesn’t, the market might just be paying more for the same barrel.
$BLESS
$HEMI
$MOVR
$MOVR
0%
$HEMI
0%
$BTR
0%
$BLESS
0%
0 ຄະແນນສຽງ • ປິດລົງຄະແນນສຽງ
119
·
--
ສັນຍານກະທິງ
ເບິ່ງການແປ
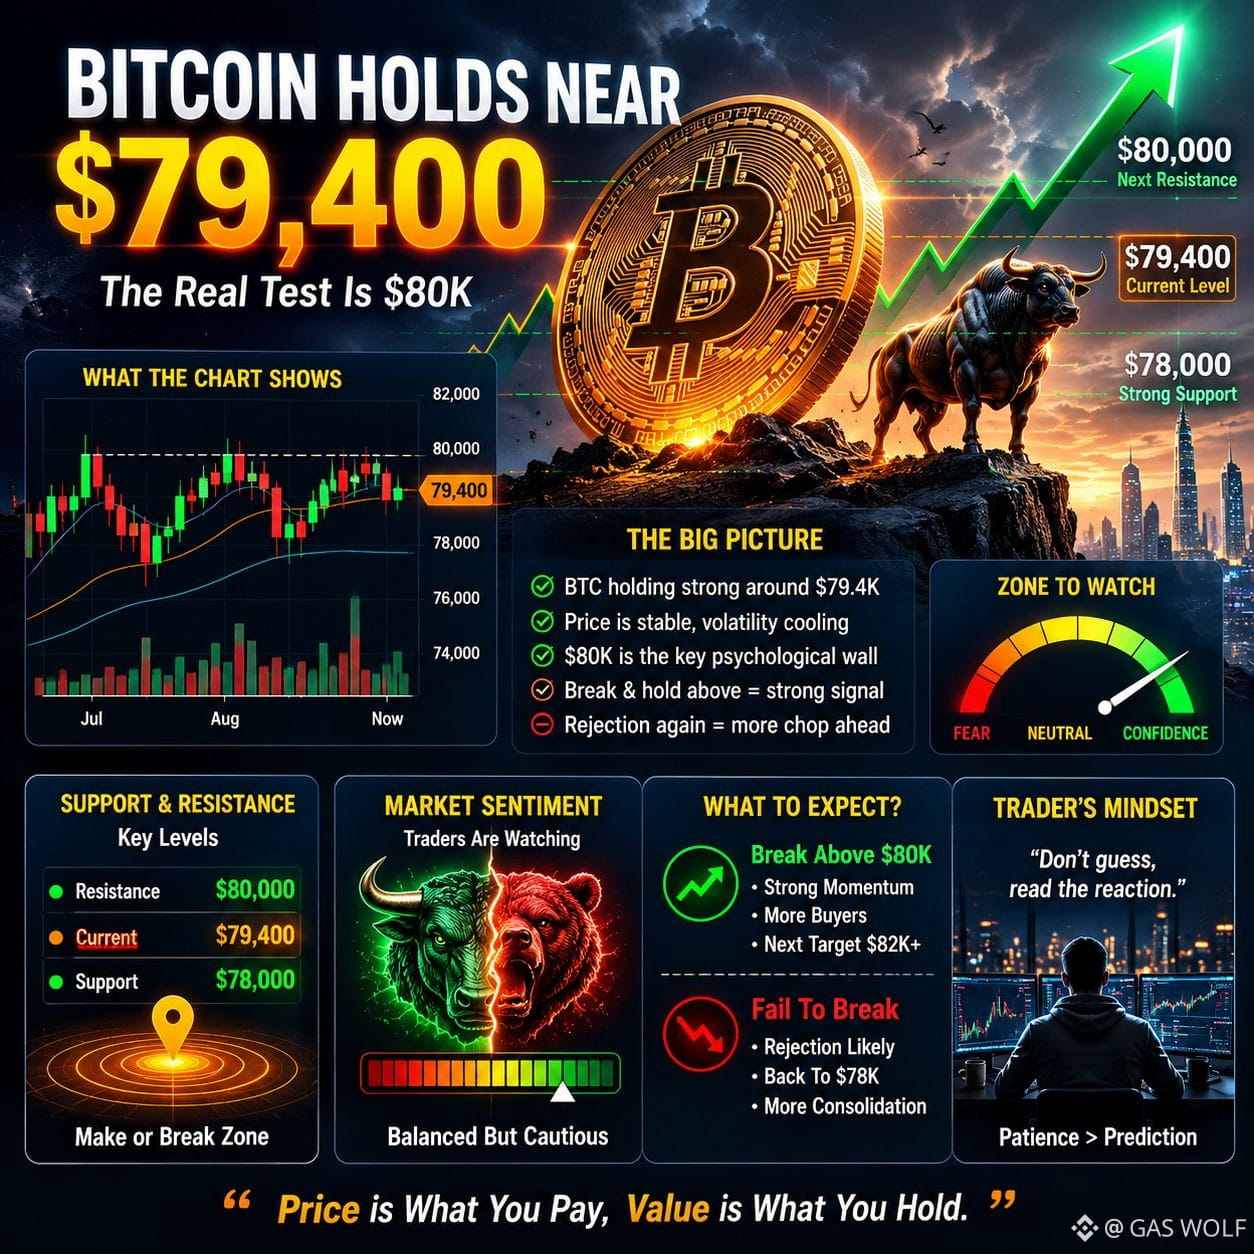
I keep coming back to Bitcoin around $79.4K because, honestly, it looks stronger than I expected.
The easy read is simple: BTC is holding near a major psychological level, sellers haven’t managed to push it away, and $80K is sitting right above like the obvious next test.
But I don’t think the price alone tells the whole story.
What caught my attention is the difference between holding a level and actually having enough demand to break it.
Bitcoin can sit around $79K for hours and look incredibly stable while positioning underneath the surface tells a completely different story. Leverage can support the move for a while, but it doesn’t necessarily create lasting spot demand.
That’s where I paused.
If buyers are genuinely stepping in, I’d expect the market to eventually show it through stronger spot activity and sustained acceptance above $80K.
Then it clicked: the breakout itself probably matters less than what happens after it.
A quick wick above $80K followed by rejection would tell me traders were chasing liquidity.
A clean move above it, followed by buyers defending the level, would be much more interesting.
So I’m not trying to guess whether Bitcoin is bullish or bearish from $79.4K.
I’m watching the behavior around $80K.
Does Bitcoin finally turn that old resistance into support, or does the market once again prove that getting close to the door and actually walking through it are two very different things?
#OktaCrowdStrikeSurgeOnEarningsBeat #BestBuyQ2RevenueTopsEstimatesLiftsOutlook #KospiClosesAtRecordHigh #ChinaOpposesUSProposed7.5%Tariff #BankOfKoreaHikesRatesTo3%
$BTC
{future}(BTCUSDT)
$MOVR
{future}(MOVRUSDT)
$DEBIT
{alpha}(560x66661c7229901f568f16bd1551b3ba826f83ce49)
I keep coming back to Bitcoin around $79.4K because, honestly, it looks stronger than I expected.
The easy read is simple: BTC is holding near a major psychological level, sellers haven’t managed to push it away, and $80K is sitting right above like the obvious next test.
But I don’t think the price alone tells the whole story.
What caught my attention is the difference between holding a level and actually having enough demand to break it.
Bitcoin can sit around $79K for hours and look incredibly stable while positioning underneath the surface tells a completely different story. Leverage can support the move for a while, but it doesn’t necessarily create lasting spot demand.
That’s where I paused.
If buyers are genuinely stepping in, I’d expect the market to eventually show it through stronger spot activity and sustained acceptance above $80K.
Then it clicked: the breakout itself probably matters less than what happens after it.
A quick wick above $80K followed by rejection would tell me traders were chasing liquidity.
A clean move above it, followed by buyers defending the level, would be much more interesting.
So I’m not trying to guess whether Bitcoin is bullish or bearish from $79.4K.
I’m watching the behavior around $80K.
Does Bitcoin finally turn that old resistance into support, or does the market once again prove that getting close to the door and actually walking through it are two very different things?
#OktaCrowdStrikeSurgeOnEarningsBeat #BestBuyQ2RevenueTopsEstimatesLiftsOutlook #KospiClosesAtRecordHigh #ChinaOpposesUSProposed7.5%Tariff #BankOfKoreaHikesRatesTo3%
$BTC
$MOVR
$DEBIT
The easy read is simple: BTC is holding near a major psychological level, sellers haven’t managed to push it away, and $80K is sitting right above like the obvious next test.
But I don’t think the price alone tells the whole story.
What caught my attention is the difference between holding a level and actually having enough demand to break it.
Bitcoin can sit around $79K for hours and look incredibly stable while positioning underneath the surface tells a completely different story. Leverage can support the move for a while, but it doesn’t necessarily create lasting spot demand.
That’s where I paused.
If buyers are genuinely stepping in, I’d expect the market to eventually show it through stronger spot activity and sustained acceptance above $80K.
Then it clicked: the breakout itself probably matters less than what happens after it.
A quick wick above $80K followed by rejection would tell me traders were chasing liquidity.
A clean move above it, followed by buyers defending the level, would be much more interesting.
So I’m not trying to guess whether Bitcoin is bullish or bearish from $79.4K.
I’m watching the behavior around $80K.
Does Bitcoin finally turn that old resistance into support, or does the market once again prove that getting close to the door and actually walking through it are two very different things?
#OktaCrowdStrikeSurgeOnEarningsBeat #BestBuyQ2RevenueTopsEstimatesLiftsOutlook #KospiClosesAtRecordHigh #ChinaOpposesUSProposed7.5%Tariff #BankOfKoreaHikesRatesTo3%
$BTC
$MOVR
$DEBIT
1
157
·
--
ສັນຍານກະທິງ
$PEPE ກຳລັງຊື້ຂາຍຢູ່ປະມານ 0.00000391, ເພີ່ມຂຶ້ນ 2.09%.
ແຜນການຊື້/ຂາຍ: ຈຸດເຂົ້າ: 0.00000370–0.00000395 ເປົ້າໝາຍ: 0.00000430 / 0.00000480 / 0.00000550 ຈຸດຕັດຂາດ (Stop Loss): 0.00000330 ທິດທາງ: ຂາຍ-ໜຸນ (Bullish) R:R: ~1:2.5
ຄວາມผันຜວນຂອງຫຸ້ນຂະໜາດນ້ອຍຮຸນແຮງ, ສະນັ້ນການກຳນົດຂະໜາດສະຖານະ (position sizing) ຈຶ່ງສຳຄັນຢ່າງຫຼາຍທີ່ນີ້. ແຜນການຍັງດ້ານບວກຢູ່ ໃນເວລາທີ່ພາກ 0.00000370 ຖືກຮັກສາໄວ້, ໂດຍ 0.00000430 ເປັນຈຸດກວດຄົນຂາຂຶ້ນດ່ານທຳອິດ.
ນີ້ແມ່ນແຜນການສຶກສາທີ່ອີງຈາກກຣາຟຈາກພາບທີ່ໃຫ້มา, ບໍ່ແມ່ນຄຳແນະນຳດ້ານການເງິນ. ລະດັບຕ່າງໆສາມາດປ່ຽນໄດ້ໄວ ຕາມການເຄື່ອນຂອງລາຄາ.$PEPE
{alpha}()
$PEPE ກຳລັງຊື້ຂາຍຢູ່ປະມານ 0.00000391, ເພີ່ມຂຶ້ນ 2.09%.
ແຜນການຊື້/ຂາຍ: ຈຸດເຂົ້າ: 0.00000370–0.00000395 ເປົ້າໝາຍ: 0.00000430 / 0.00000480 / 0.00000550 ຈຸດຕັດຂາດ (Stop Loss): 0.00000330 ທິດທາງ: ຂາຍ-ໜຸນ (Bullish) R:R: ~1:2.5
ຄວາມผันຜວນຂອງຫຸ້ນຂະໜາດນ້ອຍຮຸນແຮງ, ສະນັ້ນການກຳນົດຂະໜາດສະຖານະ (position sizing) ຈຶ່ງສຳຄັນຢ່າງຫຼາຍທີ່ນີ້. ແຜນການຍັງດ້ານບວກຢູ່ ໃນເວລາທີ່ພາກ 0.00000370 ຖືກຮັກສາໄວ້, ໂດຍ 0.00000430 ເປັນຈຸດກວດຄົນຂາຂຶ້ນດ່ານທຳອິດ.
ນີ້ແມ່ນແຜນການສຶກສາທີ່ອີງຈາກກຣາຟຈາກພາບທີ່ໃຫ້มา, ບໍ່ແມ່ນຄຳແນະນຳດ້ານການເງິນ. ລະດັບຕ່າງໆສາມາດປ່ຽນໄດ້ໄວ ຕາມການເຄື່ອນຂອງລາຄາ.$PEPE
ແຜນການຊື້/ຂາຍ: ຈຸດເຂົ້າ: 0.00000370–0.00000395 ເປົ້າໝາຍ: 0.00000430 / 0.00000480 / 0.00000550 ຈຸດຕັດຂາດ (Stop Loss): 0.00000330 ທິດທາງ: ຂາຍ-ໜຸນ (Bullish) R:R: ~1:2.5
ຄວາມผันຜວນຂອງຫຸ້ນຂະໜາດນ້ອຍຮຸນແຮງ, ສະນັ້ນການກຳນົດຂະໜາດສະຖານະ (position sizing) ຈຶ່ງສຳຄັນຢ່າງຫຼາຍທີ່ນີ້. ແຜນການຍັງດ້ານບວກຢູ່ ໃນເວລາທີ່ພາກ 0.00000370 ຖືກຮັກສາໄວ້, ໂດຍ 0.00000430 ເປັນຈຸດກວດຄົນຂາຂຶ້ນດ່ານທຳອິດ.
ນີ້ແມ່ນແຜນການສຶກສາທີ່ອີງຈາກກຣາຟຈາກພາບທີ່ໃຫ້มา, ບໍ່ແມ່ນຄຳແນະນຳດ້ານການເງິນ. ລະດັບຕ່າງໆສາມາດປ່ຽນໄດ້ໄວ ຕາມການເຄື່ອນຂອງລາຄາ.$PEPE
93
·
--
ສັນຍານກະທິງ
$DOGE i kāng nyim 0.08907 lẹhinna ni nkan bi 2.89% ilosoke.
Àwọn Eto Iṣowo: Iwọle: 0.087–0.090 Awọn ibi-afẹde: 0.094 / 0.102 / 0.110 Duro Loss: 0.080 Imọràn: Bullish R:R: ~1:2.4
Agbegbe 0.087 jẹ́ atilẹyin pàtàkì. Tí ó bá ń di i duro, ó jẹ́ kí ọna lọ sí 0.094 ṣi silẹ, nígbà tí ìfarapa tí o mọ́lẹ̀ le mu ìgbéga naa yara.
$DOGE
{future}(DOGEUSDT)
$DOGE i kāng nyim 0.08907 lẹhinna ni nkan bi 2.89% ilosoke.
Àwọn Eto Iṣowo: Iwọle: 0.087–0.090 Awọn ibi-afẹde: 0.094 / 0.102 / 0.110 Duro Loss: 0.080 Imọràn: Bullish R:R: ~1:2.4
Agbegbe 0.087 jẹ́ atilẹyin pàtàkì. Tí ó bá ń di i duro, ó jẹ́ kí ọna lọ sí 0.094 ṣi silẹ, nígbà tí ìfarapa tí o mọ́lẹ̀ le mu ìgbéga naa yara.
$DOGE
Àwọn Eto Iṣowo: Iwọle: 0.087–0.090 Awọn ibi-afẹde: 0.094 / 0.102 / 0.110 Duro Loss: 0.080 Imọràn: Bullish R:R: ~1:2.4
Agbegbe 0.087 jẹ́ atilẹyin pàtàkì. Tí ó bá ń di i duro, ó jẹ́ kí ọna lọ sí 0.094 ṣi silẹ, nígbà tí ìfarapa tí o mọ́lẹ̀ le mu ìgbéga naa yara.
$DOGE
72
·
--
ສັນຍານກະທິງ
$TUT is trading around 0.04856, down 4.60%.
Trade Setup: Entry: 0.047–0.050 Targets: 0.043 / 0.038 / 0.033 Stop Loss: 0.055 Bias: Bearish R:R: ~1:2.2
Lower highs are keeping pressure on the chart. A rejection from the 0.047–0.050 region could favor continuation toward 0.043 and 0.038.$TUT
{future}(TUTUSDT)
$TUT is trading around 0.04856, down 4.60%.
Trade Setup: Entry: 0.047–0.050 Targets: 0.043 / 0.038 / 0.033 Stop Loss: 0.055 Bias: Bearish R:R: ~1:2.2
Lower highs are keeping pressure on the chart. A rejection from the 0.047–0.050 region could favor continuation toward 0.043 and 0.038.$TUT
Trade Setup: Entry: 0.047–0.050 Targets: 0.043 / 0.038 / 0.033 Stop Loss: 0.055 Bias: Bearish R:R: ~1:2.2
Lower highs are keeping pressure on the chart. A rejection from the 0.047–0.050 region could favor continuation toward 0.043 and 0.038.$TUT
208
·
--
ສັນຍານກະທິງ
ເບິ່ງການແປ
$HEMI is showing the strongest percentage move among these names, up 37.76% at 0.01047.
Trade Setup: Entry: 0.0098–0.0105 Targets: 0.0118 / 0.0132 / 0.0150 Stop Loss: 0.0085 Bias: Bullish R:R: ~1:2.8
Strong momentum, but after a 37% move, pullback risk is high. The setup becomes more attractive if price consolidates rather than immediately extending vertically.$HEMI
{future}(HEMIUSDT)
$HEMI is showing the strongest percentage move among these names, up 37.76% at 0.01047.
Trade Setup: Entry: 0.0098–0.0105 Targets: 0.0118 / 0.0132 / 0.0150 Stop Loss: 0.0085 Bias: Bullish R:R: ~1:2.8
Strong momentum, but after a 37% move, pullback risk is high. The setup becomes more attractive if price consolidates rather than immediately extending vertically.$HEMI
Trade Setup: Entry: 0.0098–0.0105 Targets: 0.0118 / 0.0132 / 0.0150 Stop Loss: 0.0085 Bias: Bullish R:R: ~1:2.8
Strong momentum, but after a 37% move, pullback risk is high. The setup becomes more attractive if price consolidates rather than immediately extending vertically.$HEMI
118
·
--
ສັນຍານກະທິງ
ເບິ່ງການແປ
$ENA is trading near 0.1695 with a strong +17.87% move.
Trade Setup: Entry: 0.162–0.170 Targets: 0.185 / 0.205 / 0.225 Stop Loss: 0.150 Bias: Bullish R:R: ~1:2.5
The key is 0.170. A confirmed break and hold above that level could extend the current momentum toward 0.185 and 0.205.$ENA
{future}(ENAUSDT)
$ENA is trading near 0.1695 with a strong +17.87% move.
Trade Setup: Entry: 0.162–0.170 Targets: 0.185 / 0.205 / 0.225 Stop Loss: 0.150 Bias: Bullish R:R: ~1:2.5
The key is 0.170. A confirmed break and hold above that level could extend the current momentum toward 0.185 and 0.205.$ENA
Trade Setup: Entry: 0.162–0.170 Targets: 0.185 / 0.205 / 0.225 Stop Loss: 0.150 Bias: Bullish R:R: ~1:2.5
The key is 0.170. A confirmed break and hold above that level could extend the current momentum toward 0.185 and 0.205.$ENA
1
135
·
--
ສັນຍານກະທິງ
$ONG hihaṅgihan ang laggard dito, paabante ang 43.08% sa paligid ng 0.12680.
Trade Setup: Entry: 0.124–0.130 Targets: 0.110 / 0.098 / 0.085 Stop Loss: 0.145 Bias: Bearish R:R: ~1:2.3
Ito ay defensive setup imbes na momentum chase. Kung mabigo ang area na 0.124–0.130 na manatili, ang downside continuation ang magiging mas malinaw na scenario.$ONG
{future}(ONGUSDT)
$ONG hihaṅgihan ang laggard dito, paabante ang 43.08% sa paligid ng 0.12680.
Trade Setup: Entry: 0.124–0.130 Targets: 0.110 / 0.098 / 0.085 Stop Loss: 0.145 Bias: Bearish R:R: ~1:2.3
Ito ay defensive setup imbes na momentum chase. Kung mabigo ang area na 0.124–0.130 na manatili, ang downside continuation ang magiging mas malinaw na scenario.$ONG
Trade Setup: Entry: 0.124–0.130 Targets: 0.110 / 0.098 / 0.085 Stop Loss: 0.145 Bias: Bearish R:R: ~1:2.3
Ito ay defensive setup imbes na momentum chase. Kung mabigo ang area na 0.124–0.130 na manatili, ang downside continuation ang magiging mas malinaw na scenario.$ONG
147
·
--
ເບິ່ງການແປ
$BMT is one of the strongest movers on the board, up 22.18% at 0.02617.
Trade Setup: Entry: 0.024–0.026 Targets: 0.029 / 0.032 / 0.036 Stop Loss: 0.021 Bias: Bullish R:R: ~1:2.6
Momentum is strong, but volatility is elevated. A pullback into 0.024–0.026 would be preferable to entering after an extended candle.$BMT
{future}(BMTUSDT)
$BMT is one of the strongest movers on the board, up 22.18% at 0.02617.
Trade Setup: Entry: 0.024–0.026 Targets: 0.029 / 0.032 / 0.036 Stop Loss: 0.021 Bias: Bullish R:R: ~1:2.6
Momentum is strong, but volatility is elevated. A pullback into 0.024–0.026 would be preferable to entering after an extended candle.$BMT
Trade Setup: Entry: 0.024–0.026 Targets: 0.029 / 0.032 / 0.036 Stop Loss: 0.021 Bias: Bullish R:R: ~1:2.6
Momentum is strong, but volatility is elevated. A pullback into 0.024–0.026 would be preferable to entering after an extended candle.$BMT
103
ເຂົ້າສູ່ລະບົບເພື່ອສຳຫຼວດເນື້ອຫາເພີ່ມເຕີມ
ເຂົ້າຮ່ວມກຸ່ມຜູ້ໃຊ້ຄຣິບໂຕທົ່ວໂລກໃນ Binance Square.
⚡️ ໄດ້ຮັບຂໍ້ມູນຫຼ້າສຸດ ແລະ ທີ່ມີປະໂຫຍດກ່ຽວກັບຄຣິບໂຕ.
💬 ໄດ້ຮັບຄວາມໄວ້ວາງໃຈຈາກຕະຫຼາດແລກປ່ຽນຄຣິບໂຕທີ່ໃຫຍ່ທີ່ສຸດໃນໂລກ.
👍 ຄົ້ນຫາຂໍ້ມູນເຊີງເລິກທີ່ແທ້ຈາກນັກສ້າງທີ່ໄດ້ຮັບການຢືນຢັນ.
ອີເມວ / ເບີໂທລະສັບ
ຫົວຂໍ້ທີ່ກໍາລັງນິຍົມ
SECReceivesGrayscaleLitecoinTrustETFFiling
57,720 views
1,099 ກຳລັງສົນທະນາ
#secreceivesgrayscalelitecointrustetffiling
I-SEC ITHOLA UKUFIKA KWEFAYELA YE-GRAYSCALE LITECOIN ETF: I-LTC ISANDA KUTHOLA OKUNYE UKUBUKA 🚨
Imakethe ibihamba kancane lapho kufika elinye isihloko sika-Litecoin. Kubahwebi ababukele bephandle, bekuyifayela elenza ume ubhekane nombuzo: ingabe ukufinyelela kwezikhungo kuya kusondela?
I-Grayscale’s Litecoin Trust isithathe enye indlela iya phambili ekubumbeni kwe-ETF, ngamafayili akamuva axhunyaniswe noshintsho oluphakanyisiwe kanye nenqubo yokufakwa kuhlu ku-NYSE Arca. Irekhodi le-SEC libonisa izinqubo zangaphambilini mayelana nesiphakamiso se-Grayscale se-Litecoin, kanti imisebenzi yakamuva yamafayela igcina indaba iqhubeka.
Okubalulekile ukuthi ifayela akusona isivumelwano. Abatshalizimali kufanele bahlukanise inqubekelaphambili yokulawula nokulindela ukuqaliswa kwe-ETF ngokushesha.
Umbono wami: indaba enkulu ukufinyeleleka. Uhlelo lwe-ETF lungase lwenze kube lula ukuzuza ukuvezwa ku-LTC kubatshalizimali bendabuko abakhetha imikhiqizo elawulwa kunokubamba ngqo i-cryptocurrency.
ILitecoin okwamanje ihweba cishe ngo-$53.69 ku-Binance, kanti le mpahla ibonisa ukunyakaza okulinganiselwe emahoreni angama-24. Lokho kwenza intuthuko yokulawula ibe yinto ethakazelisayo kunokulandela nje ukusabela kwentengo okusekelwe esihlokweni.
Ukuhlolwa kwangempela kufika ngokulandelayo: izinqumo zokulawula, isidingo semakethe, uketshezi, nokuthi ngabe intshisekelo yezikhungo iyalandela yini amaphepha.
Ifayela lingavula umnyango, kodwa isidingo sinquma ukuthi kwenzekani ngemva kokuvuleka.
❓Ucabanga ukuthi i-Grayscale Litecoin ETF ingashintsha kakhulu isidingo sezikhungo se-LTC?
Isaziso: Lokhu ngezinjongo zolwazi kuphela hhayi iseluleko sezezimali. Izimpahla ze-Crypto ziyaguquguquka, futhi imiphumela yokulawula ayiqinisekile.
#Litecoin #CryptoETF #GrowWithSAC $LTC $ETH $SOL
#SECReceivesGrayscaleLitecoinTrustETFFiling
Sienna Leo-你真棒-带我走
·2 ຖືກໃຈ
·2k views
ClarityActFacesProceduralVoteSept15
179,026 views
2,013 ກຳລັງສົນທະນາ
US10YearTreasuryYieldNears5%
60,953 views
1,098 ກຳລັງສົນທະນາ