
For-Exx Kripto
1.4k ໂພສ

For-Exx Kripto
ລາຍງານ
ບລັອກຜູ້ໃຊ້
Technical and Fundamental Analysis of Cryptocurrencies,Stocks and Financial Instruments
/// Youtube / Twitter : @ForExxKripto
1 ກໍາລັງຕິດຕາມ
1.1K+ ຜູ້ຕິດຕາມ
3.9K+ Liked
ໂພສ
ທັງໝົດ
ວົງຢືມ
ວີດີໂອ
ບົດຄວາມ
ເບິ່ງການແປ
END-OF-DAY MARKET REPORT — SEPTEMBER 9, 2026🔐 END-OF-DAY MARKET REPORT — SEPTEMBER 9, 2026
🌐 TOP STORIES OF THE DAY
Zcash (ZEC) climbed as high as $1,290 today in a rally fueled by Grayscale’s ZCSH ETF, reaching its highest level since November 2016 — gaining 57% over the past week, more than 138% over the past month, and approximately 2,400% over the past year; ZCSH options also began trading on the NYSE, while the ETF’s net assets reached $463 million
The Liquid Network attacker returned 3,400 BTC — approximately 85% of the 4,000 BTC withdrawn — to the federation address on September 7; 598.5 BTC (~$47 million) remains unrecovered and the network is still suspended — Ledger CTO Charles Guillemet stated that retaining the remaining amount is inconsistent with a genuine “white-hat” bug bounty agreement and is closer to “extortion”
The U.S.-Iran conflict continued yesterday with attacks from both sides; oil prices approached $100 per barrel, while expectations for a 25-basis-point rate hike are strengthening one week before the Fed concludes its two-day policy meeting
BTC formed a “golden cross” pattern this week — the short-term moving average crossing above the long-term moving average, improving the trend structure but considered a lagging signal
━━━
₿ BITCOIN
BTC opened this morning at $78,446, down 0.8% from yesterday’s open; during the morning, it recovered toward the $78,800–$78,900 range. The price remains tightly trapped around $78,600 and below the $79,500 resistance — a four-hour close above this level, as highlighted by one trader, could reopen the path toward the $82,000 area; otherwise, the $70,500 level followed by the $67,200 range remains at risk. Despite the golden cross formation, a breakout has not yet been confirmed; ETF demand remains strong, while there is limited evidence of increasing selling pressure from large wallets. Yesterday, BTC declined from $79,113 to $78,455 (~0.8%), while the September 8 intraday range remained between $77,666 and $79,475.
━━━
🔷 ETHEREUM & ALTCOINS
ETH opened this morning at $2,485, down 0.2% from yesterday. Zcash remains the standout cryptocurrency of the week — the ETF catalyst combined with a sharp increase in open interest indicates that the rally is being driven not only by spot buying but also by growing derivatives-market interest; analysts view the $1,435–$1,500 range as the next test zone. The broader market remains cautious due to geopolitical tensions related to Iran and rising oil prices.
━━━
📋 TOP CRYPTO NEWS
Liquid Network’s federation reserve has fallen from approximately 4,200 BTC before the incident to around 197 BTC; Blockstream stated that it has deployed the patched software and that federation members are preparing for a coordinated restart, but there is still no publicly announced timeline for the return of normal peg-out operations
Analysts believe the incident could trigger new independent audits across the industry focusing on how total-supply verification is performed in sidechain and bridge architectures
The combination of Zcash’s privacy-pool technology and institutional ETF demand continues to set a precedent for the integration of privacy-focused crypto assets into regulated products
━━━
🔓 TOKEN UNLOCKS
Linea (LINEA)
September 10, 2026
Amount: ~$2.75 million (3% of circulating supply) — 960.13 million tokens
Recipient profile: Linea Consortium (long-term alignment) + Linea Consortium (Ignition), split equally
Selling pressure: 🟡
Aptos (APT)
September 11, 2026
Amount: ~$7.09 million (0.65% of circulating supply) — 11.31 million tokens
Selling pressure: 🟡
━━━
🔭 OUTLOOK & UPCOMING EVENTS
The most critical event of the week is the August CPI report on September 11 — following the strong NFP, the market is now pricing the possibility of a rate hike, and a hot CPI reading could reinforce this scenario and create additional pressure on BTC ahead of the FOMC decision on September 15–16. The fate of the 598.5 BTC still unrecovered from the Liquid Network incident and the timeline for the network’s reopening will be closely monitored in the short term; the impact of the conflict in Iran on oil prices also continues to complicate the inflation outlook. Whether BTC can break the $79,500 resistance and confirm the golden cross signal will be the week’s most critical technical test; failure could leave the $70,500–$67,200 range at risk. Zcash’s rally toward the $1,435–$1,500 target and the September 10–11 LINEA/APT unlocks stand out as separate but smaller-scale test points.
END-OF-DAY MARKET REPORT — SEPTEMBER 9, 2026
🔐 END-OF-DAY MARKET REPORT — SEPTEMBER 9, 2026
🌐 TOP STORIES OF THE DAY
Zcash (ZEC) climbed as high as $1,290 today in a rally fueled by Grayscale’s ZCSH ETF, reaching its highest level since November 2016 — gaining 57% over the past week, more than 138% over the past month, and approximately 2,400% over the past year; ZCSH options also began trading on the NYSE, while the ETF’s net assets reached $463 million
The Liquid Network attacker returned 3,400 BTC — approximately 85% of the 4,000 BTC withdrawn — to the federation address on September 7; 598.5 BTC (~$47 million) remains unrecovered and the network is still suspended — Ledger CTO Charles Guillemet stated that retaining the remaining amount is inconsistent with a genuine “white-hat” bug bounty agreement and is closer to “extortion”
The U.S.-Iran conflict continued yesterday with attacks from both sides; oil prices approached $100 per barrel, while expectations for a 25-basis-point rate hike are strengthening one week before the Fed concludes its two-day policy meeting
BTC formed a “golden cross” pattern this week — the short-term moving average crossing above the long-term moving average, improving the trend structure but considered a lagging signal
━━━
₿ BITCOIN
BTC opened this morning at $78,446, down 0.8% from yesterday’s open; during the morning, it recovered toward the $78,800–$78,900 range. The price remains tightly trapped around $78,600 and below the $79,500 resistance — a four-hour close above this level, as highlighted by one trader, could reopen the path toward the $82,000 area; otherwise, the $70,500 level followed by the $67,200 range remains at risk. Despite the golden cross formation, a breakout has not yet been confirmed; ETF demand remains strong, while there is limited evidence of increasing selling pressure from large wallets. Yesterday, BTC declined from $79,113 to $78,455 (~0.8%), while the September 8 intraday range remained between $77,666 and $79,475.
━━━
🔷 ETHEREUM & ALTCOINS
ETH opened this morning at $2,485, down 0.2% from yesterday. Zcash remains the standout cryptocurrency of the week — the ETF catalyst combined with a sharp increase in open interest indicates that the rally is being driven not only by spot buying but also by growing derivatives-market interest; analysts view the $1,435–$1,500 range as the next test zone. The broader market remains cautious due to geopolitical tensions related to Iran and rising oil prices.
━━━
📋 TOP CRYPTO NEWS
Liquid Network’s federation reserve has fallen from approximately 4,200 BTC before the incident to around 197 BTC; Blockstream stated that it has deployed the patched software and that federation members are preparing for a coordinated restart, but there is still no publicly announced timeline for the return of normal peg-out operations
Analysts believe the incident could trigger new independent audits across the industry focusing on how total-supply verification is performed in sidechain and bridge architectures
The combination of Zcash’s privacy-pool technology and institutional ETF demand continues to set a precedent for the integration of privacy-focused crypto assets into regulated products
━━━
🔓 TOKEN UNLOCKS
Linea (LINEA)
September 10, 2026
Amount: ~$2.75 million (3% of circulating supply) — 960.13 million tokens
Recipient profile: Linea Consortium (long-term alignment) + Linea Consortium (Ignition), split equally
Selling pressure: 🟡
Aptos (APT)
September 11, 2026
Amount: ~$7.09 million (0.65% of circulating supply) — 11.31 million tokens
Selling pressure: 🟡
━━━
🔭 OUTLOOK & UPCOMING EVENTS
The most critical event of the week is the August CPI report on September 11 — following the strong NFP, the market is now pricing the possibility of a rate hike, and a hot CPI reading could reinforce this scenario and create additional pressure on BTC ahead of the FOMC decision on September 15–16. The fate of the 598.5 BTC still unrecovered from the Liquid Network incident and the timeline for the network’s reopening will be closely monitored in the short term; the impact of the conflict in Iran on oil prices also continues to complicate the inflation outlook. Whether BTC can break the $79,500 resistance and confirm the golden cross signal will be the week’s most critical technical test; failure could leave the $70,500–$67,200 range at risk. Zcash’s rally toward the $1,435–$1,500 target and the September 10–11 LINEA/APT unlocks stand out as separate but smaller-scale test points.
🌐 TOP STORIES OF THE DAY
Zcash (ZEC) climbed as high as $1,290 today in a rally fueled by Grayscale’s ZCSH ETF, reaching its highest level since November 2016 — gaining 57% over the past week, more than 138% over the past month, and approximately 2,400% over the past year; ZCSH options also began trading on the NYSE, while the ETF’s net assets reached $463 million
The Liquid Network attacker returned 3,400 BTC — approximately 85% of the 4,000 BTC withdrawn — to the federation address on September 7; 598.5 BTC (~$47 million) remains unrecovered and the network is still suspended — Ledger CTO Charles Guillemet stated that retaining the remaining amount is inconsistent with a genuine “white-hat” bug bounty agreement and is closer to “extortion”
The U.S.-Iran conflict continued yesterday with attacks from both sides; oil prices approached $100 per barrel, while expectations for a 25-basis-point rate hike are strengthening one week before the Fed concludes its two-day policy meeting
BTC formed a “golden cross” pattern this week — the short-term moving average crossing above the long-term moving average, improving the trend structure but considered a lagging signal
━━━
₿ BITCOIN
BTC opened this morning at $78,446, down 0.8% from yesterday’s open; during the morning, it recovered toward the $78,800–$78,900 range. The price remains tightly trapped around $78,600 and below the $79,500 resistance — a four-hour close above this level, as highlighted by one trader, could reopen the path toward the $82,000 area; otherwise, the $70,500 level followed by the $67,200 range remains at risk. Despite the golden cross formation, a breakout has not yet been confirmed; ETF demand remains strong, while there is limited evidence of increasing selling pressure from large wallets. Yesterday, BTC declined from $79,113 to $78,455 (~0.8%), while the September 8 intraday range remained between $77,666 and $79,475.
━━━
🔷 ETHEREUM & ALTCOINS
ETH opened this morning at $2,485, down 0.2% from yesterday. Zcash remains the standout cryptocurrency of the week — the ETF catalyst combined with a sharp increase in open interest indicates that the rally is being driven not only by spot buying but also by growing derivatives-market interest; analysts view the $1,435–$1,500 range as the next test zone. The broader market remains cautious due to geopolitical tensions related to Iran and rising oil prices.
━━━
📋 TOP CRYPTO NEWS
Liquid Network’s federation reserve has fallen from approximately 4,200 BTC before the incident to around 197 BTC; Blockstream stated that it has deployed the patched software and that federation members are preparing for a coordinated restart, but there is still no publicly announced timeline for the return of normal peg-out operations
Analysts believe the incident could trigger new independent audits across the industry focusing on how total-supply verification is performed in sidechain and bridge architectures
The combination of Zcash’s privacy-pool technology and institutional ETF demand continues to set a precedent for the integration of privacy-focused crypto assets into regulated products
━━━
🔓 TOKEN UNLOCKS
Linea (LINEA)
September 10, 2026
Amount: ~$2.75 million (3% of circulating supply) — 960.13 million tokens
Recipient profile: Linea Consortium (long-term alignment) + Linea Consortium (Ignition), split equally
Selling pressure: 🟡
Aptos (APT)
September 11, 2026
Amount: ~$7.09 million (0.65% of circulating supply) — 11.31 million tokens
Selling pressure: 🟡
━━━
🔭 OUTLOOK & UPCOMING EVENTS
The most critical event of the week is the August CPI report on September 11 — following the strong NFP, the market is now pricing the possibility of a rate hike, and a hot CPI reading could reinforce this scenario and create additional pressure on BTC ahead of the FOMC decision on September 15–16. The fate of the 598.5 BTC still unrecovered from the Liquid Network incident and the timeline for the network’s reopening will be closely monitored in the short term; the impact of the conflict in Iran on oil prices also continues to complicate the inflation outlook. Whether BTC can break the $79,500 resistance and confirm the golden cross signal will be the week’s most critical technical test; failure could leave the $70,500–$67,200 range at risk. Zcash’s rally toward the $1,435–$1,500 target and the September 10–11 LINEA/APT unlocks stand out as separate but smaller-scale test points.
1
256
ບົດຄວາມ
ເບິ່ງການແປ
END-OF-DAY MARKET REPORT — SEPTEMBER 8, 2026🔐 END-OF-DAY MARKET REPORT — SEPTEMBER 8, 2026
🌐 TOP STORIES OF THE DAY
Liquid Network (Blockstream’s Bitcoin sidechain) confirmed that approximately 4,000 BTC ($320 million) was withdrawn from its federation wallet on September 6 due to a rangeproof caching bug in the Elements software — attackers generated L-BTC not backed by real BTC and cashed it out through SideSwap as if it were a legitimate peg-out transaction, without stealing private keys; attackers claiming to be “white hats” returned 3,400 BTC, while 598.5 BTC (~$47 million) remains unrecovered, and the network remains suspended
A fix for the vulnerability had been publicly uploaded to the Elements main repository on GitHub on September 1 — the attacker may have reverse-engineered and exploited the open-source patch; the Bitcoin mainnet was not affected by the incident
The U.S.-Iran conflict continues with military activity over the weekend, while oil prices are approaching $100 again — fueling inflation concerns one week before the Fed meeting where interest-rate policy will be discussed
The crypto market failed to reclaim the $80,000 resistance on Monday amid low liquidity due to the U.S. Labor Day holiday; French company Capital B purchased 376 BTC for $29 million, bringing its treasury holdings to 3,521 BTC, while Strive viewed the decline as a buying opportunity
Short-term whales are still holding approximately $9.07 billion in unrealized profits — being monitored as a potential source of profit-taking pressure
Ahead of the consecutive CLARITY Act cloture vote and FOMC interest-rate decision on September 15–16, today’s and tomorrow’s macro data — including the September 11 CPI report — remain the market’s focus
━━━
₿ BITCOIN
$BTC opened this morning at $79,100, down 1.6% from Monday’s open; during the morning, it declined into the $78,170–$78,700 range. Rising Treasury yields following the strong August NFP report and geopolitical tensions related to Iran are putting pressure on risk assets by strengthening rate-hike expectations. The price is approximately 2.5% below the September 4 high of $81,167 and has fallen below the 50-week moving average (~$79,725), failing to hold this level at Sunday’s weekly close. Low liquidity during the holiday triggered $55 million in BTC long liquidations and $208 million in long liquidations across the broader crypto market. Critical support is in the $78,000–$78,500 range, with the $80,000–$80,500 resistance zone above; the 30-day change remains strongly positive at approximately 22%.
━━━
🔷 ETHEREUM & ALTCOINS
$ETH opened this morning at $2,490, down 1% from yesterday. Solana declined 2.4% to the $103–$104 range, with hourly momentum turning bearish; XRP fell 1.8% to $1.40. The broader market is in risk-reduction mode due to the combination of the confidence shock caused by the Liquid Network hack and macroeconomic pressure; meanwhile, large funds continue to maintain steady buying beneath the surface.
━━━
📋 TOP CRYPTO NEWS
Analysts emphasize that despite the “white-hat” claim, the Liquid Network incident highlights the need for an industry-wide review of sidechain security architecture, particularly total-supply verification under Confidential Transactions
Approximately 136–140 million dollars was lost across around 50 separate crypto hacks in August — the Liquid Network incident alone is more than twice that total and stands out as the largest security incident of the second half of the year
The market is now focused on the September 11 CPI report, followed by the CLARITY Act vote and FOMC decision on September 15–16 — this highly concentrated calendar over the next three weeks creates an unusually high risk of volatility in crypto pricing
━━━
🔓 TOKEN UNLOCKS
Aptos ($APT)
September 11, 2026
Amount: ~$7.09 million (0.65% of circulating supply) — 11.31 million tokens
Selling pressure: 🟡
Linea (LINEA)
September 10, 2026
Amount: ~$2.75 million (3% of circulating supply) — 960.13 million tokens
Recipient profile: Linea Consortium (long-term alignment) + Linea Consortium (Ignition), split equally
Selling pressure: 🟡
According to Tokenomist, approximately $325.6 million in total unlocks are expected during the second week of the month, including APT, LINEA, and CHEEL.
━━━
🔭 OUTLOOK & UPCOMING EVENTS
The August CPI report to be released this week — not tomorrow, September 11 — will be the final major data point ahead of the consecutive CLARITY Act cloture vote and FOMC decision on September 15–16. A hot reading could reinforce already-strengthening rate-hike expectations following the strong NFP. The fate of the 598.5 BTC that remains unrecovered from the Liquid Network incident and when the network will reopen will be closely monitored in the short term; similar sidechain security concerns could spread to other bridge projects. Whether BTC can hold the $78,000–$78,500 support zone will be critical for an attempt to reclaim the 50-week moving average. The September 10–11 LINEA and APT unlocks stand out as relatively small-scale test points ahead of the major macroeconomic events.
END-OF-DAY MARKET REPORT — SEPTEMBER 8, 2026
🔐 END-OF-DAY MARKET REPORT — SEPTEMBER 8, 2026
🌐 TOP STORIES OF THE DAY
Liquid Network (Blockstream’s Bitcoin sidechain) confirmed that approximately 4,000 BTC ($320 million) was withdrawn from its federation wallet on September 6 due to a rangeproof caching bug in the Elements software — attackers generated L-BTC not backed by real BTC and cashed it out through SideSwap as if it were a legitimate peg-out transaction, without stealing private keys; attackers claiming to be “white hats” returned 3,400 BTC, while 598.5 BTC (~$47 million) remains unrecovered, and the network remains suspended
A fix for the vulnerability had been publicly uploaded to the Elements main repository on GitHub on September 1 — the attacker may have reverse-engineered and exploited the open-source patch; the Bitcoin mainnet was not affected by the incident
The U.S.-Iran conflict continues with military activity over the weekend, while oil prices are approaching $100 again — fueling inflation concerns one week before the Fed meeting where interest-rate policy will be discussed
The crypto market failed to reclaim the $80,000 resistance on Monday amid low liquidity due to the U.S. Labor Day holiday; French company Capital B purchased 376 BTC for $29 million, bringing its treasury holdings to 3,521 BTC, while Strive viewed the decline as a buying opportunity
Short-term whales are still holding approximately $9.07 billion in unrealized profits — being monitored as a potential source of profit-taking pressure
Ahead of the consecutive CLARITY Act cloture vote and FOMC interest-rate decision on September 15–16, today’s and tomorrow’s macro data — including the September 11 CPI report — remain the market’s focus
━━━
₿ BITCOIN
$BTC opened this morning at $79,100, down 1.6% from Monday’s open; during the morning, it declined into the $78,170–$78,700 range. Rising Treasury yields following the strong August NFP report and geopolitical tensions related to Iran are putting pressure on risk assets by strengthening rate-hike expectations. The price is approximately 2.5% below the September 4 high of $81,167 and has fallen below the 50-week moving average (~$79,725), failing to hold this level at Sunday’s weekly close. Low liquidity during the holiday triggered $55 million in BTC long liquidations and $208 million in long liquidations across the broader crypto market. Critical support is in the $78,000–$78,500 range, with the $80,000–$80,500 resistance zone above; the 30-day change remains strongly positive at approximately 22%.
━━━
🔷 ETHEREUM & ALTCOINS
$ETH opened this morning at $2,490, down 1% from yesterday. Solana declined 2.4% to the $103–$104 range, with hourly momentum turning bearish; XRP fell 1.8% to $1.40. The broader market is in risk-reduction mode due to the combination of the confidence shock caused by the Liquid Network hack and macroeconomic pressure; meanwhile, large funds continue to maintain steady buying beneath the surface.
━━━
📋 TOP CRYPTO NEWS
Analysts emphasize that despite the “white-hat” claim, the Liquid Network incident highlights the need for an industry-wide review of sidechain security architecture, particularly total-supply verification under Confidential Transactions
Approximately 136–140 million dollars was lost across around 50 separate crypto hacks in August — the Liquid Network incident alone is more than twice that total and stands out as the largest security incident of the second half of the year
The market is now focused on the September 11 CPI report, followed by the CLARITY Act vote and FOMC decision on September 15–16 — this highly concentrated calendar over the next three weeks creates an unusually high risk of volatility in crypto pricing
━━━
🔓 TOKEN UNLOCKS
Aptos ($APT)
September 11, 2026
Amount: ~$7.09 million (0.65% of circulating supply) — 11.31 million tokens
Selling pressure: 🟡
Linea (LINEA)
September 10, 2026
Amount: ~$2.75 million (3% of circulating supply) — 960.13 million tokens
Recipient profile: Linea Consortium (long-term alignment) + Linea Consortium (Ignition), split equally
Selling pressure: 🟡
According to Tokenomist, approximately $325.6 million in total unlocks are expected during the second week of the month, including APT, LINEA, and CHEEL.
━━━
🔭 OUTLOOK & UPCOMING EVENTS
The August CPI report to be released this week — not tomorrow, September 11 — will be the final major data point ahead of the consecutive CLARITY Act cloture vote and FOMC decision on September 15–16. A hot reading could reinforce already-strengthening rate-hike expectations following the strong NFP. The fate of the 598.5 BTC that remains unrecovered from the Liquid Network incident and when the network will reopen will be closely monitored in the short term; similar sidechain security concerns could spread to other bridge projects. Whether BTC can hold the $78,000–$78,500 support zone will be critical for an attempt to reclaim the 50-week moving average. The September 10–11 LINEA and APT unlocks stand out as relatively small-scale test points ahead of the major macroeconomic events.
🌐 TOP STORIES OF THE DAY
Liquid Network (Blockstream’s Bitcoin sidechain) confirmed that approximately 4,000 BTC ($320 million) was withdrawn from its federation wallet on September 6 due to a rangeproof caching bug in the Elements software — attackers generated L-BTC not backed by real BTC and cashed it out through SideSwap as if it were a legitimate peg-out transaction, without stealing private keys; attackers claiming to be “white hats” returned 3,400 BTC, while 598.5 BTC (~$47 million) remains unrecovered, and the network remains suspended
A fix for the vulnerability had been publicly uploaded to the Elements main repository on GitHub on September 1 — the attacker may have reverse-engineered and exploited the open-source patch; the Bitcoin mainnet was not affected by the incident
The U.S.-Iran conflict continues with military activity over the weekend, while oil prices are approaching $100 again — fueling inflation concerns one week before the Fed meeting where interest-rate policy will be discussed
The crypto market failed to reclaim the $80,000 resistance on Monday amid low liquidity due to the U.S. Labor Day holiday; French company Capital B purchased 376 BTC for $29 million, bringing its treasury holdings to 3,521 BTC, while Strive viewed the decline as a buying opportunity
Short-term whales are still holding approximately $9.07 billion in unrealized profits — being monitored as a potential source of profit-taking pressure
Ahead of the consecutive CLARITY Act cloture vote and FOMC interest-rate decision on September 15–16, today’s and tomorrow’s macro data — including the September 11 CPI report — remain the market’s focus
━━━
₿ BITCOIN
$BTC opened this morning at $79,100, down 1.6% from Monday’s open; during the morning, it declined into the $78,170–$78,700 range. Rising Treasury yields following the strong August NFP report and geopolitical tensions related to Iran are putting pressure on risk assets by strengthening rate-hike expectations. The price is approximately 2.5% below the September 4 high of $81,167 and has fallen below the 50-week moving average (~$79,725), failing to hold this level at Sunday’s weekly close. Low liquidity during the holiday triggered $55 million in BTC long liquidations and $208 million in long liquidations across the broader crypto market. Critical support is in the $78,000–$78,500 range, with the $80,000–$80,500 resistance zone above; the 30-day change remains strongly positive at approximately 22%.
━━━
🔷 ETHEREUM & ALTCOINS
$ETH opened this morning at $2,490, down 1% from yesterday. Solana declined 2.4% to the $103–$104 range, with hourly momentum turning bearish; XRP fell 1.8% to $1.40. The broader market is in risk-reduction mode due to the combination of the confidence shock caused by the Liquid Network hack and macroeconomic pressure; meanwhile, large funds continue to maintain steady buying beneath the surface.
━━━
📋 TOP CRYPTO NEWS
Analysts emphasize that despite the “white-hat” claim, the Liquid Network incident highlights the need for an industry-wide review of sidechain security architecture, particularly total-supply verification under Confidential Transactions
Approximately 136–140 million dollars was lost across around 50 separate crypto hacks in August — the Liquid Network incident alone is more than twice that total and stands out as the largest security incident of the second half of the year
The market is now focused on the September 11 CPI report, followed by the CLARITY Act vote and FOMC decision on September 15–16 — this highly concentrated calendar over the next three weeks creates an unusually high risk of volatility in crypto pricing
━━━
🔓 TOKEN UNLOCKS
Aptos ($APT)
September 11, 2026
Amount: ~$7.09 million (0.65% of circulating supply) — 11.31 million tokens
Selling pressure: 🟡
Linea (LINEA)
September 10, 2026
Amount: ~$2.75 million (3% of circulating supply) — 960.13 million tokens
Recipient profile: Linea Consortium (long-term alignment) + Linea Consortium (Ignition), split equally
Selling pressure: 🟡
According to Tokenomist, approximately $325.6 million in total unlocks are expected during the second week of the month, including APT, LINEA, and CHEEL.
━━━
🔭 OUTLOOK & UPCOMING EVENTS
The August CPI report to be released this week — not tomorrow, September 11 — will be the final major data point ahead of the consecutive CLARITY Act cloture vote and FOMC decision on September 15–16. A hot reading could reinforce already-strengthening rate-hike expectations following the strong NFP. The fate of the 598.5 BTC that remains unrecovered from the Liquid Network incident and when the network will reopen will be closely monitored in the short term; similar sidechain security concerns could spread to other bridge projects. Whether BTC can hold the $78,000–$78,500 support zone will be critical for an attempt to reclaim the 50-week moving average. The September 10–11 LINEA and APT unlocks stand out as relatively small-scale test points ahead of the major macroeconomic events.
152
ບົດຄວາມ
ເບິ່ງການແປ
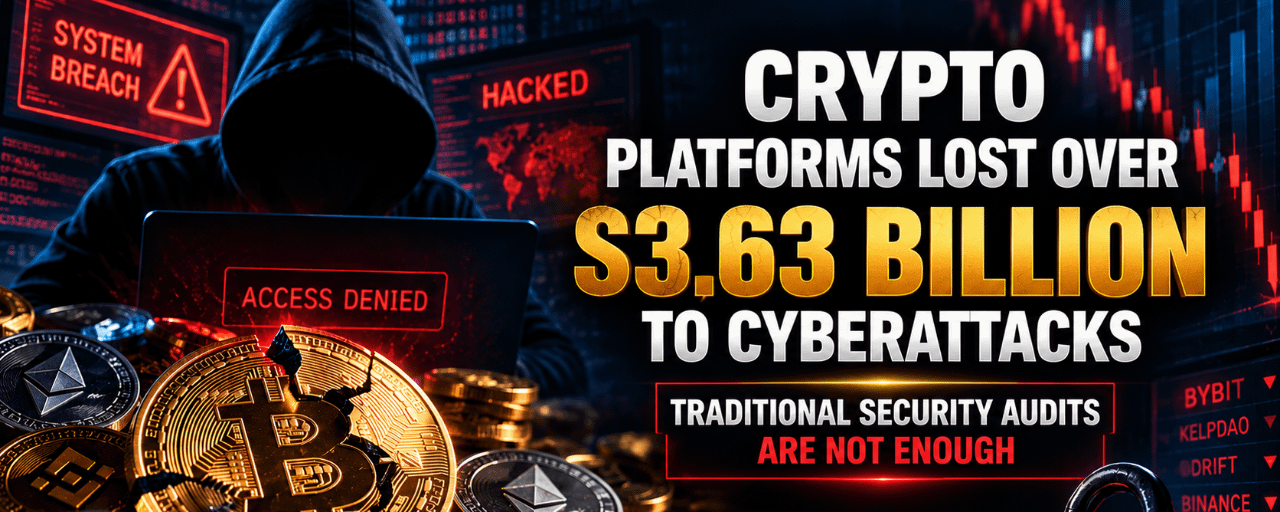
Security Alert Across Crypto Platforms: $3.63 Billion Lost to CyberattacksDespite the widespread adoption of security audits across the cryptocurrency industry, platforms remain vulnerable to cyberattacks. According to CoinGecko data, more than $3.63 billion in funds were lost between January 2025 and July 2026 due to attacks on crypto platforms and compromised credentials.
The most striking point in the report is that a significant portion of the platforms that were attacked had previously undergone independent security audits.
Why Are Security Audits Falling Short?
According to CoinGecko’s report dated August 27, approximately 88% of the stolen funds and around 60% of the attacked platforms had undergone independent security audits.
This suggests that traditional security audits alone may not be sufficient.
The report notes that attackers often target vulnerabilities that fall outside the scope of standard audit processes. In other words, having a platform audited does not mean it is completely protected against real-time attacks or more sophisticated security vulnerabilities.
In the crypto sector, access permissions, private keys, employee accounts, and operational processes are also among the major targets of attacks, alongside smart contract security.
Bybit Suffered the Largest Loss
The largest attack during the period covered by the report was the Bybit incident.
In February 2025, approximately $1.4 billion worth of assets were stolen. Blockchain analytics firm Elliptic assessed that the attack was linked to North Korean actors.
KelpDAO ranked second with losses of $292 million, while Drift Protocol ranked third with losses of $285 million.
The report stated that all three platforms had not immediately responded to CNBC’s requests for comment regarding the assessment.
Passing an Audit Is Not a Guarantee of Security
Security audits are considered an important control mechanism in the crypto market, particularly for DeFi protocols and smart contracts. However, recent attacks show that there can be a significant gap between the scope of an audit and the attack methods used in the real world.
Considering that billions of dollars in assets are held across decentralized or semi-centralized systems, relying solely on code audits as a security strategy carries significant risks.
The $3.63 billion in losses demonstrates that security in the crypto industry cannot be built solely around “passing an audit.”
Going forward, platforms will need to focus not only on smart contract vulnerabilities but also more heavily on private key management, access controls, employee accounts, and incident-response mechanisms.
$BTC
Security Alert Across Crypto Platforms: $3.63 Billion Lost to Cyberattacks
Despite the widespread adoption of security audits across the cryptocurrency industry, platforms remain vulnerable to cyberattacks. According to CoinGecko data, more than $3.63 billion in funds were lost between January 2025 and July 2026 due to attacks on crypto platforms and compromised credentials.
The most striking point in the report is that a significant portion of the platforms that were attacked had previously undergone independent security audits.
Why Are Security Audits Falling Short?
According to CoinGecko’s report dated August 27, approximately 88% of the stolen funds and around 60% of the attacked platforms had undergone independent security audits.
This suggests that traditional security audits alone may not be sufficient.
The report notes that attackers often target vulnerabilities that fall outside the scope of standard audit processes. In other words, having a platform audited does not mean it is completely protected against real-time attacks or more sophisticated security vulnerabilities.
In the crypto sector, access permissions, private keys, employee accounts, and operational processes are also among the major targets of attacks, alongside smart contract security.
Bybit Suffered the Largest Loss
The largest attack during the period covered by the report was the Bybit incident.
In February 2025, approximately $1.4 billion worth of assets were stolen. Blockchain analytics firm Elliptic assessed that the attack was linked to North Korean actors.
KelpDAO ranked second with losses of $292 million, while Drift Protocol ranked third with losses of $285 million.
The report stated that all three platforms had not immediately responded to CNBC’s requests for comment regarding the assessment.
Passing an Audit Is Not a Guarantee of Security
Security audits are considered an important control mechanism in the crypto market, particularly for DeFi protocols and smart contracts. However, recent attacks show that there can be a significant gap between the scope of an audit and the attack methods used in the real world.
Considering that billions of dollars in assets are held across decentralized or semi-centralized systems, relying solely on code audits as a security strategy carries significant risks.
The $3.63 billion in losses demonstrates that security in the crypto industry cannot be built solely around “passing an audit.”
Going forward, platforms will need to focus not only on smart contract vulnerabilities but also more heavily on private key management, access controls, employee accounts, and incident-response mechanisms.
$BTC
The most striking point in the report is that a significant portion of the platforms that were attacked had previously undergone independent security audits.
Why Are Security Audits Falling Short?
According to CoinGecko’s report dated August 27, approximately 88% of the stolen funds and around 60% of the attacked platforms had undergone independent security audits.
This suggests that traditional security audits alone may not be sufficient.
The report notes that attackers often target vulnerabilities that fall outside the scope of standard audit processes. In other words, having a platform audited does not mean it is completely protected against real-time attacks or more sophisticated security vulnerabilities.
In the crypto sector, access permissions, private keys, employee accounts, and operational processes are also among the major targets of attacks, alongside smart contract security.
Bybit Suffered the Largest Loss
The largest attack during the period covered by the report was the Bybit incident.
In February 2025, approximately $1.4 billion worth of assets were stolen. Blockchain analytics firm Elliptic assessed that the attack was linked to North Korean actors.
KelpDAO ranked second with losses of $292 million, while Drift Protocol ranked third with losses of $285 million.
The report stated that all three platforms had not immediately responded to CNBC’s requests for comment regarding the assessment.
Passing an Audit Is Not a Guarantee of Security
Security audits are considered an important control mechanism in the crypto market, particularly for DeFi protocols and smart contracts. However, recent attacks show that there can be a significant gap between the scope of an audit and the attack methods used in the real world.
Considering that billions of dollars in assets are held across decentralized or semi-centralized systems, relying solely on code audits as a security strategy carries significant risks.
The $3.63 billion in losses demonstrates that security in the crypto industry cannot be built solely around “passing an audit.”
Going forward, platforms will need to focus not only on smart contract vulnerabilities but also more heavily on private key management, access controls, employee accounts, and incident-response mechanisms.
$BTC
65
ບົດຄວາມ
LIPOTI O MAKETI I LE FAIAGA O LE ASO — SETEMA 7, 2026🔐 LIPOTI O MAKETI I LE FAIAGA O LE ASO — SETEMA 7, 2026
🌐 TALES TAUA O LE ASO
O loo aga’i atu le maketi o le crypto i se vaitaimi taua e lua aso: i le aso 15 o Setema, o le Senate o le a faia se palota fa’atonu (cloture) e mana’omia ai le 60-palota i le CLARITY Act, sosoo ai ma le fa’ai’uga o tului a le FOMC i le aso 16 o Setema—o le talosaga a le Ta’ita’i a le Senate o Thune mo le cloture na faila i le amataga o Aukuso ua va’aia o le avanoa mulimuli lea a le Konekeresi a’o le’i o’o i palota o le vaeluagalemu
O lo’o fuafuaina e Polymarket le avanoa e pasia ai le H.R. 3633 (CLARITY Act) i lona tulaga o iai nei i le 15–16%, ae o Kalshi o lo’o fuafuaina le konekarate mo le faiga lautele o maketi i le 19–20%—o lo’o umia e Republicans nofoa e 53, o lona uiga e mana’omia le lagolago a Democrats e ausia ai le sone 60-palota; o lo’o tumau pea aiaiga tau amio, taui mo stablecoin, ma tiute o DeFi o itu autu e le ioe i ai
LIPOTI O MAKETI I LE FAIAGA O LE ASO — SETEMA 7, 2026
🔐 LIPOTI O MAKETI I LE FAIAGA O LE ASO — SETEMA 7, 2026
🌐 TALES TAUA O LE ASO
O loo aga’i atu le maketi o le crypto i se vaitaimi taua e lua aso: i le aso 15 o Setema, o le Senate o le a faia se palota fa’atonu (cloture) e mana’omia ai le 60-palota i le CLARITY Act, sosoo ai ma le fa’ai’uga o tului a le FOMC i le aso 16 o Setema—o le talosaga a le Ta’ita’i a le Senate o Thune mo le cloture na faila i le amataga o Aukuso ua va’aia o le avanoa mulimuli lea a le Konekeresi a’o le’i o’o i palota o le vaeluagalemu
O lo’o fuafuaina e Polymarket le avanoa e pasia ai le H.R. 3633 (CLARITY Act) i lona tulaga o iai nei i le 15–16%, ae o Kalshi o lo’o fuafuaina le konekarate mo le faiga lautele o maketi i le 19–20%—o lo’o umia e Republicans nofoa e 53, o lona uiga e mana’omia le lagolago a Democrats e ausia ai le sone 60-palota; o lo’o tumau pea aiaiga tau amio, taui mo stablecoin, ma tiute o DeFi o itu autu e le ioe i ai
🌐 TALES TAUA O LE ASO
O loo aga’i atu le maketi o le crypto i se vaitaimi taua e lua aso: i le aso 15 o Setema, o le Senate o le a faia se palota fa’atonu (cloture) e mana’omia ai le 60-palota i le CLARITY Act, sosoo ai ma le fa’ai’uga o tului a le FOMC i le aso 16 o Setema—o le talosaga a le Ta’ita’i a le Senate o Thune mo le cloture na faila i le amataga o Aukuso ua va’aia o le avanoa mulimuli lea a le Konekeresi a’o le’i o’o i palota o le vaeluagalemu
O lo’o fuafuaina e Polymarket le avanoa e pasia ai le H.R. 3633 (CLARITY Act) i lona tulaga o iai nei i le 15–16%, ae o Kalshi o lo’o fuafuaina le konekarate mo le faiga lautele o maketi i le 19–20%—o lo’o umia e Republicans nofoa e 53, o lona uiga e mana’omia le lagolago a Democrats e ausia ai le sone 60-palota; o lo’o tumau pea aiaiga tau amio, taui mo stablecoin, ma tiute o DeFi o itu autu e le ioe i ai
1
67
ບົດຄວາມ
BitConnect (BCC): Indlela Omunye WamaPonzi Amakhulu Kunawo Wonke Emidlalweni Ye-Crypto Owawela NgayoI-BitConnect ivele ngesikhathi esinye sezimakethe zokuqala ezinkulu ze-bull emkhakheni we-cryptocurrency ngo-2017 futhi ngokushesha yaba iphrojekthi enamadola ayizigidi eziningi. Ithenjisa izinzuzo eziphezulu nezicishe ziqinisekisiwe, uhlelo lwadonsa isisekelo esikhulu sabatshalizimali njengoba inani le-token ye-BCC lathola ukukhuphuka okungajwayelekile.
Kodwa-ke, ukukhuphuka akuzange kuqhubeke isikhathi eside. Njengoba kwaqala ukuvela imibuzo mayelana nesakhiwo se-BitConnect kanye nomthombo wenzuzo okwakunikezwa abatshalizimali, lolu hlelo lwawa, kwashiya abatshalizimali abayizinkulungwane bebhekene nokulahlekelwa okukhulu.
BitConnect (BCC): Indlela Omunye WamaPonzi Amakhulu Kunawo Wonke Emidlalweni Ye-Crypto Owawela Ngayo
I-BitConnect ivele ngesikhathi esinye sezimakethe zokuqala ezinkulu ze-bull emkhakheni we-cryptocurrency ngo-2017 futhi ngokushesha yaba iphrojekthi enamadola ayizigidi eziningi. Ithenjisa izinzuzo eziphezulu nezicishe ziqinisekisiwe, uhlelo lwadonsa isisekelo esikhulu sabatshalizimali njengoba inani le-token ye-BCC lathola ukukhuphuka okungajwayelekile.
Kodwa-ke, ukukhuphuka akuzange kuqhubeke isikhathi eside. Njengoba kwaqala ukuvela imibuzo mayelana nesakhiwo se-BitConnect kanye nomthombo wenzuzo okwakunikezwa abatshalizimali, lolu hlelo lwawa, kwashiya abatshalizimali abayizinkulungwane bebhekene nokulahlekelwa okukhulu.
Kodwa-ke, ukukhuphuka akuzange kuqhubeke isikhathi eside. Njengoba kwaqala ukuvela imibuzo mayelana nesakhiwo se-BitConnect kanye nomthombo wenzuzo okwakunikezwa abatshalizimali, lolu hlelo lwawa, kwashiya abatshalizimali abayizinkulungwane bebhekene nokulahlekelwa okukhulu.
63
ບົດຄວາມ
I-Bitcoin Noketshezi: Uhambo Olulandelayo Lwe-Fed Luzithinta Kanjani I-Crypto?Imakethe yeBitcoin isidlula endaweni entsha yokushintsha. Ukugxila kwabatyali be-crypto akusagxili kuphela ekunyakazeni kwentengo yeBitcoin noma kudatha ye-on-chain, kodwa futhi nakwinqubomgomo yezimali yeFederal Reserve.
Njengoba kungaqiniseki mayelana nenqubomgomo yamazinga enzalo ye-Fed kuphinde kwanda ngoSepthemba, umbuzo obalulekile uvela ngeBitcoin: Ingabe uketshezi lomhlaba wonke luzokhula, noma izimo zezezimali zizoqina nakakhulu?
Impendulo ingaba esinye sezici ezibaluleke kakhulu ezinqumayo ukuthi iBitcoin ingaqalisa kanjani igagasi elisha lokukhuphuka esikhathini esizayo.
I-Bitcoin Noketshezi: Uhambo Olulandelayo Lwe-Fed Luzithinta Kanjani I-Crypto?
Imakethe yeBitcoin isidlula endaweni entsha yokushintsha. Ukugxila kwabatyali be-crypto akusagxili kuphela ekunyakazeni kwentengo yeBitcoin noma kudatha ye-on-chain, kodwa futhi nakwinqubomgomo yezimali yeFederal Reserve.
Njengoba kungaqiniseki mayelana nenqubomgomo yamazinga enzalo ye-Fed kuphinde kwanda ngoSepthemba, umbuzo obalulekile uvela ngeBitcoin: Ingabe uketshezi lomhlaba wonke luzokhula, noma izimo zezezimali zizoqina nakakhulu?
Impendulo ingaba esinye sezici ezibaluleke kakhulu ezinqumayo ukuthi iBitcoin ingaqalisa kanjani igagasi elisha lokukhuphuka esikhathini esizayo.
Njengoba kungaqiniseki mayelana nenqubomgomo yamazinga enzalo ye-Fed kuphinde kwanda ngoSepthemba, umbuzo obalulekile uvela ngeBitcoin: Ingabe uketshezi lomhlaba wonke luzokhula, noma izimo zezezimali zizoqina nakakhulu?
Impendulo ingaba esinye sezici ezibaluleke kakhulu ezinqumayo ukuthi iBitcoin ingaqalisa kanjani igagasi elisha lokukhuphuka esikhathini esizayo.
69
ບົດຄວາມ
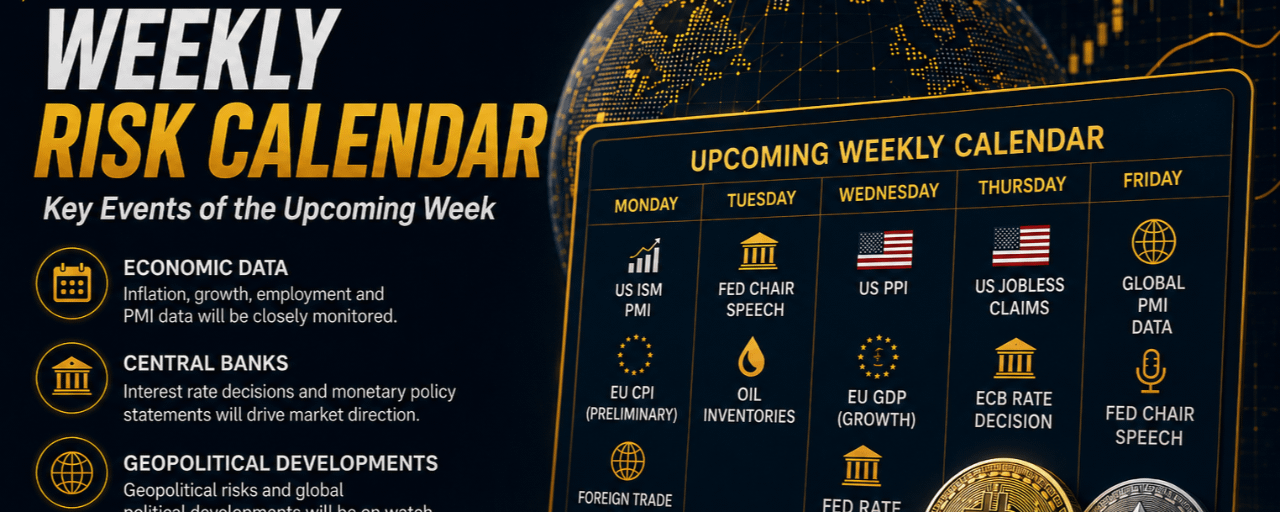
NgoSeptemba 7–11, 2026 | Ikhalenda yeengozi yevekiNgoSeptemba 7–11, 2026 | Ikhalenda yeengozi yeveki (TRT)
🎯 Umxholo Ophambili weVeki
Emva kokusetyenzwa kweJackson Hole kunye nengxelo ye-NFP kaAgasti, imarike ijonga indawo entsha yokubhekisela. I-ADP yongeze kuphela imisebenzi engama-38,000 ngoAgasti, ingaphantsi kokuqikelelwa kwe-47,000 kwaye yayicotha kunaleyo ilungisiweyo ngoJulayi eyi-46,000. I-ISM Manufacturing yehle ukusuka ku-55.6 ukuya ku-54.6 kodwa yahlala kwindawo yokwandisa, ngelixa i-ISM Services inyuke ukusuka ku-54.1 ukuya ku-55.4. Phantsi kwesi siqendu esixubeneyo, iveki iya kumiselwa yidatha yokunyuka kwamaxabiso e-US egxininiswe ngoLwesine–ngoLwesihlanu kunye nesigqibo se-ECB ngosuku olunye. Iimarike zase-US nezaseKhanada zivaliwe ngoMvulo uLwesuku loMsebenzi — oko kunciphisa iveki ibe ziintsuku zokurhweba ezine kuphela.
NgoSeptemba 7–11, 2026 | Ikhalenda yeengozi yeveki
NgoSeptemba 7–11, 2026 | Ikhalenda yeengozi yeveki (TRT)
🎯 Umxholo Ophambili weVeki
Emva kokusetyenzwa kweJackson Hole kunye nengxelo ye-NFP kaAgasti, imarike ijonga indawo entsha yokubhekisela. I-ADP yongeze kuphela imisebenzi engama-38,000 ngoAgasti, ingaphantsi kokuqikelelwa kwe-47,000 kwaye yayicotha kunaleyo ilungisiweyo ngoJulayi eyi-46,000. I-ISM Manufacturing yehle ukusuka ku-55.6 ukuya ku-54.6 kodwa yahlala kwindawo yokwandisa, ngelixa i-ISM Services inyuke ukusuka ku-54.1 ukuya ku-55.4. Phantsi kwesi siqendu esixubeneyo, iveki iya kumiselwa yidatha yokunyuka kwamaxabiso e-US egxininiswe ngoLwesine–ngoLwesihlanu kunye nesigqibo se-ECB ngosuku olunye. Iimarike zase-US nezaseKhanada zivaliwe ngoMvulo uLwesuku loMsebenzi — oko kunciphisa iveki ibe ziintsuku zokurhweba ezine kuphela.
🎯 Umxholo Ophambili weVeki
Emva kokusetyenzwa kweJackson Hole kunye nengxelo ye-NFP kaAgasti, imarike ijonga indawo entsha yokubhekisela. I-ADP yongeze kuphela imisebenzi engama-38,000 ngoAgasti, ingaphantsi kokuqikelelwa kwe-47,000 kwaye yayicotha kunaleyo ilungisiweyo ngoJulayi eyi-46,000. I-ISM Manufacturing yehle ukusuka ku-55.6 ukuya ku-54.6 kodwa yahlala kwindawo yokwandisa, ngelixa i-ISM Services inyuke ukusuka ku-54.1 ukuya ku-55.4. Phantsi kwesi siqendu esixubeneyo, iveki iya kumiselwa yidatha yokunyuka kwamaxabiso e-US egxininiswe ngoLwesine–ngoLwesihlanu kunye nesigqibo se-ECB ngosuku olunye. Iimarike zase-US nezaseKhanada zivaliwe ngoMvulo uLwesuku loMsebenzi — oko kunciphisa iveki ibe ziintsuku zokurhweba ezine kuphela.
15
ບົດຄວາມ
Aghamayan sa Selyo sa Mga Bono sa Mataas na Antas sa Ilang Dekada: Nagbabago ang Pundasyon ng PamilihanAghamayan sa Selyo sa Mga Bono sa Mataas na Antas sa Ilang Dekada: Nagbabago ang Pundasyon ng Pamilihan
Mula sa US papuntang Japan, mula UK papuntang France, ang mga ani ng government bonds ay nasa pinakamataas na antas sa loob ng mga dekada. Hindi na lang ito tungkol sa interest rate; ibig sabihin, nagbabago ang pundasyon kung saan pinapresyo ang mga equities, ginto, at crypto assets.
━━━━━━━━━━━━━━━━━━━━
Nasaan Tayo — Pagsasara ng Setyembre 4
US: Ang 10-taong Treasury yield ay sinara ang linggo sa 4.78%. Umabot ito sa 4.812% sa loob ng linggo, ang pinakamataas mula noong Nobyembre 2023; ang 52-week high ay 4.818%. Sa panandaliang panahon, ang 2-year yield ay nasa 4.37%, habang ang 20-year ay nasa 5.25%. Ang 30-year yield ay umabot malapit sa sikolohikal na 5% na hangganan. Ang 10-year yield ay tumaas ng 17 basis points sa nakalipas na buwan at 71 basis points sa nakalipas na taon.
Aghamayan sa Selyo sa Mga Bono sa Mataas na Antas sa Ilang Dekada: Nagbabago ang Pundasyon ng Pamilihan
Aghamayan sa Selyo sa Mga Bono sa Mataas na Antas sa Ilang Dekada: Nagbabago ang Pundasyon ng Pamilihan
Mula sa US papuntang Japan, mula UK papuntang France, ang mga ani ng government bonds ay nasa pinakamataas na antas sa loob ng mga dekada. Hindi na lang ito tungkol sa interest rate; ibig sabihin, nagbabago ang pundasyon kung saan pinapresyo ang mga equities, ginto, at crypto assets.
━━━━━━━━━━━━━━━━━━━━
Nasaan Tayo — Pagsasara ng Setyembre 4
US: Ang 10-taong Treasury yield ay sinara ang linggo sa 4.78%. Umabot ito sa 4.812% sa loob ng linggo, ang pinakamataas mula noong Nobyembre 2023; ang 52-week high ay 4.818%. Sa panandaliang panahon, ang 2-year yield ay nasa 4.37%, habang ang 20-year ay nasa 5.25%. Ang 30-year yield ay umabot malapit sa sikolohikal na 5% na hangganan. Ang 10-year yield ay tumaas ng 17 basis points sa nakalipas na buwan at 71 basis points sa nakalipas na taon.
Mula sa US papuntang Japan, mula UK papuntang France, ang mga ani ng government bonds ay nasa pinakamataas na antas sa loob ng mga dekada. Hindi na lang ito tungkol sa interest rate; ibig sabihin, nagbabago ang pundasyon kung saan pinapresyo ang mga equities, ginto, at crypto assets.
━━━━━━━━━━━━━━━━━━━━
Nasaan Tayo — Pagsasara ng Setyembre 4
US: Ang 10-taong Treasury yield ay sinara ang linggo sa 4.78%. Umabot ito sa 4.812% sa loob ng linggo, ang pinakamataas mula noong Nobyembre 2023; ang 52-week high ay 4.818%. Sa panandaliang panahon, ang 2-year yield ay nasa 4.37%, habang ang 20-year ay nasa 5.25%. Ang 30-year yield ay umabot malapit sa sikolohikal na 5% na hangganan. Ang 10-year yield ay tumaas ng 17 basis points sa nakalipas na buwan at 71 basis points sa nakalipas na taon.
6
ບົດຄວາມ
ທັດສະນະຕະຫຼາດ — ວັນທີ 5 ກັນຍາ 2026📰 ທັດສະນະຕະຫຼາດ — ວັນທີ 5 ກັນຍາ 2026
━━━━━━━━━━━━━━━━
🗺️ ໂລກ ແລະ ພູມລັດສາດ
• ຄວາມຂັດແຍ້ງ ສະຫະລັດ-ອີຣ່ານ ໄດ້ຮຸນແຮງຂຶ້ນອີກຄັ້ງ: ໃນວັນທີ 1 ກັນຍາ, US CENTCOM ໄດ້ປະກາດການໂຈມຕີທາງອາກາດໃໝ່ຕໍ່ເປົ້າໝາຍທີ່ກ່ຽວຂ້ອງກັບ ກອງກຳລັງປະຕິວັດອິສລາມຂອງອີຣ່ານ; ເຫດການນີ້ເກີດຂຶ້ນທັນທີຫຼັງຈາກທີ່ລູກຂຸນບັນທຸກນ້ຳມັນຖືກຍິງດ້ວຍລູກລະເບີດທີ່ບໍ່ຮູ້ສາຍ ໃນຊ່ອງແຄບຮໍມຸຊ. ທຣຳ ໄດ້ບອກ Fox News, “ພວກເຮົາຈະຕີພວກເຂົາຢ່າງໜັກແໜ້ນ.”
• ມື້ນີ້ (5 ກັນຍາ), ລູກຂຸນບັນທຸກນ້ຳມັນຂອງອີຣ່ານ ຖືກຍິງໂຈມຕີດ້ວຍຈະຫຼວດສະຫະລັດ 4 ລູກ ຢູ່ນອກເກາະ Khark, ເຊິ່ງເປັນທ່າເຮືອທີ່ຮອງຮັບປະມານ 90% ຂອງການສົ່ງອອກນ້ຳມັນຂອງອີຣ່ານ; ສື່ຂອງອີຣ່ານ ລາຍງານວ່າບໍ່ມີຜູ້ເສຍຊີວິດ ແລະກ່າວວ່າຄົນປະຈຳເຮືອໄດ້ຖືກອົບພະຍົບແລ້ວ. ເກາະນີ້ມີຄວາມສາມາດ 7 ລ້ານບາເຣວຕໍ່ມື້, ເຮັດໃຫ້ເປັນເປົ້າໝາຍດ້ານພະລັງງານທີ່ສຳຄັນທາງຍຸດທະສາດ.
ທັດສະນະຕະຫຼາດ — ວັນທີ 5 ກັນຍາ 2026
📰 ທັດສະນະຕະຫຼາດ — ວັນທີ 5 ກັນຍາ 2026
━━━━━━━━━━━━━━━━
🗺️ ໂລກ ແລະ ພູມລັດສາດ
• ຄວາມຂັດແຍ້ງ ສະຫະລັດ-ອີຣ່ານ ໄດ້ຮຸນແຮງຂຶ້ນອີກຄັ້ງ: ໃນວັນທີ 1 ກັນຍາ, US CENTCOM ໄດ້ປະກາດການໂຈມຕີທາງອາກາດໃໝ່ຕໍ່ເປົ້າໝາຍທີ່ກ່ຽວຂ້ອງກັບ ກອງກຳລັງປະຕິວັດອິສລາມຂອງອີຣ່ານ; ເຫດການນີ້ເກີດຂຶ້ນທັນທີຫຼັງຈາກທີ່ລູກຂຸນບັນທຸກນ້ຳມັນຖືກຍິງດ້ວຍລູກລະເບີດທີ່ບໍ່ຮູ້ສາຍ ໃນຊ່ອງແຄບຮໍມຸຊ. ທຣຳ ໄດ້ບອກ Fox News, “ພວກເຮົາຈະຕີພວກເຂົາຢ່າງໜັກແໜ້ນ.”
• ມື້ນີ້ (5 ກັນຍາ), ລູກຂຸນບັນທຸກນ້ຳມັນຂອງອີຣ່ານ ຖືກຍິງໂຈມຕີດ້ວຍຈະຫຼວດສະຫະລັດ 4 ລູກ ຢູ່ນອກເກາະ Khark, ເຊິ່ງເປັນທ່າເຮືອທີ່ຮອງຮັບປະມານ 90% ຂອງການສົ່ງອອກນ້ຳມັນຂອງອີຣ່ານ; ສື່ຂອງອີຣ່ານ ລາຍງານວ່າບໍ່ມີຜູ້ເສຍຊີວິດ ແລະກ່າວວ່າຄົນປະຈຳເຮືອໄດ້ຖືກອົບພະຍົບແລ້ວ. ເກາະນີ້ມີຄວາມສາມາດ 7 ລ້ານບາເຣວຕໍ່ມື້, ເຮັດໃຫ້ເປັນເປົ້າໝາຍດ້ານພະລັງງານທີ່ສຳຄັນທາງຍຸດທະສາດ.
━━━━━━━━━━━━━━━━
🗺️ ໂລກ ແລະ ພູມລັດສາດ
• ຄວາມຂັດແຍ້ງ ສະຫະລັດ-ອີຣ່ານ ໄດ້ຮຸນແຮງຂຶ້ນອີກຄັ້ງ: ໃນວັນທີ 1 ກັນຍາ, US CENTCOM ໄດ້ປະກາດການໂຈມຕີທາງອາກາດໃໝ່ຕໍ່ເປົ້າໝາຍທີ່ກ່ຽວຂ້ອງກັບ ກອງກຳລັງປະຕິວັດອິສລາມຂອງອີຣ່ານ; ເຫດການນີ້ເກີດຂຶ້ນທັນທີຫຼັງຈາກທີ່ລູກຂຸນບັນທຸກນ້ຳມັນຖືກຍິງດ້ວຍລູກລະເບີດທີ່ບໍ່ຮູ້ສາຍ ໃນຊ່ອງແຄບຮໍມຸຊ. ທຣຳ ໄດ້ບອກ Fox News, “ພວກເຮົາຈະຕີພວກເຂົາຢ່າງໜັກແໜ້ນ.”
• ມື້ນີ້ (5 ກັນຍາ), ລູກຂຸນບັນທຸກນ້ຳມັນຂອງອີຣ່ານ ຖືກຍິງໂຈມຕີດ້ວຍຈະຫຼວດສະຫະລັດ 4 ລູກ ຢູ່ນອກເກາະ Khark, ເຊິ່ງເປັນທ່າເຮືອທີ່ຮອງຮັບປະມານ 90% ຂອງການສົ່ງອອກນ້ຳມັນຂອງອີຣ່ານ; ສື່ຂອງອີຣ່ານ ລາຍງານວ່າບໍ່ມີຜູ້ເສຍຊີວິດ ແລະກ່າວວ່າຄົນປະຈຳເຮືອໄດ້ຖືກອົບພະຍົບແລ້ວ. ເກາະນີ້ມີຄວາມສາມາດ 7 ລ້ານບາເຣວຕໍ່ມື້, ເຮັດໃຫ້ເປັນເປົ້າໝາຍດ້ານພະລັງງານທີ່ສຳຄັນທາງຍຸດທະສາດ.
15
ບົດຄວາມ
IMBOKO YEMAKETHI YOKUPHELA KOSUKU — SEPTEMBER 4, 2026🔐 IMBIKO YEMAKETHI YOKUPHELA KOSUKU — SEPTEMBER 4, 2026
🌐 IZINDABA EZIVELELE KULOSUKU
Ingqikithi yombiko we-August US Nonfarm Payrolls (NFP) uqedele okulindelwe kathathu, ufike ku-162,000 uma kuqhathaniswa nokulindelwe cishe okungu-55,000-56,000, kanti izinga lokungasebenzi lihlale ku-4.1%; izinombolo zika-June no-July nazo zabuyekezwa phezulu ngokuhlangene okungu-55,000 — umbiko wawakha kancane waze waphikisa kakhulu isignali kaMbusi we-Fed u-Waller evela ngosuku olwandulela ukuthi angasekela ukugcina amanani engashintshi.
Ngokuka-CME FedWatch, amathuba okwenyuka kwenani ngoSepthemba agxumele esuka ku-49.4% ngaphambi kwedatha aya ebangeni lika-58-60%; inzuzo yeminyaka eyi-10 ye-Treasury inyuke yafika ku-4.80%, inzuzo yeminyaka emi-2 yafika ku-4.40%, ikusasa le-US equity laphola kancane, kanti i-Dow yehle ngamaphuzu angu-226.
IMBOKO YEMAKETHI YOKUPHELA KOSUKU — SEPTEMBER 4, 2026
🔐 IMBIKO YEMAKETHI YOKUPHELA KOSUKU — SEPTEMBER 4, 2026
🌐 IZINDABA EZIVELELE KULOSUKU
Ingqikithi yombiko we-August US Nonfarm Payrolls (NFP) uqedele okulindelwe kathathu, ufike ku-162,000 uma kuqhathaniswa nokulindelwe cishe okungu-55,000-56,000, kanti izinga lokungasebenzi lihlale ku-4.1%; izinombolo zika-June no-July nazo zabuyekezwa phezulu ngokuhlangene okungu-55,000 — umbiko wawakha kancane waze waphikisa kakhulu isignali kaMbusi we-Fed u-Waller evela ngosuku olwandulela ukuthi angasekela ukugcina amanani engashintshi.
Ngokuka-CME FedWatch, amathuba okwenyuka kwenani ngoSepthemba agxumele esuka ku-49.4% ngaphambi kwedatha aya ebangeni lika-58-60%; inzuzo yeminyaka eyi-10 ye-Treasury inyuke yafika ku-4.80%, inzuzo yeminyaka emi-2 yafika ku-4.40%, ikusasa le-US equity laphola kancane, kanti i-Dow yehle ngamaphuzu angu-226.
🌐 IZINDABA EZIVELELE KULOSUKU
Ingqikithi yombiko we-August US Nonfarm Payrolls (NFP) uqedele okulindelwe kathathu, ufike ku-162,000 uma kuqhathaniswa nokulindelwe cishe okungu-55,000-56,000, kanti izinga lokungasebenzi lihlale ku-4.1%; izinombolo zika-June no-July nazo zabuyekezwa phezulu ngokuhlangene okungu-55,000 — umbiko wawakha kancane waze waphikisa kakhulu isignali kaMbusi we-Fed u-Waller evela ngosuku olwandulela ukuthi angasekela ukugcina amanani engashintshi.
Ngokuka-CME FedWatch, amathuba okwenyuka kwenani ngoSepthemba agxumele esuka ku-49.4% ngaphambi kwedatha aya ebangeni lika-58-60%; inzuzo yeminyaka eyi-10 ye-Treasury inyuke yafika ku-4.80%, inzuzo yeminyaka emi-2 yafika ku-4.40%, ikusasa le-US equity laphola kancane, kanti i-Dow yehle ngamaphuzu angu-226.
129

ບົດຄວາມ
Ama-Nonfarm Payrolls Aphindwe Kathathu Izibikezelo: Ukunyuswa Kwenzalo Kubuyela EtafuleniAma-Nonfarm Payrolls Aphindwe Kathathu Izibikezelo: Ukunyuswa Kwenzalo Kubuyela Etafuleni
Idatha yama-nonfarm payrolls ka-August ekhishwe namuhla ngo-15:30 TRT yi-US Bureau of Labor Statistics ikhombise okuphambene ncamashi nendawo eyayibekwe imakethe. Ukuqashwa kukhuphuke ngo-162,000, kanti imakethe yayilindele cishe ama-55,000. Ukulahlekelwa okwakubikwe ngaphambilini kukaJulayi okungu-23,000 kwabuyekezwa kwaba wukuhleli endaweni enhle.
Izinga lokungasebenzi alishintshile ku-4.1%. Izindleko zokukhokha ngehora ezijwayelekile zenyuke ngo-0.3% uma kuqhathaniswa nenyanga edlule futhi ngo-3.1% uma kuqhathaniswa nonyaka odlule — kuhambisana nokulindelekile futhi kubonisa ukuthi ingcindezi yokwehla kwamandla emali eqhutshwa amaholo ayikagxili. Izicelo zokuqala zokungasebenzi zesonto lika-Agasti 29 zifikile ku-206,000, zihlala ngaphakathi kobubanzi obujwayelekile obubonwe kulo lonke unyaka.
Ama-Nonfarm Payrolls Aphindwe Kathathu Izibikezelo: Ukunyuswa Kwenzalo Kubuyela Etafuleni
Ama-Nonfarm Payrolls Aphindwe Kathathu Izibikezelo: Ukunyuswa Kwenzalo Kubuyela Etafuleni
Idatha yama-nonfarm payrolls ka-August ekhishwe namuhla ngo-15:30 TRT yi-US Bureau of Labor Statistics ikhombise okuphambene ncamashi nendawo eyayibekwe imakethe. Ukuqashwa kukhuphuke ngo-162,000, kanti imakethe yayilindele cishe ama-55,000. Ukulahlekelwa okwakubikwe ngaphambilini kukaJulayi okungu-23,000 kwabuyekezwa kwaba wukuhleli endaweni enhle.
Izinga lokungasebenzi alishintshile ku-4.1%. Izindleko zokukhokha ngehora ezijwayelekile zenyuke ngo-0.3% uma kuqhathaniswa nenyanga edlule futhi ngo-3.1% uma kuqhathaniswa nonyaka odlule — kuhambisana nokulindelekile futhi kubonisa ukuthi ingcindezi yokwehla kwamandla emali eqhutshwa amaholo ayikagxili. Izicelo zokuqala zokungasebenzi zesonto lika-Agasti 29 zifikile ku-206,000, zihlala ngaphakathi kobubanzi obujwayelekile obubonwe kulo lonke unyaka.
Idatha yama-nonfarm payrolls ka-August ekhishwe namuhla ngo-15:30 TRT yi-US Bureau of Labor Statistics ikhombise okuphambene ncamashi nendawo eyayibekwe imakethe. Ukuqashwa kukhuphuke ngo-162,000, kanti imakethe yayilindele cishe ama-55,000. Ukulahlekelwa okwakubikwe ngaphambilini kukaJulayi okungu-23,000 kwabuyekezwa kwaba wukuhleli endaweni enhle.
Izinga lokungasebenzi alishintshile ku-4.1%. Izindleko zokukhokha ngehora ezijwayelekile zenyuke ngo-0.3% uma kuqhathaniswa nenyanga edlule futhi ngo-3.1% uma kuqhathaniswa nonyaka odlule — kuhambisana nokulindelekile futhi kubonisa ukuthi ingcindezi yokwehla kwamandla emali eqhutshwa amaholo ayikagxili. Izicelo zokuqala zokungasebenzi zesonto lika-Agasti 29 zifikile ku-206,000, zihlala ngaphakathi kobubanzi obujwayelekile obubonwe kulo lonke unyaka.
219

ບົດຄວາມ
UMBIKO WOKUVALA WOSUKU LOKUHWEBA — SEPTEMBER 3, 2026🔐 UMBIKO WOKUVALA WOSUKU LOKUHWEBA — SEPTEMBER 3, 2026
🌐 IZINDABA EZIPHUMA PHEZULU ZOSUKU
UFederal Reserve uMbusi uChristopher Waller, ngokuphambene nendlela eyayinzima yokukhuluma kaSihlalo Warsh ngesonto eledlule, ubonisile ukuthi uzokweseka ukugcina amanani engashintshi emhlanganweni kaSepthemba — kuyilapho evuma ukuthi ukwehla kwamandla emali kusese “ngaphezu kakhulu” komgomo, wathi idatha yakamuva ikhombisile izimpawu zokuncipha kokwehla kwamandla emali; “uma lokho kuqhubeka kudatha emavikini amabili ezayo, ngithambekele ekusekeleni ukugcina izinga lenqubomgomo lisesimweni salo samanje,” usho, ngenkathi engeza ukuthi angacabanga ukukhushulwa uma ukwehla kwamandla emali kuka-Agasti kungaphuma kushisa. Ngemuva kwenkulumo, ngokusho kwe-CME FedWatch, amathuba okukhushulwa kwezinga ngoSepthemba ehle cishe ngamaphuzu angu-12 aya ku-54.6%, kanti amafa e-Treasury alulamele.
UMBIKO WOKUVALA WOSUKU LOKUHWEBA — SEPTEMBER 3, 2026
🔐 UMBIKO WOKUVALA WOSUKU LOKUHWEBA — SEPTEMBER 3, 2026
🌐 IZINDABA EZIPHUMA PHEZULU ZOSUKU
UFederal Reserve uMbusi uChristopher Waller, ngokuphambene nendlela eyayinzima yokukhuluma kaSihlalo Warsh ngesonto eledlule, ubonisile ukuthi uzokweseka ukugcina amanani engashintshi emhlanganweni kaSepthemba — kuyilapho evuma ukuthi ukwehla kwamandla emali kusese “ngaphezu kakhulu” komgomo, wathi idatha yakamuva ikhombisile izimpawu zokuncipha kokwehla kwamandla emali; “uma lokho kuqhubeka kudatha emavikini amabili ezayo, ngithambekele ekusekeleni ukugcina izinga lenqubomgomo lisesimweni salo samanje,” usho, ngenkathi engeza ukuthi angacabanga ukukhushulwa uma ukwehla kwamandla emali kuka-Agasti kungaphuma kushisa. Ngemuva kwenkulumo, ngokusho kwe-CME FedWatch, amathuba okukhushulwa kwezinga ngoSepthemba ehle cishe ngamaphuzu angu-12 aya ku-54.6%, kanti amafa e-Treasury alulamele.
🌐 IZINDABA EZIPHUMA PHEZULU ZOSUKU
UFederal Reserve uMbusi uChristopher Waller, ngokuphambene nendlela eyayinzima yokukhuluma kaSihlalo Warsh ngesonto eledlule, ubonisile ukuthi uzokweseka ukugcina amanani engashintshi emhlanganweni kaSepthemba — kuyilapho evuma ukuthi ukwehla kwamandla emali kusese “ngaphezu kakhulu” komgomo, wathi idatha yakamuva ikhombisile izimpawu zokuncipha kokwehla kwamandla emali; “uma lokho kuqhubeka kudatha emavikini amabili ezayo, ngithambekele ekusekeleni ukugcina izinga lenqubomgomo lisesimweni salo samanje,” usho, ngenkathi engeza ukuthi angacabanga ukukhushulwa uma ukwehla kwamandla emali kuka-Agasti kungaphuma kushisa. Ngemuva kwenkulumo, ngokusho kwe-CME FedWatch, amathuba okukhushulwa kwezinga ngoSepthemba ehle cishe ngamaphuzu angu-12 aya ku-54.6%, kanti amafa e-Treasury alulamele.
220
ບົດຄວາມ
UMBIKO WOKUPHELA KOSUKU WEZIMAKETHI — SEPTEMBER 2, 2026🔐 UMBIKO WEZIMAKETHI WEZINSUKU ZOKUPHUMULA — SEPTEMBER 2, 2026
🌐 IZIHLOKO EZIPHEZULU ZOSUKU
I-US Central Command imemezele ukuthi ngomhlaka-1 Septhemba yaqedela inqwaba entsha yemijikelezo yokuhlasela cishe izindawo zezempi eziyi-100 e-Iran, okuhlanganisa amasistimu okulwa nezindiza, ama-radar, izimpahla zasolwandle, amakhono okushiya izimayini olwandle (mine-laying), nezindawo zokuxhumana; i-Iran iphendule ngemijovo (missiles) nama-drones aqondise izisekelo zase-US e-Iraq nase-Bahrain, kanti i-IRGC nayo yathi yaqhumisa izimayini e-Strait of Hormuz, yashaya amathangi amabili.
UMBIKO WOKUPHELA KOSUKU WEZIMAKETHI — SEPTEMBER 2, 2026
🔐 UMBIKO WEZIMAKETHI WEZINSUKU ZOKUPHUMULA — SEPTEMBER 2, 2026
🌐 IZIHLOKO EZIPHEZULU ZOSUKU
I-US Central Command imemezele ukuthi ngomhlaka-1 Septhemba yaqedela inqwaba entsha yemijikelezo yokuhlasela cishe izindawo zezempi eziyi-100 e-Iran, okuhlanganisa amasistimu okulwa nezindiza, ama-radar, izimpahla zasolwandle, amakhono okushiya izimayini olwandle (mine-laying), nezindawo zokuxhumana; i-Iran iphendule ngemijovo (missiles) nama-drones aqondise izisekelo zase-US e-Iraq nase-Bahrain, kanti i-IRGC nayo yathi yaqhumisa izimayini e-Strait of Hormuz, yashaya amathangi amabili.
🌐 IZIHLOKO EZIPHEZULU ZOSUKU
I-US Central Command imemezele ukuthi ngomhlaka-1 Septhemba yaqedela inqwaba entsha yemijikelezo yokuhlasela cishe izindawo zezempi eziyi-100 e-Iran, okuhlanganisa amasistimu okulwa nezindiza, ama-radar, izimpahla zasolwandle, amakhono okushiya izimayini olwandle (mine-laying), nezindawo zokuxhumana; i-Iran iphendule ngemijovo (missiles) nama-drones aqondise izisekelo zase-US e-Iraq nase-Bahrain, kanti i-IRGC nayo yathi yaqhumisa izimayini e-Strait of Hormuz, yashaya amathangi amabili.
104
ບົດຄວາມ
I-NFP YOLWESIHLANU: IMICABANGO ENGENZAKALA EYA KUMA-FED, IGOLIDE, I-BITCOIN, KANYE NESITOKII-NFP YOLWESIHLANU: IMICABANGO ENGENZAKALA EYA KUMA-FED, IGOLIDE, I-BITCOIN, KANYE NESITOKI
I-Nonfarm Payrolls ( #NFP ) report ezobanjwa ngoLwesihlanu e-US izoba esinye sezihloko ezibaluleke kakhulu iminithi emakethe ezoyibhekisisa ngaphambi komhlangano ka-Fed kaSepthemba.
Imakethe ilindele amathuba amasha angaba ngu-55-60K emisebenzi ngo-Agasti, kanti izinga lokungasebenzi lizoba cishe ku-4.1-4.2%.
Nokho, umthelela we-NFP emakethe ngeke uncike kuphela enanini elikhulu elibikiwe.
Izinga lokungasebenzi, iholo elijwayelekile ngehora, izinga lokubamba iqhaza kwabasebenzi, nokulungiswa kwezinyanga zangaphambilini konke kuzohlolwa ndawonye.
I-NFP YOLWESIHLANU: IMICABANGO ENGENZAKALA EYA KUMA-FED, IGOLIDE, I-BITCOIN, KANYE NESITOKI
I-NFP YOLWESIHLANU: IMICABANGO ENGENZAKALA EYA KUMA-FED, IGOLIDE, I-BITCOIN, KANYE NESITOKI
I-Nonfarm Payrolls ( #NFP ) report ezobanjwa ngoLwesihlanu e-US izoba esinye sezihloko ezibaluleke kakhulu iminithi emakethe ezoyibhekisisa ngaphambi komhlangano ka-Fed kaSepthemba.
Imakethe ilindele amathuba amasha angaba ngu-55-60K emisebenzi ngo-Agasti, kanti izinga lokungasebenzi lizoba cishe ku-4.1-4.2%.
Nokho, umthelela we-NFP emakethe ngeke uncike kuphela enanini elikhulu elibikiwe.
Izinga lokungasebenzi, iholo elijwayelekile ngehora, izinga lokubamba iqhaza kwabasebenzi, nokulungiswa kwezinyanga zangaphambilini konke kuzohlolwa ndawonye.
I-Nonfarm Payrolls ( #NFP ) report ezobanjwa ngoLwesihlanu e-US izoba esinye sezihloko ezibaluleke kakhulu iminithi emakethe ezoyibhekisisa ngaphambi komhlangano ka-Fed kaSepthemba.
Imakethe ilindele amathuba amasha angaba ngu-55-60K emisebenzi ngo-Agasti, kanti izinga lokungasebenzi lizoba cishe ku-4.1-4.2%.
Nokho, umthelela we-NFP emakethe ngeke uncike kuphela enanini elikhulu elibikiwe.
Izinga lokungasebenzi, iholo elijwayelekile ngehora, izinga lokubamba iqhaza kwabasebenzi, nokulungiswa kwezinyanga zangaphambilini konke kuzohlolwa ndawonye.
112
·
--
ສັນຍານໝີ
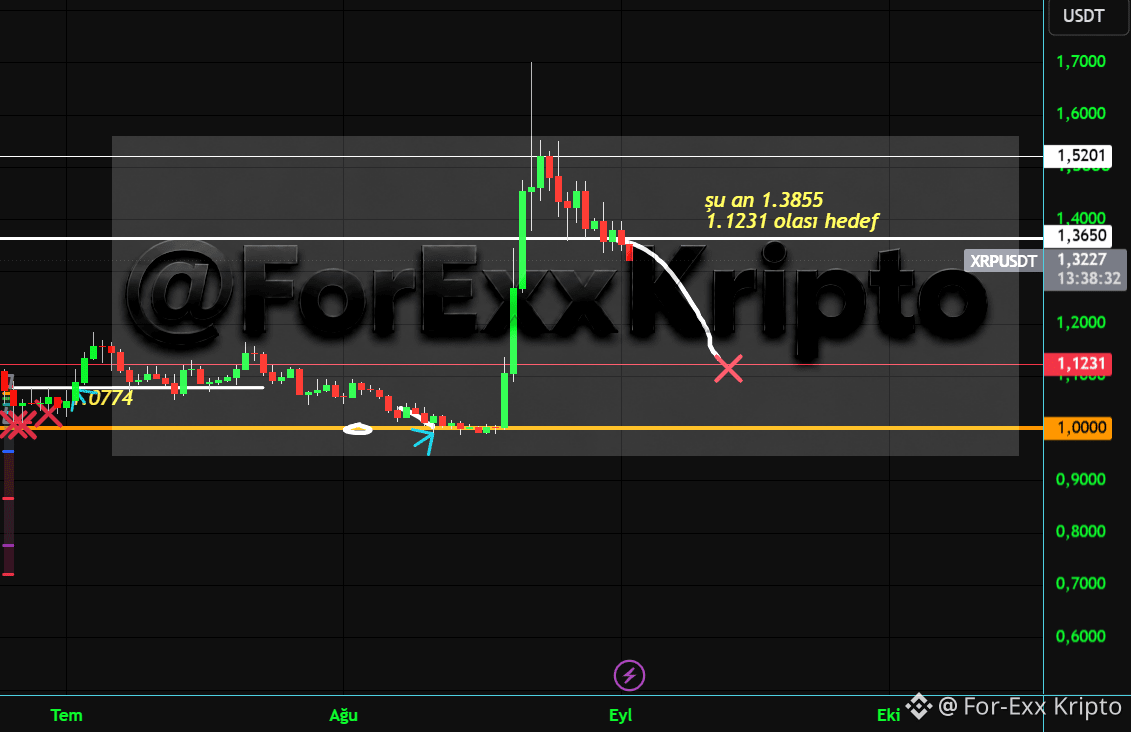
Komo na nasabi ko sa video kagahapon nang ang $XRP ay nasa $1.3855, ang $1.3650 ay isang mahalagang antas ng suporta. Ang pagsasara ng araw sa ibaba ng antas na iyon ay magtatakda ng target sa $1.1231.
Komo na nasabi ko sa video kagahapon nang ang $XRP ay nasa $1.3855, ang $1.3650 ay isang mahalagang antas ng suporta. Ang pagsasara ng araw sa ibaba ng antas na iyon ay magtatakda ng target sa $1.1231.
78
·
--
ສັນຍານໝີ
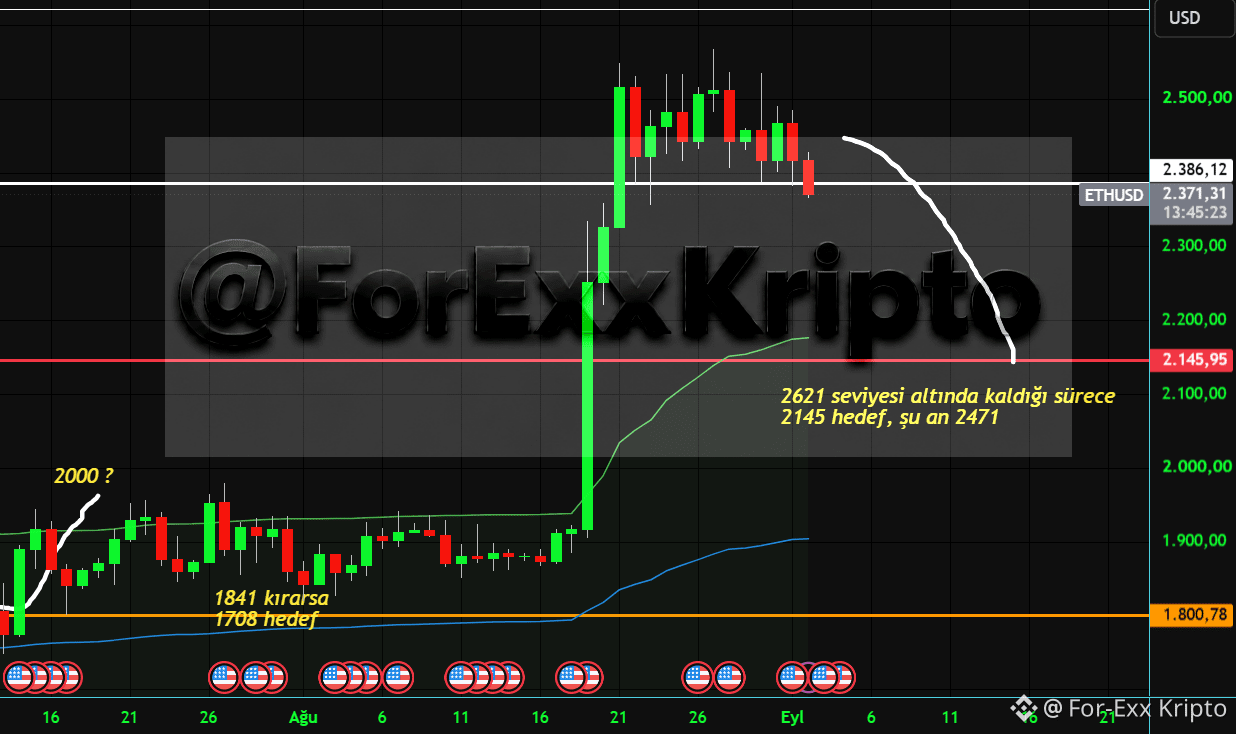
ຕົວເລກ $ETH ທີ່ຂ້ອຍໄດ້ກ່າວໃນວິດີໂອຂອງມື້ວານນີ້ ຕອນມັນຢູ່ທີ່ $2,471 ດຽວນີ້ຢູ່ທີ່ $2,371. ຖ້າມັນປິດມື້ຕໍ່າກວ່າ $2,390, ລະດັບ $2,145 ອາດຈະເຂົ້າມາໄດ້ເປັນເປົ້າໝາຍ.
ຕົວເລກ $ETH ທີ່ຂ້ອຍໄດ້ກ່າວໃນວິດີໂອຂອງມື້ວານນີ້ ຕອນມັນຢູ່ທີ່ $2,471 ດຽວນີ້ຢູ່ທີ່ $2,371. ຖ້າມັນປິດມື້ຕໍ່າກວ່າ $2,390, ລະດັບ $2,145 ອາດຈະເຂົ້າມາໄດ້ເປັນເປົ້າໝາຍ.
89
·
--
ສັນຍານໝີ
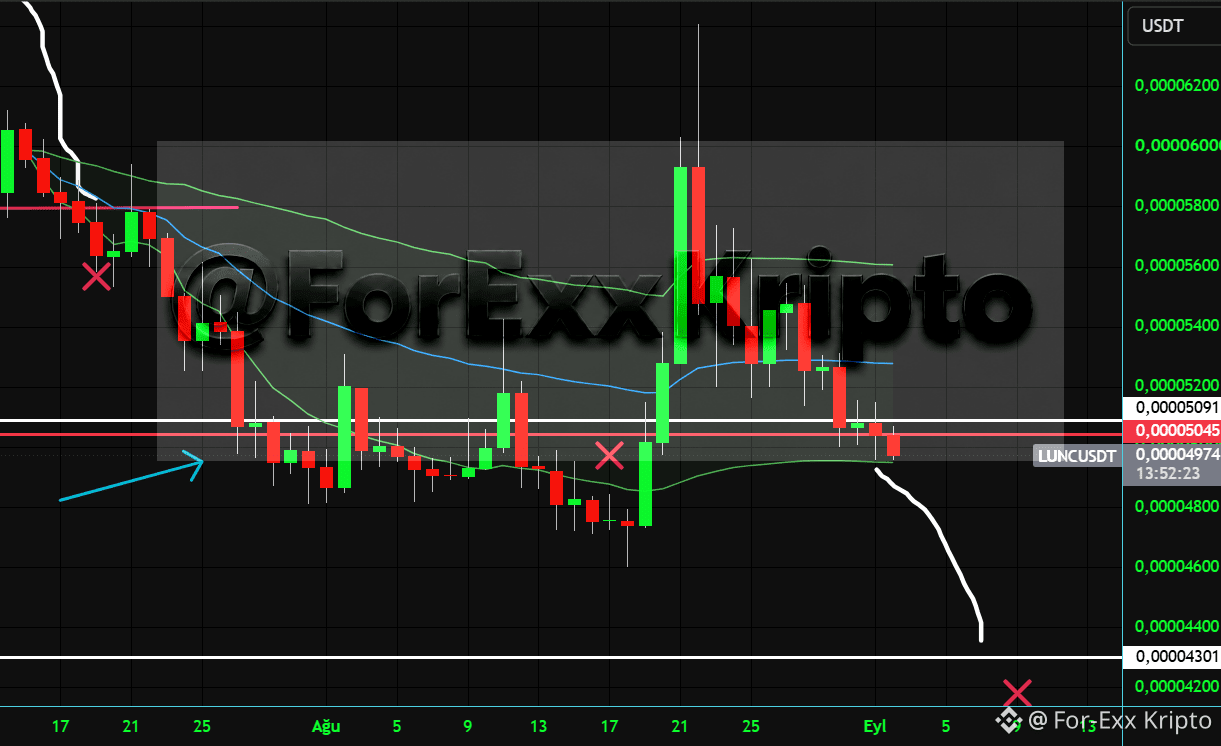
$LUNC ’s target ຈະເປັນ 4301 ຖ້າມັນປິດຕ່ຳກວ່າລະດັບ 5045. ຖ້າການຫຼຸດທີ່ຂ້ອຍຄາດວ່າຈະເກີດຂຶ້ນທົ່ວຕະຫຼາດ crypto ວົງກວ້າງ ເກີດຂື້ນ, ມັນອາດຈະໄປຮອດລະດັບນັ້ນ. ມັນຄວນຈະຖືຢູ່ທີ່ນັ້ນໂດຍບໍ່ແຕກລົງຕ່ຳກວ່າ; ການເດ้งຕົວໄປຈາກແນວຮອງ (support) ທີ່ອາດເກີດຂຶ້ນ ສາມາດກະຕຸ້ນການຂຶ້ນໄດ້.
$LUNC ’s target ຈະເປັນ 4301 ຖ້າມັນປິດຕ່ຳກວ່າລະດັບ 5045. ຖ້າການຫຼຸດທີ່ຂ້ອຍຄາດວ່າຈະເກີດຂຶ້ນທົ່ວຕະຫຼາດ crypto ວົງກວ້າງ ເກີດຂື້ນ, ມັນອາດຈະໄປຮອດລະດັບນັ້ນ. ມັນຄວນຈະຖືຢູ່ທີ່ນັ້ນໂດຍບໍ່ແຕກລົງຕ່ຳກວ່າ; ການເດ้งຕົວໄປຈາກແນວຮອງ (support) ທີ່ອາດເກີດຂຶ້ນ ສາມາດກະຕຸ້ນການຂຶ້ນໄດ້.
1
11
2k
ບົດຄວາມ
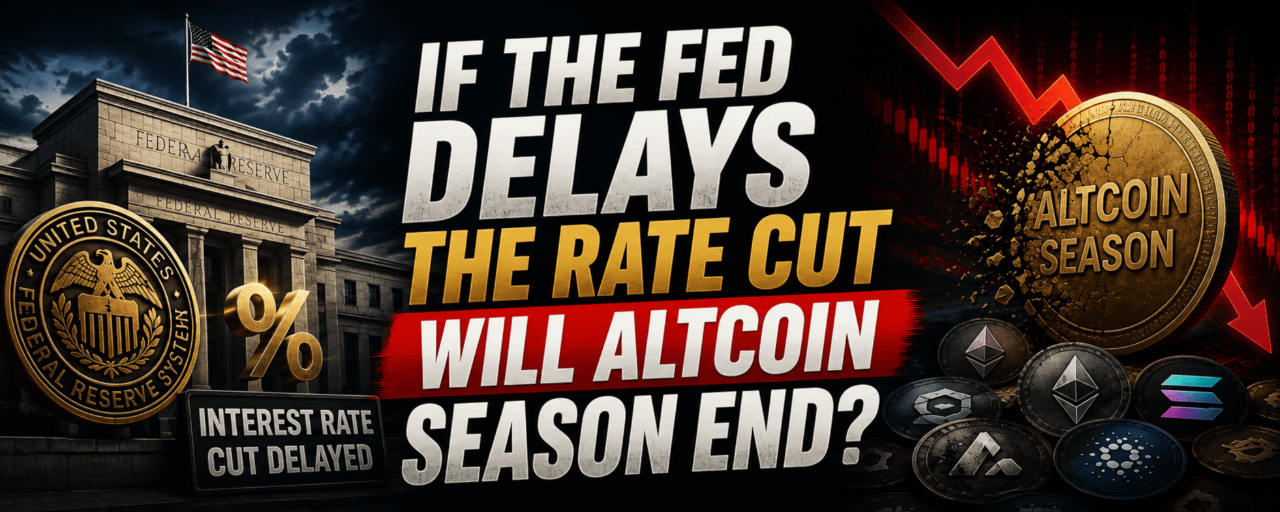
La stagione degli altcoin finirà se la Fed ritarda i tagli dei tassi?L’aspettativa di una stagione di altcoin s’è legata per anni al stesso scenario: a ch'è la Fed allenta, aumenta la liquidità, cresce l’appetito per il risc è che il capitale si sposta da Bitcoin verso attività a capitalizzazione più piccola. Però, quando il primo anello di questa catena — un taglio dei tassi — viene rimandato, il quadro non crolla necessariamente in modo così semplice come potrebbe sembrare.
La liquidità è davvero il grilletto, o il risultato?
Hè vero che le passate corse degli altcoin in genere sono succedute durante periodi di liquidità abbondante, ma la direzione della causalità può essere confusa. Il semplice allentamento della Fed non porta automaticamente capitali in cripto; contano di più l’orientamento complessivo dell’appetito per il rischio e la traiettoria della dominanza di Bitcoin. Quando i tagli dei tassi vengono rinviati, la liquidità resta più stretta, i costi di finanziamento rimangono elevati e le posizioni con leva diventano più care — di solito limitando i movimenti ad alto beta che si vedono negli altcoin.
La stagione degli altcoin finirà se la Fed ritarda i tagli dei tassi?
L’aspettativa di una stagione di altcoin s’è legata per anni al stesso scenario: a ch'è la Fed allenta, aumenta la liquidità, cresce l’appetito per il risc è che il capitale si sposta da Bitcoin verso attività a capitalizzazione più piccola. Però, quando il primo anello di questa catena — un taglio dei tassi — viene rimandato, il quadro non crolla necessariamente in modo così semplice come potrebbe sembrare.
La liquidità è davvero il grilletto, o il risultato?
Hè vero che le passate corse degli altcoin in genere sono succedute durante periodi di liquidità abbondante, ma la direzione della causalità può essere confusa. Il semplice allentamento della Fed non porta automaticamente capitali in cripto; contano di più l’orientamento complessivo dell’appetito per il rischio e la traiettoria della dominanza di Bitcoin. Quando i tagli dei tassi vengono rinviati, la liquidità resta più stretta, i costi di finanziamento rimangono elevati e le posizioni con leva diventano più care — di solito limitando i movimenti ad alto beta che si vedono negli altcoin.
La liquidità è davvero il grilletto, o il risultato?
Hè vero che le passate corse degli altcoin in genere sono succedute durante periodi di liquidità abbondante, ma la direzione della causalità può essere confusa. Il semplice allentamento della Fed non porta automaticamente capitali in cripto; contano di più l’orientamento complessivo dell’appetito per il rischio e la traiettoria della dominanza di Bitcoin. Quando i tagli dei tassi vengono rinviati, la liquidità resta più stretta, i costi di finanziamento rimangono elevati e le posizioni con leva diventano più care — di solito limitando i movimenti ad alto beta che si vedono negli altcoin.
89
ບົດຄວາມ
UMBIKO WEMAKETHI WOKUPHUMA KOSUKU — SEPTEMBER 1, 2026🔐 UMBIKO WEMAKETHI WOKUPHUMA KOSUKU — SEPTEMBER 1, 2026
🌐 IZINDABA EZISISEMQOKA ZALOSUKU
Umthetho we-crypto waseRussia (Federal Law No. 282-FZ) uqale ukusebenza namuhla, kusungulwa uhlaka lwempahla yedijithali oluvunyelwe ngokuphelele oluvumela ukuhweba nokugcinwa kwe-Bitcoin, Ethereum ne-USDT ngokusebenzisa abaphakathi abagunyaziwe abaphethwe yi-Central Bank; imikhawulo yaminyaka yonke yokuthenga ngensiza (retail) ikhawulelwe ku-300,000 rubles (~$3,700), kanti izinkokhelo ze-crypto zemikhiqizo nezinsiza zasekhaya zihlala zivinjelwe
I-BLAKE2b hard fork eyethulwe abaxhasi be-Bitcoin Knots izoqala ukusebenza namuhla—ukushintsha i-algorithm yokuhashing kusuka ku-SHA-256d kuya ku-BLAKE2b kwenza ihadiwe ekhona yokumba (BTC mining) ingasetshenziswa kulayini omusha; labo abaphethe i-BTC kumaketango amakhulu (main chain) akudingeki benze noma yisiphi isenzo
UMBIKO WEMAKETHI WOKUPHUMA KOSUKU — SEPTEMBER 1, 2026
🔐 UMBIKO WEMAKETHI WOKUPHUMA KOSUKU — SEPTEMBER 1, 2026
🌐 IZINDABA EZISISEMQOKA ZALOSUKU
Umthetho we-crypto waseRussia (Federal Law No. 282-FZ) uqale ukusebenza namuhla, kusungulwa uhlaka lwempahla yedijithali oluvunyelwe ngokuphelele oluvumela ukuhweba nokugcinwa kwe-Bitcoin, Ethereum ne-USDT ngokusebenzisa abaphakathi abagunyaziwe abaphethwe yi-Central Bank; imikhawulo yaminyaka yonke yokuthenga ngensiza (retail) ikhawulelwe ku-300,000 rubles (~$3,700), kanti izinkokhelo ze-crypto zemikhiqizo nezinsiza zasekhaya zihlala zivinjelwe
I-BLAKE2b hard fork eyethulwe abaxhasi be-Bitcoin Knots izoqala ukusebenza namuhla—ukushintsha i-algorithm yokuhashing kusuka ku-SHA-256d kuya ku-BLAKE2b kwenza ihadiwe ekhona yokumba (BTC mining) ingasetshenziswa kulayini omusha; labo abaphethe i-BTC kumaketango amakhulu (main chain) akudingeki benze noma yisiphi isenzo
🌐 IZINDABA EZISISEMQOKA ZALOSUKU
Umthetho we-crypto waseRussia (Federal Law No. 282-FZ) uqale ukusebenza namuhla, kusungulwa uhlaka lwempahla yedijithali oluvunyelwe ngokuphelele oluvumela ukuhweba nokugcinwa kwe-Bitcoin, Ethereum ne-USDT ngokusebenzisa abaphakathi abagunyaziwe abaphethwe yi-Central Bank; imikhawulo yaminyaka yonke yokuthenga ngensiza (retail) ikhawulelwe ku-300,000 rubles (~$3,700), kanti izinkokhelo ze-crypto zemikhiqizo nezinsiza zasekhaya zihlala zivinjelwe
I-BLAKE2b hard fork eyethulwe abaxhasi be-Bitcoin Knots izoqala ukusebenza namuhla—ukushintsha i-algorithm yokuhashing kusuka ku-SHA-256d kuya ku-BLAKE2b kwenza ihadiwe ekhona yokumba (BTC mining) ingasetshenziswa kulayini omusha; labo abaphethe i-BTC kumaketango amakhulu (main chain) akudingeki benze noma yisiphi isenzo
77
·
--
ສັນຍານໝີ
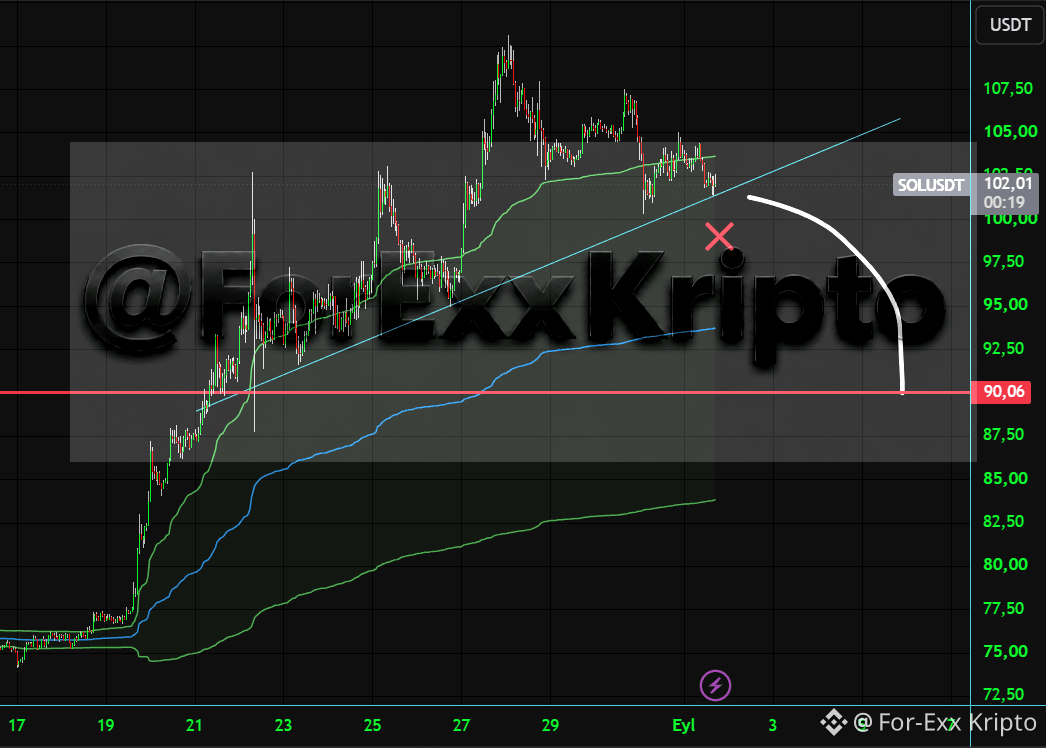
$SOL ກຳລັງລົງຕໍ່າກວ່າລະດັບ $100 ອາດຈະກະຕຸ້ນໃຫ້ມີການຫຼຸດລົງໄປຫາ $90.
ການເຄື່ອນໄຫວແບບນີ້ໃນຫມວດເງິນຕົ້ນຕໍ ອາດຈະສ້າງຜົນແບບ domino ຂ້າມໄປສູ່ cryptocurrency ອື່ນໆ ທີ່ສຳຄັນ. ໃນພາບລວມໃຫຍ່, ຮູບແບບ Head & Shoulders ທີ່ຂ້ອຍເຄີຍຊີ້ແຈ້ງໄວ້ ພ້ອມເປົ້າໝາຍ $51.98 ຍັງຄົງກຳລັງດຳເນີນຢູ່.
$SOL ກຳລັງລົງຕໍ່າກວ່າລະດັບ $100 ອາດຈະກະຕຸ້ນໃຫ້ມີການຫຼຸດລົງໄປຫາ $90.
ການເຄື່ອນໄຫວແບບນີ້ໃນຫມວດເງິນຕົ້ນຕໍ ອາດຈະສ້າງຜົນແບບ domino ຂ້າມໄປສູ່ cryptocurrency ອື່ນໆ ທີ່ສຳຄັນ. ໃນພາບລວມໃຫຍ່, ຮູບແບບ Head & Shoulders ທີ່ຂ້ອຍເຄີຍຊີ້ແຈ້ງໄວ້ ພ້ອມເປົ້າໝາຍ $51.98 ຍັງຄົງກຳລັງດຳເນີນຢູ່.
ການເຄື່ອນໄຫວແບບນີ້ໃນຫມວດເງິນຕົ້ນຕໍ ອາດຈະສ້າງຜົນແບບ domino ຂ້າມໄປສູ່ cryptocurrency ອື່ນໆ ທີ່ສຳຄັນ. ໃນພາບລວມໃຫຍ່, ຮູບແບບ Head & Shoulders ທີ່ຂ້ອຍເຄີຍຊີ້ແຈ້ງໄວ້ ພ້ອມເປົ້າໝາຍ $51.98 ຍັງຄົງກຳລັງດຳເນີນຢູ່.
129
ເຂົ້າສູ່ລະບົບເພື່ອສຳຫຼວດເນື້ອຫາເພີ່ມເຕີມ
ເຂົ້າຮ່ວມກຸ່ມຜູ້ໃຊ້ຄຣິບໂຕທົ່ວໂລກໃນ Binance Square.
⚡️ ໄດ້ຮັບຂໍ້ມູນຫຼ້າສຸດ ແລະ ທີ່ມີປະໂຫຍດກ່ຽວກັບຄຣິບໂຕ.
💬 ໄດ້ຮັບຄວາມໄວ້ວາງໃຈຈາກຕະຫຼາດແລກປ່ຽນຄຣິບໂຕທີ່ໃຫຍ່ທີ່ສຸດໃນໂລກ.
👍 ຄົ້ນຫາຂໍ້ມູນເຊີງເລິກທີ່ແທ້ຈາກນັກສ້າງທີ່ໄດ້ຮັບການຢືນຢັນ.
ອີເມວ / ເບີໂທລະສັບ
ຫົວຂໍ້ທີ່ກໍາລັງນິຍົມ
AppleDebutsFoldablePhone
6,739 views
170 ກຳລັງສົນທະນາ
#appledebutsfoldablephone ຂ້ອຍໄດ້ຈັບ iPhone Duo ຄັ້ງທຳອິດຂອງ Apple ທີ່ເປັນໂທລະສັບພັບໄດ້ເປັນຄັ້ງທຳອິດ—ນີ້ແມ່ນສິ່ງທີ່ໂດດເດັ່ນ
ໂທລະສັບຂະໜາດຝາມືນີ້ແມ່ນມືຖືທີ່ກ້າຫານທີ່ສຸດຂອງ Apple ໃນຮອບຫຼາຍປີ ດ້ວຍໜ້າຈໍຝາປິດ 5.4 ນິ້ວ ແລະ ໜ້າຈໍຫຼັກ 7.6 ນິ້ວ. ຂ້ອຍໄດ້ໃຊ້ເວລາກັບ Duo ກ່ອນການເປີດຕົວໃນເດືອນຕຸລາ.
ສຸດທ້າຍມັນມາແລ້ວ: Apple ໃນວັນພຸດນີ້ໄດ້ເປີດເຜີຍ iPhone ພັບໄດ້ລຸ້ນທຳອິດ ທີ່ເອີ້ນວ່າ iPhone Duo.
ການອອກແບບແລະການປະກອບສ້າງຂອງ iPhone Duo
iPhone Duo ເປັນຄອມແພັກ ກັບຄວາມອອກແບບຄ້າຍຂະໜາດ passport. ມັນມີຈໍຂະໜາດ 7.6 ນິ້ວຢູ່ດ້ານໃນ ແລະ ຈໍຂະໜາດ 5.4 ນິ້ວຢູ່ດ້ານນອກ. ມັນພໍດີໃນຝາມືຂອງຂ້ອຍ ໂດຍມີຂະໜາດຄ້າຍກັບ Samsung’s Galaxy Z Fold 8 ທີ່ມີຈໍດ້ານໃນ 7.6 ນິ້ວ ແລະ ຈໍດ້ານປົກ 5.5 ນິ້ວ.
Apple ບອກວ່າ Duo ແມ່ນ iPhone ທີ່ບາງທີ່ສຸດເມື່ອເປີດ ວັດໄດ້ 5.2mm. ໜາ 11.3mm ເມື່ອປິດ. ກອບໂລຫະໄທເທນຽມຊ່ວຍໃຫ້ມັນເບົາພຽງ 254 ກຣາມ.
ໜຶ່ງໃນຄວາມແຕກຕ່າງທີ່ສຳຄັນໃນດ້ານສຳຜັດລະຫວ່າງໂທລະສັບຂອງ Apple ແລະ Samsung ແມ່ນວ່າ iPhone Duo ມີຜິວຈືດແບບ matte ແລະ ລາຍທົດ nano texture ຢູ່ດ້ານໃນຂອງຈໍ ເຊິ່ງຊ່ວຍຫຼຸດຮອຍພັບ (crease) ໃນໂທລະສັບ ແລະ ຂັບສະທ້ອນແສງ. ມັນຮູ້ສຶກພໍໃຈ ແລະ ເຮັດໃຫ້ຮອຍພັບເກືອບຈະຫາຍໄປເມື່ອໜ້າຈໍເປີດຂຶ້ນ. ຂ້ອຍພົບວ່າມັນຍາກກວ່າຈະສັງເກດກ່ວາ Z Fold 8 ອີກ, ເຊິ່ງກໍມີຈໍຕ້ານສະທ້ອນແສງ.$ONG $IMX $TAC
Isabella-I
·4 ຖືກໃຈ
·867 views
US10YTreasuryYieldHitsHighestSinceNov2023
10,908 views
223 ກຳລັງສົນທະນາ
USTreasuryToBuyBackUpTo$6BLongDatedDebt
10,496 views
139 ກຳລັງສົນທະນາ