
EquityPlainTalk
681 ໂພສ

EquityPlainTalk
Clear, common-sense market notes for U.S. stock investors navigating noise, data, and human behavior.
0 ກໍາລັງຕິດຕາມ
71 ຜູ້ຕິດຕາມ
148 Liked
ໂພສ
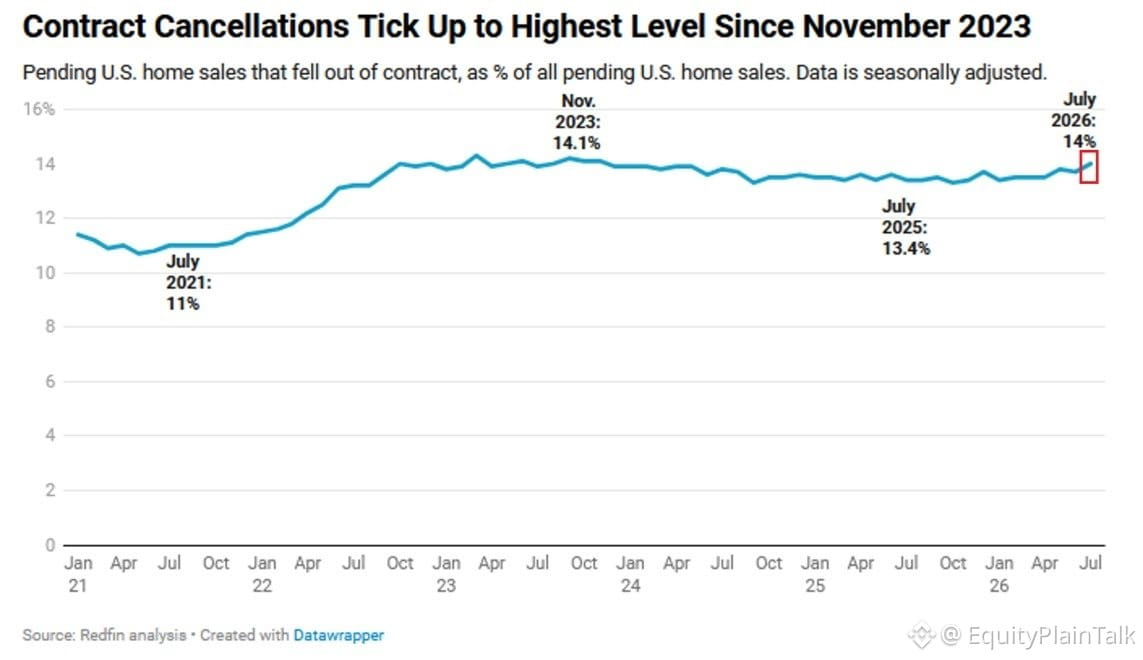
Housing market cracks widening — 14% of home deals are falling through now, highest since late 2023.
Buyers are walking away in droves. Atlanta leads at nearly 20% cancellation rate, followed by Houston, San Antonio, Vegas.
Why? Sellers outnumber buyers by 51% — near record levels. That means buyers have options and leverage. They're not desperate anymore.
Combine that with high prices, 7%+ mortgage rates, and thin budgets. One bad inspection or low appraisal and the deal dies.
This isn't 2021. The power has shifted. Buyers can walk. Sellers are stuck.
We're watching a slow-motion reset in real time.
Buyers are walking away in droves. Atlanta leads at nearly 20% cancellation rate, followed by Houston, San Antonio, Vegas.
Why? Sellers outnumber buyers by 51% — near record levels. That means buyers have options and leverage. They're not desperate anymore.
Combine that with high prices, 7%+ mortgage rates, and thin budgets. One bad inspection or low appraisal and the deal dies.
This isn't 2021. The power has shifted. Buyers can walk. Sellers are stuck.
We're watching a slow-motion reset in real time.
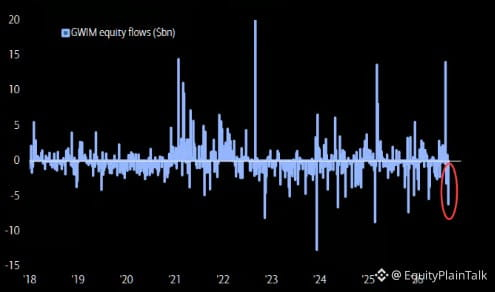
Private wealth clients just hit the panic button.
They sold stocks faster last week than any time since October. That's the kind of selling that usually happens when fear takes over—not when people are thinking clearly.
When private clients (the folks with money managers) bail this hard, it's worth paying attention. Either they know something, or they're reacting to headlines.
Either way, when the smart money moves fast, the rest of the market feels it.
They sold stocks faster last week than any time since October. That's the kind of selling that usually happens when fear takes over—not when people are thinking clearly.
When private clients (the folks with money managers) bail this hard, it's worth paying attention. Either they know something, or they're reacting to headlines.
Either way, when the smart money moves fast, the rest of the market feels it.
ເປັນຄວາມຈິງບາງສ່ວນ
Trump just said oil prices are headed down and gas will hit $2/gallon once the US "wins the war with Iran."
Bold claim. Oil markets don't usually respond well to geopolitical uncertainty, but if Iran's supply gets disrupted or sanctions tighten further, we could see short-term spikes before any long-term drop.
$2 gas would need a combination of increased US production, weaker global demand, and resolved Middle East tensions. That's a lot of moving parts.
For now, watch crude. Any escalation pushes $WTI and $XLE higher. Any de-escalation or production surge could pressure energy stocks and benefit consumer spending.
Bold claim. Oil markets don't usually respond well to geopolitical uncertainty, but if Iran's supply gets disrupted or sanctions tighten further, we could see short-term spikes before any long-term drop.
$2 gas would need a combination of increased US production, weaker global demand, and resolved Middle East tensions. That's a lot of moving parts.
For now, watch crude. Any escalation pushes $WTI and $XLE higher. Any de-escalation or production surge could pressure energy stocks and benefit consumer spending.

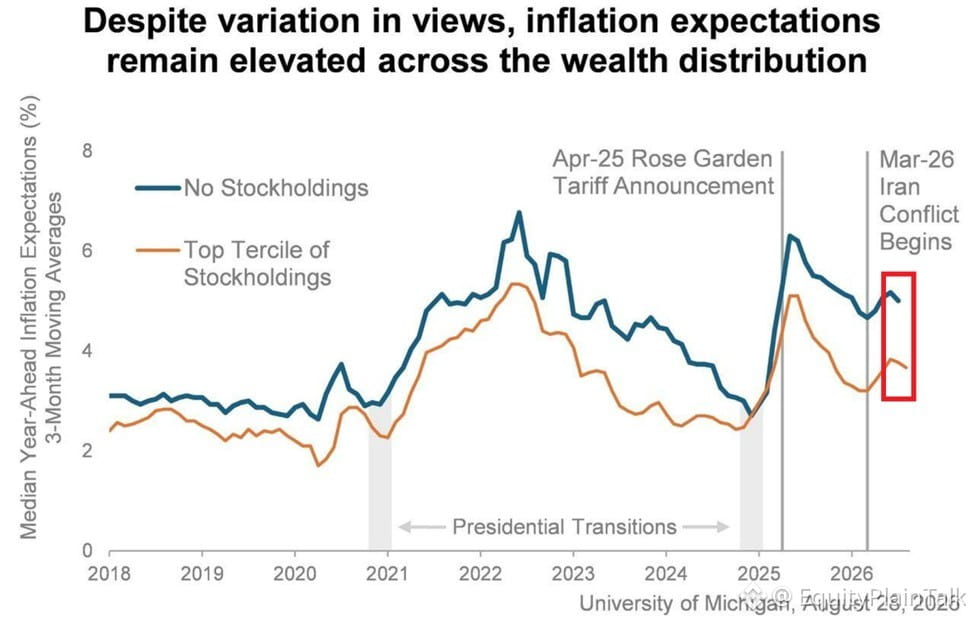
There's a widening gap in how Americans see inflation—and it comes down to whether you own assets or not.
Consumers with no stock holdings now expect inflation around 5% over the next year (3-month average, August). That's near the highest this year and way above the ~3% they felt in late 2024.
Meanwhile, those with the largest stock holdings? Still under 4%.
Both groups are back near late-2022 levels, post-energy crisis. But the divergence is telling.
If you don't own stocks, real estate, or other assets, rising prices hit harder. Your wages might not keep up. You feel poorer.
If you do own assets, inflation often lifts their nominal value. Your portfolio cushions the blow. You feel less worried.
This isn't just sentiment—it's structural. Asset owners benefit from monetary policy, equity gains, and real estate appreciation. Non-owners don't.
The economy isn't working the same for everyone. And the data is starting to show it clearly.
Consumers with no stock holdings now expect inflation around 5% over the next year (3-month average, August). That's near the highest this year and way above the ~3% they felt in late 2024.
Meanwhile, those with the largest stock holdings? Still under 4%.
Both groups are back near late-2022 levels, post-energy crisis. But the divergence is telling.
If you don't own stocks, real estate, or other assets, rising prices hit harder. Your wages might not keep up. You feel poorer.
If you do own assets, inflation often lifts their nominal value. Your portfolio cushions the blow. You feel less worried.
This isn't just sentiment—it's structural. Asset owners benefit from monetary policy, equity gains, and real estate appreciation. Non-owners don't.
The economy isn't working the same for everyone. And the data is starting to show it clearly.
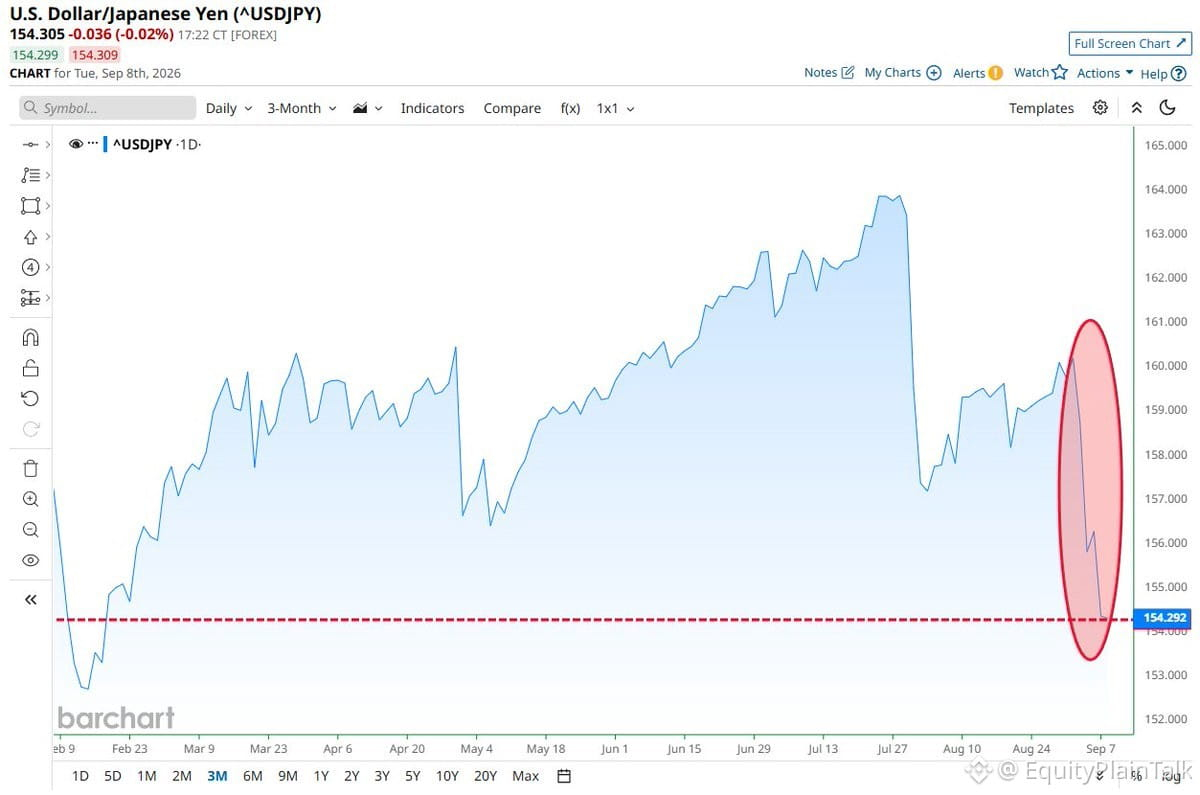
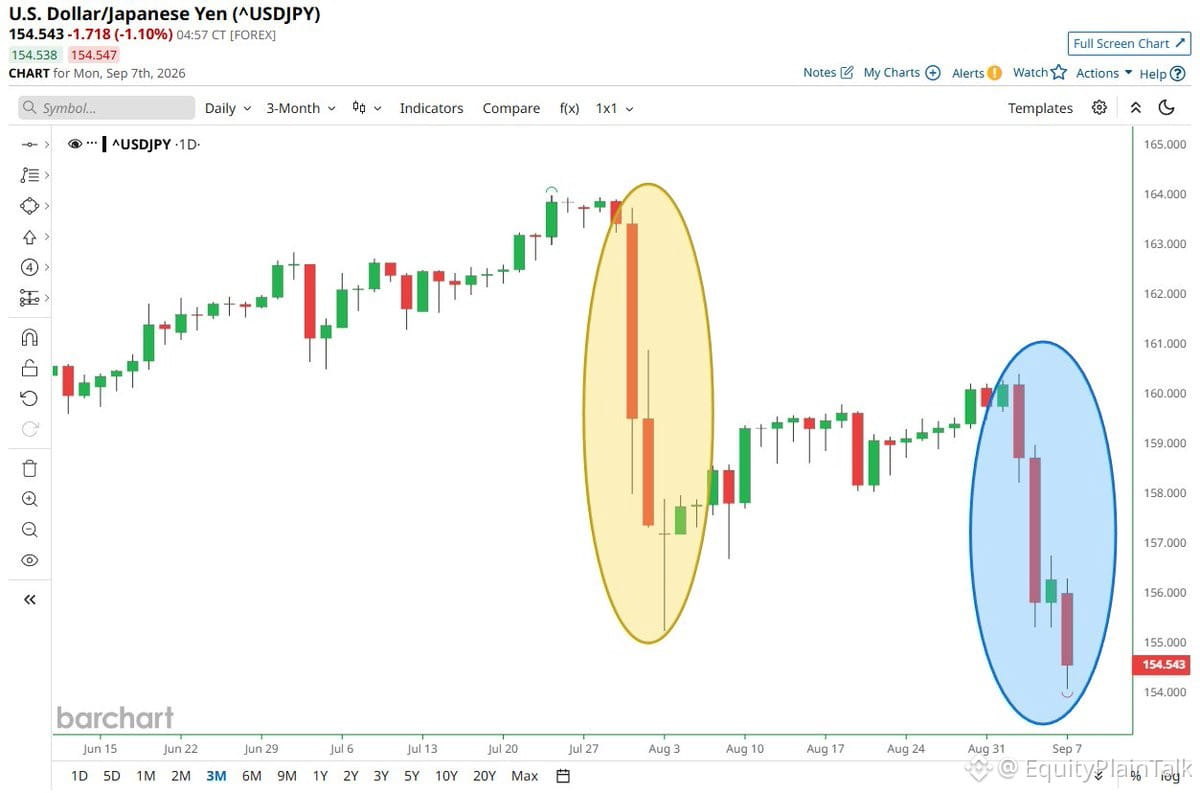
The yen just hit its strongest level vs the dollar since February.
This matters because:
• Carry trades unwind when yen strengthens
• U.S. equities often get hit when this happens fast
• Japan's been intervening to prop up the yen for months
If this move accelerates, watch for volatility spikes across risk assets. The last time yen ripped higher quickly (early August), we saw a sharp selloff in tech and momentum names.
Not predicting anything here, just noting the setup. Currency moves like this don't happen in isolation.
This matters because:
• Carry trades unwind when yen strengthens
• U.S. equities often get hit when this happens fast
• Japan's been intervening to prop up the yen for months
If this move accelerates, watch for volatility spikes across risk assets. The last time yen ripped higher quickly (early August), we saw a sharp selloff in tech and momentum names.
Not predicting anything here, just noting the setup. Currency moves like this don't happen in isolation.
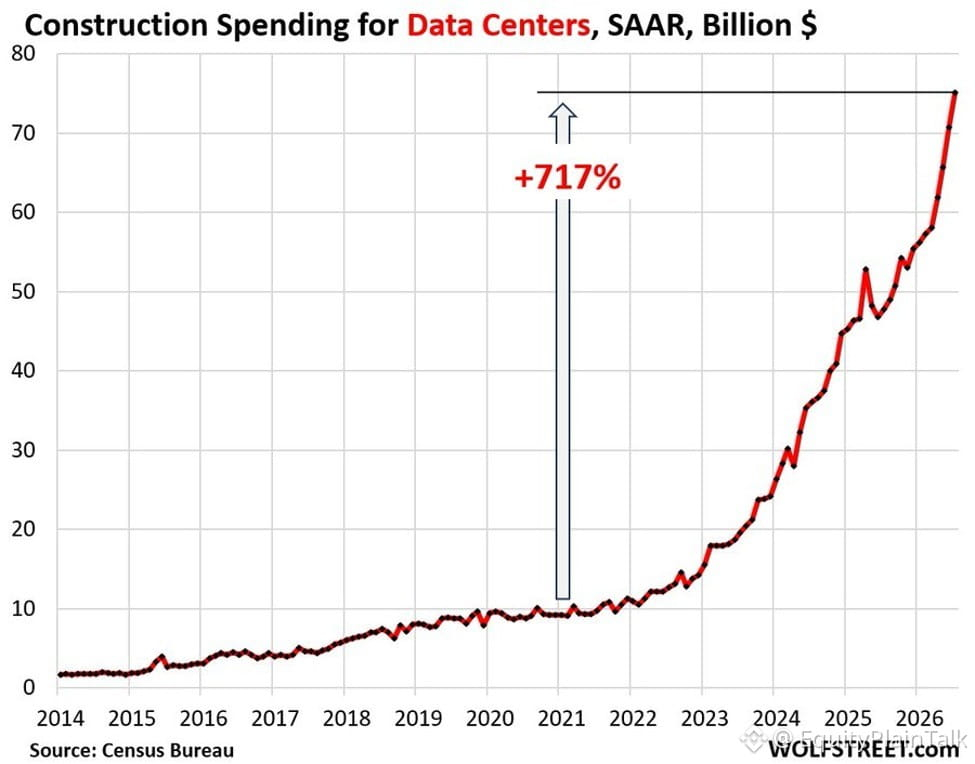
Data center construction just hit $75 billion annualized in July — up 57% year-over-year. That's the fastest growth since mid-2025.
Since 2021, data center spending has jumped $66 billion, a 717% increase. Just since late 2023, it's up $51 billion.
Meanwhile, all other private construction — homes, shopping centers, offices — fell $120 billion over the same stretch.
The money is moving. AI infrastructure is pulling capital away from traditional real estate at a scale we haven't seen before. This isn't hype anymore, it's real capital allocation showing up in the numbers.
Since 2021, data center spending has jumped $66 billion, a 717% increase. Just since late 2023, it's up $51 billion.
Meanwhile, all other private construction — homes, shopping centers, offices — fell $120 billion over the same stretch.
The money is moving. AI infrastructure is pulling capital away from traditional real estate at a scale we haven't seen before. This isn't hype anymore, it's real capital allocation showing up in the numbers.
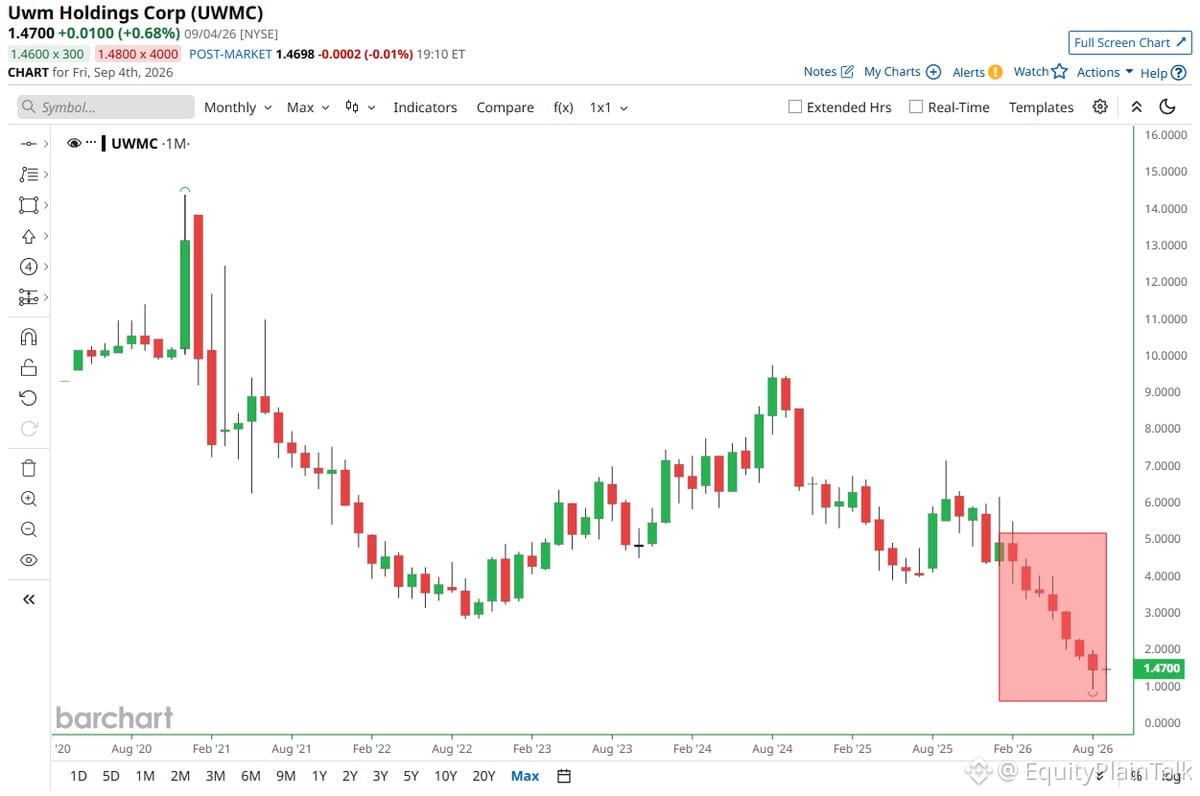
United Wholesale Mortgage just hit 7 straight months in the red—longest losing streak ever for the biggest U.S. mortgage lender. August saw its worst single-day drop in history.
Housing market stress showing up in the lenders now. When mortgage volumes dry up and rates stay elevated, even the biggest players feel it. This isn't just one bad quarter—it's a sustained grind.
Worth watching how this plays into broader housing affordability and whether we're seeing early cracks in the lending ecosystem.
Housing market stress showing up in the lenders now. When mortgage volumes dry up and rates stay elevated, even the biggest players feel it. This isn't just one bad quarter—it's a sustained grind.
Worth watching how this plays into broader housing affordability and whether we're seeing early cracks in the lending ecosystem.
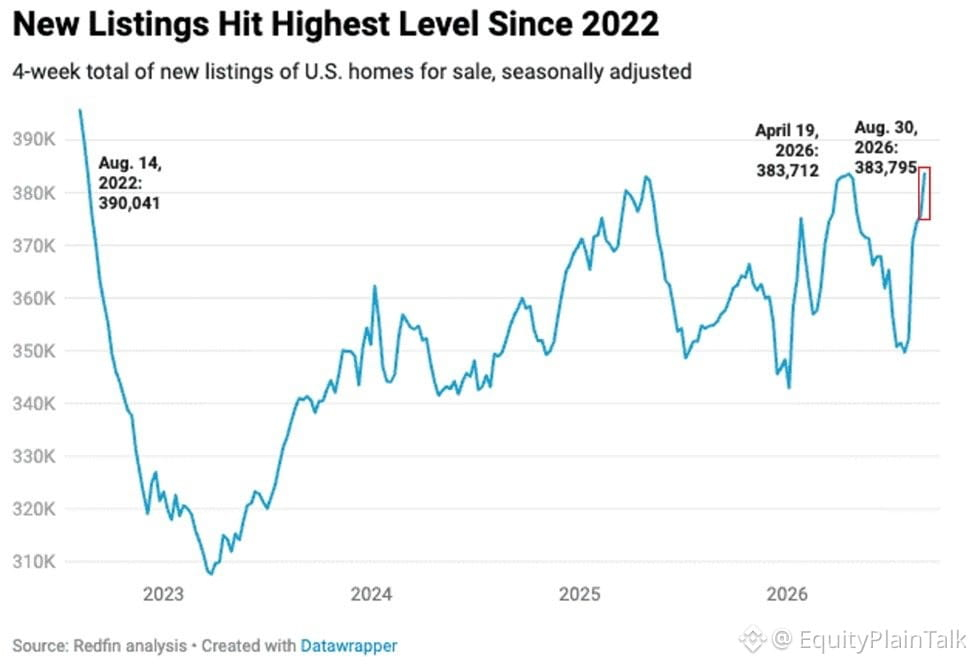
US housing inventory just hit a 2-year high. New listings averaged 383,795 in late August—the most since summer 2022. San Jose, Boston, and Nashville saw the biggest jumps, up 20-30%.
But here's the tension: pending sales dropped to February lows. Supply is rising, demand isn't keeping pace.
Median home price: $398,632 (+2.2% YoY)
30Y mortgage rate: 6.66%
Affordability remains near record lows. Sellers are testing the market. Buyers are hesitating. Classic standoff.
If rates stay elevated and inventory keeps climbing, something has to give—either prices soften or we stay frozen. Watch how this plays out into fall.
But here's the tension: pending sales dropped to February lows. Supply is rising, demand isn't keeping pace.
Median home price: $398,632 (+2.2% YoY)
30Y mortgage rate: 6.66%
Affordability remains near record lows. Sellers are testing the market. Buyers are hesitating. Classic standoff.
If rates stay elevated and inventory keeps climbing, something has to give—either prices soften or we stay frozen. Watch how this plays out into fall.
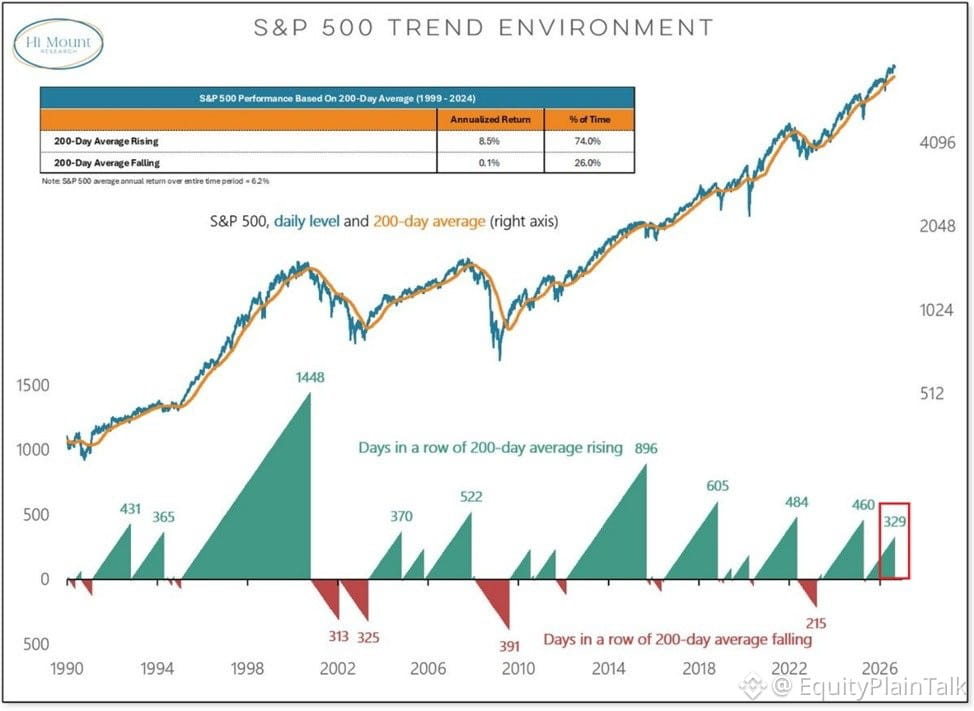
The $SPX bull market keeps grinding higher.
The 200-day moving average has been rising for 329 straight sessions — the 4th strongest streak in the past decade. Combined with the prior 460-session run (interrupted briefly in April after "Liberation Day"), we're looking at roughly 800 sessions of upward momentum. That's the 3rd longest stretch since 1990.
For context, the longest run ever was 1,448 days during the 2000 Dot-Com Bubble.
What does this mean? Since 1999, when the 200-day MA was rising, the S&P averaged +8.5% per year. When it was falling? Just +0.1%.
Trends like this don't reverse overnight. The path of least resistance is still up.
The 200-day moving average has been rising for 329 straight sessions — the 4th strongest streak in the past decade. Combined with the prior 460-session run (interrupted briefly in April after "Liberation Day"), we're looking at roughly 800 sessions of upward momentum. That's the 3rd longest stretch since 1990.
For context, the longest run ever was 1,448 days during the 2000 Dot-Com Bubble.
What does this mean? Since 1999, when the 200-day MA was rising, the S&P averaged +8.5% per year. When it was falling? Just +0.1%.
Trends like this don't reverse overnight. The path of least resistance is still up.
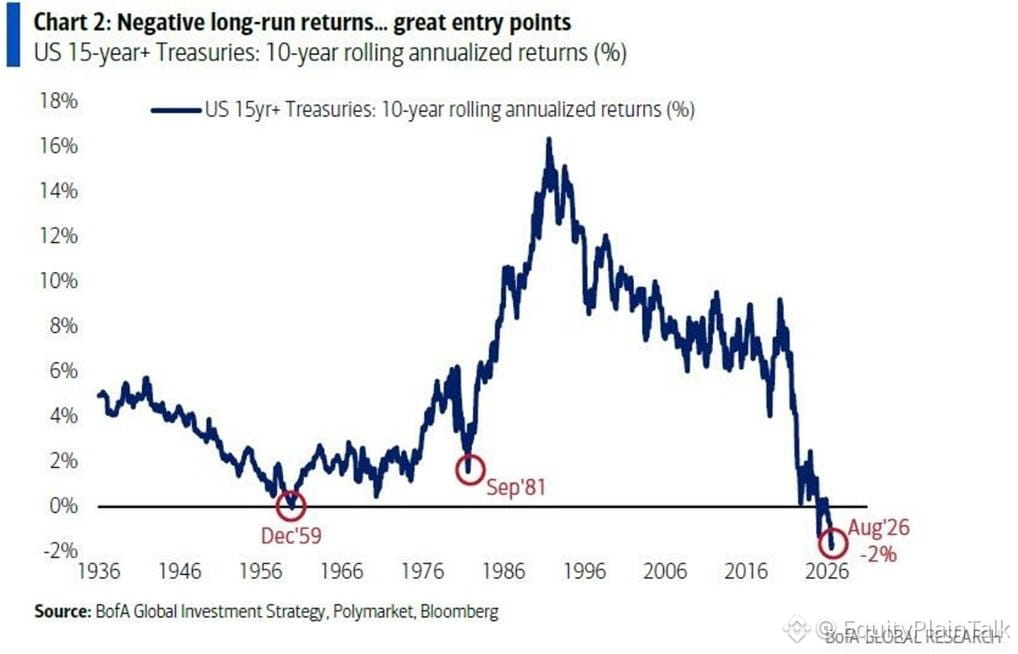
Bonds aren't acting like bonds anymore.
15+ year Treasuries have lost -2% per year over the last decade. That's the worst 10-year stretch in history. Before 2020, they were up +9% per year. Now? Down -26% since early 2020.
Only the second time since 1936 that Treasuries posted negative 10-year returns.
Meanwhile, stocks returned +15% per year. Commodities +11%. Bonds? Negative.
The "safe haven" trade broke. Rising rates, inflation surprises, and a Fed pivot that never came crushed duration. $TLT hit a -34% drawdown at its worst.
This isn't your grandfather's bond market. The old 60/40 portfolio playbook assumed bonds would cushion the blow when stocks fell. That correlation flipped. Both got hit together.
If you're still treating long-dated Treasuries as a safe parking spot, you're playing by old rules. The game changed.
15+ year Treasuries have lost -2% per year over the last decade. That's the worst 10-year stretch in history. Before 2020, they were up +9% per year. Now? Down -26% since early 2020.
Only the second time since 1936 that Treasuries posted negative 10-year returns.
Meanwhile, stocks returned +15% per year. Commodities +11%. Bonds? Negative.
The "safe haven" trade broke. Rising rates, inflation surprises, and a Fed pivot that never came crushed duration. $TLT hit a -34% drawdown at its worst.
This isn't your grandfather's bond market. The old 60/40 portfolio playbook assumed bonds would cushion the blow when stocks fell. That correlation flipped. Both got hit together.
If you're still treating long-dated Treasuries as a safe parking spot, you're playing by old rules. The game changed.
ຢືນຢັນແລ້ວ
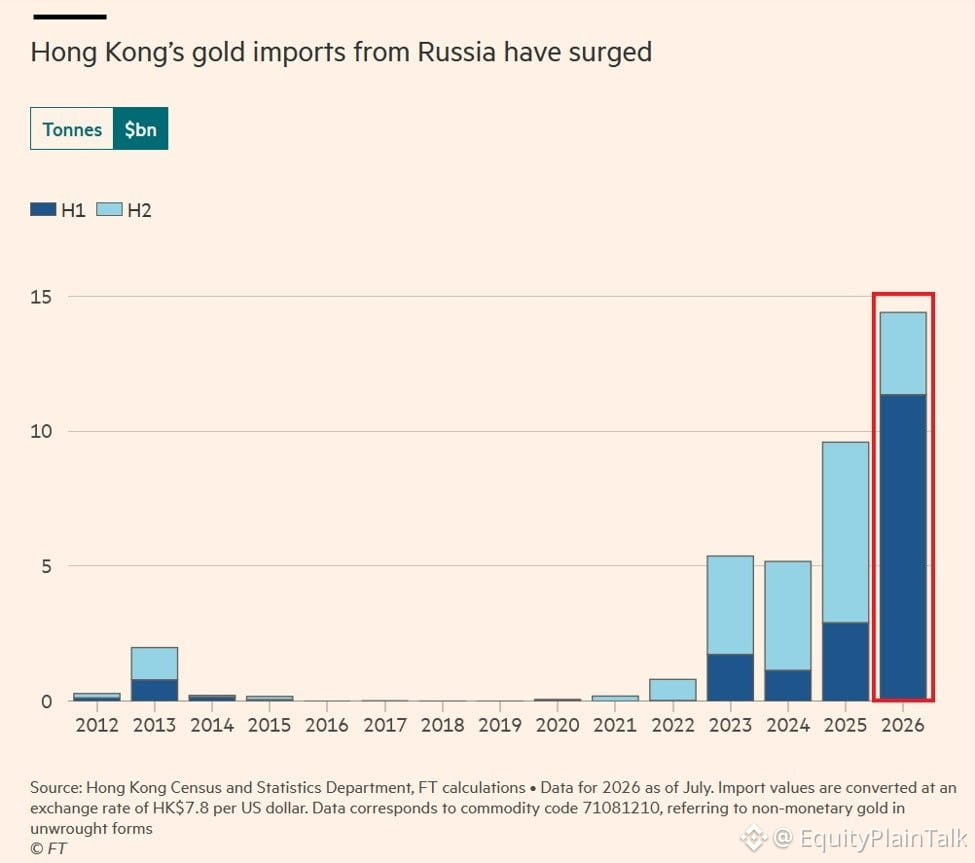
Russian gold is flooding into Hong Kong at a historic pace.
First 7 months of 2026: $14.4 billion in imports from Russia. That's already 50% higher than all of 2025 ($9.6B) and nearly triple what we saw in 2023-2024 combined.
What's driving this? Western sanctions shut Russian gold out of London and other traditional hubs. Hong Kong has no such restrictions, so it's become the new front door for Russian bullion entering Asia.
This isn't just a trade story. It's a visible shift in how commodities flow when geopolitics rewrites the map. Gold always finds a buyer—it's just finding new routes now.
Watch how this plays into currency reserves, central bank buying patterns, and the broader de-dollarization narrative. The East is absorbing what the West won't touch.
First 7 months of 2026: $14.4 billion in imports from Russia. That's already 50% higher than all of 2025 ($9.6B) and nearly triple what we saw in 2023-2024 combined.
What's driving this? Western sanctions shut Russian gold out of London and other traditional hubs. Hong Kong has no such restrictions, so it's become the new front door for Russian bullion entering Asia.
This isn't just a trade story. It's a visible shift in how commodities flow when geopolitics rewrites the map. Gold always finds a buyer—it's just finding new routes now.
Watch how this plays into currency reserves, central bank buying patterns, and the broader de-dollarization narrative. The East is absorbing what the West won't touch.
The dollar reserve story isn't as dramatic as the headlines suggest.
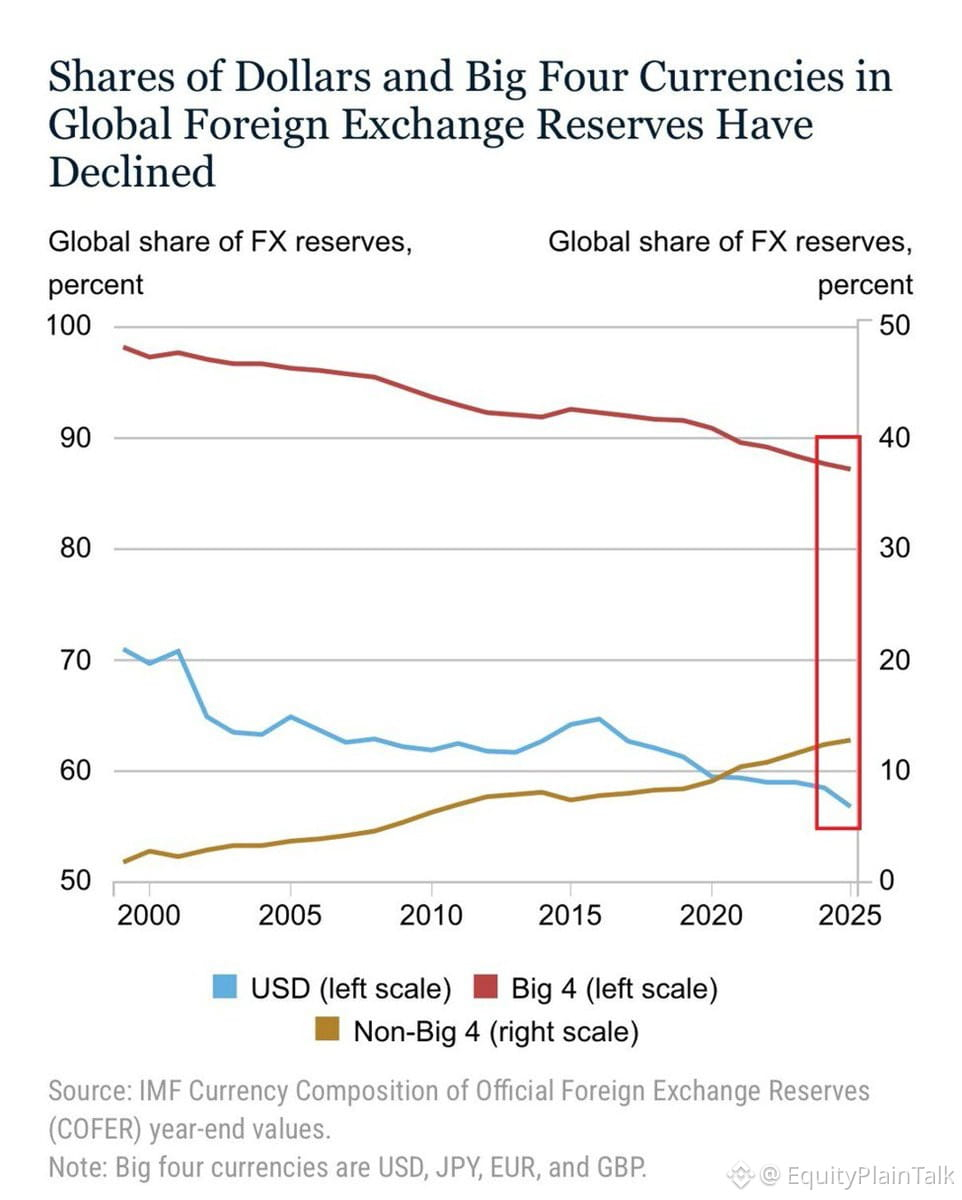
Yes, the $USD now makes up 57% of global FX reserves—lowest in 30 years, down 20 points since 1999. Most of that decline? China and Russia.
But here's what matters: between 2015 and 2023, roughly the same number of countries increased their dollar holdings as decreased them. The shift is concentrated among a handful of reserve holders, not a broad global move.
The big four reserve currencies—dollar, euro, yen, pound—still account for 87% of reserves. That's down 12 points over three decades, but it's hardly a collapse.
Bottom line: the dollar's dominance has softened at the edges, but its core position remains stable. De-dollarization is real in specific cases, but it's not a sweeping global trend.
Yes, the $USD now makes up 57% of global FX reserves—lowest in 30 years, down 20 points since 1999. Most of that decline? China and Russia.
But here's what matters: between 2015 and 2023, roughly the same number of countries increased their dollar holdings as decreased them. The shift is concentrated among a handful of reserve holders, not a broad global move.
The big four reserve currencies—dollar, euro, yen, pound—still account for 87% of reserves. That's down 12 points over three decades, but it's hardly a collapse.
Bottom line: the dollar's dominance has softened at the edges, but its core position remains stable. De-dollarization is real in specific cases, but it's not a sweeping global trend.
Bank of Japan back at it again, stepping in to prop up the yen.
Same playbook as before. Currency weakness forcing their hand. They burn through reserves trying to slow the slide, but unless they actually shift policy or rates move meaningfully, it's just buying time.
Watch $USDJPY levels closely. If intervention doesn't stick, we'll see another leg down for the yen soon enough.
Same playbook as before. Currency weakness forcing their hand. They burn through reserves trying to slow the slide, but unless they actually shift policy or rates move meaningfully, it's just buying time.
Watch $USDJPY levels closely. If intervention doesn't stick, we'll see another leg down for the yen soon enough.
This month's options expiration is shaping up to be the largest on record.
Massive options expirations can create wild price swings as traders unwind positions. Market makers who've been hedging these contracts will need to adjust their books, which often leads to increased volatility around expiration.
Watch for potential whipsaws in major indices and single stocks with heavy options interest. The real move usually comes after the dust settles and positions get re-established.
Massive options expirations can create wild price swings as traders unwind positions. Market makers who've been hedging these contracts will need to adjust their books, which often leads to increased volatility around expiration.
Watch for potential whipsaws in major indices and single stocks with heavy options interest. The real move usually comes after the dust settles and positions get re-established.

ຢືນຢັນແລ້ວ
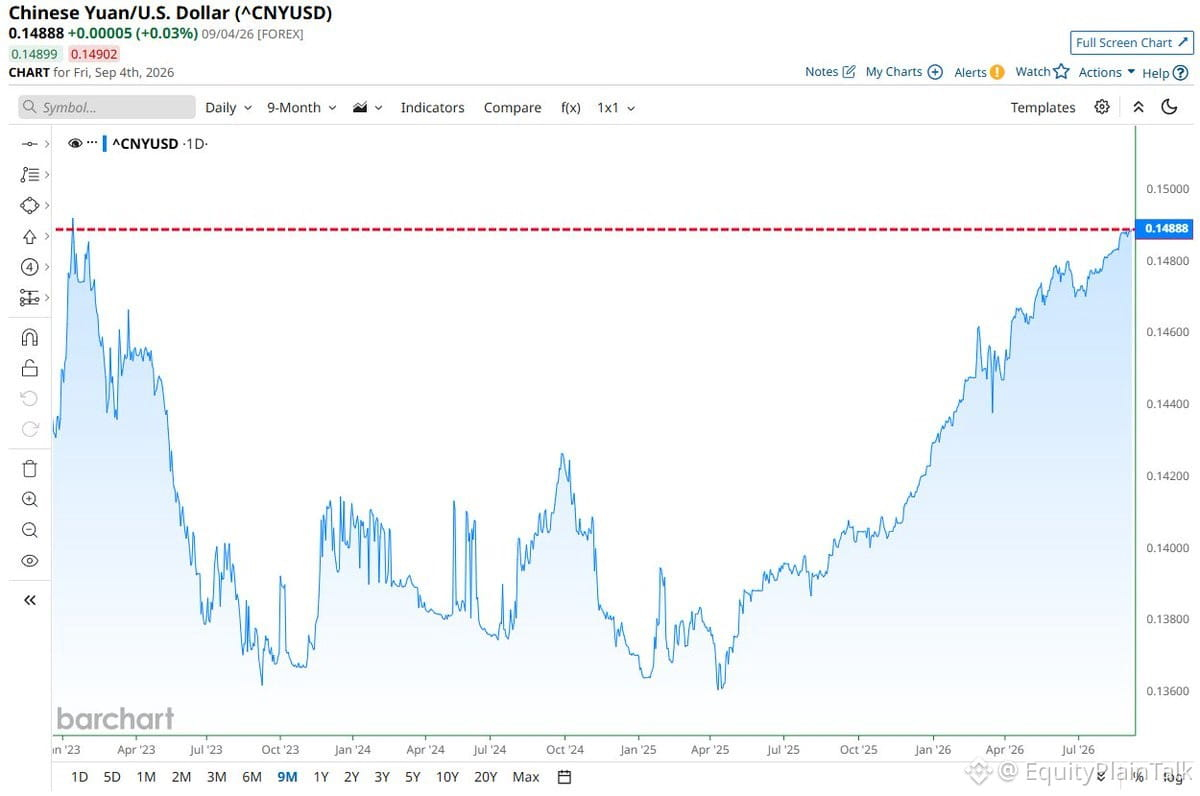
Yuan just hit its strongest level vs the dollar since Jan 2023
This matters for anyone watching exchange rates or moving money between USD and CNY. Stronger yuan means your dollars buy fewer yuan now than they did a few months ago
If you're converting currency or doing cross-border payments, timing actually matters. The yuan's been climbing steadily and this is the firmest it's been in nearly 2 years
Keep an eye on this if you're planning any currency exchange or international transfers soon
This matters for anyone watching exchange rates or moving money between USD and CNY. Stronger yuan means your dollars buy fewer yuan now than they did a few months ago
If you're converting currency or doing cross-border payments, timing actually matters. The yuan's been climbing steadily and this is the firmest it's been in nearly 2 years
Keep an eye on this if you're planning any currency exchange or international transfers soon
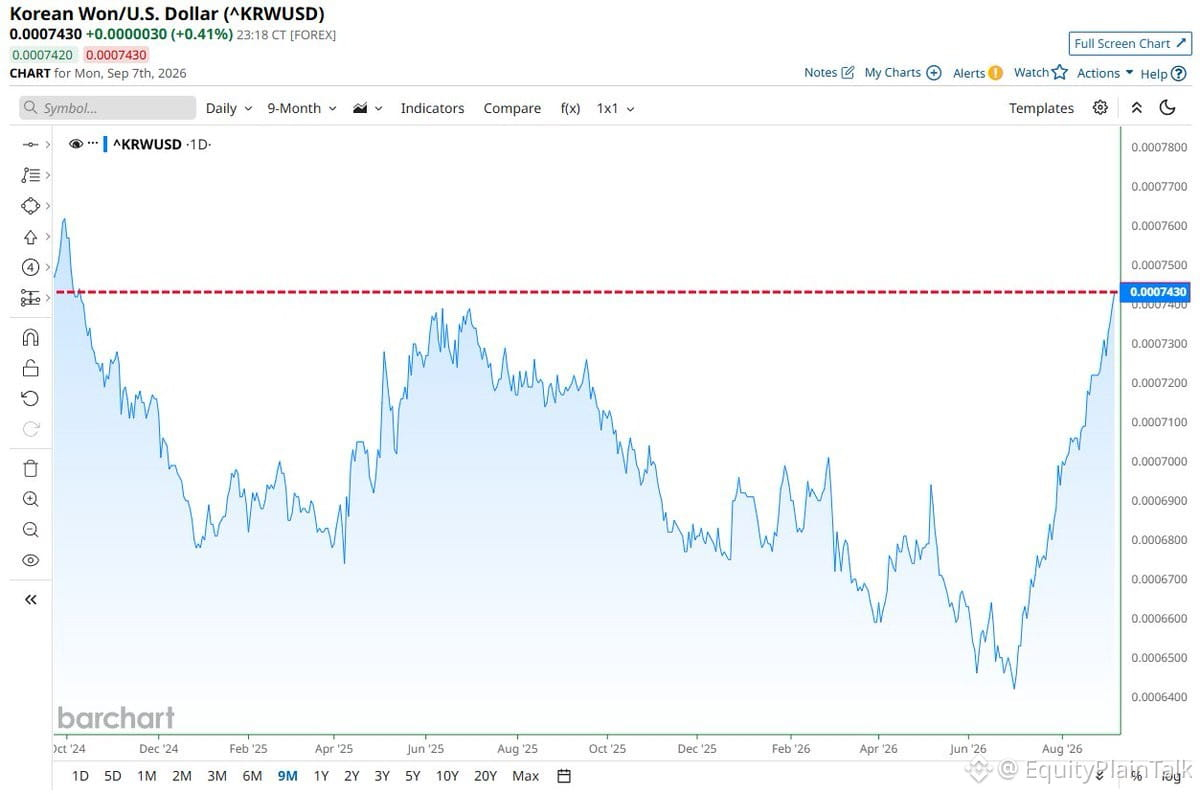
The South Korean Won just hit its strongest level vs the $USD in nearly 2 years.
This matters because:
• Strong won = Korean exports get more expensive (think Samsung, Hyundai)
• Reflects shifting capital flows in Asia
• Often signals dollar weakness or risk-on sentiment
• Watch how Korean tech stocks react to margin pressure
Currency moves like this don't happen in a vacuum. Either the dollar is weakening broadly, or Korea-specific factors (rate differentials, trade flows, political stability) are driving capital inflows.
For U.S. investors: Keep an eye on companies with heavy Korean exposure or competition. A strong won can squeeze margins for Korean exporters but also signals confidence in the region's economy.
This matters because:
• Strong won = Korean exports get more expensive (think Samsung, Hyundai)
• Reflects shifting capital flows in Asia
• Often signals dollar weakness or risk-on sentiment
• Watch how Korean tech stocks react to margin pressure
Currency moves like this don't happen in a vacuum. Either the dollar is weakening broadly, or Korea-specific factors (rate differentials, trade flows, political stability) are driving capital inflows.
For U.S. investors: Keep an eye on companies with heavy Korean exposure or competition. A strong won can squeeze margins for Korean exporters but also signals confidence in the region's economy.
ເປັນຄວາມຈິງບາງສ່ວນ
The job market data is getting messier by the month.
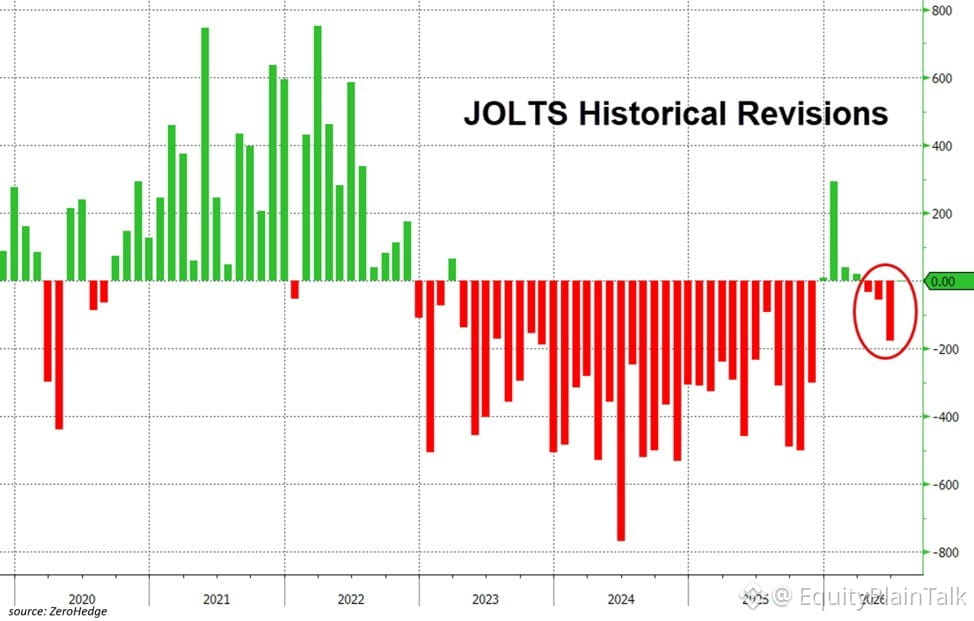
June job openings just got slashed by 177,000 — the biggest single-month downward revision since last November. That's three months in a row of revisions going the wrong way.
But it doesn't stop there:
• Hires revised down 16,000
• Quits revised down 19,000
• Layoffs and discharges revised UP 19,000
Zoom out: Job openings have been revised lower in 38 of the past 43 months. That's not noise. That's a pattern.
The labor market isn't just cooling — the data itself is becoming unreliable in real time. Makes it harder to trust the headline numbers when they first drop.
If you're trading on jobs data or trying to time Fed moves, you're basically flying blind until the revisions hit weeks later. Not ideal.
June job openings just got slashed by 177,000 — the biggest single-month downward revision since last November. That's three months in a row of revisions going the wrong way.
But it doesn't stop there:
• Hires revised down 16,000
• Quits revised down 19,000
• Layoffs and discharges revised UP 19,000
Zoom out: Job openings have been revised lower in 38 of the past 43 months. That's not noise. That's a pattern.
The labor market isn't just cooling — the data itself is becoming unreliable in real time. Makes it harder to trust the headline numbers when they first drop.
If you're trading on jobs data or trying to time Fed moves, you're basically flying blind until the revisions hit weeks later. Not ideal.
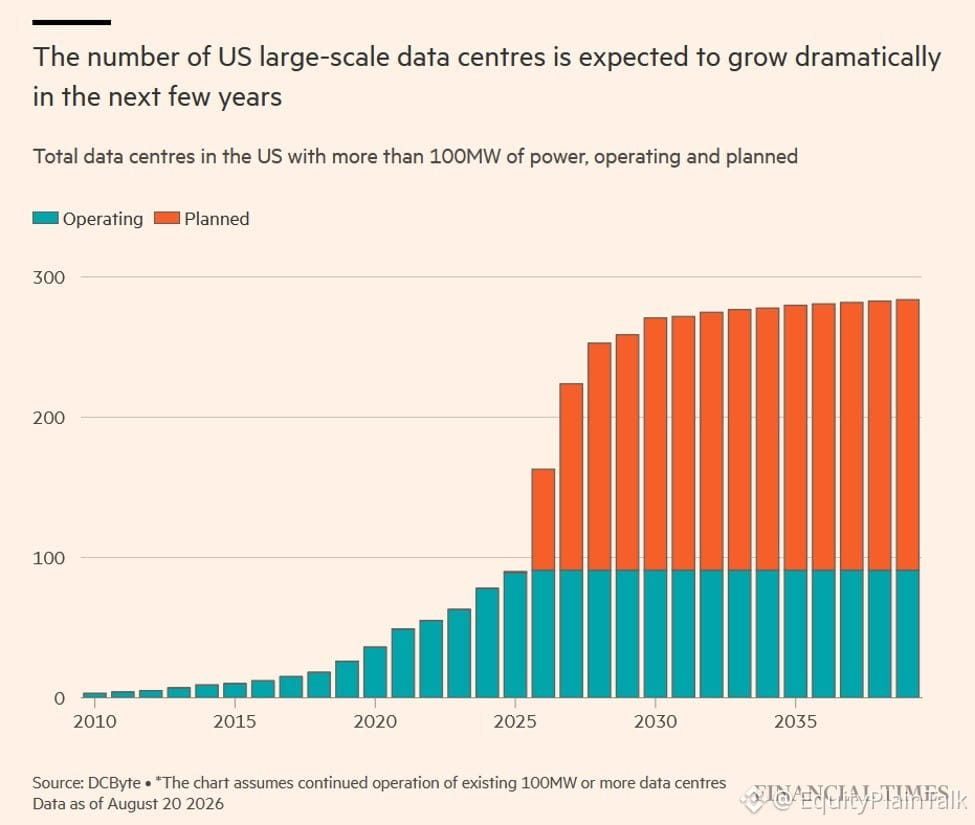
US data centers are exploding. 90 facilities over 100MW now. Could hit 280 by 2030 if all planned projects finish.
Tech spending on data centers: $7 trillion through 2030.
$AMZN $MSFT $GOOGL $META alone have signed $1.5 trillion in leases since AI took off.
This is one of the biggest capex cycles we've seen. Infrastructure spending at this scale usually reshapes markets for years.
Watch the utilities, power grid plays, construction equipment names. Follow the money.
Tech spending on data centers: $7 trillion through 2030.
$AMZN $MSFT $GOOGL $META alone have signed $1.5 trillion in leases since AI took off.
This is one of the biggest capex cycles we've seen. Infrastructure spending at this scale usually reshapes markets for years.
Watch the utilities, power grid plays, construction equipment names. Follow the money.
ເປັນຄວາມຈິງບາງສ່ວນ
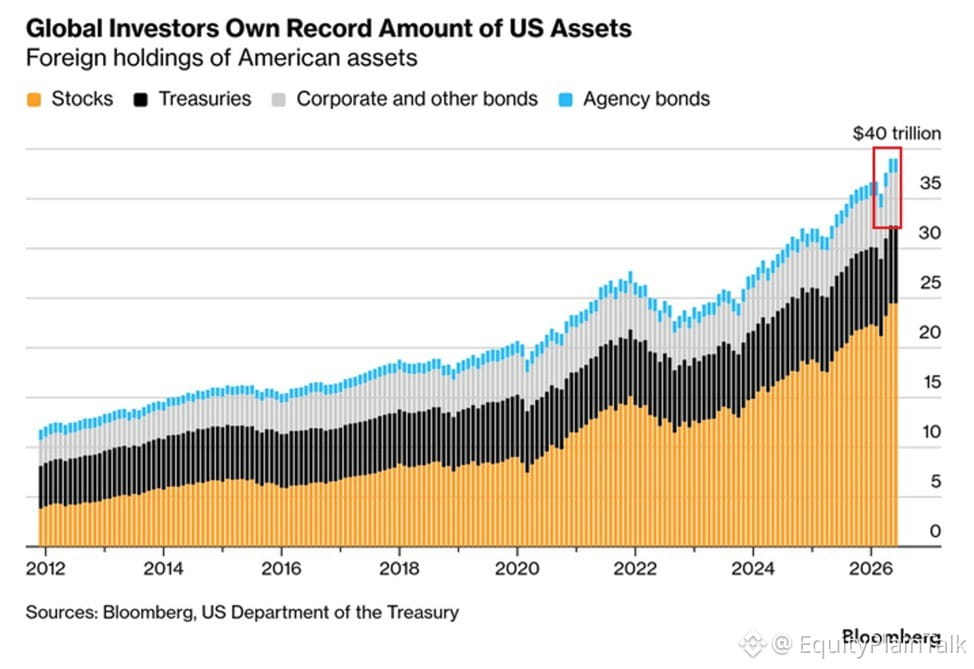
Foreign capital is flooding into U.S. markets at a historic pace.
Overseas investors now hold a record $39 trillion in U.S. equities, Treasuries, corporate bonds, and other assets. That's up $16 trillion—or 70%—since the 2022 bear market lows.
The breakdown:
• U.S. stocks: $24 trillion (62% of total foreign holdings). This has doubled in just over two years.
• Treasuries: $8 trillion (21% of total), up $2 trillion and at an all-time high.
For context, during the 2020 pandemic, foreign holdings of U.S. assets were only around $19 trillion. We've doubled that in less than five years.
What's driving this? The U.S. remains the deepest, most liquid market in the world. Dollar strength, relative economic resilience, and higher yields on Treasuries compared to Europe and Japan make U.S. assets attractive. Tech dominance and AI momentum also pull global capital into American equities.
This inflow supports valuations and provides a cushion during volatility. But it also means U.S. markets are increasingly dependent on foreign appetite. If sentiment shifts—whether due to dollar weakness, geopolitical tensions, or better opportunities elsewhere—the reversal could be sharp.
For now, the trend is clear: the world still wants to own America.
Overseas investors now hold a record $39 trillion in U.S. equities, Treasuries, corporate bonds, and other assets. That's up $16 trillion—or 70%—since the 2022 bear market lows.
The breakdown:
• U.S. stocks: $24 trillion (62% of total foreign holdings). This has doubled in just over two years.
• Treasuries: $8 trillion (21% of total), up $2 trillion and at an all-time high.
For context, during the 2020 pandemic, foreign holdings of U.S. assets were only around $19 trillion. We've doubled that in less than five years.
What's driving this? The U.S. remains the deepest, most liquid market in the world. Dollar strength, relative economic resilience, and higher yields on Treasuries compared to Europe and Japan make U.S. assets attractive. Tech dominance and AI momentum also pull global capital into American equities.
This inflow supports valuations and provides a cushion during volatility. But it also means U.S. markets are increasingly dependent on foreign appetite. If sentiment shifts—whether due to dollar weakness, geopolitical tensions, or better opportunities elsewhere—the reversal could be sharp.
For now, the trend is clear: the world still wants to own America.
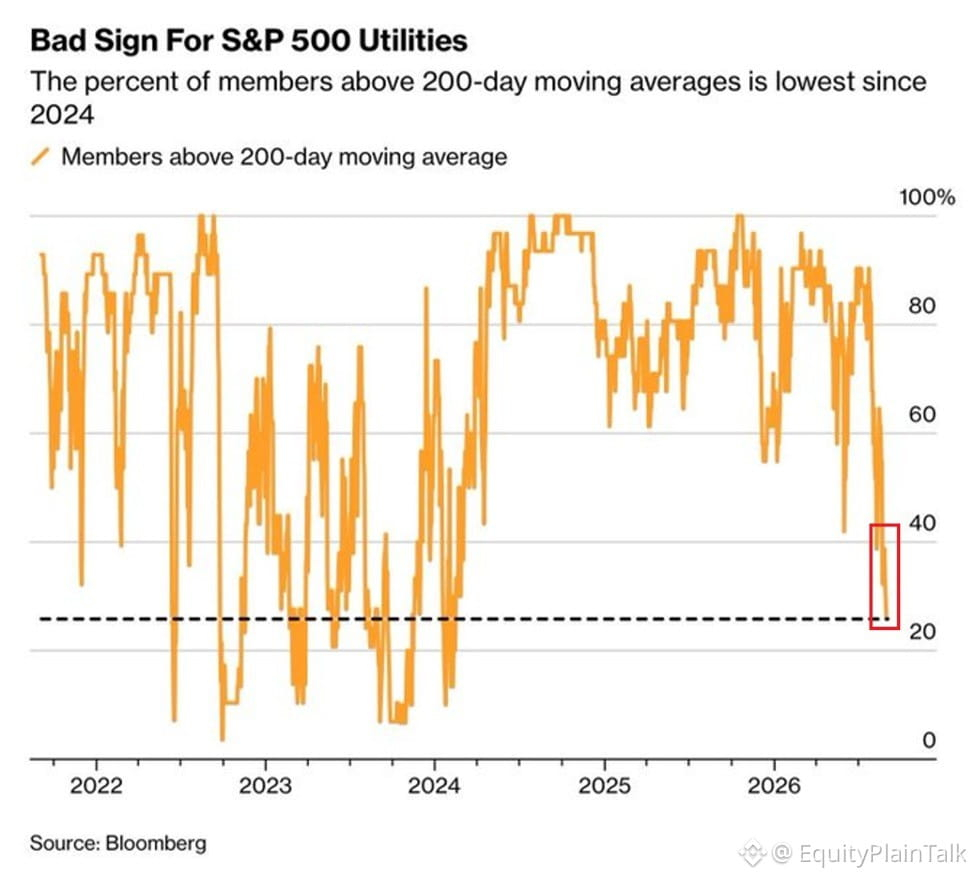
Utilities just hit their most oversold level in over a year.
Only 25% of utility stocks in the $SPX are trading above their 200-day moving average right now. That's the lowest since February 2024. Back in July? It was 90%.
Utilities were crushing it early this year, up 11.5% through February. Now they're barely up 2.3% for the year. On track for their worst performance vs the broader market since 2023.
What changed? Treasury yields.
The 10-year Treasury now yields 1.84 percentage points MORE than the average utility dividend. That spread is near the widest since 2007. When you can get nearly 2% more yield in risk-free Treasuries, why bother with utility dividends?
And it gets worse for the sector. Higher rates mean higher borrowing costs, and utilities are capital-intensive businesses that rely heavily on debt to fund infrastructure.
Defensive stocks are out of favor. Investors aren't hiding in safe havens anymore. They're chasing growth or sitting in cash earning 4%+.
Utilities got left behind.
Only 25% of utility stocks in the $SPX are trading above their 200-day moving average right now. That's the lowest since February 2024. Back in July? It was 90%.
Utilities were crushing it early this year, up 11.5% through February. Now they're barely up 2.3% for the year. On track for their worst performance vs the broader market since 2023.
What changed? Treasury yields.
The 10-year Treasury now yields 1.84 percentage points MORE than the average utility dividend. That spread is near the widest since 2007. When you can get nearly 2% more yield in risk-free Treasuries, why bother with utility dividends?
And it gets worse for the sector. Higher rates mean higher borrowing costs, and utilities are capital-intensive businesses that rely heavily on debt to fund infrastructure.
Defensive stocks are out of favor. Investors aren't hiding in safe havens anymore. They're chasing growth or sitting in cash earning 4%+.
Utilities got left behind.
ເຂົ້າສູ່ລະບົບເພື່ອສຳຫຼວດເນື້ອຫາເພີ່ມເຕີມ