
Mr_Desoza
37.4k ໂພສ

Mr_Desoza
 Square ຢືນຢັນແລ້ວ
ລາຍງານ
ບລັອກຜູ້ໃຊ້
Passionate about the future of decentralized finance and blockchain innovation. Exploring the world of crypto, NFTs, and Web3 technologies $BTC $ETH $BNB $SOL
ເປີດການຊື້ຂາຍ
ຜູ້ຊື້ຂາຍປະຈໍາ
2.7 ປີ
55 ກໍາລັງຕິດຕາມ
35.5K+ ຜູ້ຕິດຕາມ
52.1K+ Liked
ໂພສ
Portfolio
ທັງໝົດ
ວົງຢືມ
ຖ່າຍທອດສົດ
·
--
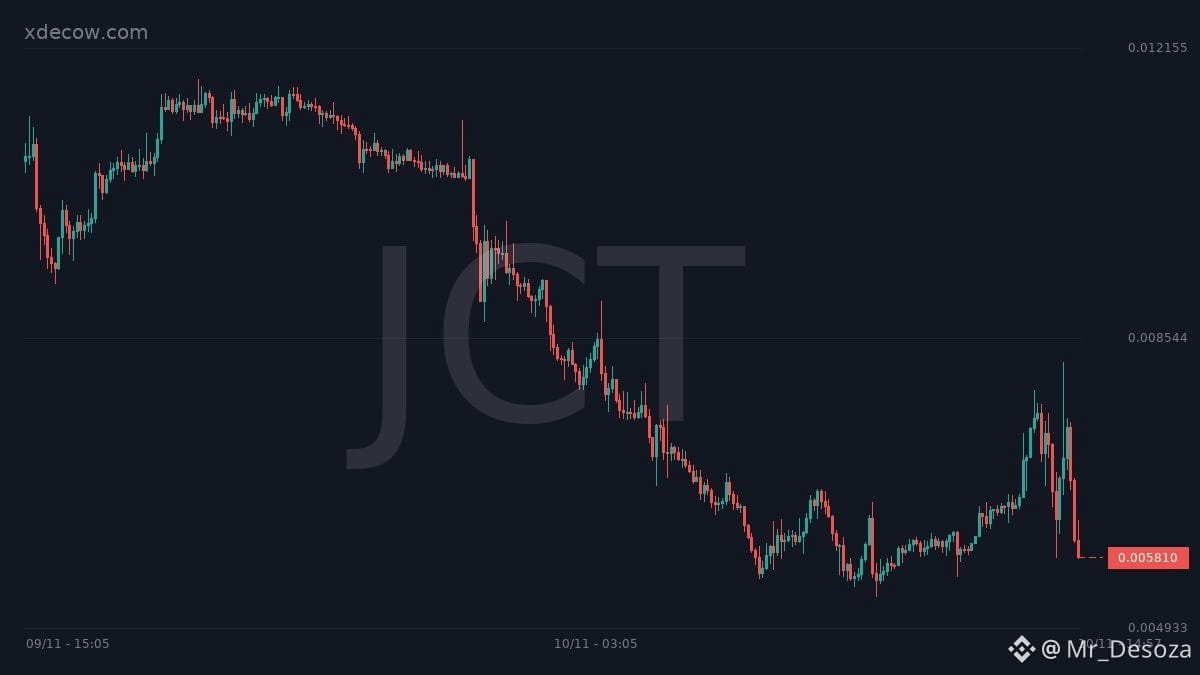
$JCT USDT — MASSIVE SELL-OFF ALERT
JCT is facing another aggressive sell-off, dropping 24.6% in just one hour to $0.005845. Trading volume exploded to $110.1M, up 245.1%, while trade activity surged 233.0%.
Interestingly, Open Interest increased 3.0% despite the sharp price decline. This suggests new positions are entering during the sell-off, potentially adding further volatility. The LSR at 1.22 indicates long-heavy positioning, increasing the risk of additional long liquidations if selling pressure continues.
Direction: SHORT — WAIT FOR RETEST
Current Price: $0.005845
Entry Zone: $0.00610–$0.00640
TP1: $0.00550
TP2: $0.00510
TP3: $0.00460
Stop Loss: $0.00675
Support: $0.00550 / $0.00510 / $0.00460
Resistance: $0.00610 / $0.00640 / $0.00675
Execution Plan: Avoid chasing the massive red candle. Wait for a relief bounce toward the proposed entry zone and bearish rejection before considering a SHORT. A sustained reclaim above $0.00640 would weaken the bearish outlook. A move above $0.00675 invalidates this trade idea.
JCT remains extremely volatile. Protect capital and let price confirm the next move.
Trade smart. Manage risk. Don't chase the dump.
Trade on $JCT
{future}(JCTUSDT)
$JCT USDT — MASSIVE SELL-OFF ALERT
JCT is facing another aggressive sell-off, dropping 24.6% in just one hour to $0.005845. Trading volume exploded to $110.1M, up 245.1%, while trade activity surged 233.0%.
Interestingly, Open Interest increased 3.0% despite the sharp price decline. This suggests new positions are entering during the sell-off, potentially adding further volatility. The LSR at 1.22 indicates long-heavy positioning, increasing the risk of additional long liquidations if selling pressure continues.
Direction: SHORT — WAIT FOR RETEST
Current Price: $0.005845
Entry Zone: $0.00610–$0.00640
TP1: $0.00550
TP2: $0.00510
TP3: $0.00460
Stop Loss: $0.00675
Support: $0.00550 / $0.00510 / $0.00460
Resistance: $0.00610 / $0.00640 / $0.00675
Execution Plan: Avoid chasing the massive red candle. Wait for a relief bounce toward the proposed entry zone and bearish rejection before considering a SHORT. A sustained reclaim above $0.00640 would weaken the bearish outlook. A move above $0.00675 invalidates this trade idea.
JCT remains extremely volatile. Protect capital and let price confirm the next move.
Trade smart. Manage risk. Don't chase the dump.
Trade on $JCT
JCT is facing another aggressive sell-off, dropping 24.6% in just one hour to $0.005845. Trading volume exploded to $110.1M, up 245.1%, while trade activity surged 233.0%.
Interestingly, Open Interest increased 3.0% despite the sharp price decline. This suggests new positions are entering during the sell-off, potentially adding further volatility. The LSR at 1.22 indicates long-heavy positioning, increasing the risk of additional long liquidations if selling pressure continues.
Direction: SHORT — WAIT FOR RETEST
Current Price: $0.005845
Entry Zone: $0.00610–$0.00640
TP1: $0.00550
TP2: $0.00510
TP3: $0.00460
Stop Loss: $0.00675
Support: $0.00550 / $0.00510 / $0.00460
Resistance: $0.00610 / $0.00640 / $0.00675
Execution Plan: Avoid chasing the massive red candle. Wait for a relief bounce toward the proposed entry zone and bearish rejection before considering a SHORT. A sustained reclaim above $0.00640 would weaken the bearish outlook. A move above $0.00675 invalidates this trade idea.
JCT remains extremely volatile. Protect capital and let price confirm the next move.
Trade smart. Manage risk. Don't chase the dump.
Trade on $JCT
492
·
--
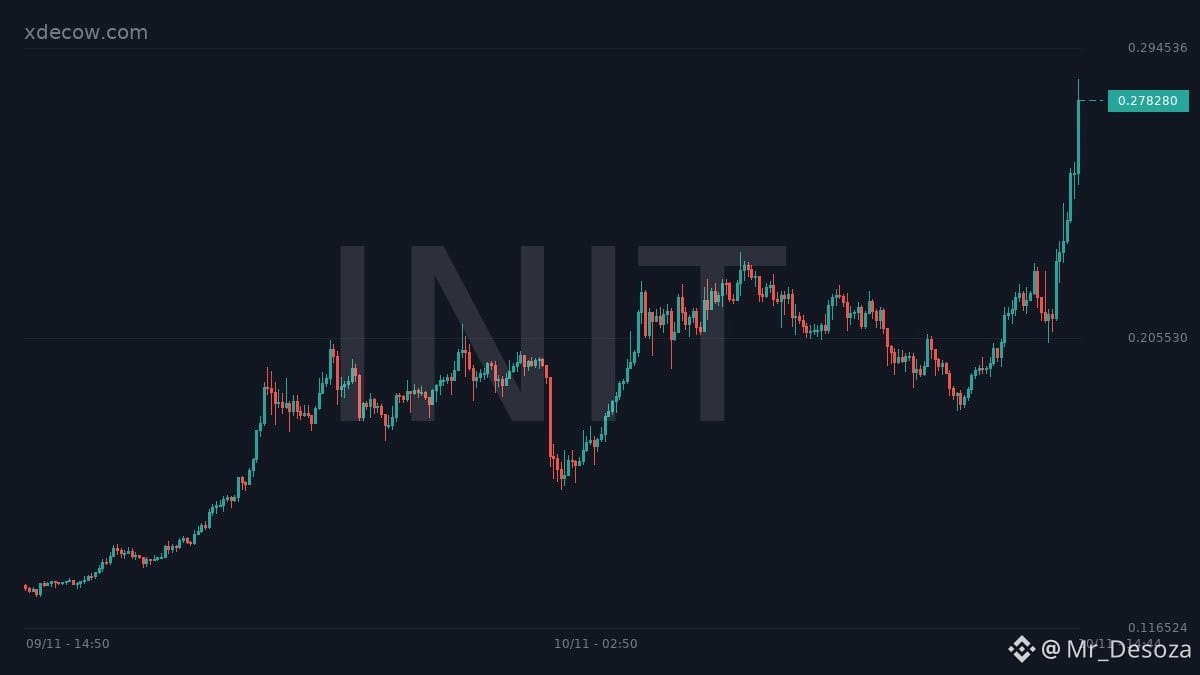
$INIT USDT — MASSIVE BULLISH BREAKOUT ALERT
INIT is showing aggressive bullish momentum, gaining 22.9% in just one hour and reaching $0.2783. Trading volume surged to $122.5M, up 92.2%, while Open Interest increased 5.1%. Trade activity also jumped 117.9%, confirming a major increase in market participation.
The LSR at 0.61 indicates short-heavy positioning, which could create conditions for further upside if buyers maintain control. However, after such a strong rally, a pullback or short-term correction remains possible.
Direction: LONG — PULLBACK ENTRY PREFERRED
Current Price: $0.2783
Entry Zone: $0.2670–$0.2730
TP1: $0.2850
TP2: $0.2980
TP3: $0.3150
Stop Loss: $0.2570
Support: $0.2670 / $0.2570 / $0.2450
Resistance: $0.2850 / $0.2980 / $0.3150
Execution Plan: Avoid chasing the 22.9% pump. Wait for a controlled pullback into the proposed entry zone and bullish confirmation before entering. A sustained breakout above $0.2850 could strengthen the continuation setup. A breakdown below $0.2570 invalidates this trade idea.
Strong volume, rising OI, and short-heavy positioning make INIT worth watching. Let price confirm the next move before committing capital.
Trade smart. Manage risk. Don't chase the pump.
Trade on $INIT
{future}(INITUSDT)
$INIT USDT — MASSIVE BULLISH BREAKOUT ALERT
INIT is showing aggressive bullish momentum, gaining 22.9% in just one hour and reaching $0.2783. Trading volume surged to $122.5M, up 92.2%, while Open Interest increased 5.1%. Trade activity also jumped 117.9%, confirming a major increase in market participation.
The LSR at 0.61 indicates short-heavy positioning, which could create conditions for further upside if buyers maintain control. However, after such a strong rally, a pullback or short-term correction remains possible.
Direction: LONG — PULLBACK ENTRY PREFERRED
Current Price: $0.2783
Entry Zone: $0.2670–$0.2730
TP1: $0.2850
TP2: $0.2980
TP3: $0.3150
Stop Loss: $0.2570
Support: $0.2670 / $0.2570 / $0.2450
Resistance: $0.2850 / $0.2980 / $0.3150
Execution Plan: Avoid chasing the 22.9% pump. Wait for a controlled pullback into the proposed entry zone and bullish confirmation before entering. A sustained breakout above $0.2850 could strengthen the continuation setup. A breakdown below $0.2570 invalidates this trade idea.
Strong volume, rising OI, and short-heavy positioning make INIT worth watching. Let price confirm the next move before committing capital.
Trade smart. Manage risk. Don't chase the pump.
Trade on $INIT
INIT is showing aggressive bullish momentum, gaining 22.9% in just one hour and reaching $0.2783. Trading volume surged to $122.5M, up 92.2%, while Open Interest increased 5.1%. Trade activity also jumped 117.9%, confirming a major increase in market participation.
The LSR at 0.61 indicates short-heavy positioning, which could create conditions for further upside if buyers maintain control. However, after such a strong rally, a pullback or short-term correction remains possible.
Direction: LONG — PULLBACK ENTRY PREFERRED
Current Price: $0.2783
Entry Zone: $0.2670–$0.2730
TP1: $0.2850
TP2: $0.2980
TP3: $0.3150
Stop Loss: $0.2570
Support: $0.2670 / $0.2570 / $0.2450
Resistance: $0.2850 / $0.2980 / $0.3150
Execution Plan: Avoid chasing the 22.9% pump. Wait for a controlled pullback into the proposed entry zone and bullish confirmation before entering. A sustained breakout above $0.2850 could strengthen the continuation setup. A breakdown below $0.2570 invalidates this trade idea.
Strong volume, rising OI, and short-heavy positioning make INIT worth watching. Let price confirm the next move before committing capital.
Trade smart. Manage risk. Don't chase the pump.
Trade on $INIT
345
·
--
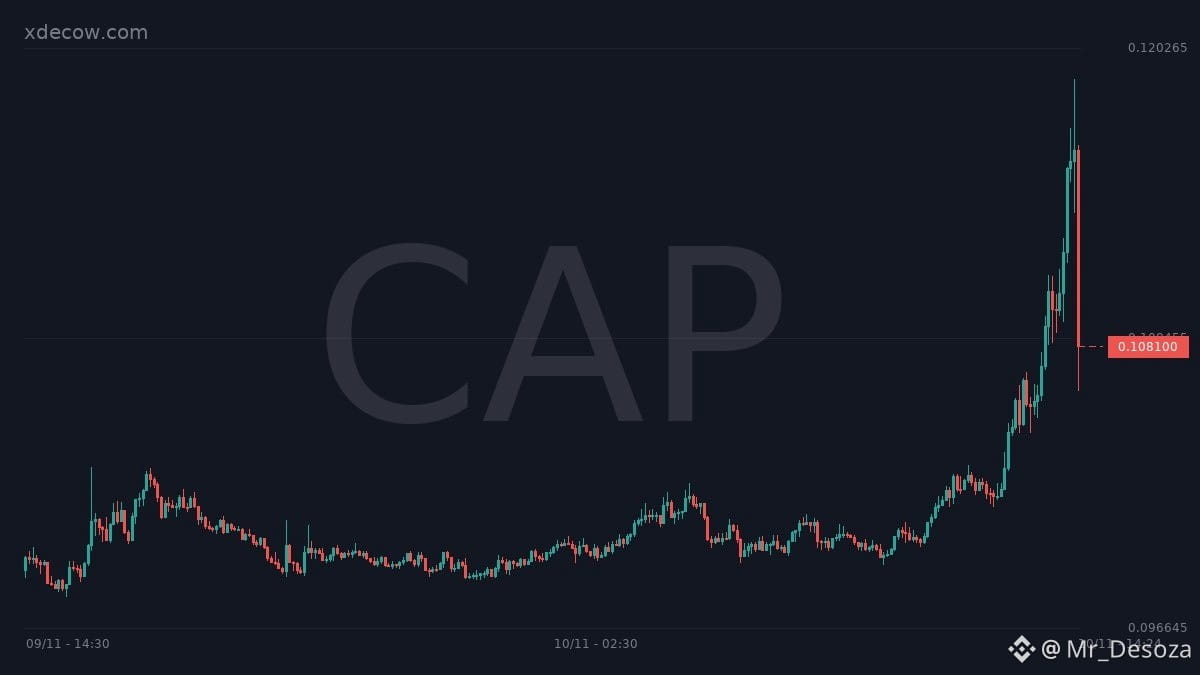
$CAP USDT — EXPLOSIVE VOLUME SPIKE ALERT
CAP is showing a significant increase in market activity! The 30-minute volume has exploded by 30.4x, while price is up 2.0% at $0.1081. Trading volume surged 502.3% to $10.8M, Open Interest increased 2.9%, and trade activity jumped 365.5%.
Rising price, volume, and OI suggest growing market participation. Bulls are gaining attention, but a confirmed breakout is still needed before expecting further upside.
Direction: LONG — PULLBACK ENTRY PREFERRED
Current Price: $0.1081
Entry Zone: $0.1050–$0.1070
TP1: $0.1110
TP2: $0.1150
TP3: $0.1200
Stop Loss: $0.1015
Support: $0.1050 / $0.1015 / $0.0980
Resistance: $0.1110 / $0.1150 / $0.1200
Execution Plan: Avoid chasing the initial volume explosion. Wait for a controlled pullback into the proposed entry zone and confirmation of renewed buying pressure. A strong breakout above $0.1110 could open the way toward higher targets. A breakdown below $0.1015 invalidates this setup.
Volume is exploding and market participation is increasing. The next key signal is whether buyers can turn this activity into sustained upward momentum.
Trade smart. Manage risk. Don't chase the pump.
Trade on $CAP
{future}(CAPUSDT)
$CAP USDT — EXPLOSIVE VOLUME SPIKE ALERT
CAP is showing a significant increase in market activity! The 30-minute volume has exploded by 30.4x, while price is up 2.0% at $0.1081. Trading volume surged 502.3% to $10.8M, Open Interest increased 2.9%, and trade activity jumped 365.5%.
Rising price, volume, and OI suggest growing market participation. Bulls are gaining attention, but a confirmed breakout is still needed before expecting further upside.
Direction: LONG — PULLBACK ENTRY PREFERRED
Current Price: $0.1081
Entry Zone: $0.1050–$0.1070
TP1: $0.1110
TP2: $0.1150
TP3: $0.1200
Stop Loss: $0.1015
Support: $0.1050 / $0.1015 / $0.0980
Resistance: $0.1110 / $0.1150 / $0.1200
Execution Plan: Avoid chasing the initial volume explosion. Wait for a controlled pullback into the proposed entry zone and confirmation of renewed buying pressure. A strong breakout above $0.1110 could open the way toward higher targets. A breakdown below $0.1015 invalidates this setup.
Volume is exploding and market participation is increasing. The next key signal is whether buyers can turn this activity into sustained upward momentum.
Trade smart. Manage risk. Don't chase the pump.
Trade on $CAP
CAP is showing a significant increase in market activity! The 30-minute volume has exploded by 30.4x, while price is up 2.0% at $0.1081. Trading volume surged 502.3% to $10.8M, Open Interest increased 2.9%, and trade activity jumped 365.5%.
Rising price, volume, and OI suggest growing market participation. Bulls are gaining attention, but a confirmed breakout is still needed before expecting further upside.
Direction: LONG — PULLBACK ENTRY PREFERRED
Current Price: $0.1081
Entry Zone: $0.1050–$0.1070
TP1: $0.1110
TP2: $0.1150
TP3: $0.1200
Stop Loss: $0.1015
Support: $0.1050 / $0.1015 / $0.0980
Resistance: $0.1110 / $0.1150 / $0.1200
Execution Plan: Avoid chasing the initial volume explosion. Wait for a controlled pullback into the proposed entry zone and confirmation of renewed buying pressure. A strong breakout above $0.1110 could open the way toward higher targets. A breakdown below $0.1015 invalidates this setup.
Volume is exploding and market participation is increasing. The next key signal is whether buyers can turn this activity into sustained upward momentum.
Trade smart. Manage risk. Don't chase the pump.
Trade on $CAP
254
·
--
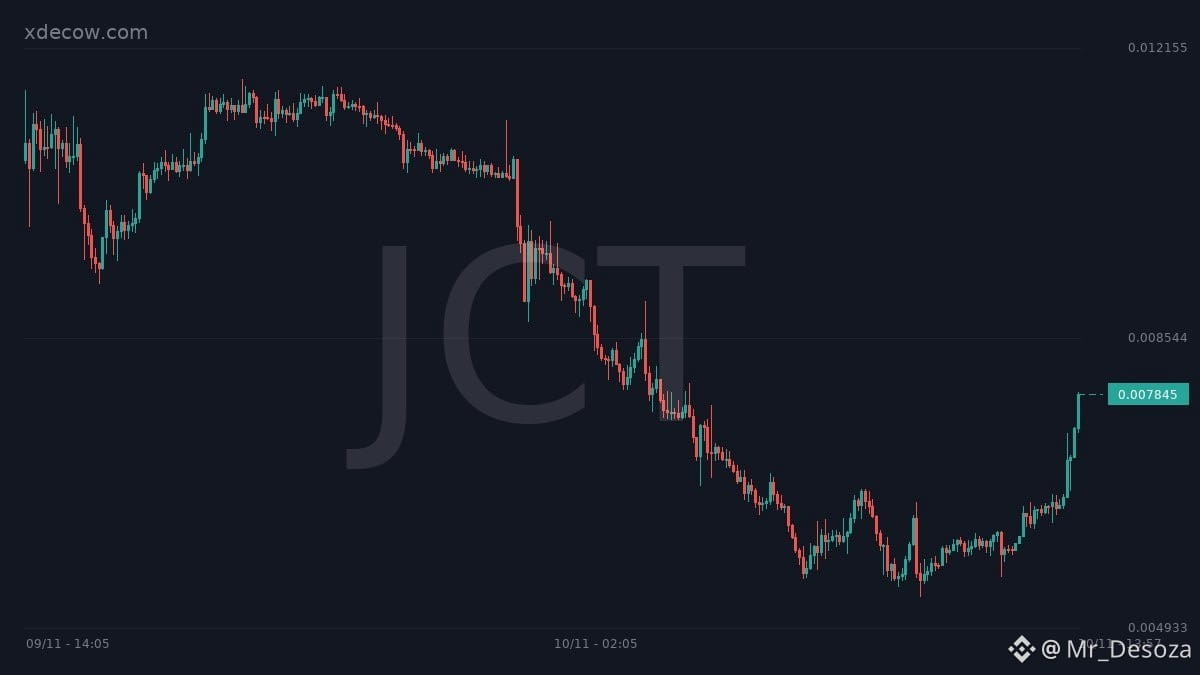
$JCT USDT — STRONG RECOVERY PUMP ALERT
JCT is showing a sharp bullish recovery, gaining 24.4% in just one hour and reaching $0.007845. Trading volume surged to $29.7M, up 38.1%, while trade activity increased 46.4%.
However, Open Interest dropped 2.5%, suggesting the rally may partly be driven by short covering and position closures rather than entirely fresh leveraged longs. Bulls need to prove they can sustain this move.
Direction: LONG — WAIT FOR PULLBACK CONFIRMATION
Current Price: $0.007845
Entry Zone: $0.00740–$0.00760
TP1: $0.00820
TP2: $0.00860
TP3: $0.00920
Stop Loss: $0.00705
Support: $0.00740 / $0.00705 / $0.00670
Resistance: $0.00820 / $0.00860 / $0.00920
Execution Plan: Avoid chasing the 24.4% green candle. Wait for a controlled pullback toward the proposed entry zone and look for a bullish rejection or strong reclaim before entering. Sustained buying above $0.00820 could support further upside. A breakdown below $0.00705 invalidates this setup.
JCT is showing renewed buying activity, but the next move depends on whether buyers can defend the recovery.
Trade smart. Manage risk. Don't chase the pump.
Trade on $JCT
{future}(JCTUSDT)
$JCT USDT — STRONG RECOVERY PUMP ALERT
JCT is showing a sharp bullish recovery, gaining 24.4% in just one hour and reaching $0.007845. Trading volume surged to $29.7M, up 38.1%, while trade activity increased 46.4%.
However, Open Interest dropped 2.5%, suggesting the rally may partly be driven by short covering and position closures rather than entirely fresh leveraged longs. Bulls need to prove they can sustain this move.
Direction: LONG — WAIT FOR PULLBACK CONFIRMATION
Current Price: $0.007845
Entry Zone: $0.00740–$0.00760
TP1: $0.00820
TP2: $0.00860
TP3: $0.00920
Stop Loss: $0.00705
Support: $0.00740 / $0.00705 / $0.00670
Resistance: $0.00820 / $0.00860 / $0.00920
Execution Plan: Avoid chasing the 24.4% green candle. Wait for a controlled pullback toward the proposed entry zone and look for a bullish rejection or strong reclaim before entering. Sustained buying above $0.00820 could support further upside. A breakdown below $0.00705 invalidates this setup.
JCT is showing renewed buying activity, but the next move depends on whether buyers can defend the recovery.
Trade smart. Manage risk. Don't chase the pump.
Trade on $JCT
JCT is showing a sharp bullish recovery, gaining 24.4% in just one hour and reaching $0.007845. Trading volume surged to $29.7M, up 38.1%, while trade activity increased 46.4%.
However, Open Interest dropped 2.5%, suggesting the rally may partly be driven by short covering and position closures rather than entirely fresh leveraged longs. Bulls need to prove they can sustain this move.
Direction: LONG — WAIT FOR PULLBACK CONFIRMATION
Current Price: $0.007845
Entry Zone: $0.00740–$0.00760
TP1: $0.00820
TP2: $0.00860
TP3: $0.00920
Stop Loss: $0.00705
Support: $0.00740 / $0.00705 / $0.00670
Resistance: $0.00820 / $0.00860 / $0.00920
Execution Plan: Avoid chasing the 24.4% green candle. Wait for a controlled pullback toward the proposed entry zone and look for a bullish rejection or strong reclaim before entering. Sustained buying above $0.00820 could support further upside. A breakdown below $0.00705 invalidates this setup.
JCT is showing renewed buying activity, but the next move depends on whether buyers can defend the recovery.
Trade smart. Manage risk. Don't chase the pump.
Trade on $JCT
521
·
--
$GRAM USDT — MASSIVE VOLUME SPIKE ALERT
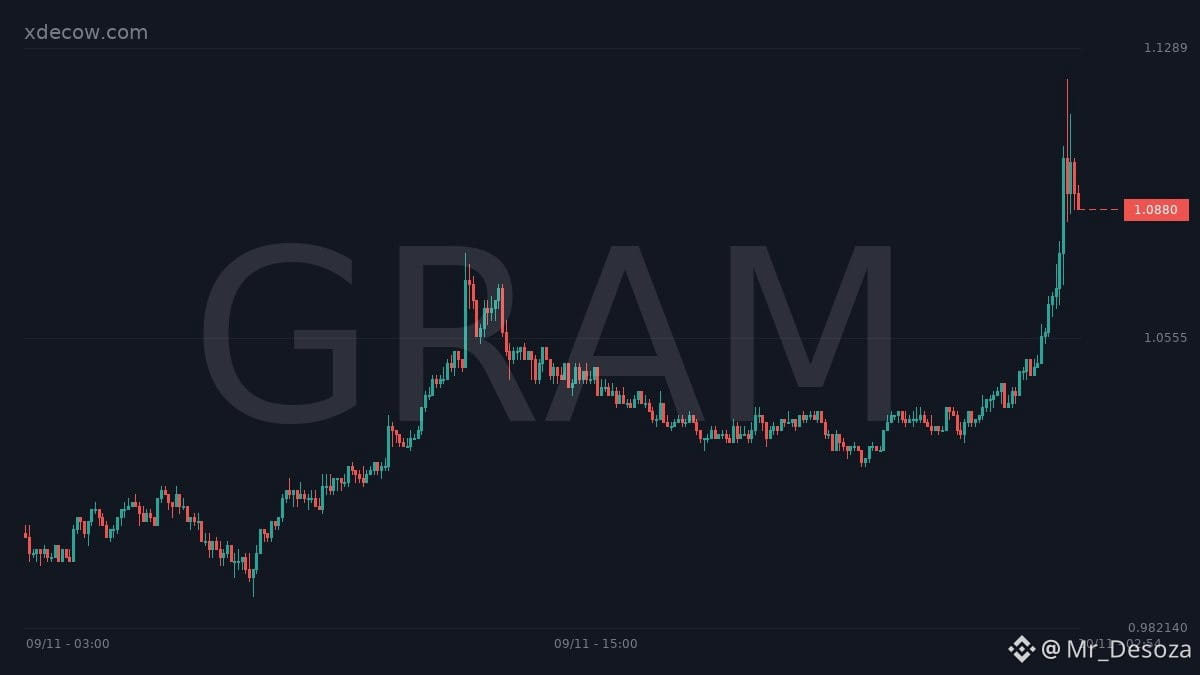
GRAM is attracting significant market attention! Price is up 3.8% to $1.09, while 30-minute volume has exploded by 20.2x. Trading volume surged 1,218.8%, Open Interest increased 12.1%, and trade activity jumped 1,461.4%.
The combination of rising price, volume, and OI suggests growing market participation and potential bullish continuation. However, traders should watch for a pullback before entering.
Direction: LONG — PULLBACK ENTRY PREFERRED
Current Price: $1.09
Entry Zone: $1.05–$1.07
TP1: $1.12
TP2: $1.16
TP3: $1.21
Stop Loss: $1.02
Support: $1.05 / $1.02 / $0.98
Resistance: $1.12 / $1.16 / $1.21
Execution Plan: Avoid chasing the initial volume spike. Wait for a controlled pullback into the proposed entry zone and confirmation of renewed buying pressure. A sustained breakout above $1.12 could open the door toward higher targets. A breakdown below $1.02 invalidates this setup.
Volume is exploding, participation is rising, and bullish momentum is building. The key is catching the right entry, not chasing the move.
Trade smart. Manage risk. Don't chase the pump.
Trade on $GRAM
{future}(GRAMUSDT)
$GRAM USDT — MASSIVE VOLUME SPIKE ALERT
GRAM is attracting significant market attention! Price is up 3.8% to $1.09, while 30-minute volume has exploded by 20.2x. Trading volume surged 1,218.8%, Open Interest increased 12.1%, and trade activity jumped 1,461.4%.
The combination of rising price, volume, and OI suggests growing market participation and potential bullish continuation. However, traders should watch for a pullback before entering.
Direction: LONG — PULLBACK ENTRY PREFERRED
Current Price: $1.09
Entry Zone: $1.05–$1.07
TP1: $1.12
TP2: $1.16
TP3: $1.21
Stop Loss: $1.02
Support: $1.05 / $1.02 / $0.98
Resistance: $1.12 / $1.16 / $1.21
Execution Plan: Avoid chasing the initial volume spike. Wait for a controlled pullback into the proposed entry zone and confirmation of renewed buying pressure. A sustained breakout above $1.12 could open the door toward higher targets. A breakdown below $1.02 invalidates this setup.
Volume is exploding, participation is rising, and bullish momentum is building. The key is catching the right entry, not chasing the move.
Trade smart. Manage risk. Don't chase the pump.
Trade on $GRAM
GRAM is attracting significant market attention! Price is up 3.8% to $1.09, while 30-minute volume has exploded by 20.2x. Trading volume surged 1,218.8%, Open Interest increased 12.1%, and trade activity jumped 1,461.4%.
The combination of rising price, volume, and OI suggests growing market participation and potential bullish continuation. However, traders should watch for a pullback before entering.
Direction: LONG — PULLBACK ENTRY PREFERRED
Current Price: $1.09
Entry Zone: $1.05–$1.07
TP1: $1.12
TP2: $1.16
TP3: $1.21
Stop Loss: $1.02
Support: $1.05 / $1.02 / $0.98
Resistance: $1.12 / $1.16 / $1.21
Execution Plan: Avoid chasing the initial volume spike. Wait for a controlled pullback into the proposed entry zone and confirmation of renewed buying pressure. A sustained breakout above $1.12 could open the door toward higher targets. A breakdown below $1.02 invalidates this setup.
Volume is exploding, participation is rising, and bullish momentum is building. The key is catching the right entry, not chasing the move.
Trade smart. Manage risk. Don't chase the pump.
Trade on $GRAM
1
193
·
--
🚨 $ONDO USDT — MASSIVE VOLUME BREAKOUT ALERT
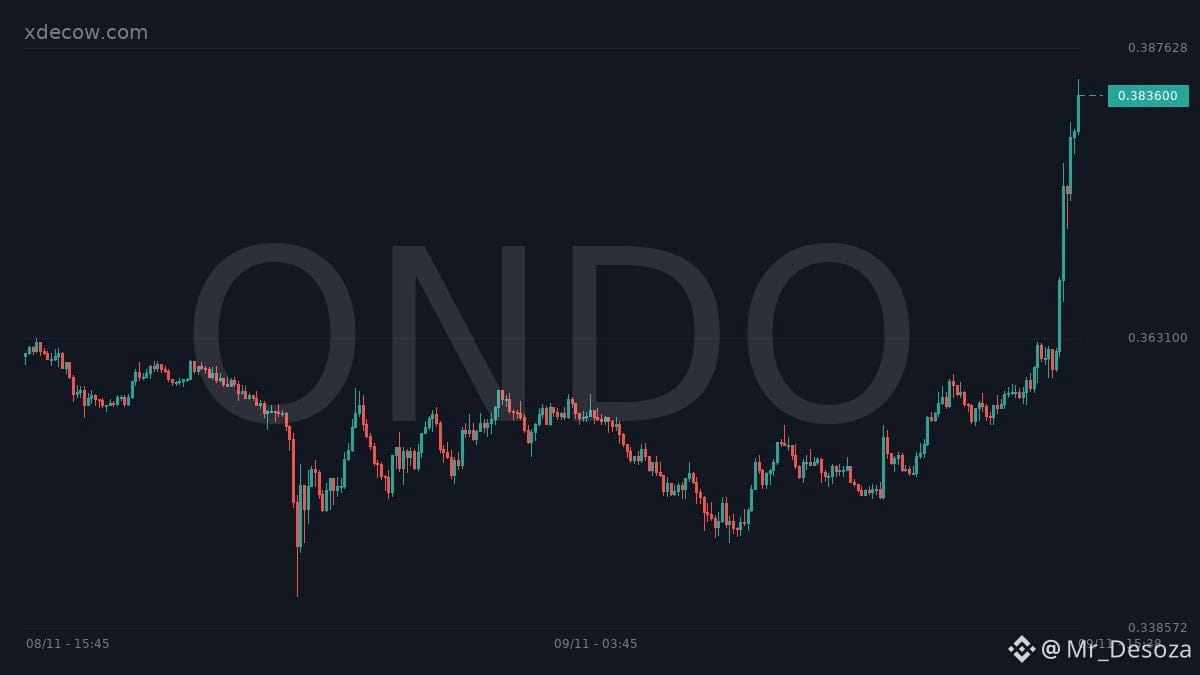
ONDO is showing a significant surge in market activity! Price has climbed 6.8% to $0.3836, while 30-minute volume exploded by 20.1x. Total trading volume increased 1,200.2%, and Open Interest jumped 12.0% to indicate fresh derivatives participation.
The combination of rising price, volume, and OI suggests strengthening bullish momentum. However, traders should watch for a short-term pullback after this aggressive activity spike.
Direction: LONG — PULLBACK ENTRY PREFERRED
Current Price: $0.3836
Entry Zone: $0.3740–$0.3800
TP1: $0.3920
TP2: $0.4050
TP3: $0.4200
Stop Loss: $0.3630
Support: $0.3740 / $0.3630 / $0.3500
Resistance: $0.3920 / $0.4050 / $0.4200
Execution Plan: Avoid chasing the initial volume explosion. Wait for a controlled pullback into the proposed entry zone and confirmation of renewed buying pressure. A sustained move above $0.3920 could strengthen bullish continuation. A breakdown below $0.3630 invalidates this setup.
Volume is expanding, participation is increasing, and bulls have an opportunity — but confirmation matters.
Trade smart. Manage risk. Don't chase the pump.
Trade on $ONDO
{future}(ONDOUSDT)
🚨 $ONDO USDT — MASSIVE VOLUME BREAKOUT ALERT
ONDO is showing a significant surge in market activity! Price has climbed 6.8% to $0.3836, while 30-minute volume exploded by 20.1x. Total trading volume increased 1,200.2%, and Open Interest jumped 12.0% to indicate fresh derivatives participation.
The combination of rising price, volume, and OI suggests strengthening bullish momentum. However, traders should watch for a short-term pullback after this aggressive activity spike.
Direction: LONG — PULLBACK ENTRY PREFERRED
Current Price: $0.3836
Entry Zone: $0.3740–$0.3800
TP1: $0.3920
TP2: $0.4050
TP3: $0.4200
Stop Loss: $0.3630
Support: $0.3740 / $0.3630 / $0.3500
Resistance: $0.3920 / $0.4050 / $0.4200
Execution Plan: Avoid chasing the initial volume explosion. Wait for a controlled pullback into the proposed entry zone and confirmation of renewed buying pressure. A sustained move above $0.3920 could strengthen bullish continuation. A breakdown below $0.3630 invalidates this setup.
Volume is expanding, participation is increasing, and bulls have an opportunity — but confirmation matters.
Trade smart. Manage risk. Don't chase the pump.
Trade on $ONDO
ONDO is showing a significant surge in market activity! Price has climbed 6.8% to $0.3836, while 30-minute volume exploded by 20.1x. Total trading volume increased 1,200.2%, and Open Interest jumped 12.0% to indicate fresh derivatives participation.
The combination of rising price, volume, and OI suggests strengthening bullish momentum. However, traders should watch for a short-term pullback after this aggressive activity spike.
Direction: LONG — PULLBACK ENTRY PREFERRED
Current Price: $0.3836
Entry Zone: $0.3740–$0.3800
TP1: $0.3920
TP2: $0.4050
TP3: $0.4200
Stop Loss: $0.3630
Support: $0.3740 / $0.3630 / $0.3500
Resistance: $0.3920 / $0.4050 / $0.4200
Execution Plan: Avoid chasing the initial volume explosion. Wait for a controlled pullback into the proposed entry zone and confirmation of renewed buying pressure. A sustained move above $0.3920 could strengthen bullish continuation. A breakdown below $0.3630 invalidates this setup.
Volume is expanding, participation is increasing, and bulls have an opportunity — but confirmation matters.
Trade smart. Manage risk. Don't chase the pump.
Trade on $ONDO
105
·
--
$ON USDT — HEAVY SELLING PRESSURE ALERT
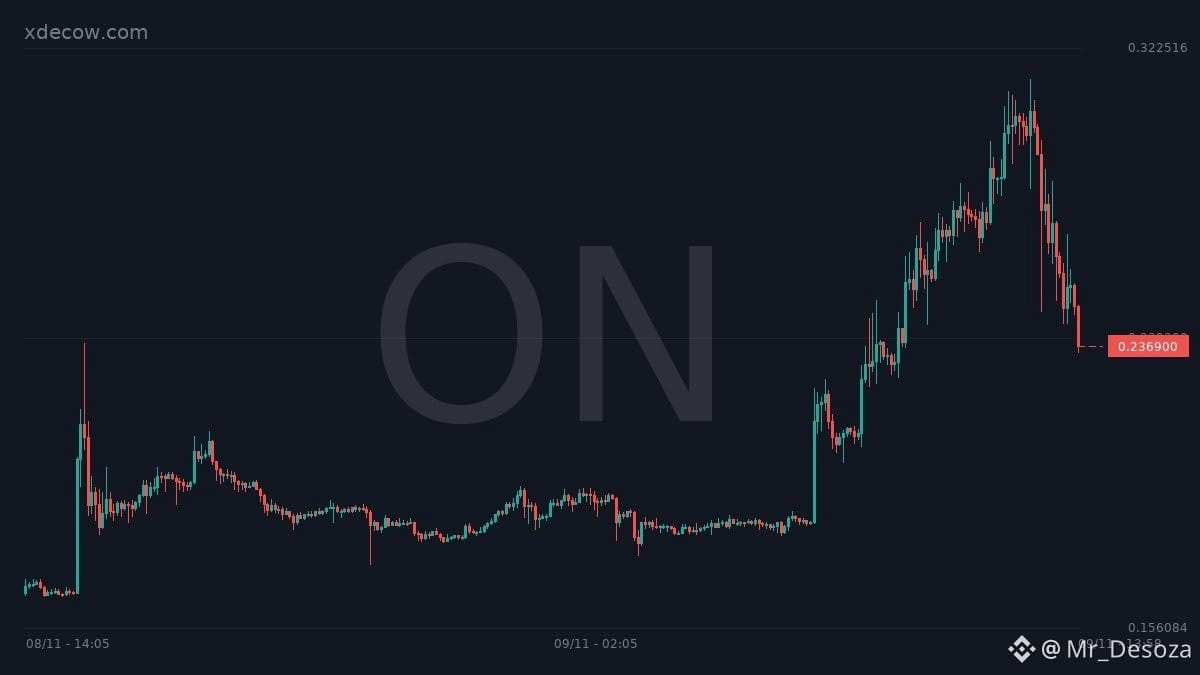
ON is facing aggressive selling pressure after dropping 21.2% in just one hour. Trading volume surged 55.8% to $52.7M, while Open Interest declined 2.7%, indicating positions are being closed during the sell-off. The LSR at 0.92 suggests a slight short-side positioning advantage.
Direction: SHORT — WAIT FOR RETEST
Current Price: $0.2386
Entry Zone: $0.2450–$0.2550
TP1: $0.2300
TP2: $0.2200
TP3: $0.2050
Stop Loss: $0.2650
Support: $0.2300 / $0.2200 / $0.2050
Resistance: $0.2450 / $0.2550 / $0.2650
Execution Plan: Avoid entering after the massive red candle. Wait for a relief bounce into the proposed entry zone and bearish rejection before considering a SHORT. If ON reclaims $0.2550 with strong buying volume, the bearish setup weakens significantly.
Heavy volume confirms increased activity, but falling OI suggests position unwinding rather than clear evidence of aggressive fresh short accumulation.
Trade smart. Manage risk. Don't chase the dump.
Trade on $ON
{future}(ONUSDT)
$ON USDT — HEAVY SELLING PRESSURE ALERT
ON is facing aggressive selling pressure after dropping 21.2% in just one hour. Trading volume surged 55.8% to $52.7M, while Open Interest declined 2.7%, indicating positions are being closed during the sell-off. The LSR at 0.92 suggests a slight short-side positioning advantage.
Direction: SHORT — WAIT FOR RETEST
Current Price: $0.2386
Entry Zone: $0.2450–$0.2550
TP1: $0.2300
TP2: $0.2200
TP3: $0.2050
Stop Loss: $0.2650
Support: $0.2300 / $0.2200 / $0.2050
Resistance: $0.2450 / $0.2550 / $0.2650
Execution Plan: Avoid entering after the massive red candle. Wait for a relief bounce into the proposed entry zone and bearish rejection before considering a SHORT. If ON reclaims $0.2550 with strong buying volume, the bearish setup weakens significantly.
Heavy volume confirms increased activity, but falling OI suggests position unwinding rather than clear evidence of aggressive fresh short accumulation.
Trade smart. Manage risk. Don't chase the dump.
Trade on $ON
ON is facing aggressive selling pressure after dropping 21.2% in just one hour. Trading volume surged 55.8% to $52.7M, while Open Interest declined 2.7%, indicating positions are being closed during the sell-off. The LSR at 0.92 suggests a slight short-side positioning advantage.
Direction: SHORT — WAIT FOR RETEST
Current Price: $0.2386
Entry Zone: $0.2450–$0.2550
TP1: $0.2300
TP2: $0.2200
TP3: $0.2050
Stop Loss: $0.2650
Support: $0.2300 / $0.2200 / $0.2050
Resistance: $0.2450 / $0.2550 / $0.2650
Execution Plan: Avoid entering after the massive red candle. Wait for a relief bounce into the proposed entry zone and bearish rejection before considering a SHORT. If ON reclaims $0.2550 with strong buying volume, the bearish setup weakens significantly.
Heavy volume confirms increased activity, but falling OI suggests position unwinding rather than clear evidence of aggressive fresh short accumulation.
Trade smart. Manage risk. Don't chase the dump.
Trade on $ON
140
·
--
$HANA USDT — EXPLOSIVE VOLUME BREAKOUT ALERT
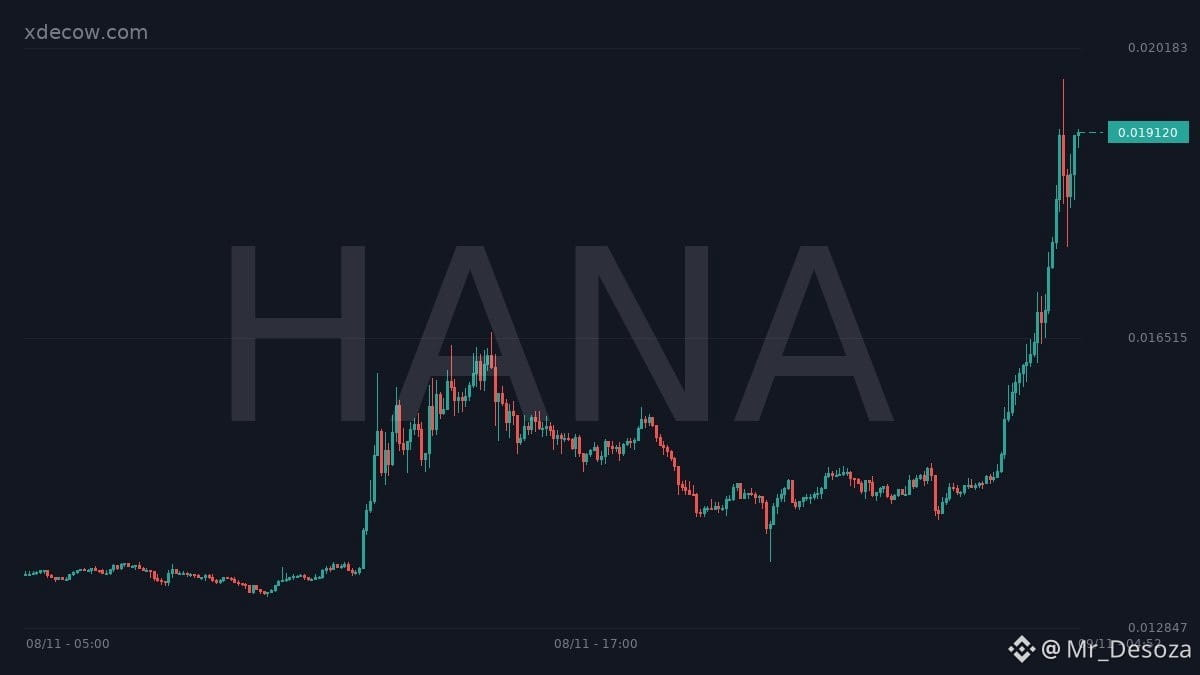
HANA is attracting serious market attention! Price is up 15.3%, while 30-minute volume has exploded by 22.1x. Trading volume increased 276.9%, and Open Interest jumped 10.4%, signaling a significant rise in market participation.
However, the LSR at 2.73 shows long-heavy positioning, increasing the risk of a sudden long squeeze. Bulls need to defend the breakout momentum.
Direction: LONG — PULLBACK ENTRY PREFERRED
Current Price: $0.0191
Entry Zone: $0.0180–$0.0186
TP1: $0.0205
TP2: $0.0220
TP3: $0.0240
Stop Loss: $0.0170
Support: $0.0180 / $0.0170
Resistance: $0.0205 / $0.0220 / $0.0240
Execution Plan: Avoid chasing the initial volume spike. Wait for a pullback into the proposed entry zone and bullish confirmation before entering. Sustained buying pressure could support another upward move, while a breakdown below $0.0170 invalidates this setup.
High volume, rising OI, and strong momentum — but discipline comes first.
Trade smart. Manage risk. Don't chase the pump.
Trade on $HANA
{future}(HANAUSDT)
$HANA USDT — EXPLOSIVE VOLUME BREAKOUT ALERT
HANA is attracting serious market attention! Price is up 15.3%, while 30-minute volume has exploded by 22.1x. Trading volume increased 276.9%, and Open Interest jumped 10.4%, signaling a significant rise in market participation.
However, the LSR at 2.73 shows long-heavy positioning, increasing the risk of a sudden long squeeze. Bulls need to defend the breakout momentum.
Direction: LONG — PULLBACK ENTRY PREFERRED
Current Price: $0.0191
Entry Zone: $0.0180–$0.0186
TP1: $0.0205
TP2: $0.0220
TP3: $0.0240
Stop Loss: $0.0170
Support: $0.0180 / $0.0170
Resistance: $0.0205 / $0.0220 / $0.0240
Execution Plan: Avoid chasing the initial volume spike. Wait for a pullback into the proposed entry zone and bullish confirmation before entering. Sustained buying pressure could support another upward move, while a breakdown below $0.0170 invalidates this setup.
High volume, rising OI, and strong momentum — but discipline comes first.
Trade smart. Manage risk. Don't chase the pump.
Trade on $HANA
HANA is attracting serious market attention! Price is up 15.3%, while 30-minute volume has exploded by 22.1x. Trading volume increased 276.9%, and Open Interest jumped 10.4%, signaling a significant rise in market participation.
However, the LSR at 2.73 shows long-heavy positioning, increasing the risk of a sudden long squeeze. Bulls need to defend the breakout momentum.
Direction: LONG — PULLBACK ENTRY PREFERRED
Current Price: $0.0191
Entry Zone: $0.0180–$0.0186
TP1: $0.0205
TP2: $0.0220
TP3: $0.0240
Stop Loss: $0.0170
Support: $0.0180 / $0.0170
Resistance: $0.0205 / $0.0220 / $0.0240
Execution Plan: Avoid chasing the initial volume spike. Wait for a pullback into the proposed entry zone and bullish confirmation before entering. Sustained buying pressure could support another upward move, while a breakdown below $0.0170 invalidates this setup.
High volume, rising OI, and strong momentum — but discipline comes first.
Trade smart. Manage risk. Don't chase the pump.
Trade on $HANA
150
·
--
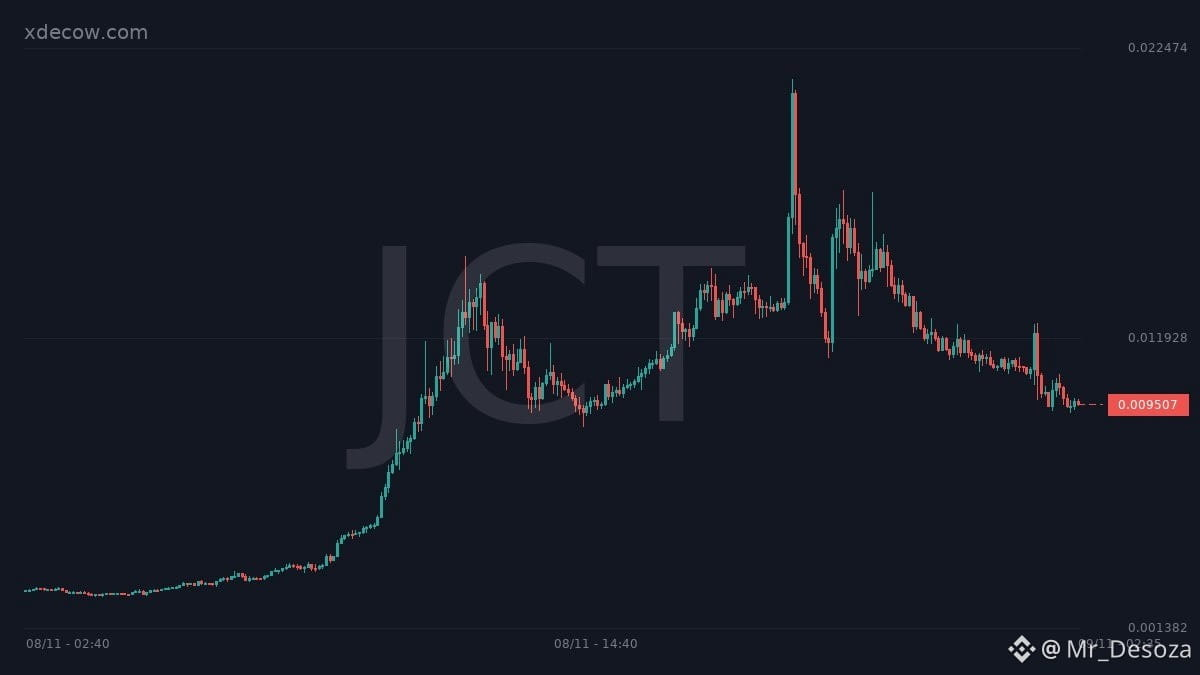
$JCT USDT — HEAVY SELLING PRESSURE
JCT is facing aggressive selling pressure after dropping 21.4% in just one hour. Trading volume surged 86.8% to $64.6M, while Open Interest increased 1.2%, suggesting fresh positions are entering during the decline. The LSR at 0.50 also indicates a derivatives positioning imbalance toward shorts.
Direction: SHORT — WAIT FOR RETEST
Current Price: $0.009507
Entry Zone: $0.00990–$0.01050
TP1: $0.00900
TP2: $0.00850
TP3: $0.00780
Stop Loss: $0.01120
Support: $0.00900 / $0.00850
Resistance: $0.01000 / $0.01080
Execution Plan: Avoid chasing the massive red candle. Wait for a relief bounce toward resistance and look for bearish rejection before considering a SHORT. A strong reclaim above $0.01080 could weaken the bearish setup.
Trade smart. Manage risk. Don't chase the dump.
Trade on $JCT
{future}(JCTUSDT)
$JCT USDT — HEAVY SELLING PRESSURE
JCT is facing aggressive selling pressure after dropping 21.4% in just one hour. Trading volume surged 86.8% to $64.6M, while Open Interest increased 1.2%, suggesting fresh positions are entering during the decline. The LSR at 0.50 also indicates a derivatives positioning imbalance toward shorts.
Direction: SHORT — WAIT FOR RETEST
Current Price: $0.009507
Entry Zone: $0.00990–$0.01050
TP1: $0.00900
TP2: $0.00850
TP3: $0.00780
Stop Loss: $0.01120
Support: $0.00900 / $0.00850
Resistance: $0.01000 / $0.01080
Execution Plan: Avoid chasing the massive red candle. Wait for a relief bounce toward resistance and look for bearish rejection before considering a SHORT. A strong reclaim above $0.01080 could weaken the bearish setup.
Trade smart. Manage risk. Don't chase the dump.
Trade on $JCT
JCT is facing aggressive selling pressure after dropping 21.4% in just one hour. Trading volume surged 86.8% to $64.6M, while Open Interest increased 1.2%, suggesting fresh positions are entering during the decline. The LSR at 0.50 also indicates a derivatives positioning imbalance toward shorts.
Direction: SHORT — WAIT FOR RETEST
Current Price: $0.009507
Entry Zone: $0.00990–$0.01050
TP1: $0.00900
TP2: $0.00850
TP3: $0.00780
Stop Loss: $0.01120
Support: $0.00900 / $0.00850
Resistance: $0.01000 / $0.01080
Execution Plan: Avoid chasing the massive red candle. Wait for a relief bounce toward resistance and look for bearish rejection before considering a SHORT. A strong reclaim above $0.01080 could weaken the bearish setup.
Trade smart. Manage risk. Don't chase the dump.
Trade on $JCT
105
·
--
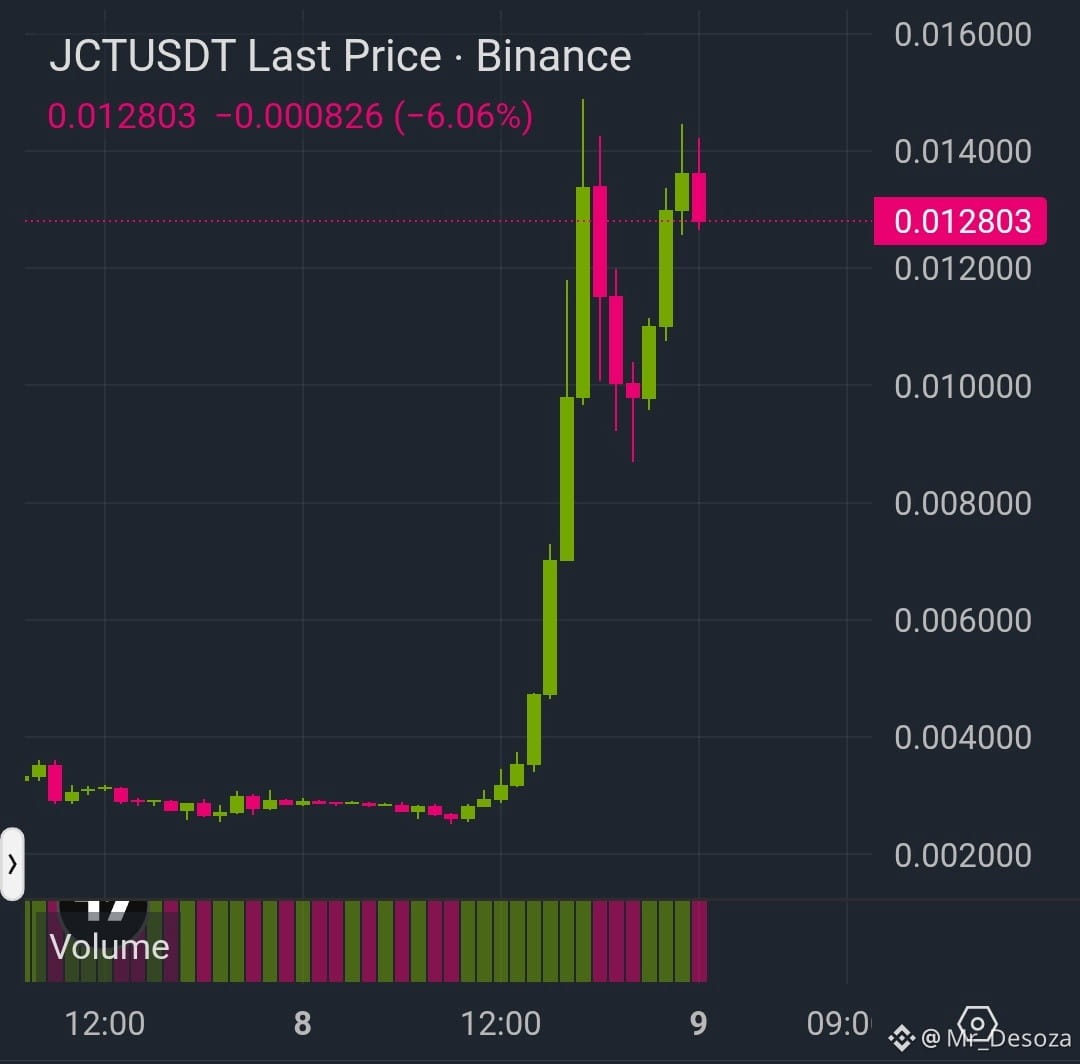
$JCT has experienced a massive bullish breakout from its previous consolidation near 0.0025–0.0035. Price surged toward 0.0145 before experiencing a sharp correction. Buyers stepped back in around 0.0090–0.0100, pushing price toward 0.0140 again. However, the latest candle shows rejection, with price currently trading at 0.012803.
This is a high-volatility market where confirmation is essential.
Current Price: 0.012803 (visible)
Direction: WAIT FOR CONFIRMATION — Potential LONG
Entry Zone: 0.011800–0.012200 (proposed pullback zone)
TP1: 0.013500
TP2: 0.014200
TP3: 0.014800
Stop Loss: 0.011200
Support: 0.012000 / 0.011000 / 0.009500
Resistance: 0.013500 / 0.014000 / 0.014500
Execution Plan: Watch the 0.011800–0.012200 zone for signs of buying pressure. A successful hold followed by a reclaim of 0.013500 would strengthen the bullish continuation setup. If price fails to hold support, avoid forcing a LONG position. A breakdown below 0.011200 invalidates this proposed setup.
$JCT
{future}(JCTUSDT)
$JCT has experienced a massive bullish breakout from its previous consolidation near 0.0025–0.0035. Price surged toward 0.0145 before experiencing a sharp correction. Buyers stepped back in around 0.0090–0.0100, pushing price toward 0.0140 again. However, the latest candle shows rejection, with price currently trading at 0.012803.
This is a high-volatility market where confirmation is essential.
Current Price: 0.012803 (visible)
Direction: WAIT FOR CONFIRMATION — Potential LONG
Entry Zone: 0.011800–0.012200 (proposed pullback zone)
TP1: 0.013500
TP2: 0.014200
TP3: 0.014800
Stop Loss: 0.011200
Support: 0.012000 / 0.011000 / 0.009500
Resistance: 0.013500 / 0.014000 / 0.014500
Execution Plan: Watch the 0.011800–0.012200 zone for signs of buying pressure. A successful hold followed by a reclaim of 0.013500 would strengthen the bullish continuation setup. If price fails to hold support, avoid forcing a LONG position. A breakdown below 0.011200 invalidates this proposed setup.
$JCT
This is a high-volatility market where confirmation is essential.
Current Price: 0.012803 (visible)
Direction: WAIT FOR CONFIRMATION — Potential LONG
Entry Zone: 0.011800–0.012200 (proposed pullback zone)
TP1: 0.013500
TP2: 0.014200
TP3: 0.014800
Stop Loss: 0.011200
Support: 0.012000 / 0.011000 / 0.009500
Resistance: 0.013500 / 0.014000 / 0.014500
Execution Plan: Watch the 0.011800–0.012200 zone for signs of buying pressure. A successful hold followed by a reclaim of 0.013500 would strengthen the bullish continuation setup. If price fails to hold support, avoid forcing a LONG position. A breakdown below 0.011200 invalidates this proposed setup.
$JCT
40
·
--
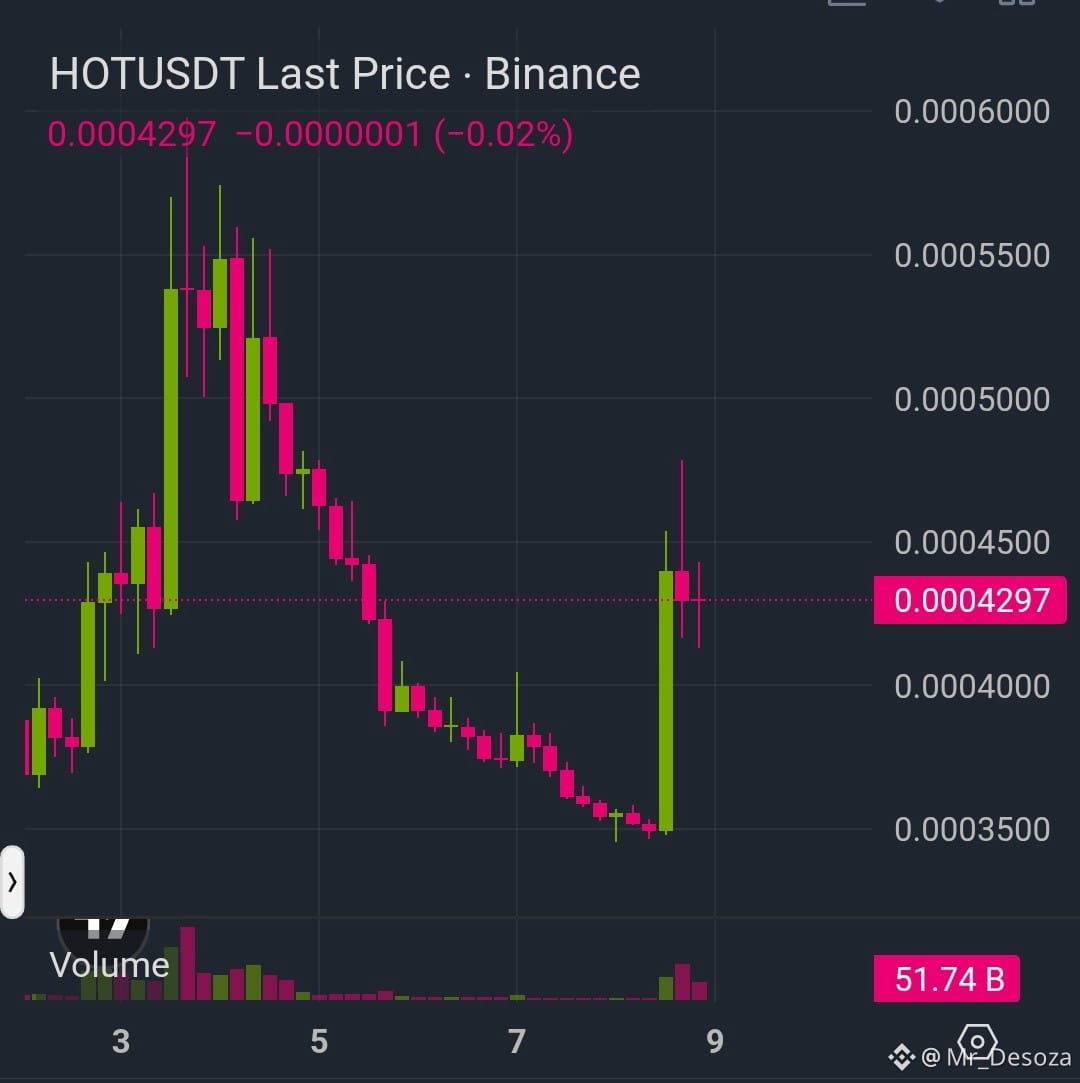
$HOT is attempting a bullish reversal after an extended decline. Price bounced strongly from the 0.000350 area toward 0.000450, accompanied by a noticeable volume spike. However, sellers have appeared near resistance, and the latest candles show some rejection around 0.000430.
Current Price: 0.0004297 (visible)
Direction: WAIT FOR CONFIRMATION — Potential LONG
Entry Zone: 0.0004150–0.0004250 (proposed pullback entry)
TP1: 0.0004550
TP2: 0.0004800
TP3: 0.0005000
Stop Loss: 0.0003970
Support: 0.0004200 / 0.0004000 / 0.0003500
Resistance: 0.0004400 / 0.0004550 / 0.0004800
Execution Plan: Watch how HOT reacts around 0.0004150–0.0004250. A bullish rejection followed by a strong move above 0.0004400 would improve the LONG setup. Avoid entering while price remains trapped below resistance. A breakdown below 0.0003970 invalidates this proposed setup.
$HOT
{future}(HOTUSDT)
$HOT is attempting a bullish reversal after an extended decline. Price bounced strongly from the 0.000350 area toward 0.000450, accompanied by a noticeable volume spike. However, sellers have appeared near resistance, and the latest candles show some rejection around 0.000430.
Current Price: 0.0004297 (visible)
Direction: WAIT FOR CONFIRMATION — Potential LONG
Entry Zone: 0.0004150–0.0004250 (proposed pullback entry)
TP1: 0.0004550
TP2: 0.0004800
TP3: 0.0005000
Stop Loss: 0.0003970
Support: 0.0004200 / 0.0004000 / 0.0003500
Resistance: 0.0004400 / 0.0004550 / 0.0004800
Execution Plan: Watch how HOT reacts around 0.0004150–0.0004250. A bullish rejection followed by a strong move above 0.0004400 would improve the LONG setup. Avoid entering while price remains trapped below resistance. A breakdown below 0.0003970 invalidates this proposed setup.
$HOT
Current Price: 0.0004297 (visible)
Direction: WAIT FOR CONFIRMATION — Potential LONG
Entry Zone: 0.0004150–0.0004250 (proposed pullback entry)
TP1: 0.0004550
TP2: 0.0004800
TP3: 0.0005000
Stop Loss: 0.0003970
Support: 0.0004200 / 0.0004000 / 0.0003500
Resistance: 0.0004400 / 0.0004550 / 0.0004800
Execution Plan: Watch how HOT reacts around 0.0004150–0.0004250. A bullish rejection followed by a strong move above 0.0004400 would improve the LONG setup. Avoid entering while price remains trapped below resistance. A breakdown below 0.0003970 invalidates this proposed setup.
$HOT
48
·
--
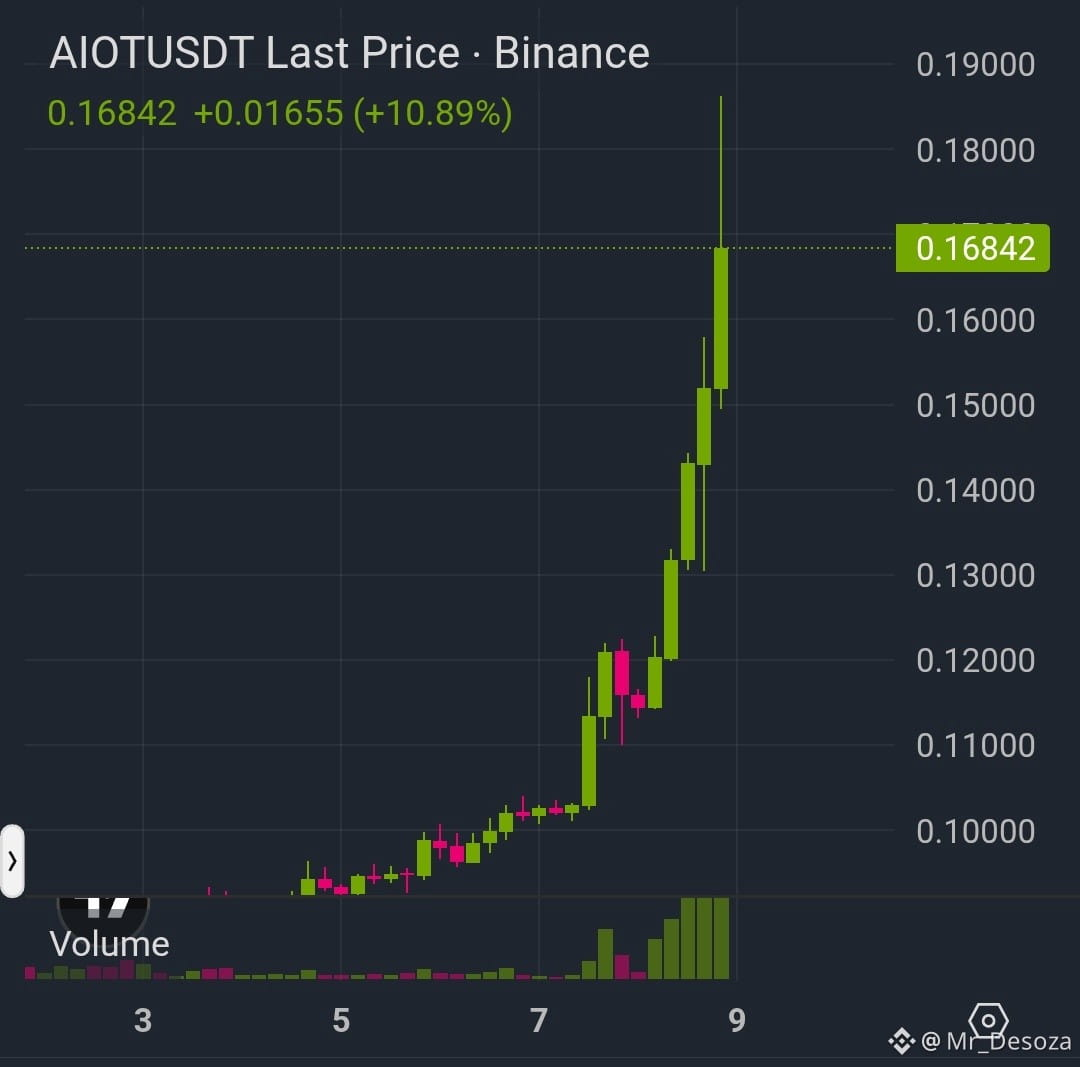
$AIOT is showing an impressive bullish expansion with consecutive green candles and increasing volume. Price has climbed from approximately 0.095 toward 0.16842, with a recent spike reaching approximately 0.186. Momentum is strong, but the upper wick signals potential profit-taking. Chasing at current levels carries elevated risk.
Current Price: 0.16842 (visible)
Direction: LONG — Only after pullback confirmation
Entry Zone: 0.15000–0.15600 (proposed retest zone)
TP1: 0.18000
TP2: 0.18600
TP3: 0.20000
Stop Loss: 0.14300
Support: 0.15000 / 0.14000 / 0.13000
Resistance: 0.18000 / 0.18600 / 0.19000
Execution Plan: AIOT has strong upside momentum, but the latest rally is extended. Wait for a controlled pullback toward 0.15000–0.15600 and look for bullish confirmation before entering. A sustained move above 0.18000 could open the way toward 0.18600 and potentially 0.20000. Losing 0.14300 invalidates this proposed LONG setup.
Don't chase the pump. Wait for the retest.
Trade smart. Manage risk.
$AIOT
{future}(AIOTUSDT)
$AIOT is showing an impressive bullish expansion with consecutive green candles and increasing volume. Price has climbed from approximately 0.095 toward 0.16842, with a recent spike reaching approximately 0.186. Momentum is strong, but the upper wick signals potential profit-taking. Chasing at current levels carries elevated risk.
Current Price: 0.16842 (visible)
Direction: LONG — Only after pullback confirmation
Entry Zone: 0.15000–0.15600 (proposed retest zone)
TP1: 0.18000
TP2: 0.18600
TP3: 0.20000
Stop Loss: 0.14300
Support: 0.15000 / 0.14000 / 0.13000
Resistance: 0.18000 / 0.18600 / 0.19000
Execution Plan: AIOT has strong upside momentum, but the latest rally is extended. Wait for a controlled pullback toward 0.15000–0.15600 and look for bullish confirmation before entering. A sustained move above 0.18000 could open the way toward 0.18600 and potentially 0.20000. Losing 0.14300 invalidates this proposed LONG setup.
Don't chase the pump. Wait for the retest.
Trade smart. Manage risk.
$AIOT
Current Price: 0.16842 (visible)
Direction: LONG — Only after pullback confirmation
Entry Zone: 0.15000–0.15600 (proposed retest zone)
TP1: 0.18000
TP2: 0.18600
TP3: 0.20000
Stop Loss: 0.14300
Support: 0.15000 / 0.14000 / 0.13000
Resistance: 0.18000 / 0.18600 / 0.19000
Execution Plan: AIOT has strong upside momentum, but the latest rally is extended. Wait for a controlled pullback toward 0.15000–0.15600 and look for bullish confirmation before entering. A sustained move above 0.18000 could open the way toward 0.18600 and potentially 0.20000. Losing 0.14300 invalidates this proposed LONG setup.
Don't chase the pump. Wait for the retest.
Trade smart. Manage risk.
$AIOT
111
·
--
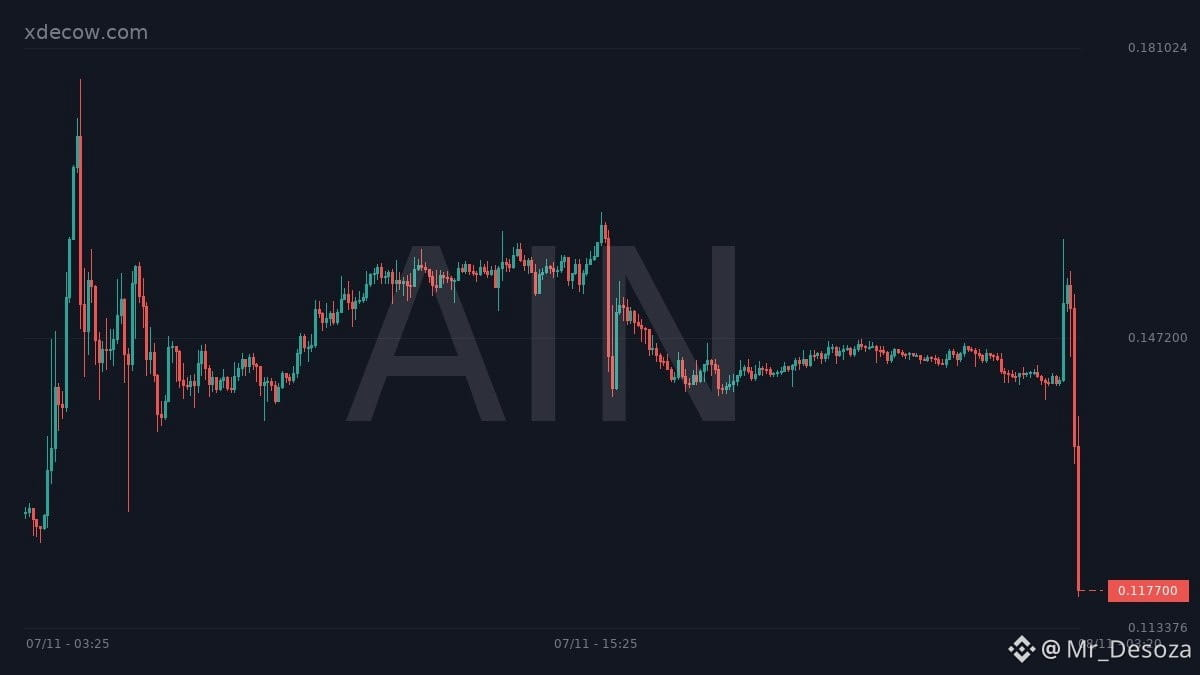
$AIN – HEAVY BEARISH PRESSURE | VIP TRADING SIGNAL
AIN is facing significant selling pressure, dropping 17.8% in just one hour as trading activity and volume surge sharply.
SHORT SETUP
Entry Range: $0.1185 – $0.1210
TP1: $0.1150
TP2: $0.1110
Final Target: $0.1060
Stop Loss: $0.1245
Market Analysis:
AIN is trading at $0.1177 after a sharp 17.8% decline. Trading volume surged 566.6%, while transactions jumped 517.1%, highlighting intense market activity during the sell-off.
Open Interest dropped by $752.7K (-4.1%), suggesting leveraged positions are being closed and possible long liquidations. The Long/Short Ratio at 1.00 indicates a relatively balanced positioning environment.
The $0.1185–$0.1210 zone is the key recovery resistance. A rejection could extend bearish momentum, while a strong reclaim above $0.1245 would invalidate this short setup.
⚠️ Wait for confirmation before entering. Avoid chasing the dump and manage leverage carefully.
Trade on $AIN
{future}(AINUSDT)
$AIN – HEAVY BEARISH PRESSURE | VIP TRADING SIGNAL
AIN is facing significant selling pressure, dropping 17.8% in just one hour as trading activity and volume surge sharply.
SHORT SETUP
Entry Range: $0.1185 – $0.1210
TP1: $0.1150
TP2: $0.1110
Final Target: $0.1060
Stop Loss: $0.1245
Market Analysis:
AIN is trading at $0.1177 after a sharp 17.8% decline. Trading volume surged 566.6%, while transactions jumped 517.1%, highlighting intense market activity during the sell-off.
Open Interest dropped by $752.7K (-4.1%), suggesting leveraged positions are being closed and possible long liquidations. The Long/Short Ratio at 1.00 indicates a relatively balanced positioning environment.
The $0.1185–$0.1210 zone is the key recovery resistance. A rejection could extend bearish momentum, while a strong reclaim above $0.1245 would invalidate this short setup.
⚠️ Wait for confirmation before entering. Avoid chasing the dump and manage leverage carefully.
Trade on $AIN
AIN is facing significant selling pressure, dropping 17.8% in just one hour as trading activity and volume surge sharply.
SHORT SETUP
Entry Range: $0.1185 – $0.1210
TP1: $0.1150
TP2: $0.1110
Final Target: $0.1060
Stop Loss: $0.1245
Market Analysis:
AIN is trading at $0.1177 after a sharp 17.8% decline. Trading volume surged 566.6%, while transactions jumped 517.1%, highlighting intense market activity during the sell-off.
Open Interest dropped by $752.7K (-4.1%), suggesting leveraged positions are being closed and possible long liquidations. The Long/Short Ratio at 1.00 indicates a relatively balanced positioning environment.
The $0.1185–$0.1210 zone is the key recovery resistance. A rejection could extend bearish momentum, while a strong reclaim above $0.1245 would invalidate this short setup.
⚠️ Wait for confirmation before entering. Avoid chasing the dump and manage leverage carefully.
Trade on $AIN
158
·
--
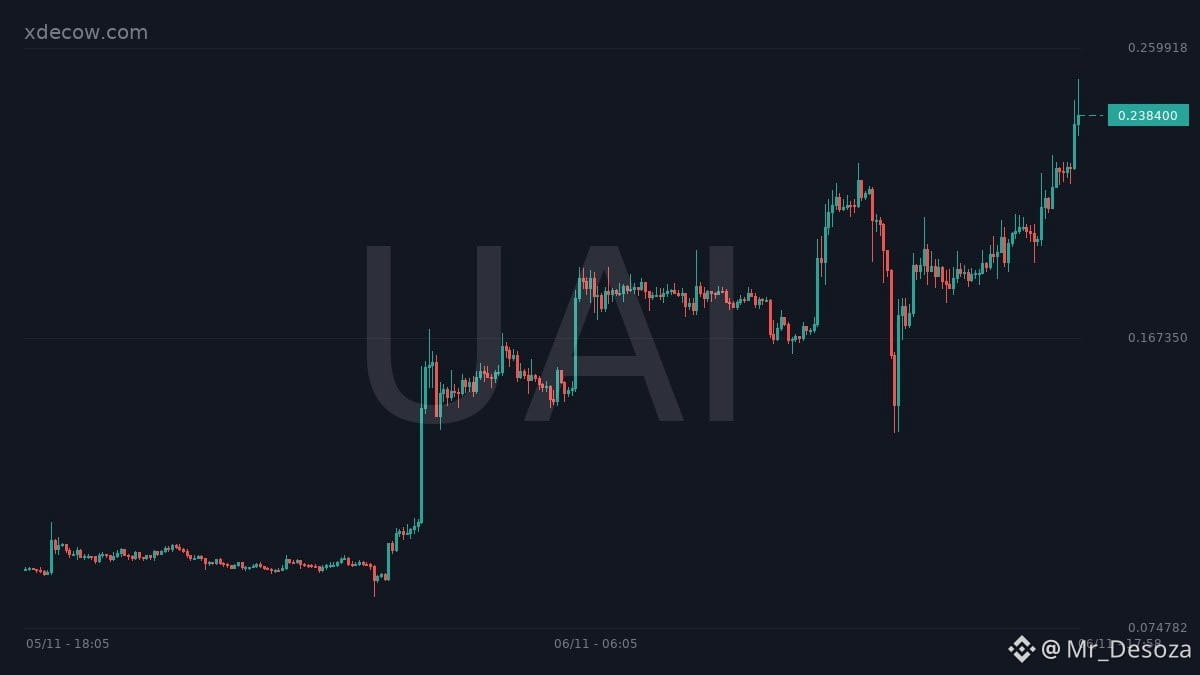
$UAI – STRONG BULLISH REVERSAL | VIP TRADING SIGNAL
UAI is showing a powerful recovery, surging 20.4% in just one hour with rising volume and increased market participation.
🟢 LONG SETUP
- Entry Range: $0.2340 – $0.2390
- TP1: $0.2450
- TP2: $0.2530
- Final Target: $0.2650
- Stop Loss: $0.2260
Market Analysis:
UAI is trading at $0.2386, up 20.4%. Trading volume increased 52.5% to an additional $33.2M, while trades jumped 71%.
Open Interest rose 4.0%, adding $622.3K, suggesting fresh positions are entering the market. However, the Long/Short Ratio stands at 0.61, indicating short-heavy positioning and potential short-squeeze conditions if buying pressure continues.
The $0.2390–$0.2450 zone is the immediate resistance. A confirmed breakout with sustained volume could open the way toward $0.2530 and $0.2650. Losing $0.2340 could weaken the bullish setup.
⚠️ Wait for confirmation before entering. Avoid chasing the pump and manage leverage carefully.
Trade on $UAI
{future}(UAIUSDT)
$UAI – STRONG BULLISH REVERSAL | VIP TRADING SIGNAL
UAI is showing a powerful recovery, surging 20.4% in just one hour with rising volume and increased market participation.
🟢 LONG SETUP
- Entry Range: $0.2340 – $0.2390
- TP1: $0.2450
- TP2: $0.2530
- Final Target: $0.2650
- Stop Loss: $0.2260
Market Analysis:
UAI is trading at $0.2386, up 20.4%. Trading volume increased 52.5% to an additional $33.2M, while trades jumped 71%.
Open Interest rose 4.0%, adding $622.3K, suggesting fresh positions are entering the market. However, the Long/Short Ratio stands at 0.61, indicating short-heavy positioning and potential short-squeeze conditions if buying pressure continues.
The $0.2390–$0.2450 zone is the immediate resistance. A confirmed breakout with sustained volume could open the way toward $0.2530 and $0.2650. Losing $0.2340 could weaken the bullish setup.
⚠️ Wait for confirmation before entering. Avoid chasing the pump and manage leverage carefully.
Trade on $UAI
UAI is showing a powerful recovery, surging 20.4% in just one hour with rising volume and increased market participation.
🟢 LONG SETUP
- Entry Range: $0.2340 – $0.2390
- TP1: $0.2450
- TP2: $0.2530
- Final Target: $0.2650
- Stop Loss: $0.2260
Market Analysis:
UAI is trading at $0.2386, up 20.4%. Trading volume increased 52.5% to an additional $33.2M, while trades jumped 71%.
Open Interest rose 4.0%, adding $622.3K, suggesting fresh positions are entering the market. However, the Long/Short Ratio stands at 0.61, indicating short-heavy positioning and potential short-squeeze conditions if buying pressure continues.
The $0.2390–$0.2450 zone is the immediate resistance. A confirmed breakout with sustained volume could open the way toward $0.2530 and $0.2650. Losing $0.2340 could weaken the bullish setup.
⚠️ Wait for confirmation before entering. Avoid chasing the pump and manage leverage carefully.
Trade on $UAI
119
·
--
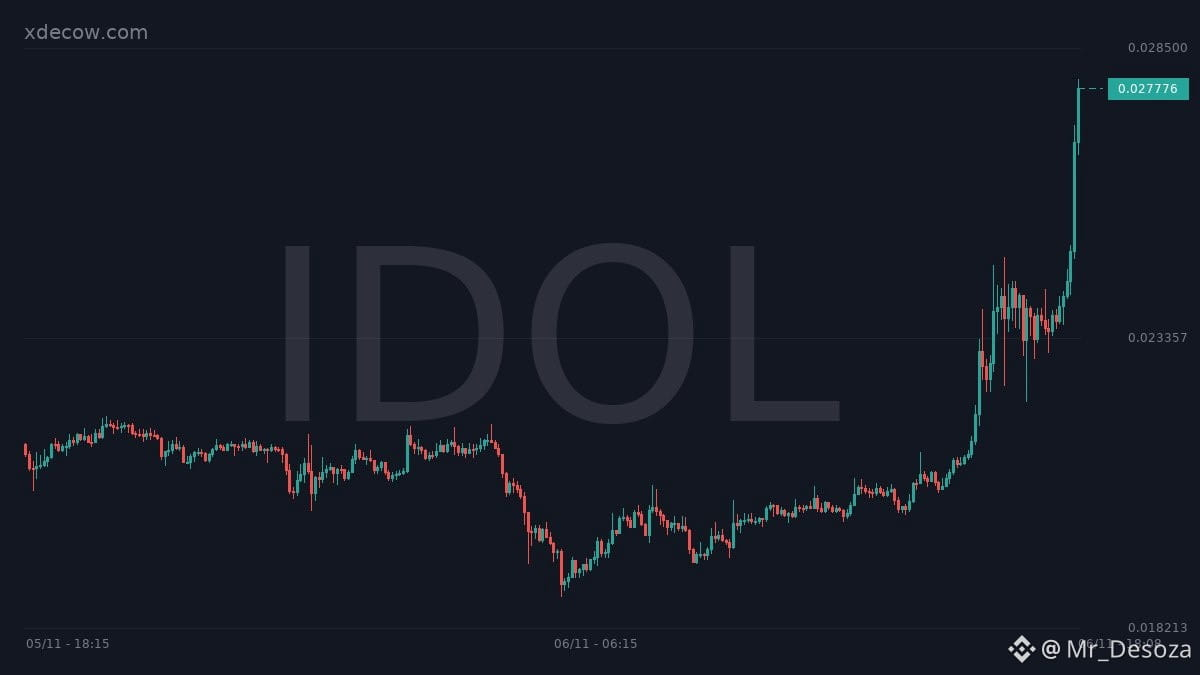
$IDOL – BULLISH MOMENTUM | VIP TRADING SIGNAL
IDOL has gained 20.4% in one hour, showing a strong price recovery. However, declining volume and trade activity suggest buyers should remain cautious.
🟢 LONG SETUP
- Entry Range: $0.0272 – $0.0278
- TP1: $0.0288
- TP2: $0.0300
- Final Target: $0.0315
- Stop Loss: $0.0264
Market Analysis:
IDOL is trading at $0.0278, up 20.4%. Open Interest increased 0.5%, adding $110.7K, indicating a slight increase in active positions.
However, volume declined 17.5% and trades dropped 21.5% despite the price rally. This divergence suggests the pump may lack strong participation. The Long/Short Ratio at 1.25 shows a long-side positioning bias.
The $0.0288–$0.0300 zone is the immediate resistance. A confirmed breakout with improving volume could open the way toward $0.0315. Losing $0.0272 may weaken the bullish setup.
⚠️ Wait for confirmation before entering. Avoid chasing the pump and manage leverage carefully.
Trade on $IDOL
{future}(IDOLUSDT)
$IDOL – BULLISH MOMENTUM | VIP TRADING SIGNAL
IDOL has gained 20.4% in one hour, showing a strong price recovery. However, declining volume and trade activity suggest buyers should remain cautious.
🟢 LONG SETUP
- Entry Range: $0.0272 – $0.0278
- TP1: $0.0288
- TP2: $0.0300
- Final Target: $0.0315
- Stop Loss: $0.0264
Market Analysis:
IDOL is trading at $0.0278, up 20.4%. Open Interest increased 0.5%, adding $110.7K, indicating a slight increase in active positions.
However, volume declined 17.5% and trades dropped 21.5% despite the price rally. This divergence suggests the pump may lack strong participation. The Long/Short Ratio at 1.25 shows a long-side positioning bias.
The $0.0288–$0.0300 zone is the immediate resistance. A confirmed breakout with improving volume could open the way toward $0.0315. Losing $0.0272 may weaken the bullish setup.
⚠️ Wait for confirmation before entering. Avoid chasing the pump and manage leverage carefully.
Trade on $IDOL
IDOL has gained 20.4% in one hour, showing a strong price recovery. However, declining volume and trade activity suggest buyers should remain cautious.
🟢 LONG SETUP
- Entry Range: $0.0272 – $0.0278
- TP1: $0.0288
- TP2: $0.0300
- Final Target: $0.0315
- Stop Loss: $0.0264
Market Analysis:
IDOL is trading at $0.0278, up 20.4%. Open Interest increased 0.5%, adding $110.7K, indicating a slight increase in active positions.
However, volume declined 17.5% and trades dropped 21.5% despite the price rally. This divergence suggests the pump may lack strong participation. The Long/Short Ratio at 1.25 shows a long-side positioning bias.
The $0.0288–$0.0300 zone is the immediate resistance. A confirmed breakout with improving volume could open the way toward $0.0315. Losing $0.0272 may weaken the bullish setup.
⚠️ Wait for confirmation before entering. Avoid chasing the pump and manage leverage carefully.
Trade on $IDOL
121
·
--
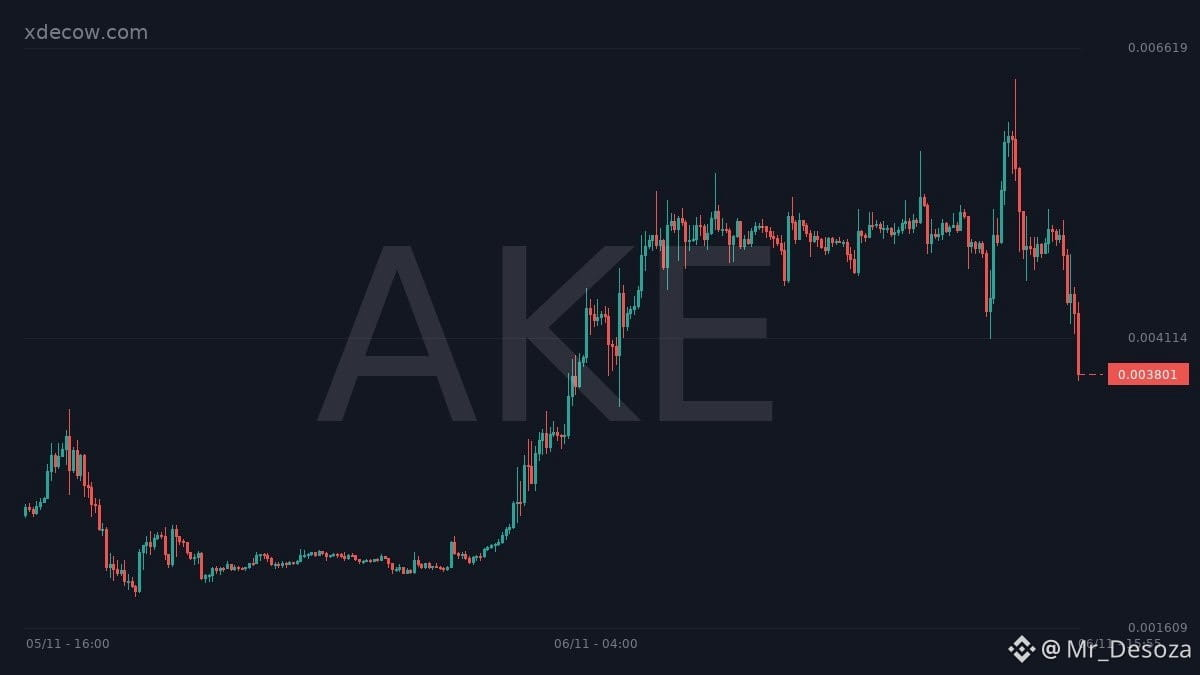
$AKE – SHARP BEARISH REVERSAL | VIP TRADING SIGNAL
AKE has suffered a heavy 20.8% drop in just one hour, putting significant pressure on its short-term market structure.
🔴 SHORT SETUP
- Entry Range: $0.00385 – $0.00395
- TP1: $0.00372
- TP2: $0.00358
- Final Target: $0.00342
- Stop Loss: $0.00408
Market Analysis:
AKE is trading at $0.003816 after a sharp hourly decline of 20.8%. Reported trading volume reached $43.2M, although volume change fell 36.6%. Trade activity also declined 35.6%, suggesting participation has cooled.
Interestingly, Open Interest increased 5.4%, adding $609.7K. This indicates new positions may be entering despite the sell-off. With the Long/Short Ratio at 1.09, positioning remains slightly long-biased.
The $0.00385–$0.00395 zone is the key recovery resistance. A rejection could extend downside pressure, while a strong reclaim above $0.00408 would invalidate this short setup.
⚠️ Wait for confirmation before entering. Avoid chasing the dump. Manage leverage carefully.
Trade on $AKE
{future}(AKEUSDT)
$AKE – SHARP BEARISH REVERSAL | VIP TRADING SIGNAL
AKE has suffered a heavy 20.8% drop in just one hour, putting significant pressure on its short-term market structure.
🔴 SHORT SETUP
- Entry Range: $0.00385 – $0.00395
- TP1: $0.00372
- TP2: $0.00358
- Final Target: $0.00342
- Stop Loss: $0.00408
Market Analysis:
AKE is trading at $0.003816 after a sharp hourly decline of 20.8%. Reported trading volume reached $43.2M, although volume change fell 36.6%. Trade activity also declined 35.6%, suggesting participation has cooled.
Interestingly, Open Interest increased 5.4%, adding $609.7K. This indicates new positions may be entering despite the sell-off. With the Long/Short Ratio at 1.09, positioning remains slightly long-biased.
The $0.00385–$0.00395 zone is the key recovery resistance. A rejection could extend downside pressure, while a strong reclaim above $0.00408 would invalidate this short setup.
⚠️ Wait for confirmation before entering. Avoid chasing the dump. Manage leverage carefully.
Trade on $AKE
AKE has suffered a heavy 20.8% drop in just one hour, putting significant pressure on its short-term market structure.
🔴 SHORT SETUP
- Entry Range: $0.00385 – $0.00395
- TP1: $0.00372
- TP2: $0.00358
- Final Target: $0.00342
- Stop Loss: $0.00408
Market Analysis:
AKE is trading at $0.003816 after a sharp hourly decline of 20.8%. Reported trading volume reached $43.2M, although volume change fell 36.6%. Trade activity also declined 35.6%, suggesting participation has cooled.
Interestingly, Open Interest increased 5.4%, adding $609.7K. This indicates new positions may be entering despite the sell-off. With the Long/Short Ratio at 1.09, positioning remains slightly long-biased.
The $0.00385–$0.00395 zone is the key recovery resistance. A rejection could extend downside pressure, while a strong reclaim above $0.00408 would invalidate this short setup.
⚠️ Wait for confirmation before entering. Avoid chasing the dump. Manage leverage carefully.
Trade on $AKE
120
·
--
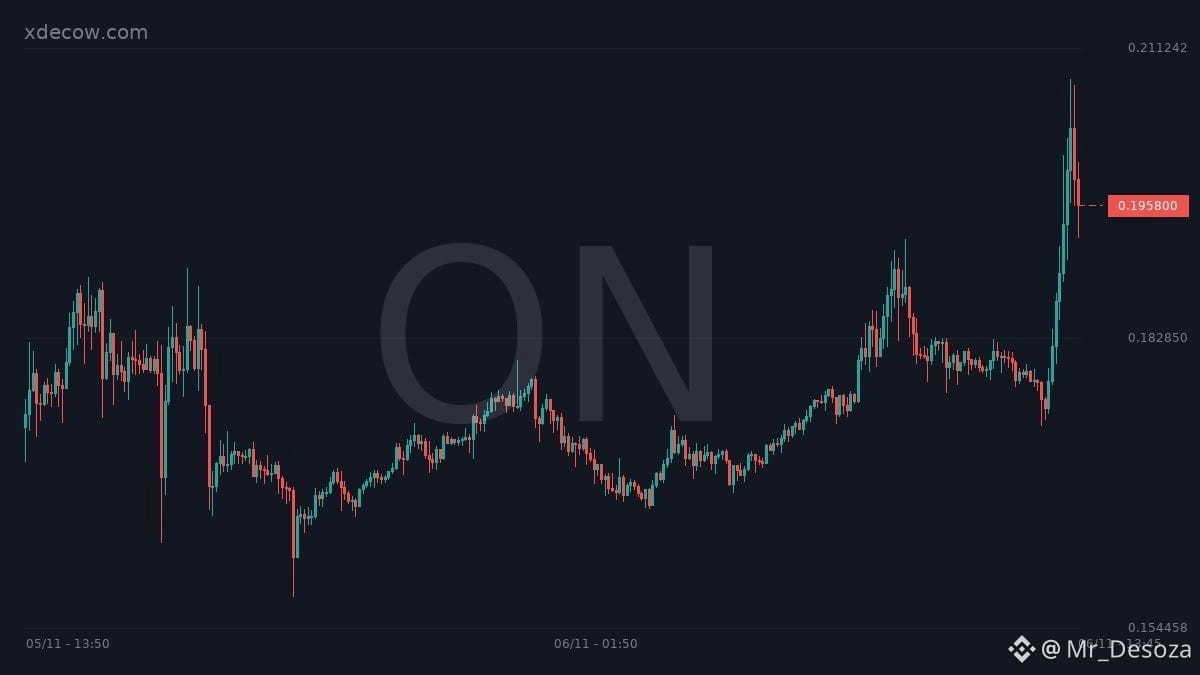
$ON – STRONG BULLISH MOMENTUM | VIP TRADING SIGNAL
ON is attracting massive market attention as trading activity explodes, with price gaining nearly 10% in just one hour.
🟢 LONG SETUP
- Entry Range: $0.1930 – $0.1960
- TP1: $0.2010
- TP2: $0.2070
- Final Target: $0.2150
- Stop Loss: $0.1870
Market Analysis:
ON is trading at $0.1961, up 9.7%. Trading volume surged 2,222.6%, while transactions jumped an impressive 1,681.6%, highlighting exceptional market participation.
Open Interest increased 4.7%, indicating fresh positions entering the market. The Long/Short Ratio stands at 1.25, although its recent decline suggests some reduction in long-side dominance.
The $0.1960–$0.2010 zone is the immediate resistance area. A confirmed breakout with sustained volume could open the way toward $0.2070 and $0.2150. Failure to hold $0.1930 could weaken the bullish structure.
⚠️ Wait for breakout confirmation before entering. Avoid chasing the pump and manage leverage carefully.
Trade on $ON
{future}(ONUSDT)
$ON – STRONG BULLISH MOMENTUM | VIP TRADING SIGNAL
ON is attracting massive market attention as trading activity explodes, with price gaining nearly 10% in just one hour.
🟢 LONG SETUP
- Entry Range: $0.1930 – $0.1960
- TP1: $0.2010
- TP2: $0.2070
- Final Target: $0.2150
- Stop Loss: $0.1870
Market Analysis:
ON is trading at $0.1961, up 9.7%. Trading volume surged 2,222.6%, while transactions jumped an impressive 1,681.6%, highlighting exceptional market participation.
Open Interest increased 4.7%, indicating fresh positions entering the market. The Long/Short Ratio stands at 1.25, although its recent decline suggests some reduction in long-side dominance.
The $0.1960–$0.2010 zone is the immediate resistance area. A confirmed breakout with sustained volume could open the way toward $0.2070 and $0.2150. Failure to hold $0.1930 could weaken the bullish structure.
⚠️ Wait for breakout confirmation before entering. Avoid chasing the pump and manage leverage carefully.
Trade on $ON
ON is attracting massive market attention as trading activity explodes, with price gaining nearly 10% in just one hour.
🟢 LONG SETUP
- Entry Range: $0.1930 – $0.1960
- TP1: $0.2010
- TP2: $0.2070
- Final Target: $0.2150
- Stop Loss: $0.1870
Market Analysis:
ON is trading at $0.1961, up 9.7%. Trading volume surged 2,222.6%, while transactions jumped an impressive 1,681.6%, highlighting exceptional market participation.
Open Interest increased 4.7%, indicating fresh positions entering the market. The Long/Short Ratio stands at 1.25, although its recent decline suggests some reduction in long-side dominance.
The $0.1960–$0.2010 zone is the immediate resistance area. A confirmed breakout with sustained volume could open the way toward $0.2070 and $0.2150. Failure to hold $0.1930 could weaken the bullish structure.
⚠️ Wait for breakout confirmation before entering. Avoid chasing the pump and manage leverage carefully.
Trade on $ON
84
·
--
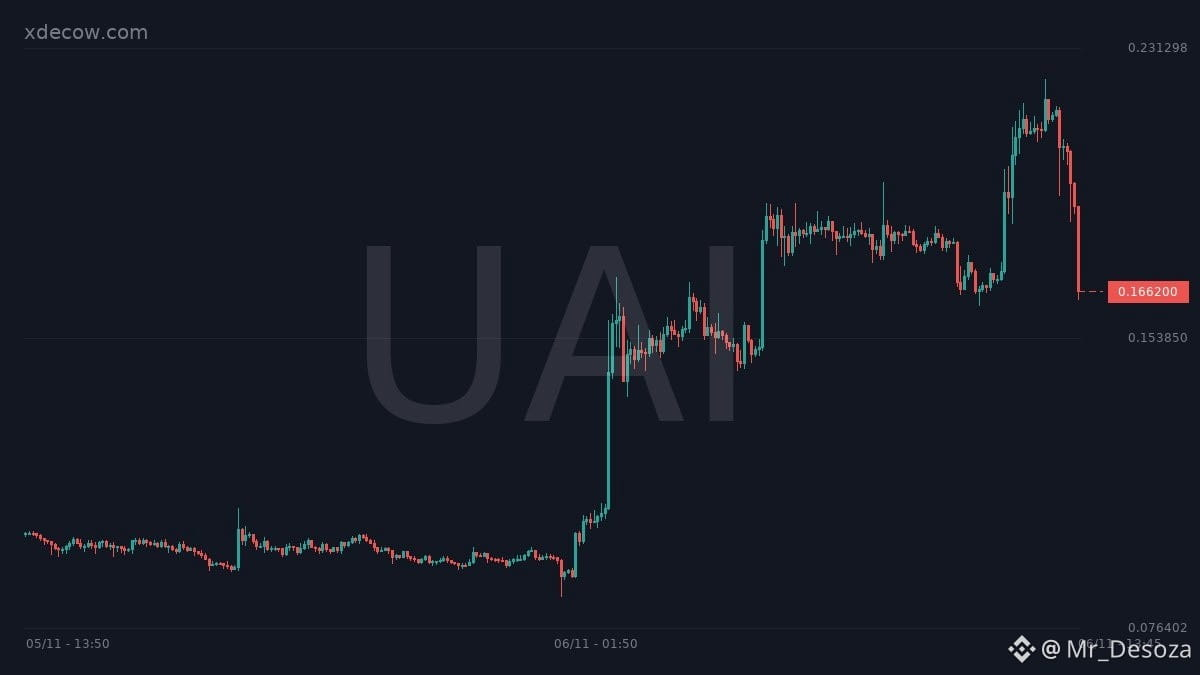
$UAI – HEAVY BEARISH PRESSURE | VIP TRADING SIGNAL
UAI has experienced a sharp 20.8% drop in just one hour, showing significant downside pressure and weakening market momentum.
🔴 SHORT SETUP
Entry Range: $0.1685 – $0.1720
TP1: $0.1620
TP2: $0.1560
- Final Target: $0.1500
- Stop Loss: $0.1765
Market Analysis:
UAI is trading at $0.1662 after a steep hourly decline of 20.8%. Reported trading volume reached an additional $27M, although the volume change indicator showed a slight 1.4% decrease.
Open Interest dropped 3.2%, suggesting leveraged positions are being closed. The Long/Short Ratio at 0.68 indicates short-heavy positioning, meaning a sudden relief bounce or short squeeze remains possible.
The $0.1685–$0.1720 zone is the key recovery resistance. A rejection could extend bearish momentum, while a strong reclaim above $0.1765 would invalidate this setup.
⚠️ Wait for confirmation before entering. Avoid chasing the dump. Manage leverage carefully.
Trade on $UAI
{future}(UAIUSDT)
$UAI – HEAVY BEARISH PRESSURE | VIP TRADING SIGNAL
UAI has experienced a sharp 20.8% drop in just one hour, showing significant downside pressure and weakening market momentum.
🔴 SHORT SETUP
Entry Range: $0.1685 – $0.1720
TP1: $0.1620
TP2: $0.1560
- Final Target: $0.1500
- Stop Loss: $0.1765
Market Analysis:
UAI is trading at $0.1662 after a steep hourly decline of 20.8%. Reported trading volume reached an additional $27M, although the volume change indicator showed a slight 1.4% decrease.
Open Interest dropped 3.2%, suggesting leveraged positions are being closed. The Long/Short Ratio at 0.68 indicates short-heavy positioning, meaning a sudden relief bounce or short squeeze remains possible.
The $0.1685–$0.1720 zone is the key recovery resistance. A rejection could extend bearish momentum, while a strong reclaim above $0.1765 would invalidate this setup.
⚠️ Wait for confirmation before entering. Avoid chasing the dump. Manage leverage carefully.
Trade on $UAI
UAI has experienced a sharp 20.8% drop in just one hour, showing significant downside pressure and weakening market momentum.
🔴 SHORT SETUP
Entry Range: $0.1685 – $0.1720
TP1: $0.1620
TP2: $0.1560
- Final Target: $0.1500
- Stop Loss: $0.1765
Market Analysis:
UAI is trading at $0.1662 after a steep hourly decline of 20.8%. Reported trading volume reached an additional $27M, although the volume change indicator showed a slight 1.4% decrease.
Open Interest dropped 3.2%, suggesting leveraged positions are being closed. The Long/Short Ratio at 0.68 indicates short-heavy positioning, meaning a sudden relief bounce or short squeeze remains possible.
The $0.1685–$0.1720 zone is the key recovery resistance. A rejection could extend bearish momentum, while a strong reclaim above $0.1765 would invalidate this setup.
⚠️ Wait for confirmation before entering. Avoid chasing the dump. Manage leverage carefully.
Trade on $UAI
99
·
--
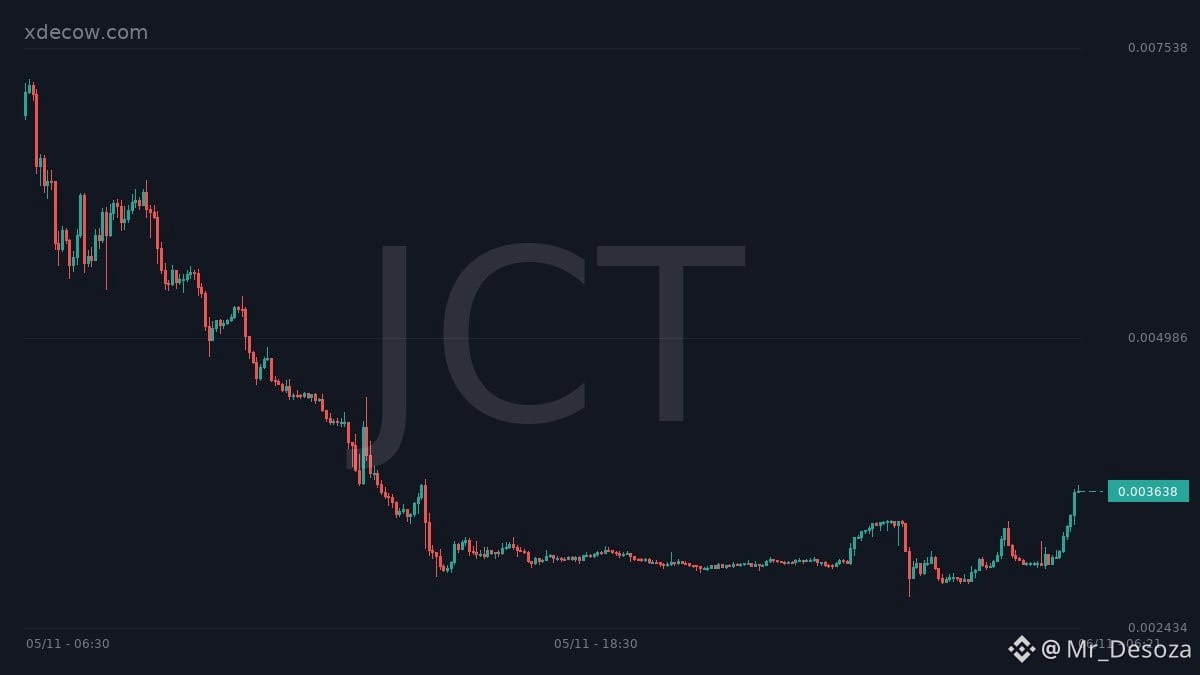
$JCT – BULLISH MOMENTUM | VIP TRADING SIGNAL
JCT is gaining strong upward momentum, with price surging 22% in just one hour alongside rising volume and trading activity.
🟢 LONG SETUP
Entry Range: $0.00358 – $0.00366
TP1: $0.00380
TP2: $0.00400
Final Target: $0.00425
Stop Loss: $0.00342
Market Analysis:
JCT is trading at $0.003647 after a 22% pump. Trading volume increased by $12.9M (+41.7%), while trades jumped 57.6%, showing growing market participation.
Open Interest also increased by 0.3%, suggesting a slight rise in active positions. The Long/Short Ratio at 1.49 indicates a long-side positioning bias.
The $0.00366–$0.00380 zone is the immediate resistance area. A confirmed breakout with sustained volume could open the way toward $0.00400 and $0.00425. Failure to hold $0.00358 may weaken the bullish setup.
⚠️ Wait for confirmation before entering. Avoid chasing the pump and manage leverage carefully.
Trade on $JCT
{future}(JCTUSDT)
$JCT – BULLISH MOMENTUM | VIP TRADING SIGNAL
JCT is gaining strong upward momentum, with price surging 22% in just one hour alongside rising volume and trading activity.
🟢 LONG SETUP
Entry Range: $0.00358 – $0.00366
TP1: $0.00380
TP2: $0.00400
Final Target: $0.00425
Stop Loss: $0.00342
Market Analysis:
JCT is trading at $0.003647 after a 22% pump. Trading volume increased by $12.9M (+41.7%), while trades jumped 57.6%, showing growing market participation.
Open Interest also increased by 0.3%, suggesting a slight rise in active positions. The Long/Short Ratio at 1.49 indicates a long-side positioning bias.
The $0.00366–$0.00380 zone is the immediate resistance area. A confirmed breakout with sustained volume could open the way toward $0.00400 and $0.00425. Failure to hold $0.00358 may weaken the bullish setup.
⚠️ Wait for confirmation before entering. Avoid chasing the pump and manage leverage carefully.
Trade on $JCT
JCT is gaining strong upward momentum, with price surging 22% in just one hour alongside rising volume and trading activity.
🟢 LONG SETUP
Entry Range: $0.00358 – $0.00366
TP1: $0.00380
TP2: $0.00400
Final Target: $0.00425
Stop Loss: $0.00342
Market Analysis:
JCT is trading at $0.003647 after a 22% pump. Trading volume increased by $12.9M (+41.7%), while trades jumped 57.6%, showing growing market participation.
Open Interest also increased by 0.3%, suggesting a slight rise in active positions. The Long/Short Ratio at 1.49 indicates a long-side positioning bias.
The $0.00366–$0.00380 zone is the immediate resistance area. A confirmed breakout with sustained volume could open the way toward $0.00400 and $0.00425. Failure to hold $0.00358 may weaken the bullish setup.
⚠️ Wait for confirmation before entering. Avoid chasing the pump and manage leverage carefully.
Trade on $JCT
170
·
--
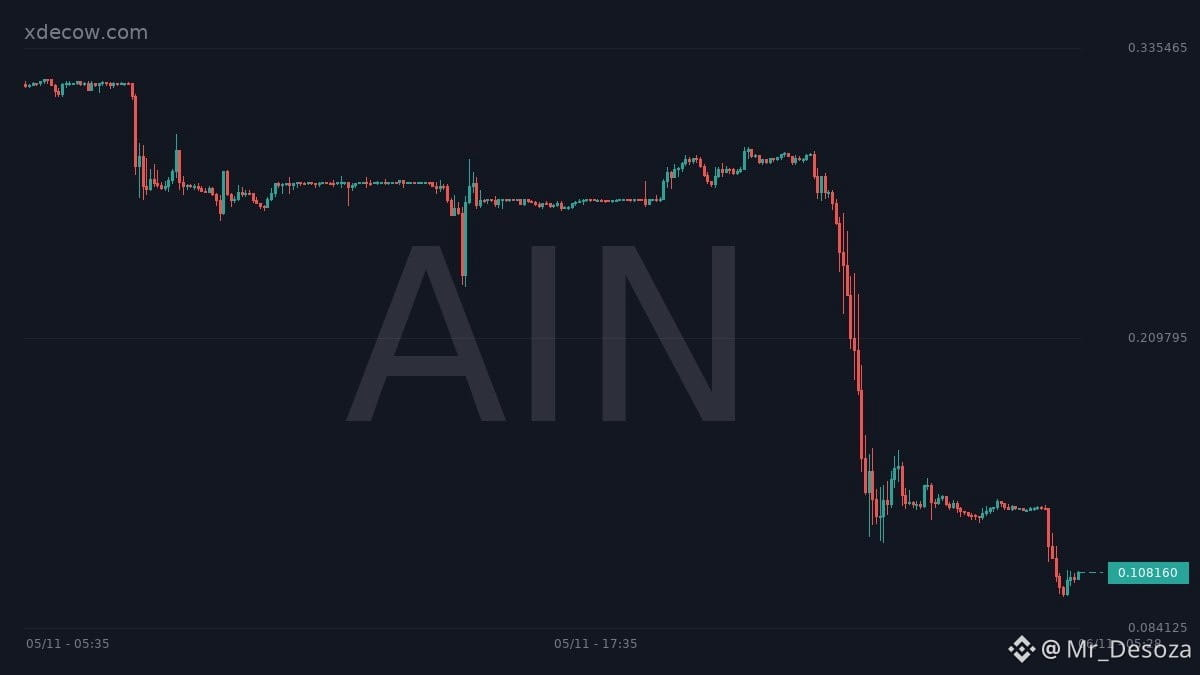
$AIN – EXTREME SELLING PRESSURE | VIP TRADING SIGNAL
AIN is experiencing another sharp sell-off, with price dropping over 20% in one hour as trading activity explodes.
SHORT SETUP
Entry Range: $0.1095 – $0.1125
TP1: $0.1050
TP2: $0.1010
Final Target: $0.0960
Stop Loss: $0.1160
Market Analysis:
AIN dropped 20.3% to $0.1081, while trading volume surged 602.2% and transactions jumped 514%. This highlights intense market activity during the decline.
Open Interest edged up 0.2%, suggesting some new positions are entering despite the sell-off. The Long/Short Ratio at 0.91 shows a slight short-side positioning bias.
The $0.1095–$0.1125 zone is the key recovery resistance. A rejection could extend bearish momentum, while a strong breakout above $0.1160 would invalidate this setup.
⚠️ Wait for confirmation before entering. Avoid chasing the dump. Manage leverage carefully.
Trade on $AIN
{future}(AINUSDT)
$AIN – EXTREME SELLING PRESSURE | VIP TRADING SIGNAL
AIN is experiencing another sharp sell-off, with price dropping over 20% in one hour as trading activity explodes.
SHORT SETUP
Entry Range: $0.1095 – $0.1125
TP1: $0.1050
TP2: $0.1010
Final Target: $0.0960
Stop Loss: $0.1160
Market Analysis:
AIN dropped 20.3% to $0.1081, while trading volume surged 602.2% and transactions jumped 514%. This highlights intense market activity during the decline.
Open Interest edged up 0.2%, suggesting some new positions are entering despite the sell-off. The Long/Short Ratio at 0.91 shows a slight short-side positioning bias.
The $0.1095–$0.1125 zone is the key recovery resistance. A rejection could extend bearish momentum, while a strong breakout above $0.1160 would invalidate this setup.
⚠️ Wait for confirmation before entering. Avoid chasing the dump. Manage leverage carefully.
Trade on $AIN
AIN is experiencing another sharp sell-off, with price dropping over 20% in one hour as trading activity explodes.
SHORT SETUP
Entry Range: $0.1095 – $0.1125
TP1: $0.1050
TP2: $0.1010
Final Target: $0.0960
Stop Loss: $0.1160
Market Analysis:
AIN dropped 20.3% to $0.1081, while trading volume surged 602.2% and transactions jumped 514%. This highlights intense market activity during the decline.
Open Interest edged up 0.2%, suggesting some new positions are entering despite the sell-off. The Long/Short Ratio at 0.91 shows a slight short-side positioning bias.
The $0.1095–$0.1125 zone is the key recovery resistance. A rejection could extend bearish momentum, while a strong breakout above $0.1160 would invalidate this setup.
⚠️ Wait for confirmation before entering. Avoid chasing the dump. Manage leverage carefully.
Trade on $AIN
142
ເຂົ້າສູ່ລະບົບເພື່ອສຳຫຼວດເນື້ອຫາເພີ່ມເຕີມ
ເຂົ້າຮ່ວມກຸ່ມຜູ້ໃຊ້ຄຣິບໂຕທົ່ວໂລກໃນ Binance Square.
⚡️ ໄດ້ຮັບຂໍ້ມູນຫຼ້າສຸດ ແລະ ທີ່ມີປະໂຫຍດກ່ຽວກັບຄຣິບໂຕ.
💬 ໄດ້ຮັບຄວາມໄວ້ວາງໃຈຈາກຕະຫຼາດແລກປ່ຽນຄຣິບໂຕທີ່ໃຫຍ່ທີ່ສຸດໃນໂລກ.
👍 ຄົ້ນຫາຂໍ້ມູນເຊີງເລິກທີ່ແທ້ຈາກນັກສ້າງທີ່ໄດ້ຮັບການຢືນຢັນ.
ອີເມວ / ເບີໂທລະສັບ
ຫົວຂໍ້ທີ່ກໍາລັງນິຍົມ
HotCPIDecemberHikePriced
271,948 ຄັ້ງທີ່ເບິ່ງ
2,894 ກຳລັງສົນທະນາ
CPI Market Watch | US CPI Rises 0.4% in October, Hotter Than 0.3% Forecast
Binance News
·31 ຖືກໃຈ
·45.4k ຄັ້ງທີ່ເບິ່ງ
ZcashFallsBelow$1000ForFirstTimeSinceSeptember
3,989 ຄັ້ງທີ່ເບິ່ງ
35 ກຳລັງສົນທະນາ
StrategyFaces$2.8BSelloffRiskFromMSCIRemoval
14,152 ຄັ້ງທີ່ເບິ່ງ
120 ກຳລັງສົນທະນາ