
Huutruong039811
10.6k ໂພສ

Huutruong039811
ລາຍງານ
ບລັອກຜູ້ໃຊ້
Crypto Airdrop Daily | Follow for new opportunities | Binance UID 152277880 | X Huutruong039811 | KITE 277880 🇻🇳
ເປີດການຊື້ຂາຍ
ຜູ້ຊື້ຂາຍປະຈໍາ
5.5 ປີ
3.6K+ ກໍາລັງຕິດຕາມ
2.4K+ ຜູ້ຕິດຕາມ
847 Liked
ໂພສ
Portfolio
ທັງໝົດ
ວົງຢືມ
ວີດີໂອ
ຖ່າຍທອດສົດ
·
--
ສັນຍານໝີ
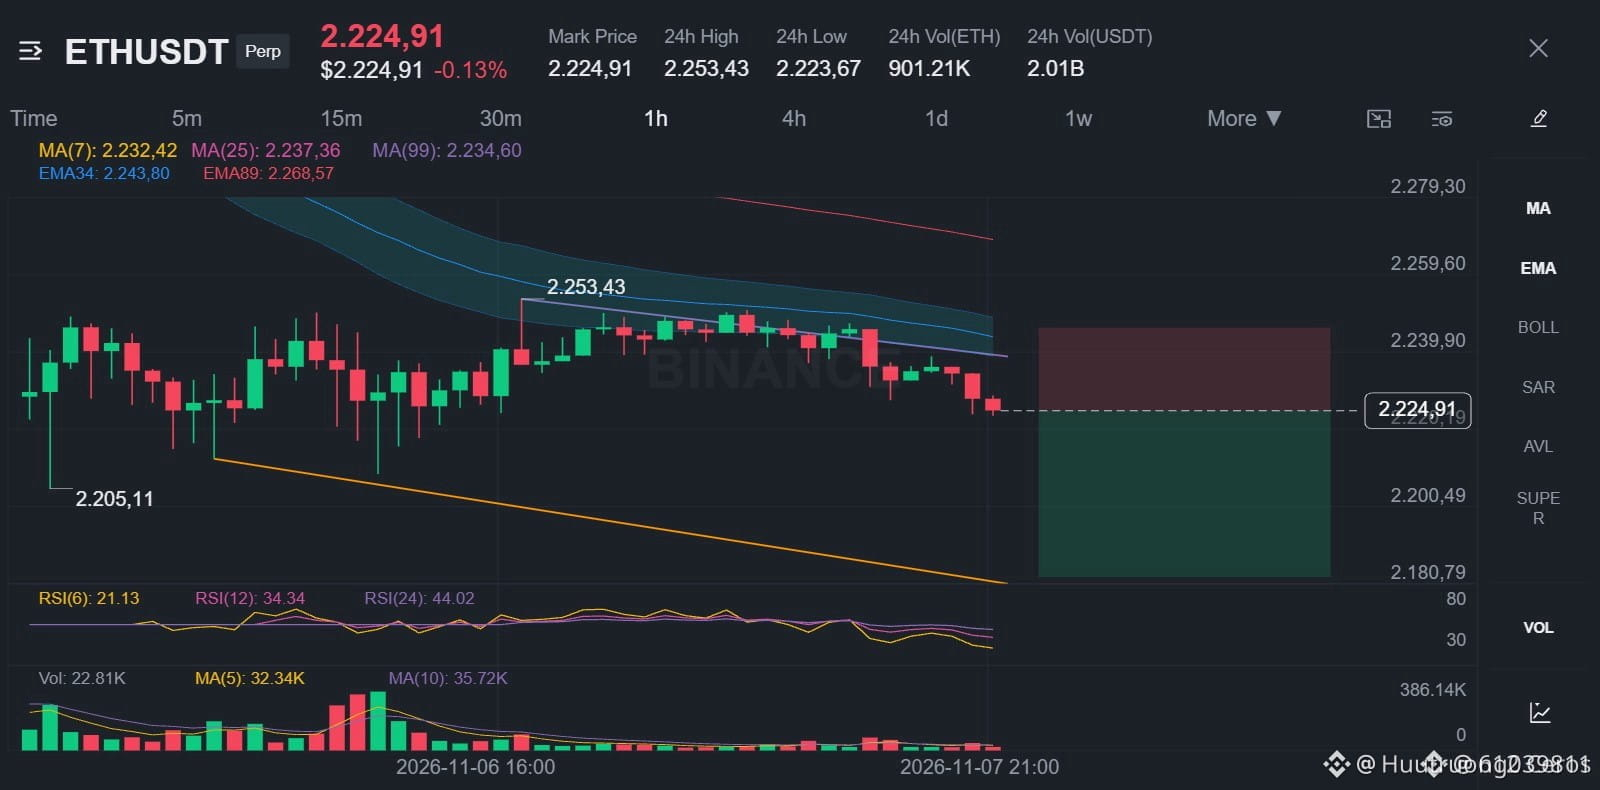
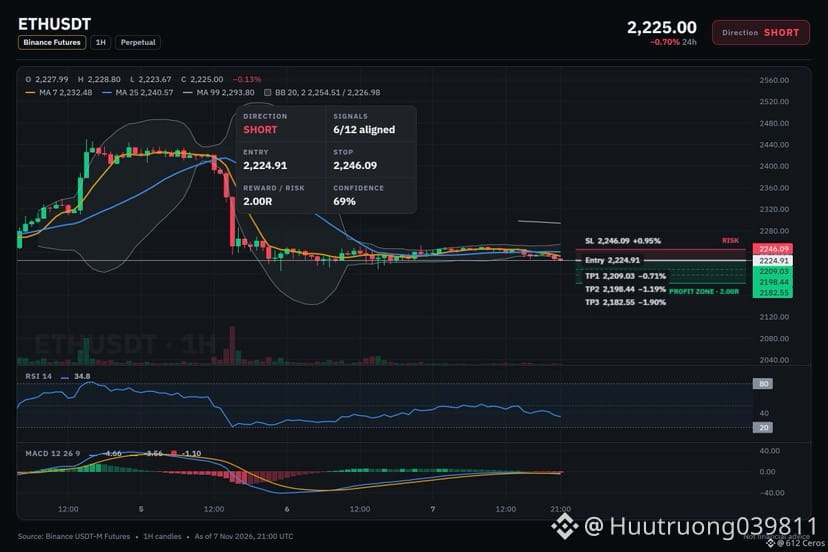
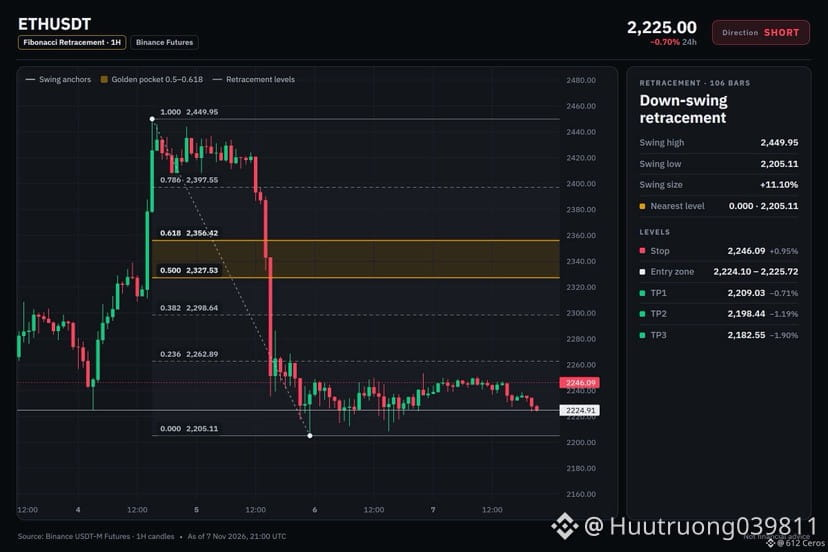
🔴 $ETH /USDT · Bias: SHORT
4h bearish stack points lower as price sits below both EMAs.
Entry: 2224.10 – 2225.72
TP1: 2209.03 (-0.7%)
TP2: 2198.44 (-1.2%)
TP3: 2182.55 (-1.9%)
SL: 2246.09 (+1.0%)
Why: ADX 40.5 with sellers in control means the move has strong directional momentum.
Risk: Far below its average, bounce likely (−3.1 ATR from 1h EMA50)
Plan: close 50% at TP1, 25% at TP2, 25% at TP3, and move the stop to entry after TP1.
Do you see this trade staying directional or fading at the entry?
{spot}(ETHUSDT)
🔴 $ETH /USDT · Bias: SHORT
4h bearish stack points lower as price sits below both EMAs.
Entry: 2224.10 – 2225.72
TP1: 2209.03 (-0.7%)
TP2: 2198.44 (-1.2%)
TP3: 2182.55 (-1.9%)
SL: 2246.09 (+1.0%)
Why: ADX 40.5 with sellers in control means the move has strong directional momentum.
Risk: Far below its average, bounce likely (−3.1 ATR from 1h EMA50)
Plan: close 50% at TP1, 25% at TP2, 25% at TP3, and move the stop to entry after TP1.
Do you see this trade staying directional or fading at the entry?
4h bearish stack points lower as price sits below both EMAs.
Entry: 2224.10 – 2225.72
TP1: 2209.03 (-0.7%)
TP2: 2198.44 (-1.2%)
TP3: 2182.55 (-1.9%)
SL: 2246.09 (+1.0%)
Why: ADX 40.5 with sellers in control means the move has strong directional momentum.
Risk: Far below its average, bounce likely (−3.1 ATR from 1h EMA50)
Plan: close 50% at TP1, 25% at TP2, 25% at TP3, and move the stop to entry after TP1.
Do you see this trade staying directional or fading at the entry?
15
·
--
ສັນຍານໝີ
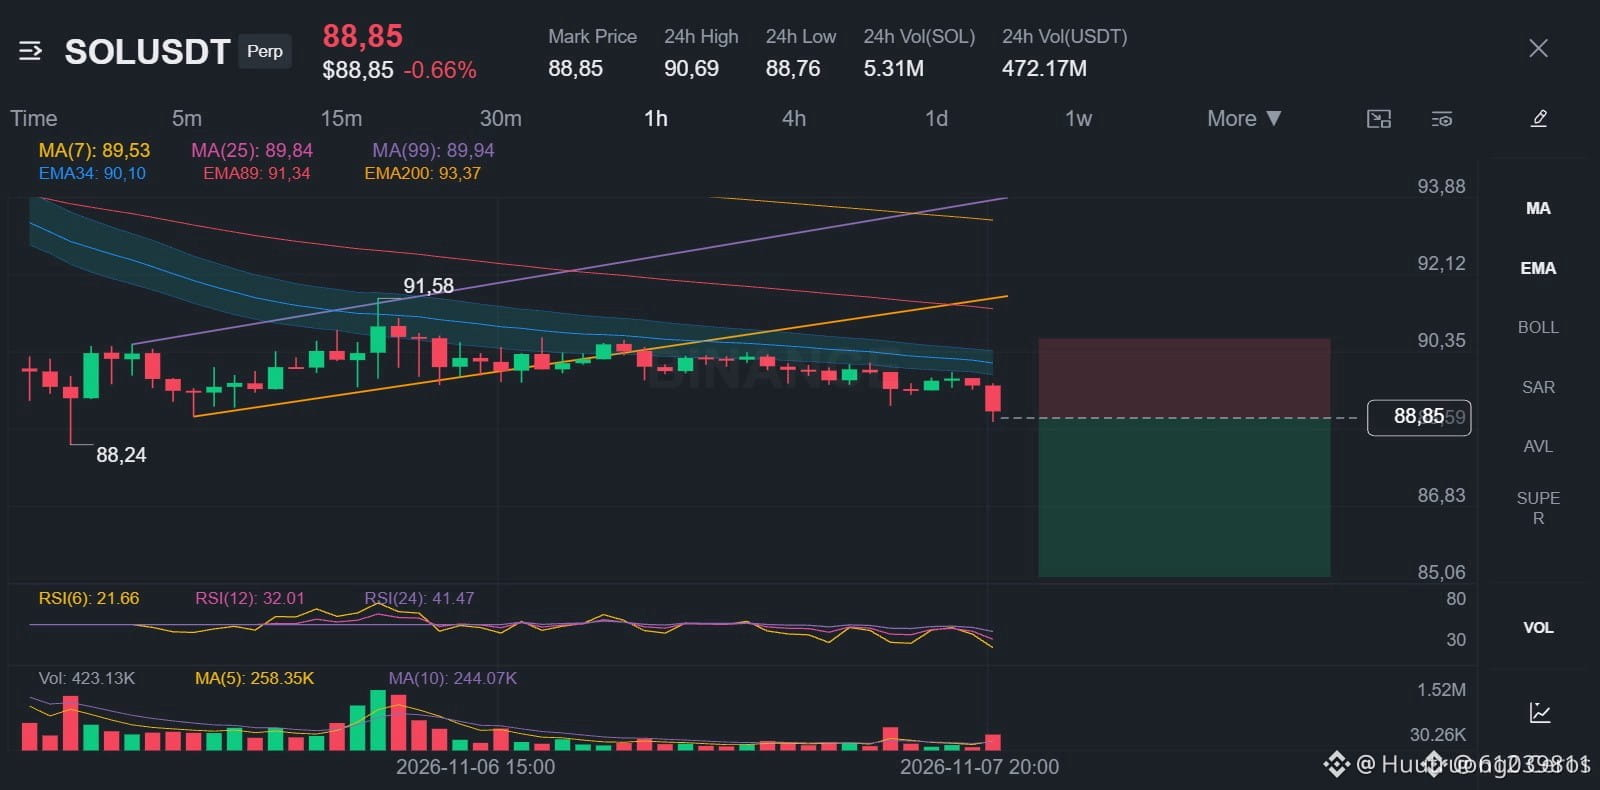
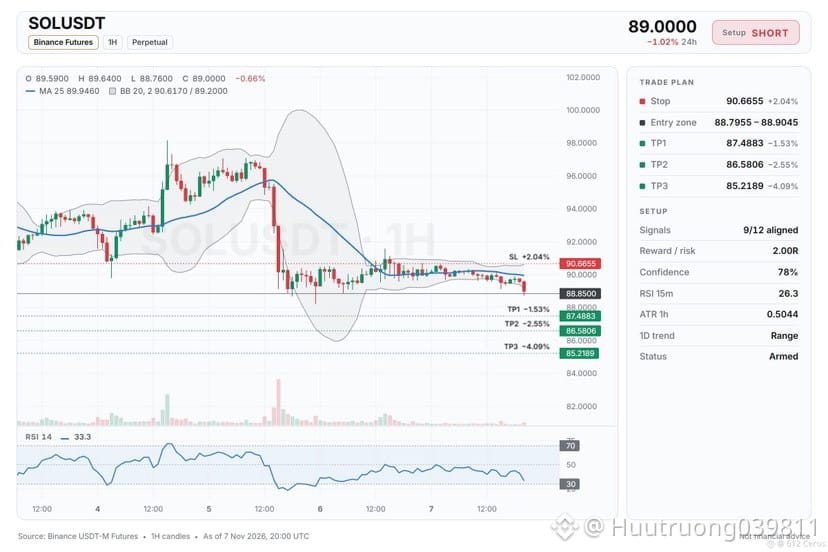
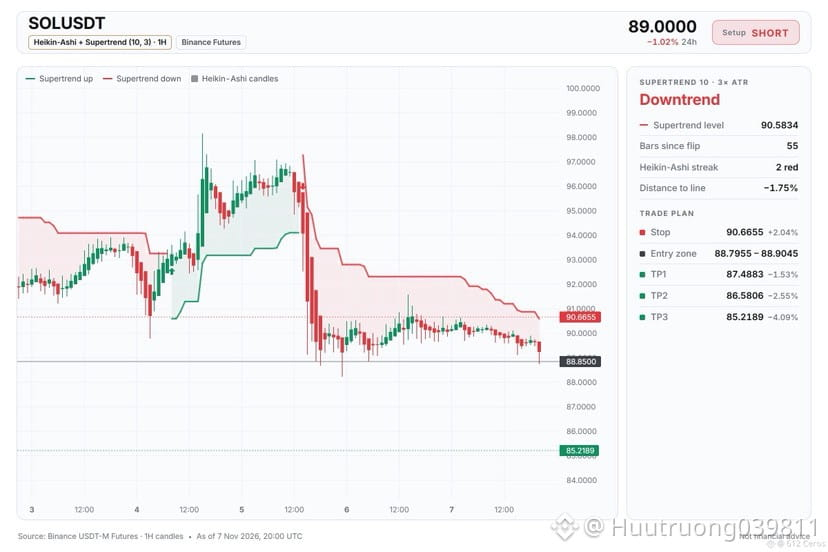
🔴 $SOL /USDT · Bias: SHORT
The 4h price sits below both EMAs in a bearish stack, pointing lower.
Entry: 88.7955 – 88.9045
TP1: 87.4883 (-1.5%)
TP2: 86.5806 (-2.6%)
TP3: 85.2189 (-4.1%)
SL: 90.6655 (+2.0%)
Why: The 1h price sits below both EMAs in a bearish stack, meaning the short-term trend is down.
Risk: Far below its average, bounce likely (−3.2 ATR from 1h EMA50)
Plan: close 50% at TP1, 25% at TP2, 25% at TP3, and move the stop to entry after TP1.
Do you see this as a good short entry?
{spot}(SOLUSDT)
🔴 $SOL /USDT · Bias: SHORT
The 4h price sits below both EMAs in a bearish stack, pointing lower.
Entry: 88.7955 – 88.9045
TP1: 87.4883 (-1.5%)
TP2: 86.5806 (-2.6%)
TP3: 85.2189 (-4.1%)
SL: 90.6655 (+2.0%)
Why: The 1h price sits below both EMAs in a bearish stack, meaning the short-term trend is down.
Risk: Far below its average, bounce likely (−3.2 ATR from 1h EMA50)
Plan: close 50% at TP1, 25% at TP2, 25% at TP3, and move the stop to entry after TP1.
Do you see this as a good short entry?
The 4h price sits below both EMAs in a bearish stack, pointing lower.
Entry: 88.7955 – 88.9045
TP1: 87.4883 (-1.5%)
TP2: 86.5806 (-2.6%)
TP3: 85.2189 (-4.1%)
SL: 90.6655 (+2.0%)
Why: The 1h price sits below both EMAs in a bearish stack, meaning the short-term trend is down.
Risk: Far below its average, bounce likely (−3.2 ATR from 1h EMA50)
Plan: close 50% at TP1, 25% at TP2, 25% at TP3, and move the stop to entry after TP1.
Do you see this as a good short entry?
12
·
--
ສັນຍານໝີ
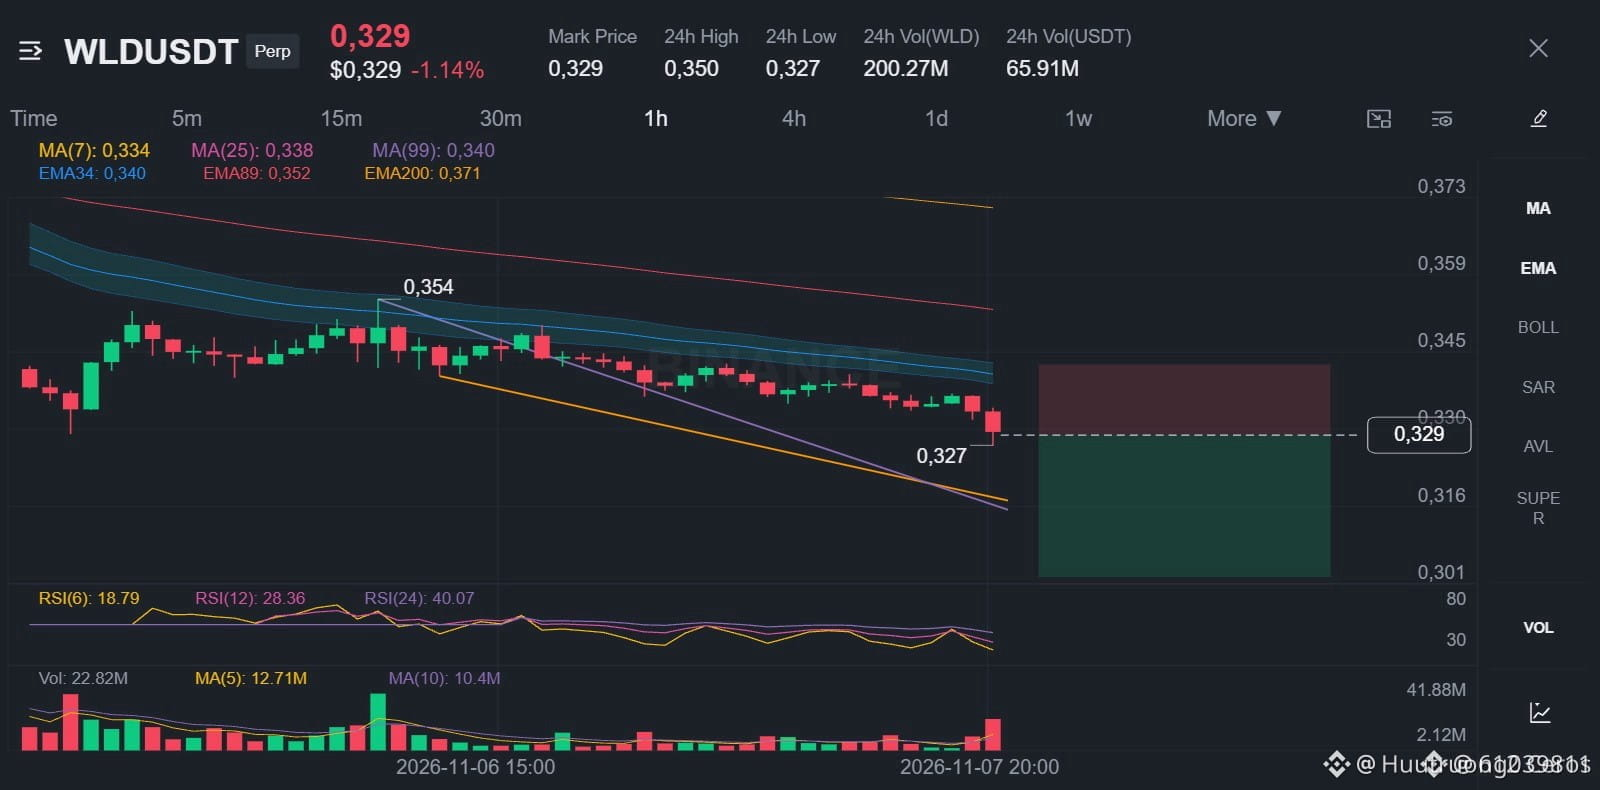
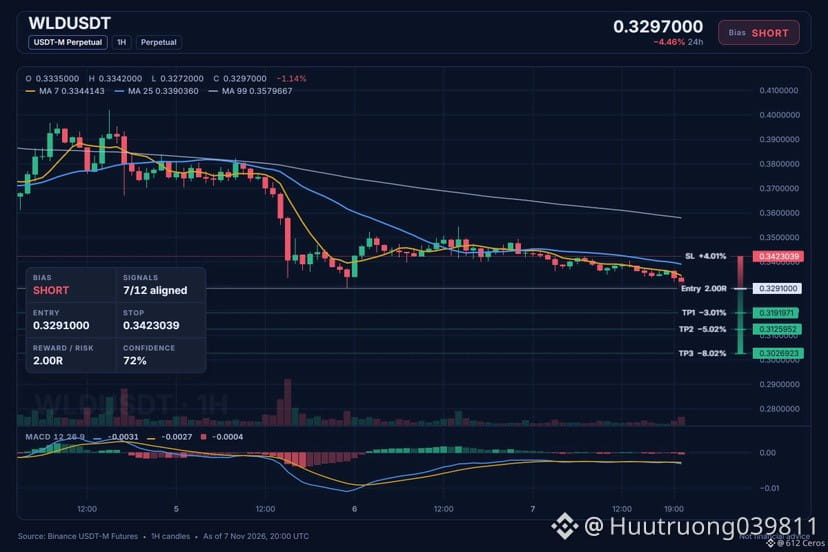
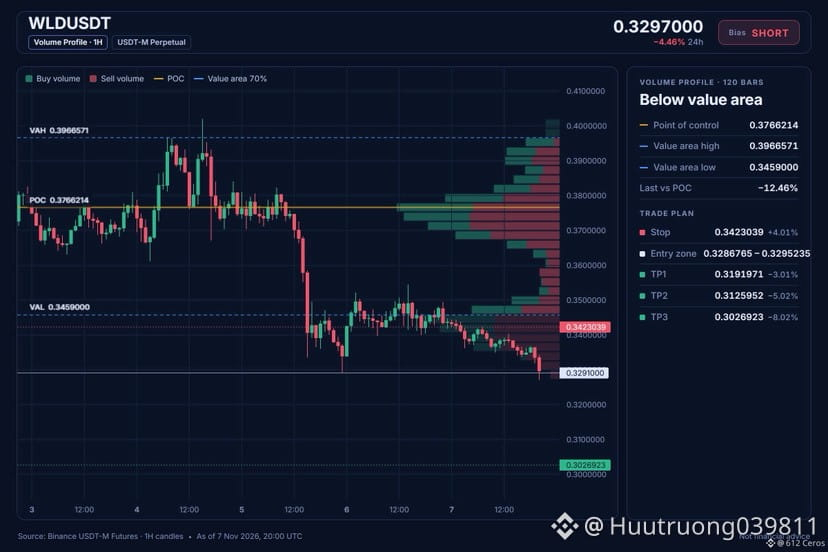
🔴 $WLD /USDT · Bias: SHORT
WLD sits below both EMAs on the 4h chart, pointing lower.
Entry: 0.3286765 – 0.3295235
TP1: 0.3191971 (-3.0%)
TP2: 0.3125952 (-5.0%)
TP3: 0.3026923 (-8.0%)
SL: 0.3423039 (+4.0%)
Why: The 4h trend shows price below EMA50 and EMA200 in a bearish stack, meaning the swing trend is down.
Risk: Far below its average, bounce likely (−4.1 ATR from 1h EMA50)
Plan: close 50% at TP1, 25% at TP2, 25% at TP3, and move the stop to entry after TP1.
Where do you think this short ends?
{spot}(WLDUSDT)
🔴 $WLD /USDT · Bias: SHORT
WLD sits below both EMAs on the 4h chart, pointing lower.
Entry: 0.3286765 – 0.3295235
TP1: 0.3191971 (-3.0%)
TP2: 0.3125952 (-5.0%)
TP3: 0.3026923 (-8.0%)
SL: 0.3423039 (+4.0%)
Why: The 4h trend shows price below EMA50 and EMA200 in a bearish stack, meaning the swing trend is down.
Risk: Far below its average, bounce likely (−4.1 ATR from 1h EMA50)
Plan: close 50% at TP1, 25% at TP2, 25% at TP3, and move the stop to entry after TP1.
Where do you think this short ends?
WLD sits below both EMAs on the 4h chart, pointing lower.
Entry: 0.3286765 – 0.3295235
TP1: 0.3191971 (-3.0%)
TP2: 0.3125952 (-5.0%)
TP3: 0.3026923 (-8.0%)
SL: 0.3423039 (+4.0%)
Why: The 4h trend shows price below EMA50 and EMA200 in a bearish stack, meaning the swing trend is down.
Risk: Far below its average, bounce likely (−4.1 ATR from 1h EMA50)
Plan: close 50% at TP1, 25% at TP2, 25% at TP3, and move the stop to entry after TP1.
Where do you think this short ends?
17
·
--
ສັນຍານໝີ
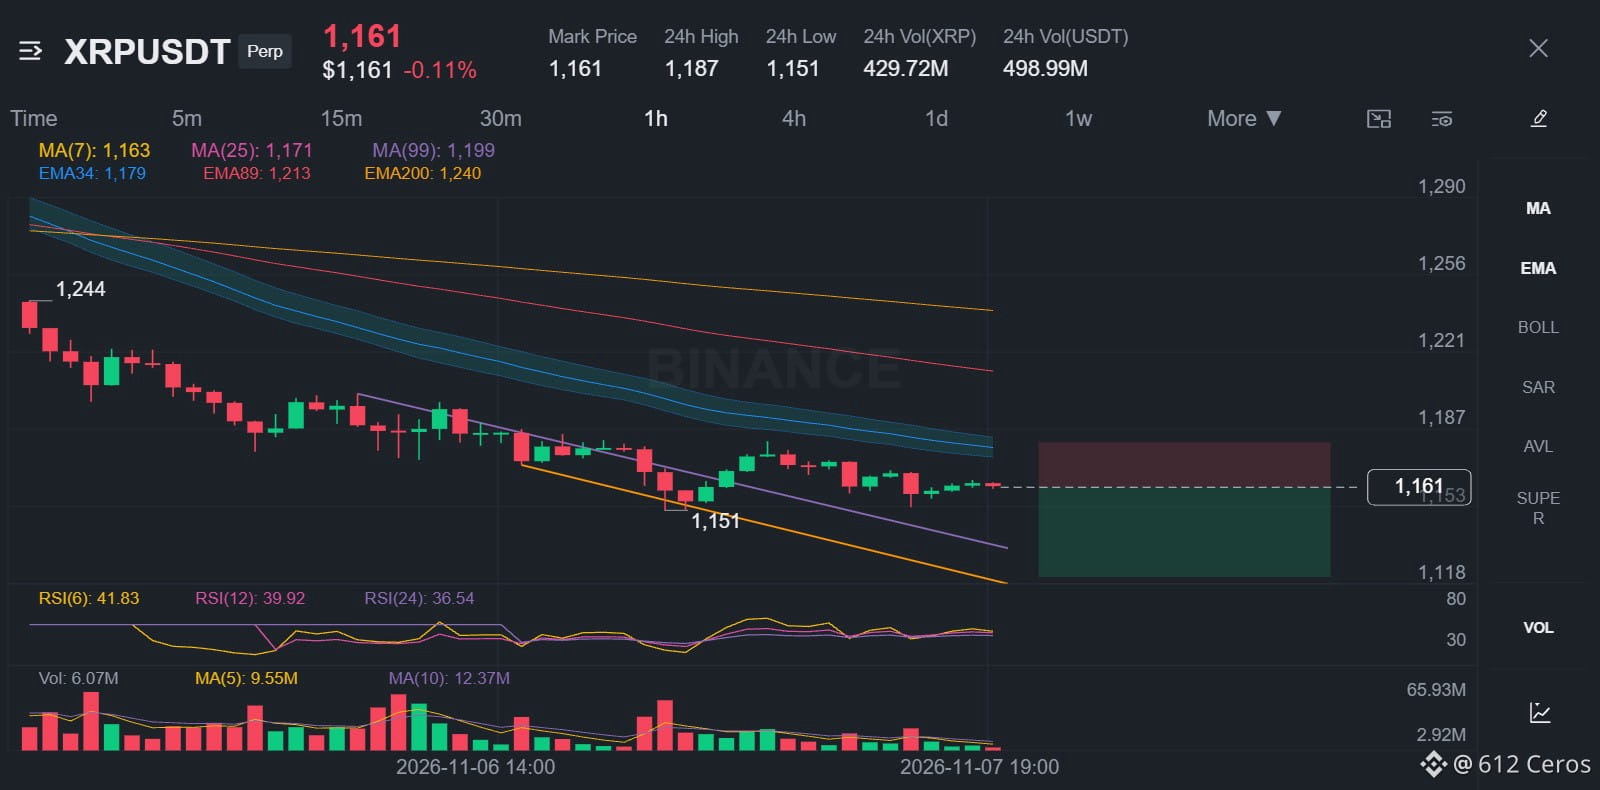
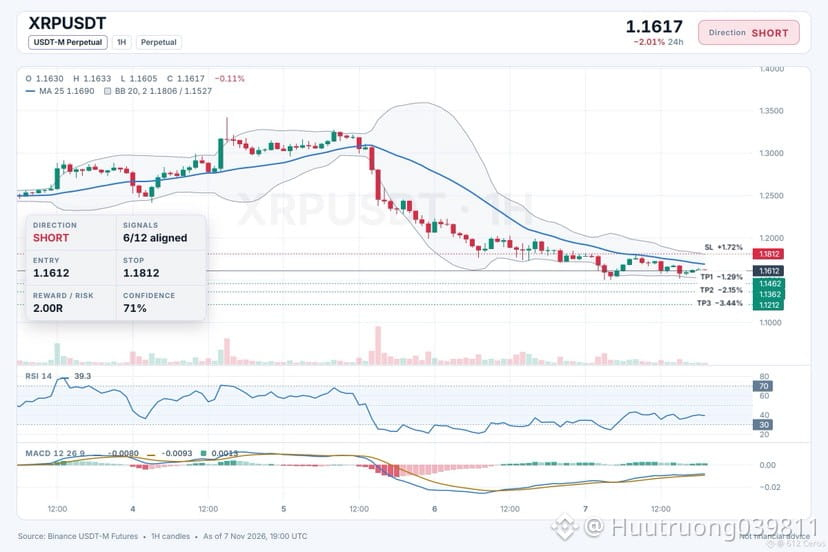
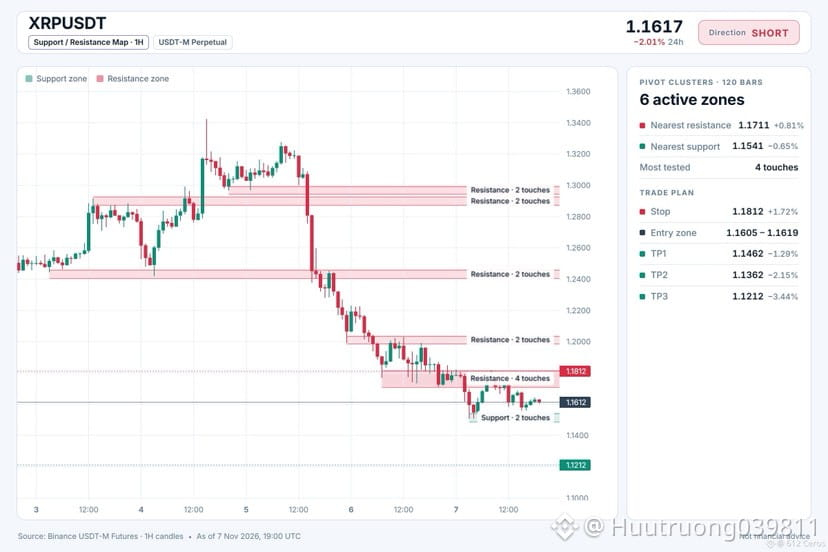
🔴 $XRP /USDT · Bias: SHORT
XRP breaks below all three EMAs as the trend turns clearly bearish.
Entry: 1.1605 – 1.1619
TP1: 1.1462 (-1.3%)
TP2: 1.1362 (-2.2%)
TP3: 1.1212 (-3.4%)
SL: 1.1812 (+1.7%)
Why: 4h RSI at 31.1 means sellers have the momentum, so price should keep falling.
Risk: Far below its average, bounce likely (−3.6 ATR from 1h EMA50)
Plan: close 50% at TP1, 25% at TP2, 25% at TP3, and move the stop to entry after TP1.
Where do you see XRP heading from here?
{spot}(XRPUSDT)
🔴 $XRP /USDT · Bias: SHORT
XRP breaks below all three EMAs as the trend turns clearly bearish.
Entry: 1.1605 – 1.1619
TP1: 1.1462 (-1.3%)
TP2: 1.1362 (-2.2%)
TP3: 1.1212 (-3.4%)
SL: 1.1812 (+1.7%)
Why: 4h RSI at 31.1 means sellers have the momentum, so price should keep falling.
Risk: Far below its average, bounce likely (−3.6 ATR from 1h EMA50)
Plan: close 50% at TP1, 25% at TP2, 25% at TP3, and move the stop to entry after TP1.
Where do you see XRP heading from here?
XRP breaks below all three EMAs as the trend turns clearly bearish.
Entry: 1.1605 – 1.1619
TP1: 1.1462 (-1.3%)
TP2: 1.1362 (-2.2%)
TP3: 1.1212 (-3.4%)
SL: 1.1812 (+1.7%)
Why: 4h RSI at 31.1 means sellers have the momentum, so price should keep falling.
Risk: Far below its average, bounce likely (−3.6 ATR from 1h EMA50)
Plan: close 50% at TP1, 25% at TP2, 25% at TP3, and move the stop to entry after TP1.
Where do you see XRP heading from here?
16
·
--
ສັນຍານໝີ
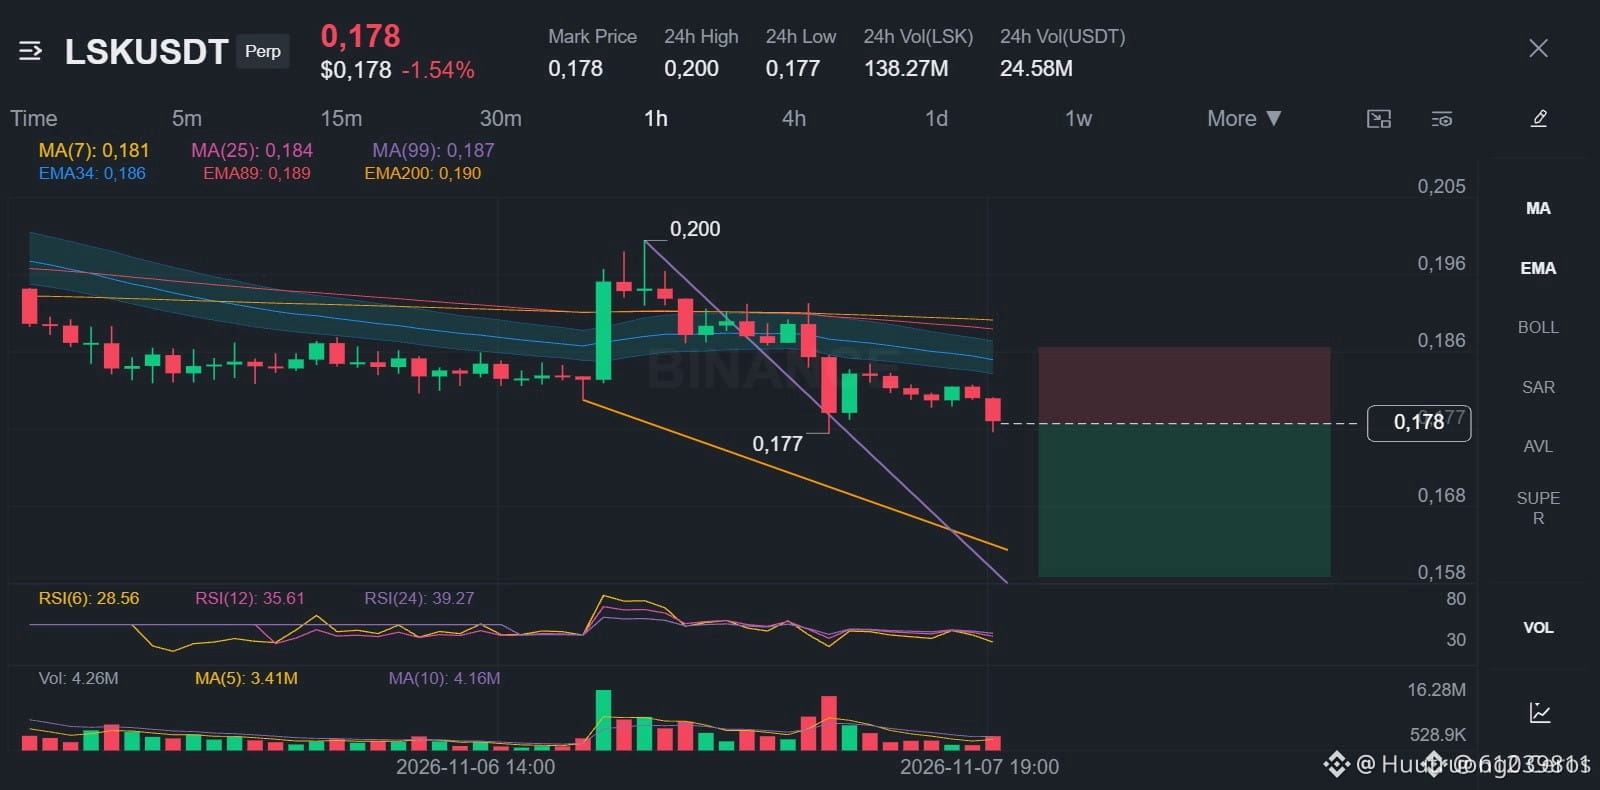
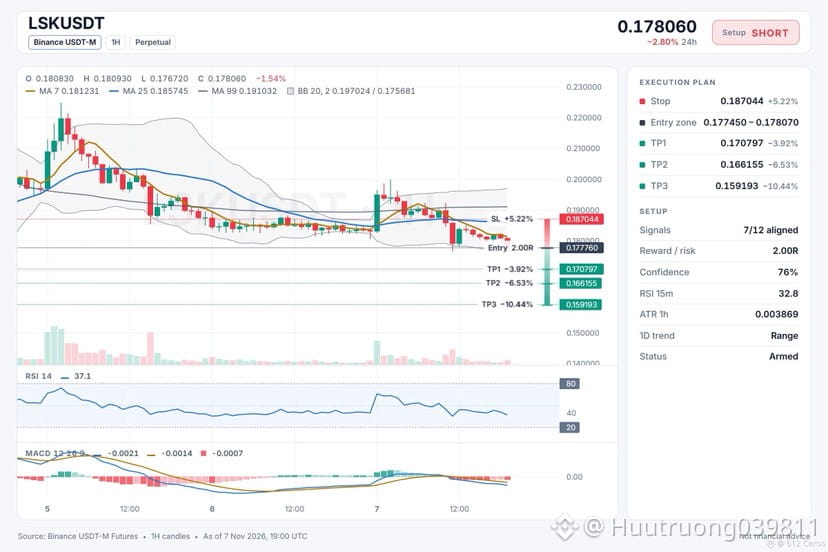
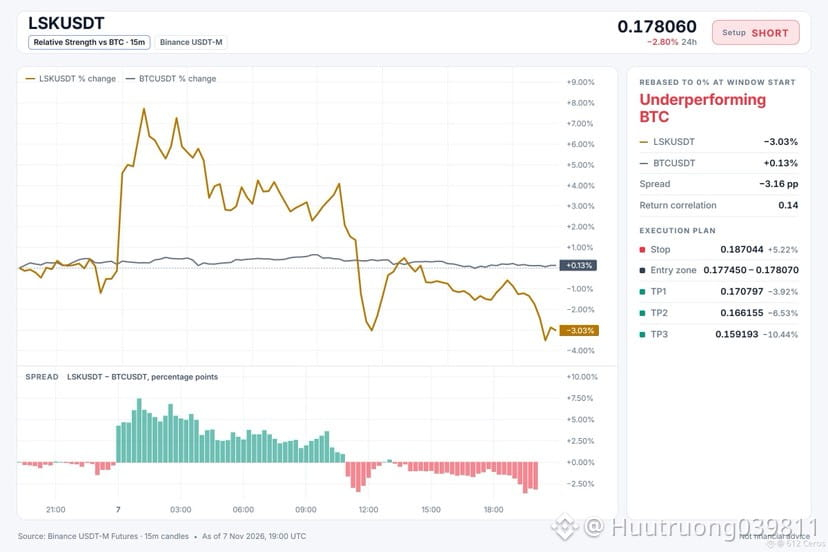
🔴 $LSK /USDT · Bias: SHORT
Bearish stack on the 4h chart points lower as price sits below both EMAs.
Entry: 0.177450 – 0.178070
TP1: 0.170797 (-3.9%)
TP2: 0.166155 (-6.5%)
TP3: 0.159193 (-10.4%)
SL: 0.187044 (+5.2%)
Why: ADX 28.4 with sellers in control means the directional movement index shows strong selling pressure.
Plan: close 50% at TP1, 25% at TP2, 25% at TP3, and move the stop to entry after TP1.
Would you enter short here or wait for a lower pullback?
{spot}(LSKUSDT)
🔴 $LSK /USDT · Bias: SHORT
Bearish stack on the 4h chart points lower as price sits below both EMAs.
Entry: 0.177450 – 0.178070
TP1: 0.170797 (-3.9%)
TP2: 0.166155 (-6.5%)
TP3: 0.159193 (-10.4%)
SL: 0.187044 (+5.2%)
Why: ADX 28.4 with sellers in control means the directional movement index shows strong selling pressure.
Plan: close 50% at TP1, 25% at TP2, 25% at TP3, and move the stop to entry after TP1.
Would you enter short here or wait for a lower pullback?
Bearish stack on the 4h chart points lower as price sits below both EMAs.
Entry: 0.177450 – 0.178070
TP1: 0.170797 (-3.9%)
TP2: 0.166155 (-6.5%)
TP3: 0.159193 (-10.4%)
SL: 0.187044 (+5.2%)
Why: ADX 28.4 with sellers in control means the directional movement index shows strong selling pressure.
Plan: close 50% at TP1, 25% at TP2, 25% at TP3, and move the stop to entry after TP1.
Would you enter short here or wait for a lower pullback?
12
·
--
ສັນຍານໝີ
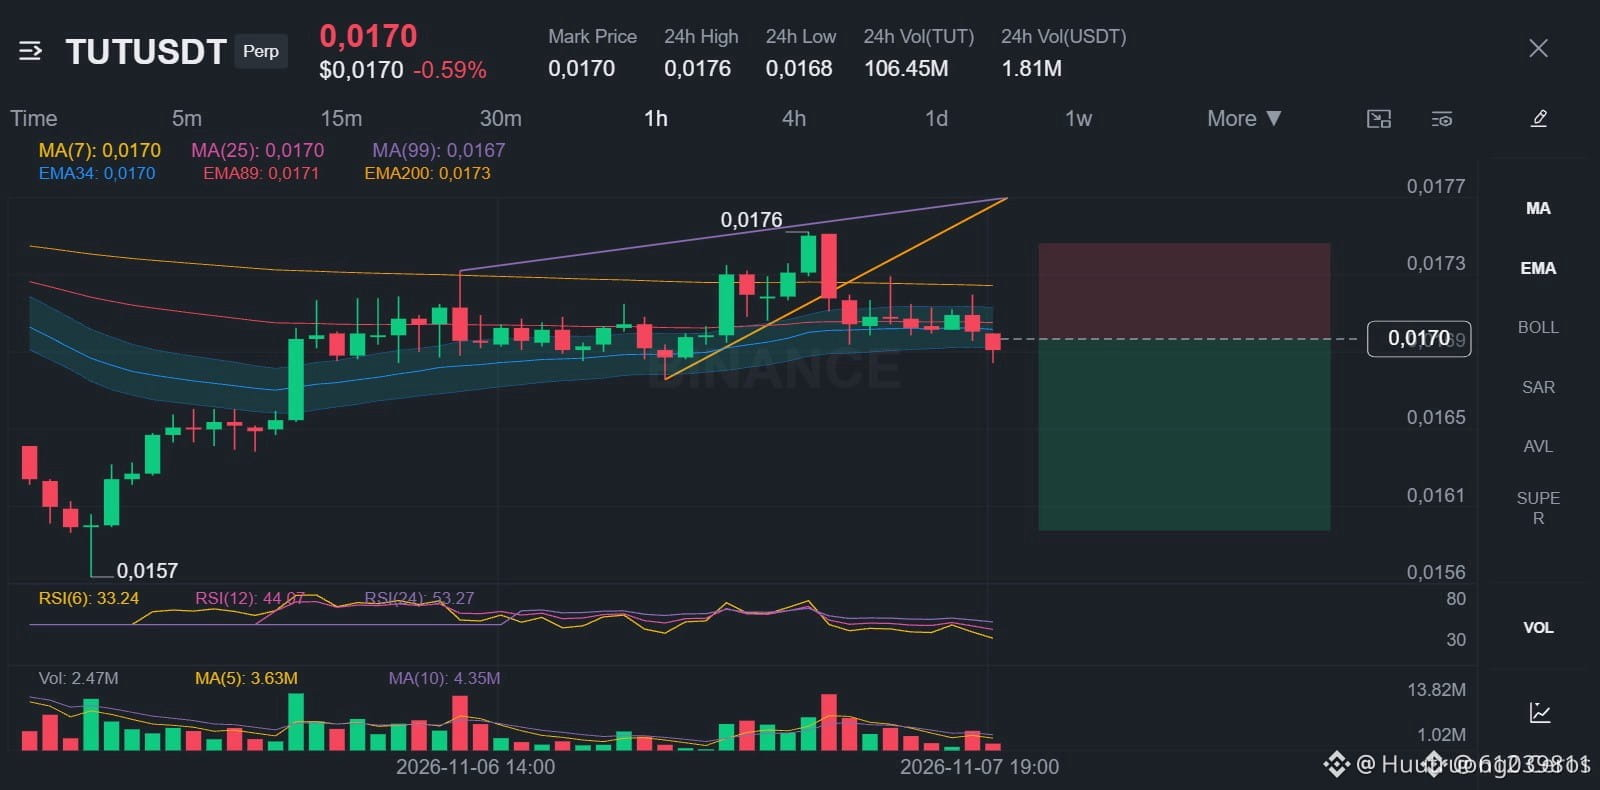
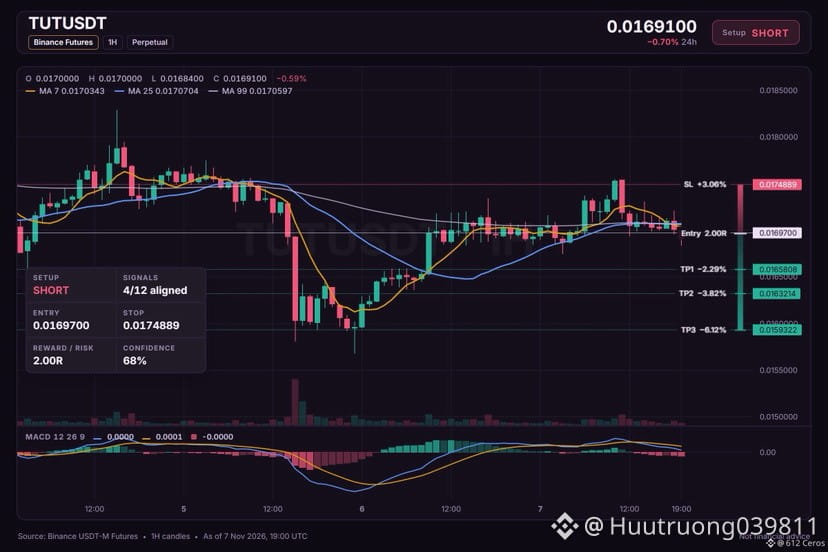
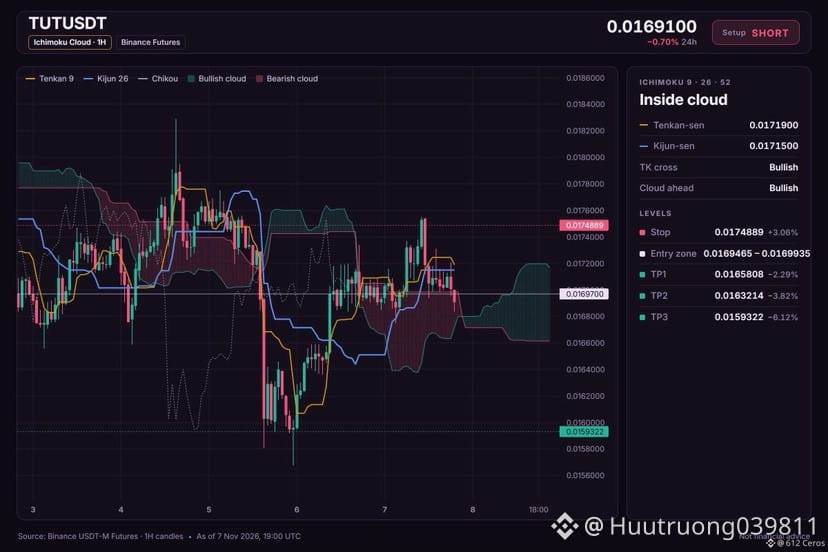
🔴 $TUT /USDT · Bias: SHORT
The daily trend points lower as price sits below both EMAs in a bearish stack.
Entry: 0.0169465 – 0.0169935
TP1: 0.0165808 (-2.3%)
TP2: 0.0163214 (-3.8%)
TP3: 0.0159322 (-6.1%)
SL: 0.0174889 (+3.1%)
Note: moderate conviction only, keep size light.
Why: Daily trend shows price below EMA50 and EMA200 in a bearish stack, meaning the big-picture trend is down.
Plan: close 50% at TP1, 25% at TP2, 25% at TP3, and move the stop to entry after TP1.
Where do you want to take profits on this short?
{spot}(TUTUSDT)
🔴 $TUT /USDT · Bias: SHORT
The daily trend points lower as price sits below both EMAs in a bearish stack.
Entry: 0.0169465 – 0.0169935
TP1: 0.0165808 (-2.3%)
TP2: 0.0163214 (-3.8%)
TP3: 0.0159322 (-6.1%)
SL: 0.0174889 (+3.1%)
Note: moderate conviction only, keep size light.
Why: Daily trend shows price below EMA50 and EMA200 in a bearish stack, meaning the big-picture trend is down.
Plan: close 50% at TP1, 25% at TP2, 25% at TP3, and move the stop to entry after TP1.
Where do you want to take profits on this short?
The daily trend points lower as price sits below both EMAs in a bearish stack.
Entry: 0.0169465 – 0.0169935
TP1: 0.0165808 (-2.3%)
TP2: 0.0163214 (-3.8%)
TP3: 0.0159322 (-6.1%)
SL: 0.0174889 (+3.1%)
Note: moderate conviction only, keep size light.
Why: Daily trend shows price below EMA50 and EMA200 in a bearish stack, meaning the big-picture trend is down.
Plan: close 50% at TP1, 25% at TP2, 25% at TP3, and move the stop to entry after TP1.
Where do you want to take profits on this short?
12
·
--
ສັນຍານໝີ
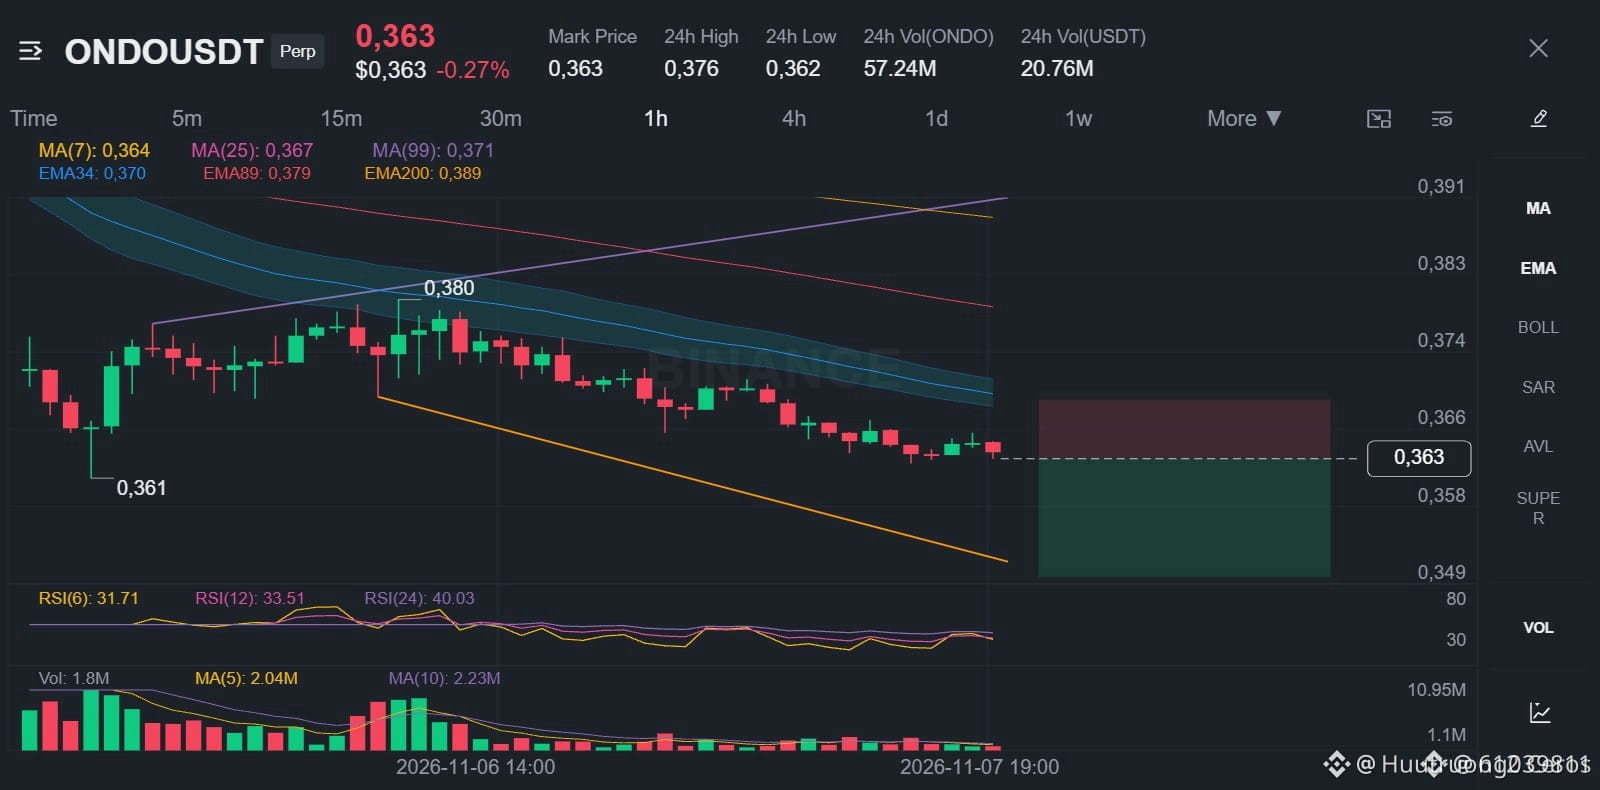
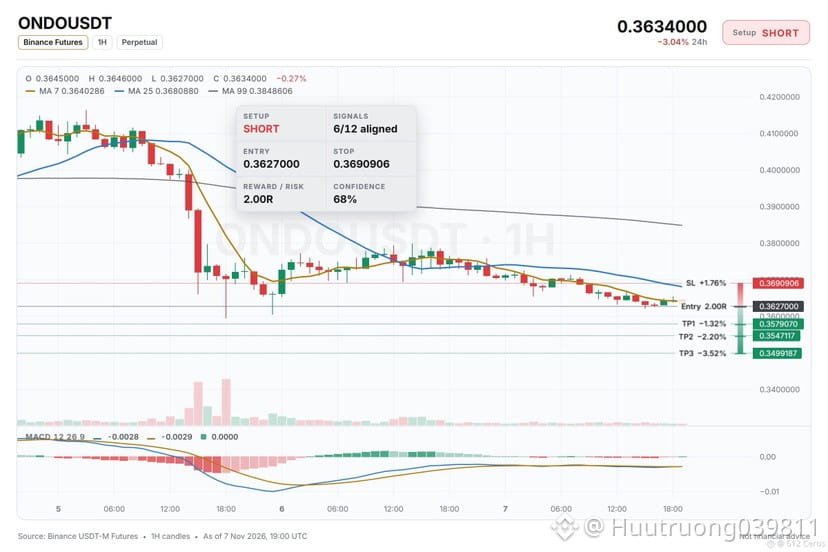
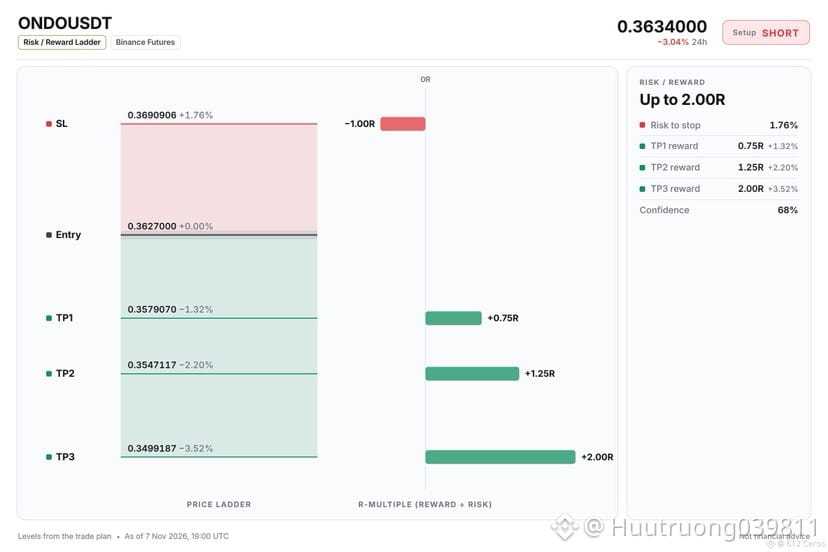
🔴 $ONDO /USDT · Bias: SHORT
Price sits below both EMAs in a bearish stack, pointing lower.
Entry: 0.3624450 – 0.3629550
TP1: 0.3579070 (-1.3%)
TP2: 0.3547117 (-2.2%)
TP3: 0.3499187 (-3.5%)
SL: 0.3690906 (+1.8%)
Why: ADX 26.8 with sellers in control means the short-term move has strong directional momentum.
Risk: Far below its average, bounce likely (−3.8 ATR from 1h EMA50)
Plan: close 50% at TP1, 25% at TP2, 25% at TP3, and move the stop to entry after TP1.
Where do you see ONDO heading from here?
{spot}(ONDOUSDT)
🔴 $ONDO /USDT · Bias: SHORT
Price sits below both EMAs in a bearish stack, pointing lower.
Entry: 0.3624450 – 0.3629550
TP1: 0.3579070 (-1.3%)
TP2: 0.3547117 (-2.2%)
TP3: 0.3499187 (-3.5%)
SL: 0.3690906 (+1.8%)
Why: ADX 26.8 with sellers in control means the short-term move has strong directional momentum.
Risk: Far below its average, bounce likely (−3.8 ATR from 1h EMA50)
Plan: close 50% at TP1, 25% at TP2, 25% at TP3, and move the stop to entry after TP1.
Where do you see ONDO heading from here?
Price sits below both EMAs in a bearish stack, pointing lower.
Entry: 0.3624450 – 0.3629550
TP1: 0.3579070 (-1.3%)
TP2: 0.3547117 (-2.2%)
TP3: 0.3499187 (-3.5%)
SL: 0.3690906 (+1.8%)
Why: ADX 26.8 with sellers in control means the short-term move has strong directional momentum.
Risk: Far below its average, bounce likely (−3.8 ATR from 1h EMA50)
Plan: close 50% at TP1, 25% at TP2, 25% at TP3, and move the stop to entry after TP1.
Where do you see ONDO heading from here?
19
·
--
ສັນຍານໝີ
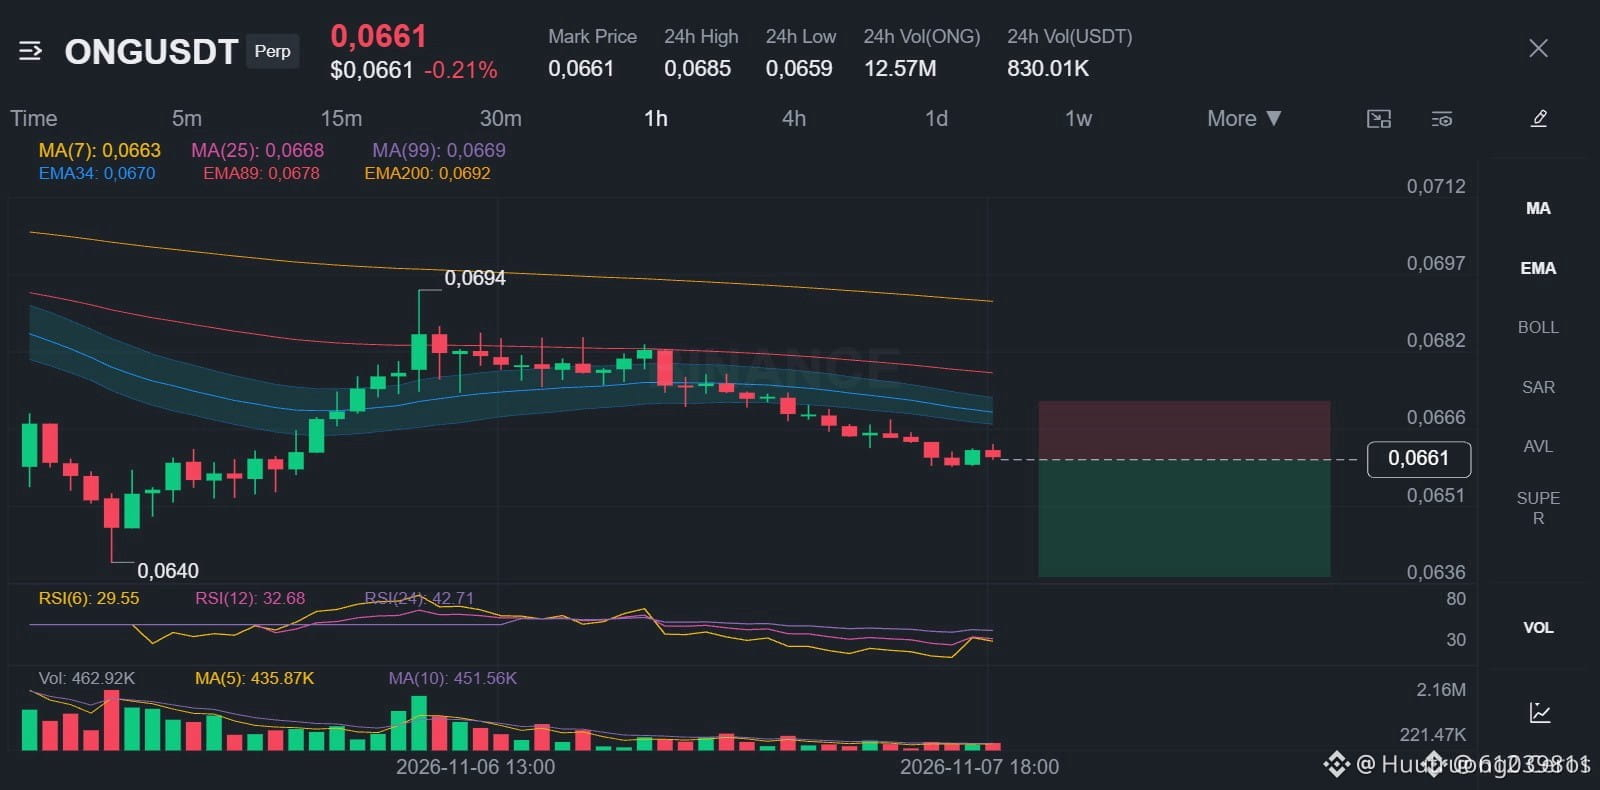
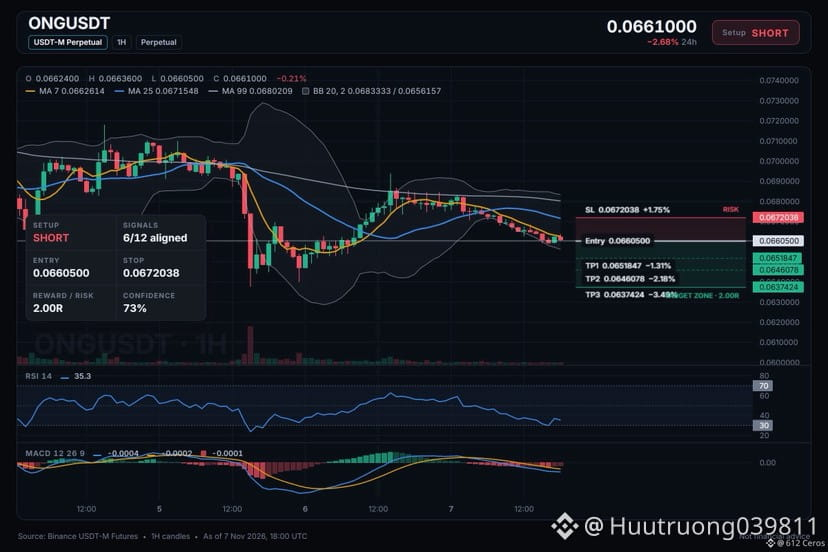
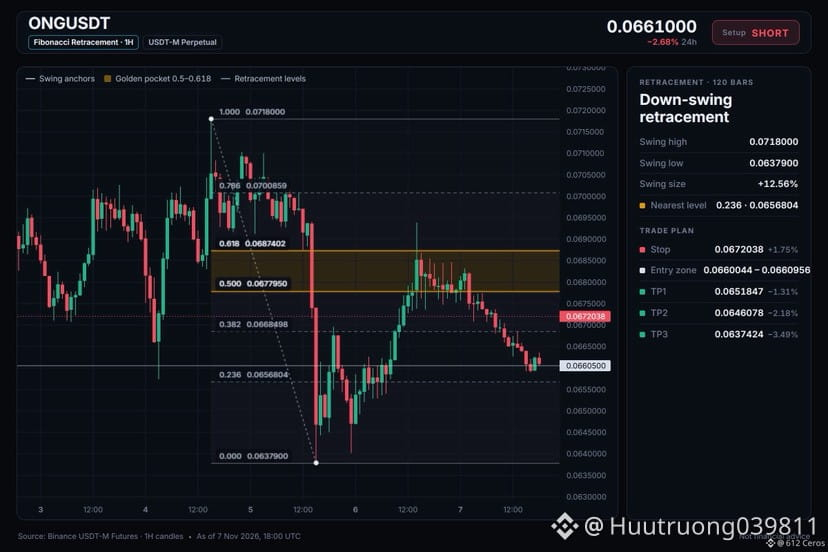
🔴 $ONG /USDT · Bias: SHORT
The 4h price sits below both EMAs in a bearish stack, pointing lower.
Entry: 0.0660044 – 0.0660956
TP1: 0.0651847 (-1.3%)
TP2: 0.0646078 (-2.2%)
TP3: 0.0637424 (-3.5%)
SL: 0.0672038 (+1.7%)
Why: The 4h trend shows price below EMA50 and EMA200, a bearish stack meaning the swing trend is down.
Plan: close 50% at TP1, 25% at TP2, 25% at TP3, and move the stop to entry after TP1.
Do you see this as a valid short entry?
{spot}(ONGUSDT)
🔴 $ONG /USDT · Bias: SHORT
The 4h price sits below both EMAs in a bearish stack, pointing lower.
Entry: 0.0660044 – 0.0660956
TP1: 0.0651847 (-1.3%)
TP2: 0.0646078 (-2.2%)
TP3: 0.0637424 (-3.5%)
SL: 0.0672038 (+1.7%)
Why: The 4h trend shows price below EMA50 and EMA200, a bearish stack meaning the swing trend is down.
Plan: close 50% at TP1, 25% at TP2, 25% at TP3, and move the stop to entry after TP1.
Do you see this as a valid short entry?
The 4h price sits below both EMAs in a bearish stack, pointing lower.
Entry: 0.0660044 – 0.0660956
TP1: 0.0651847 (-1.3%)
TP2: 0.0646078 (-2.2%)
TP3: 0.0637424 (-3.5%)
SL: 0.0672038 (+1.7%)
Why: The 4h trend shows price below EMA50 and EMA200, a bearish stack meaning the swing trend is down.
Plan: close 50% at TP1, 25% at TP2, 25% at TP3, and move the stop to entry after TP1.
Do you see this as a valid short entry?
19
·
--
ສັນຍານໝີ
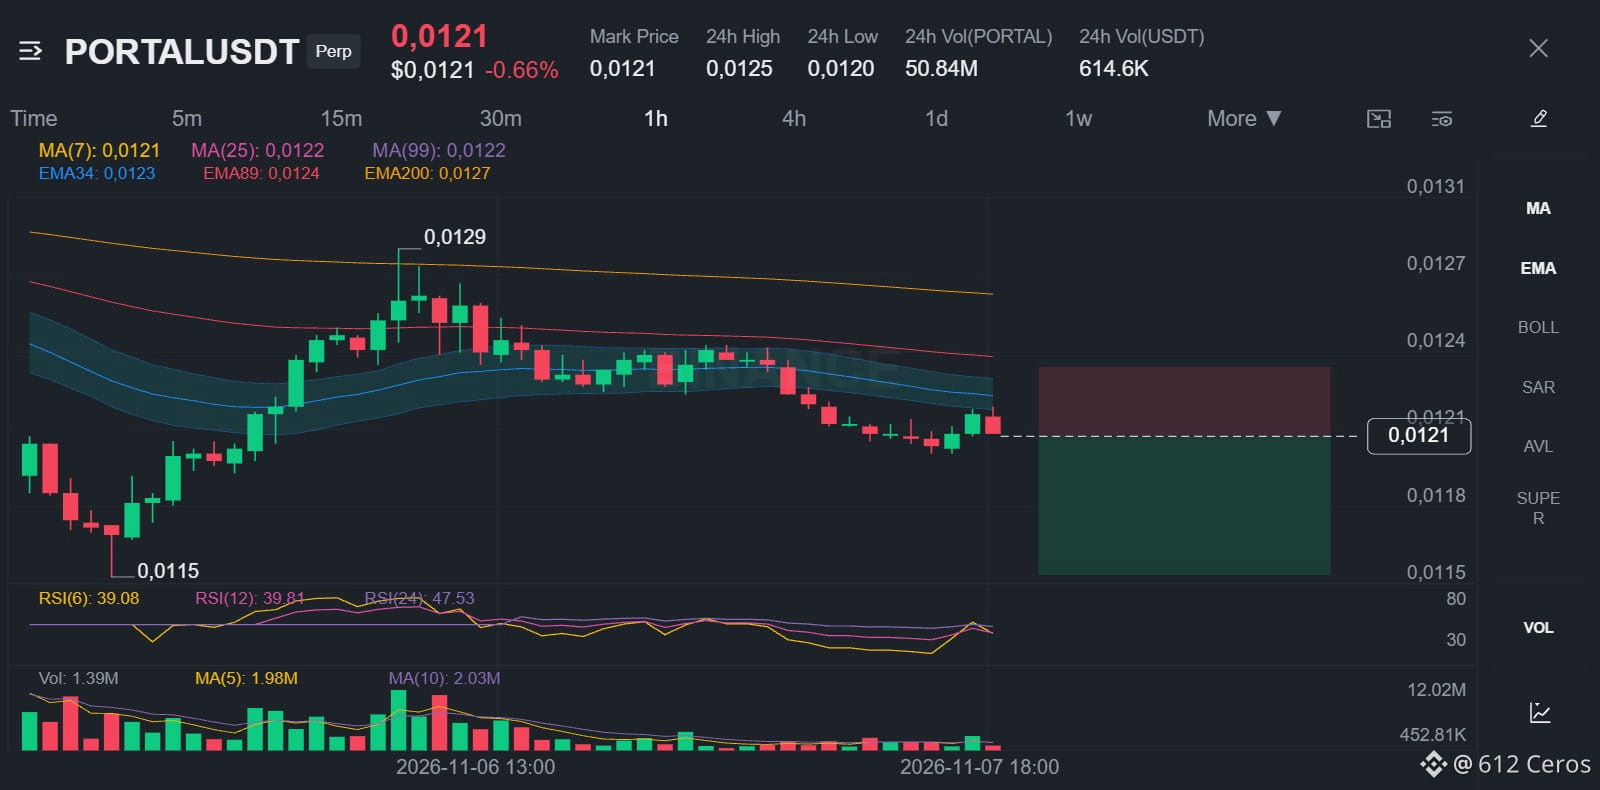
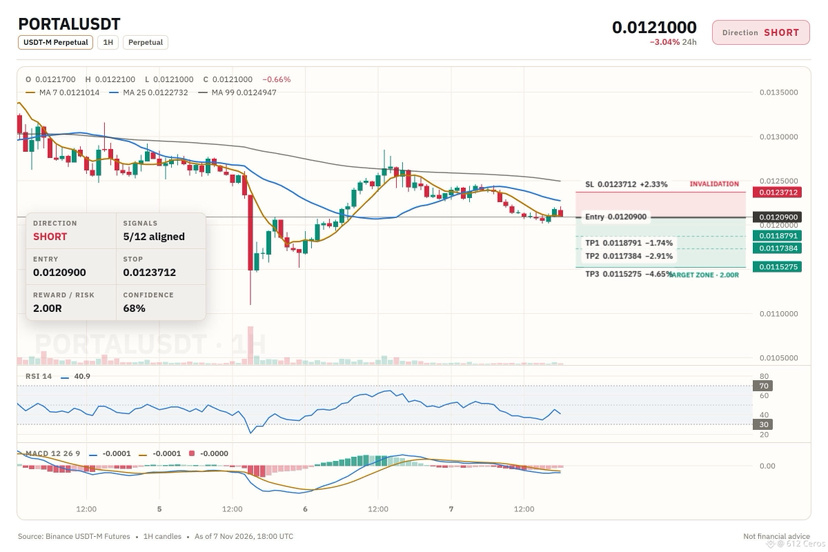
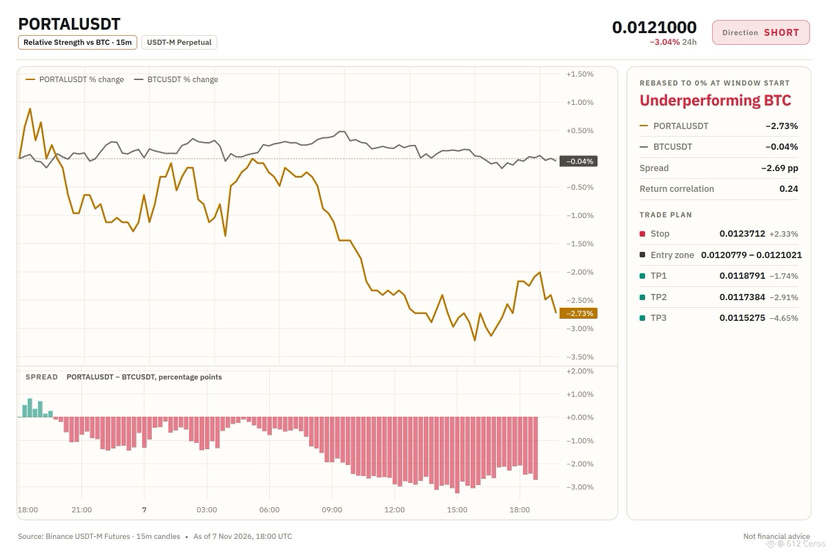
🔴 $PORTAL /USDT · Bias: SHORT
Price sits below both EMAs in a bearish stack, pointing lower.
Entry: 0.0120779 – 0.0121021
TP1: 0.0118791 (-1.7%)
TP2: 0.0117384 (-2.9%)
TP3: 0.0115275 (-4.7%)
SL: 0.0123712 (+2.3%)
Note: moderate conviction only, keep size light.
Why: the 4h price is below both EMAs in a bearish stack, meaning the swing trend is down.
Plan: close 50% at TP1, 25% at TP2, 25% at TP3, and move the stop to entry after TP1.
Do you see more downside from here?
{spot}(PORTALUSDT)
🔴 $PORTAL /USDT · Bias: SHORT
Price sits below both EMAs in a bearish stack, pointing lower.
Entry: 0.0120779 – 0.0121021
TP1: 0.0118791 (-1.7%)
TP2: 0.0117384 (-2.9%)
TP3: 0.0115275 (-4.7%)
SL: 0.0123712 (+2.3%)
Note: moderate conviction only, keep size light.
Why: the 4h price is below both EMAs in a bearish stack, meaning the swing trend is down.
Plan: close 50% at TP1, 25% at TP2, 25% at TP3, and move the stop to entry after TP1.
Do you see more downside from here?
Price sits below both EMAs in a bearish stack, pointing lower.
Entry: 0.0120779 – 0.0121021
TP1: 0.0118791 (-1.7%)
TP2: 0.0117384 (-2.9%)
TP3: 0.0115275 (-4.7%)
SL: 0.0123712 (+2.3%)
Note: moderate conviction only, keep size light.
Why: the 4h price is below both EMAs in a bearish stack, meaning the swing trend is down.
Plan: close 50% at TP1, 25% at TP2, 25% at TP3, and move the stop to entry after TP1.
Do you see more downside from here?
17
·
--
ສັນຍານໝີ
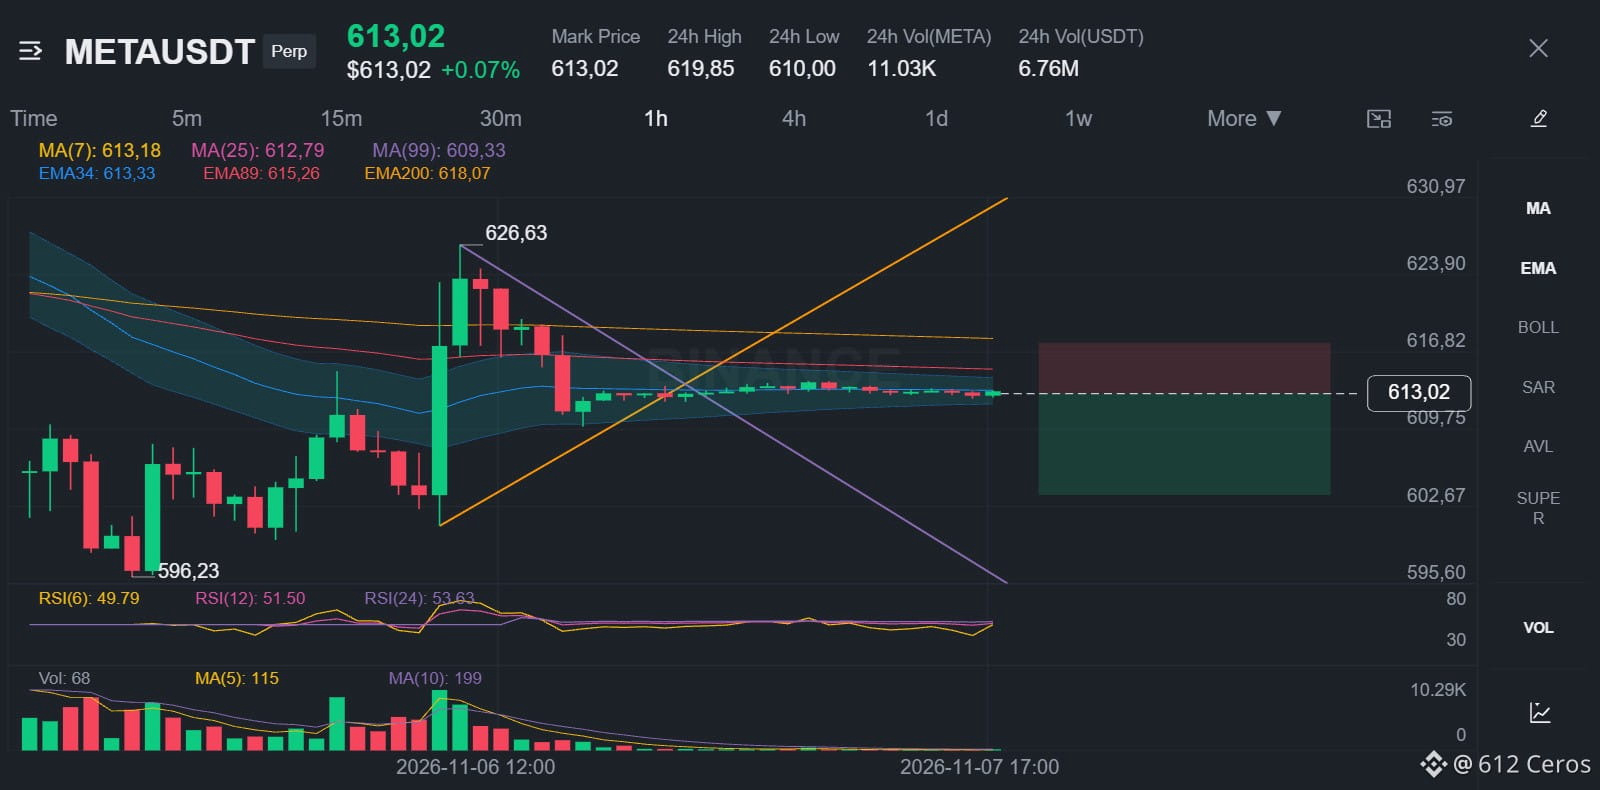
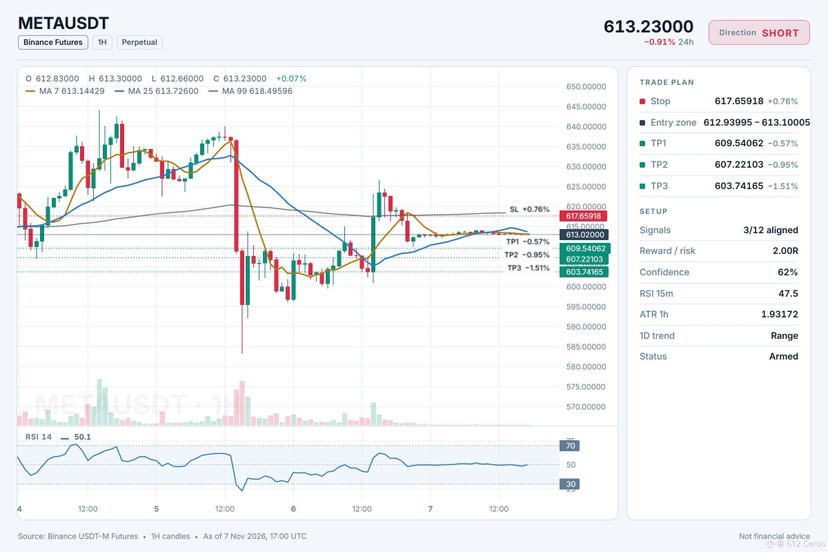
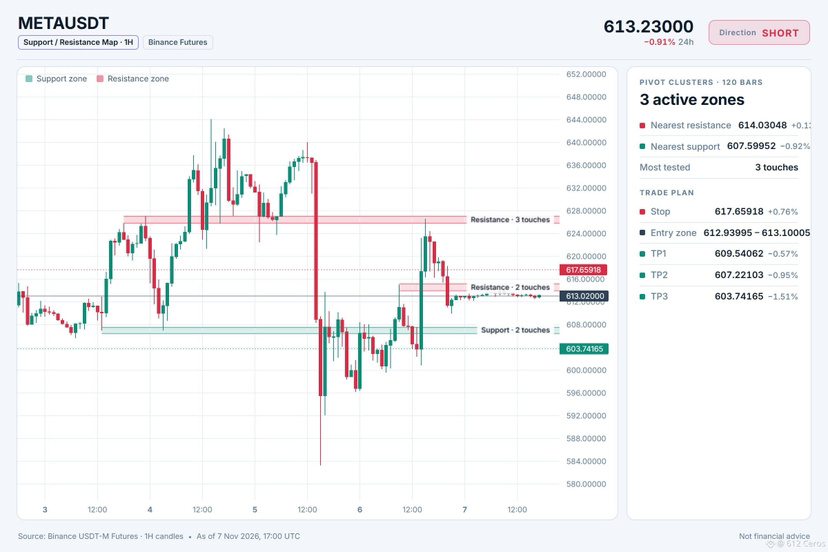
🔴 $META /USDT · Bias: SHORT
4h bearish stack points lower after price broke below both EMAs.
Entry: 612.93995 – 613.10005
TP1: 609.54062 (-0.6%)
TP2: 607.22103 (-0.9%)
TP3: 603.74165 (-1.5%)
SL: 617.65918 (+0.8%)
Note: moderate conviction only, keep size light.
Why: The 4h price sits below both EMAs in a bearish stack, meaning the swing trend is down.
Plan: close 50% at TP1, 25% at TP2, 25% at TP3, and move the stop to entry after TP1.
Do you think price continues lower from here?
{future}(METAUSDT)
🔴 $META /USDT · Bias: SHORT
4h bearish stack points lower after price broke below both EMAs.
Entry: 612.93995 – 613.10005
TP1: 609.54062 (-0.6%)
TP2: 607.22103 (-0.9%)
TP3: 603.74165 (-1.5%)
SL: 617.65918 (+0.8%)
Note: moderate conviction only, keep size light.
Why: The 4h price sits below both EMAs in a bearish stack, meaning the swing trend is down.
Plan: close 50% at TP1, 25% at TP2, 25% at TP3, and move the stop to entry after TP1.
Do you think price continues lower from here?
4h bearish stack points lower after price broke below both EMAs.
Entry: 612.93995 – 613.10005
TP1: 609.54062 (-0.6%)
TP2: 607.22103 (-0.9%)
TP3: 603.74165 (-1.5%)
SL: 617.65918 (+0.8%)
Note: moderate conviction only, keep size light.
Why: The 4h price sits below both EMAs in a bearish stack, meaning the swing trend is down.
Plan: close 50% at TP1, 25% at TP2, 25% at TP3, and move the stop to entry after TP1.
Do you think price continues lower from here?
17
·
--
ສັນຍານກະທິງ
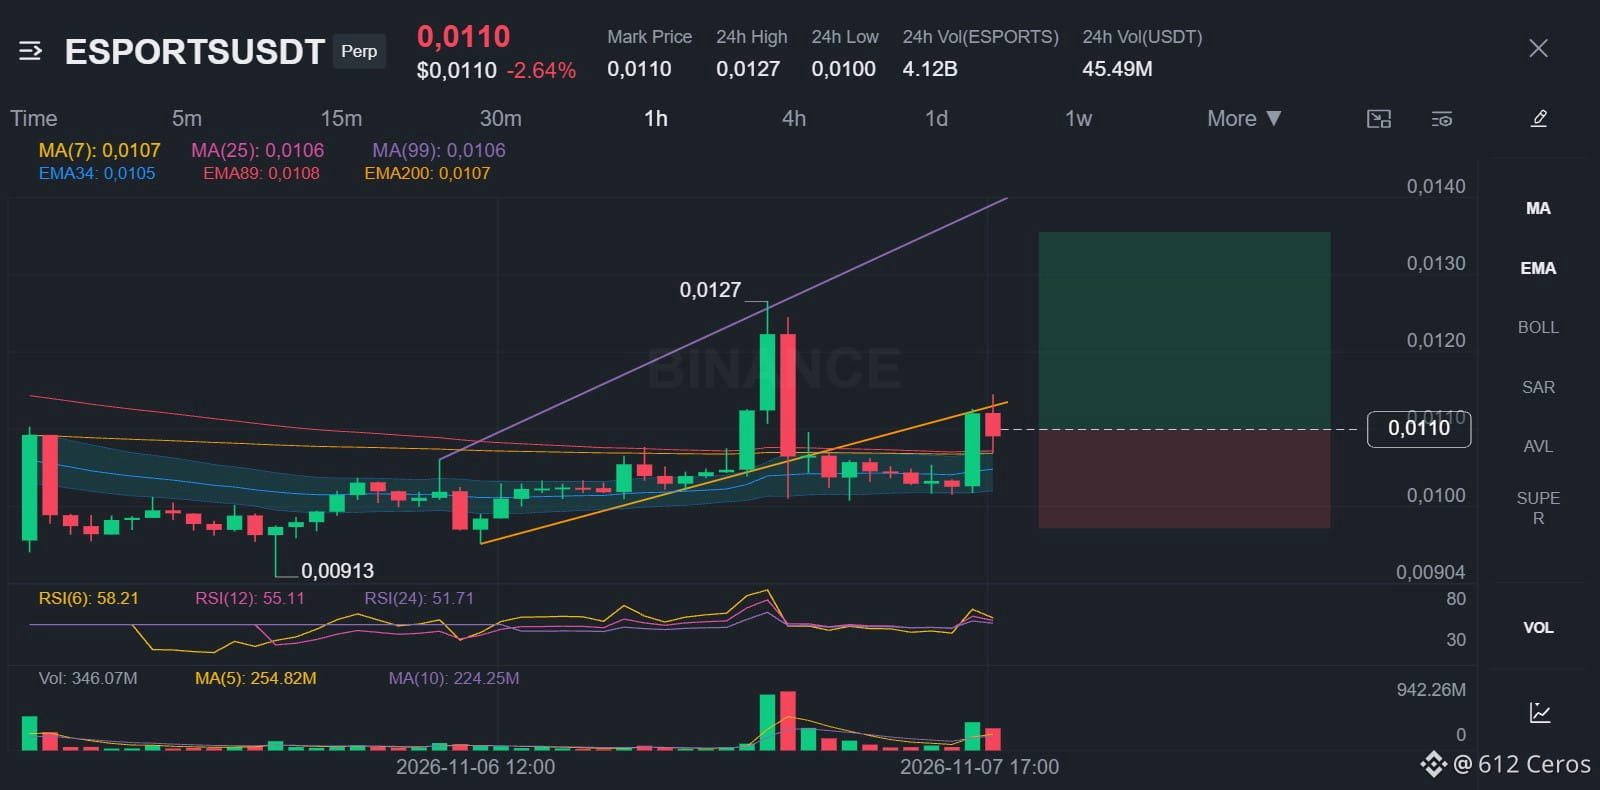
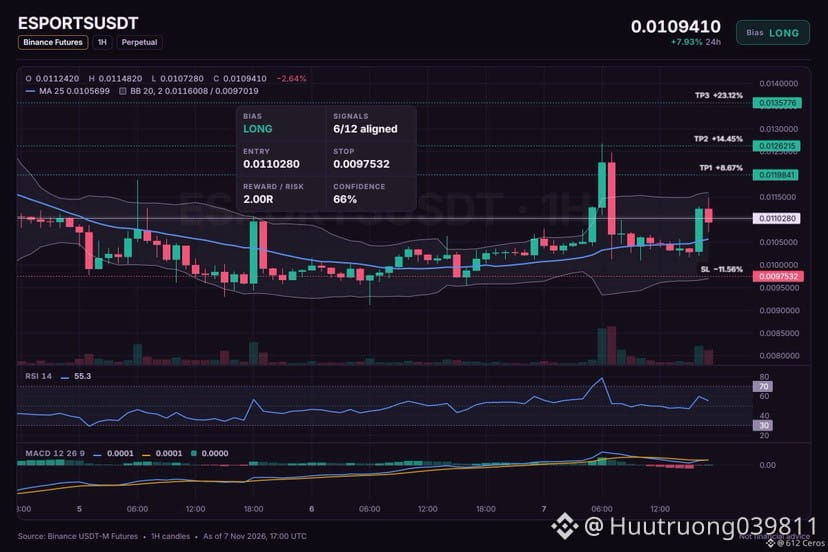
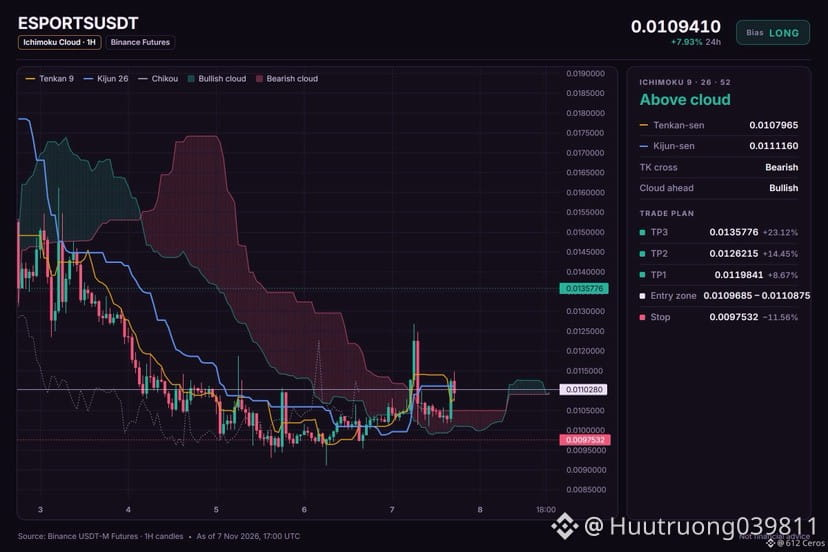
🟢 $ESPORTS /USDT · Bias: LONG
4h bullish stack forms as price rises above both EMAs.
Entry: 0.0109685 – 0.0110875
TP1: 0.0119841 (+8.7%)
TP2: 0.0126215 (+14.4%)
TP3: 0.0135776 (+23.1%)
SL: 0.0097532 (-11.6%)
Caution: counter-trend idea backed by 6 signals only. Smaller size, hard stop.
Why: The 4h trend shows price above EMA50 and EMA200, meaning the swing trend is up, which supports a long.
Risk: Daily trend down (below EMA50 & EMA200)
Plan: close 50% at TP1, 25% at TP2, 25% at TP3, and move the stop to entry after TP1.
Where do you place this counter-trend long?
{future}(ESPORTSUSDT)
🟢 $ESPORTS /USDT · Bias: LONG
4h bullish stack forms as price rises above both EMAs.
Entry: 0.0109685 – 0.0110875
TP1: 0.0119841 (+8.7%)
TP2: 0.0126215 (+14.4%)
TP3: 0.0135776 (+23.1%)
SL: 0.0097532 (-11.6%)
Caution: counter-trend idea backed by 6 signals only. Smaller size, hard stop.
Why: The 4h trend shows price above EMA50 and EMA200, meaning the swing trend is up, which supports a long.
Risk: Daily trend down (below EMA50 & EMA200)
Plan: close 50% at TP1, 25% at TP2, 25% at TP3, and move the stop to entry after TP1.
Where do you place this counter-trend long?
4h bullish stack forms as price rises above both EMAs.
Entry: 0.0109685 – 0.0110875
TP1: 0.0119841 (+8.7%)
TP2: 0.0126215 (+14.4%)
TP3: 0.0135776 (+23.1%)
SL: 0.0097532 (-11.6%)
Caution: counter-trend idea backed by 6 signals only. Smaller size, hard stop.
Why: The 4h trend shows price above EMA50 and EMA200, meaning the swing trend is up, which supports a long.
Risk: Daily trend down (below EMA50 & EMA200)
Plan: close 50% at TP1, 25% at TP2, 25% at TP3, and move the stop to entry after TP1.
Where do you place this counter-trend long?
18
·
--
ສັນຍານໝີ
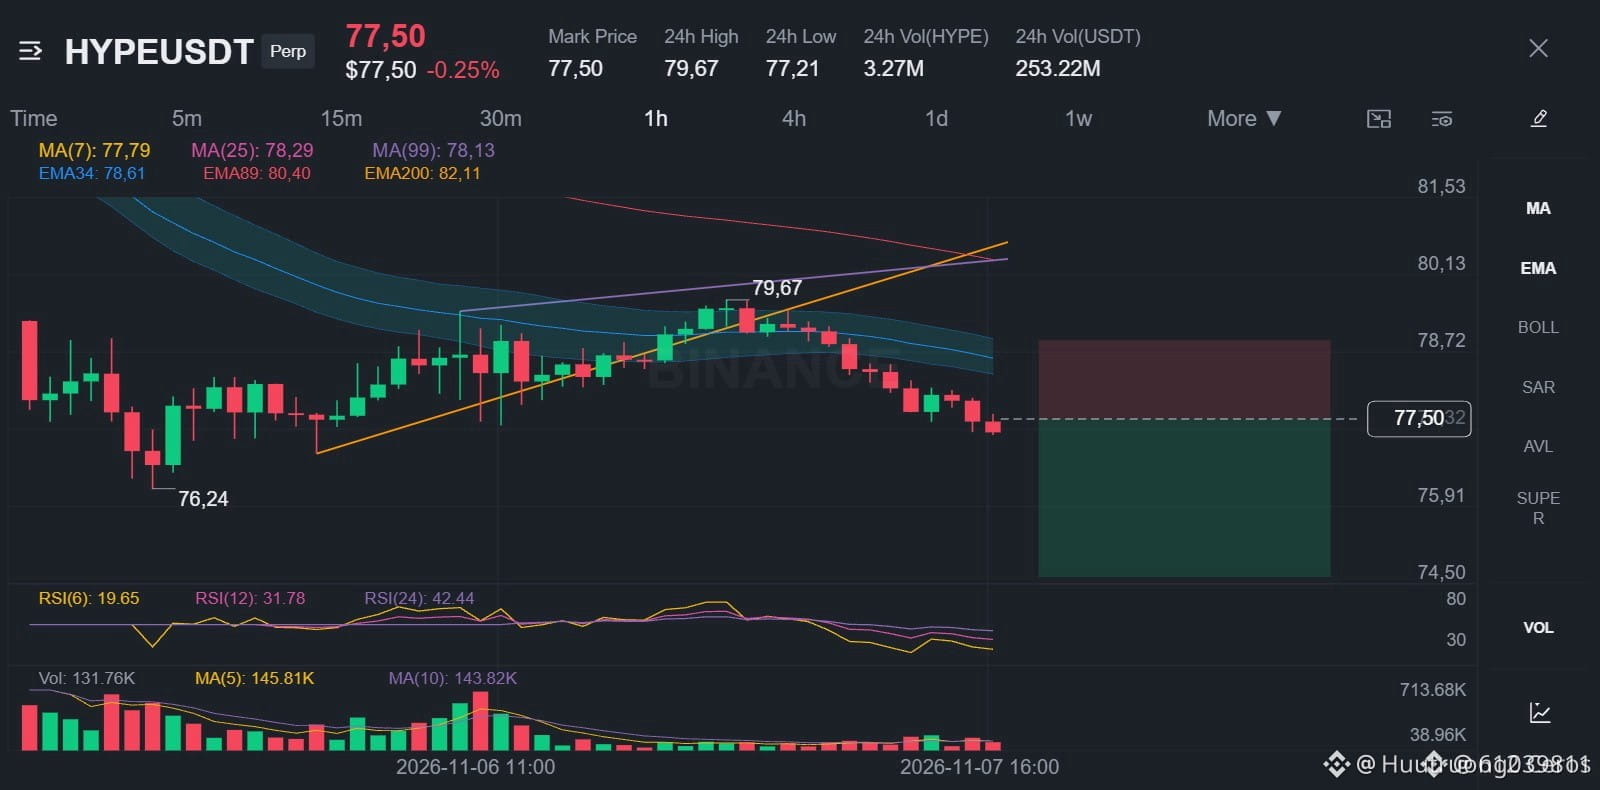
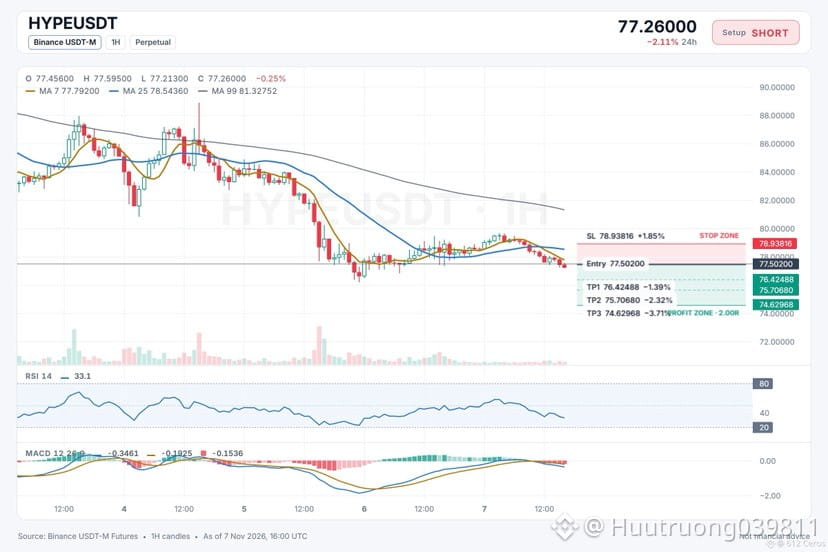
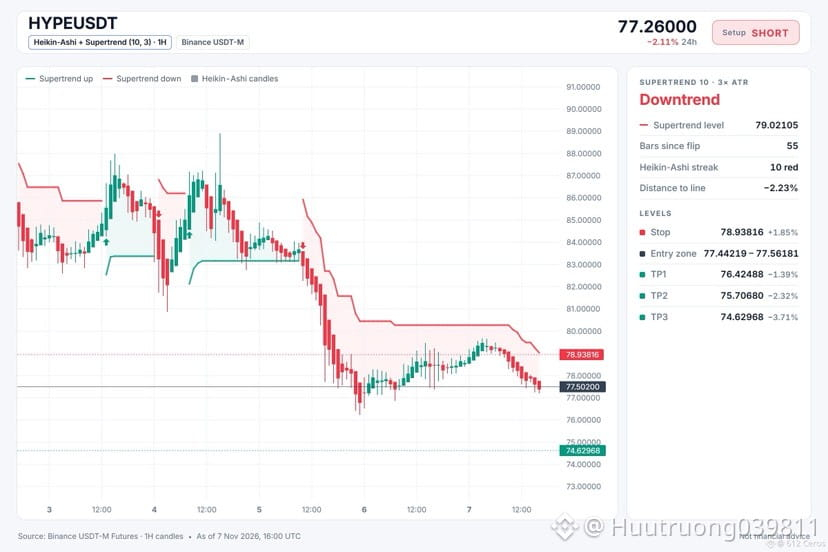
🔴 $HYPE /USDT · Bias: SHORT
The 4h price sits below both EMAs in a bearish stack, pointing lower.
Entry: 77.44219 – 77.56181
TP1: 76.42488 (-1.4%)
TP2: 75.70680 (-2.3%)
TP3: 74.62968 (-3.7%)
SL: 78.93816 (+1.9%)
Note: moderate conviction only, keep size light.
Why: The 1h price is below both EMAs in a bearish stack, so the short-term trend is down.
Plan: close 50% at TP1, 25% at TP2, 25% at TP3, and move the stop to entry after TP1.
Where do you see this trade heading?
{spot}(HYPEUSDT)
🔴 $HYPE /USDT · Bias: SHORT
The 4h price sits below both EMAs in a bearish stack, pointing lower.
Entry: 77.44219 – 77.56181
TP1: 76.42488 (-1.4%)
TP2: 75.70680 (-2.3%)
TP3: 74.62968 (-3.7%)
SL: 78.93816 (+1.9%)
Note: moderate conviction only, keep size light.
Why: The 1h price is below both EMAs in a bearish stack, so the short-term trend is down.
Plan: close 50% at TP1, 25% at TP2, 25% at TP3, and move the stop to entry after TP1.
Where do you see this trade heading?
The 4h price sits below both EMAs in a bearish stack, pointing lower.
Entry: 77.44219 – 77.56181
TP1: 76.42488 (-1.4%)
TP2: 75.70680 (-2.3%)
TP3: 74.62968 (-3.7%)
SL: 78.93816 (+1.9%)
Note: moderate conviction only, keep size light.
Why: The 1h price is below both EMAs in a bearish stack, so the short-term trend is down.
Plan: close 50% at TP1, 25% at TP2, 25% at TP3, and move the stop to entry after TP1.
Where do you see this trade heading?
7
·
--
ສັນຍານໝີ
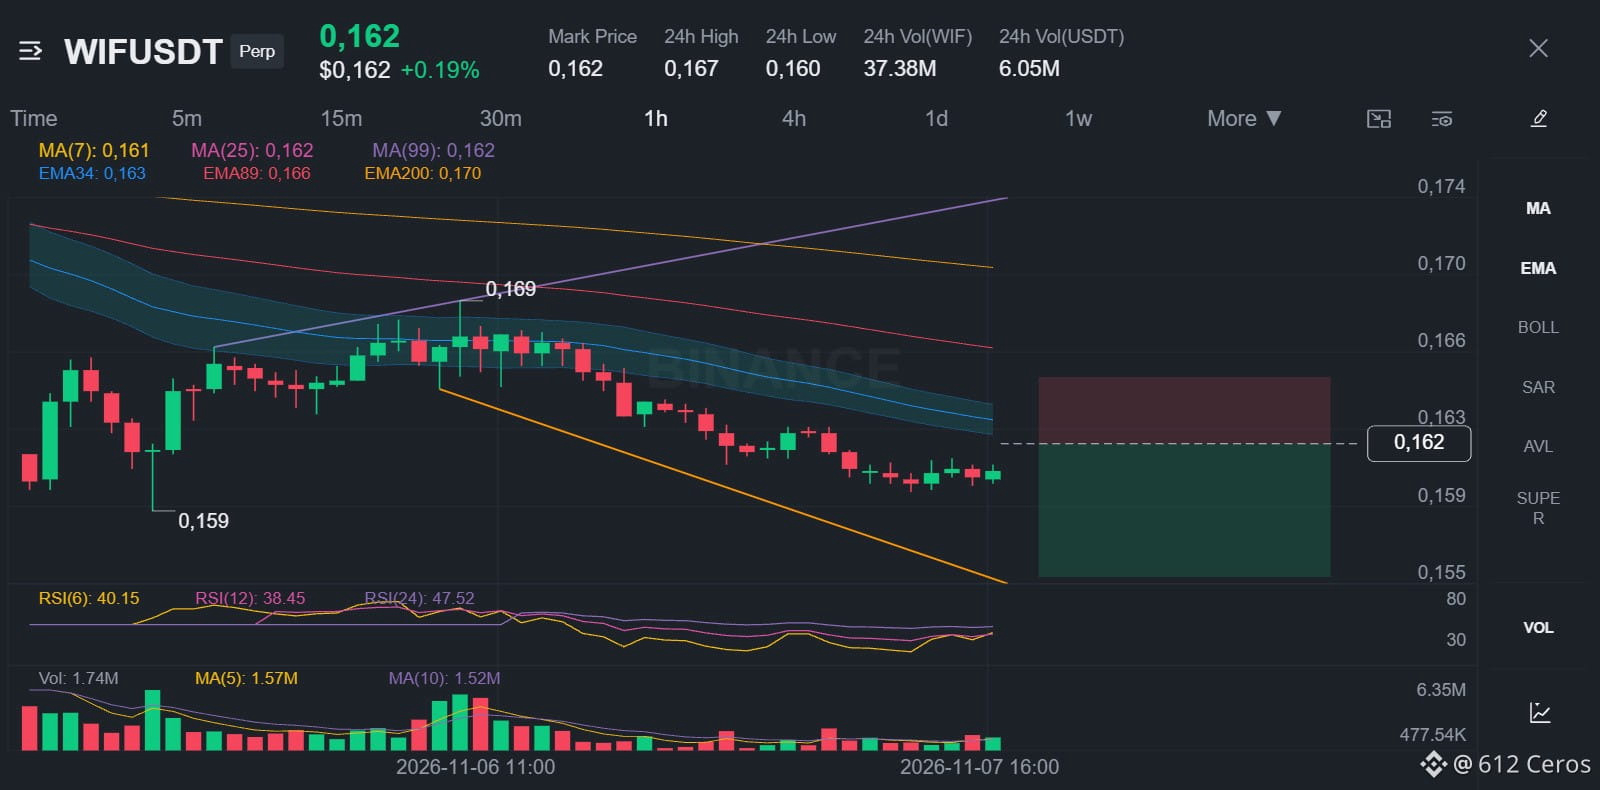
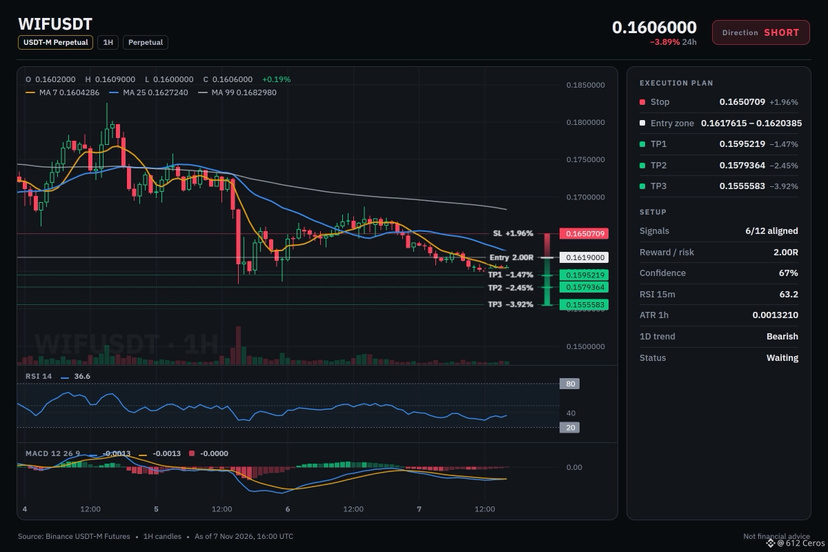
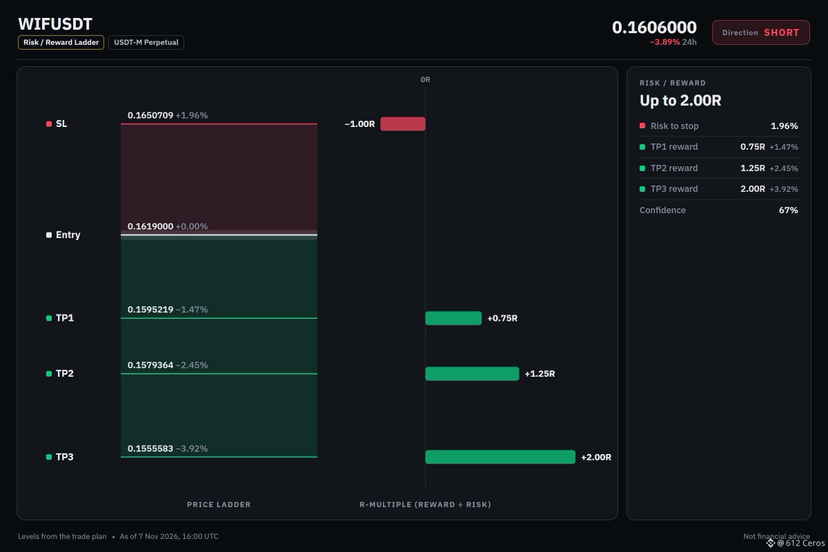
🔴 $WIF /USDT · Bias: SHORT
Daily bearish stack with price below both EMAs points lower.
Entry: 0.1617615 – 0.1620385
TP1: 0.1595219 (-1.5%)
TP2: 0.1579364 (-2.4%)
TP3: 0.1555583 (-3.9%)
SL: 0.1650709 (+2.0%)
Why: The daily trend is bearish with price below both EMAs, pointing lower, which means the big-picture trend is down.
Risk: Buyers are driving the move (15m ADX 20.5)
Plan: close 50% at TP1, 25% at TP2, 25% at TP3, and move the stop to entry after TP1.
Where do you see this heading next?
{spot}(WIFUSDT)
🔴 $WIF /USDT · Bias: SHORT
Daily bearish stack with price below both EMAs points lower.
Entry: 0.1617615 – 0.1620385
TP1: 0.1595219 (-1.5%)
TP2: 0.1579364 (-2.4%)
TP3: 0.1555583 (-3.9%)
SL: 0.1650709 (+2.0%)
Why: The daily trend is bearish with price below both EMAs, pointing lower, which means the big-picture trend is down.
Risk: Buyers are driving the move (15m ADX 20.5)
Plan: close 50% at TP1, 25% at TP2, 25% at TP3, and move the stop to entry after TP1.
Where do you see this heading next?
Daily bearish stack with price below both EMAs points lower.
Entry: 0.1617615 – 0.1620385
TP1: 0.1595219 (-1.5%)
TP2: 0.1579364 (-2.4%)
TP3: 0.1555583 (-3.9%)
SL: 0.1650709 (+2.0%)
Why: The daily trend is bearish with price below both EMAs, pointing lower, which means the big-picture trend is down.
Risk: Buyers are driving the move (15m ADX 20.5)
Plan: close 50% at TP1, 25% at TP2, 25% at TP3, and move the stop to entry after TP1.
Where do you see this heading next?
18
·
--
ສັນຍານໝີ
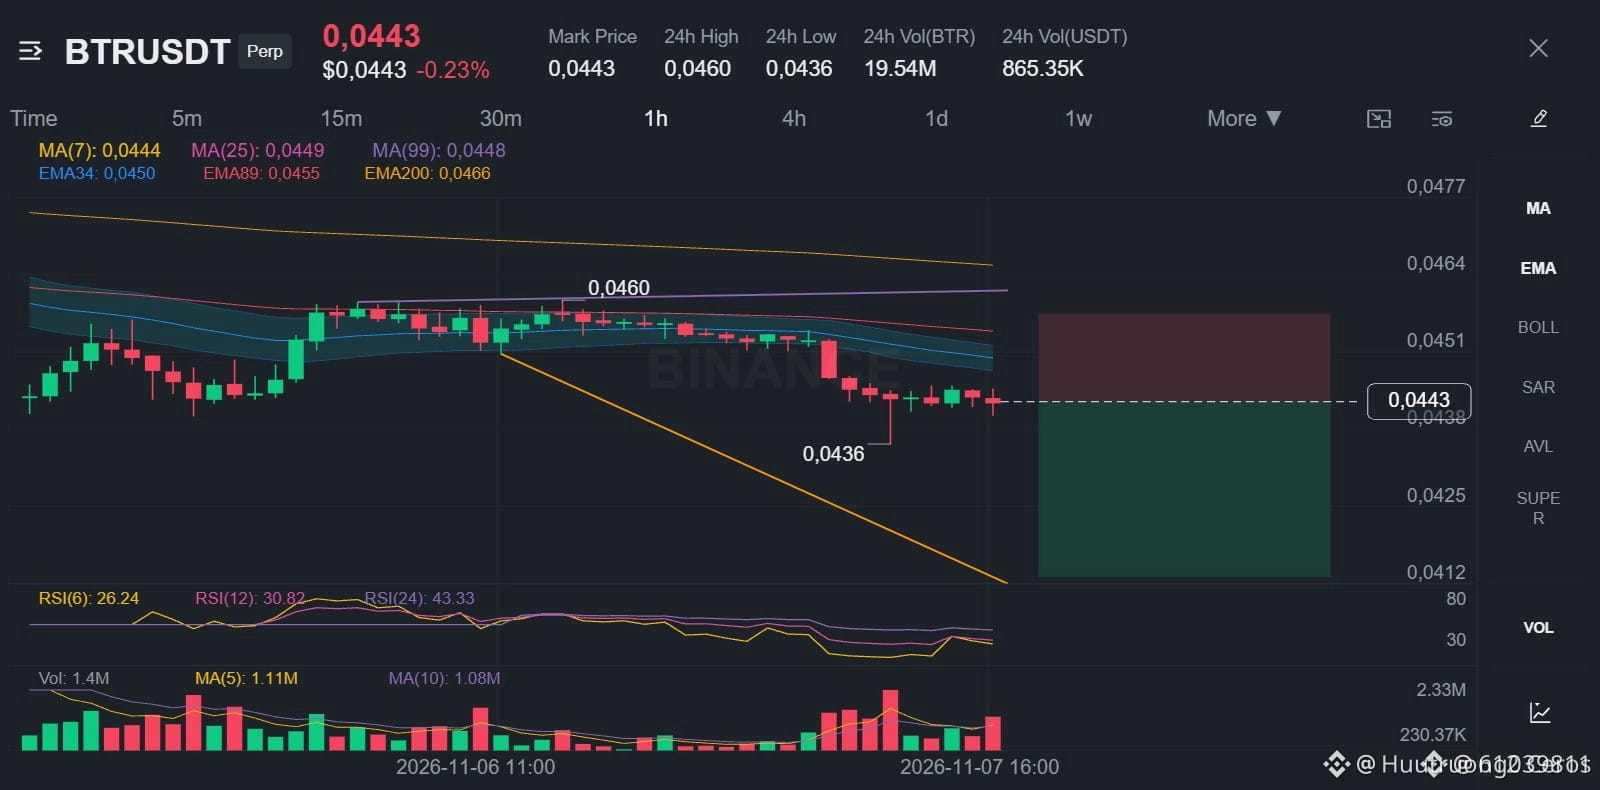
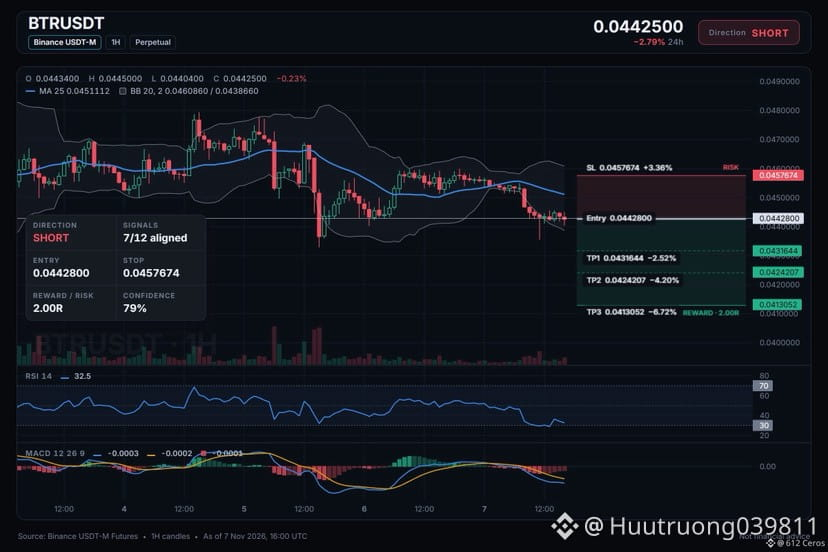
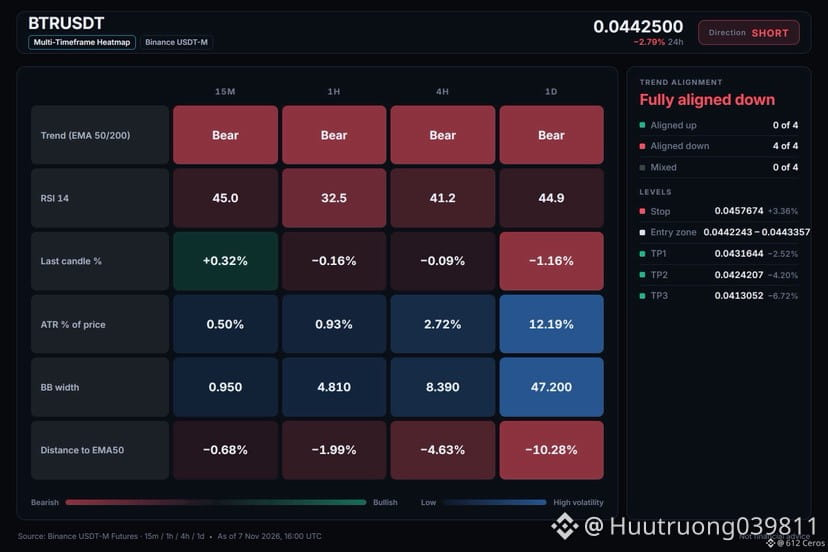
🔴 $BTR /USDT · Bias: SHORT
The daily trend is bearish with price below both EMAs, pointing lower.
Entry: 0.0442243 – 0.0443357
TP1: 0.0431644 (-2.5%)
TP2: 0.0424207 (-4.2%)
TP3: 0.0413052 (-6.7%)
SL: 0.0457674 (+3.4%)
Why: The daily trend shows price below EMA50 and EMA200, a bearish stack meaning the big picture is down.
Plan: close 50% at TP1, 25% at TP2, 25% at TP3, and move the stop to entry after TP1.
Where do you want to see this trade go?
{future}(BTRUSDT)
🔴 $BTR /USDT · Bias: SHORT
The daily trend is bearish with price below both EMAs, pointing lower.
Entry: 0.0442243 – 0.0443357
TP1: 0.0431644 (-2.5%)
TP2: 0.0424207 (-4.2%)
TP3: 0.0413052 (-6.7%)
SL: 0.0457674 (+3.4%)
Why: The daily trend shows price below EMA50 and EMA200, a bearish stack meaning the big picture is down.
Plan: close 50% at TP1, 25% at TP2, 25% at TP3, and move the stop to entry after TP1.
Where do you want to see this trade go?
The daily trend is bearish with price below both EMAs, pointing lower.
Entry: 0.0442243 – 0.0443357
TP1: 0.0431644 (-2.5%)
TP2: 0.0424207 (-4.2%)
TP3: 0.0413052 (-6.7%)
SL: 0.0457674 (+3.4%)
Why: The daily trend shows price below EMA50 and EMA200, a bearish stack meaning the big picture is down.
Plan: close 50% at TP1, 25% at TP2, 25% at TP3, and move the stop to entry after TP1.
Where do you want to see this trade go?
10
·
--
ສັນຍານໝີ
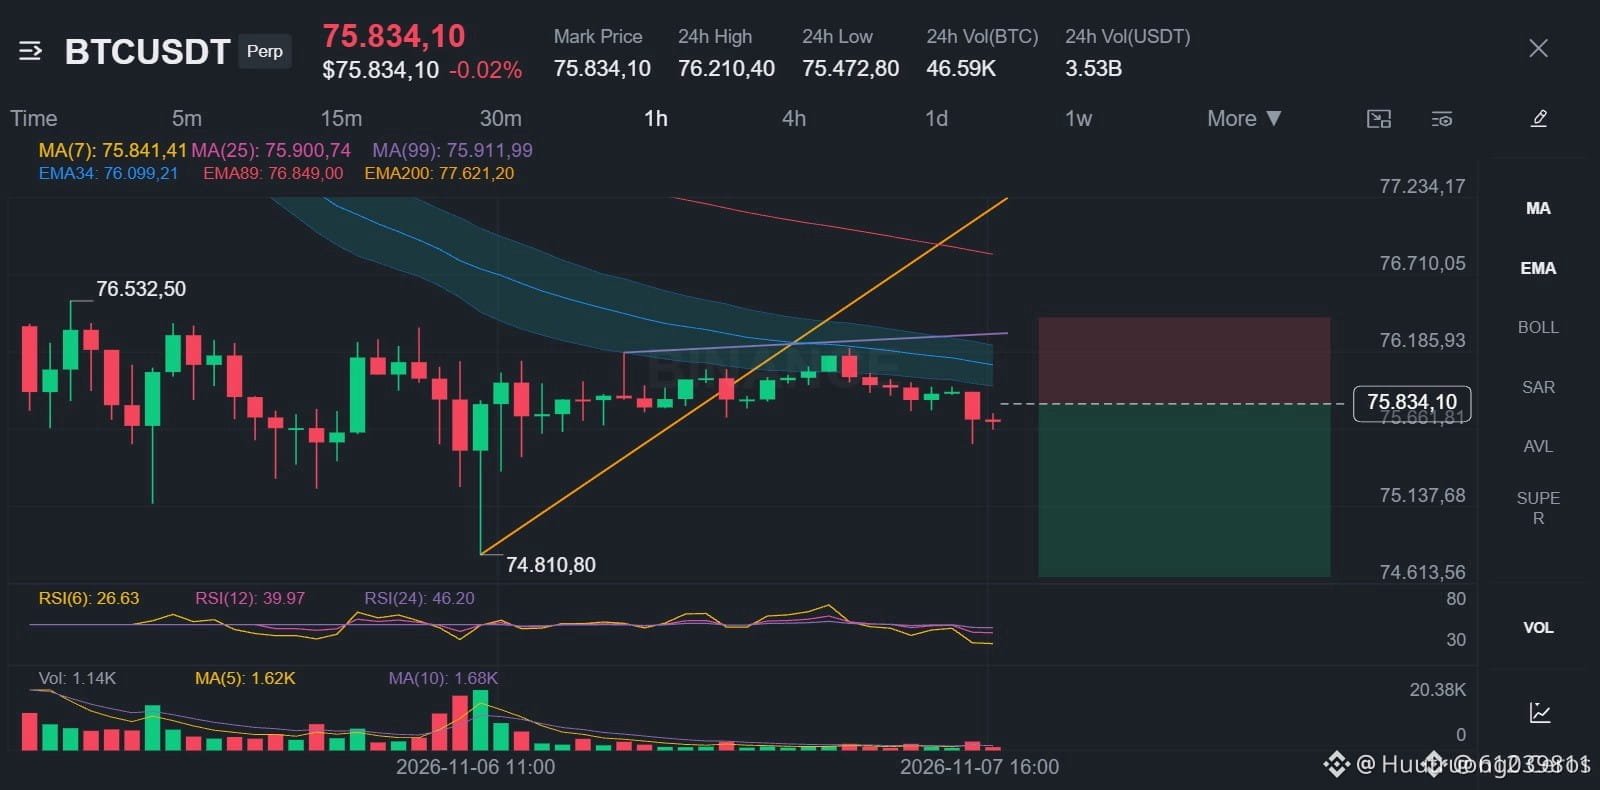
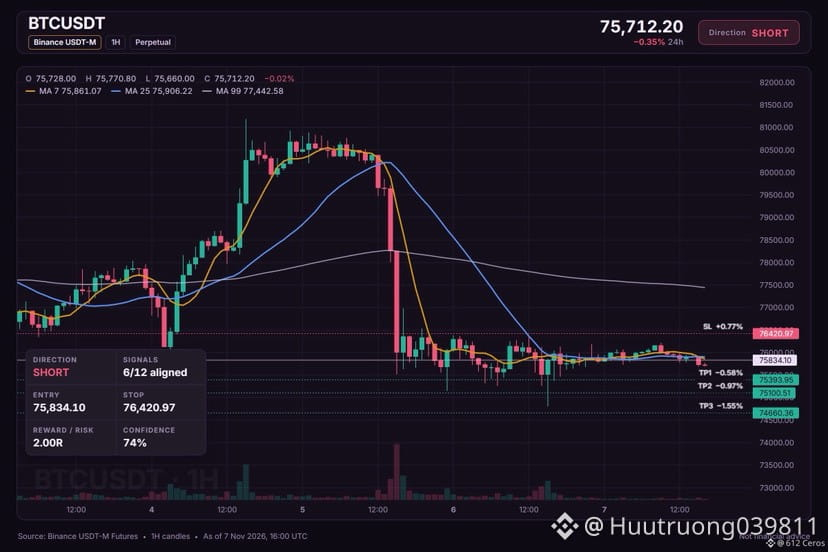
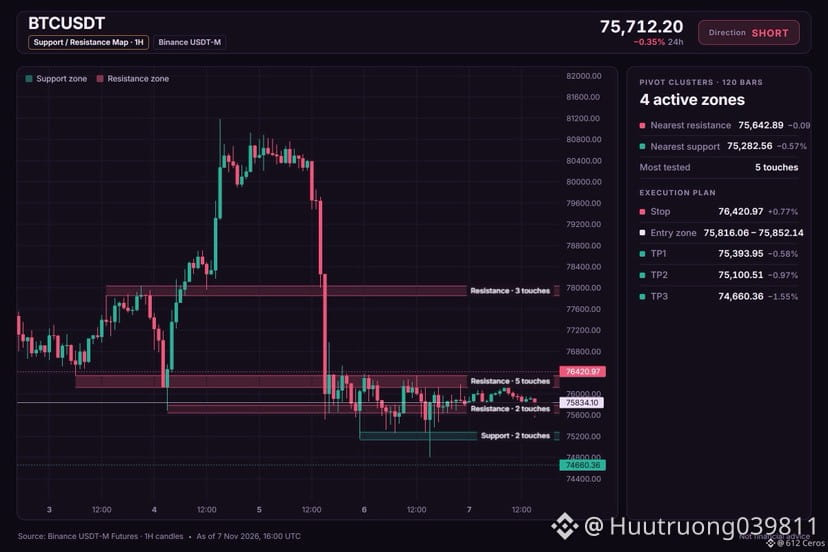
🔴 $BTC /USDT · Bias: SHORT
4h bearish stack points lower after price broke below both EMAs.
Entry: 75816.06 – 75852.14
TP1: 75393.95 (-0.6%)
TP2: 75100.51 (-1.0%)
TP3: 74660.36 (-1.5%)
SL: 76420.97 (+0.8%)
Why: The 4h trend shows price below both EMAs in a bearish stack, meaning the swing trend is down.
Plan: close 50% at TP1, 25% at TP2, 25% at TP3, and move the stop to entry after TP1.
Where do you take profit on this short?
{spot}(BTCUSDT)
🔴 $BTC /USDT · Bias: SHORT
4h bearish stack points lower after price broke below both EMAs.
Entry: 75816.06 – 75852.14
TP1: 75393.95 (-0.6%)
TP2: 75100.51 (-1.0%)
TP3: 74660.36 (-1.5%)
SL: 76420.97 (+0.8%)
Why: The 4h trend shows price below both EMAs in a bearish stack, meaning the swing trend is down.
Plan: close 50% at TP1, 25% at TP2, 25% at TP3, and move the stop to entry after TP1.
Where do you take profit on this short?
4h bearish stack points lower after price broke below both EMAs.
Entry: 75816.06 – 75852.14
TP1: 75393.95 (-0.6%)
TP2: 75100.51 (-1.0%)
TP3: 74660.36 (-1.5%)
SL: 76420.97 (+0.8%)
Why: The 4h trend shows price below both EMAs in a bearish stack, meaning the swing trend is down.
Plan: close 50% at TP1, 25% at TP2, 25% at TP3, and move the stop to entry after TP1.
Where do you take profit on this short?
9
·
--
ສັນຍານໝີ
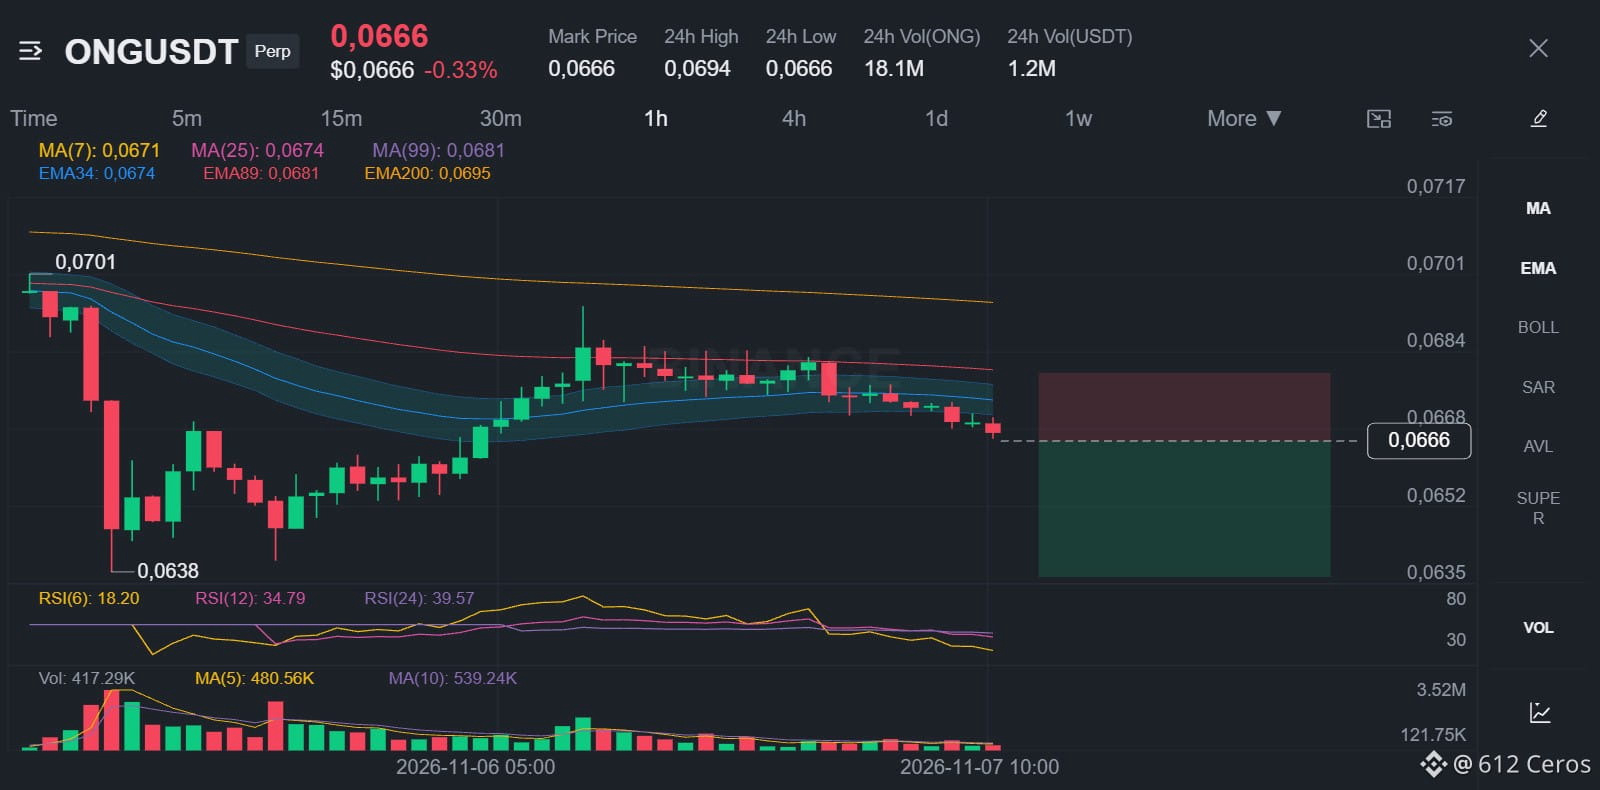
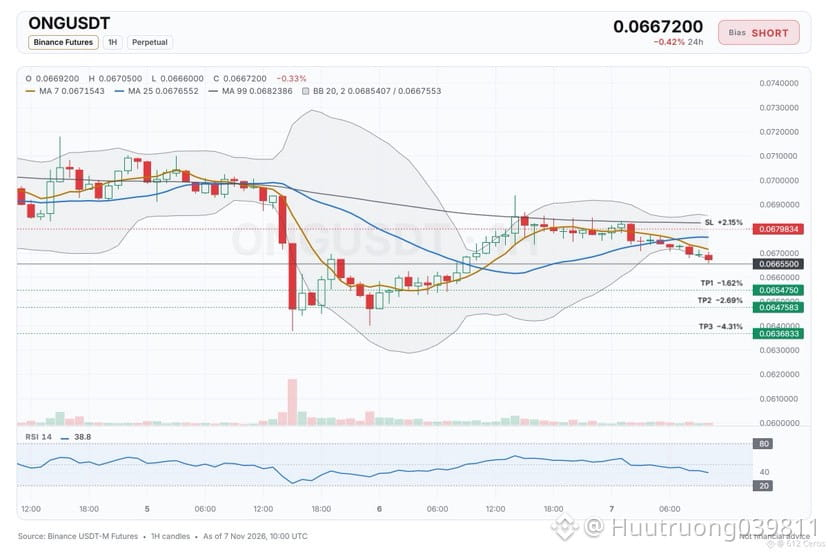
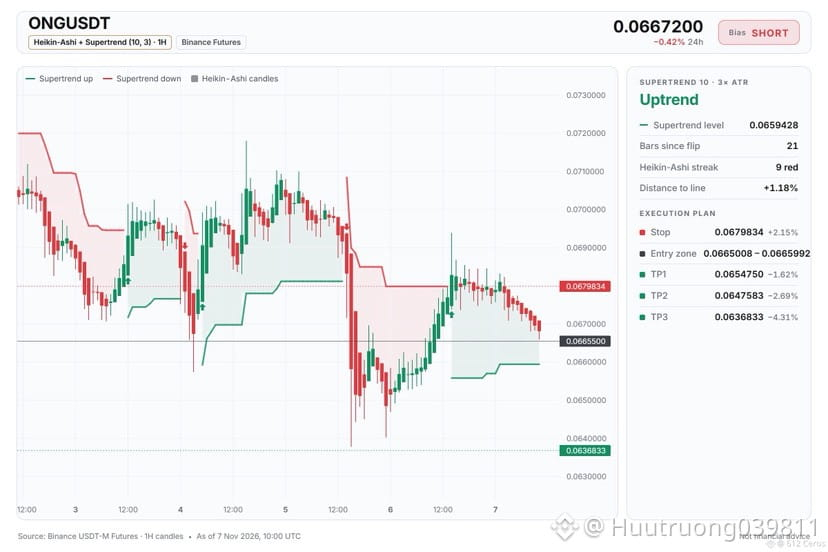
🔴 $ONG /USDT · Bias: SHORT
The 4h price sits below EMA50 and EMA200, showing a bearish stack that points lower.
Entry: 0.0665008 – 0.0665992
TP1: 0.0654750 (-1.6%)
TP2: 0.0647583 (-2.7%)
TP3: 0.0636833 (-4.3%)
SL: 0.0679834 (+2.2%)
Why: The 4h trend shows price below EMA50 and EMA200, meaning the swing trend is down.
Plan: close 50% at TP1, 25% at TP2, 25% at TP3, and move the stop to entry after TP1.
Would you enter this short at the current level?
{spot}(ONGUSDT)
🔴 $ONG /USDT · Bias: SHORT
The 4h price sits below EMA50 and EMA200, showing a bearish stack that points lower.
Entry: 0.0665008 – 0.0665992
TP1: 0.0654750 (-1.6%)
TP2: 0.0647583 (-2.7%)
TP3: 0.0636833 (-4.3%)
SL: 0.0679834 (+2.2%)
Why: The 4h trend shows price below EMA50 and EMA200, meaning the swing trend is down.
Plan: close 50% at TP1, 25% at TP2, 25% at TP3, and move the stop to entry after TP1.
Would you enter this short at the current level?
The 4h price sits below EMA50 and EMA200, showing a bearish stack that points lower.
Entry: 0.0665008 – 0.0665992
TP1: 0.0654750 (-1.6%)
TP2: 0.0647583 (-2.7%)
TP3: 0.0636833 (-4.3%)
SL: 0.0679834 (+2.2%)
Why: The 4h trend shows price below EMA50 and EMA200, meaning the swing trend is down.
Plan: close 50% at TP1, 25% at TP2, 25% at TP3, and move the stop to entry after TP1.
Would you enter this short at the current level?
5
·
--
ສັນຍານໝີ
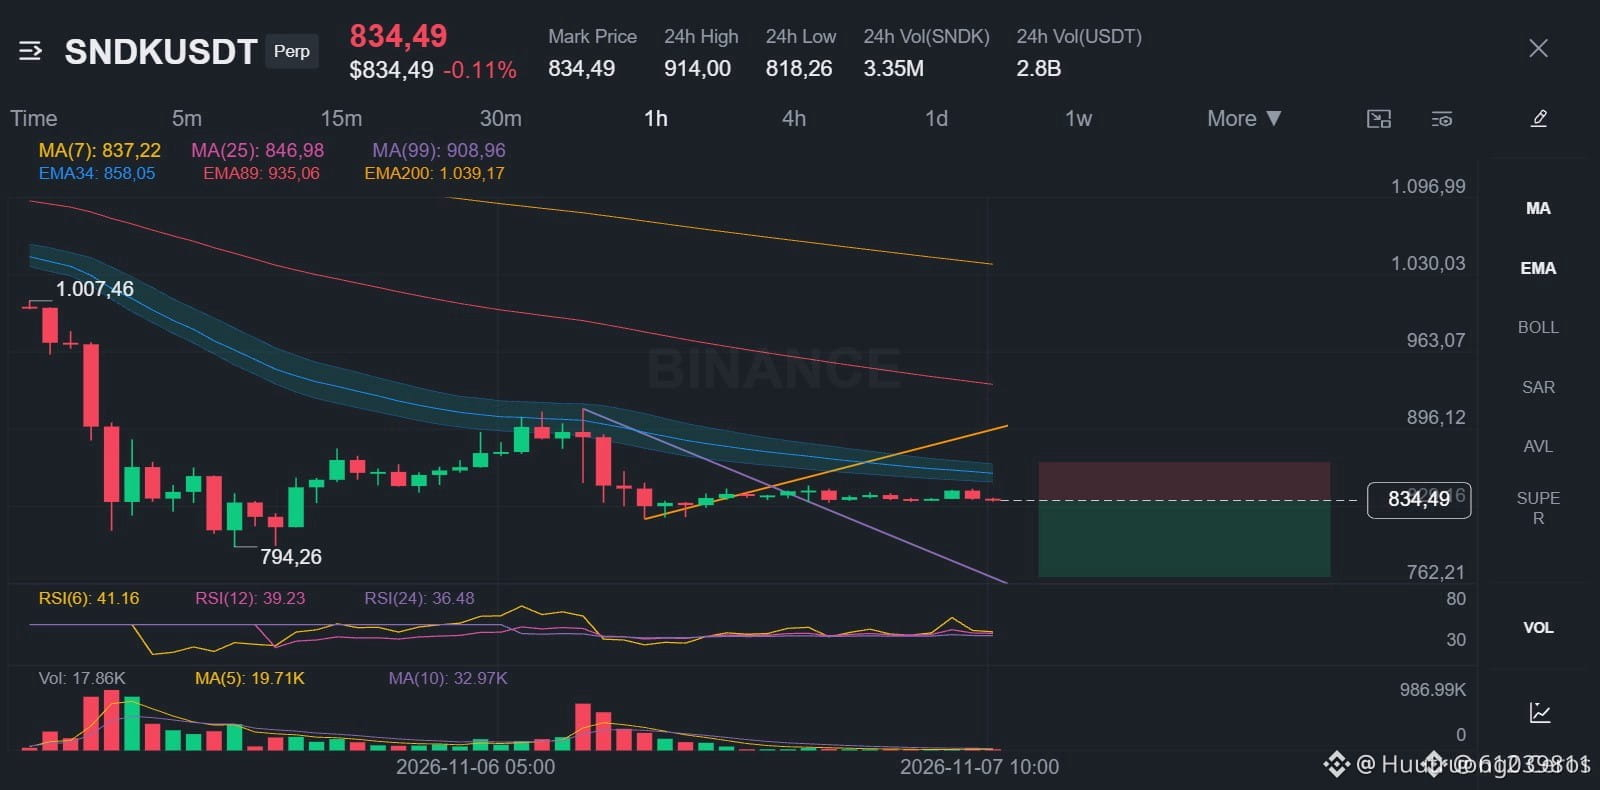
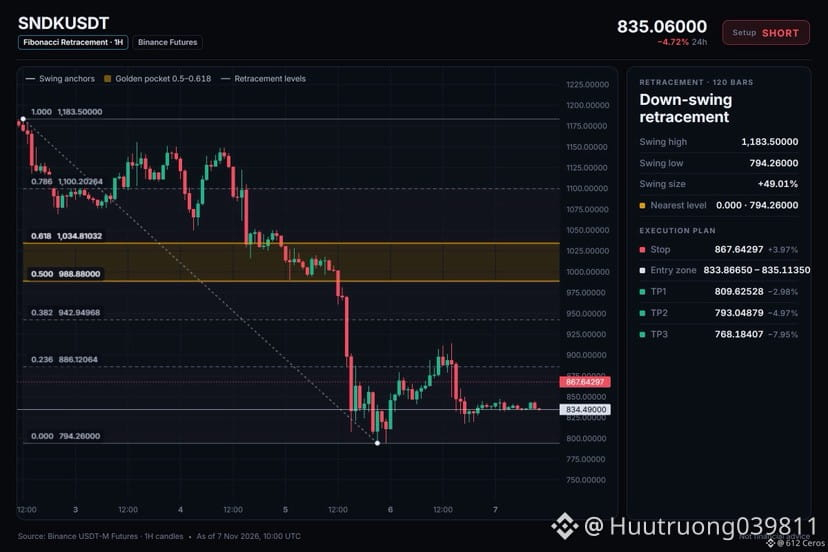
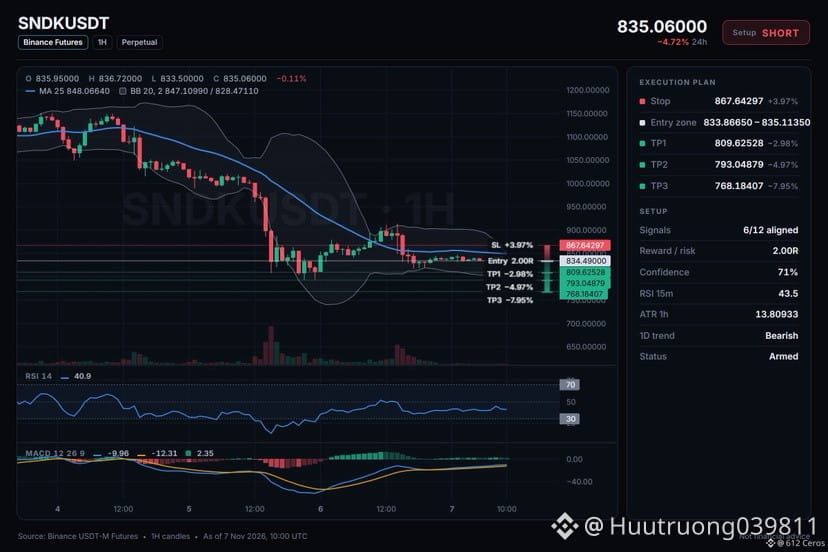
🔴 $SNDK /USDT · Bias: SHORT
SNDK is in a bearish stack on daily and 1h charts, pointing lower.
Entry: 833.86650 – 835.11350
TP1: 809.62528 (-3.0%)
TP2: 793.04879 (-5.0%)
TP3: 768.18407 (-7.9%)
SL: 867.64297 (+4.0%)
Why: The daily trend shows price below both EMAs, meaning the big-picture trend is down and sellers are in control.
Risk: Far below its average, bounce likely (−3.3 ATR from 1h EMA50)
Plan: close 50% at TP1, 25% at TP2, 25% at TP3, and move the stop to entry after TP1.
Do you agree with this short setup on SNDK?
{future}(SNDKUSDT)
🔴 $SNDK /USDT · Bias: SHORT
SNDK is in a bearish stack on daily and 1h charts, pointing lower.
Entry: 833.86650 – 835.11350
TP1: 809.62528 (-3.0%)
TP2: 793.04879 (-5.0%)
TP3: 768.18407 (-7.9%)
SL: 867.64297 (+4.0%)
Why: The daily trend shows price below both EMAs, meaning the big-picture trend is down and sellers are in control.
Risk: Far below its average, bounce likely (−3.3 ATR from 1h EMA50)
Plan: close 50% at TP1, 25% at TP2, 25% at TP3, and move the stop to entry after TP1.
Do you agree with this short setup on SNDK?
SNDK is in a bearish stack on daily and 1h charts, pointing lower.
Entry: 833.86650 – 835.11350
TP1: 809.62528 (-3.0%)
TP2: 793.04879 (-5.0%)
TP3: 768.18407 (-7.9%)
SL: 867.64297 (+4.0%)
Why: The daily trend shows price below both EMAs, meaning the big-picture trend is down and sellers are in control.
Risk: Far below its average, bounce likely (−3.3 ATR from 1h EMA50)
Plan: close 50% at TP1, 25% at TP2, 25% at TP3, and move the stop to entry after TP1.
Do you agree with this short setup on SNDK?
10
·
--
ສັນຍານໝີ
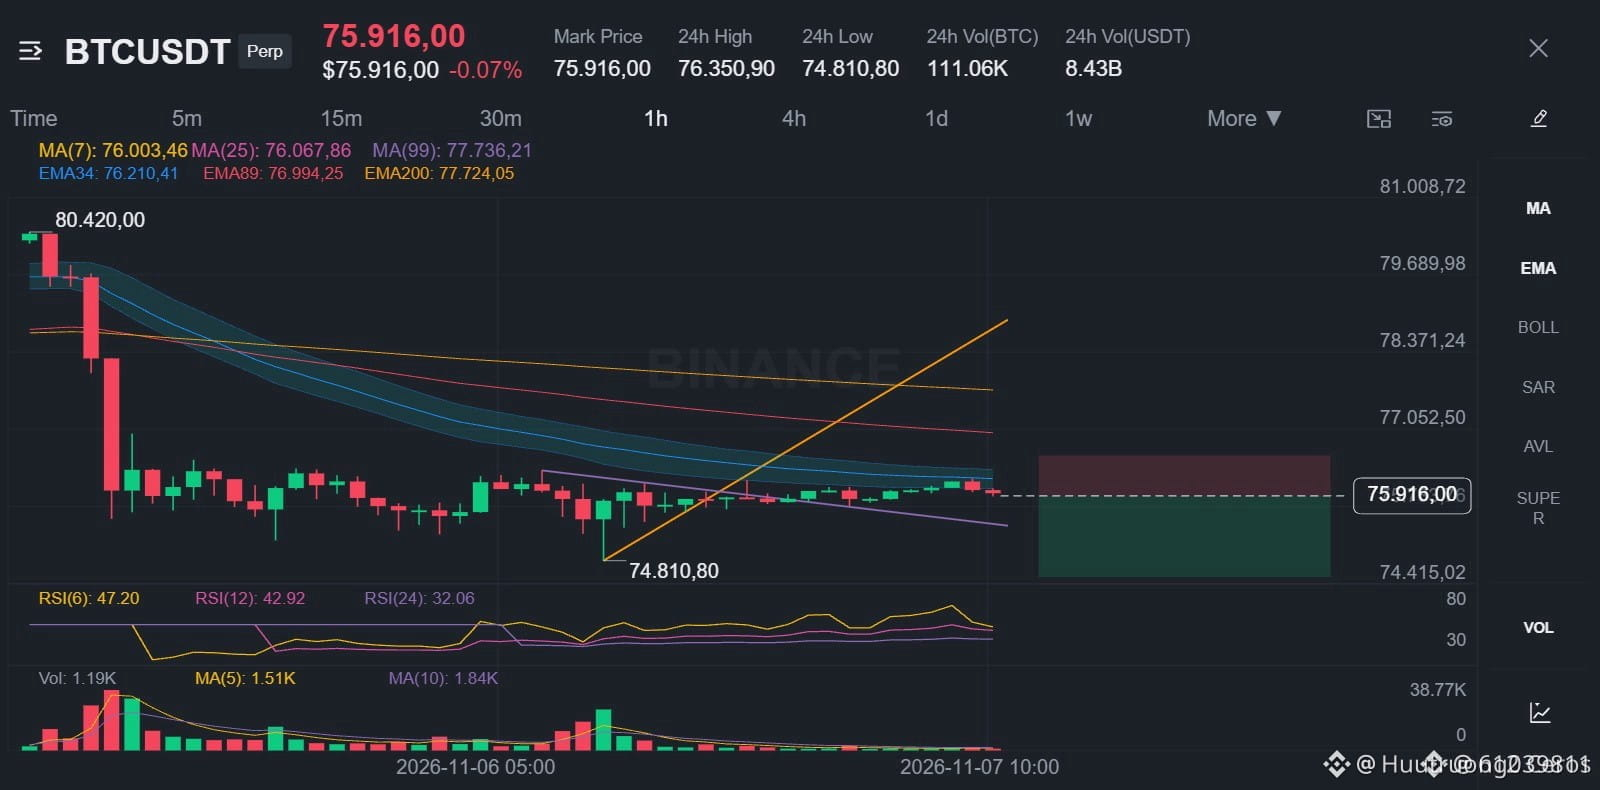
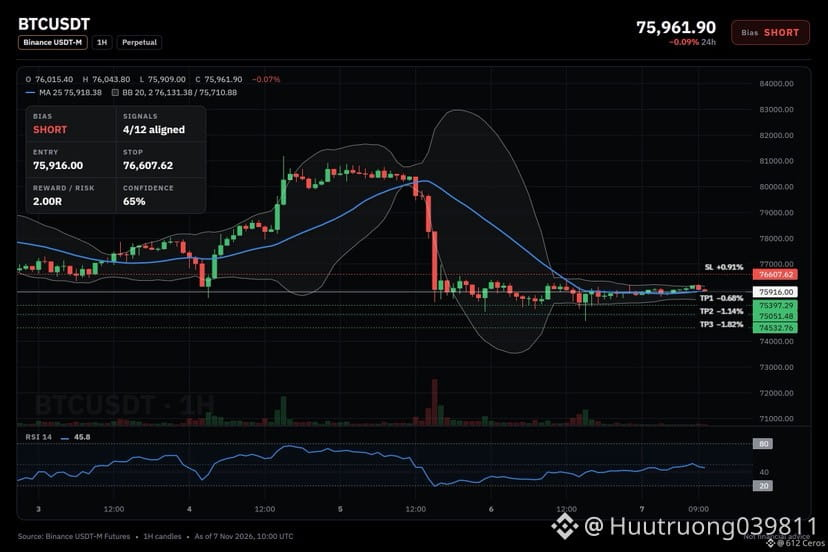
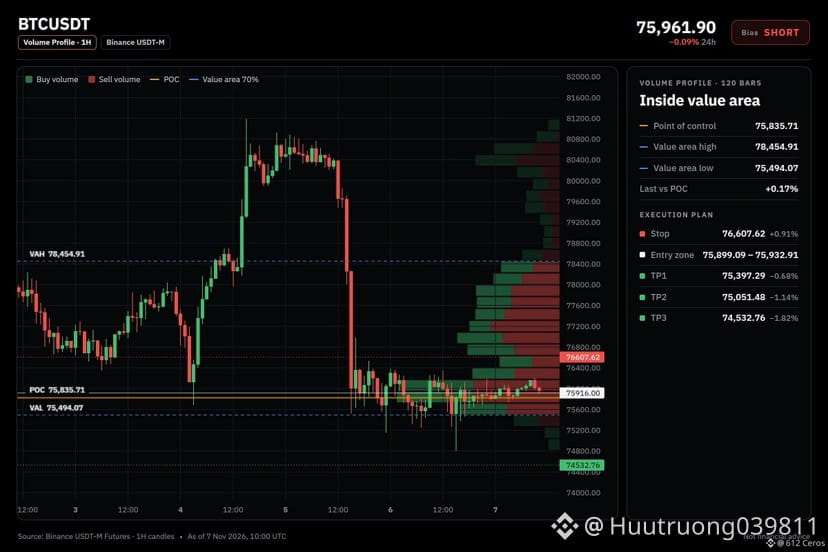
🔴 $BTC /USDT · Bias: SHORT
Four-hour and one-hour bearish stacks point the swing trend lower.
Entry: 75899.09 – 75932.91
TP1: 75397.29 (-0.7%)
TP2: 75051.48 (-1.1%)
TP3: 74532.76 (-1.8%)
SL: 76607.62 (+0.9%)
Note: moderate conviction only, keep size light.
Why: The 4h trend shows price below both EMAs in a bearish stack, meaning the swing trend is down.
Plan: close 50% at TP1, 25% at TP2, 25% at TP3, and move the stop to entry after TP1.
Do you see room for this short to reach the first target?
{spot}(BTCUSDT)
🔴 $BTC /USDT · Bias: SHORT
Four-hour and one-hour bearish stacks point the swing trend lower.
Entry: 75899.09 – 75932.91
TP1: 75397.29 (-0.7%)
TP2: 75051.48 (-1.1%)
TP3: 74532.76 (-1.8%)
SL: 76607.62 (+0.9%)
Note: moderate conviction only, keep size light.
Why: The 4h trend shows price below both EMAs in a bearish stack, meaning the swing trend is down.
Plan: close 50% at TP1, 25% at TP2, 25% at TP3, and move the stop to entry after TP1.
Do you see room for this short to reach the first target?
Four-hour and one-hour bearish stacks point the swing trend lower.
Entry: 75899.09 – 75932.91
TP1: 75397.29 (-0.7%)
TP2: 75051.48 (-1.1%)
TP3: 74532.76 (-1.8%)
SL: 76607.62 (+0.9%)
Note: moderate conviction only, keep size light.
Why: The 4h trend shows price below both EMAs in a bearish stack, meaning the swing trend is down.
Plan: close 50% at TP1, 25% at TP2, 25% at TP3, and move the stop to entry after TP1.
Do you see room for this short to reach the first target?
5
·
--
ສັນຍານໝີ
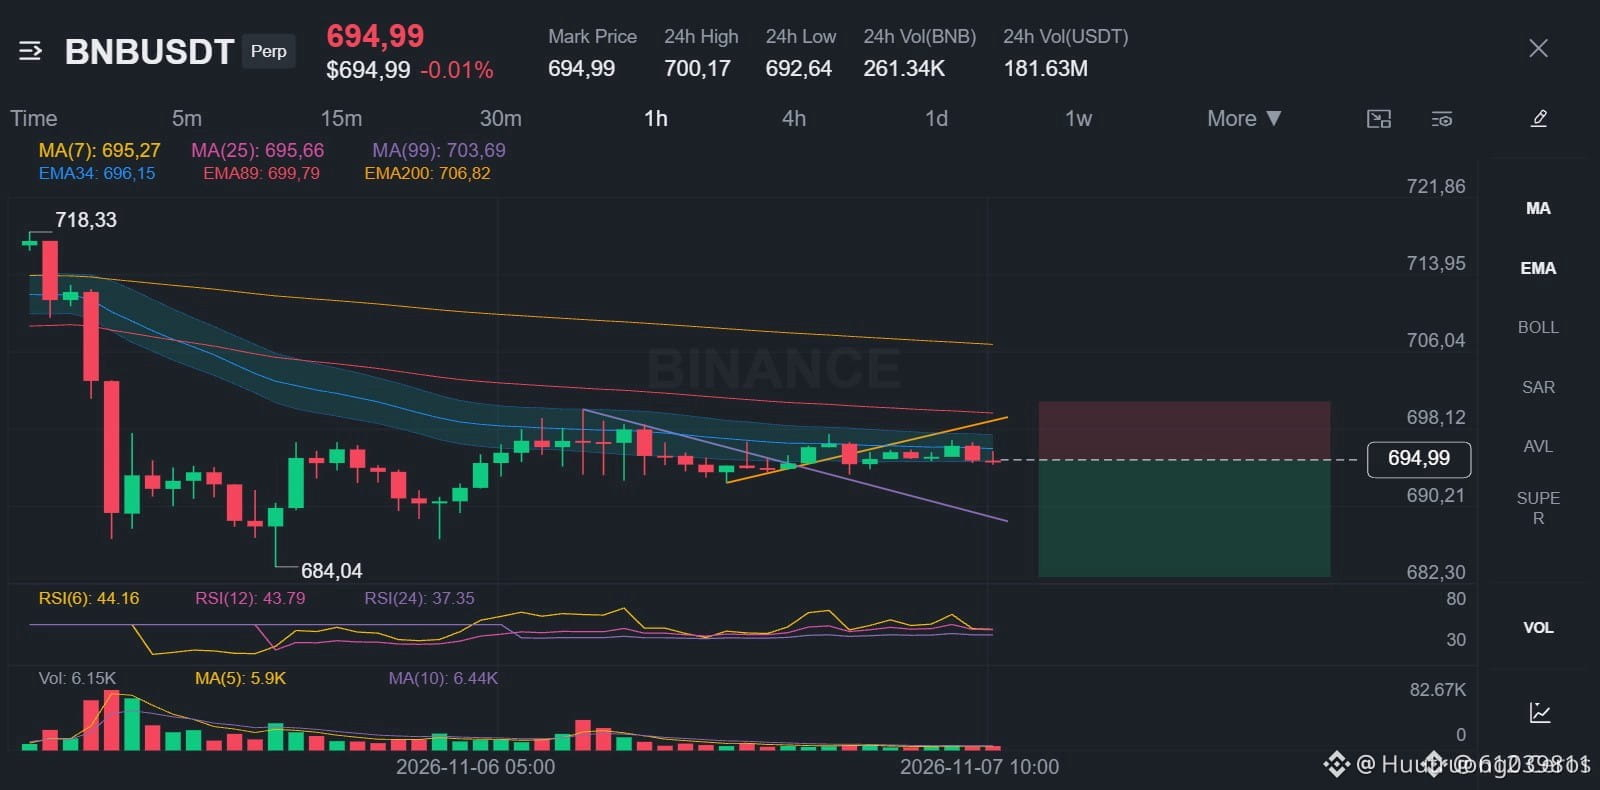
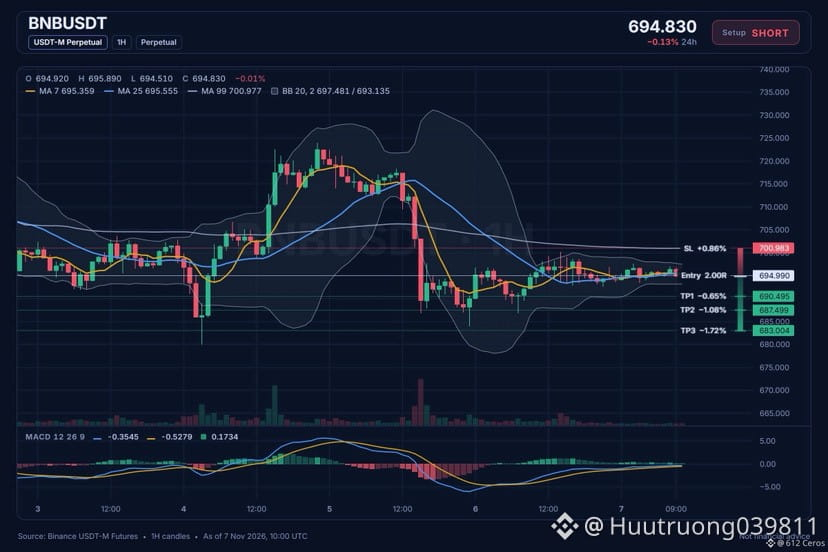
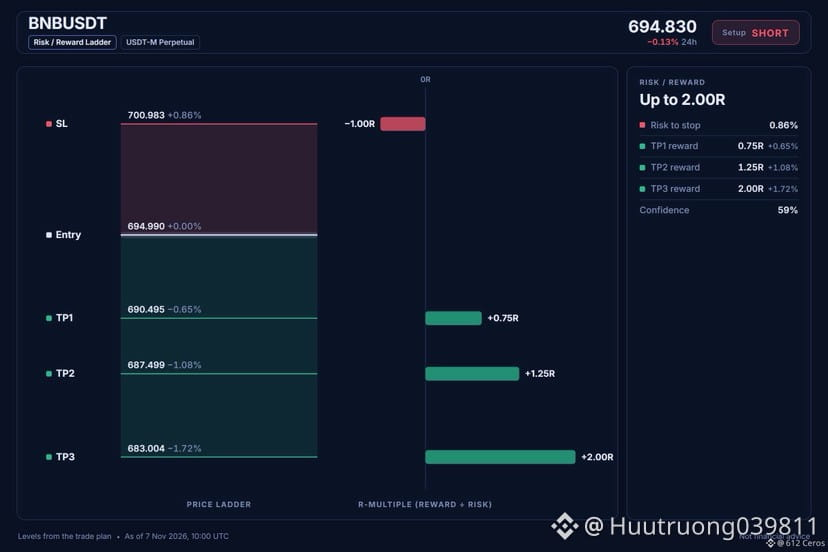
🔴 $BNB /USDT · Bias: SHORT
Price sits below both EMAs on the 4h chart, showing a bearish stack.
Entry: 694.817 – 695.163
TP1: 690.495 (-0.6%)
TP2: 687.499 (-1.1%)
TP3: 683.004 (-1.7%)
SL: 700.983 (+0.9%)
Note: moderate conviction only, keep size light.
Why: The 4h trend shows price below EMA50 and EMA200, a bearish stack meaning the swing trend is down.
Plan: close 50% at TP1, 25% at TP2, 25% at TP3, and move the stop to entry after TP1.
Do you see room for more downside from here?
{spot}(BNBUSDT)
🔴 $BNB /USDT · Bias: SHORT
Price sits below both EMAs on the 4h chart, showing a bearish stack.
Entry: 694.817 – 695.163
TP1: 690.495 (-0.6%)
TP2: 687.499 (-1.1%)
TP3: 683.004 (-1.7%)
SL: 700.983 (+0.9%)
Note: moderate conviction only, keep size light.
Why: The 4h trend shows price below EMA50 and EMA200, a bearish stack meaning the swing trend is down.
Plan: close 50% at TP1, 25% at TP2, 25% at TP3, and move the stop to entry after TP1.
Do you see room for more downside from here?
Price sits below both EMAs on the 4h chart, showing a bearish stack.
Entry: 694.817 – 695.163
TP1: 690.495 (-0.6%)
TP2: 687.499 (-1.1%)
TP3: 683.004 (-1.7%)
SL: 700.983 (+0.9%)
Note: moderate conviction only, keep size light.
Why: The 4h trend shows price below EMA50 and EMA200, a bearish stack meaning the swing trend is down.
Plan: close 50% at TP1, 25% at TP2, 25% at TP3, and move the stop to entry after TP1.
Do you see room for more downside from here?
10
·
--
ສັນຍານໝີ
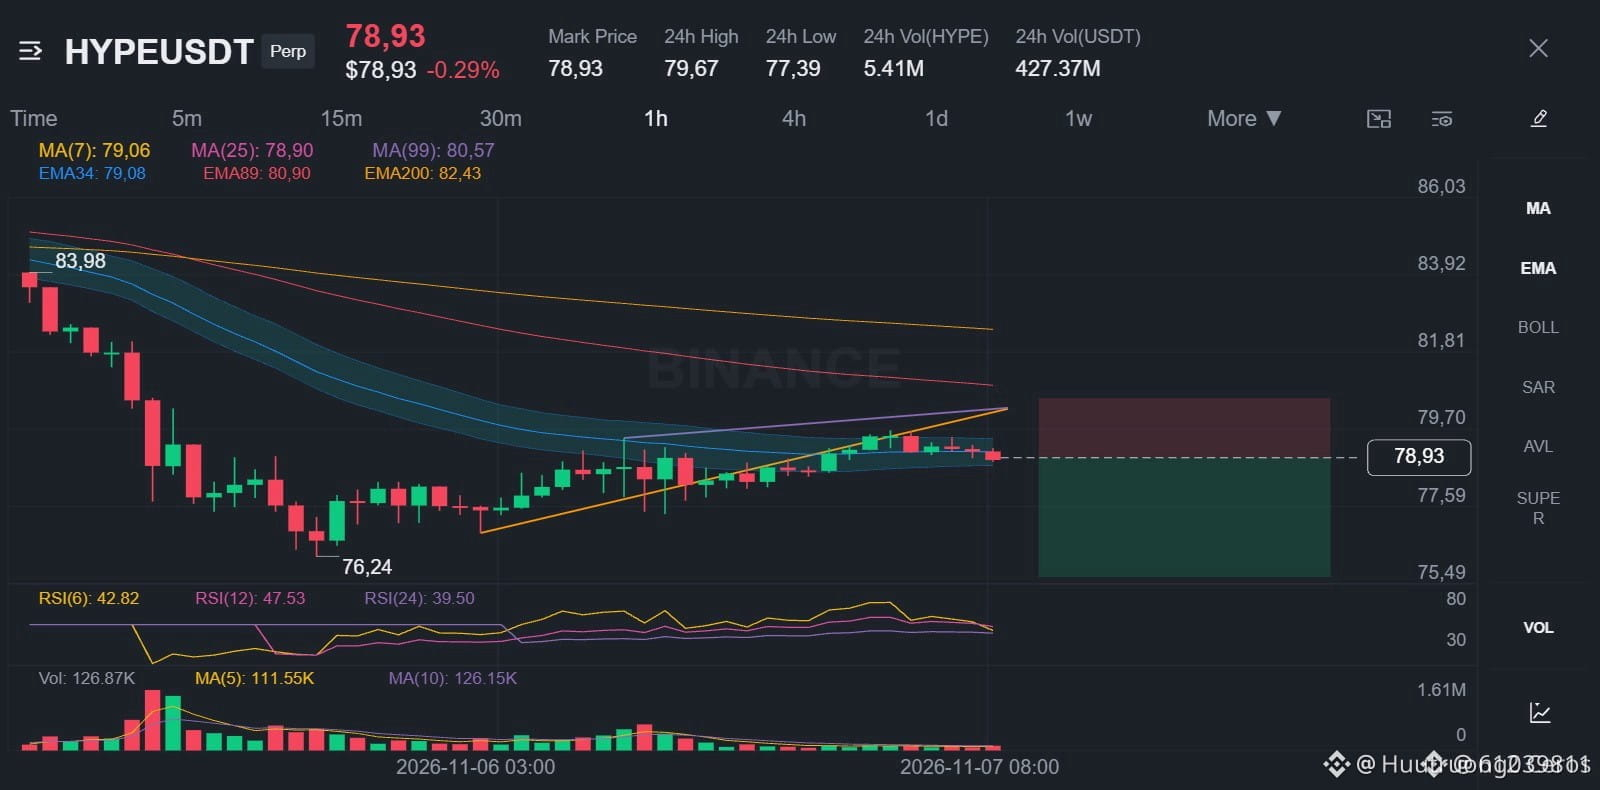
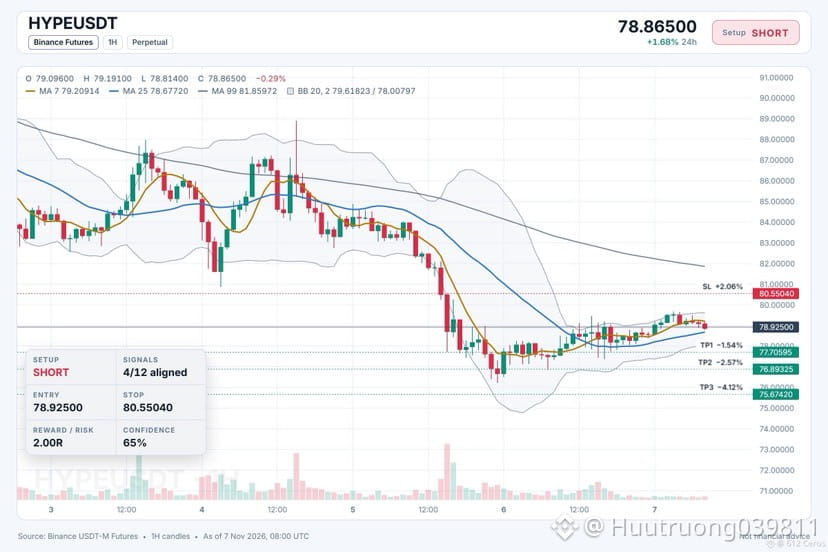
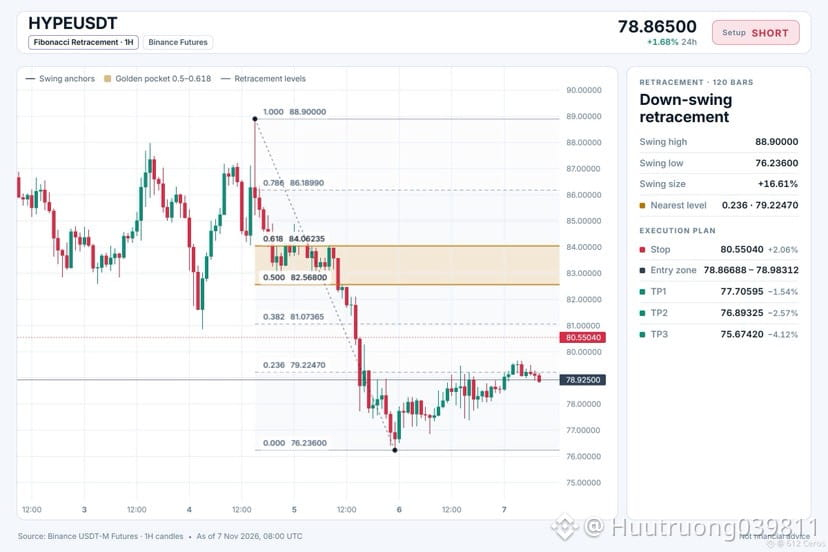
🔴 $HYPE /USDT · Bias: SHORT
4h and 1h bearish stacks keep price under both EMAs.
Entry: 78.86688 – 78.98312
TP1: 77.70595 (-1.5%)
TP2: 76.89325 (-2.6%)
TP3: 75.67420 (-4.1%)
SL: 80.55040 (+2.1%)
Note: moderate conviction only, keep size light.
Why: The 4h trend shows price below EMA50 below EMA200, a bearish stack meaning the swing trend is down.
Plan: close 50% at TP1, 25% at TP2, 25% at TP3, and move the stop to entry after TP1.
Do you see room for more downside from here?
{spot}(HYPEUSDT)
🔴 $HYPE /USDT · Bias: SHORT
4h and 1h bearish stacks keep price under both EMAs.
Entry: 78.86688 – 78.98312
TP1: 77.70595 (-1.5%)
TP2: 76.89325 (-2.6%)
TP3: 75.67420 (-4.1%)
SL: 80.55040 (+2.1%)
Note: moderate conviction only, keep size light.
Why: The 4h trend shows price below EMA50 below EMA200, a bearish stack meaning the swing trend is down.
Plan: close 50% at TP1, 25% at TP2, 25% at TP3, and move the stop to entry after TP1.
Do you see room for more downside from here?
4h and 1h bearish stacks keep price under both EMAs.
Entry: 78.86688 – 78.98312
TP1: 77.70595 (-1.5%)
TP2: 76.89325 (-2.6%)
TP3: 75.67420 (-4.1%)
SL: 80.55040 (+2.1%)
Note: moderate conviction only, keep size light.
Why: The 4h trend shows price below EMA50 below EMA200, a bearish stack meaning the swing trend is down.
Plan: close 50% at TP1, 25% at TP2, 25% at TP3, and move the stop to entry after TP1.
Do you see room for more downside from here?
7
ເຂົ້າສູ່ລະບົບເພື່ອສຳຫຼວດເນື້ອຫາເພີ່ມເຕີມ
ເຂົ້າຮ່ວມກຸ່ມຜູ້ໃຊ້ຄຣິບໂຕທົ່ວໂລກໃນ Binance Square.
⚡️ ໄດ້ຮັບຂໍ້ມູນຫຼ້າສຸດ ແລະ ທີ່ມີປະໂຫຍດກ່ຽວກັບຄຣິບໂຕ.
💬 ໄດ້ຮັບຄວາມໄວ້ວາງໃຈຈາກຕະຫຼາດແລກປ່ຽນຄຣິບໂຕທີ່ໃຫຍ່ທີ່ສຸດໃນໂລກ.
👍 ຄົ້ນຫາຂໍ້ມູນເຊີງເລິກທີ່ແທ້ຈາກນັກສ້າງທີ່ໄດ້ຮັບການຢືນຢັນ.
ອີເມວ / ເບີໂທລະສັບ
ຫົວຂໍ້ທີ່ກໍາລັງນິຍົມ
JobsReportRaisesHikeOdds
528,857 ຄັ້ງທີ່ເບິ່ງ
3,400 ກຳລັງສົນທະນາ
TradFi News | US Adds 165,000 Jobs in October, More Than Double the 65,000 Forecast, as Unemployment Falls to 4.1%
Binance News
·42 ຖືກໃຈ
·24.2k ຄັ້ງທີ່ເບິ່ງ
CPITestsDecemberRateOutlook
158,627 ຄັ້ງທີ່ເບິ່ງ
1,170 ກຳລັງສົນທະນາ
US Data Center Rules May Constrain AI Expansion
73,932 ຄັ້ງທີ່ເບິ່ງ
229 ກຳລັງສົນທະນາ