
Crypto Skull Signal
7.8k ໂພສ

Crypto Skull Signal
 Square Verified+
X.com/SkullSignal 👈 I’m not only a pretty face… I’ll show step by step how to beat this market, because I already did. Welcome to the family

Level 1 Creator
4 ກໍາລັງຕິດຕາມ
55.8K+ ຜູ້ຕິດຕາມ
93.2K+ Liked
1 ຫຼຽນລາງວັນ
ໂພສ
ທັງໝົດ
ວົງຢືມ
ວີດີໂອ
ປັກໝຸດ
#BITCOIN ANALYSIS
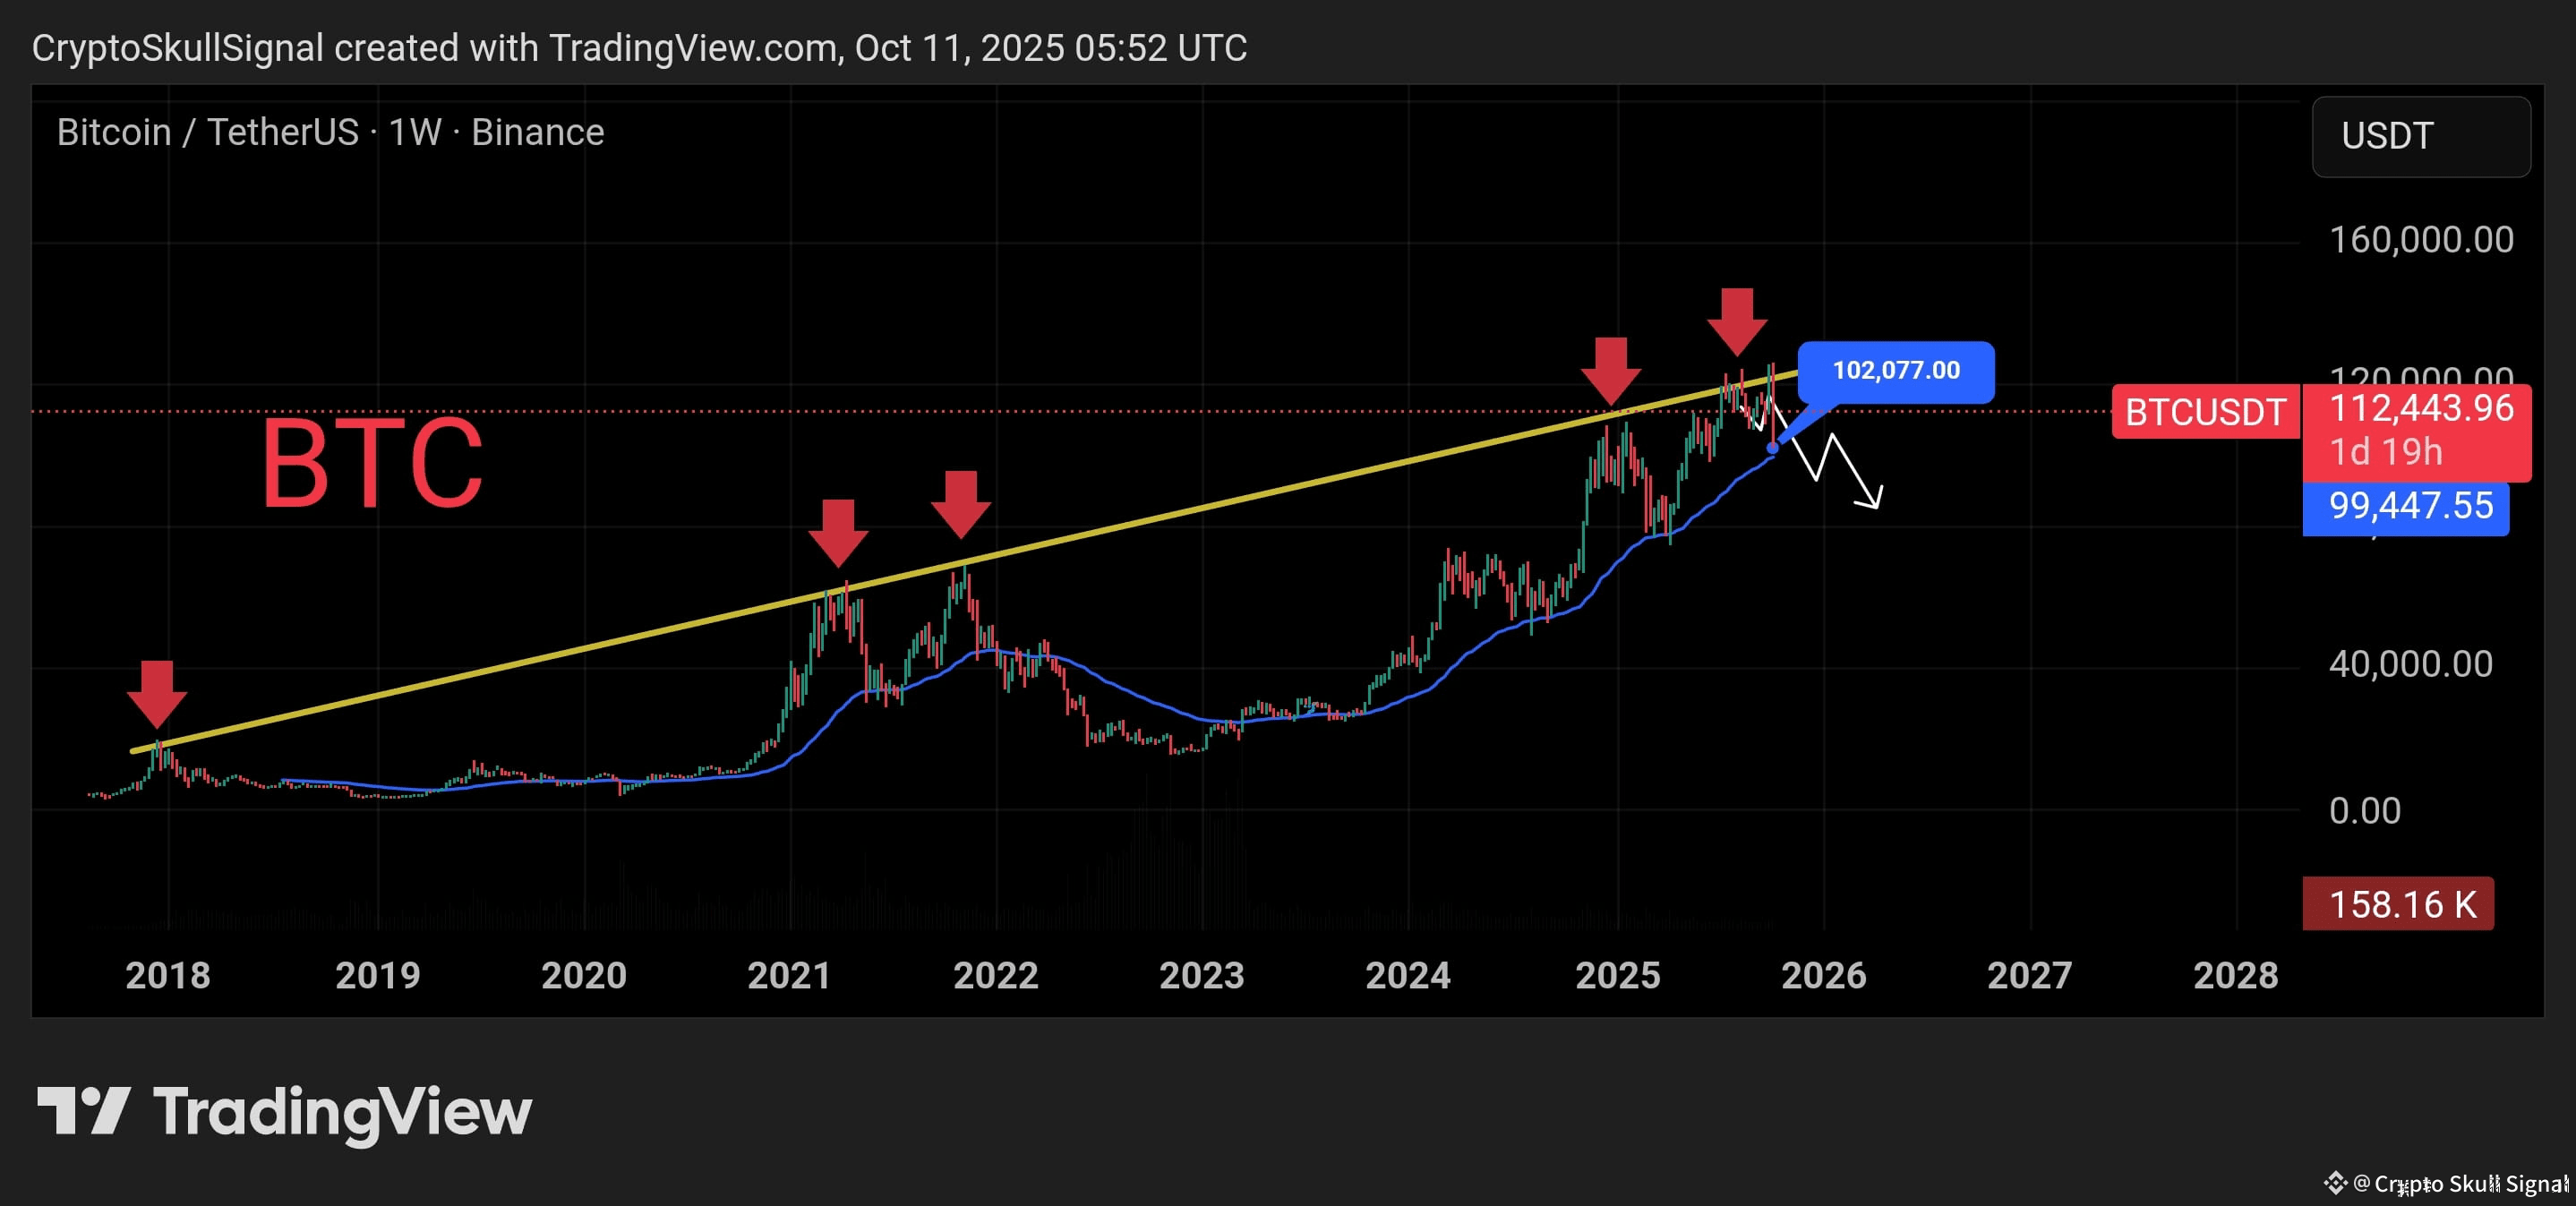
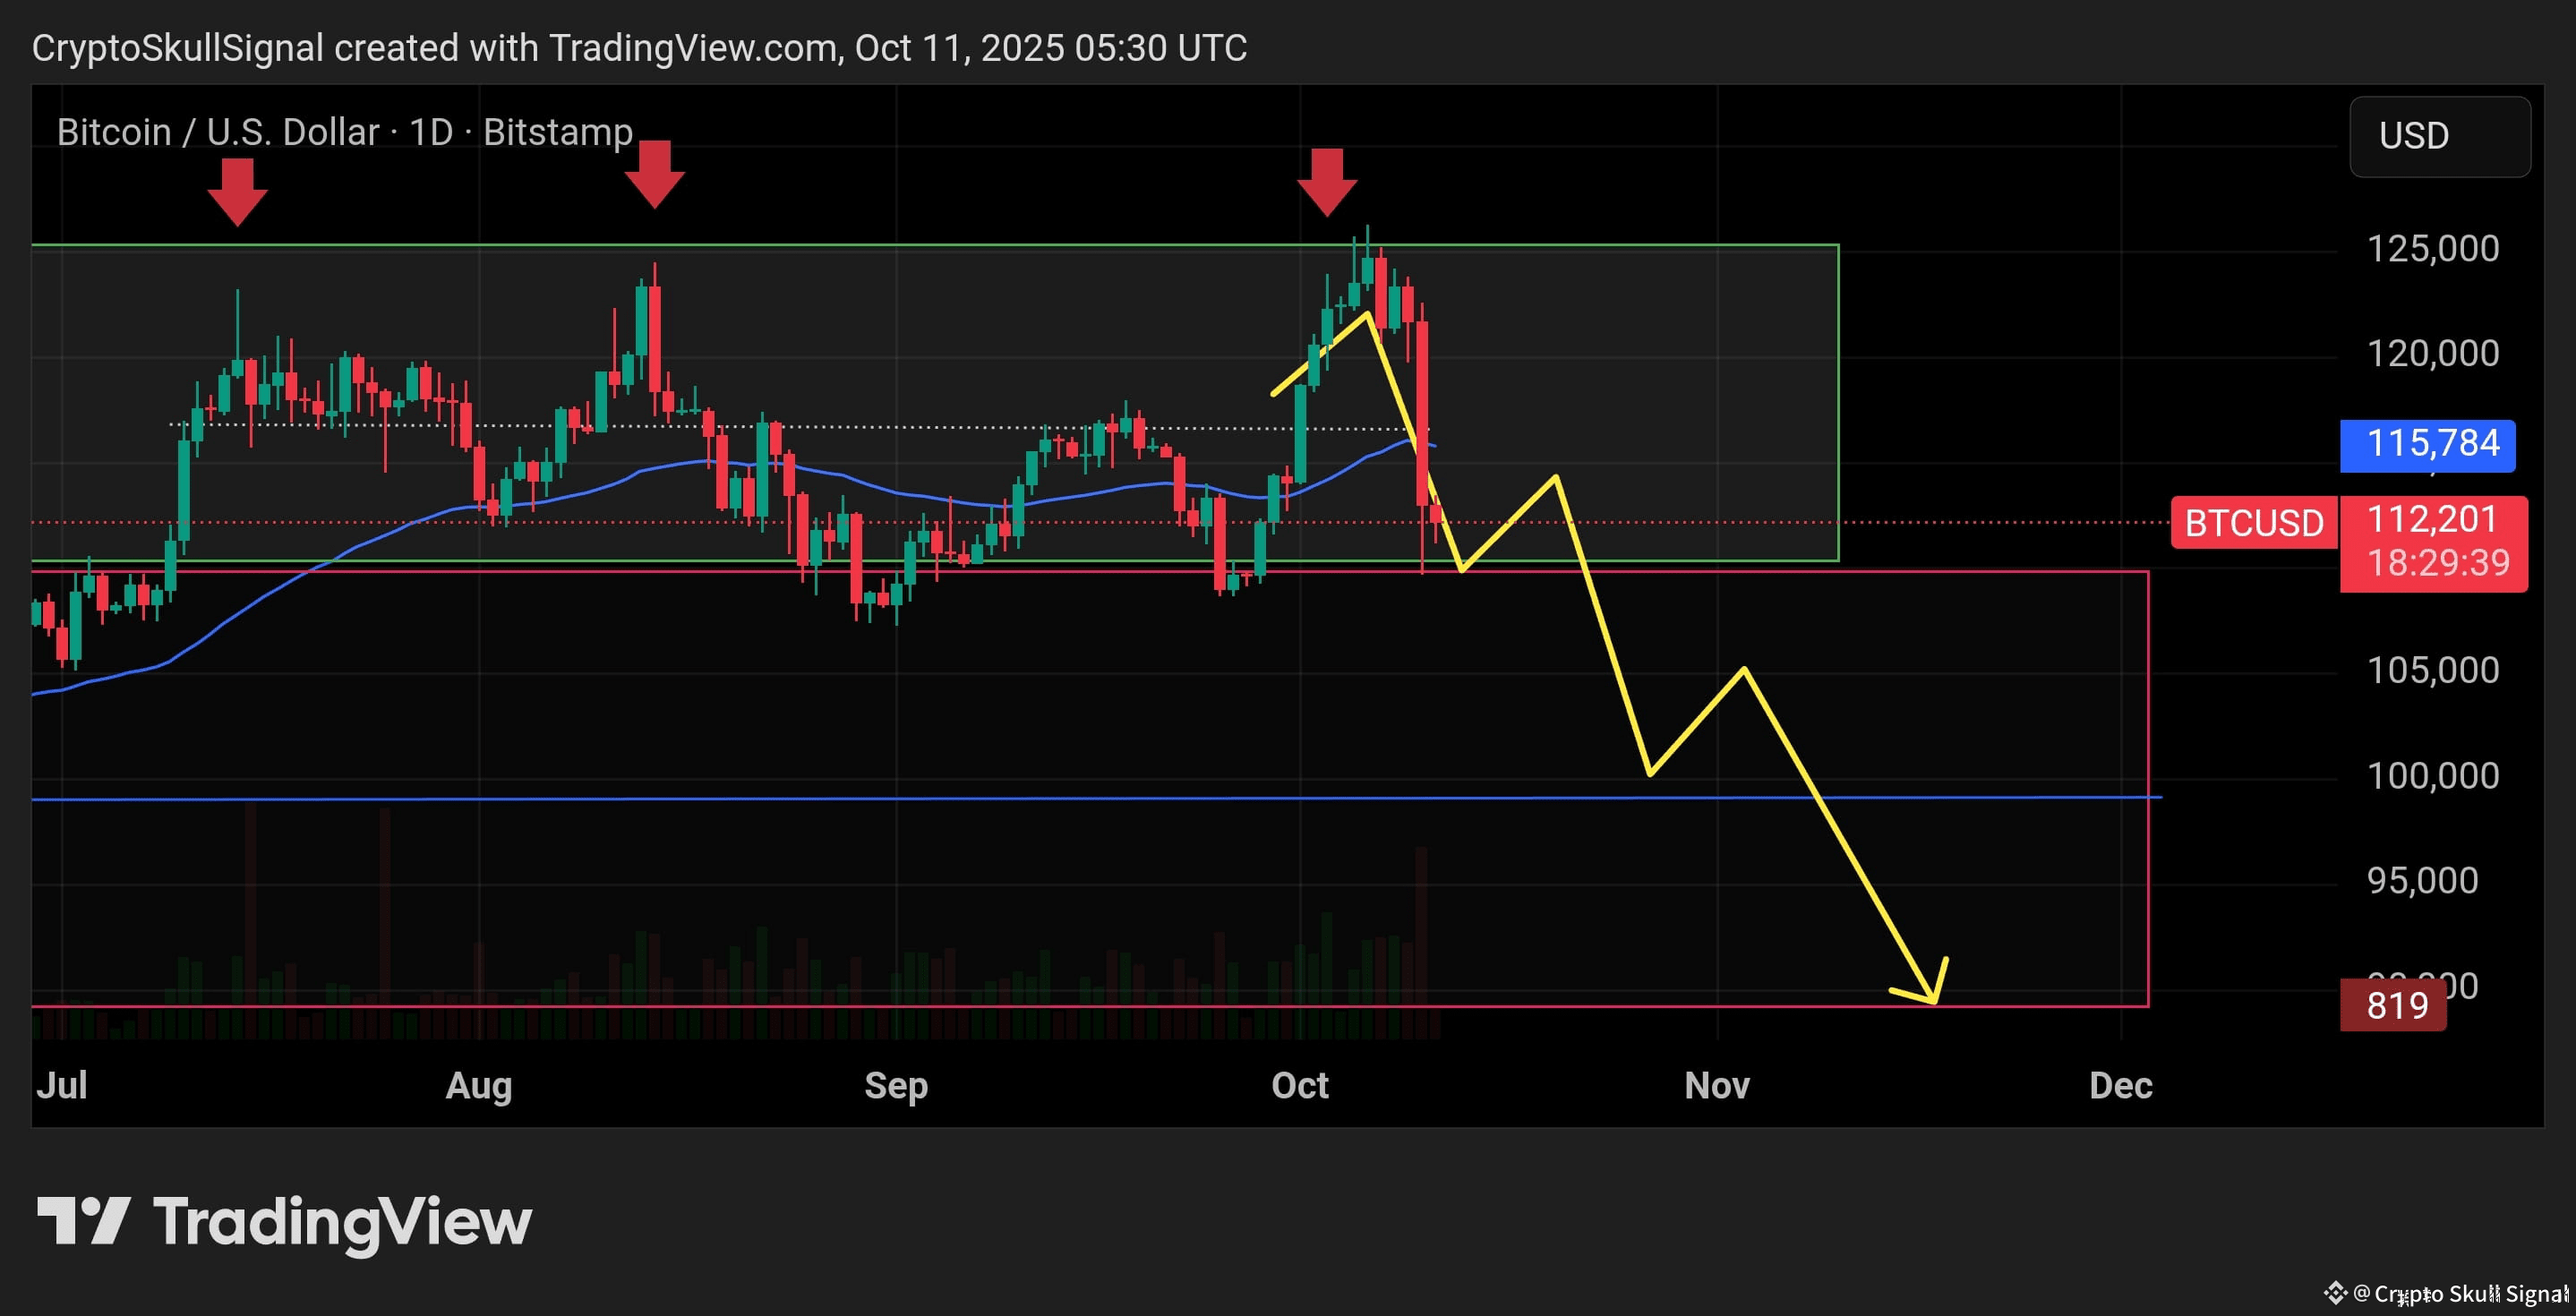
I have been warning you for the last 45 days that a big dump was coming and now it’s playing out exactly. Bitcoin has already dumped around $20K and is now trading near 112K, right at the major resistance zone that has triggered every big correction since 2018.
A small bounce to 115K–116K is possible, but after that I expect another leg down toward 100K, and potentially lower to 90K.
I’m still holding my 50% short position. If anything changes or I close my position, I’ll update you. Remember I mentioned earlier that if BTC went back to 125K–128K, I would add more shorts and that plan hasn’t changed.
Till Monday, I expect some volatility, but Monday’s price action will give a clearer direction.
🔸 Weekly:
BTC touched the long-term trendline again → clear rejection happened.
👉 Until we get a weekly close above 125K, the risk of a major pullback stays high.
🔸 Daily:
Price is inside the 110K–125K supply zone. Structure is weak.
If price breaks and resists below 110K, then 100K is the next target.
📊 My Trade:
✅ First target 105K hit
Holding 50% shorts, expecting a bounce to 115K, then lower.
📌 Downside Targets: 105K ✅ → 100K → 95K → 90K
$BTC #TrumpTariffs
I have been warning you for the last 45 days that a big dump was coming and now it’s playing out exactly. Bitcoin has already dumped around $20K and is now trading near 112K, right at the major resistance zone that has triggered every big correction since 2018.
A small bounce to 115K–116K is possible, but after that I expect another leg down toward 100K, and potentially lower to 90K.
I’m still holding my 50% short position. If anything changes or I close my position, I’ll update you. Remember I mentioned earlier that if BTC went back to 125K–128K, I would add more shorts and that plan hasn’t changed.
Till Monday, I expect some volatility, but Monday’s price action will give a clearer direction.
🔸 Weekly:
BTC touched the long-term trendline again → clear rejection happened.
👉 Until we get a weekly close above 125K, the risk of a major pullback stays high.
🔸 Daily:
Price is inside the 110K–125K supply zone. Structure is weak.
If price breaks and resists below 110K, then 100K is the next target.
📊 My Trade:
✅ First target 105K hit
Holding 50% shorts, expecting a bounce to 115K, then lower.
📌 Downside Targets: 105K ✅ → 100K → 95K → 90K
$BTC #TrumpTariffs
Crypto Skull Signal
·
--
ສັນຍານໝີ#BITCOIN ANALYSIS
For the last 40 days I’ve been telling you guys I’m bearish on $BTC. We already dropped almost 8K twice, but every time Bitcoin reclaimed the levels again. Right now it’s trading around 18K to 119k but nothing has changed for me. I’m still bearish.
I’ve said many times that the 115K to 124K region is a short zone, not a long zone. If you’re still holding longs, I’d strongly suggest you flip to shorts because the chart is flashing multiple top signals.
Don’t get trapped by hype like “Bitcoin to 1 million by the end of this year.” That’s just noise. The structure is weak, liquidity is being engineered, and the bigger downside move is still ahead.
📌 Downside Targets:
105K → 100K → 95K → 90K
$BTC
For the last 40 days I’ve been telling you guys I’m bearish on $BTC. We already dropped almost 8K twice, but every time Bitcoin reclaimed the levels again. Right now it’s trading around 18K to 119k but nothing has changed for me. I’m still bearish.
I’ve said many times that the 115K to 124K region is a short zone, not a long zone. If you’re still holding longs, I’d strongly suggest you flip to shorts because the chart is flashing multiple top signals.
Don’t get trapped by hype like “Bitcoin to 1 million by the end of this year.” That’s just noise. The structure is weak, liquidity is being engineered, and the bigger downside move is still ahead.
📌 Downside Targets:
105K → 100K → 95K → 90K
$BTC
$ZEC Big Congratulations 🎉 To All HOLDERS Finally Patience Pays Off.
Currently Trading At $1187.13 Up By 54%
$ZEC Remember I Told You Guys Again And Again Don't Miss it Buy And HOLD For Good Returns Now See Exactly Going As Expected. Comment Below
👇 If You Are HOLDING?
Click Here To See the chart $ZEC
Currently Trading At $1187.13 Up By 54%
$ZEC Remember I Told You Guys Again And Again Don't Miss it Buy And HOLD For Good Returns Now See Exactly Going As Expected. Comment Below
👇 If You Are HOLDING?
Click Here To See the chart $ZEC
Crypto Skull Signal
·
--
ສັນຍານກະທິງ$ZEC HIT THE TARGET 🎯🚀
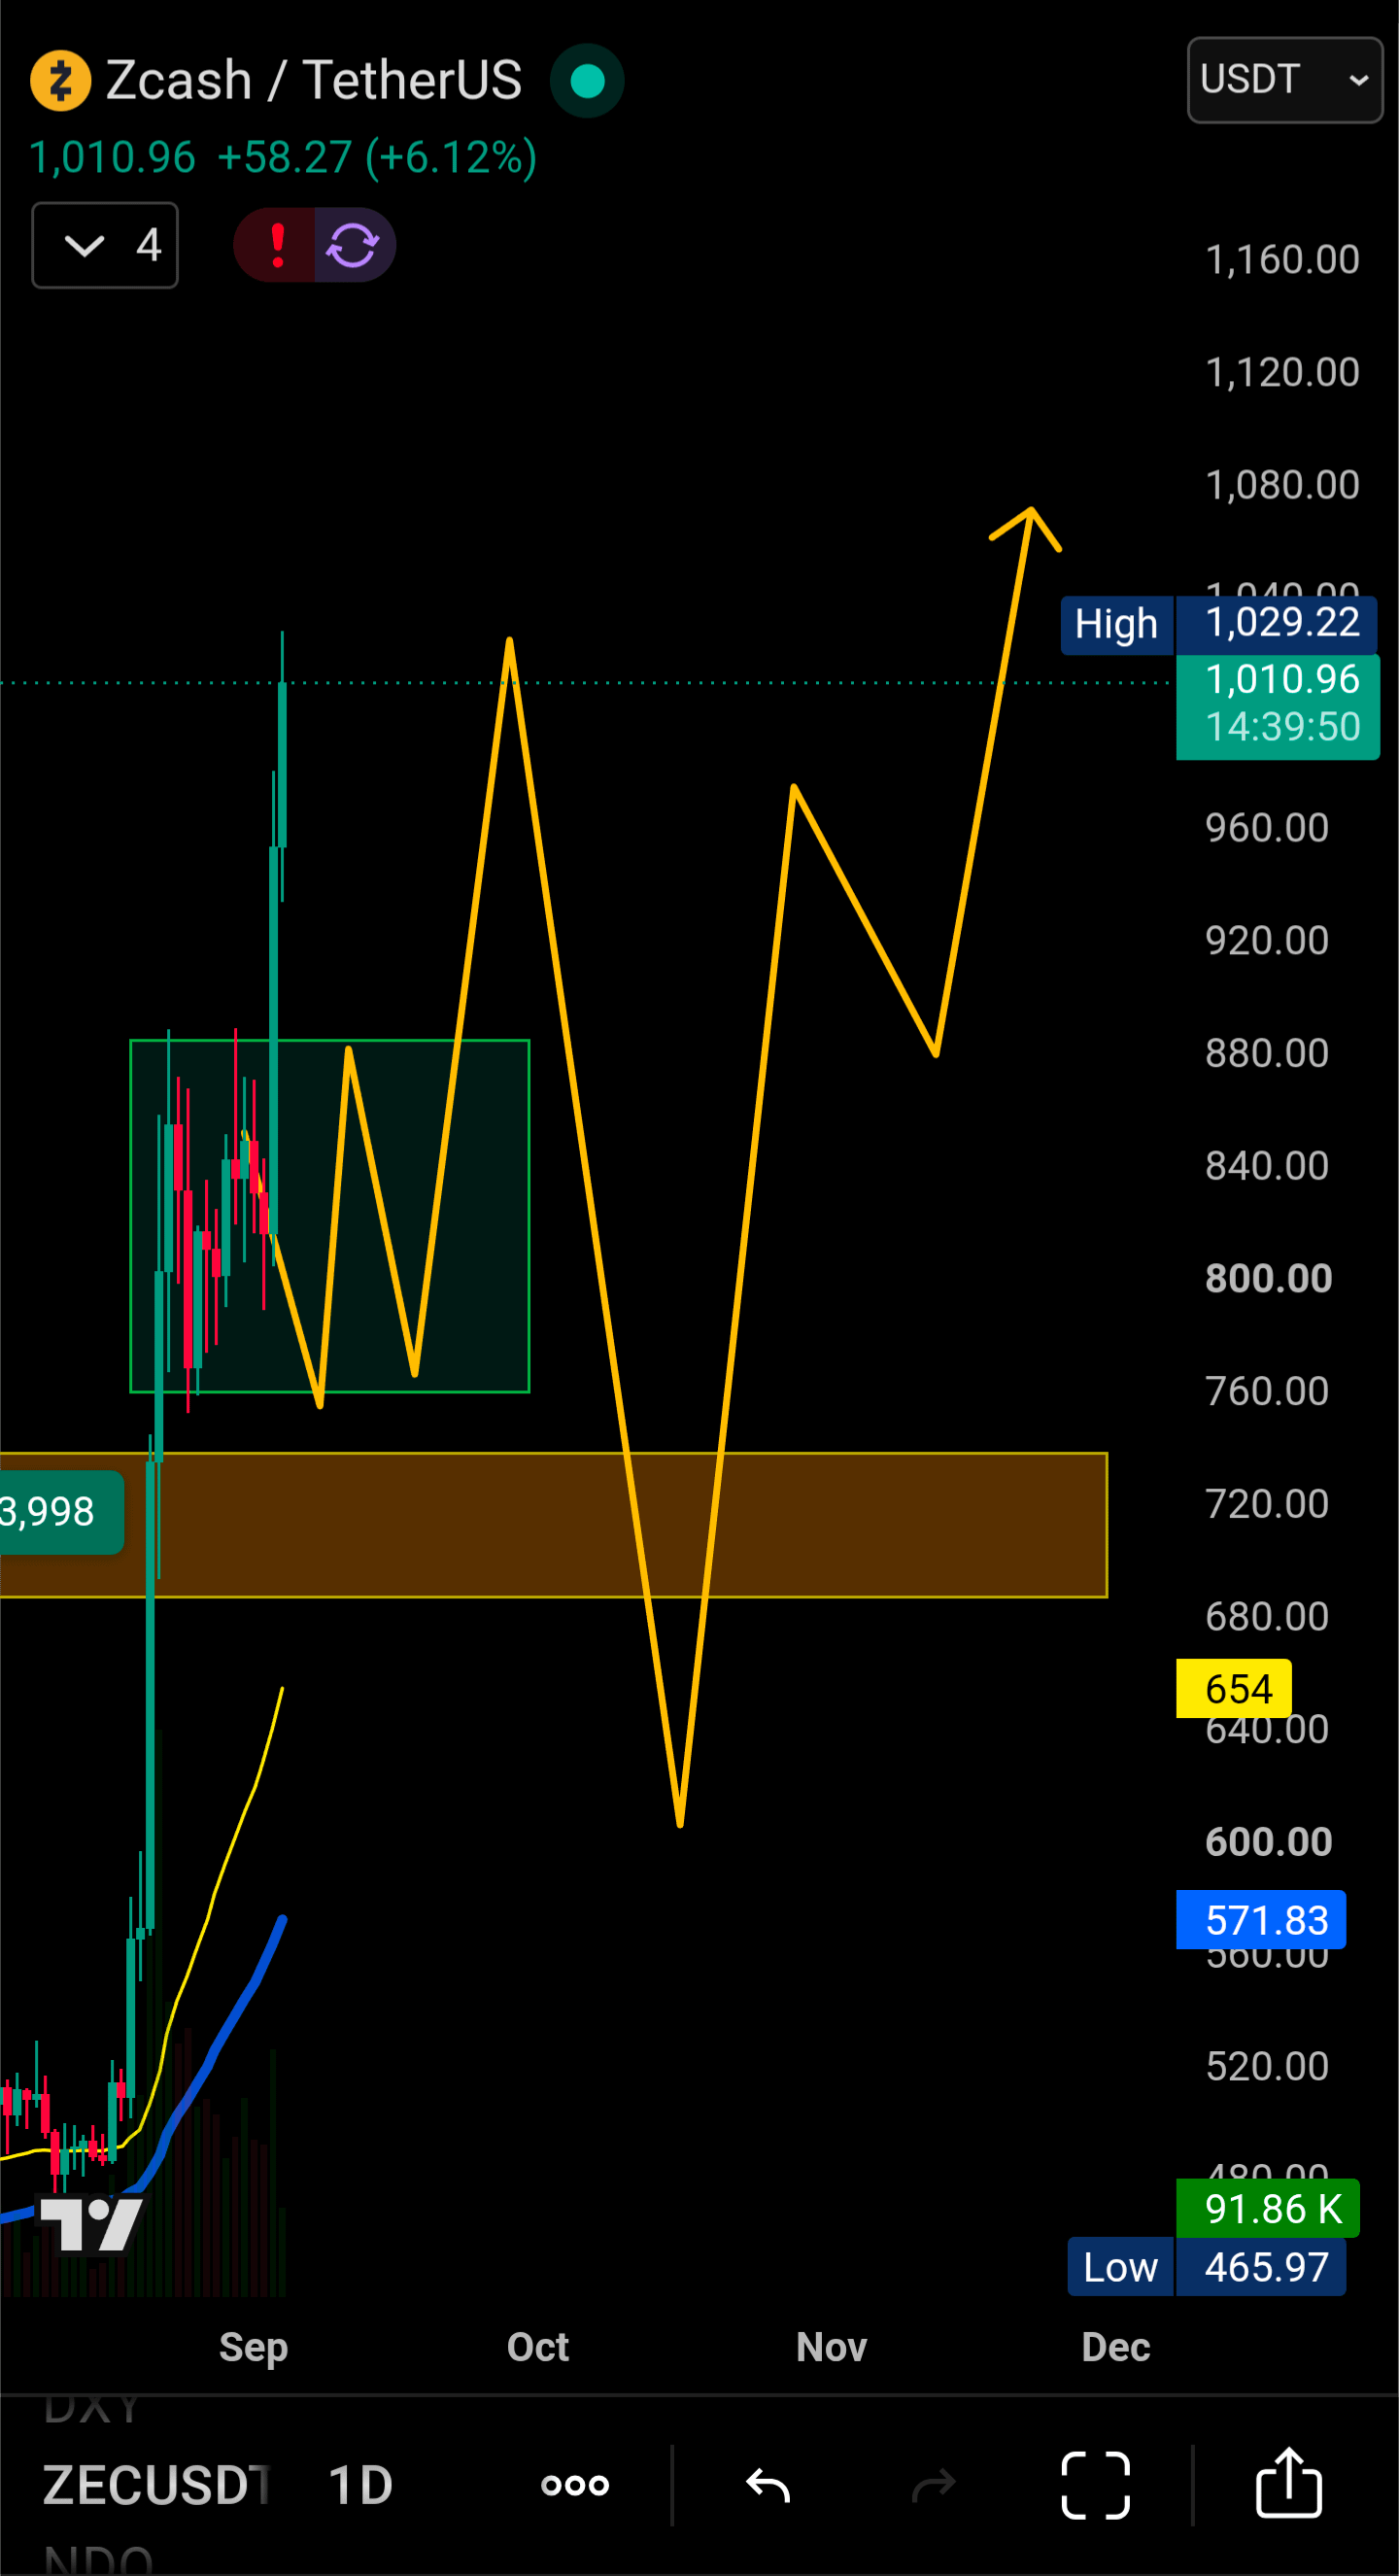
$ZEC has now hit the $1,000+ target we were expecting.
We already caught 3 successful moves on $ZEC, including the previous ~63% move, and now the breakout setup has delivered again.
The structure is still looking strong. If $ZEC continues holding above the previous breakout/support zone around $880–$737, I remain bullish and believe we can see further upside from here.
Next target: $1,150+ 🚀
Another one delivered. zec is doing exactly what we expected. 💰
$ZEC has now hit the $1,000+ target we were expecting.
We already caught 3 successful moves on $ZEC, including the previous ~63% move, and now the breakout setup has delivered again.
The structure is still looking strong. If $ZEC continues holding above the previous breakout/support zone around $880–$737, I remain bullish and believe we can see further upside from here.
Next target: $1,150+ 🚀
Another one delivered. zec is doing exactly what we expected. 💰
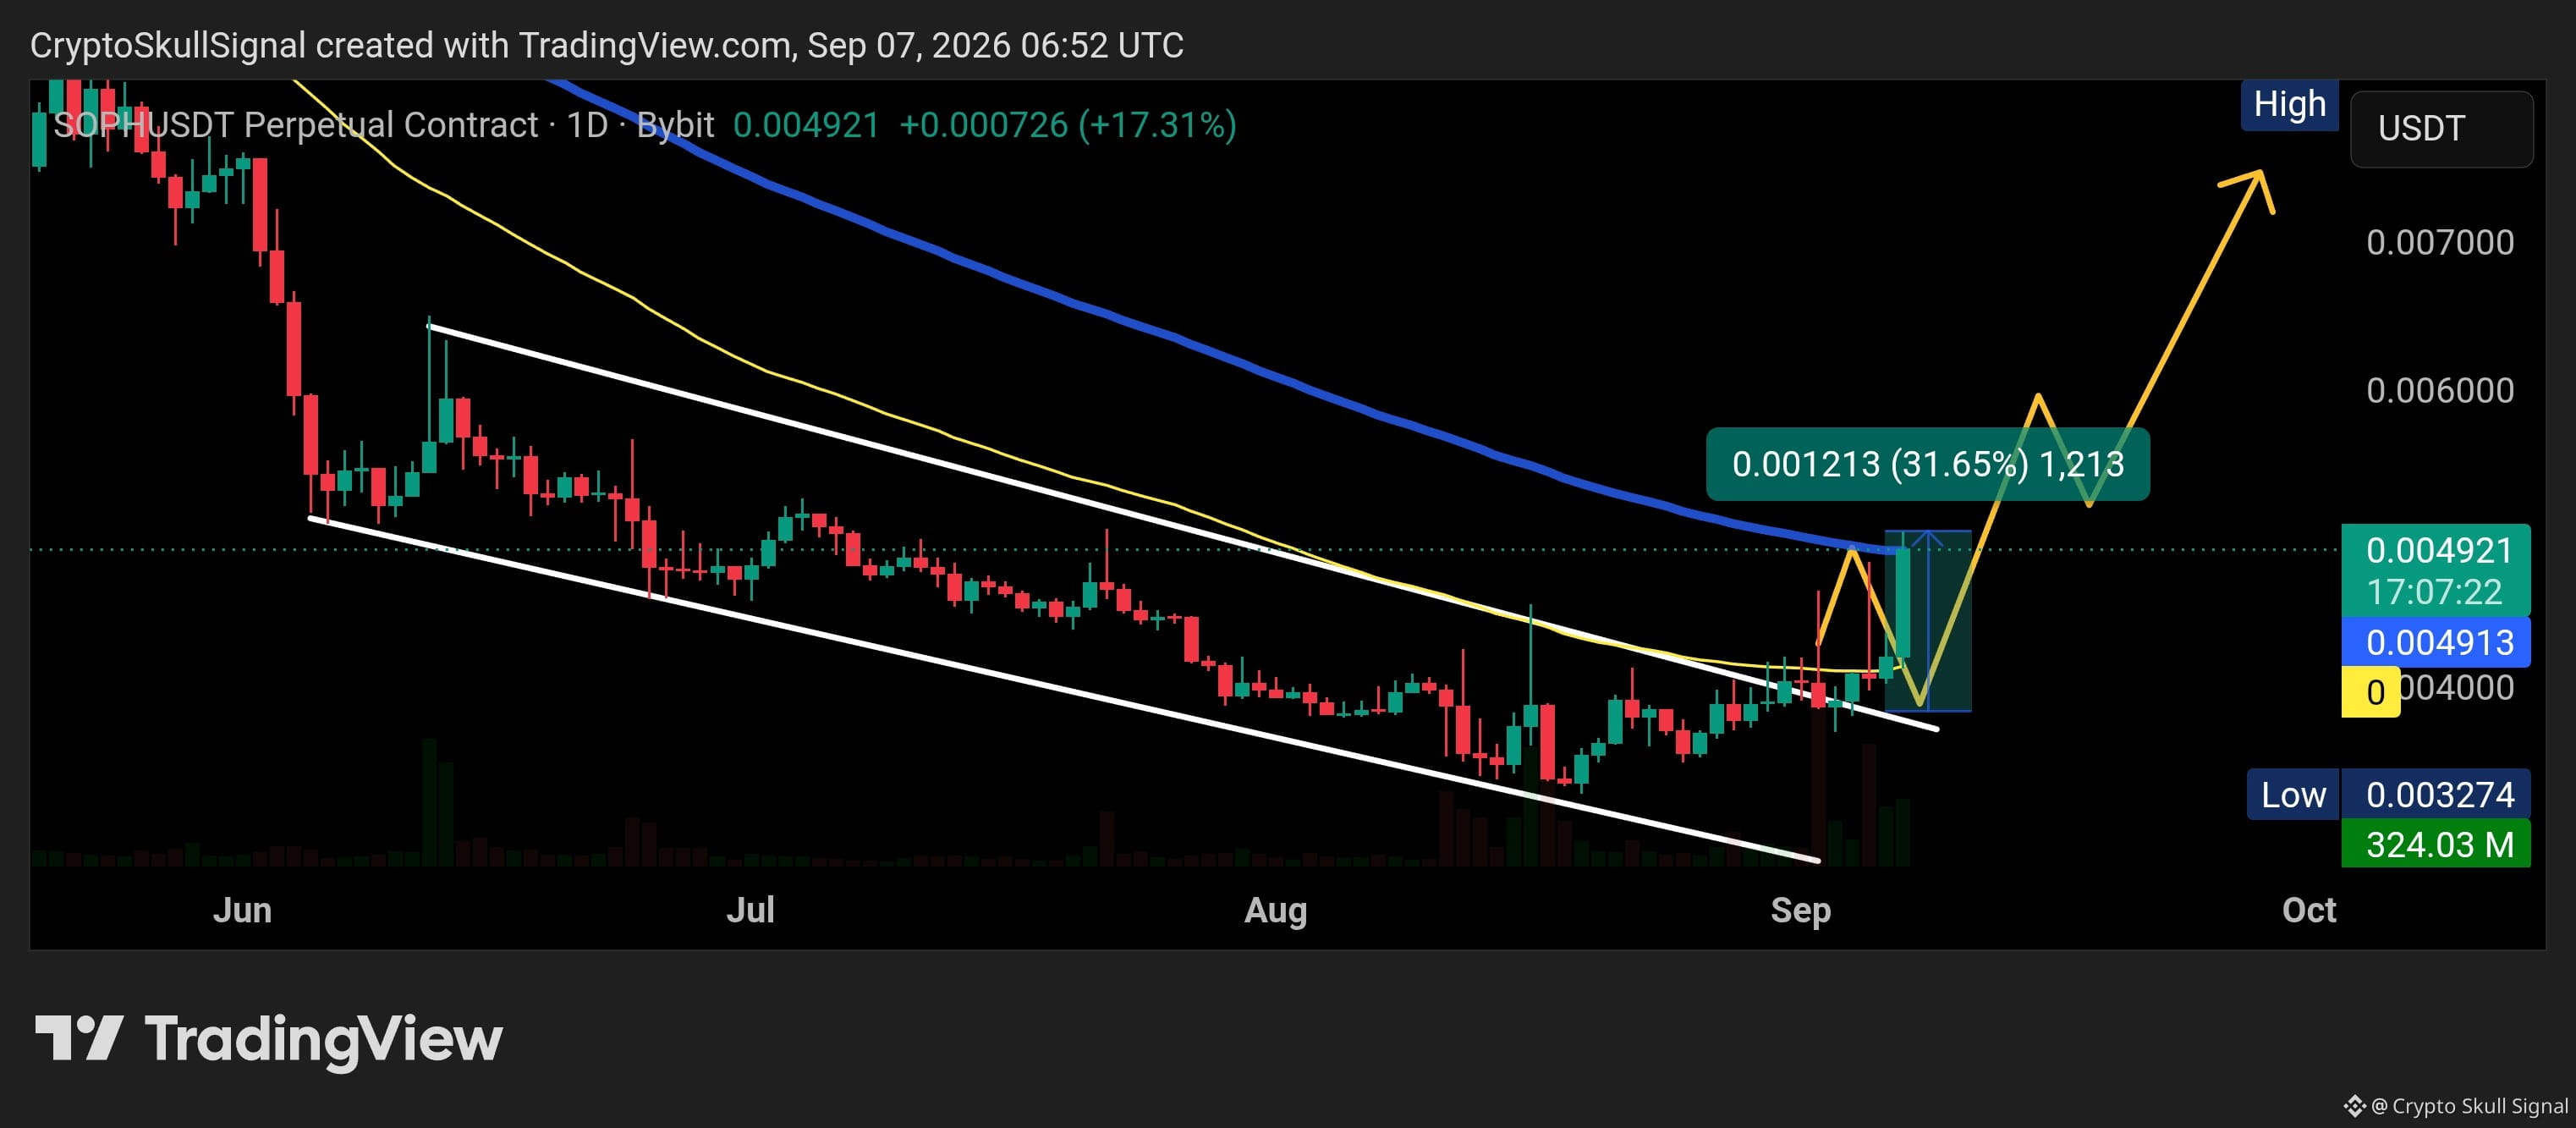
$SOPH is now around 30% up. 🚀
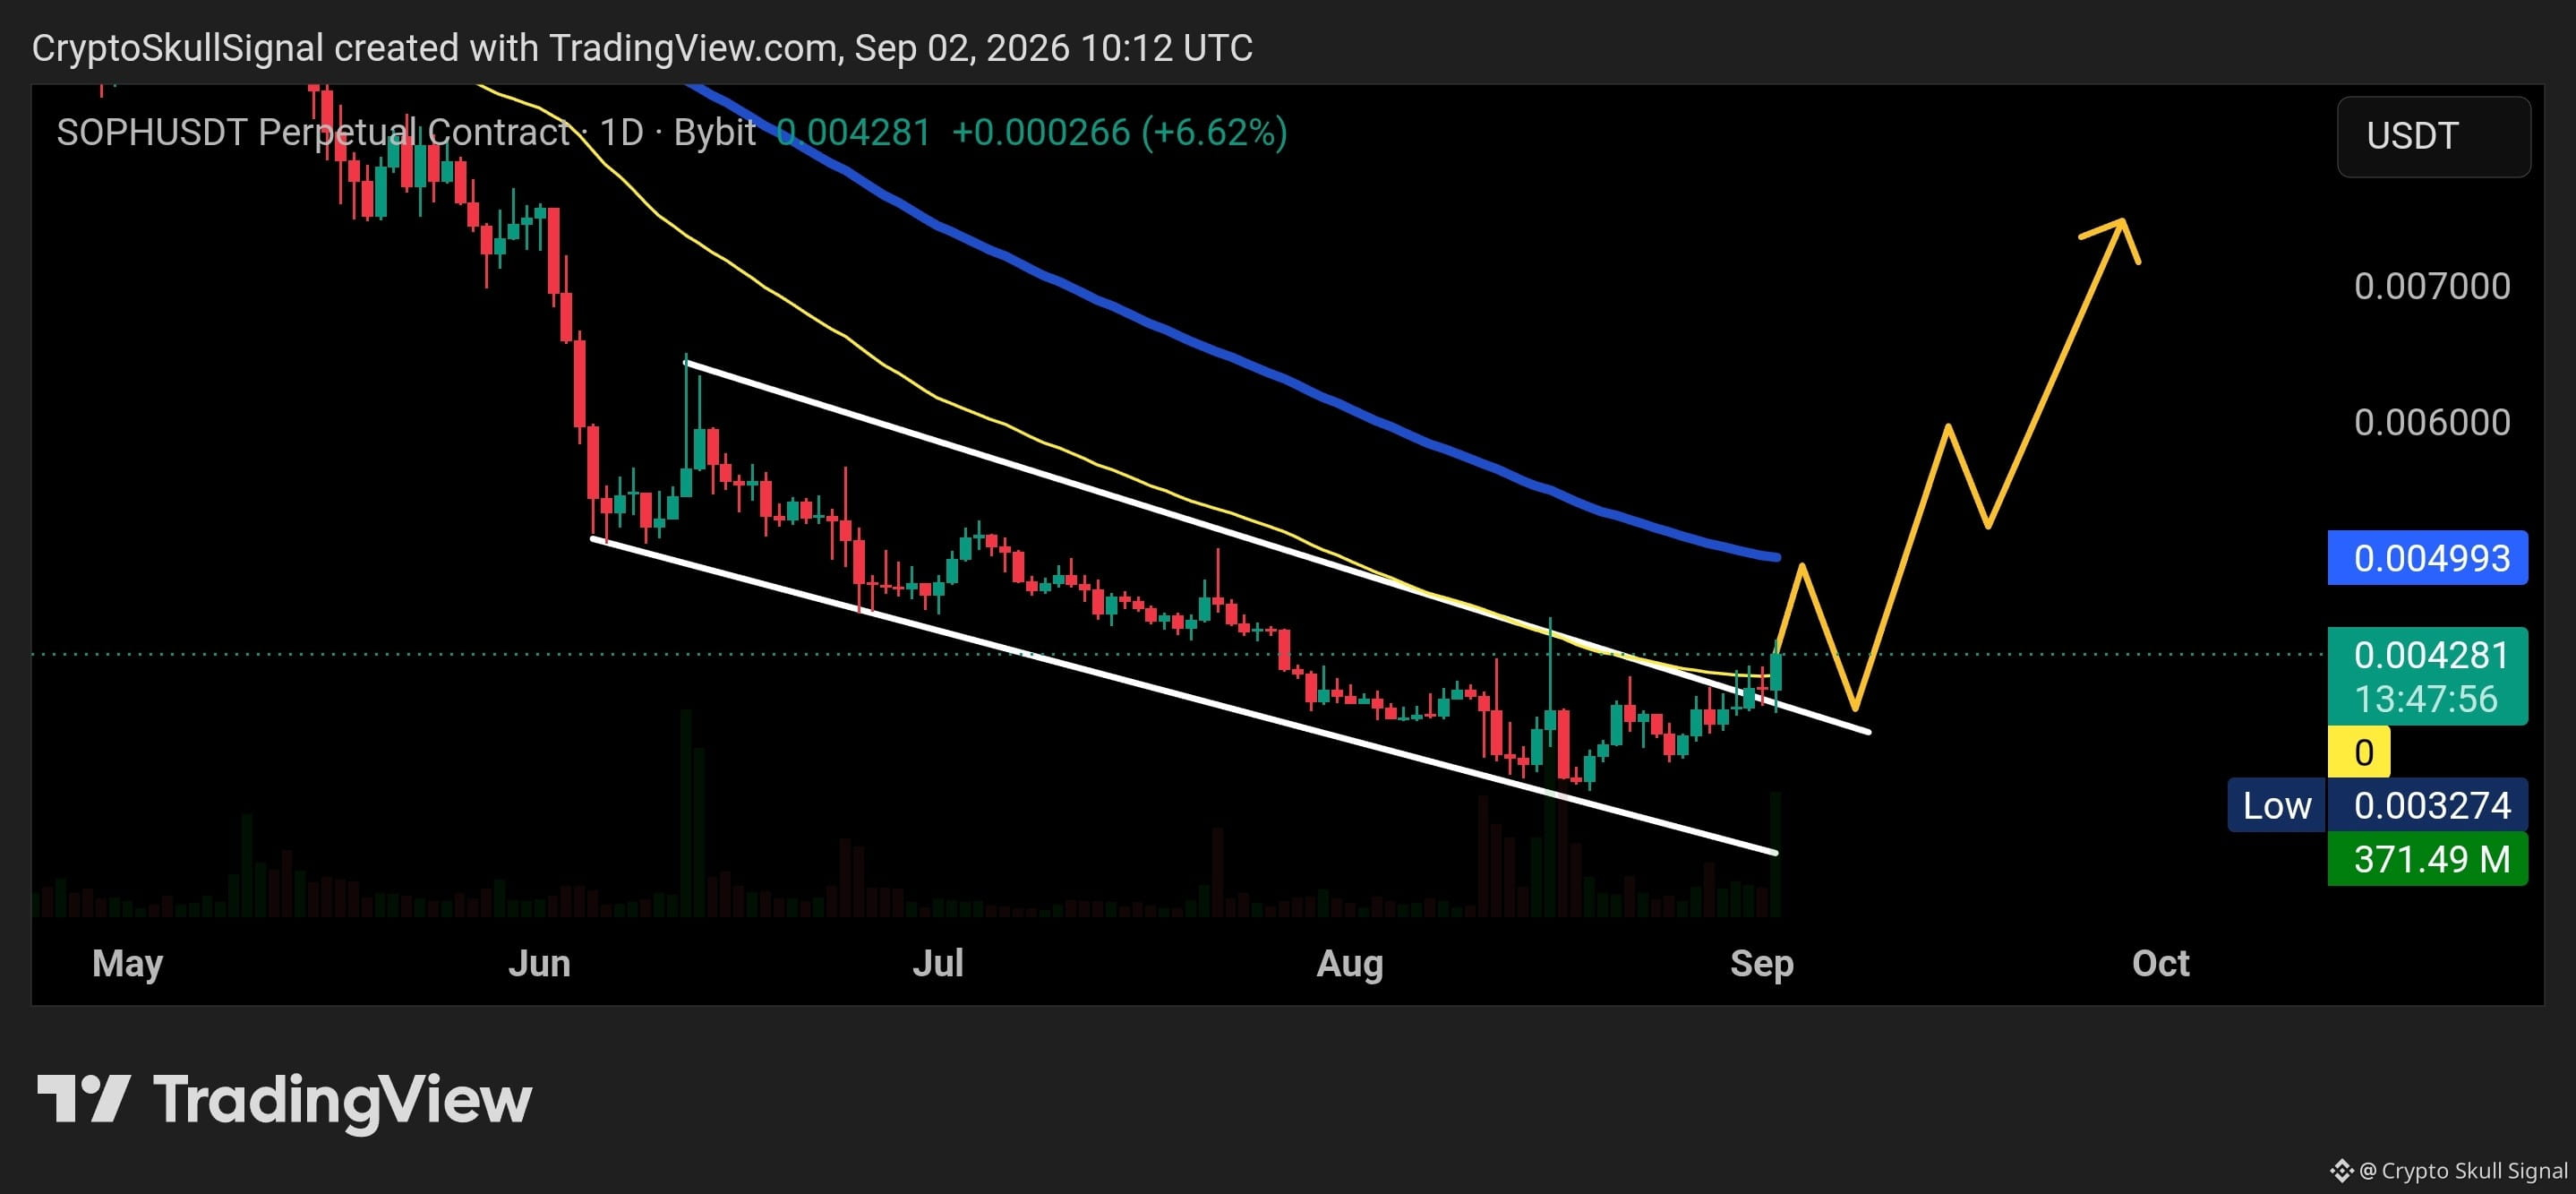
SOPH is moving exactly as expected after breaking out of the long-term descending channel.
The breakout is now showing strong momentum, with price pushing higher and reclaiming the key resistance area around $0.0049.
As long as SOPH holds above the breakout level, I remain bullish. The next upside targets are around:
$0.0058 → $0.0060 → $0.0070+ 🎯
The structure has completely changed after months of trading inside the descending channel. Now we want to see the previous resistance turn into support.
For now, SOPH looks bullish and the breakout is playing out nicely. 🚀
SOPH is moving exactly as expected after breaking out of the long-term descending channel.
The breakout is now showing strong momentum, with price pushing higher and reclaiming the key resistance area around $0.0049.
As long as SOPH holds above the breakout level, I remain bullish. The next upside targets are around:
$0.0058 → $0.0060 → $0.0070+ 🎯
The structure has completely changed after months of trading inside the descending channel. Now we want to see the previous resistance turn into support.
For now, SOPH looks bullish and the breakout is playing out nicely. 🚀
Crypto Skull Signal
·
--
ສັນຍານກະທິງ$SOPH is finally breaking out of the long-term descending channel after months of lower highs and lower lows.
Price has pushed above the channel resistance, and the breakout is now being tested. If #SOPH holds above the breakout area and continues building strength, I’m expecting the next move toward the major EMA around $0.0050, followed by $0.0058 → $0.0065 → $0.0075+.
The key now is simple: hold the breakout. A successful retest would make this setup even stronger.
For now, I’m bullish on $SOPH and watching for continuation toward $0.007+ 🚀
Price has pushed above the channel resistance, and the breakout is now being tested. If #SOPH holds above the breakout area and continues building strength, I’m expecting the next move toward the major EMA around $0.0050, followed by $0.0058 → $0.0065 → $0.0075+.
The key now is simple: hold the breakout. A successful retest would make this setup even stronger.
For now, I’m bullish on $SOPH and watching for continuation toward $0.007+ 🚀
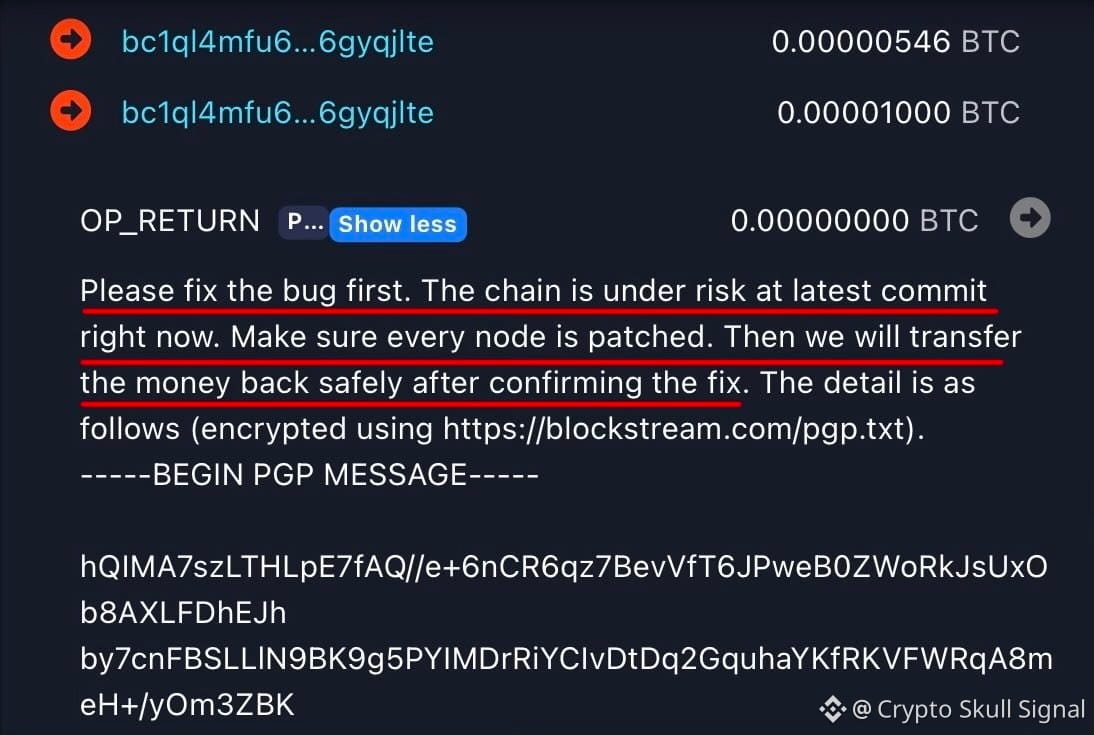
JUST IN: 4,000 Bitcoin worth $320 million withdrawn following Liquid Network hack.
The hacker is now communicating with network maintainers through on-chain Bitcoin transactions & intends to return the $BTC after the vulnerability is fixed.
The hacker is now communicating with network maintainers through on-chain Bitcoin transactions & intends to return the $BTC after the vulnerability is fixed.
$ZEC hit $1,150+ 🚀 Target 🎯
Crypto Skull Signal
·
--
ສັນຍານກະທິງ$ZEC HIT THE TARGET 🎯🚀
$ZEC has now hit the $1,000+ target we were expecting.
We already caught 3 successful moves on $ZEC, including the previous ~63% move, and now the breakout setup has delivered again.
The structure is still looking strong. If $ZEC continues holding above the previous breakout/support zone around $880–$737, I remain bullish and believe we can see further upside from here.
Next target: $1,150+ 🚀
Another one delivered. zec is doing exactly what we expected. 💰
$ZEC has now hit the $1,000+ target we were expecting.
We already caught 3 successful moves on $ZEC, including the previous ~63% move, and now the breakout setup has delivered again.
The structure is still looking strong. If $ZEC continues holding above the previous breakout/support zone around $880–$737, I remain bullish and believe we can see further upside from here.
Next target: $1,150+ 🚀
Another one delivered. zec is doing exactly what we expected. 💰
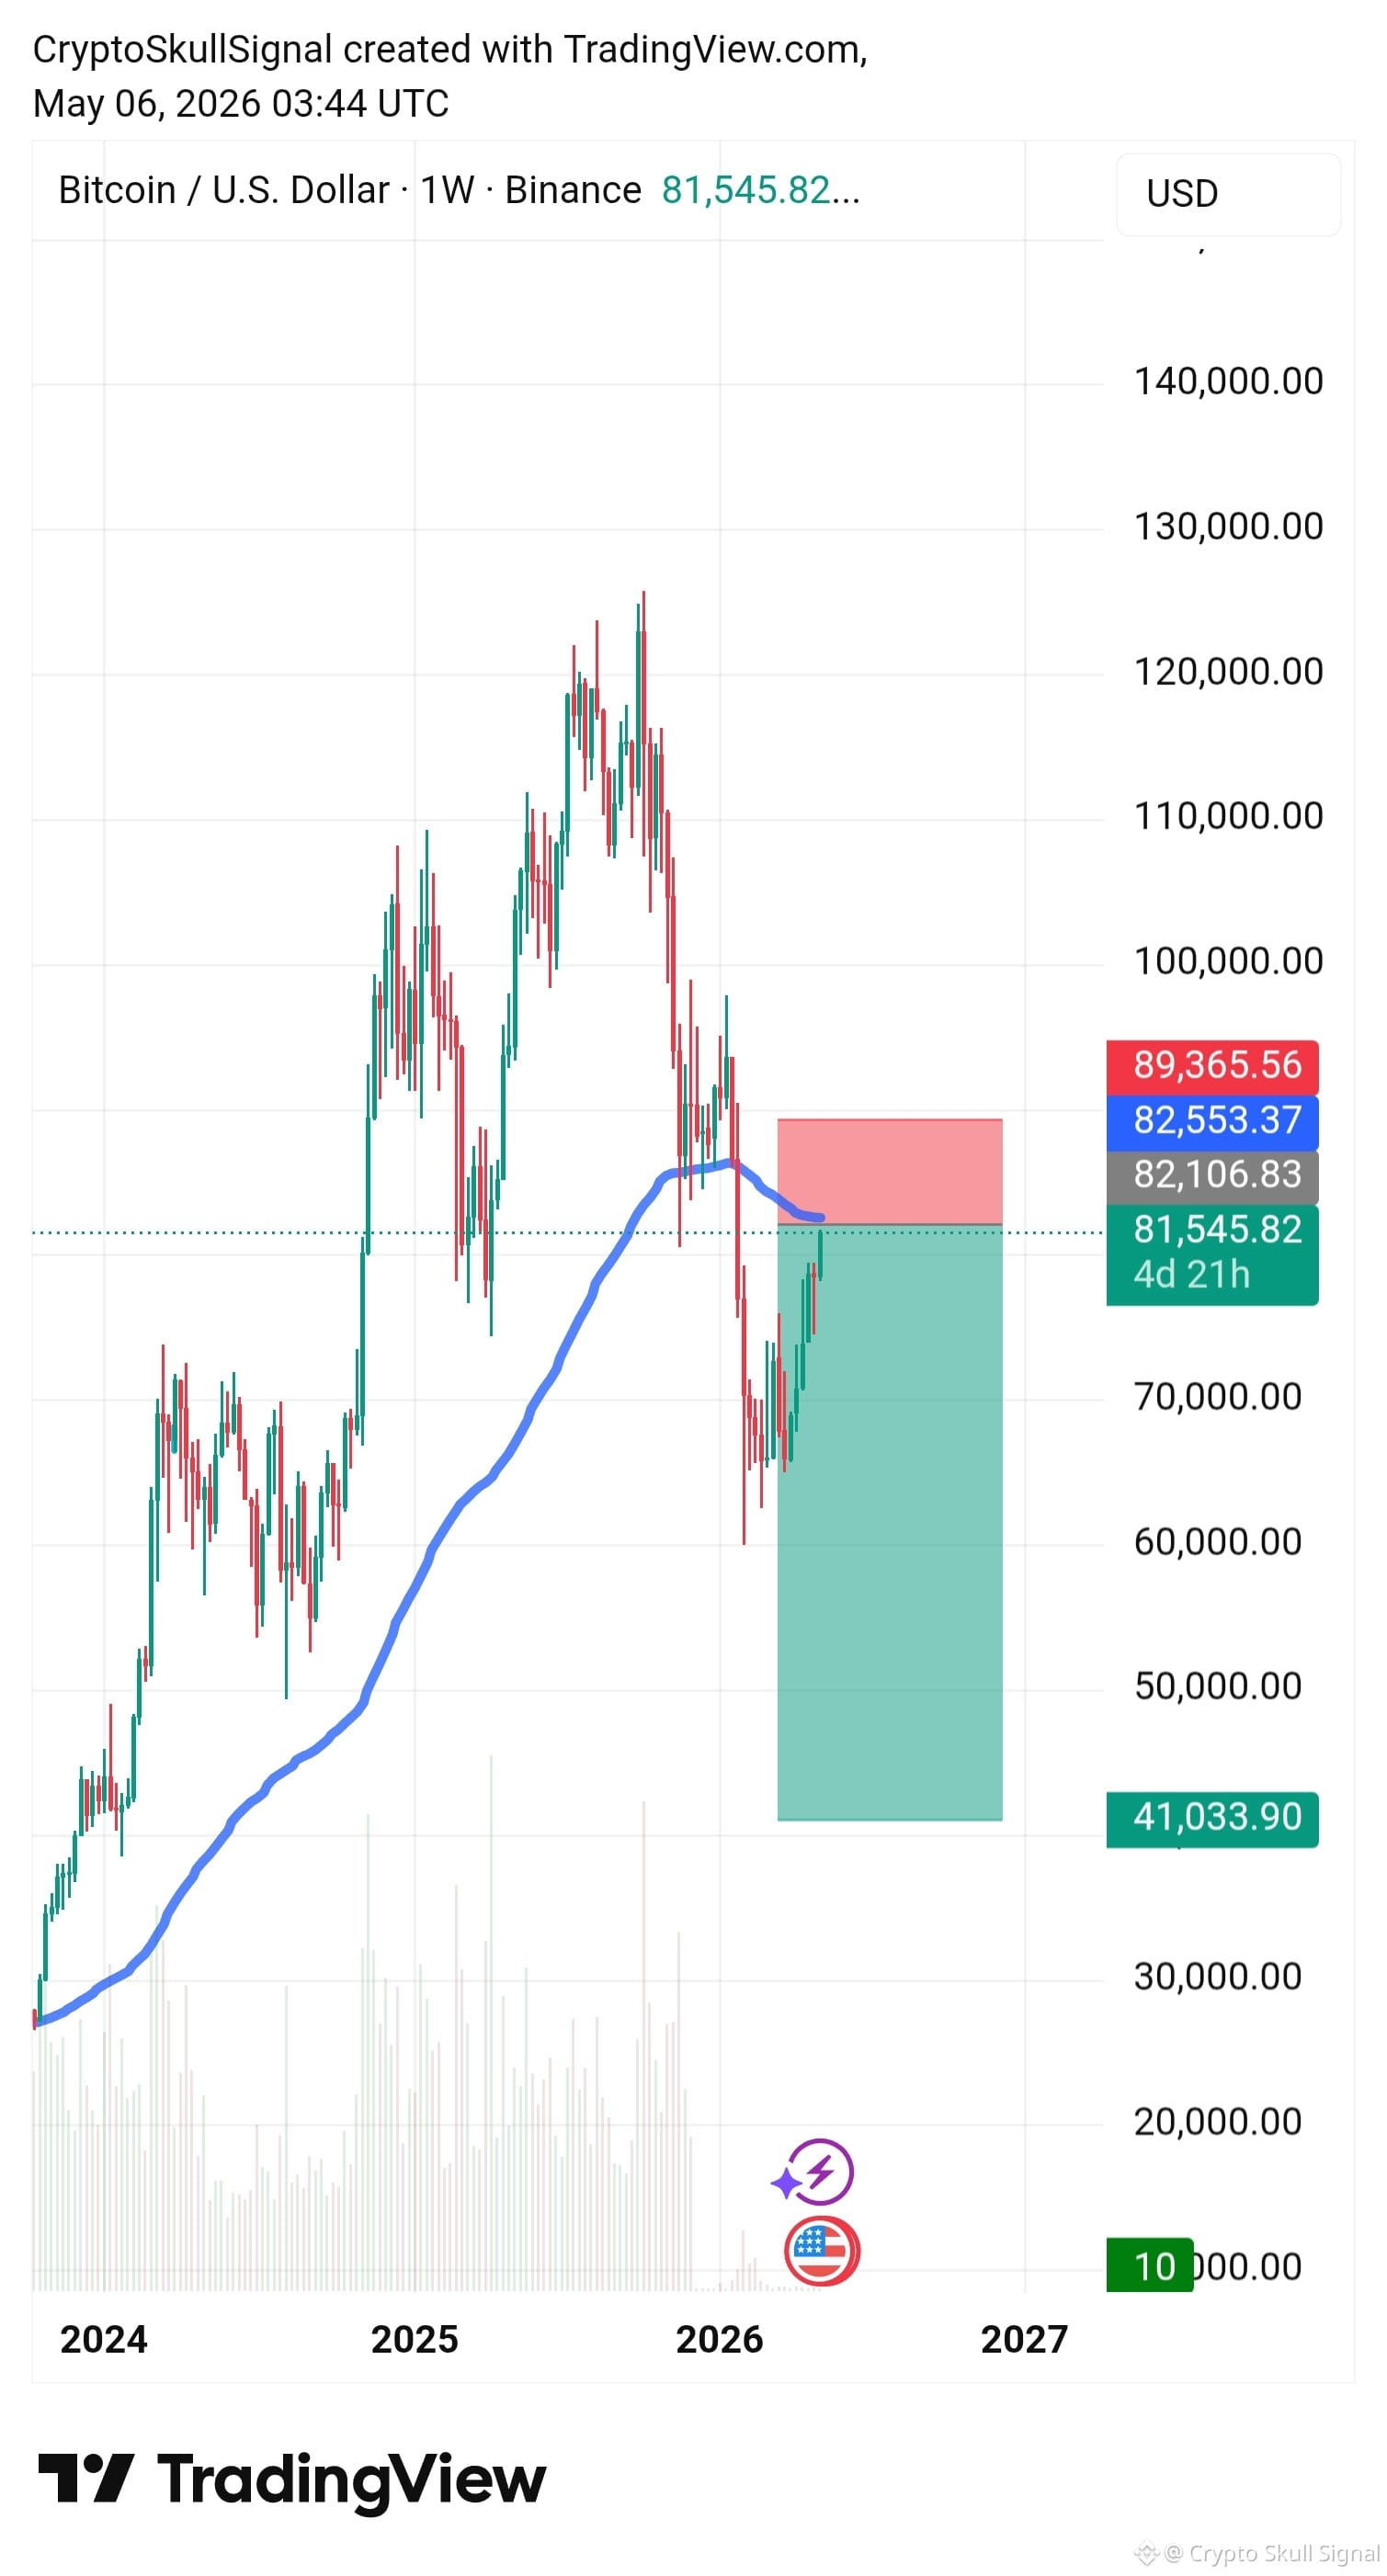
# Bitcoin Sunday Analysis
A small change in my plan, but my main view is still the same.
As I told you before, if BTC gets a strong weekly close above $82K and holds above it, I will accept the loss and close my short. That part has NOT changed.
But my position is currently in the red, so I want to manage the risk better.
If BTC drops back to the $70K–$72K support zone, I’m planning to close 50% of my short there and reduce my exposure.
If BTC later moves back toward $82K, I’ll consider adding that 50% back.
🔴 $82K → Weekly close above + hold = my bearish plan changes.
🟢 $70K–$72K → Important support + my 50% reduction zone.
For now, I’m still bearish and I still believe this pump could be a trap. But I’m not going to blindly hold a position just to prove a point. Risk management comes first.
Let’s see what BTC gives us next. 👀
$BTC
A small change in my plan, but my main view is still the same.
As I told you before, if BTC gets a strong weekly close above $82K and holds above it, I will accept the loss and close my short. That part has NOT changed.
But my position is currently in the red, so I want to manage the risk better.
If BTC drops back to the $70K–$72K support zone, I’m planning to close 50% of my short there and reduce my exposure.
If BTC later moves back toward $82K, I’ll consider adding that 50% back.
🔴 $82K → Weekly close above + hold = my bearish plan changes.
🟢 $70K–$72K → Important support + my 50% reduction zone.
For now, I’m still bearish and I still believe this pump could be a trap. But I’m not going to blindly hold a position just to prove a point. Risk management comes first.
Let’s see what BTC gives us next. 👀
$BTC
Crypto Skull Signal
·
--
ສັນຍານໝີ🟠 BTC SUNDAY ANALYSIS
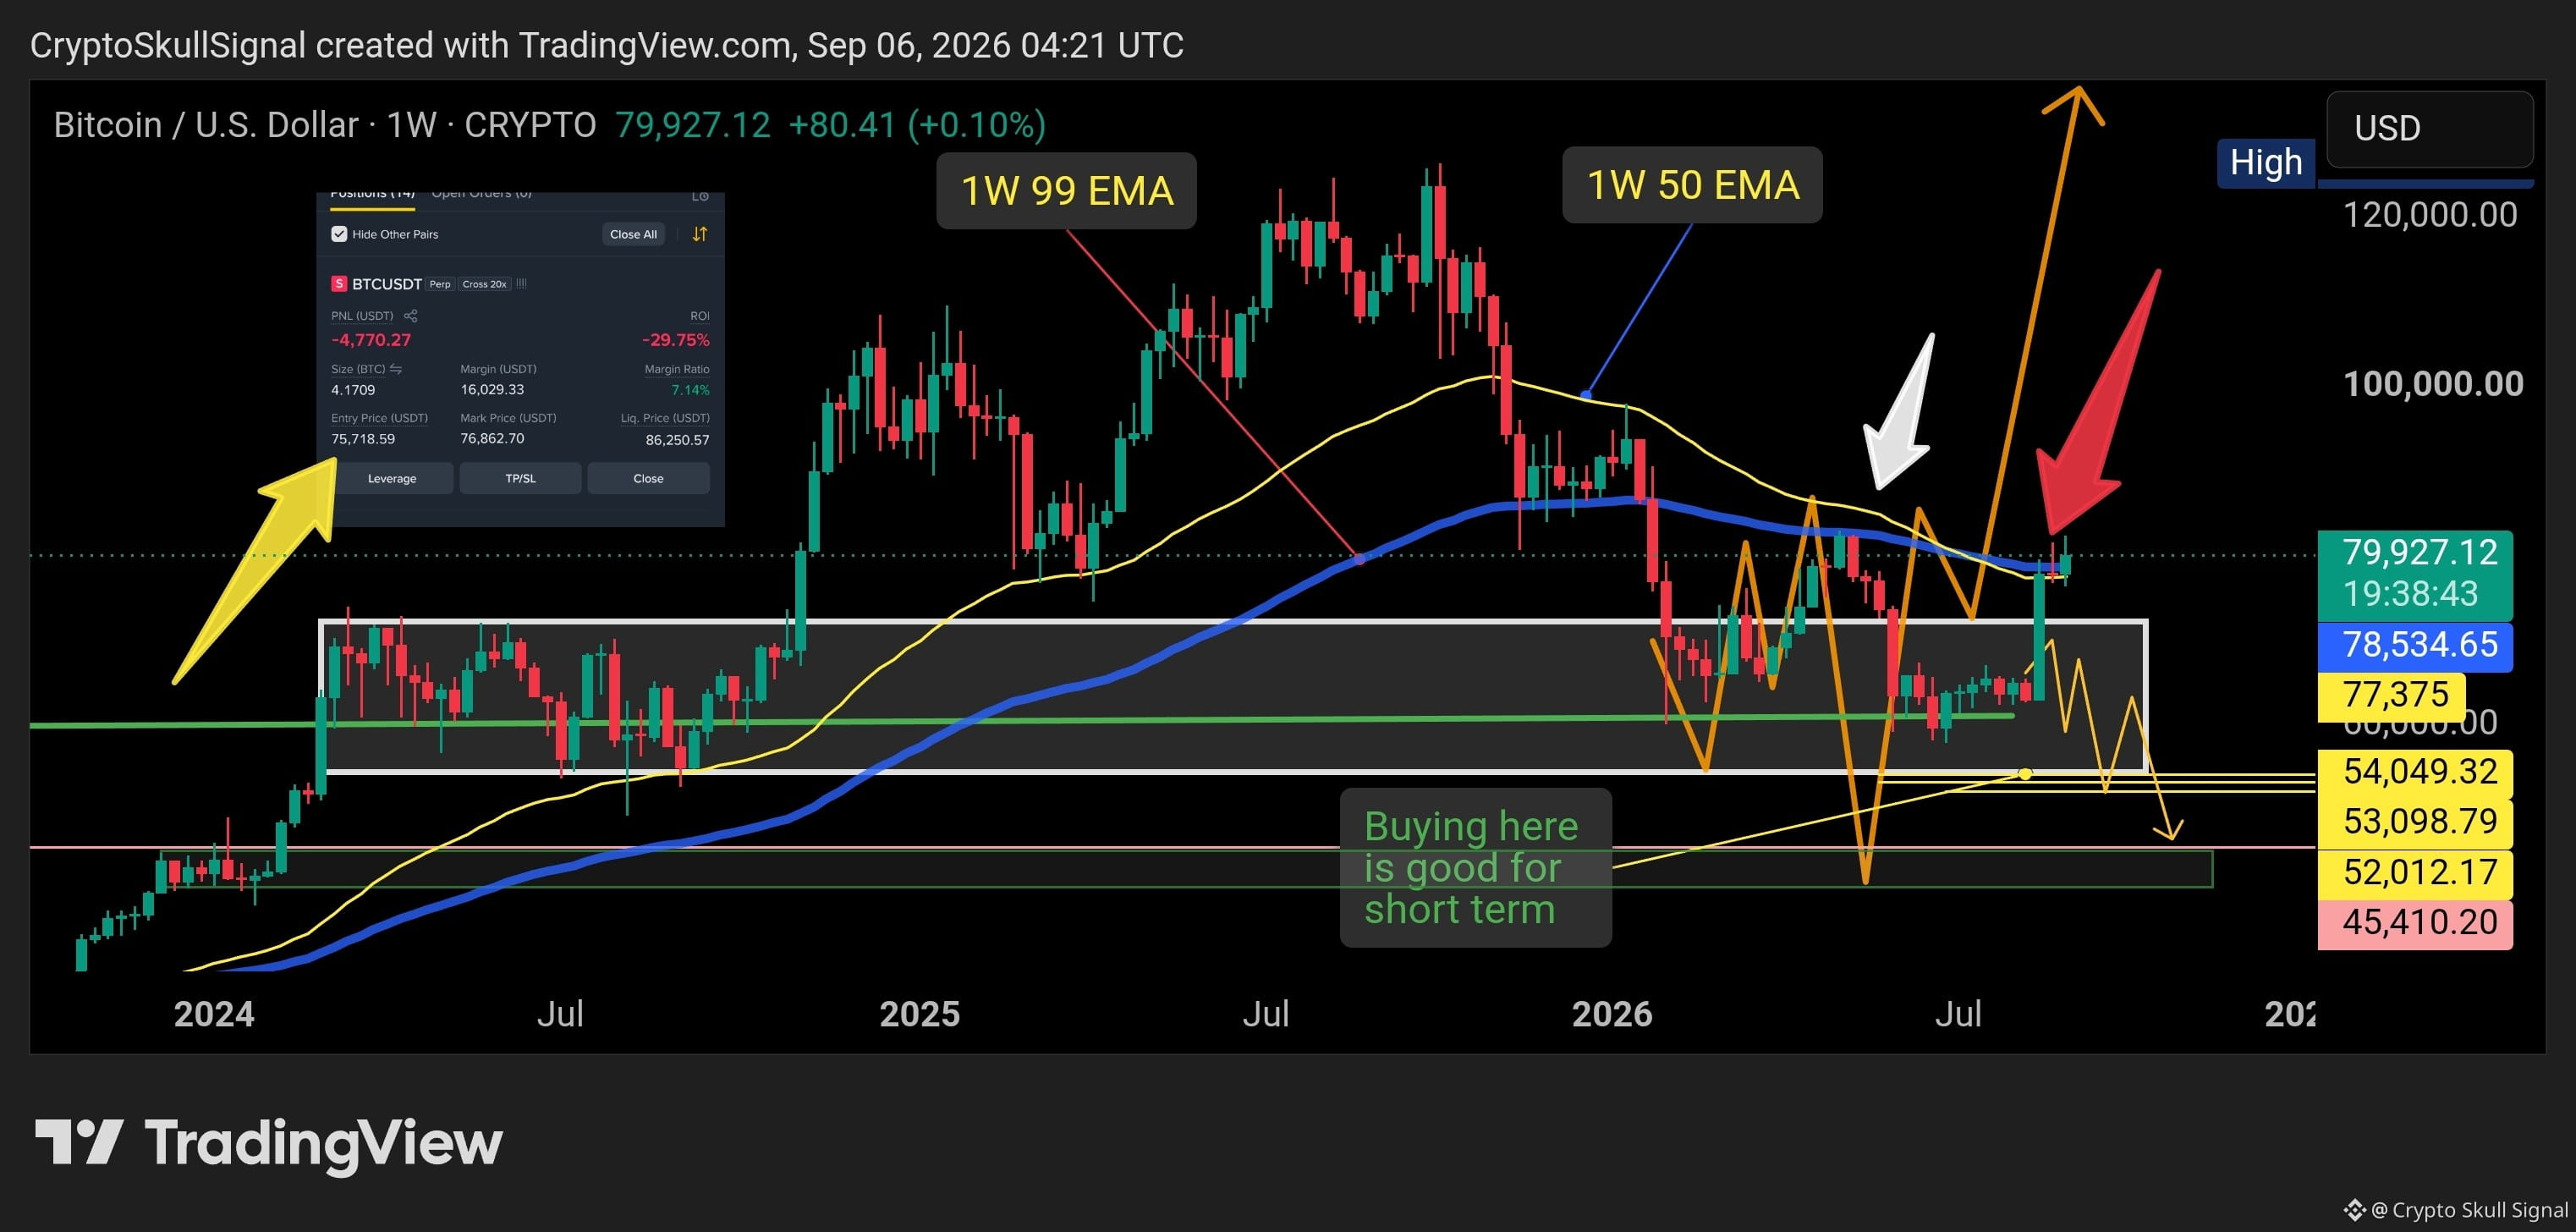
Nothing changed from my last update. I’m still looking at this move as a possible trap pump.
BTC is around $78K, but the level I’m watching is still $82K. I already told you, I need a weekly candle close above $82K and then BTC must hold above it. Until that happens, I’m not changing my view.
Right now, it looks like this weekly candle will close below $82K.
One important thing has changed though: $70K-$72K is now support. The same zone I was calling resistance before has now turned into support.
So watch these two levels closely:
🔴 $82K = Key resistance
🟢 $70K-$72K = Key support
If BTC breaks and holds above $82K, I will reconsider my bearish view.
But if BTC comes back to $70K-$72K and fails to hold this support, then I will take that as a strong confirmation that this pump was a trap.
For now, I’m still holding my short position and waiting.
Nothing changed. Let’s see what Bitcoin does next. 👀
$BTC
Nothing changed from my last update. I’m still looking at this move as a possible trap pump.
BTC is around $78K, but the level I’m watching is still $82K. I already told you, I need a weekly candle close above $82K and then BTC must hold above it. Until that happens, I’m not changing my view.
Right now, it looks like this weekly candle will close below $82K.
One important thing has changed though: $70K-$72K is now support. The same zone I was calling resistance before has now turned into support.
So watch these two levels closely:
🔴 $82K = Key resistance
🟢 $70K-$72K = Key support
If BTC breaks and holds above $82K, I will reconsider my bearish view.
But if BTC comes back to $70K-$72K and fails to hold this support, then I will take that as a strong confirmation that this pump was a trap.
For now, I’m still holding my short position and waiting.
Nothing changed. Let’s see what Bitcoin does next. 👀
$BTC
Elon Musk says he doesn’t have a “big pile of cash.”
And technically, he’s right.
Most of his wealth is tied up in stocks, mainly Tesla and SpaceX.
Here’s where it gets interesting:
1️⃣ His stocks go up in value → His net worth increases massively.
2️⃣ He doesn’t sell the stocks → No cash is realized from that gain.
3️⃣ Instead of selling, he can use those shares as collateral to borrow money.
4️⃣ He gets access to billions in cash without necessarily selling his ownership.
5️⃣ Then he can use that liquidity to make investments, acquisitions, or fund major purchases.
😆 The irony?
“Stocks are not cash, so you shouldn’t tax me on them.”
But those same stocks can be valuable enough to unlock billions in loans.
That’s the difference between how most people think about wealth and how the ultra-rich use wealth.
The poor work for money.
The rich own assets.
And the ultra-rich borrow against those assets.
The real game isn’t always about having cash.
It’s about owning something valuable enough that banks are willing to give you cash against it. 👀🔥
$TSLA $SPCX
And technically, he’s right.
Most of his wealth is tied up in stocks, mainly Tesla and SpaceX.
Here’s where it gets interesting:
1️⃣ His stocks go up in value → His net worth increases massively.
2️⃣ He doesn’t sell the stocks → No cash is realized from that gain.
3️⃣ Instead of selling, he can use those shares as collateral to borrow money.
4️⃣ He gets access to billions in cash without necessarily selling his ownership.
5️⃣ Then he can use that liquidity to make investments, acquisitions, or fund major purchases.
😆 The irony?
“Stocks are not cash, so you shouldn’t tax me on them.”
But those same stocks can be valuable enough to unlock billions in loans.
That’s the difference between how most people think about wealth and how the ultra-rich use wealth.
The poor work for money.
The rich own assets.
And the ultra-rich borrow against those assets.
The real game isn’t always about having cash.
It’s about owning something valuable enough that banks are willing to give you cash against it. 👀🔥
$TSLA $SPCX


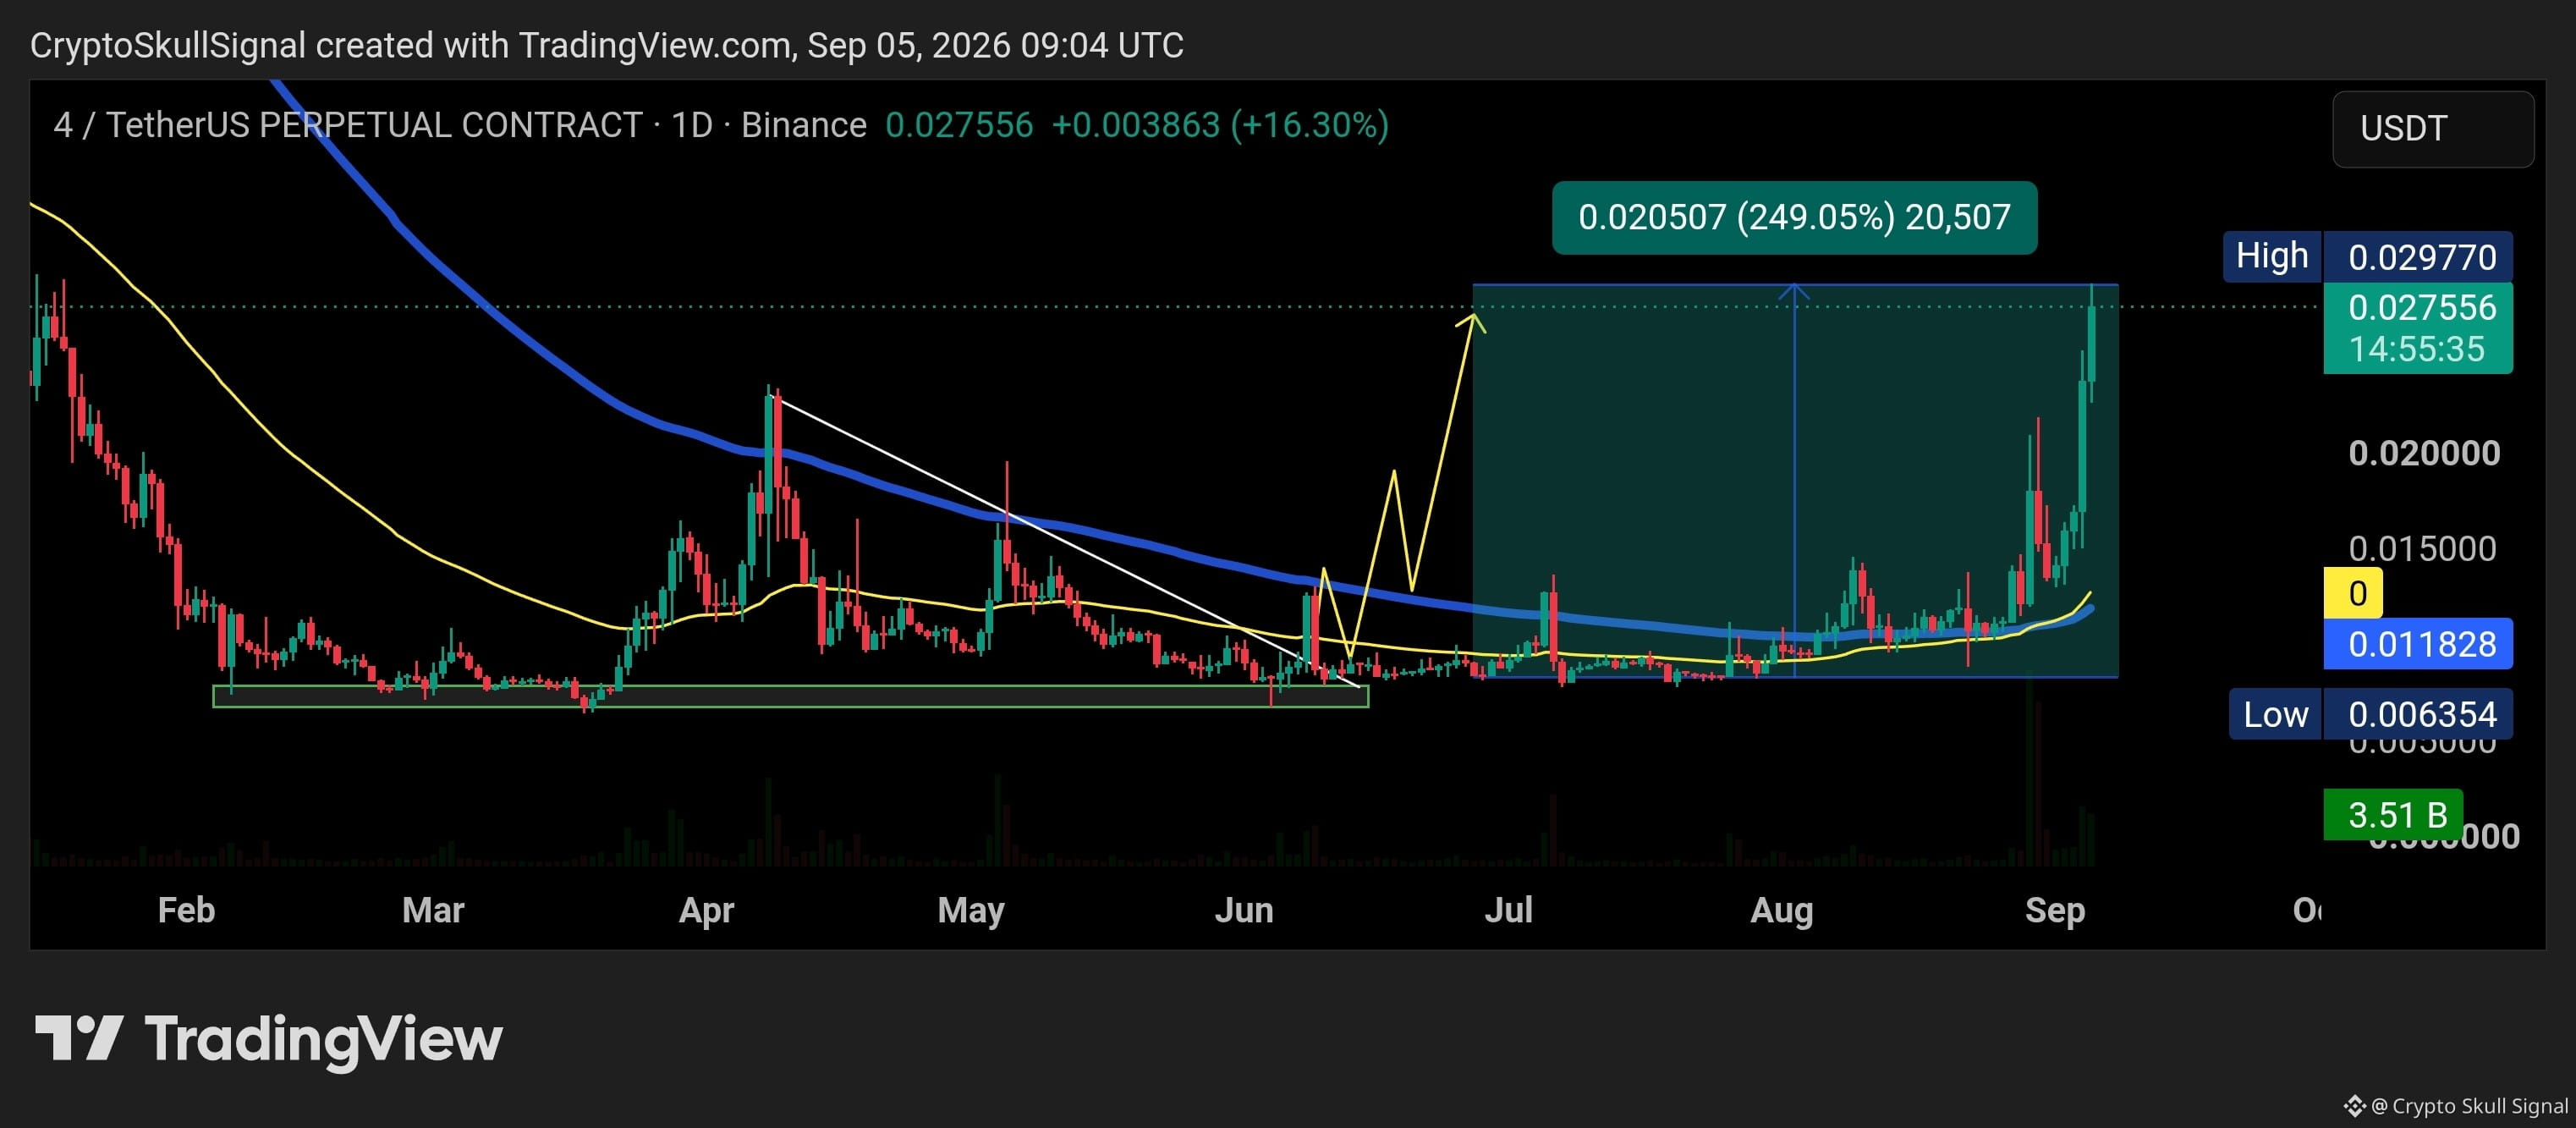
$4 is up 249% from our accumulation zone. 🔥
And honestly, if I were a Market Maker, I’d probably push a meme harder than many other altcoins too.
Why?
Because fundamentally, most memes have almost no intrinsic value to justify their valuation. But ironically, that’s exactly what makes them perfect for building narratives, creating hype, triggering FOMO, and attracting massive liquidity.
Crypto can sometimes be very simple:
Want users? → Create attention.
Want attention? → Create FOMO.
And nothing creates FOMO faster than watching a meme coin go 10x, 100x, or even 1,000x.
That’s why memes can become some of the most powerful liquidity machines in crypto.
$4 is already up 249%, and the market is paying attention now. 🔥
And honestly, if I were a Market Maker, I’d probably push a meme harder than many other altcoins too.
Why?
Because fundamentally, most memes have almost no intrinsic value to justify their valuation. But ironically, that’s exactly what makes them perfect for building narratives, creating hype, triggering FOMO, and attracting massive liquidity.
Crypto can sometimes be very simple:
Want users? → Create attention.
Want attention? → Create FOMO.
And nothing creates FOMO faster than watching a meme coin go 10x, 100x, or even 1,000x.
That’s why memes can become some of the most powerful liquidity machines in crypto.
$4 is already up 249%, and the market is paying attention now. 🔥
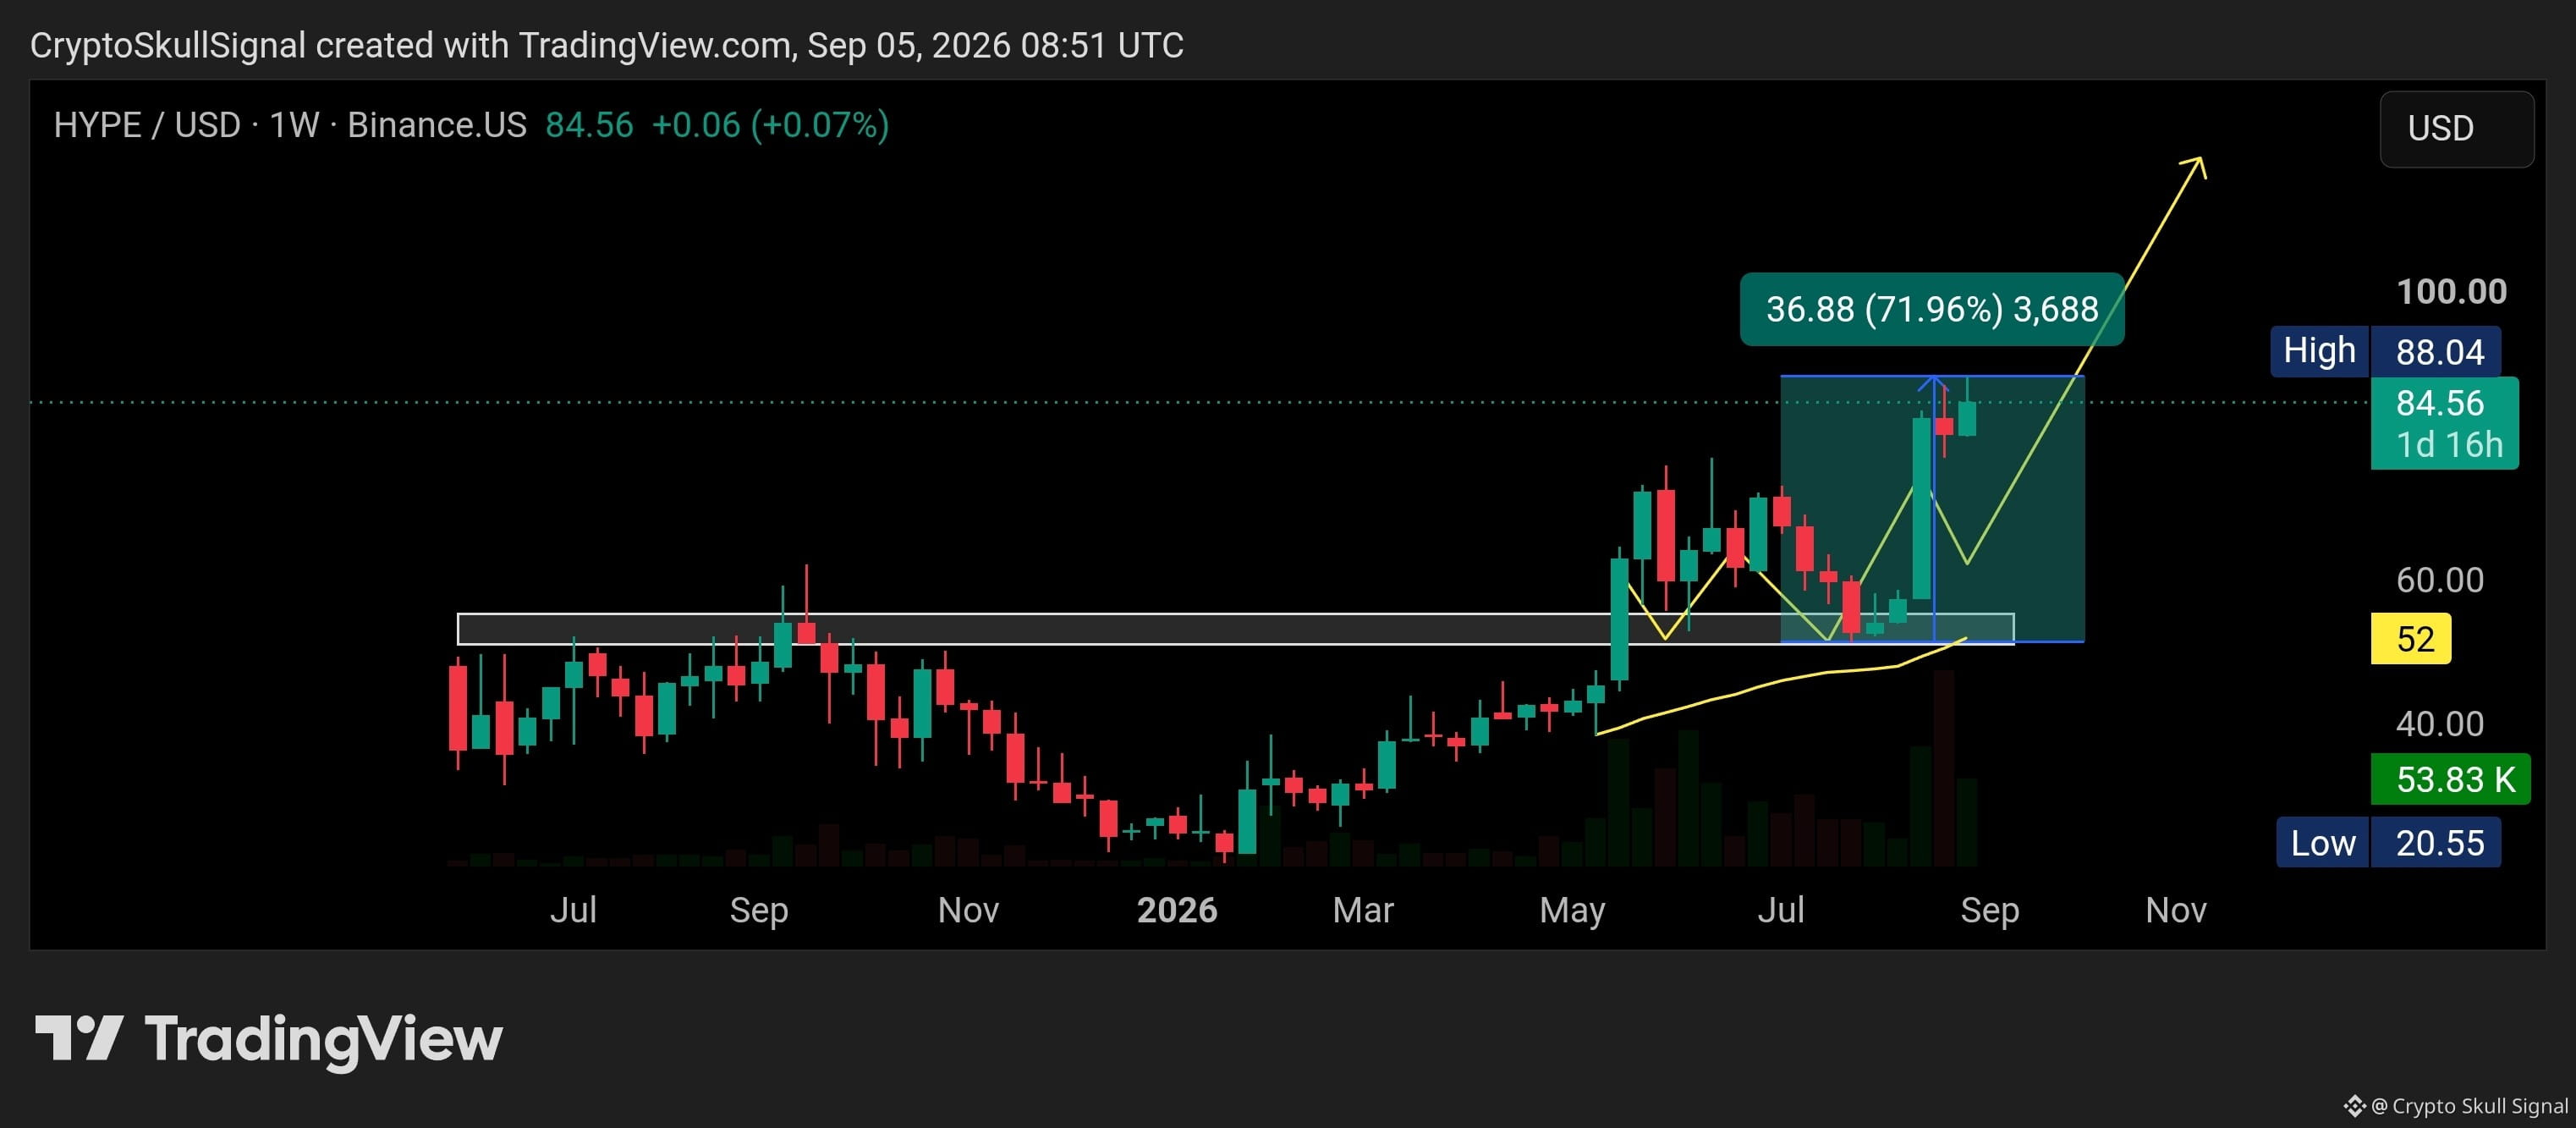
$HYPE IS NOW 71% UP 🚀🔥
Another massive move from our setup! $HYPE has delivered an incredible 71% upside move and is doing exactly what we expected.
The breakout and bullish structure played out perfectly. 🚀
$HYPE continues showing strong momentum, and this is another successful move for the community. 💰🔥
71% PROFIT SO FAR! 🎯🚀
Another massive move from our setup! $HYPE has delivered an incredible 71% upside move and is doing exactly what we expected.
The breakout and bullish structure played out perfectly. 🚀
$HYPE continues showing strong momentum, and this is another successful move for the community. 💰🔥
71% PROFIT SO FAR! 🎯🚀
Crypto Skull Signal
·
--
ສັນຍານກະທິງ$HYPE is taking a breather after its strong rally, but there's nothing bearish about this chart yet. Price is still holding above the key $50 to $55 support zone, which keeps the bigger picture looking positive.
As long as that level holds, I still see a move toward $100 as the next major objective, with $120 possible if momentum picks up again. 🚀📈
As long as that level holds, I still see a move toward $100 as the next major objective, with $120 possible if momentum picks up again. 🚀📈
JUST IN: $200,000,000 worth of crypto longs liquidated in the past 15 minutes.
$ZEC HIT THE TARGET 🎯🚀
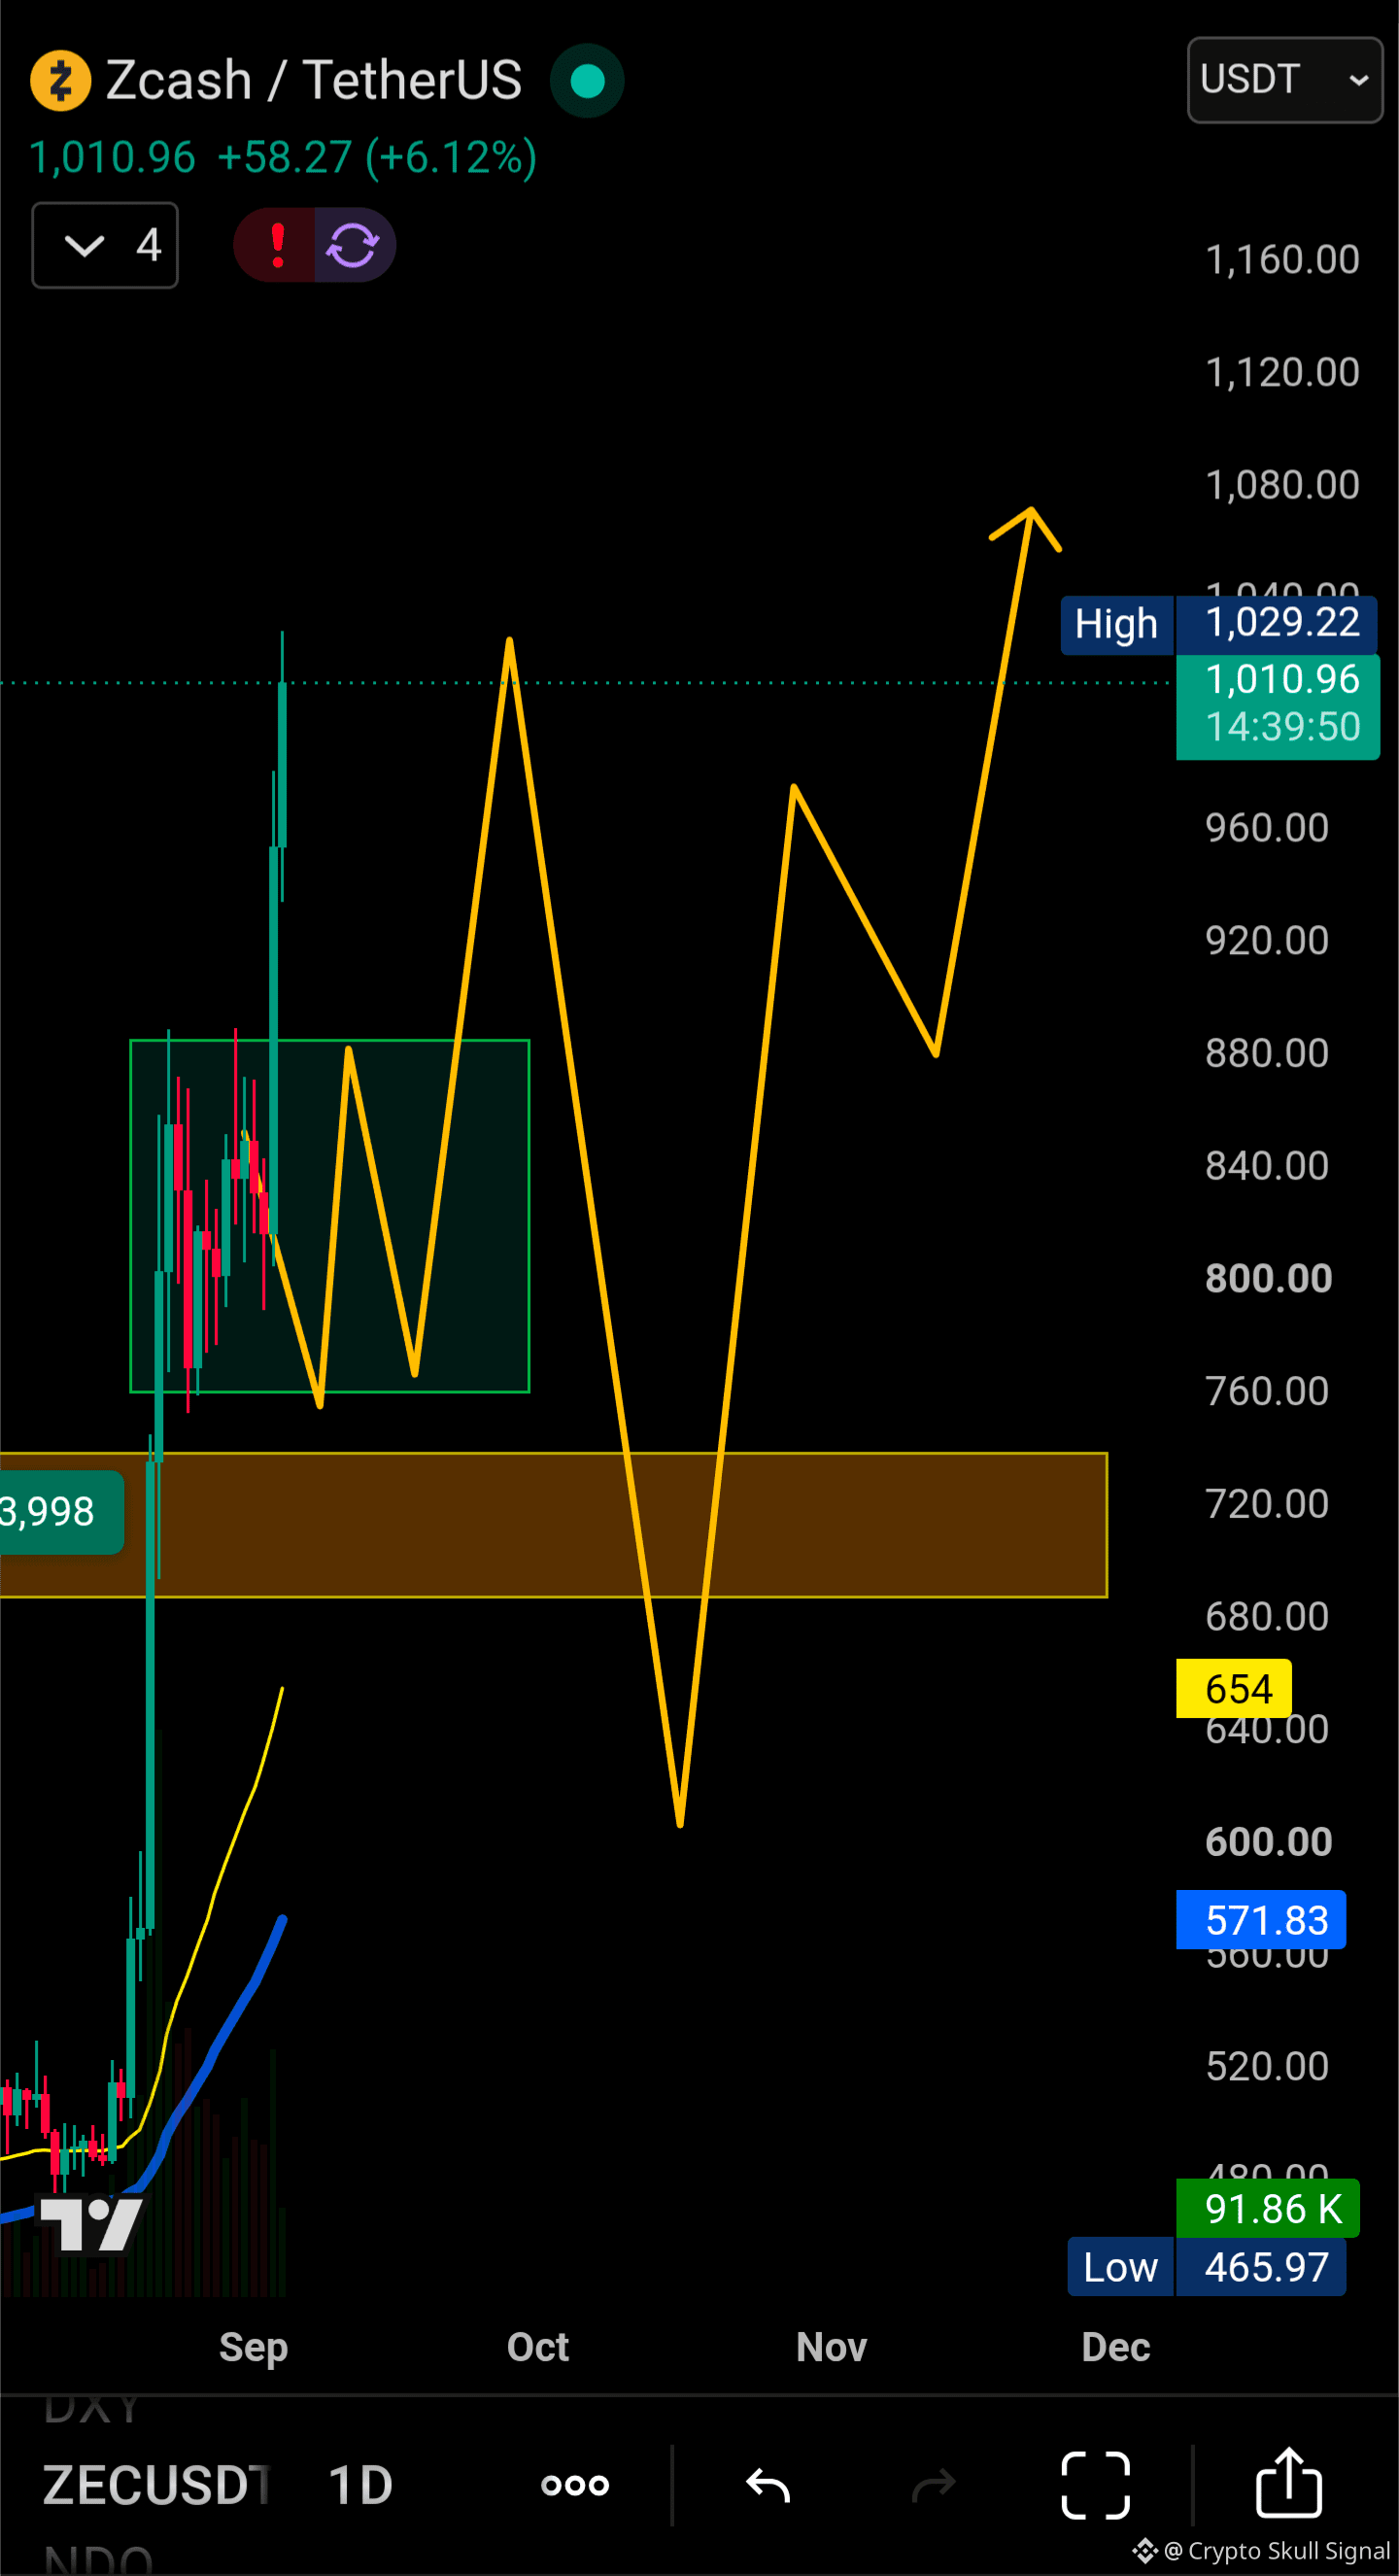
$ZEC has now hit the $1,000+ target we were expecting.
We already caught 3 successful moves on $ZEC , including the previous ~63% move, and now the breakout setup has delivered again.
The structure is still looking strong. If $ZEC continues holding above the previous breakout/support zone around $880–$737, I remain bullish and believe we can see further upside from here.
Next target: $1,150+ 🚀
Another one delivered. zec is doing exactly what we expected. 💰
$ZEC has now hit the $1,000+ target we were expecting.
We already caught 3 successful moves on $ZEC , including the previous ~63% move, and now the breakout setup has delivered again.
The structure is still looking strong. If $ZEC continues holding above the previous breakout/support zone around $880–$737, I remain bullish and believe we can see further upside from here.
Next target: $1,150+ 🚀
Another one delivered. zec is doing exactly what we expected. 💰
Crypto Skull Signal
·
--
ສັນຍານກະທິງ$ZEC BREAKOUT UPDATE 🚀
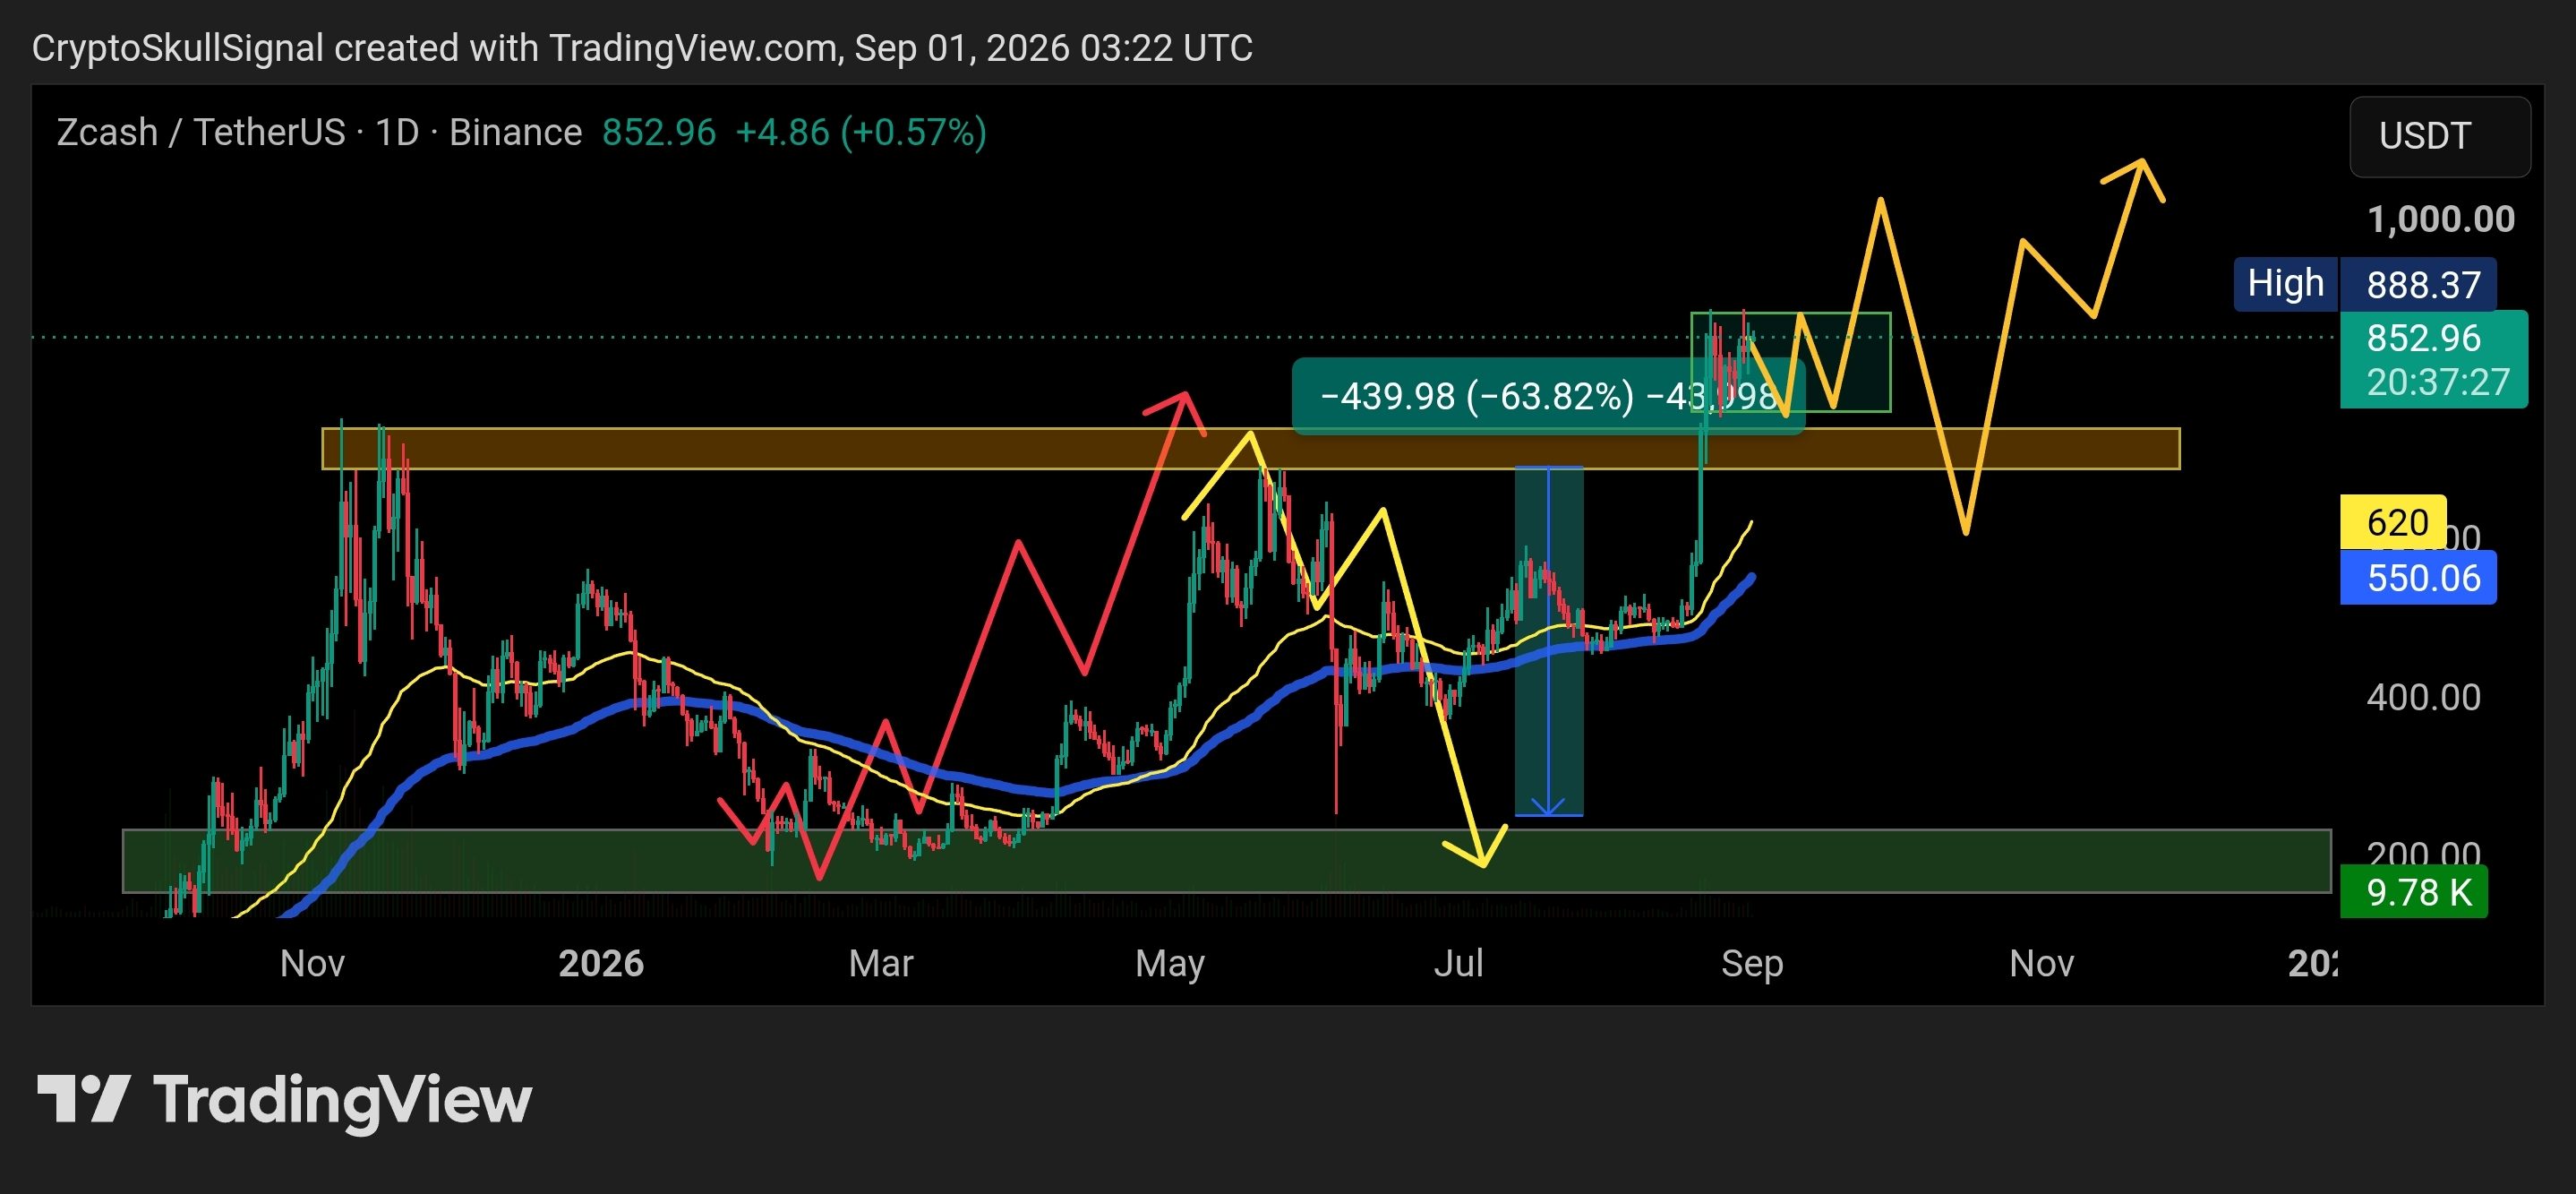
$ZEC has finally broken out of the major resistance zone, exactly as we were waiting for. The previous resistance is now turning into support.
We already caught 3 successful moves on $ZEC, including the last move of around 63% 📈
Now the key area is $688–$737. As long as $ZEC holds above this support zone, I remain bullish and believe it can easily push toward and above $1,000.
But losing this support zone would make the setup highly risky again, so this is the level I’m watching closely.
For now, breakout is confirmed, support is holding, and I’m bullish on $ZEC.
Target: $1,000+ 🚀
$ZEC has finally broken out of the major resistance zone, exactly as we were waiting for. The previous resistance is now turning into support.
We already caught 3 successful moves on $ZEC, including the last move of around 63% 📈
Now the key area is $688–$737. As long as $ZEC holds above this support zone, I remain bullish and believe it can easily push toward and above $1,000.
But losing this support zone would make the setup highly risky again, so this is the level I’m watching closely.
For now, breakout is confirmed, support is holding, and I’m bullish on $ZEC.
Target: $1,000+ 🚀
$ZEC $1000? 👀
Crypto Skull Signal
·
--
ສັນຍານກະທິງ$ZEC BREAKOUT UPDATE 🚀
$ZEC has finally broken out of the major resistance zone, exactly as we were waiting for. The previous resistance is now turning into support.
We already caught 3 successful moves on $ZEC, including the last move of around 63% 📈
Now the key area is $688–$737. As long as $ZEC holds above this support zone, I remain bullish and believe it can easily push toward and above $1,000.
But losing this support zone would make the setup highly risky again, so this is the level I’m watching closely.
For now, breakout is confirmed, support is holding, and I’m bullish on $ZEC.
Target: $1,000+ 🚀
$ZEC has finally broken out of the major resistance zone, exactly as we were waiting for. The previous resistance is now turning into support.
We already caught 3 successful moves on $ZEC, including the last move of around 63% 📈
Now the key area is $688–$737. As long as $ZEC holds above this support zone, I remain bullish and believe it can easily push toward and above $1,000.
But losing this support zone would make the setup highly risky again, so this is the level I’m watching closely.
For now, breakout is confirmed, support is holding, and I’m bullish on $ZEC.
Target: $1,000+ 🚀
$VST /USDT Take-Profit
TARGET 2 DONE ✅
Profit: 27.54% with 10x 🤑
TARGET 2 DONE ✅
Profit: 27.54% with 10x 🤑
Crypto Skull Signal
·
--
ສັນຍານໝີ$VST /USDT
🔴 SHORT 10X
📍 Entry: 145.22
🎯 Targets:
TP1: 143.77
TP2: 142.32
TP3: 139.41
TP4: 136.51
TP5: 132.15
TP6: 127.79
❌ Stop Loss: 154.36
🔴 SHORT 10X
📍 Entry: 145.22
🎯 Targets:
TP1: 143.77
TP2: 142.32
TP3: 139.41
TP4: 136.51
TP5: 132.15
TP6: 127.79
❌ Stop Loss: 154.36
$VST/USDT Take-Profit
TARGET 1 DONE ✅
Profit: 12.24% with 10x 📈
TARGET 1 DONE ✅
Profit: 12.24% with 10x 📈
Crypto Skull Signal
·
--
ສັນຍານໝີ$VST /USDT
🔴 SHORT 10X
📍 Entry: 145.22
🎯 Targets:
TP1: 143.77
TP2: 142.32
TP3: 139.41
TP4: 136.51
TP5: 132.15
TP6: 127.79
❌ Stop Loss: 154.36
🔴 SHORT 10X
📍 Entry: 145.22
🎯 Targets:
TP1: 143.77
TP2: 142.32
TP3: 139.41
TP4: 136.51
TP5: 132.15
TP6: 127.79
❌ Stop Loss: 154.36
$VST /USDT
🔴 SHORT 10X
📍 Entry: 145.22
🎯 Targets:
TP1: 143.77
TP2: 142.32
TP3: 139.41
TP4: 136.51
TP5: 132.15
TP6: 127.79
❌ Stop Loss: 154.36
🔴 SHORT 10X
📍 Entry: 145.22
🎯 Targets:
TP1: 143.77
TP2: 142.32
TP3: 139.41
TP4: 136.51
TP5: 132.15
TP6: 127.79
❌ Stop Loss: 154.36
$SOPH is finally breaking out of the long-term descending channel after months of lower highs and lower lows.
Price has pushed above the channel resistance, and the breakout is now being tested. If #SOPH holds above the breakout area and continues building strength, I’m expecting the next move toward the major EMA around $0.0050, followed by $0.0058 → $0.0065 → $0.0075+.
The key now is simple: hold the breakout. A successful retest would make this setup even stronger.
For now, I’m bullish on $SOPH and watching for continuation toward $0.007+ 🚀
Price has pushed above the channel resistance, and the breakout is now being tested. If #SOPH holds above the breakout area and continues building strength, I’m expecting the next move toward the major EMA around $0.0050, followed by $0.0058 → $0.0065 → $0.0075+.
The key now is simple: hold the breakout. A successful retest would make this setup even stronger.
For now, I’m bullish on $SOPH and watching for continuation toward $0.007+ 🚀
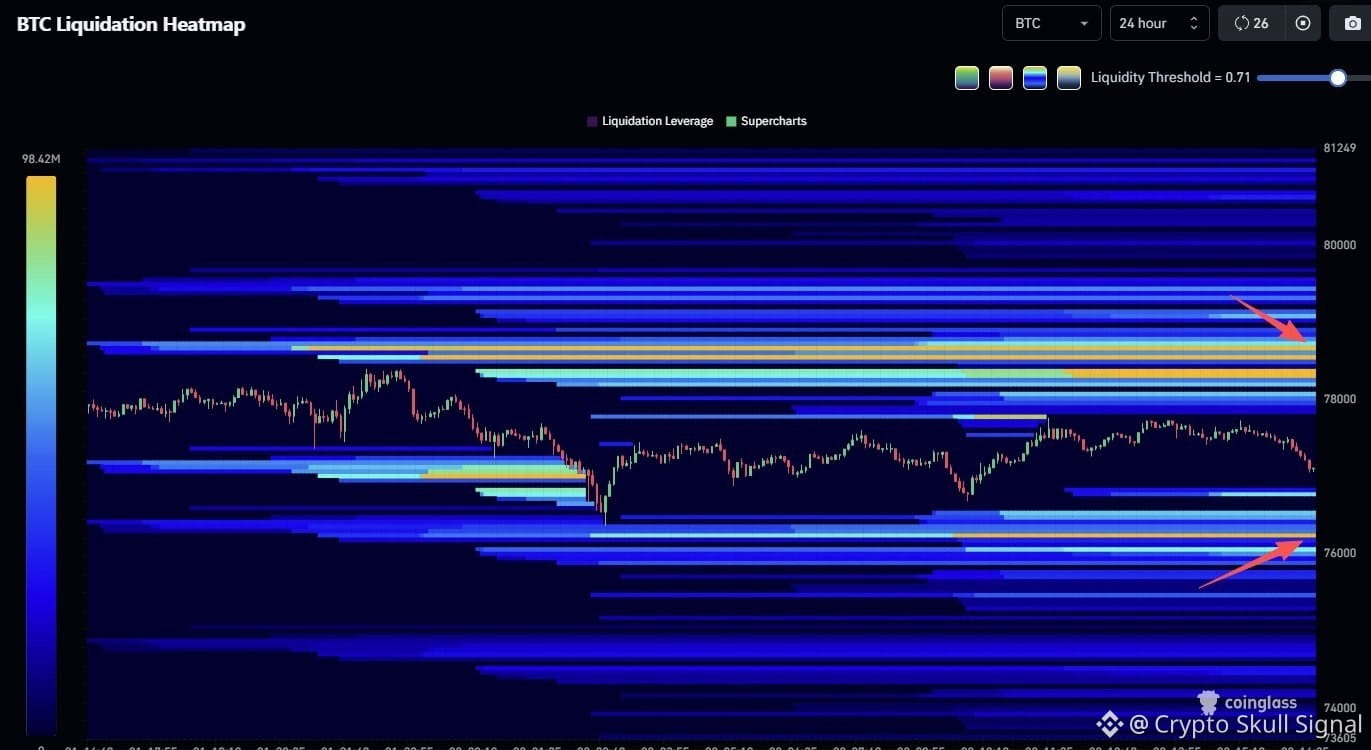
The Bitcoin liquidation heatmap shows the areas where leveraged positions are most likely to be liquidated, with ranges around $76,000 and $78,500.
$HMSTR /USDT
🟢 SPOT SIGNAL
📍 Entry: 0.000169 - 0.00011
🎯 Targets:
TP1: 0.00018
TP2: 0.00020
TP3: 0.00025
TP4: 0.00033
TP5: 0.00044
TP6: 0.00057
❌ Stop Loss: 0.00010 (Daily Close Below)
🟢 SPOT SIGNAL
📍 Entry: 0.000169 - 0.00011
🎯 Targets:
TP1: 0.00018
TP2: 0.00020
TP3: 0.00025
TP4: 0.00033
TP5: 0.00044
TP6: 0.00057
❌ Stop Loss: 0.00010 (Daily Close Below)
ເຂົ້າສູ່ລະບົບເພື່ອສຳຫຼວດເນື້ອຫາເພີ່ມເຕີມ