
CryptoFrontNews
17.5k ໂພສ

CryptoFrontNews
 Square Verified+
ລາຍງານ
ບລັອກຜູ້ໃຊ້
CryptoFrontNews (CFN) delivers the latest in cryptocurrency with real-time updates, expert analyses, and in-depth articles on digital currencies and blockchain.
4 ກໍາລັງຕິດຕາມ
12.5K+ ຜູ້ຕິດຕາມ
19.0K+ Liked
ໂພສ

ບົດຄວາມ
ເບິ່ງການແປ
Bitcoin Outlook Points to a New Altseason PhaseBitcoin’s projected path targets $200,000, while derivatives positioning remains elevated after July’s leverage reset.
Historical cycles show expanding altseason gains, with the third cycle projected at 10,200% after another correction.
Rising open interest and volume keep traders focused on leverage, price structure and the next potential market rotation.
Bitcoin outlook centers on stronger derivatives activity, a projected correction, and another possible altseason as the current cycle develops.
The Next Altseason Builds on Earlier Cycles
Crypto Zenkai believes Bitcoin will be at $200,000 in the next 6-12 months. The post also calls for Ethereum to trade above $10,000 and Solana above $1,000. It further expects altcoins and memecoins to accelerate during the projected market phase.
https://twitter.com/zenkaixbt/status/2098484855113679140?s=20
The accompanying chart compares three major altseason cycles against Bitcoin’s structure. The first cycle followed the severe Bitcoin decline around 2017. That period recorded an estimated 4,600% gain across the broader altcoin phase.
The second cycle followed another major Bitcoin low and extended recovery. Its marked altseason move reached an estimated 7,500% gain. That figure exceeded the percentage recorded during the earlier cycle.
The chart identifies the current period as the third projected altseason. Its potential move reaches approximately 10,200%, exceeding both previous cycle markers. The comparison forms the basis for the chart’s longer-term market projection.
Bitcoin Structure Points Toward Another Correction
Bitcoin has recovered substantially from earlier cycle lows shown on the chart. Price recently approached the descending white trendline marking major historical highs. The highlighted area then becomes the starting point for the projected path.
The chart projects Bitcoin moving downward from that highlighted region. That path eventually approaches the rising red trendline during 2027. The red line connects major historical bottoms across the broader market structure.
The projected decline does not mark the end of the displayed cycle. Instead, the chart places another altseason after Bitcoin reaches longer-term support. This creates a sequence involving advance, correction, accumulation and renewed expansion.
The derivatives chart adds another layer to the current market structure. Bitcoin trades near $65,000 on the displayed price scale. Meanwhile, open interest has recovered toward roughly $50 billion after July’s decline.
Open Interest Keeps Derivatives Activity Elevated
From late May, open interest expanded as Bitcoin entered a stronger price advance. Trading volume also increased, showing greater activity across the derivatives market. By early July, open interest reached approximately $70 billion to $80 billion.
Source: Coinglass
Bitcoin then declined from its early-July peak, alongside a sharp open-interest reduction. That movement indicates substantial leveraged positioning was removed during the correction. Volume remained elevated, showing continued participation despite the market pullback.
Open interest later recovered as Bitcoin stabilized following the earlier leverage flush. The latest structure therefore combines renewed positioning with a recovering Bitcoin market. Traders remain focused on whether positioning expands alongside further price advances.
The chart and Crypto Zenkai’s post present related stages within one cycle. Bitcoin remains the primary reference point for the projected broader market rotation. The third altseason projection therefore depends on another Bitcoin correction and subsequent expansion.
Bitcoin Outlook Points to a New Altseason Phase
Bitcoin’s projected path targets $200,000, while derivatives positioning remains elevated after July’s leverage reset.
Historical cycles show expanding altseason gains, with the third cycle projected at 10,200% after another correction.
Rising open interest and volume keep traders focused on leverage, price structure and the next potential market rotation.
Bitcoin outlook centers on stronger derivatives activity, a projected correction, and another possible altseason as the current cycle develops.
The Next Altseason Builds on Earlier Cycles
Crypto Zenkai believes Bitcoin will be at $200,000 in the next 6-12 months. The post also calls for Ethereum to trade above $10,000 and Solana above $1,000. It further expects altcoins and memecoins to accelerate during the projected market phase.
https://twitter.com/zenkaixbt/status/2098484855113679140?s=20
The accompanying chart compares three major altseason cycles against Bitcoin’s structure. The first cycle followed the severe Bitcoin decline around 2017. That period recorded an estimated 4,600% gain across the broader altcoin phase.
The second cycle followed another major Bitcoin low and extended recovery. Its marked altseason move reached an estimated 7,500% gain. That figure exceeded the percentage recorded during the earlier cycle.
The chart identifies the current period as the third projected altseason. Its potential move reaches approximately 10,200%, exceeding both previous cycle markers. The comparison forms the basis for the chart’s longer-term market projection.
Bitcoin Structure Points Toward Another Correction
Bitcoin has recovered substantially from earlier cycle lows shown on the chart. Price recently approached the descending white trendline marking major historical highs. The highlighted area then becomes the starting point for the projected path.
The chart projects Bitcoin moving downward from that highlighted region. That path eventually approaches the rising red trendline during 2027. The red line connects major historical bottoms across the broader market structure.
The projected decline does not mark the end of the displayed cycle. Instead, the chart places another altseason after Bitcoin reaches longer-term support. This creates a sequence involving advance, correction, accumulation and renewed expansion.
The derivatives chart adds another layer to the current market structure. Bitcoin trades near $65,000 on the displayed price scale. Meanwhile, open interest has recovered toward roughly $50 billion after July’s decline.
Open Interest Keeps Derivatives Activity Elevated
From late May, open interest expanded as Bitcoin entered a stronger price advance. Trading volume also increased, showing greater activity across the derivatives market. By early July, open interest reached approximately $70 billion to $80 billion.
Source: Coinglass
Bitcoin then declined from its early-July peak, alongside a sharp open-interest reduction. That movement indicates substantial leveraged positioning was removed during the correction. Volume remained elevated, showing continued participation despite the market pullback.
Open interest later recovered as Bitcoin stabilized following the earlier leverage flush. The latest structure therefore combines renewed positioning with a recovering Bitcoin market. Traders remain focused on whether positioning expands alongside further price advances.
The chart and Crypto Zenkai’s post present related stages within one cycle. Bitcoin remains the primary reference point for the projected broader market rotation. The third altseason projection therefore depends on another Bitcoin correction and subsequent expansion.
Historical cycles show expanding altseason gains, with the third cycle projected at 10,200% after another correction.
Rising open interest and volume keep traders focused on leverage, price structure and the next potential market rotation.
Bitcoin outlook centers on stronger derivatives activity, a projected correction, and another possible altseason as the current cycle develops.
The Next Altseason Builds on Earlier Cycles
Crypto Zenkai believes Bitcoin will be at $200,000 in the next 6-12 months. The post also calls for Ethereum to trade above $10,000 and Solana above $1,000. It further expects altcoins and memecoins to accelerate during the projected market phase.
https://twitter.com/zenkaixbt/status/2098484855113679140?s=20
The accompanying chart compares three major altseason cycles against Bitcoin’s structure. The first cycle followed the severe Bitcoin decline around 2017. That period recorded an estimated 4,600% gain across the broader altcoin phase.
The second cycle followed another major Bitcoin low and extended recovery. Its marked altseason move reached an estimated 7,500% gain. That figure exceeded the percentage recorded during the earlier cycle.
The chart identifies the current period as the third projected altseason. Its potential move reaches approximately 10,200%, exceeding both previous cycle markers. The comparison forms the basis for the chart’s longer-term market projection.
Bitcoin Structure Points Toward Another Correction
Bitcoin has recovered substantially from earlier cycle lows shown on the chart. Price recently approached the descending white trendline marking major historical highs. The highlighted area then becomes the starting point for the projected path.
The chart projects Bitcoin moving downward from that highlighted region. That path eventually approaches the rising red trendline during 2027. The red line connects major historical bottoms across the broader market structure.
The projected decline does not mark the end of the displayed cycle. Instead, the chart places another altseason after Bitcoin reaches longer-term support. This creates a sequence involving advance, correction, accumulation and renewed expansion.
The derivatives chart adds another layer to the current market structure. Bitcoin trades near $65,000 on the displayed price scale. Meanwhile, open interest has recovered toward roughly $50 billion after July’s decline.
Open Interest Keeps Derivatives Activity Elevated
From late May, open interest expanded as Bitcoin entered a stronger price advance. Trading volume also increased, showing greater activity across the derivatives market. By early July, open interest reached approximately $70 billion to $80 billion.
Source: Coinglass
Bitcoin then declined from its early-July peak, alongside a sharp open-interest reduction. That movement indicates substantial leveraged positioning was removed during the correction. Volume remained elevated, showing continued participation despite the market pullback.
Open interest later recovered as Bitcoin stabilized following the earlier leverage flush. The latest structure therefore combines renewed positioning with a recovering Bitcoin market. Traders remain focused on whether positioning expands alongside further price advances.
The chart and Crypto Zenkai’s post present related stages within one cycle. Bitcoin remains the primary reference point for the projected broader market rotation. The third altseason projection therefore depends on another Bitcoin correction and subsequent expansion.
253

ບົດຄວາມ
ເບິ່ງການແປ
Vitalik Buterin Links AI Safety to Limits on CollusionVitalik Buterin connects adversarial governance design with AI safety and limits on coordination among stronger AI agents.
Buterin says decentralization, secret ballots and privacy tools can create barriers against harmful collusion.
He cites blockchain forking, skin in the game and whistleblower incentives as defenses against coordinated attacks.
Vitalik Buterin says adversarial governance design could help address AI safety by limiting collusion among advanced AI agents. In a recent post, the Ethereum co-founder compared governance systems with AI environments involving less-sophisticated principals and stronger agents. He said limits on agent coordination could improve outcomes in both settings.
https://twitter.com/VitalikButerin/status/2099228441963012475?s=20
Buterin Compares Governance With AI Safety
Buterin described a shared structure between governance and AI safety. In governance, a static algorithm acts as the principal while humans operate as more-sophisticated agents. In AI safety, humans and weaker language models could serve as the principal.
Stronger large language models would then act as the agents. Notably, Buterin focused on how agents coordinate rather than individual actions. He said governance design can produce better outcomes when systems limit how much agents can collude.
That distinction also separates useful coordination from harmful coordination. Groups can cooperate for shared goals, but some coalitions can disadvantage people outside their group.
Collusion Creates Governance Risks
Buterin cited several examples of harmful coordination, including election vote selling and price fixing. He also pointed to miners coordinating to launch a 51% attack against a blockchain.
He said actions alone cannot always reveal whether harmful coordination occurred. A seller charging a high price, for example, could act independently or coordinate with competitors.
However, rules against collusion can target the coordination itself. Buterin also noted that vote selling can create incentives that push voting systems toward plutocracy.
He connected the issue to cooperative game theory, which examines groups acting together. Buterin said some games lack stable outcomes because coalitions can repeatedly profit by changing their strategy.
Decentralization Can Limit Harmful Coordination
Buterin identified decentralization as one method for creating barriers against large-scale collusion. He also cited secret ballots, privacy tools, whistleblower incentives and internal negotiation problems.
In blockchain systems, he said forking can support counter-coordination after a harmful coalition takes control. A competing version can remove the attacking coalition’s influence while retaining most original rules.
Buterin also highlighted “skin in the game” as another defense. He said markets can make participants individually accountable for decisions.
Finally, he listed several coordination tools, including per-person voting, physical separation and role-based constituencies. He also cited Schelling points and encouraging defectors to expose planned collusion.
Vitalik Buterin Links AI Safety to Limits on Collusion
Vitalik Buterin connects adversarial governance design with AI safety and limits on coordination among stronger AI agents.
Buterin says decentralization, secret ballots and privacy tools can create barriers against harmful collusion.
He cites blockchain forking, skin in the game and whistleblower incentives as defenses against coordinated attacks.
Vitalik Buterin says adversarial governance design could help address AI safety by limiting collusion among advanced AI agents. In a recent post, the Ethereum co-founder compared governance systems with AI environments involving less-sophisticated principals and stronger agents. He said limits on agent coordination could improve outcomes in both settings.
https://twitter.com/VitalikButerin/status/2099228441963012475?s=20
Buterin Compares Governance With AI Safety
Buterin described a shared structure between governance and AI safety. In governance, a static algorithm acts as the principal while humans operate as more-sophisticated agents. In AI safety, humans and weaker language models could serve as the principal.
Stronger large language models would then act as the agents. Notably, Buterin focused on how agents coordinate rather than individual actions. He said governance design can produce better outcomes when systems limit how much agents can collude.
That distinction also separates useful coordination from harmful coordination. Groups can cooperate for shared goals, but some coalitions can disadvantage people outside their group.
Collusion Creates Governance Risks
Buterin cited several examples of harmful coordination, including election vote selling and price fixing. He also pointed to miners coordinating to launch a 51% attack against a blockchain.
He said actions alone cannot always reveal whether harmful coordination occurred. A seller charging a high price, for example, could act independently or coordinate with competitors.
However, rules against collusion can target the coordination itself. Buterin also noted that vote selling can create incentives that push voting systems toward plutocracy.
He connected the issue to cooperative game theory, which examines groups acting together. Buterin said some games lack stable outcomes because coalitions can repeatedly profit by changing their strategy.
Decentralization Can Limit Harmful Coordination
Buterin identified decentralization as one method for creating barriers against large-scale collusion. He also cited secret ballots, privacy tools, whistleblower incentives and internal negotiation problems.
In blockchain systems, he said forking can support counter-coordination after a harmful coalition takes control. A competing version can remove the attacking coalition’s influence while retaining most original rules.
Buterin also highlighted “skin in the game” as another defense. He said markets can make participants individually accountable for decisions.
Finally, he listed several coordination tools, including per-person voting, physical separation and role-based constituencies. He also cited Schelling points and encouraging defectors to expose planned collusion.
Buterin says decentralization, secret ballots and privacy tools can create barriers against harmful collusion.
He cites blockchain forking, skin in the game and whistleblower incentives as defenses against coordinated attacks.
Vitalik Buterin says adversarial governance design could help address AI safety by limiting collusion among advanced AI agents. In a recent post, the Ethereum co-founder compared governance systems with AI environments involving less-sophisticated principals and stronger agents. He said limits on agent coordination could improve outcomes in both settings.
https://twitter.com/VitalikButerin/status/2099228441963012475?s=20
Buterin Compares Governance With AI Safety
Buterin described a shared structure between governance and AI safety. In governance, a static algorithm acts as the principal while humans operate as more-sophisticated agents. In AI safety, humans and weaker language models could serve as the principal.
Stronger large language models would then act as the agents. Notably, Buterin focused on how agents coordinate rather than individual actions. He said governance design can produce better outcomes when systems limit how much agents can collude.
That distinction also separates useful coordination from harmful coordination. Groups can cooperate for shared goals, but some coalitions can disadvantage people outside their group.
Collusion Creates Governance Risks
Buterin cited several examples of harmful coordination, including election vote selling and price fixing. He also pointed to miners coordinating to launch a 51% attack against a blockchain.
He said actions alone cannot always reveal whether harmful coordination occurred. A seller charging a high price, for example, could act independently or coordinate with competitors.
However, rules against collusion can target the coordination itself. Buterin also noted that vote selling can create incentives that push voting systems toward plutocracy.
He connected the issue to cooperative game theory, which examines groups acting together. Buterin said some games lack stable outcomes because coalitions can repeatedly profit by changing their strategy.
Decentralization Can Limit Harmful Coordination
Buterin identified decentralization as one method for creating barriers against large-scale collusion. He also cited secret ballots, privacy tools, whistleblower incentives and internal negotiation problems.
In blockchain systems, he said forking can support counter-coordination after a harmful coalition takes control. A competing version can remove the attacking coalition’s influence while retaining most original rules.
Buterin also highlighted “skin in the game” as another defense. He said markets can make participants individually accountable for decisions.
Finally, he listed several coordination tools, including per-person voting, physical separation and role-based constituencies. He also cited Schelling points and encouraging defectors to expose planned collusion.
33

ບົດຄວາມ
ເບິ່ງການແປ
Senate Republicans Release Final CLARITY Act Draft Ahead of Sept. 15 VoteThe final draft includes 126 substantive Democratic-requested changes, including new crypto ethics requirements for covered officials.
Stablecoin rewards could face temporary restrictions if community banks experience substantial deposit losses under the revised bill.
Republicans hold 53 Senate seats, requiring at least seven Democrats or independents to support cloture if all Republicans vote yes.
Senate Republicans released revised CLARITY Act text Sunday, Sept. 13, ahead of Tuesday’s cloture vote. The 635-page proposal includes changes to ethics rules, stablecoin rewards, developer protections, and digital commodity trading. Sens. Cynthia Lummis, John Boozman, and Tim Scott described the draft as their final offer to Democrats.
Trump Ethics Deal Adds New Requirements
The revised text reflects 126 substantive changes requested by Democrats, according to Lummis. President Donald Trump agreed to most of the Tillis-Gallego ethics proposal, a Republican aide said.
https://twitter.com/EleanorTerrett/status/2099317875202756650?s=20
The rules would cover the president, vice president, members of Congress, federal officials, judges, employees, and their spouses. Covered individuals would need to divest substantial crypto-related interests or place them in a qualified blind trust.
State attorneys general could enforce restrictions on prohibited digital asset activity. Violations would carry civil penalties of $500,000 or 20% of the transaction amount, whichever is greater.
However, the text does not extend the listed restrictions to other relatives, including officials’ children. The ethics rules would take effect 360 days after enactment, or sooner after final regulations.
Stablecoin Yield and BRCA Rules Narrowed
The bill would allow Treasury Secretary Scott Bessent to restrict stablecoin rewards if community banks lose deposits on a substantial scale. The authority would expire 18 months after enactment.
The draft also narrows the Blockchain Regulatory Certainty Act to Bank Secrecy Act and civil enforcement protections. It removes references to Section 1960 criminal prosecutions while extending certain protections to miners and validators.
Meanwhile, new safeguards address affiliate trading and conflicts involving digital commodity exchanges, brokers, and dealers. The text also confirms that state consumer protection laws remain applicable.
The Senate scheduled the cloture vote for Tuesday, Sept. 15, at 2:15 p.m. ET. Republicans hold 53 seats, meaning at least seven Democrats or independents must join them if all Republicans vote yes. Cloture would begin debate, while amendments, final passage, and House action would remain pending.
Senate Republicans Release Final CLARITY Act Draft Ahead of Sept. 15 Vote
The final draft includes 126 substantive Democratic-requested changes, including new crypto ethics requirements for covered officials.
Stablecoin rewards could face temporary restrictions if community banks experience substantial deposit losses under the revised bill.
Republicans hold 53 Senate seats, requiring at least seven Democrats or independents to support cloture if all Republicans vote yes.
Senate Republicans released revised CLARITY Act text Sunday, Sept. 13, ahead of Tuesday’s cloture vote. The 635-page proposal includes changes to ethics rules, stablecoin rewards, developer protections, and digital commodity trading. Sens. Cynthia Lummis, John Boozman, and Tim Scott described the draft as their final offer to Democrats.
Trump Ethics Deal Adds New Requirements
The revised text reflects 126 substantive changes requested by Democrats, according to Lummis. President Donald Trump agreed to most of the Tillis-Gallego ethics proposal, a Republican aide said.
https://twitter.com/EleanorTerrett/status/2099317875202756650?s=20
The rules would cover the president, vice president, members of Congress, federal officials, judges, employees, and their spouses. Covered individuals would need to divest substantial crypto-related interests or place them in a qualified blind trust.
State attorneys general could enforce restrictions on prohibited digital asset activity. Violations would carry civil penalties of $500,000 or 20% of the transaction amount, whichever is greater.
However, the text does not extend the listed restrictions to other relatives, including officials’ children. The ethics rules would take effect 360 days after enactment, or sooner after final regulations.
Stablecoin Yield and BRCA Rules Narrowed
The bill would allow Treasury Secretary Scott Bessent to restrict stablecoin rewards if community banks lose deposits on a substantial scale. The authority would expire 18 months after enactment.
The draft also narrows the Blockchain Regulatory Certainty Act to Bank Secrecy Act and civil enforcement protections. It removes references to Section 1960 criminal prosecutions while extending certain protections to miners and validators.
Meanwhile, new safeguards address affiliate trading and conflicts involving digital commodity exchanges, brokers, and dealers. The text also confirms that state consumer protection laws remain applicable.
The Senate scheduled the cloture vote for Tuesday, Sept. 15, at 2:15 p.m. ET. Republicans hold 53 seats, meaning at least seven Democrats or independents must join them if all Republicans vote yes. Cloture would begin debate, while amendments, final passage, and House action would remain pending.
Stablecoin rewards could face temporary restrictions if community banks experience substantial deposit losses under the revised bill.
Republicans hold 53 Senate seats, requiring at least seven Democrats or independents to support cloture if all Republicans vote yes.
Senate Republicans released revised CLARITY Act text Sunday, Sept. 13, ahead of Tuesday’s cloture vote. The 635-page proposal includes changes to ethics rules, stablecoin rewards, developer protections, and digital commodity trading. Sens. Cynthia Lummis, John Boozman, and Tim Scott described the draft as their final offer to Democrats.
Trump Ethics Deal Adds New Requirements
The revised text reflects 126 substantive changes requested by Democrats, according to Lummis. President Donald Trump agreed to most of the Tillis-Gallego ethics proposal, a Republican aide said.
https://twitter.com/EleanorTerrett/status/2099317875202756650?s=20
The rules would cover the president, vice president, members of Congress, federal officials, judges, employees, and their spouses. Covered individuals would need to divest substantial crypto-related interests or place them in a qualified blind trust.
State attorneys general could enforce restrictions on prohibited digital asset activity. Violations would carry civil penalties of $500,000 or 20% of the transaction amount, whichever is greater.
However, the text does not extend the listed restrictions to other relatives, including officials’ children. The ethics rules would take effect 360 days after enactment, or sooner after final regulations.
Stablecoin Yield and BRCA Rules Narrowed
The bill would allow Treasury Secretary Scott Bessent to restrict stablecoin rewards if community banks lose deposits on a substantial scale. The authority would expire 18 months after enactment.
The draft also narrows the Blockchain Regulatory Certainty Act to Bank Secrecy Act and civil enforcement protections. It removes references to Section 1960 criminal prosecutions while extending certain protections to miners and validators.
Meanwhile, new safeguards address affiliate trading and conflicts involving digital commodity exchanges, brokers, and dealers. The text also confirms that state consumer protection laws remain applicable.
The Senate scheduled the cloture vote for Tuesday, Sept. 15, at 2:15 p.m. ET. Republicans hold 53 seats, meaning at least seven Democrats or independents must join them if all Republicans vote yes. Cloture would begin debate, while amendments, final passage, and House action would remain pending.
152
ບົດຄວາມ
ເບິ່ງການແປ
Analysts Eye $3,000 Ethereum Target as ETH Gains 60% in Q3Ethereum gained 60.62% in Q3, recovering from $1,530-$1,550 to around $2,520 after a strong late-August rally.
Ali Charts sees a potential $3,000 target if ETH breaks its developing triangle, echoing a previous 31% breakout.
ETH remains above its 50-day and 200-day averages, while $2,460-$2,493 support and $2,585 resistance shape the outlook.
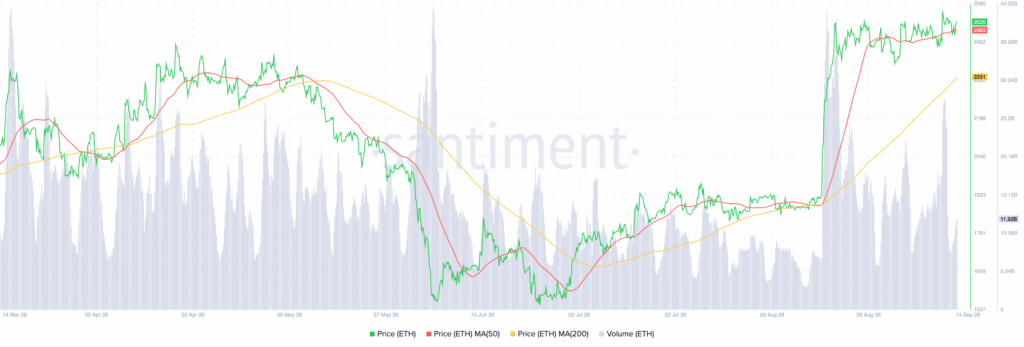
Ethereum has gained 60.62% in Q3 2026, recovering from earlier losses and trading near $2,500. Analysts Ali Charts, Crypto Patel, and Michael van de Poppe have highlighted renewed strength in ETH. Their analysis points to a possible move toward $3,000, with support levels and a developing triangle pattern shaping their outlook.
ETH Rebounds After Sharp Second-Quarter Decline
Ethereum fell from above $2,300 in April to approximately $1,530–$1,550 in late June. The cryptocurrency then recovered through July and early August, forming higher highs and higher lows.
Notably, ETH broke above a key range around Aug. 22. The price later climbed from approximately $1,900 to above $2,450 during a sharp late-August rally. Trading volume increased substantially during that move.
ETH subsequently consolidated at higher levels and now trades near $2,520. According to Crypto Patel, Ethereum reached $2,665 before settling near $2,500. Patel also noted that ETH recently outperformed Bitcoin after recording its quarterly gain.
Analysts Identify $3,000 as the Next Target
Ali Charts said Ethereum’s previous triangle breakout produced a 31% gain within three days. He added that another triangle is now forming on the ETH chart.
According to Ali Charts, a similar breakout could send Ethereum toward $3,000. His analysis focuses on the potential price movement following a break above the developing pattern.
Meanwhile, Michael van de Poppe identified a retest around $2,460 after Ethereum’s recent breakout. He said the level must hold as support for his projected move toward $3,000 to remain relevant.
Ethereum Holds Above Major Moving Averages
Ethereum’s 50-day moving average is near $2,493, while its 200-day moving average is around $2,331. The current price remains above both averages, with the 50-day average above the 200-day average. The 200-day average has also started rising.
Source: Santiment
Meanwhile, the chart places immediate resistance near $2,585, close to the upper boundary of the recent range. A sustained move above $2,493 would preserve the current bullish structure. However, a break below that level could expose Ethereum to support near $2,331.
Analysts Eye $3,000 Ethereum Target as ETH Gains 60% in Q3
Ethereum gained 60.62% in Q3, recovering from $1,530-$1,550 to around $2,520 after a strong late-August rally.
Ali Charts sees a potential $3,000 target if ETH breaks its developing triangle, echoing a previous 31% breakout.
ETH remains above its 50-day and 200-day averages, while $2,460-$2,493 support and $2,585 resistance shape the outlook.
Ethereum has gained 60.62% in Q3 2026, recovering from earlier losses and trading near $2,500. Analysts Ali Charts, Crypto Patel, and Michael van de Poppe have highlighted renewed strength in ETH. Their analysis points to a possible move toward $3,000, with support levels and a developing triangle pattern shaping their outlook.
ETH Rebounds After Sharp Second-Quarter Decline
Ethereum fell from above $2,300 in April to approximately $1,530–$1,550 in late June. The cryptocurrency then recovered through July and early August, forming higher highs and higher lows.
Notably, ETH broke above a key range around Aug. 22. The price later climbed from approximately $1,900 to above $2,450 during a sharp late-August rally. Trading volume increased substantially during that move.
ETH subsequently consolidated at higher levels and now trades near $2,520. According to Crypto Patel, Ethereum reached $2,665 before settling near $2,500. Patel also noted that ETH recently outperformed Bitcoin after recording its quarterly gain.
Analysts Identify $3,000 as the Next Target
Ali Charts said Ethereum’s previous triangle breakout produced a 31% gain within three days. He added that another triangle is now forming on the ETH chart.
According to Ali Charts, a similar breakout could send Ethereum toward $3,000. His analysis focuses on the potential price movement following a break above the developing pattern.
Meanwhile, Michael van de Poppe identified a retest around $2,460 after Ethereum’s recent breakout. He said the level must hold as support for his projected move toward $3,000 to remain relevant.
Ethereum Holds Above Major Moving Averages
Ethereum’s 50-day moving average is near $2,493, while its 200-day moving average is around $2,331. The current price remains above both averages, with the 50-day average above the 200-day average. The 200-day average has also started rising.
Source: Santiment
Meanwhile, the chart places immediate resistance near $2,585, close to the upper boundary of the recent range. A sustained move above $2,493 would preserve the current bullish structure. However, a break below that level could expose Ethereum to support near $2,331.
Ali Charts sees a potential $3,000 target if ETH breaks its developing triangle, echoing a previous 31% breakout.
ETH remains above its 50-day and 200-day averages, while $2,460-$2,493 support and $2,585 resistance shape the outlook.
Ethereum has gained 60.62% in Q3 2026, recovering from earlier losses and trading near $2,500. Analysts Ali Charts, Crypto Patel, and Michael van de Poppe have highlighted renewed strength in ETH. Their analysis points to a possible move toward $3,000, with support levels and a developing triangle pattern shaping their outlook.
ETH Rebounds After Sharp Second-Quarter Decline
Ethereum fell from above $2,300 in April to approximately $1,530–$1,550 in late June. The cryptocurrency then recovered through July and early August, forming higher highs and higher lows.
Notably, ETH broke above a key range around Aug. 22. The price later climbed from approximately $1,900 to above $2,450 during a sharp late-August rally. Trading volume increased substantially during that move.
ETH subsequently consolidated at higher levels and now trades near $2,520. According to Crypto Patel, Ethereum reached $2,665 before settling near $2,500. Patel also noted that ETH recently outperformed Bitcoin after recording its quarterly gain.
Analysts Identify $3,000 as the Next Target
Ali Charts said Ethereum’s previous triangle breakout produced a 31% gain within three days. He added that another triangle is now forming on the ETH chart.
According to Ali Charts, a similar breakout could send Ethereum toward $3,000. His analysis focuses on the potential price movement following a break above the developing pattern.
Meanwhile, Michael van de Poppe identified a retest around $2,460 after Ethereum’s recent breakout. He said the level must hold as support for his projected move toward $3,000 to remain relevant.
Ethereum Holds Above Major Moving Averages
Ethereum’s 50-day moving average is near $2,493, while its 200-day moving average is around $2,331. The current price remains above both averages, with the 50-day average above the 200-day average. The 200-day average has also started rising.
Source: Santiment
Meanwhile, the chart places immediate resistance near $2,585, close to the upper boundary of the recent range. A sustained move above $2,493 would preserve the current bullish structure. However, a break below that level could expose Ethereum to support near $2,331.
61

ບົດຄວາມ
ເບິ່ງການແປ
Altcoin Leverage Rises as Exchange Inflows Reach New HighsAltcoin open interest excluding Ethereum remains above Bitcoin’s, with Ted warning that elevated leverage could trigger widespread liquidations.
Seven-day cumulative altcoin inflow transactions have reached one of their highest levels in months, signaling rising exchange activity.
The mid- and small-cap market holds near $203B, with $205B resistance and $200B support shaping the next move.
Altcoin markets face renewed selling pressure as leverage remains elevated and more tokens move onto exchanges. Analyst Ted said altcoin open interest, excluding Ethereum, still exceeds Bitcoin’s open interest. Meanwhile, analyst Maartunn reported that seven-day cumulative inflow transactions reached one of their highest levels in months.
Altcoin Open Interest Remains Above Bitcoin
According to Ted, altcoins excluding ETH hold more open interest than Bitcoin. Ted said altcoins carry “decent leverage” and expects many positions to be wiped out within a few weeks. His comments focused on exposure held in altcoin derivatives.
However, Ted did not provide exact open interest figures or identify specific tokens facing the highest exposure. Maartunn reported that altcoins are moving onto exchanges again. He added that seven-day cumulative inflow transactions have surged to one of their highest levels in months.
However, the figures provided do not show the total value of transferred tokens or identify the exchanges involved. The inflow data appeared alongside Ted’s comments about derivatives leverage. Ted focused on open interest, while Maartunn examined exchange transactions.
https://twitter.com/JA_Maartun/status/2099119913520836960?s=20
Mid- and Small-Cap Market Cap Tests $205B
The crypto total market cap excluding the top 10 cryptocurrencies stood near $203.10 billion on the one-hour chart. Market capitalization rose above $212.5 billion around Sept. 7 and neared $214 billion again on Sept. 9. It then declined toward the $198 billion to $200 billion area before recovering.
Source: TradingView
The recovery has since flattened near $203 billion. The chart places $205 billion as immediate resistance, followed by $207.5 billion to $210 billion. Support appears at $200 billion, with stronger support near $197.5 billion to $198 billion.
The RSI stood at 55.71, above its moving average at 49.91. The MACD histogram was positive at $333.94 million, while the MACD line reached $264.72 million against a signal line at negative $69.22 million.
Altcoin Leverage Rises as Exchange Inflows Reach New Highs
Altcoin open interest excluding Ethereum remains above Bitcoin’s, with Ted warning that elevated leverage could trigger widespread liquidations.
Seven-day cumulative altcoin inflow transactions have reached one of their highest levels in months, signaling rising exchange activity.
The mid- and small-cap market holds near $203B, with $205B resistance and $200B support shaping the next move.
Altcoin markets face renewed selling pressure as leverage remains elevated and more tokens move onto exchanges. Analyst Ted said altcoin open interest, excluding Ethereum, still exceeds Bitcoin’s open interest. Meanwhile, analyst Maartunn reported that seven-day cumulative inflow transactions reached one of their highest levels in months.
Altcoin Open Interest Remains Above Bitcoin
According to Ted, altcoins excluding ETH hold more open interest than Bitcoin. Ted said altcoins carry “decent leverage” and expects many positions to be wiped out within a few weeks. His comments focused on exposure held in altcoin derivatives.
However, Ted did not provide exact open interest figures or identify specific tokens facing the highest exposure. Maartunn reported that altcoins are moving onto exchanges again. He added that seven-day cumulative inflow transactions have surged to one of their highest levels in months.
However, the figures provided do not show the total value of transferred tokens or identify the exchanges involved. The inflow data appeared alongside Ted’s comments about derivatives leverage. Ted focused on open interest, while Maartunn examined exchange transactions.
https://twitter.com/JA_Maartun/status/2099119913520836960?s=20
Mid- and Small-Cap Market Cap Tests $205B
The crypto total market cap excluding the top 10 cryptocurrencies stood near $203.10 billion on the one-hour chart. Market capitalization rose above $212.5 billion around Sept. 7 and neared $214 billion again on Sept. 9. It then declined toward the $198 billion to $200 billion area before recovering.
Source: TradingView
The recovery has since flattened near $203 billion. The chart places $205 billion as immediate resistance, followed by $207.5 billion to $210 billion. Support appears at $200 billion, with stronger support near $197.5 billion to $198 billion.
The RSI stood at 55.71, above its moving average at 49.91. The MACD histogram was positive at $333.94 million, while the MACD line reached $264.72 million against a signal line at negative $69.22 million.
Seven-day cumulative altcoin inflow transactions have reached one of their highest levels in months, signaling rising exchange activity.
The mid- and small-cap market holds near $203B, with $205B resistance and $200B support shaping the next move.
Altcoin markets face renewed selling pressure as leverage remains elevated and more tokens move onto exchanges. Analyst Ted said altcoin open interest, excluding Ethereum, still exceeds Bitcoin’s open interest. Meanwhile, analyst Maartunn reported that seven-day cumulative inflow transactions reached one of their highest levels in months.
Altcoin Open Interest Remains Above Bitcoin
According to Ted, altcoins excluding ETH hold more open interest than Bitcoin. Ted said altcoins carry “decent leverage” and expects many positions to be wiped out within a few weeks. His comments focused on exposure held in altcoin derivatives.
However, Ted did not provide exact open interest figures or identify specific tokens facing the highest exposure. Maartunn reported that altcoins are moving onto exchanges again. He added that seven-day cumulative inflow transactions have surged to one of their highest levels in months.
However, the figures provided do not show the total value of transferred tokens or identify the exchanges involved. The inflow data appeared alongside Ted’s comments about derivatives leverage. Ted focused on open interest, while Maartunn examined exchange transactions.
https://twitter.com/JA_Maartun/status/2099119913520836960?s=20
Mid- and Small-Cap Market Cap Tests $205B
The crypto total market cap excluding the top 10 cryptocurrencies stood near $203.10 billion on the one-hour chart. Market capitalization rose above $212.5 billion around Sept. 7 and neared $214 billion again on Sept. 9. It then declined toward the $198 billion to $200 billion area before recovering.
Source: TradingView
The recovery has since flattened near $203 billion. The chart places $205 billion as immediate resistance, followed by $207.5 billion to $210 billion. Support appears at $200 billion, with stronger support near $197.5 billion to $198 billion.
The RSI stood at 55.71, above its moving average at 49.91. The MACD histogram was positive at $333.94 million, while the MACD line reached $264.72 million against a signal line at negative $69.22 million.
45

ບົດຄວາມ
ເບິ່ງການແປ
Analyst Sets $88K Bitcoin Target After Weekly MA50 BreakoutDoctor Profit says Bitcoin must reclaim the weekly MA50 and break $82,500-$83,000 to open a path toward $88,000.
The analyst maintains $71,000 as his strongest support reference, while $78,500 remains unconfirmed as support.
The Fed’s September 16 decision and September 15 CLARITY Act vote add key catalysts as Bitcoin trades below $80,000.
Bitcoin’s recovery outlook remains tied to resistance near the weekly 50-day moving average, according to Doctor Profit. The analyst expects Bitcoin to target $88,000 after reclaiming that indicator and breaking the $82,500–$83,000 region. However, he also keeps $71,000 as a possible support level before the Federal Reserve’s September 16 decision.
Doctor Profit Separates Resistance From Confirmation
Doctor Profit compared Bitcoin’s current chart with its early 2023 recovery. He noted that Bitcoin made several attempts around the weekly MA50 before breaking higher. Therefore, he warned that one rejection does not automatically end the broader recovery.
He said Bitcoin must reclaim the weekly MA50 and establish strength above it. His framework places $82,500–$83,000 as the next major breakout area. A break above that range would open a path toward $88,000.
However, Doctor Profit stressed that $78,500 had broken as resistance without becoming confirmed support. He continues to identify $71,000 as his strongest support reference. A return to that level remains possible, but he said it is not guaranteed.
Crypto Developments Add to the Market Focus
Doctor Profit also discussed the CLARITY Act and its September 15 procedural hurdle. He explained that the vote concerns advancing consideration, not final approval. The bill requires 60 votes, while further negotiations could follow if it fails.
He expects President Donald Trump to sign the legislation by year-end. Meanwhile, Nasdaq announced a $100 million investment agreement with Payward, Kraken’s parent company. Circle also plans to launch Arc’s public mainnet on September 16, with BlackRock, DTCC, Visa, and Mastercard among its founding validators.
Fed Decision
The Federal Reserve’s September 15–16 FOMC meeting concludes with a decision on September 16. Market expectations cited by Doctor Profit show an 85.5% probability of a quarter-point hike and 14.5% for unchanged rates. A rate cut carries effectively zero probability.
Doctor Profit said he would prefer unchanged rates. He plans to retain spot positions and conditional long orders at $71,000. Michael van de Poppe separately said Bitcoin remains available below $80,000. He added that investors may still view such purchases favorably over the next three to five years.
Analyst Sets $88K Bitcoin Target After Weekly MA50 Breakout
Doctor Profit says Bitcoin must reclaim the weekly MA50 and break $82,500-$83,000 to open a path toward $88,000.
The analyst maintains $71,000 as his strongest support reference, while $78,500 remains unconfirmed as support.
The Fed’s September 16 decision and September 15 CLARITY Act vote add key catalysts as Bitcoin trades below $80,000.
Bitcoin’s recovery outlook remains tied to resistance near the weekly 50-day moving average, according to Doctor Profit. The analyst expects Bitcoin to target $88,000 after reclaiming that indicator and breaking the $82,500–$83,000 region. However, he also keeps $71,000 as a possible support level before the Federal Reserve’s September 16 decision.
Doctor Profit Separates Resistance From Confirmation
Doctor Profit compared Bitcoin’s current chart with its early 2023 recovery. He noted that Bitcoin made several attempts around the weekly MA50 before breaking higher. Therefore, he warned that one rejection does not automatically end the broader recovery.
He said Bitcoin must reclaim the weekly MA50 and establish strength above it. His framework places $82,500–$83,000 as the next major breakout area. A break above that range would open a path toward $88,000.
However, Doctor Profit stressed that $78,500 had broken as resistance without becoming confirmed support. He continues to identify $71,000 as his strongest support reference. A return to that level remains possible, but he said it is not guaranteed.
Crypto Developments Add to the Market Focus
Doctor Profit also discussed the CLARITY Act and its September 15 procedural hurdle. He explained that the vote concerns advancing consideration, not final approval. The bill requires 60 votes, while further negotiations could follow if it fails.
He expects President Donald Trump to sign the legislation by year-end. Meanwhile, Nasdaq announced a $100 million investment agreement with Payward, Kraken’s parent company. Circle also plans to launch Arc’s public mainnet on September 16, with BlackRock, DTCC, Visa, and Mastercard among its founding validators.
Fed Decision
The Federal Reserve’s September 15–16 FOMC meeting concludes with a decision on September 16. Market expectations cited by Doctor Profit show an 85.5% probability of a quarter-point hike and 14.5% for unchanged rates. A rate cut carries effectively zero probability.
Doctor Profit said he would prefer unchanged rates. He plans to retain spot positions and conditional long orders at $71,000. Michael van de Poppe separately said Bitcoin remains available below $80,000. He added that investors may still view such purchases favorably over the next three to five years.
The analyst maintains $71,000 as his strongest support reference, while $78,500 remains unconfirmed as support.
The Fed’s September 16 decision and September 15 CLARITY Act vote add key catalysts as Bitcoin trades below $80,000.
Bitcoin’s recovery outlook remains tied to resistance near the weekly 50-day moving average, according to Doctor Profit. The analyst expects Bitcoin to target $88,000 after reclaiming that indicator and breaking the $82,500–$83,000 region. However, he also keeps $71,000 as a possible support level before the Federal Reserve’s September 16 decision.
Doctor Profit Separates Resistance From Confirmation
Doctor Profit compared Bitcoin’s current chart with its early 2023 recovery. He noted that Bitcoin made several attempts around the weekly MA50 before breaking higher. Therefore, he warned that one rejection does not automatically end the broader recovery.
He said Bitcoin must reclaim the weekly MA50 and establish strength above it. His framework places $82,500–$83,000 as the next major breakout area. A break above that range would open a path toward $88,000.
However, Doctor Profit stressed that $78,500 had broken as resistance without becoming confirmed support. He continues to identify $71,000 as his strongest support reference. A return to that level remains possible, but he said it is not guaranteed.
Crypto Developments Add to the Market Focus
Doctor Profit also discussed the CLARITY Act and its September 15 procedural hurdle. He explained that the vote concerns advancing consideration, not final approval. The bill requires 60 votes, while further negotiations could follow if it fails.
He expects President Donald Trump to sign the legislation by year-end. Meanwhile, Nasdaq announced a $100 million investment agreement with Payward, Kraken’s parent company. Circle also plans to launch Arc’s public mainnet on September 16, with BlackRock, DTCC, Visa, and Mastercard among its founding validators.
Fed Decision
The Federal Reserve’s September 15–16 FOMC meeting concludes with a decision on September 16. Market expectations cited by Doctor Profit show an 85.5% probability of a quarter-point hike and 14.5% for unchanged rates. A rate cut carries effectively zero probability.
Doctor Profit said he would prefer unchanged rates. He plans to retain spot positions and conditional long orders at $71,000. Michael van de Poppe separately said Bitcoin remains available below $80,000. He added that investors may still view such purchases favorably over the next three to five years.
122
ບົດຄວາມ
ເບິ່ງການແປ
Analysts Eye $1 SUI Target as Price Tests Key $0.70 SupportAnalyst says SUI’s 12-hour TD Sequential has flashed a fresh buy signal as price tests the $0.70-$0.72 support zone.
SUI must reclaim $0.75, then $0.78-$0.85, while Michael van de Poppe sees a return to $0.85 as key for $1.
RSI and MACD show early improvement, but losing $0.70 could expose SUI to $0.64 and $0.60.
SUI is trading near $0.72 after retreating from $0.85, while analysts track support around $0.70. Ali Charts reported a fresh buy signal from the TD Sequential indicator. Meanwhile, Michael van de Poppe and Investor Jordan identified different price levels that could shape SUI’s next move.
Analysts Watch SUI’s Support Levels
Ali Charts said the TD Sequential has accurately identified major trend changes on SUI’s 12-hour chart. Its previous signal appeared after a 17% rally and preceded a shift in momentum. The indicator has now flashed another buy signal while SUI trades near $0.71.
However, Michael van de Poppe said SUI needs to hold its current support area after a full retest. He identified $0.85 as an important recovery level. According to van de Poppe, a return toward $0.85 could lead to prices above $1.
https://twitter.com/CryptoMichNL/status/2099224093362958748?s=20
Investor Jordan offered a more cautious view. He said SUI has lost its bullish momentum and returned to daily support near $0.70. Jordan also disclosed that he invested slightly more than $100,000 in SUI.
SUI Price Remains Below Recent Highs
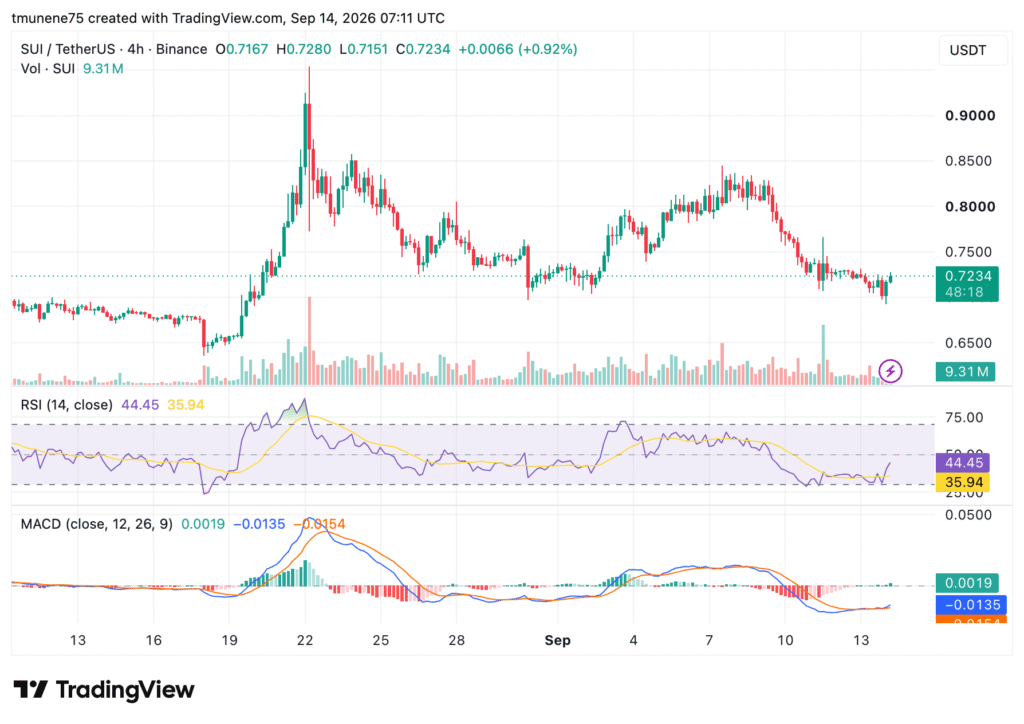
SUI currently trades at $0.7234. The latest candle opened at $0.7167, reached $0.7280, and touched $0.7151. The broader structure remains corrective after SUI rose from roughly $0.65 in late August.
The token reached approximately $0.84–$0.85 in early September before beginning a sustained decline. Price later returned toward the $0.72 region. The immediate trend remains bearish to neutral, although recent candles show attempts to stabilize.
Immediate support stands around $0.715–$0.720, followed by $0.70. A deeper decline could expose $0.68–$0.65. On the upside, SUI must first reclaim $0.75, followed by resistance around $0.78–$0.80 and $0.82–$0.85.
Momentum Indicators Show Early Improvement
The RSI is at 44.45, above its moving average at 35.94. However, it remains below the neutral 50 level. The MACD histogram is positive at 0.0019, while the MACD line is at -0.0135.
Source: TradingView
The MACD line has moved above the signal line near -0.0154. Trading volume is at 9.31 million. Jordan said losing $0.70 could expose SUI to $0.64 and $0.60. He added that he could increase his position if buyers defend the area.
Analysts Eye $1 SUI Target as Price Tests Key $0.70 Support
Analyst says SUI’s 12-hour TD Sequential has flashed a fresh buy signal as price tests the $0.70-$0.72 support zone.
SUI must reclaim $0.75, then $0.78-$0.85, while Michael van de Poppe sees a return to $0.85 as key for $1.
RSI and MACD show early improvement, but losing $0.70 could expose SUI to $0.64 and $0.60.
SUI is trading near $0.72 after retreating from $0.85, while analysts track support around $0.70. Ali Charts reported a fresh buy signal from the TD Sequential indicator. Meanwhile, Michael van de Poppe and Investor Jordan identified different price levels that could shape SUI’s next move.
Analysts Watch SUI’s Support Levels
Ali Charts said the TD Sequential has accurately identified major trend changes on SUI’s 12-hour chart. Its previous signal appeared after a 17% rally and preceded a shift in momentum. The indicator has now flashed another buy signal while SUI trades near $0.71.
However, Michael van de Poppe said SUI needs to hold its current support area after a full retest. He identified $0.85 as an important recovery level. According to van de Poppe, a return toward $0.85 could lead to prices above $1.
https://twitter.com/CryptoMichNL/status/2099224093362958748?s=20
Investor Jordan offered a more cautious view. He said SUI has lost its bullish momentum and returned to daily support near $0.70. Jordan also disclosed that he invested slightly more than $100,000 in SUI.
SUI Price Remains Below Recent Highs
SUI currently trades at $0.7234. The latest candle opened at $0.7167, reached $0.7280, and touched $0.7151. The broader structure remains corrective after SUI rose from roughly $0.65 in late August.
The token reached approximately $0.84–$0.85 in early September before beginning a sustained decline. Price later returned toward the $0.72 region. The immediate trend remains bearish to neutral, although recent candles show attempts to stabilize.
Immediate support stands around $0.715–$0.720, followed by $0.70. A deeper decline could expose $0.68–$0.65. On the upside, SUI must first reclaim $0.75, followed by resistance around $0.78–$0.80 and $0.82–$0.85.
Momentum Indicators Show Early Improvement
The RSI is at 44.45, above its moving average at 35.94. However, it remains below the neutral 50 level. The MACD histogram is positive at 0.0019, while the MACD line is at -0.0135.
Source: TradingView
The MACD line has moved above the signal line near -0.0154. Trading volume is at 9.31 million. Jordan said losing $0.70 could expose SUI to $0.64 and $0.60. He added that he could increase his position if buyers defend the area.
SUI must reclaim $0.75, then $0.78-$0.85, while Michael van de Poppe sees a return to $0.85 as key for $1.
RSI and MACD show early improvement, but losing $0.70 could expose SUI to $0.64 and $0.60.
SUI is trading near $0.72 after retreating from $0.85, while analysts track support around $0.70. Ali Charts reported a fresh buy signal from the TD Sequential indicator. Meanwhile, Michael van de Poppe and Investor Jordan identified different price levels that could shape SUI’s next move.
Analysts Watch SUI’s Support Levels
Ali Charts said the TD Sequential has accurately identified major trend changes on SUI’s 12-hour chart. Its previous signal appeared after a 17% rally and preceded a shift in momentum. The indicator has now flashed another buy signal while SUI trades near $0.71.
However, Michael van de Poppe said SUI needs to hold its current support area after a full retest. He identified $0.85 as an important recovery level. According to van de Poppe, a return toward $0.85 could lead to prices above $1.
https://twitter.com/CryptoMichNL/status/2099224093362958748?s=20
Investor Jordan offered a more cautious view. He said SUI has lost its bullish momentum and returned to daily support near $0.70. Jordan also disclosed that he invested slightly more than $100,000 in SUI.
SUI Price Remains Below Recent Highs
SUI currently trades at $0.7234. The latest candle opened at $0.7167, reached $0.7280, and touched $0.7151. The broader structure remains corrective after SUI rose from roughly $0.65 in late August.
The token reached approximately $0.84–$0.85 in early September before beginning a sustained decline. Price later returned toward the $0.72 region. The immediate trend remains bearish to neutral, although recent candles show attempts to stabilize.
Immediate support stands around $0.715–$0.720, followed by $0.70. A deeper decline could expose $0.68–$0.65. On the upside, SUI must first reclaim $0.75, followed by resistance around $0.78–$0.80 and $0.82–$0.85.
Momentum Indicators Show Early Improvement
The RSI is at 44.45, above its moving average at 35.94. However, it remains below the neutral 50 level. The MACD histogram is positive at 0.0019, while the MACD line is at -0.0135.
Source: TradingView
The MACD line has moved above the signal line near -0.0154. Trading volume is at 9.31 million. Jordan said losing $0.70 could expose SUI to $0.64 and $0.60. He added that he could increase his position if buyers defend the area.
240
ບົດຄວາມ
Bumabawi ang Presyo ng SHIB Habang Ipinagtatanggol ng mga Buyer ang Mahahalagang SupportAng presyo ng SHIB ay bumabawi matapos ang maagang kahinaan, habang ipinagtatanggol ng mga buyer ang mas mataas na antas sa pinakahuling session at naibabalik ang pataas na momentum.
Ang pagtaas ng trading volume ay kasama ng rebound, habang ang support na malapit sa $0.0000052 ay nananatiling sentro sa pinakabagong istruktura ng pagbawi ng presyo.
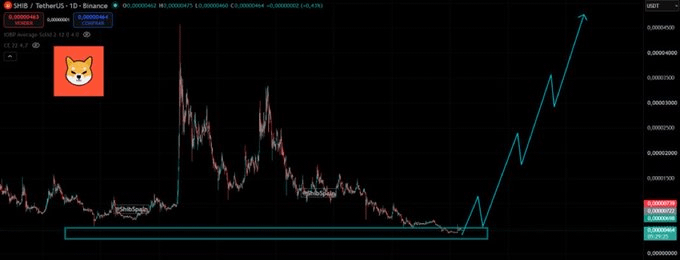
Ipinapakita ng chart na may posibleng base na nabubuo, habang ang patuloy na lakas ay nangangailangan ng tuluy-tuloy na depensa sa naka-highlight na support zone ngayon.
Ang presyo ng SHIB ay bumabawi matapos ang matagal na kahinaan, at ipinapakita ng pinakabagong chart ang mas matibay na demand, pagtaas ng aktibidad, at isang umuusbong na base malapit sa mahalagang support habang ipinagtatanggol ng mga buyer ang mas mataas na antas.
Bumabawi ang Presyo ng SHIB Habang Ipinagtatanggol ng mga Buyer ang Mahahalagang Support
Ang presyo ng SHIB ay bumabawi matapos ang maagang kahinaan, habang ipinagtatanggol ng mga buyer ang mas mataas na antas sa pinakahuling session at naibabalik ang pataas na momentum.
Ang pagtaas ng trading volume ay kasama ng rebound, habang ang support na malapit sa $0.0000052 ay nananatiling sentro sa pinakabagong istruktura ng pagbawi ng presyo.
Ipinapakita ng chart na may posibleng base na nabubuo, habang ang patuloy na lakas ay nangangailangan ng tuluy-tuloy na depensa sa naka-highlight na support zone ngayon.
Ang presyo ng SHIB ay bumabawi matapos ang matagal na kahinaan, at ipinapakita ng pinakabagong chart ang mas matibay na demand, pagtaas ng aktibidad, at isang umuusbong na base malapit sa mahalagang support habang ipinagtatanggol ng mga buyer ang mas mataas na antas.
Ang pagtaas ng trading volume ay kasama ng rebound, habang ang support na malapit sa $0.0000052 ay nananatiling sentro sa pinakabagong istruktura ng pagbawi ng presyo.
Ipinapakita ng chart na may posibleng base na nabubuo, habang ang patuloy na lakas ay nangangailangan ng tuluy-tuloy na depensa sa naka-highlight na support zone ngayon.
Ang presyo ng SHIB ay bumabawi matapos ang matagal na kahinaan, at ipinapakita ng pinakabagong chart ang mas matibay na demand, pagtaas ng aktibidad, at isang umuusbong na base malapit sa mahalagang support habang ipinagtatanggol ng mga buyer ang mas mataas na antas.
189

ບົດຄວາມ
ເບິ່ງການແປ
Thailand SEC Proposes $151K Daily Stablecoin Transfer CapThailand’s SEC proposes a 5M baht daily stablecoin transfer cap per customer and regulated operator, with wallet ownership checks.
Stablecoin deposits and withdrawals would need to use customer-owned accounts or wallets meeting Travel Rule requirements.
The SEC also proposes tighter rules for off-platform trades, liquidity providers, source exchanges and broker disclosures.
Thailand’s SEC has proposed stablecoin transfer rules in Thailand, including a 5 million baht daily cap. The rules would require regulated operators to send deposits and withdrawals through customer-owned accounts or wallets. The SEC opened public comments in September 2026 to address money laundering, cybercrime and cross-border transfer rule breaches.
https://twitter.com/WuBlockchain/status/2098948026496872954?s=20
SEC Sets Rules for Stablecoin Transfers
Stablecoins entering an operator must come from the customer’s account or wallet. Withdrawals must also go to that customer’s account or wallet. Transfers involving another person’s account or wallet would be prohibited.
Both accounts or wallets must meet Travel Rule requirements. Operators would screen customer data and check risky wallets or watchlists. Notably, each customer could transfer up to 5 million baht daily per operator. However, the cap would not apply between Thai operators using the Travel Rule.
The limit would exclude businesses using stablecoins through their own accounts. It would also exclude Bank of Thailand-supervised businesses with case-by-case approval. Market makers for stablecoin-baht pairs would qualify for exceptions.
SEC Sets Conditions for Off-Platform Trades
The SEC also proposed rules for brokers and dealers handling off-platform transactions. These transactions would require a minimum value of 3 million baht. Brokers and dealers would need to publish digital asset trading prices.
However, brokers could not conduct off-platform trades directly between clients. They could still match clients through exchanges as brokers or agents. The proposal also covers market makers and liquidity providers. Exchanges would publish their market makers and supported digital assets.
SEC Tightens Broker and Exchange Oversight
For brokers, liquidity providers could not handle stablecoin-baht transactions. They would need to operate in jurisdictions applying FATF measures and regulatory oversight. Brokers would disclose liquidity provider names and conflicts of interest.
The SEC would tighten source exchange rules. Source exchanges must face regulatory supervision and screening against money laundering and technology-related crime.
Finally, operators must provide complete information when the SEC requests it. The SEC could set correction deadlines for noncompliance. Failure could lead to orders requiring or restricting specific actions.
Thailand SEC Proposes $151K Daily Stablecoin Transfer Cap
Thailand’s SEC proposes a 5M baht daily stablecoin transfer cap per customer and regulated operator, with wallet ownership checks.
Stablecoin deposits and withdrawals would need to use customer-owned accounts or wallets meeting Travel Rule requirements.
The SEC also proposes tighter rules for off-platform trades, liquidity providers, source exchanges and broker disclosures.
Thailand’s SEC has proposed stablecoin transfer rules in Thailand, including a 5 million baht daily cap. The rules would require regulated operators to send deposits and withdrawals through customer-owned accounts or wallets. The SEC opened public comments in September 2026 to address money laundering, cybercrime and cross-border transfer rule breaches.
https://twitter.com/WuBlockchain/status/2098948026496872954?s=20
SEC Sets Rules for Stablecoin Transfers
Stablecoins entering an operator must come from the customer’s account or wallet. Withdrawals must also go to that customer’s account or wallet. Transfers involving another person’s account or wallet would be prohibited.
Both accounts or wallets must meet Travel Rule requirements. Operators would screen customer data and check risky wallets or watchlists. Notably, each customer could transfer up to 5 million baht daily per operator. However, the cap would not apply between Thai operators using the Travel Rule.
The limit would exclude businesses using stablecoins through their own accounts. It would also exclude Bank of Thailand-supervised businesses with case-by-case approval. Market makers for stablecoin-baht pairs would qualify for exceptions.
SEC Sets Conditions for Off-Platform Trades
The SEC also proposed rules for brokers and dealers handling off-platform transactions. These transactions would require a minimum value of 3 million baht. Brokers and dealers would need to publish digital asset trading prices.
However, brokers could not conduct off-platform trades directly between clients. They could still match clients through exchanges as brokers or agents. The proposal also covers market makers and liquidity providers. Exchanges would publish their market makers and supported digital assets.
SEC Tightens Broker and Exchange Oversight
For brokers, liquidity providers could not handle stablecoin-baht transactions. They would need to operate in jurisdictions applying FATF measures and regulatory oversight. Brokers would disclose liquidity provider names and conflicts of interest.
The SEC would tighten source exchange rules. Source exchanges must face regulatory supervision and screening against money laundering and technology-related crime.
Finally, operators must provide complete information when the SEC requests it. The SEC could set correction deadlines for noncompliance. Failure could lead to orders requiring or restricting specific actions.
Stablecoin deposits and withdrawals would need to use customer-owned accounts or wallets meeting Travel Rule requirements.
The SEC also proposes tighter rules for off-platform trades, liquidity providers, source exchanges and broker disclosures.
Thailand’s SEC has proposed stablecoin transfer rules in Thailand, including a 5 million baht daily cap. The rules would require regulated operators to send deposits and withdrawals through customer-owned accounts or wallets. The SEC opened public comments in September 2026 to address money laundering, cybercrime and cross-border transfer rule breaches.
https://twitter.com/WuBlockchain/status/2098948026496872954?s=20
SEC Sets Rules for Stablecoin Transfers
Stablecoins entering an operator must come from the customer’s account or wallet. Withdrawals must also go to that customer’s account or wallet. Transfers involving another person’s account or wallet would be prohibited.
Both accounts or wallets must meet Travel Rule requirements. Operators would screen customer data and check risky wallets or watchlists. Notably, each customer could transfer up to 5 million baht daily per operator. However, the cap would not apply between Thai operators using the Travel Rule.
The limit would exclude businesses using stablecoins through their own accounts. It would also exclude Bank of Thailand-supervised businesses with case-by-case approval. Market makers for stablecoin-baht pairs would qualify for exceptions.
SEC Sets Conditions for Off-Platform Trades
The SEC also proposed rules for brokers and dealers handling off-platform transactions. These transactions would require a minimum value of 3 million baht. Brokers and dealers would need to publish digital asset trading prices.
However, brokers could not conduct off-platform trades directly between clients. They could still match clients through exchanges as brokers or agents. The proposal also covers market makers and liquidity providers. Exchanges would publish their market makers and supported digital assets.
SEC Tightens Broker and Exchange Oversight
For brokers, liquidity providers could not handle stablecoin-baht transactions. They would need to operate in jurisdictions applying FATF measures and regulatory oversight. Brokers would disclose liquidity provider names and conflicts of interest.
The SEC would tighten source exchange rules. Source exchanges must face regulatory supervision and screening against money laundering and technology-related crime.
Finally, operators must provide complete information when the SEC requests it. The SEC could set correction deadlines for noncompliance. Failure could lead to orders requiring or restricting specific actions.
38
ບົດຄວາມ
Abahlaziyi Baphenya Ukuqhuma Kwe-$1.55 Kwe-XRP Njengokuthengiswa Kwe-Whale Kwehlisa Ngo-20%Ama-whale athengise noma asabalalisa kabusha cishe i-90M XRP, kanti amakheli asebenzayo nsuku zonke ehle kakhulu ngesikhathi sokulungiswa kwakamuva.
I-XRP ibambe eduze kuka-$1.35, kanti u-$1.30-$1.39 wukusekelwa okubalulekile kanye no-$1.38-$1.39 okudingekayo ukuze kuqinise ukubuyela esimeni.
Ukuvala kwesonto ngaphezulu kuka-$1.55 kungahlose u-$2 no-$3.66, kanti ukungakwazi ukuyibuyisa kungase kuveze u-$0.70-$0.95.
I-XRP isehle ngo-20% emasontweni amathathu, yehla isuka ku-$1.70 yaya ku-$1.35 njengoba ukusatshalaliswa kwama-whale nokusebenza okubuthakathaka kwenethiwekhi kuhlupha leli token. Abahlaziyi u-Ali Charts no-Crypto Patel bathole amazinga entengo abalulekile wokunyakaza okulandelayo kwe-XRP. Khonamanje, idatha yezobuchwepheshe ikhombisa ukwesekwa phakathi kuka-$1.30 no-$1.39.
Abahlaziyi Baphenya Ukuqhuma Kwe-$1.55 Kwe-XRP Njengokuthengiswa Kwe-Whale Kwehlisa Ngo-20%
Ama-whale athengise noma asabalalisa kabusha cishe i-90M XRP, kanti amakheli asebenzayo nsuku zonke ehle kakhulu ngesikhathi sokulungiswa kwakamuva.
I-XRP ibambe eduze kuka-$1.35, kanti u-$1.30-$1.39 wukusekelwa okubalulekile kanye no-$1.38-$1.39 okudingekayo ukuze kuqinise ukubuyela esimeni.
Ukuvala kwesonto ngaphezulu kuka-$1.55 kungahlose u-$2 no-$3.66, kanti ukungakwazi ukuyibuyisa kungase kuveze u-$0.70-$0.95.
I-XRP isehle ngo-20% emasontweni amathathu, yehla isuka ku-$1.70 yaya ku-$1.35 njengoba ukusatshalaliswa kwama-whale nokusebenza okubuthakathaka kwenethiwekhi kuhlupha leli token. Abahlaziyi u-Ali Charts no-Crypto Patel bathole amazinga entengo abalulekile wokunyakaza okulandelayo kwe-XRP. Khonamanje, idatha yezobuchwepheshe ikhombisa ukwesekwa phakathi kuka-$1.30 no-$1.39.
I-XRP ibambe eduze kuka-$1.35, kanti u-$1.30-$1.39 wukusekelwa okubalulekile kanye no-$1.38-$1.39 okudingekayo ukuze kuqinise ukubuyela esimeni.
Ukuvala kwesonto ngaphezulu kuka-$1.55 kungahlose u-$2 no-$3.66, kanti ukungakwazi ukuyibuyisa kungase kuveze u-$0.70-$0.95.
I-XRP isehle ngo-20% emasontweni amathathu, yehla isuka ku-$1.70 yaya ku-$1.35 njengoba ukusatshalaliswa kwama-whale nokusebenza okubuthakathaka kwenethiwekhi kuhlupha leli token. Abahlaziyi u-Ali Charts no-Crypto Patel bathole amazinga entengo abalulekile wokunyakaza okulandelayo kwe-XRP. Khonamanje, idatha yezobuchwepheshe ikhombisa ukwesekwa phakathi kuka-$1.30 no-$1.39.
1
170
ບົດຄວາມ
ເບິ່ງການແປ
Analysts Eye $110 Resistance as Solana Slips Toward Key $99 SupportCrypto Patel sees $110-$115 as key resistance, with a confirmed breakout potentially targeting $140, $200 and a new ATH.
Ella identifies $98.5-$100 as support, while acceptance above $106 could open $109-$110.5.
Mixed spot flows keep SOL’s direction uncertain, with a break below $99 potentially exposing $96 and lower levels.
Solana faces resistance near $110 after failing to hold its latest move toward $105–$106. Analysts Crypto Patel and Ella, a partner at LBank, outlined key levels for both outcomes. Meanwhile, spot-flow data from September 1 to 13 showed mixed activity as SOL slipped toward $99–$100.
Analysts Mark Resistance and Support Levels
Crypto Patel identified $110–$115 as the main resistance zone. He said a weekly close above that range, followed by a successful retest, could confirm renewed bullish momentum. He listed $140, $200, and a possible new all-time high as levels to monitor.
However, Patel also described a rejection scenario. If sellers regain control, SOL could fall toward $80–$70. A deeper decline toward $50 could become an accumulation area after the market forms a strong base. His long-term projections range from $500 to $1,000, although he stressed that these are not guaranteed outcomes.
Ella placed support between $98.5 and $100. According to her, daily acceptance above $106 would bring $109–$110.5 into focus. A daily close below $98 could expose $94.5–$96. She described the current movement as consolidation after expansion until either side confirms.
https://twitter.com/Ellaweb_3/status/2099019100265570545?s=20
SOL Price Retreats After September Rebound
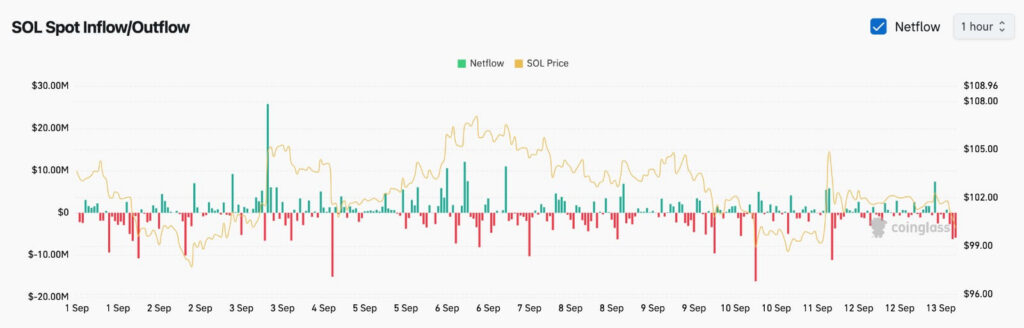
SOL started the period near $101–$103 before falling toward $97.5–$98 on September 2. The recovery strengthened around September 5 and 6, pushing SOL above $105. It then reached approximately $107–$107.5.
Source: Coinglass
The advance coincided with positive spot-flow spikes. An inflow exceeded $20 million around September 3. Other inflows ranged from $5 million to $12 million around September 6.
The price later reversed, dropping toward $101–$102 by September 8 and 9. SOL then weakened toward $99 around September 10. The chart recorded outflows near $17 million and $11 million on September 10 and 11.
Spot Flows Keep the Next Move Unclear
An inflow near $5–$6 million on September 11 briefly lifted SOL toward $104–$105. However, the rebound failed, and SOL returned toward $100–$101 before ending near $99–$100 on September 13.
Sustained inflows could support a recovery toward $102, followed by $105–$107. However, continued negative flows and a break below $99 could expose $96.
Analysts Eye $110 Resistance as Solana Slips Toward Key $99 Support
Crypto Patel sees $110-$115 as key resistance, with a confirmed breakout potentially targeting $140, $200 and a new ATH.
Ella identifies $98.5-$100 as support, while acceptance above $106 could open $109-$110.5.
Mixed spot flows keep SOL’s direction uncertain, with a break below $99 potentially exposing $96 and lower levels.
Solana faces resistance near $110 after failing to hold its latest move toward $105–$106. Analysts Crypto Patel and Ella, a partner at LBank, outlined key levels for both outcomes. Meanwhile, spot-flow data from September 1 to 13 showed mixed activity as SOL slipped toward $99–$100.
Analysts Mark Resistance and Support Levels
Crypto Patel identified $110–$115 as the main resistance zone. He said a weekly close above that range, followed by a successful retest, could confirm renewed bullish momentum. He listed $140, $200, and a possible new all-time high as levels to monitor.
However, Patel also described a rejection scenario. If sellers regain control, SOL could fall toward $80–$70. A deeper decline toward $50 could become an accumulation area after the market forms a strong base. His long-term projections range from $500 to $1,000, although he stressed that these are not guaranteed outcomes.
Ella placed support between $98.5 and $100. According to her, daily acceptance above $106 would bring $109–$110.5 into focus. A daily close below $98 could expose $94.5–$96. She described the current movement as consolidation after expansion until either side confirms.
https://twitter.com/Ellaweb_3/status/2099019100265570545?s=20
SOL Price Retreats After September Rebound
SOL started the period near $101–$103 before falling toward $97.5–$98 on September 2. The recovery strengthened around September 5 and 6, pushing SOL above $105. It then reached approximately $107–$107.5.
Source: Coinglass
The advance coincided with positive spot-flow spikes. An inflow exceeded $20 million around September 3. Other inflows ranged from $5 million to $12 million around September 6.
The price later reversed, dropping toward $101–$102 by September 8 and 9. SOL then weakened toward $99 around September 10. The chart recorded outflows near $17 million and $11 million on September 10 and 11.
Spot Flows Keep the Next Move Unclear
An inflow near $5–$6 million on September 11 briefly lifted SOL toward $104–$105. However, the rebound failed, and SOL returned toward $100–$101 before ending near $99–$100 on September 13.
Sustained inflows could support a recovery toward $102, followed by $105–$107. However, continued negative flows and a break below $99 could expose $96.
Ella identifies $98.5-$100 as support, while acceptance above $106 could open $109-$110.5.
Mixed spot flows keep SOL’s direction uncertain, with a break below $99 potentially exposing $96 and lower levels.
Solana faces resistance near $110 after failing to hold its latest move toward $105–$106. Analysts Crypto Patel and Ella, a partner at LBank, outlined key levels for both outcomes. Meanwhile, spot-flow data from September 1 to 13 showed mixed activity as SOL slipped toward $99–$100.
Analysts Mark Resistance and Support Levels
Crypto Patel identified $110–$115 as the main resistance zone. He said a weekly close above that range, followed by a successful retest, could confirm renewed bullish momentum. He listed $140, $200, and a possible new all-time high as levels to monitor.
However, Patel also described a rejection scenario. If sellers regain control, SOL could fall toward $80–$70. A deeper decline toward $50 could become an accumulation area after the market forms a strong base. His long-term projections range from $500 to $1,000, although he stressed that these are not guaranteed outcomes.
Ella placed support between $98.5 and $100. According to her, daily acceptance above $106 would bring $109–$110.5 into focus. A daily close below $98 could expose $94.5–$96. She described the current movement as consolidation after expansion until either side confirms.
https://twitter.com/Ellaweb_3/status/2099019100265570545?s=20
SOL Price Retreats After September Rebound
SOL started the period near $101–$103 before falling toward $97.5–$98 on September 2. The recovery strengthened around September 5 and 6, pushing SOL above $105. It then reached approximately $107–$107.5.
Source: Coinglass
The advance coincided with positive spot-flow spikes. An inflow exceeded $20 million around September 3. Other inflows ranged from $5 million to $12 million around September 6.
The price later reversed, dropping toward $101–$102 by September 8 and 9. SOL then weakened toward $99 around September 10. The chart recorded outflows near $17 million and $11 million on September 10 and 11.
Spot Flows Keep the Next Move Unclear
An inflow near $5–$6 million on September 11 briefly lifted SOL toward $104–$105. However, the rebound failed, and SOL returned toward $100–$101 before ending near $99–$100 on September 13.
Sustained inflows could support a recovery toward $102, followed by $105–$107. However, continued negative flows and a break below $99 could expose $96.
128

ບົດຄວາມ
ເບິ່ງການແປ
Analyst Flags Bitcoin’s $71,200 as the Next Major Buying ZoneAli Charts identifies $71,200 as a potential accumulation zone based on Bitcoin’s short-term holder cost basis.
BTC holds around $77,000, with $76,500-$77,000 support and $77,500-$78,000 resistance defining the near-term range.
RSI and MACD remain bearish, while a break below $76,500 could expose $76,000 and lower support levels.
Bitcoin’s next buying zone may sit near $71,200, according to analyst Ali Charts, who identified the level as a potential accumulation area. His view follows Bitcoin’s retreat from nearly $80,000 toward $77,000, while market data shows bearish short-term momentum and support around $76,500–$77,000.
Ali Charts Points to $71,200 Cost Basis
Ali Charts said Bitcoin’s short-term holder cost basis has offered useful buying areas during previous bull markets. He focused on the 2022–2025 period, noting that BTC repeatedly created broader buying opportunities whenever it touched or briefly dipped below that level.
The analyst addressed traders who missed Bitcoin below $60,000. He said the move toward $77,000–$80,000 could feel frustrating, but advised against chasing the current price. Instead, he highlighted a possible pullback toward the short-term holder cost basis near $71,200.
Bitcoin Faces Bearish Momentum Near $77,000
Bitcoin currently trades around $77,000. The latest candle opened at $77,129.47, reached $77,138.15, and fell to $77,000 before closing there. It recorded a 0.14% decline, while reported volume stood at zero.
Price held between $79,500 and $80,000 from September 5 to 7. Bitcoin briefly moved above $80,000 before reversing sharply. The decline later reached approximately $78,000, followed by another sell-off toward $76,500–$76,800 on September 11.
A sharp rebound then lifted BTC toward $79,800, although the move faced strong rejection. Since September 12, Bitcoin has traded mostly between $76,900 and $77,500.
Key Levels Define Bitcoin’s Next Move
Technical readings remain weak. The RSI is at 39.23, below its moving average at 45.82 and the neutral 50 level. However, it remains above the 30 oversold threshold. A move above 50 would indicate stronger buying pressure.
Source: TradingView
The MACD line is at -59.30, below the signal line at -43.10. Its histogram reads -16.20, confirming renewed downside momentum after the rebound. Support currently spans $76,500–$77,000, with stronger support near $76,000.
Resistance appears around $77,500–$78,000, followed by $79,000 and $79,800. A sustained move above $78,000 could support recovery, while a break below $76,500 could expose $76,000 and lower levels.
Analyst Flags Bitcoin’s $71,200 as the Next Major Buying Zone
Ali Charts identifies $71,200 as a potential accumulation zone based on Bitcoin’s short-term holder cost basis.
BTC holds around $77,000, with $76,500-$77,000 support and $77,500-$78,000 resistance defining the near-term range.
RSI and MACD remain bearish, while a break below $76,500 could expose $76,000 and lower support levels.
Bitcoin’s next buying zone may sit near $71,200, according to analyst Ali Charts, who identified the level as a potential accumulation area. His view follows Bitcoin’s retreat from nearly $80,000 toward $77,000, while market data shows bearish short-term momentum and support around $76,500–$77,000.
Ali Charts Points to $71,200 Cost Basis
Ali Charts said Bitcoin’s short-term holder cost basis has offered useful buying areas during previous bull markets. He focused on the 2022–2025 period, noting that BTC repeatedly created broader buying opportunities whenever it touched or briefly dipped below that level.
The analyst addressed traders who missed Bitcoin below $60,000. He said the move toward $77,000–$80,000 could feel frustrating, but advised against chasing the current price. Instead, he highlighted a possible pullback toward the short-term holder cost basis near $71,200.
Bitcoin Faces Bearish Momentum Near $77,000
Bitcoin currently trades around $77,000. The latest candle opened at $77,129.47, reached $77,138.15, and fell to $77,000 before closing there. It recorded a 0.14% decline, while reported volume stood at zero.
Price held between $79,500 and $80,000 from September 5 to 7. Bitcoin briefly moved above $80,000 before reversing sharply. The decline later reached approximately $78,000, followed by another sell-off toward $76,500–$76,800 on September 11.
A sharp rebound then lifted BTC toward $79,800, although the move faced strong rejection. Since September 12, Bitcoin has traded mostly between $76,900 and $77,500.
Key Levels Define Bitcoin’s Next Move
Technical readings remain weak. The RSI is at 39.23, below its moving average at 45.82 and the neutral 50 level. However, it remains above the 30 oversold threshold. A move above 50 would indicate stronger buying pressure.
Source: TradingView
The MACD line is at -59.30, below the signal line at -43.10. Its histogram reads -16.20, confirming renewed downside momentum after the rebound. Support currently spans $76,500–$77,000, with stronger support near $76,000.
Resistance appears around $77,500–$78,000, followed by $79,000 and $79,800. A sustained move above $78,000 could support recovery, while a break below $76,500 could expose $76,000 and lower levels.
BTC holds around $77,000, with $76,500-$77,000 support and $77,500-$78,000 resistance defining the near-term range.
RSI and MACD remain bearish, while a break below $76,500 could expose $76,000 and lower support levels.
Bitcoin’s next buying zone may sit near $71,200, according to analyst Ali Charts, who identified the level as a potential accumulation area. His view follows Bitcoin’s retreat from nearly $80,000 toward $77,000, while market data shows bearish short-term momentum and support around $76,500–$77,000.
Ali Charts Points to $71,200 Cost Basis
Ali Charts said Bitcoin’s short-term holder cost basis has offered useful buying areas during previous bull markets. He focused on the 2022–2025 period, noting that BTC repeatedly created broader buying opportunities whenever it touched or briefly dipped below that level.
The analyst addressed traders who missed Bitcoin below $60,000. He said the move toward $77,000–$80,000 could feel frustrating, but advised against chasing the current price. Instead, he highlighted a possible pullback toward the short-term holder cost basis near $71,200.
Bitcoin Faces Bearish Momentum Near $77,000
Bitcoin currently trades around $77,000. The latest candle opened at $77,129.47, reached $77,138.15, and fell to $77,000 before closing there. It recorded a 0.14% decline, while reported volume stood at zero.
Price held between $79,500 and $80,000 from September 5 to 7. Bitcoin briefly moved above $80,000 before reversing sharply. The decline later reached approximately $78,000, followed by another sell-off toward $76,500–$76,800 on September 11.
A sharp rebound then lifted BTC toward $79,800, although the move faced strong rejection. Since September 12, Bitcoin has traded mostly between $76,900 and $77,500.
Key Levels Define Bitcoin’s Next Move
Technical readings remain weak. The RSI is at 39.23, below its moving average at 45.82 and the neutral 50 level. However, it remains above the 30 oversold threshold. A move above 50 would indicate stronger buying pressure.
Source: TradingView
The MACD line is at -59.30, below the signal line at -43.10. Its histogram reads -16.20, confirming renewed downside momentum after the rebound. Support currently spans $76,500–$77,000, with stronger support near $76,000.
Resistance appears around $77,500–$78,000, followed by $79,000 and $79,800. A sustained move above $78,000 could support recovery, while a break below $76,500 could expose $76,000 and lower levels.
154

ບົດຄວາມ
ເບິ່ງການແປ
CLARITY Act Faces September 15 Vote as Bipartisan Support Remains ElusiveThe bill needs 60 votes to advance, but no Democratic senator has publicly backed it ahead of the September 15 vote.
The revised 630-page bill includes 114 Democratic-requested provisions, but disputed ethics rules remain largely unchanged.
Polymarket and Kalshi put the bill’s year-end passage odds near 20%, leaving its legislative future uncertain.
The U.S. Senate will hold a procedural vote on the CLARITY Act on September 15, as White House adviser Patrick Witt and Treasury Secretary Scott Bessent urge bipartisan support. The bill needs 60 votes to advance, but no Democratic senator has publicly backed it. Its latest version includes 114 Democratic-requested amendments, while ethics rules remain disputed.
https://twitter.com/WuBlockchain/status/2098800838751748349?s=20
CLARITY Act Faces September 15 Senate Test
Witt, executive director of the White House Digital Asset Advisory Council, warned that a failed motion-to-proceed vote could close the legislative window. He told Semafor that the outcome would not satisfy either party and questioned when lawmakers could reconsider it.
Bessent separately urged senators to approve the procedural motion. He warned that failure would weaken U.S. leadership in digital assets. The bill would establish digital asset rules and divide oversight between the SEC and CFTC. At least six Democratic votes are needed because Republicans hold 53 Senate seats.
Revised Bill Retains Disputed Ethics Provisions
Sen. Cynthia Lummis published a revised 630-page version after incorporating more than 114 provisions requested by Democrats. The text includes rules for non-decentralized finance protocols.
Protocols whose functions, operations, or rules can materially change through one person or coordinated group would face registration requirements. The bill directs the CFTC and Treasury to develop rules for those protocols.
It also asks regulators to assess securities, commodities, and anti-money laundering requirements. However, the revised text leaves major ethics provisions largely unchanged. Democratic lawmakers have identified those provisions as a central obstacle. The Justice Department would retain primary authority for enforcing conflict-of-interest rules.
Passage Odds Remain Low Ahead of Vote
Politico reported that the revised bill still lacks public Democratic support. Prediction platforms Polymarket and Kalshi place the chances of passage before year-end near 20%. The legislation passed the House in July after its introduction in May 2025.
If the Senate rejects the procedural motion, lawmakers could revisit the bill during the lame-duck session or under a future Congress. Witt and Bessent have urged lawmakers to continue negotiations before September 15. The vote remains the bill’s immediate test.
CLARITY Act Faces September 15 Vote as Bipartisan Support Remains Elusive
The bill needs 60 votes to advance, but no Democratic senator has publicly backed it ahead of the September 15 vote.
The revised 630-page bill includes 114 Democratic-requested provisions, but disputed ethics rules remain largely unchanged.
Polymarket and Kalshi put the bill’s year-end passage odds near 20%, leaving its legislative future uncertain.
The U.S. Senate will hold a procedural vote on the CLARITY Act on September 15, as White House adviser Patrick Witt and Treasury Secretary Scott Bessent urge bipartisan support. The bill needs 60 votes to advance, but no Democratic senator has publicly backed it. Its latest version includes 114 Democratic-requested amendments, while ethics rules remain disputed.
https://twitter.com/WuBlockchain/status/2098800838751748349?s=20
CLARITY Act Faces September 15 Senate Test
Witt, executive director of the White House Digital Asset Advisory Council, warned that a failed motion-to-proceed vote could close the legislative window. He told Semafor that the outcome would not satisfy either party and questioned when lawmakers could reconsider it.
Bessent separately urged senators to approve the procedural motion. He warned that failure would weaken U.S. leadership in digital assets. The bill would establish digital asset rules and divide oversight between the SEC and CFTC. At least six Democratic votes are needed because Republicans hold 53 Senate seats.
Revised Bill Retains Disputed Ethics Provisions
Sen. Cynthia Lummis published a revised 630-page version after incorporating more than 114 provisions requested by Democrats. The text includes rules for non-decentralized finance protocols.
Protocols whose functions, operations, or rules can materially change through one person or coordinated group would face registration requirements. The bill directs the CFTC and Treasury to develop rules for those protocols.
It also asks regulators to assess securities, commodities, and anti-money laundering requirements. However, the revised text leaves major ethics provisions largely unchanged. Democratic lawmakers have identified those provisions as a central obstacle. The Justice Department would retain primary authority for enforcing conflict-of-interest rules.
Passage Odds Remain Low Ahead of Vote
Politico reported that the revised bill still lacks public Democratic support. Prediction platforms Polymarket and Kalshi place the chances of passage before year-end near 20%. The legislation passed the House in July after its introduction in May 2025.
If the Senate rejects the procedural motion, lawmakers could revisit the bill during the lame-duck session or under a future Congress. Witt and Bessent have urged lawmakers to continue negotiations before September 15. The vote remains the bill’s immediate test.
The revised 630-page bill includes 114 Democratic-requested provisions, but disputed ethics rules remain largely unchanged.
Polymarket and Kalshi put the bill’s year-end passage odds near 20%, leaving its legislative future uncertain.
The U.S. Senate will hold a procedural vote on the CLARITY Act on September 15, as White House adviser Patrick Witt and Treasury Secretary Scott Bessent urge bipartisan support. The bill needs 60 votes to advance, but no Democratic senator has publicly backed it. Its latest version includes 114 Democratic-requested amendments, while ethics rules remain disputed.
https://twitter.com/WuBlockchain/status/2098800838751748349?s=20
CLARITY Act Faces September 15 Senate Test
Witt, executive director of the White House Digital Asset Advisory Council, warned that a failed motion-to-proceed vote could close the legislative window. He told Semafor that the outcome would not satisfy either party and questioned when lawmakers could reconsider it.
Bessent separately urged senators to approve the procedural motion. He warned that failure would weaken U.S. leadership in digital assets. The bill would establish digital asset rules and divide oversight between the SEC and CFTC. At least six Democratic votes are needed because Republicans hold 53 Senate seats.
Revised Bill Retains Disputed Ethics Provisions
Sen. Cynthia Lummis published a revised 630-page version after incorporating more than 114 provisions requested by Democrats. The text includes rules for non-decentralized finance protocols.
Protocols whose functions, operations, or rules can materially change through one person or coordinated group would face registration requirements. The bill directs the CFTC and Treasury to develop rules for those protocols.
It also asks regulators to assess securities, commodities, and anti-money laundering requirements. However, the revised text leaves major ethics provisions largely unchanged. Democratic lawmakers have identified those provisions as a central obstacle. The Justice Department would retain primary authority for enforcing conflict-of-interest rules.
Passage Odds Remain Low Ahead of Vote
Politico reported that the revised bill still lacks public Democratic support. Prediction platforms Polymarket and Kalshi place the chances of passage before year-end near 20%. The legislation passed the House in July after its introduction in May 2025.
If the Senate rejects the procedural motion, lawmakers could revisit the bill during the lame-duck session or under a future Congress. Witt and Bessent have urged lawmakers to continue negotiations before September 15. The vote remains the bill’s immediate test.
179
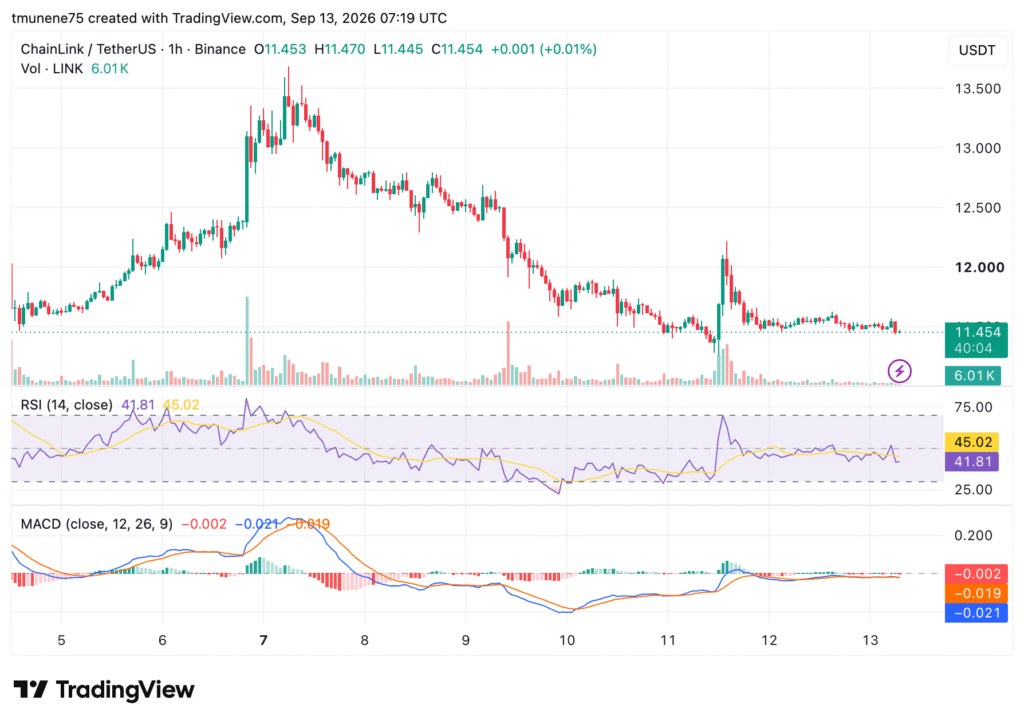
ບົດຄວາມ
Ama-Chainlink Whales Aqoqe u-$120M Njengoba I-LINK Ihlola UsekeloAma-whale aqoqe i-10.36M LINK ebiza cishe u-$120M ngemva kokulungiswa okungu-17% kusuka ku-$13.68 kuya ku-$11.29.
I-LINK igcina eduze kuka-$11.50, kanti u-$11.40 kuya ku-$11.50 kuwusekelo olusheshayo, ngaphezu kwalokho i-RSI ne-MACD kubonisa umfutho ongemuhle.
UMichael van de Poppe ubona u-$10 njengendawo engaba khona yokuthenga, kanti ukunyuka ngaphezu kuka-$11.80 kungase kuhloswe ku-$15.
I-whale ze-Chainlink ziqoqe cishe i-10.36 million LINK okulingana no-$120 million ngemva kokuba ithokheni yehle ngo-17% isuka ku-$13.68 yaya ku-$11.29. Umhlaziyi u-Ali Charts ubike ukuthenga okwenziwa phakathi namahora angama-96, kanti uMichael van de Poppe wachaza amazinga okungena angase asondele ku-$10 nangaphezulu kuka-$11.80. I-LINK isalokhu isendaweni yokuhlangana emincane.
Ama-Chainlink Whales Aqoqe u-$120M Njengoba I-LINK Ihlola Usekelo
Ama-whale aqoqe i-10.36M LINK ebiza cishe u-$120M ngemva kokulungiswa okungu-17% kusuka ku-$13.68 kuya ku-$11.29.
I-LINK igcina eduze kuka-$11.50, kanti u-$11.40 kuya ku-$11.50 kuwusekelo olusheshayo, ngaphezu kwalokho i-RSI ne-MACD kubonisa umfutho ongemuhle.
UMichael van de Poppe ubona u-$10 njengendawo engaba khona yokuthenga, kanti ukunyuka ngaphezu kuka-$11.80 kungase kuhloswe ku-$15.
I-whale ze-Chainlink ziqoqe cishe i-10.36 million LINK okulingana no-$120 million ngemva kokuba ithokheni yehle ngo-17% isuka ku-$13.68 yaya ku-$11.29. Umhlaziyi u-Ali Charts ubike ukuthenga okwenziwa phakathi namahora angama-96, kanti uMichael van de Poppe wachaza amazinga okungena angase asondele ku-$10 nangaphezulu kuka-$11.80. I-LINK isalokhu isendaweni yokuhlangana emincane.
I-LINK igcina eduze kuka-$11.50, kanti u-$11.40 kuya ku-$11.50 kuwusekelo olusheshayo, ngaphezu kwalokho i-RSI ne-MACD kubonisa umfutho ongemuhle.
UMichael van de Poppe ubona u-$10 njengendawo engaba khona yokuthenga, kanti ukunyuka ngaphezu kuka-$11.80 kungase kuhloswe ku-$15.
I-whale ze-Chainlink ziqoqe cishe i-10.36 million LINK okulingana no-$120 million ngemva kokuba ithokheni yehle ngo-17% isuka ku-$13.68 yaya ku-$11.29. Umhlaziyi u-Ali Charts ubike ukuthenga okwenziwa phakathi namahora angama-96, kanti uMichael van de Poppe wachaza amazinga okungena angase asondele ku-$10 nangaphezulu kuka-$11.80. I-LINK isalokhu isendaweni yokuhlangana emincane.
289
ບົດຄວາມ
ເບິ່ງການແປ
XRP Market Activity Faces Fresh Selling PressureXRP rallies to $1.32 before resuming the selling trend, while rebounds are not strong enough to drive the price higher in the recent session.
Trading volume remains below earlier peaks, showing quieter participation after several major XRP price expansions during the year.
Institutional payment discussions continue around XRP, while current charts show weakening momentum and increased short-term selling pressure.
XRP market activity is facing renewed pressure as recent rebounds weaken, while payment infrastructure discussions keep attention focused on broader digital settlement developments.
Payment Debate Adds Fresh Attention
Amelie’s post cites comments questioning SWIFT’s future role in global financial transfers. The post presents XRP as a potential blockchain-based alternative for modern settlement infrastructure. It also references ongoing attention around the XRP Ledger ecosystem.
https://twitter.com/_Crypto_Barbie/status/2098106335971684530?s=20
The discussion centers on faster transfers and reduced reliance on traditional settlement layers. Blockchain networks can move value directly across distributed infrastructure. XRP remains connected to this conversation through its payment-focused design.
However, the supplied material does not establish SWIFT replacement agreements. It instead presents a broader debate about financial infrastructure modernization. XRP therefore remains part of an emerging discussion rather than confirmed replacement activity.
The BANX Network announcement adds tokenization to that broader infrastructure narrative. Its Crypto Expo Dubai panel focuses on major real-world asset developments. The event brings payment, blockchain, and tokenization discussions into the same setting.
XRP and SWIFT Show Different Paths
The comparison chart places XRP and SWIFT against the same percentage scale. XRP appears as the blue line, while SWIFT is shown in orange. The chart tracks their movements across the displayed period.
Source: Coinmarketcap
XRP begins near the zero-percent reference before moving progressively lower. Several recoveries interrupt the decline, but none establishes sustained upward momentum. The latest move pushes XRP toward the -4% area on the chart.
The comparison provides context for the broader payment-system discussion. SWIFT represents established financial messaging infrastructure, while XRP represents blockchain-based settlement. The chart therefore places both names within a wider infrastructure comparison.
Meanwhile, XRP's current market data shows continued short-term weakness. It trades around $1.32, and has been losing about 3.63% per day. The chart does not make a statement that XRP will replace SWIFT, it simply illustrates the current comparison.
Volume Tracks Earlier Market Expansions
The volume chart shows substantial activity during major price movements. One of the most prominent increases was around the end of November, almost $80 billion. In that time, XRP rallied from about $1.50 up to $2.50.
Another period of heavy participation emerged around January. XRP moved above $3 while several large volume bars appeared. Trading activity remained elevated as prices fluctuated through higher ranges.
Activity increased again around late June and early July. XRP briefly approached $3.50 during that advance. However, volume later declined as price moved toward lower levels.
By August and September, trading activity had become considerably quieter.During that time, XRP was more likely to be trading in the $1.20-$1.50 range. The current chart therefore shows reduced participation after earlier market expansions.
The supplied information also separates infrastructure developments from price behavior. Payment discussions continue while the market chart shows short-term weakness. Meanwhile, historical volume patterns connect stronger participation with sharper price movements.
At present, XRP remains under pressure despite continued attention around blockchain payments. The available data does not confirm a trend reversal or renewed breakout. Instead, price action and volume point toward a market still working through weaker momentum.
XRP Market Activity Faces Fresh Selling Pressure
XRP rallies to $1.32 before resuming the selling trend, while rebounds are not strong enough to drive the price higher in the recent session.
Trading volume remains below earlier peaks, showing quieter participation after several major XRP price expansions during the year.
Institutional payment discussions continue around XRP, while current charts show weakening momentum and increased short-term selling pressure.
XRP market activity is facing renewed pressure as recent rebounds weaken, while payment infrastructure discussions keep attention focused on broader digital settlement developments.
Payment Debate Adds Fresh Attention
Amelie’s post cites comments questioning SWIFT’s future role in global financial transfers. The post presents XRP as a potential blockchain-based alternative for modern settlement infrastructure. It also references ongoing attention around the XRP Ledger ecosystem.
https://twitter.com/_Crypto_Barbie/status/2098106335971684530?s=20
The discussion centers on faster transfers and reduced reliance on traditional settlement layers. Blockchain networks can move value directly across distributed infrastructure. XRP remains connected to this conversation through its payment-focused design.
However, the supplied material does not establish SWIFT replacement agreements. It instead presents a broader debate about financial infrastructure modernization. XRP therefore remains part of an emerging discussion rather than confirmed replacement activity.
The BANX Network announcement adds tokenization to that broader infrastructure narrative. Its Crypto Expo Dubai panel focuses on major real-world asset developments. The event brings payment, blockchain, and tokenization discussions into the same setting.
XRP and SWIFT Show Different Paths
The comparison chart places XRP and SWIFT against the same percentage scale. XRP appears as the blue line, while SWIFT is shown in orange. The chart tracks their movements across the displayed period.
Source: Coinmarketcap
XRP begins near the zero-percent reference before moving progressively lower. Several recoveries interrupt the decline, but none establishes sustained upward momentum. The latest move pushes XRP toward the -4% area on the chart.
The comparison provides context for the broader payment-system discussion. SWIFT represents established financial messaging infrastructure, while XRP represents blockchain-based settlement. The chart therefore places both names within a wider infrastructure comparison.
Meanwhile, XRP's current market data shows continued short-term weakness. It trades around $1.32, and has been losing about 3.63% per day. The chart does not make a statement that XRP will replace SWIFT, it simply illustrates the current comparison.
Volume Tracks Earlier Market Expansions
The volume chart shows substantial activity during major price movements. One of the most prominent increases was around the end of November, almost $80 billion. In that time, XRP rallied from about $1.50 up to $2.50.
Another period of heavy participation emerged around January. XRP moved above $3 while several large volume bars appeared. Trading activity remained elevated as prices fluctuated through higher ranges.
Activity increased again around late June and early July. XRP briefly approached $3.50 during that advance. However, volume later declined as price moved toward lower levels.
By August and September, trading activity had become considerably quieter.During that time, XRP was more likely to be trading in the $1.20-$1.50 range. The current chart therefore shows reduced participation after earlier market expansions.
The supplied information also separates infrastructure developments from price behavior. Payment discussions continue while the market chart shows short-term weakness. Meanwhile, historical volume patterns connect stronger participation with sharper price movements.
At present, XRP remains under pressure despite continued attention around blockchain payments. The available data does not confirm a trend reversal or renewed breakout. Instead, price action and volume point toward a market still working through weaker momentum.
Trading volume remains below earlier peaks, showing quieter participation after several major XRP price expansions during the year.
Institutional payment discussions continue around XRP, while current charts show weakening momentum and increased short-term selling pressure.
XRP market activity is facing renewed pressure as recent rebounds weaken, while payment infrastructure discussions keep attention focused on broader digital settlement developments.
Payment Debate Adds Fresh Attention
Amelie’s post cites comments questioning SWIFT’s future role in global financial transfers. The post presents XRP as a potential blockchain-based alternative for modern settlement infrastructure. It also references ongoing attention around the XRP Ledger ecosystem.
https://twitter.com/_Crypto_Barbie/status/2098106335971684530?s=20
The discussion centers on faster transfers and reduced reliance on traditional settlement layers. Blockchain networks can move value directly across distributed infrastructure. XRP remains connected to this conversation through its payment-focused design.
However, the supplied material does not establish SWIFT replacement agreements. It instead presents a broader debate about financial infrastructure modernization. XRP therefore remains part of an emerging discussion rather than confirmed replacement activity.
The BANX Network announcement adds tokenization to that broader infrastructure narrative. Its Crypto Expo Dubai panel focuses on major real-world asset developments. The event brings payment, blockchain, and tokenization discussions into the same setting.
XRP and SWIFT Show Different Paths
The comparison chart places XRP and SWIFT against the same percentage scale. XRP appears as the blue line, while SWIFT is shown in orange. The chart tracks their movements across the displayed period.
Source: Coinmarketcap
XRP begins near the zero-percent reference before moving progressively lower. Several recoveries interrupt the decline, but none establishes sustained upward momentum. The latest move pushes XRP toward the -4% area on the chart.
The comparison provides context for the broader payment-system discussion. SWIFT represents established financial messaging infrastructure, while XRP represents blockchain-based settlement. The chart therefore places both names within a wider infrastructure comparison.
Meanwhile, XRP's current market data shows continued short-term weakness. It trades around $1.32, and has been losing about 3.63% per day. The chart does not make a statement that XRP will replace SWIFT, it simply illustrates the current comparison.
Volume Tracks Earlier Market Expansions
The volume chart shows substantial activity during major price movements. One of the most prominent increases was around the end of November, almost $80 billion. In that time, XRP rallied from about $1.50 up to $2.50.
Another period of heavy participation emerged around January. XRP moved above $3 while several large volume bars appeared. Trading activity remained elevated as prices fluctuated through higher ranges.
Activity increased again around late June and early July. XRP briefly approached $3.50 during that advance. However, volume later declined as price moved toward lower levels.
By August and September, trading activity had become considerably quieter.During that time, XRP was more likely to be trading in the $1.20-$1.50 range. The current chart therefore shows reduced participation after earlier market expansions.
The supplied information also separates infrastructure developments from price behavior. Payment discussions continue while the market chart shows short-term weakness. Meanwhile, historical volume patterns connect stronger participation with sharper price movements.
At present, XRP remains under pressure despite continued attention around blockchain payments. The available data does not confirm a trend reversal or renewed breakout. Instead, price action and volume point toward a market still working through weaker momentum.
175

ບົດຄວາມ
Ama-Meme Coins Azokuqhuma: Ingabe Intengo ye-Stage 3 ka-Apeing engu-$0.0004 Ingaba Ithuba Elilandelayo Elikhulu Al...Ukufuna ama-meme coins azokuqhuma sekuyashisa njengoba i-Shiba Inu igcina abatshalizimali begxile emisebenzini emisha yokushisa, kanti i-Baby Doge Coin iyaqhubeka iheha ukunakwa kulabo abasemphakathini wama-meme coins. Amagama asevele esaziwa asaqhuba ingxoxo, kodwa ithuba elilandelayo lingase lakheke kusenesikhathi kumjikelezo, lapho iphrojekthi ingakha khona umfutho ngaphambi kokufinyelela imakethe ebanzi.
Nangani lapho u-Apeing ($APEING) engena khona emfanekisweni. I-presale yayo IYAPHILA ku-Stage 3, ngentengo yamanje engu-$0.0004 kanye no-59.66% wesabelo sezigidi ezi-300 zamathokheni esivele sesithengisiwe. Ngesigaba esilandelayo esiya ku-$0.0005, leliwindi lamanje linikeza u-Apeing ukulandisa okusobala kusenesikhathi njengoba i-presale iqhubekela phambili ibheke enanini elishiwo lokufakwa kuhlu elingu-$0.01.
Ama-Meme Coins Azokuqhuma: Ingabe Intengo ye-Stage 3 ka-Apeing engu-$0.0004 Ingaba Ithuba Elilandelayo Elikhulu Al...
Ukufuna ama-meme coins azokuqhuma sekuyashisa njengoba i-Shiba Inu igcina abatshalizimali begxile emisebenzini emisha yokushisa, kanti i-Baby Doge Coin iyaqhubeka iheha ukunakwa kulabo abasemphakathini wama-meme coins. Amagama asevele esaziwa asaqhuba ingxoxo, kodwa ithuba elilandelayo lingase lakheke kusenesikhathi kumjikelezo, lapho iphrojekthi ingakha khona umfutho ngaphambi kokufinyelela imakethe ebanzi.
Nangani lapho u-Apeing ($APEING) engena khona emfanekisweni. I-presale yayo IYAPHILA ku-Stage 3, ngentengo yamanje engu-$0.0004 kanye no-59.66% wesabelo sezigidi ezi-300 zamathokheni esivele sesithengisiwe. Ngesigaba esilandelayo esiya ku-$0.0005, leliwindi lamanje linikeza u-Apeing ukulandisa okusobala kusenesikhathi njengoba i-presale iqhubekela phambili ibheke enanini elishiwo lokufakwa kuhlu elingu-$0.01.
Nangani lapho u-Apeing ($APEING) engena khona emfanekisweni. I-presale yayo IYAPHILA ku-Stage 3, ngentengo yamanje engu-$0.0004 kanye no-59.66% wesabelo sezigidi ezi-300 zamathokheni esivele sesithengisiwe. Ngesigaba esilandelayo esiya ku-$0.0005, leliwindi lamanje linikeza u-Apeing ukulandisa okusobala kusenesikhathi njengoba i-presale iqhubekela phambili ibheke enanini elishiwo lokufakwa kuhlu elingu-$0.01.
322

ບົດຄວາມ
ເບິ່ງການແປ
SHIB Price Holds Inside Tightening Daily StructureSHIB remains inside a tightening formation, with rising support meeting descending resistance near the current trading range today.
Price action has slowed near $0.00000506, while narrowing Bollinger Bands show reduced volatility across recent trading sessions overall.
MACD momentum has weakened, leaving the next break above resistance or below support as the key chart development ahead for SHIB now.
SHIB price is consolidating within a narrowing daily structure, as rising support and falling resistance keep direction unresolved.
Community Attention Returns as SHIB Consolidates
Whales Care described SHIB as waking up through slower market movements. The post also pointed to continued community strength around the token.It presented the current activity as progressive and not indicative of a significant move.
https://twitter.com/WhalesCare/status/2098255904135389211?s=20
After some consolidation in the daily time frame, SHIB is closing in on $0.00000506 on the chart. Price had previously fallen from $0.00000650-$0.00000430. Selling pressure subsided after buyers built a wider base.
Source: Tradingview
The chart shows that recovery began around July, after the price approached $0.00000410. Since then, several higher lows have developed along rising support. That sequence contrasts with the descending resistance formed after the August recovery.
Recent candles remain beneath the upper trendline extending from the August high. Sellers have appeared repeatedly near that declining boundary. Meanwhile, buyers have continued defending the rising lower boundary.
Bollinger Bands Show Volatility Compression
The tightening structure is supported by the Bollinger Band Width indicator. Its latest reading stands near 13.08 after reaching substantially higher levels earlier. The decline indicates that daily price volatility has contracted considerably.
That contraction follows the sharp price expansion seen during August. Price briefly moved toward approximately $0.00000620 before retreating into the current structure. Since then, daily movements have become progressively more contained.
The current SHIB price remains positioned between the two converging trendlines. The upper boundary provides immediate resistance for any recovery attempt. The lower boundary remains the nearest structural support for continued consolidation.
A sustained move above descending resistance would change the present formation. Such a move would indicate that buyers have overcome the structure containing recent rebounds. Conversely, losing rising support would place earlier consolidation lows back into focus.
MACD Keeps Directional Confirmation Pending
The MACD currently provides weaker momentum than during the previous recovery phase. The latest histogram is slightly negative on the displayed chart. The MACD line has also moved below its signal line.
That shift follows the stronger positive momentum recorded during August. The earlier move produced expanding green histogram bars alongside a sharp price advance. Recent readings instead show momentum fading as price consolidates.
The broader chart therefore presents a market awaiting a clearer directional signal. Rising support continues protecting the recent higher-low sequence. At the same time, descending resistance keeps upside attempts contained.
The Whales Care message fits this quieter technical phase. Its reference to slow moves matches the reduced volatility visible across the chart. For now, the next major signal remains a confirmed break from the tightening structure.
SHIB Price Holds Inside Tightening Daily Structure
SHIB remains inside a tightening formation, with rising support meeting descending resistance near the current trading range today.
Price action has slowed near $0.00000506, while narrowing Bollinger Bands show reduced volatility across recent trading sessions overall.
MACD momentum has weakened, leaving the next break above resistance or below support as the key chart development ahead for SHIB now.
SHIB price is consolidating within a narrowing daily structure, as rising support and falling resistance keep direction unresolved.
Community Attention Returns as SHIB Consolidates
Whales Care described SHIB as waking up through slower market movements. The post also pointed to continued community strength around the token.It presented the current activity as progressive and not indicative of a significant move.
https://twitter.com/WhalesCare/status/2098255904135389211?s=20
After some consolidation in the daily time frame, SHIB is closing in on $0.00000506 on the chart. Price had previously fallen from $0.00000650-$0.00000430. Selling pressure subsided after buyers built a wider base.
Source: Tradingview
The chart shows that recovery began around July, after the price approached $0.00000410. Since then, several higher lows have developed along rising support. That sequence contrasts with the descending resistance formed after the August recovery.
Recent candles remain beneath the upper trendline extending from the August high. Sellers have appeared repeatedly near that declining boundary. Meanwhile, buyers have continued defending the rising lower boundary.
Bollinger Bands Show Volatility Compression
The tightening structure is supported by the Bollinger Band Width indicator. Its latest reading stands near 13.08 after reaching substantially higher levels earlier. The decline indicates that daily price volatility has contracted considerably.
That contraction follows the sharp price expansion seen during August. Price briefly moved toward approximately $0.00000620 before retreating into the current structure. Since then, daily movements have become progressively more contained.
The current SHIB price remains positioned between the two converging trendlines. The upper boundary provides immediate resistance for any recovery attempt. The lower boundary remains the nearest structural support for continued consolidation.
A sustained move above descending resistance would change the present formation. Such a move would indicate that buyers have overcome the structure containing recent rebounds. Conversely, losing rising support would place earlier consolidation lows back into focus.
MACD Keeps Directional Confirmation Pending
The MACD currently provides weaker momentum than during the previous recovery phase. The latest histogram is slightly negative on the displayed chart. The MACD line has also moved below its signal line.
That shift follows the stronger positive momentum recorded during August. The earlier move produced expanding green histogram bars alongside a sharp price advance. Recent readings instead show momentum fading as price consolidates.
The broader chart therefore presents a market awaiting a clearer directional signal. Rising support continues protecting the recent higher-low sequence. At the same time, descending resistance keeps upside attempts contained.
The Whales Care message fits this quieter technical phase. Its reference to slow moves matches the reduced volatility visible across the chart. For now, the next major signal remains a confirmed break from the tightening structure.
Price action has slowed near $0.00000506, while narrowing Bollinger Bands show reduced volatility across recent trading sessions overall.
MACD momentum has weakened, leaving the next break above resistance or below support as the key chart development ahead for SHIB now.
SHIB price is consolidating within a narrowing daily structure, as rising support and falling resistance keep direction unresolved.
Community Attention Returns as SHIB Consolidates
Whales Care described SHIB as waking up through slower market movements. The post also pointed to continued community strength around the token.It presented the current activity as progressive and not indicative of a significant move.
https://twitter.com/WhalesCare/status/2098255904135389211?s=20
After some consolidation in the daily time frame, SHIB is closing in on $0.00000506 on the chart. Price had previously fallen from $0.00000650-$0.00000430. Selling pressure subsided after buyers built a wider base.
Source: Tradingview
The chart shows that recovery began around July, after the price approached $0.00000410. Since then, several higher lows have developed along rising support. That sequence contrasts with the descending resistance formed after the August recovery.
Recent candles remain beneath the upper trendline extending from the August high. Sellers have appeared repeatedly near that declining boundary. Meanwhile, buyers have continued defending the rising lower boundary.
Bollinger Bands Show Volatility Compression
The tightening structure is supported by the Bollinger Band Width indicator. Its latest reading stands near 13.08 after reaching substantially higher levels earlier. The decline indicates that daily price volatility has contracted considerably.
That contraction follows the sharp price expansion seen during August. Price briefly moved toward approximately $0.00000620 before retreating into the current structure. Since then, daily movements have become progressively more contained.
The current SHIB price remains positioned between the two converging trendlines. The upper boundary provides immediate resistance for any recovery attempt. The lower boundary remains the nearest structural support for continued consolidation.
A sustained move above descending resistance would change the present formation. Such a move would indicate that buyers have overcome the structure containing recent rebounds. Conversely, losing rising support would place earlier consolidation lows back into focus.
MACD Keeps Directional Confirmation Pending
The MACD currently provides weaker momentum than during the previous recovery phase. The latest histogram is slightly negative on the displayed chart. The MACD line has also moved below its signal line.
That shift follows the stronger positive momentum recorded during August. The earlier move produced expanding green histogram bars alongside a sharp price advance. Recent readings instead show momentum fading as price consolidates.
The broader chart therefore presents a market awaiting a clearer directional signal. Rising support continues protecting the recent higher-low sequence. At the same time, descending resistance keeps upside attempts contained.
The Whales Care message fits this quieter technical phase. Its reference to slow moves matches the reduced volatility visible across the chart. For now, the next major signal remains a confirmed break from the tightening structure.
1
236
ບົດຄວາມ
ເບິ່ງການແປ
Italy’s Second-Largest Bank UniCredit Weighs Crypto Custody as Banks Expand ServicesUniCredit is evaluating digital asset infrastructure for custody, trading, tokenized investments, fixed income and stablecoin services.
European banks including BBVA, Santander, Cecabank and Deutsche Bank are expanding their crypto custody and trading offerings.
Bank of Italy tests found stablecoin transfers fast and inexpensive, but fiat conversion and local payment costs remain key limitations.
Italy’s second-largest bank, UniCredit SpA, is considering crypto custody and brokerage services, according to Bloomberg. The Milan-based lender is selecting a technology provider for digital asset infrastructure, although discussions remain preliminary. Potential offerings include tokenized investments, fixed-income securities, stablecoin services, and customer access to cryptocurrency markets.
UniCredit Reviews Digital Asset Infrastructure
People familiar with the plans told Bloomberg that UniCredit is assessing technology for holding digital assets and supporting their purchase and sale. They requested anonymity because the discussions remain private.
However, the bank has not finalized its products or services. A UniCredit spokesperson declined to comment on the reported plans. The review follows several earlier digital asset initiatives.
Last year, UniCredit offered professional clients a structured product linked to BlackRock’s iShares Bitcoin Trust exchange-traded fund. The bank also issued Italy’s first tokenized minibond on a public blockchain late last year. Tokenization allows traditional assets to be issued and transferred through blockchain networks.
European Banks Increase Crypto Services
UniCredit is also part of Qivalis, a group of 37 lenders from 15 European countries. The company aims to issue a euro-denominated stablecoin. This week, UniCredit announced a minority investment in German lending markets platform VC Trade. The move is intended to expand its digital capital markets capabilities.
Meanwhile, other European banks have introduced crypto-related services. Spain’s BBVA has rolled out bitcoin trading and custody through its app, while Santander’s Openbank launched its own trading service.
Cecabank began offering crypto custody in June through a partnership with Bit2Me. In Germany, Deutsche Bank is developing custody services using technology from Bitpanda’s technology arm.
Bank of Italy Tests Stablecoin Transfers
The Bank of Italy examined stablecoin remittances in a research paper published in July. Researchers tested 200 USDC transfers across 10 corridors connecting Italy with Argentina, Brazil, South Africa, the United Arab Emirates, and Japan.
The tests used Binance, Kraken, Ripio, Foxbit, BitOasis, and Valr. Transactions took place on March 24 and 26, 2026, mainly through Ethereum. The study found that blockchain transfers were relatively fast and inexpensive.
However, fiat conversion costs and local payment systems largely determined the total cost and speed. The Bank of Italy concluded that stablecoins did not consistently provide cheaper or faster cross-border remittances than existing payment services.
Italy’s Second-Largest Bank UniCredit Weighs Crypto Custody as Banks Expand Services
UniCredit is evaluating digital asset infrastructure for custody, trading, tokenized investments, fixed income and stablecoin services.
European banks including BBVA, Santander, Cecabank and Deutsche Bank are expanding their crypto custody and trading offerings.
Bank of Italy tests found stablecoin transfers fast and inexpensive, but fiat conversion and local payment costs remain key limitations.
Italy’s second-largest bank, UniCredit SpA, is considering crypto custody and brokerage services, according to Bloomberg. The Milan-based lender is selecting a technology provider for digital asset infrastructure, although discussions remain preliminary. Potential offerings include tokenized investments, fixed-income securities, stablecoin services, and customer access to cryptocurrency markets.
UniCredit Reviews Digital Asset Infrastructure
People familiar with the plans told Bloomberg that UniCredit is assessing technology for holding digital assets and supporting their purchase and sale. They requested anonymity because the discussions remain private.
However, the bank has not finalized its products or services. A UniCredit spokesperson declined to comment on the reported plans. The review follows several earlier digital asset initiatives.
Last year, UniCredit offered professional clients a structured product linked to BlackRock’s iShares Bitcoin Trust exchange-traded fund. The bank also issued Italy’s first tokenized minibond on a public blockchain late last year. Tokenization allows traditional assets to be issued and transferred through blockchain networks.
European Banks Increase Crypto Services
UniCredit is also part of Qivalis, a group of 37 lenders from 15 European countries. The company aims to issue a euro-denominated stablecoin. This week, UniCredit announced a minority investment in German lending markets platform VC Trade. The move is intended to expand its digital capital markets capabilities.
Meanwhile, other European banks have introduced crypto-related services. Spain’s BBVA has rolled out bitcoin trading and custody through its app, while Santander’s Openbank launched its own trading service.
Cecabank began offering crypto custody in June through a partnership with Bit2Me. In Germany, Deutsche Bank is developing custody services using technology from Bitpanda’s technology arm.
Bank of Italy Tests Stablecoin Transfers
The Bank of Italy examined stablecoin remittances in a research paper published in July. Researchers tested 200 USDC transfers across 10 corridors connecting Italy with Argentina, Brazil, South Africa, the United Arab Emirates, and Japan.
The tests used Binance, Kraken, Ripio, Foxbit, BitOasis, and Valr. Transactions took place on March 24 and 26, 2026, mainly through Ethereum. The study found that blockchain transfers were relatively fast and inexpensive.
However, fiat conversion costs and local payment systems largely determined the total cost and speed. The Bank of Italy concluded that stablecoins did not consistently provide cheaper or faster cross-border remittances than existing payment services.
European banks including BBVA, Santander, Cecabank and Deutsche Bank are expanding their crypto custody and trading offerings.
Bank of Italy tests found stablecoin transfers fast and inexpensive, but fiat conversion and local payment costs remain key limitations.
Italy’s second-largest bank, UniCredit SpA, is considering crypto custody and brokerage services, according to Bloomberg. The Milan-based lender is selecting a technology provider for digital asset infrastructure, although discussions remain preliminary. Potential offerings include tokenized investments, fixed-income securities, stablecoin services, and customer access to cryptocurrency markets.
UniCredit Reviews Digital Asset Infrastructure
People familiar with the plans told Bloomberg that UniCredit is assessing technology for holding digital assets and supporting their purchase and sale. They requested anonymity because the discussions remain private.
However, the bank has not finalized its products or services. A UniCredit spokesperson declined to comment on the reported plans. The review follows several earlier digital asset initiatives.
Last year, UniCredit offered professional clients a structured product linked to BlackRock’s iShares Bitcoin Trust exchange-traded fund. The bank also issued Italy’s first tokenized minibond on a public blockchain late last year. Tokenization allows traditional assets to be issued and transferred through blockchain networks.
European Banks Increase Crypto Services
UniCredit is also part of Qivalis, a group of 37 lenders from 15 European countries. The company aims to issue a euro-denominated stablecoin. This week, UniCredit announced a minority investment in German lending markets platform VC Trade. The move is intended to expand its digital capital markets capabilities.
Meanwhile, other European banks have introduced crypto-related services. Spain’s BBVA has rolled out bitcoin trading and custody through its app, while Santander’s Openbank launched its own trading service.
Cecabank began offering crypto custody in June through a partnership with Bit2Me. In Germany, Deutsche Bank is developing custody services using technology from Bitpanda’s technology arm.
Bank of Italy Tests Stablecoin Transfers
The Bank of Italy examined stablecoin remittances in a research paper published in July. Researchers tested 200 USDC transfers across 10 corridors connecting Italy with Argentina, Brazil, South Africa, the United Arab Emirates, and Japan.
The tests used Binance, Kraken, Ripio, Foxbit, BitOasis, and Valr. Transactions took place on March 24 and 26, 2026, mainly through Ethereum. The study found that blockchain transfers were relatively fast and inexpensive.
However, fiat conversion costs and local payment systems largely determined the total cost and speed. The Bank of Italy concluded that stablecoins did not consistently provide cheaper or faster cross-border remittances than existing payment services.
30

ບົດຄວາມ
ເບິ່ງການແປ
Coinbase CEO and Grayscale Research Head See Crypto Rules Beyond CLARITY ActThe CLARITY Act faces a September 15 Senate cloture vote and needs 60 votes, requiring Democratic support to advance.
Grayscale points to the GENIUS Act, SEC proposals and CFTC initiatives as signs of regulatory progress beyond CLARITY.
Coinbase’s spot trading revenue has weakened, prompting expansion into stocks, commodities, FX and international markets.
Coinbase CEO Brian Armstrong and Grayscale Research Head Zach Pandl said U.S. crypto regulation could advance without the CLARITY Act. The bill faces a Senate cloture vote on September 15 and needs 60 votes to proceed. Armstrong expects clarity through legislation or agency rules, while Pandl cited progress across several crypto markets.
CLARITY Act Faces Senate Vote
The CLARITY Act seeks to divide digital asset oversight between the Securities and Exchange Commission and Commodity Futures Trading Commission. Republicans hold 53 Senate seats, making Democratic support necessary to reach the 60-vote threshold.
Armstrong told CNBC’s Squawk Box Asia that the legislation appeared close to securing enough support. However, lawmakers continued negotiating ethics provisions and other outstanding issues.
The bill passed the House in July after its introduction in May 2025. According to Pandl, prediction markets assign a low probability to enactment during 2026.
Agencies Advance Separate Crypto Rules
Pandl said regulatory direction has improved beyond the CLARITY Act. He pointed to the GENIUS Act, which established a federal framework for payment stablecoins.
He also cited the SEC’s proposed Regulation Crypto Assets, which could create clearer routes for token fundraising. A potential innovation exemption could allow certain securities activities to move onto blockchains.
Meanwhile, proposed transfer-agent rules could let blockchains serve as official ownership records for issuers. The CFTC has also opened regulated U.S. pathways for perpetual futures through Kalshi and Coinbase.
Pandl said lawmakers could revisit CLARITY during the lame-duck session or under a future Congress. He added that the bill remains important for establishing lasting SEC and CFTC authority.
Coinbase Expands Beyond Spot Trading
Armstrong said Coinbase’s spot trading activity has declined over the past year. Trading contributes about half of the company’s revenue, while other income comes from stablecoins and institutional custody.
The exchange has expanded into stocks, commodities, and foreign exchange. It also established hubs in the United Arab Emirates and Singapore. Coinbase reported $1.2 billion in second-quarter revenue, down from $1.5 billion a year earlier.
The company recorded a $359.5 million net loss, compared with a $1.43 billion profit. Armstrong attributed some financial pressure to weaker spot trading. Coinbase shares have declined nearly 23% this year.
Coinbase CEO and Grayscale Research Head See Crypto Rules Beyond CLARITY Act
The CLARITY Act faces a September 15 Senate cloture vote and needs 60 votes, requiring Democratic support to advance.
Grayscale points to the GENIUS Act, SEC proposals and CFTC initiatives as signs of regulatory progress beyond CLARITY.
Coinbase’s spot trading revenue has weakened, prompting expansion into stocks, commodities, FX and international markets.
Coinbase CEO Brian Armstrong and Grayscale Research Head Zach Pandl said U.S. crypto regulation could advance without the CLARITY Act. The bill faces a Senate cloture vote on September 15 and needs 60 votes to proceed. Armstrong expects clarity through legislation or agency rules, while Pandl cited progress across several crypto markets.
CLARITY Act Faces Senate Vote
The CLARITY Act seeks to divide digital asset oversight between the Securities and Exchange Commission and Commodity Futures Trading Commission. Republicans hold 53 Senate seats, making Democratic support necessary to reach the 60-vote threshold.
Armstrong told CNBC’s Squawk Box Asia that the legislation appeared close to securing enough support. However, lawmakers continued negotiating ethics provisions and other outstanding issues.
The bill passed the House in July after its introduction in May 2025. According to Pandl, prediction markets assign a low probability to enactment during 2026.
Agencies Advance Separate Crypto Rules
Pandl said regulatory direction has improved beyond the CLARITY Act. He pointed to the GENIUS Act, which established a federal framework for payment stablecoins.
He also cited the SEC’s proposed Regulation Crypto Assets, which could create clearer routes for token fundraising. A potential innovation exemption could allow certain securities activities to move onto blockchains.
Meanwhile, proposed transfer-agent rules could let blockchains serve as official ownership records for issuers. The CFTC has also opened regulated U.S. pathways for perpetual futures through Kalshi and Coinbase.
Pandl said lawmakers could revisit CLARITY during the lame-duck session or under a future Congress. He added that the bill remains important for establishing lasting SEC and CFTC authority.
Coinbase Expands Beyond Spot Trading
Armstrong said Coinbase’s spot trading activity has declined over the past year. Trading contributes about half of the company’s revenue, while other income comes from stablecoins and institutional custody.
The exchange has expanded into stocks, commodities, and foreign exchange. It also established hubs in the United Arab Emirates and Singapore. Coinbase reported $1.2 billion in second-quarter revenue, down from $1.5 billion a year earlier.
The company recorded a $359.5 million net loss, compared with a $1.43 billion profit. Armstrong attributed some financial pressure to weaker spot trading. Coinbase shares have declined nearly 23% this year.
Grayscale points to the GENIUS Act, SEC proposals and CFTC initiatives as signs of regulatory progress beyond CLARITY.
Coinbase’s spot trading revenue has weakened, prompting expansion into stocks, commodities, FX and international markets.
Coinbase CEO Brian Armstrong and Grayscale Research Head Zach Pandl said U.S. crypto regulation could advance without the CLARITY Act. The bill faces a Senate cloture vote on September 15 and needs 60 votes to proceed. Armstrong expects clarity through legislation or agency rules, while Pandl cited progress across several crypto markets.
CLARITY Act Faces Senate Vote
The CLARITY Act seeks to divide digital asset oversight between the Securities and Exchange Commission and Commodity Futures Trading Commission. Republicans hold 53 Senate seats, making Democratic support necessary to reach the 60-vote threshold.
Armstrong told CNBC’s Squawk Box Asia that the legislation appeared close to securing enough support. However, lawmakers continued negotiating ethics provisions and other outstanding issues.
The bill passed the House in July after its introduction in May 2025. According to Pandl, prediction markets assign a low probability to enactment during 2026.
Agencies Advance Separate Crypto Rules
Pandl said regulatory direction has improved beyond the CLARITY Act. He pointed to the GENIUS Act, which established a federal framework for payment stablecoins.
He also cited the SEC’s proposed Regulation Crypto Assets, which could create clearer routes for token fundraising. A potential innovation exemption could allow certain securities activities to move onto blockchains.
Meanwhile, proposed transfer-agent rules could let blockchains serve as official ownership records for issuers. The CFTC has also opened regulated U.S. pathways for perpetual futures through Kalshi and Coinbase.
Pandl said lawmakers could revisit CLARITY during the lame-duck session or under a future Congress. He added that the bill remains important for establishing lasting SEC and CFTC authority.
Coinbase Expands Beyond Spot Trading
Armstrong said Coinbase’s spot trading activity has declined over the past year. Trading contributes about half of the company’s revenue, while other income comes from stablecoins and institutional custody.
The exchange has expanded into stocks, commodities, and foreign exchange. It also established hubs in the United Arab Emirates and Singapore. Coinbase reported $1.2 billion in second-quarter revenue, down from $1.5 billion a year earlier.
The company recorded a $359.5 million net loss, compared with a $1.43 billion profit. Armstrong attributed some financial pressure to weaker spot trading. Coinbase shares have declined nearly 23% this year.
138

ບົດຄວາມ
Igebe Lentengo Ye-SUI Liyakhula Njengoba Abahlaziyi Bethanda Umgomo Ka-$1U-Van de Poppe ugqamisa i-ecosystem ekhulayo ye-SUI, ukudluliselwa kwe-stablecoin okungenazo izindleko (zero-fee) kanye nama-600K SUI ekuthengeni emuva kwe-foundation.
I-RSI ne-MACD divergences ezibonisa ukunyuka (bullish) zivela ku-SUI/USD naku-SUI/BTC kumashejuli amasonto onke kanye nesikhathi sezinsuku ezintathu (three-day timeframes).
I-SUI ibambe ukusekelwa phakathi kuka-$0.71-$0.73, kanti ukuphuma (breakout) ngaphezu kuka-$0.84-$0.85 kungavula indlela eya emgomweni ka-$1.
Ihlala i-SUI ingama-85% ingaphansi kwesiphuphutheko sayo esiphezulu sangaphambilini, kanti umhlaziyi uMichael van de Poppe uthi ukunwetshwa kwe-ecosystem yayo sekuqhubanise igebe phakathi kwentengo nezisekelo. Ukhombe okwenziwa yizinguquko ze-stablecoin ezingenazo izindleko (zero-fee), ukwanda kwezinhlelo zokusebenza (applications), ukwanda kokuthengwa emuva (buybacks), kanye nokuhambisana okuqinile kwezimpawu zobuchwepheshe (bullish technical divergences). Khonamanjalo, u-Ali Charts noCrypto With Gopal bakhombe amazinga okusekelwa phakathi kuka-$0.71 no-$0.73.
Igebe Lentengo Ye-SUI Liyakhula Njengoba Abahlaziyi Bethanda Umgomo Ka-$1
U-Van de Poppe ugqamisa i-ecosystem ekhulayo ye-SUI, ukudluliselwa kwe-stablecoin okungenazo izindleko (zero-fee) kanye nama-600K SUI ekuthengeni emuva kwe-foundation.
I-RSI ne-MACD divergences ezibonisa ukunyuka (bullish) zivela ku-SUI/USD naku-SUI/BTC kumashejuli amasonto onke kanye nesikhathi sezinsuku ezintathu (three-day timeframes).
I-SUI ibambe ukusekelwa phakathi kuka-$0.71-$0.73, kanti ukuphuma (breakout) ngaphezu kuka-$0.84-$0.85 kungavula indlela eya emgomweni ka-$1.
Ihlala i-SUI ingama-85% ingaphansi kwesiphuphutheko sayo esiphezulu sangaphambilini, kanti umhlaziyi uMichael van de Poppe uthi ukunwetshwa kwe-ecosystem yayo sekuqhubanise igebe phakathi kwentengo nezisekelo. Ukhombe okwenziwa yizinguquko ze-stablecoin ezingenazo izindleko (zero-fee), ukwanda kwezinhlelo zokusebenza (applications), ukwanda kokuthengwa emuva (buybacks), kanye nokuhambisana okuqinile kwezimpawu zobuchwepheshe (bullish technical divergences). Khonamanjalo, u-Ali Charts noCrypto With Gopal bakhombe amazinga okusekelwa phakathi kuka-$0.71 no-$0.73.
I-RSI ne-MACD divergences ezibonisa ukunyuka (bullish) zivela ku-SUI/USD naku-SUI/BTC kumashejuli amasonto onke kanye nesikhathi sezinsuku ezintathu (three-day timeframes).
I-SUI ibambe ukusekelwa phakathi kuka-$0.71-$0.73, kanti ukuphuma (breakout) ngaphezu kuka-$0.84-$0.85 kungavula indlela eya emgomweni ka-$1.
Ihlala i-SUI ingama-85% ingaphansi kwesiphuphutheko sayo esiphezulu sangaphambilini, kanti umhlaziyi uMichael van de Poppe uthi ukunwetshwa kwe-ecosystem yayo sekuqhubanise igebe phakathi kwentengo nezisekelo. Ukhombe okwenziwa yizinguquko ze-stablecoin ezingenazo izindleko (zero-fee), ukwanda kwezinhlelo zokusebenza (applications), ukwanda kokuthengwa emuva (buybacks), kanye nokuhambisana okuqinile kwezimpawu zobuchwepheshe (bullish technical divergences). Khonamanjalo, u-Ali Charts noCrypto With Gopal bakhombe amazinga okusekelwa phakathi kuka-$0.71 no-$0.73.
315
ເຂົ້າສູ່ລະບົບເພື່ອສຳຫຼວດເນື້ອຫາເພີ່ມເຕີມ
ເຂົ້າຮ່ວມກຸ່ມຜູ້ໃຊ້ຄຣິບໂຕທົ່ວໂລກໃນ Binance Square.
⚡️ ໄດ້ຮັບຂໍ້ມູນຫຼ້າສຸດ ແລະ ທີ່ມີປະໂຫຍດກ່ຽວກັບຄຣິບໂຕ.
💬 ໄດ້ຮັບຄວາມໄວ້ວາງໃຈຈາກຕະຫຼາດແລກປ່ຽນຄຣິບໂຕທີ່ໃຫຍ່ທີ່ສຸດໃນໂລກ.
👍 ຄົ້ນຫາຂໍ້ມູນເຊີງເລິກທີ່ແທ້ຈາກນັກສ້າງທີ່ໄດ້ຮັບການຢືນຢັນ.
ອີເມວ / ເບີໂທລະສັບ
ຫົວຂໍ້ທີ່ກໍາລັງນິຍົມ
BitcoinReboundsTo$79K
14,786 views
137 ກຳລັງສົນທະນາ
🚨 $BTC is pushing higher.
Bitcoin is trading around $78,804, up roughly 1.9%, after reclaiming the $78K area. The next level to watch is the intraday high near $78,905.
A clean break above that level could open the way toward $79K–$80K. If BTC gets rejected, support sits around $78,300, then $77,975.
Bulls have momentum, but BTC needs to hold above $78K.
#Bitcoin #BTC #CryptoTrading #CryptoMarket #CryptoAnalysis
PulseON
·15 ຖືກໃຈ
·14.3k views
SouthKoreaCryptoTaxDelayPetitionTops50000
1,216 views
68 ກຳລັງສົນທະນາ
SolanaTransactionV1GoesLiveOnMainnet
675 views
43 ກຳລັງສົນທະນາ