
Crypto AnalyserX
4 ໂພສ

Crypto AnalyserX
ລາຍງານ
ບລັອກຜູ້ໃຊ້
Crypto Market Analysis & Insights. BTC • ETH • Altcoins • Web3 . Simplifying Crypto for a Global Community. X(Twitter) @CryptoAnalyserX
ເປີດການຊື້ຂາຍ
ຜູ້ຊື້ຂາຍຊົ່ວຄາວ
2.3 ປີ
1 ກໍາລັງຕິດຕາມ
0 ຜູ້ຕິດຕາມ
0 Liked
ໂພສ
Portfolio
ເບິ່ງການແປ
😎😎😎😎😎😎😎😎😎😎
🚨 BTC SIGNAL UPDATE
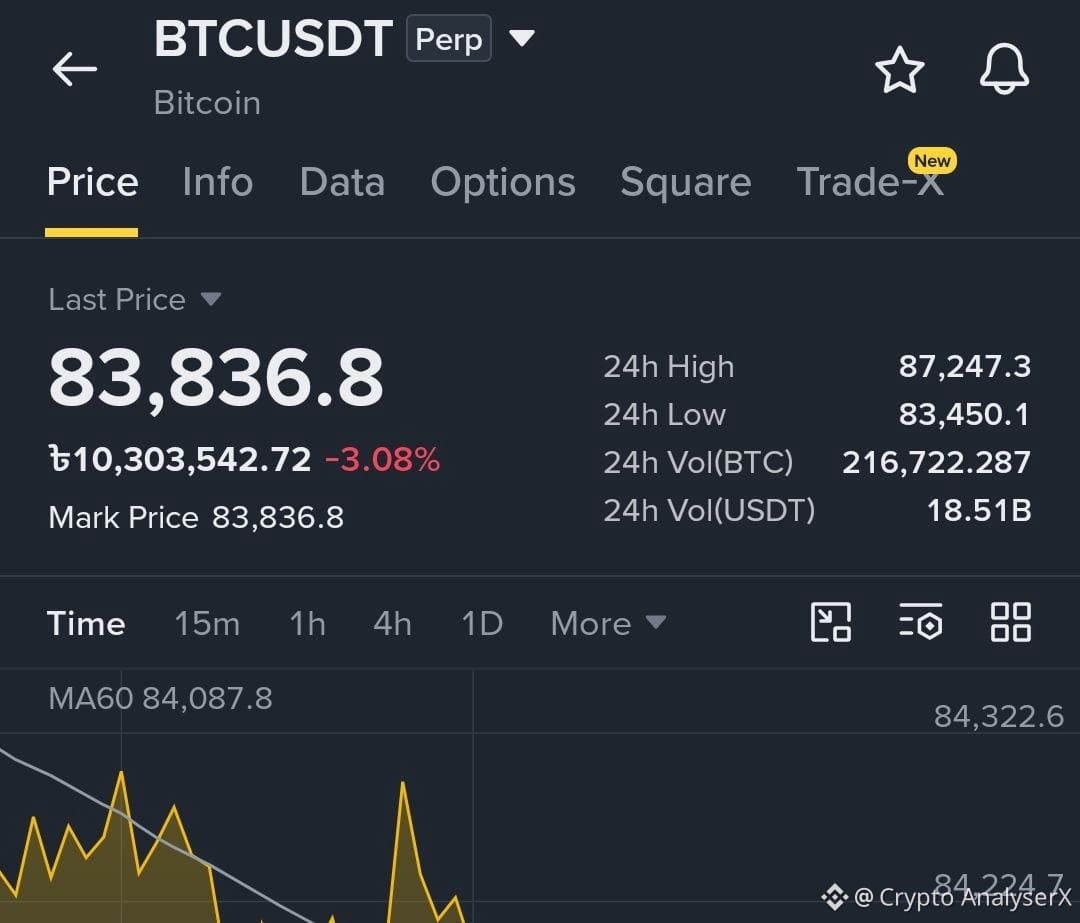
📊 Previous Analysis: BTC reached $86,000 → then moved down toward $84,600.
✅ Analysis played out
🎯 Key level now: $84,600
Watch the next reaction: • Hold + reclaim → bullish recovery scenario
• Break below → further downside risk
⚠️ Market conditions can change quickly. This is an analysis, not a guaranteed result.
#BTC #Bitcoin #Crypto #BTCAnalysis
😎😎😎😎😎😎😎😎😎😎
🚨 BTC SIGNAL UPDATE
📊 Previous Analysis: BTC reached $86,000 → then moved down toward $84,600.
✅ Analysis played out
🎯 Key level now: $84,600
Watch the next reaction: • Hold + reclaim → bullish recovery scenario
• Break below → further downside risk
⚠️ Market conditions can change quickly. This is an analysis, not a guaranteed result.
#BTC #Bitcoin #Crypto #BTCAnalysis
🚨 BTC SIGNAL UPDATE
📊 Previous Analysis: BTC reached $86,000 → then moved down toward $84,600.
✅ Analysis played out
🎯 Key level now: $84,600
Watch the next reaction: • Hold + reclaim → bullish recovery scenario
• Break below → further downside risk
⚠️ Market conditions can change quickly. This is an analysis, not a guaranteed result.
#BTC #Bitcoin #Crypto #BTCAnalysis
60
ເບິ່ງການແປ
🚨 BTC SIGNAL | SHORT BIAS
₿ Bitcoin
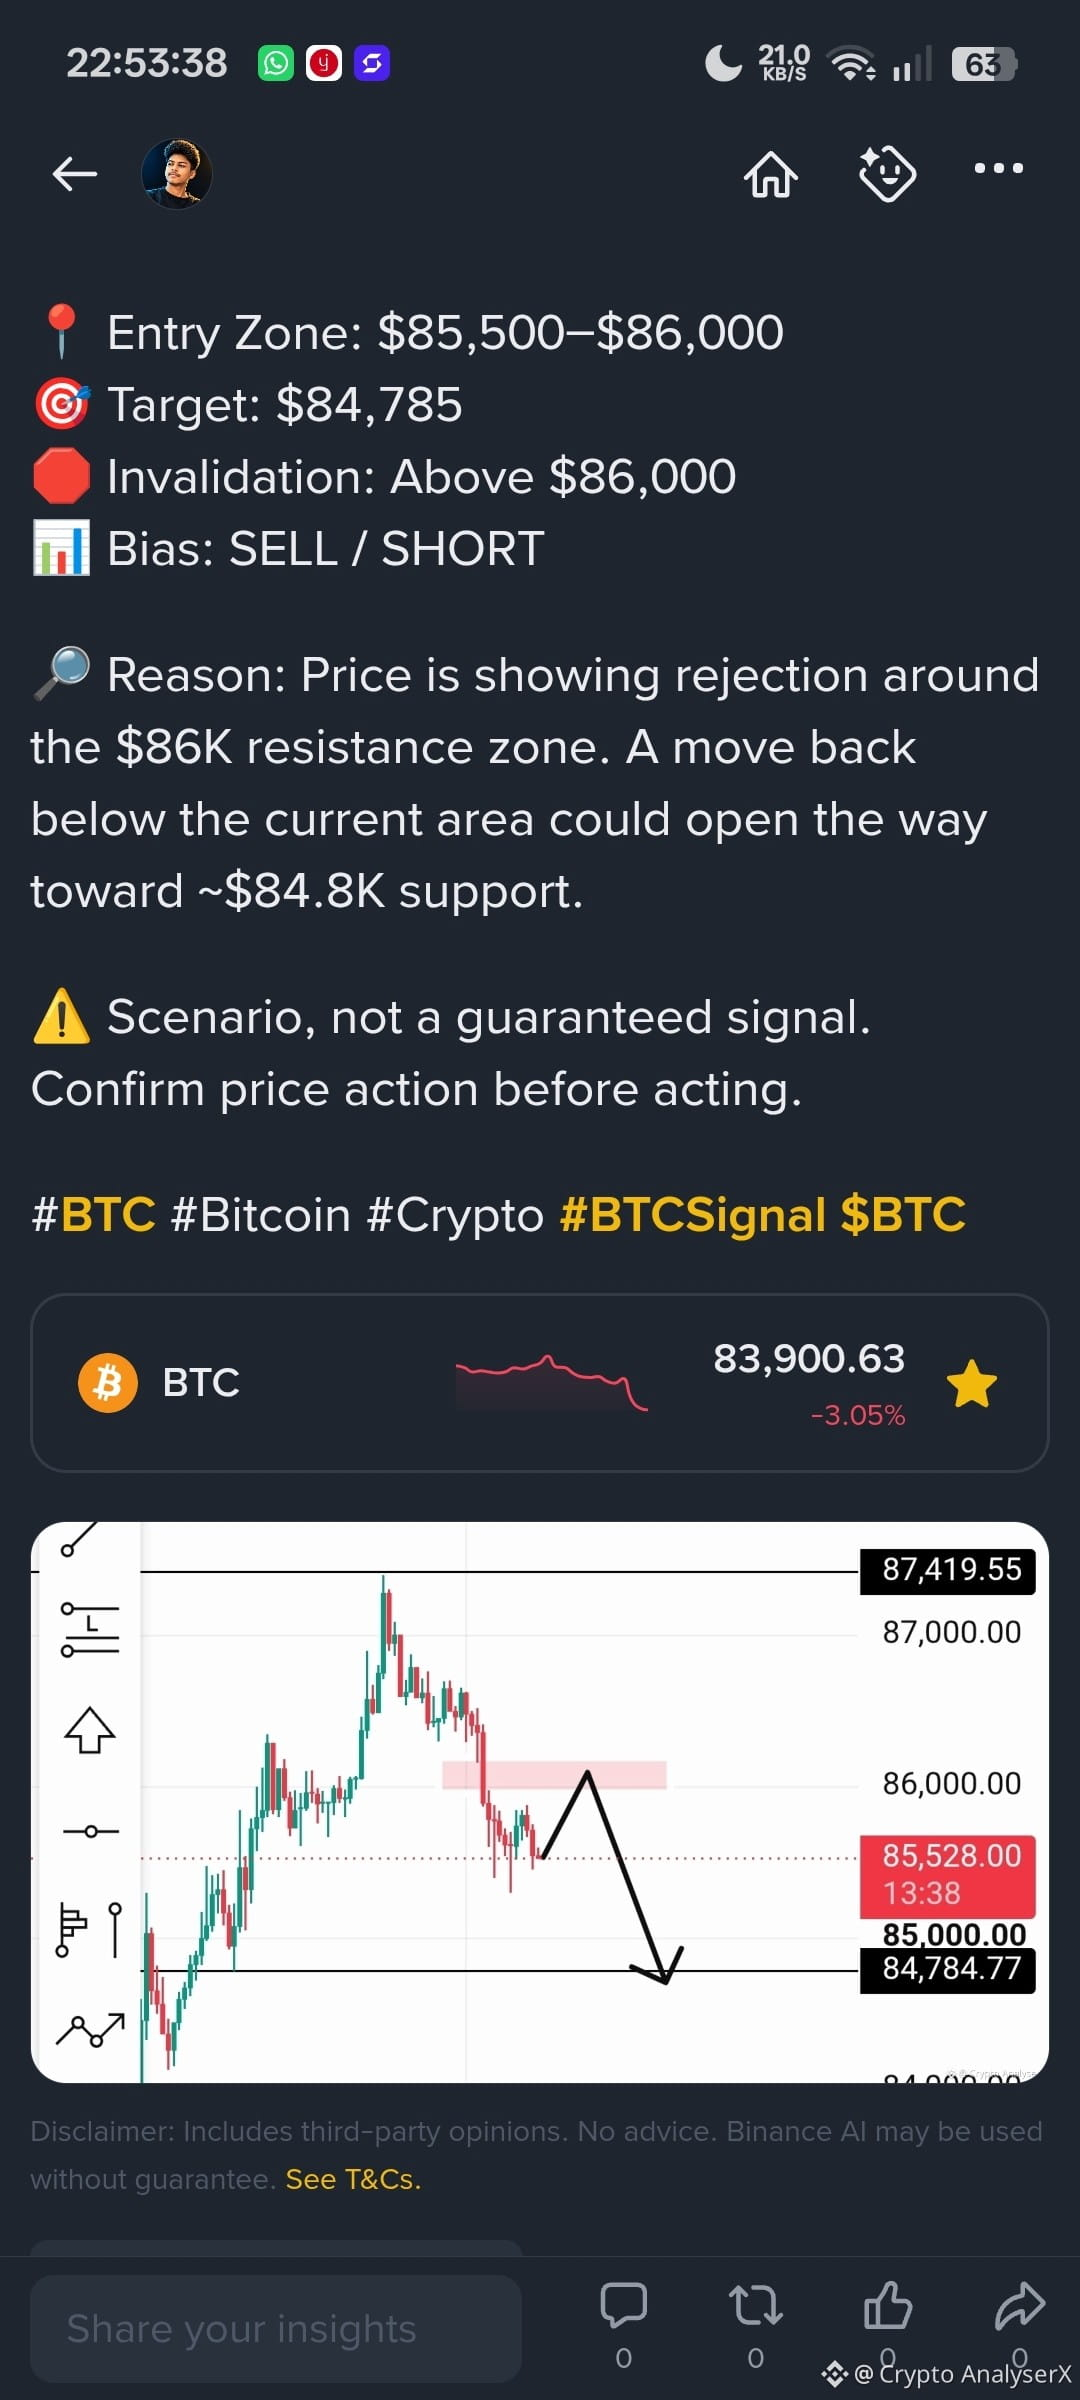
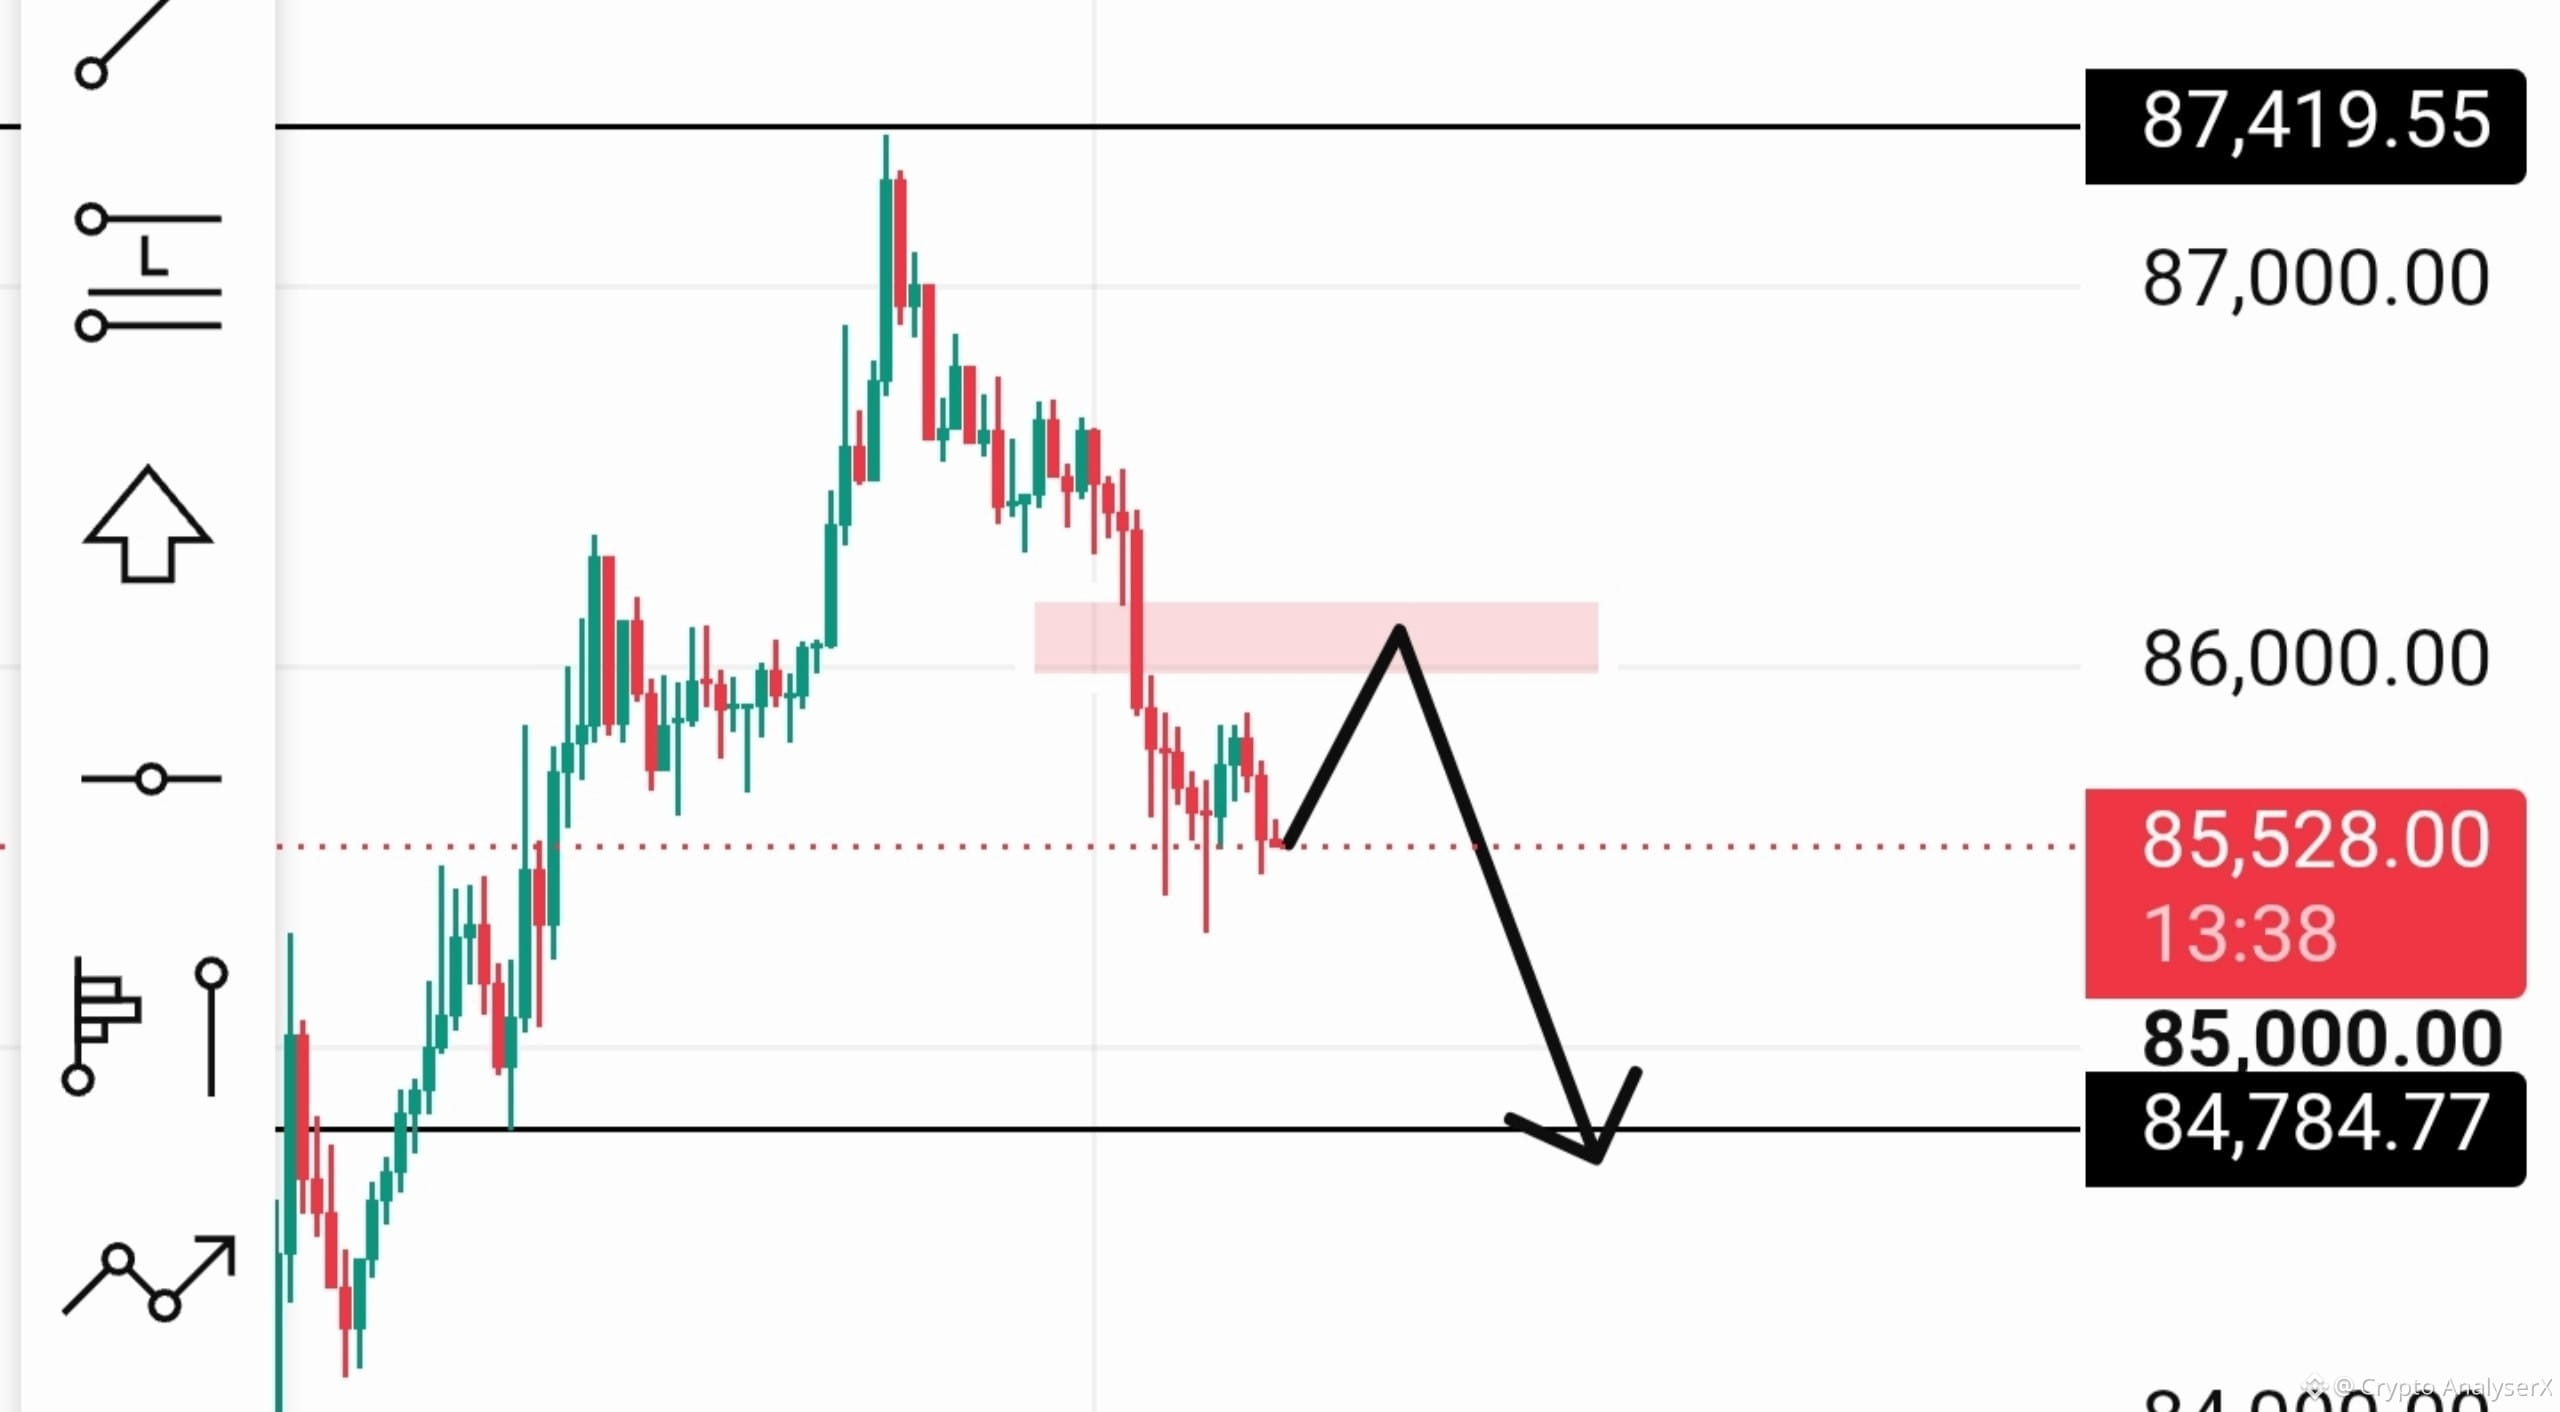
📍 Entry Zone: $85,500–$86,000
🎯 Target: $84,785
🛑 Invalidation: Above $86,000
📊 Bias: SELL / SHORT
🔎 Reason: Price is showing rejection around the $86K resistance zone. A move back below the current area could open the way toward ~$84.8K support.
⚠️ Scenario, not a guaranteed signal. Confirm price action before acting.
#BTC #Bitcoin #Crypto #BTCSignal $BTC
{spot}(BTCUSDT)
🚨 BTC SIGNAL | SHORT BIAS
₿ Bitcoin
📍 Entry Zone: $85,500–$86,000
🎯 Target: $84,785
🛑 Invalidation: Above $86,000
📊 Bias: SELL / SHORT
🔎 Reason: Price is showing rejection around the $86K resistance zone. A move back below the current area could open the way toward ~$84.8K support.
⚠️ Scenario, not a guaranteed signal. Confirm price action before acting.
#BTC #Bitcoin #Crypto #BTCSignal $BTC
₿ Bitcoin
📍 Entry Zone: $85,500–$86,000
🎯 Target: $84,785
🛑 Invalidation: Above $86,000
📊 Bias: SELL / SHORT
🔎 Reason: Price is showing rejection around the $86K resistance zone. A move back below the current area could open the way toward ~$84.8K support.
⚠️ Scenario, not a guaranteed signal. Confirm price action before acting.
#BTC #Bitcoin #Crypto #BTCSignal $BTC
91
🚨 BITCOIN: ກ່ອນຈະເບິ່ງ Altcoins, ໃຫ້ເບິ່ງອັນນີ້ກ່ອນ
ມີນັກທຼາດຫຼາຍຄົນເບິ່ງພຽງລາຄາ BTC ເທົ່ານັ້ນ. ແຕ່ຍັງມີຕົວຊີ້ວັດອີກອັນໜຶ່ງທີ່ສາມາດບອກໄດ້ຫຼາຍວ່າ ຕະຫຼາດ crypto ທັງໝົດອາດຈະໄປທາງໃດ:
📊 Bitcoin Dominance (BTC.D)
ມັນແມ່ນຫຍັງ?
Bitcoin Dominance ສະແດງສ່ວນແບ່ງຂອງ Bitcoin ໃນມູນຄ່າລວມຂອງຕະຫຼາດ crypto.
🔎 ເປັນຫຍັງມັນສຳຄັນ?
• BTC.D ເພີ່ມຂຶ້ນ → ອາດຈະເຫັນວ່າ ທຶນກຳລັງໄປສຸມຢູ່ໃນ Bitcoin ຫຼາຍຂຶ້ນ.
• BTC.D ຫຼຸດລົງ → ອາດຈະເຫັນການໝຸນທຶນໄປທາງ Ethereum ແລະ altcoins.
• BTC.D + BTC ເພີ່ມຂຶ້ນ → ມັກຈະສະທ້ອນສະພາບຕະຫຼາດທີ່ນຳໂດຍ Bitcoin ທີ່ແຂງແຮງ.
• BTC.D ຫຼຸດລົງ ແຕ່ BTC ຍັງແຂງແຮງ → ອາດຈະບອກວ່າ ມີການເຂົ້າຮ່ວມຂອງຕະຫຼາດກວ້າງກວ່າ.
🧠 ຄວາມເຫັນຂອງຂ້ອຍ
ລາຄາ BTC ບອກເຮົາວ່າ Bitcoin ກຳລັງເຮັດຫຍັງຢູ່.
Bitcoin Dominance ຊ່ວຍໃຫ້ເຮົາເຂົ້າໃຈວ່າ ທຶນຂອງຕະຫຼາດ crypto ອາດຈະໄປສຸມຢູ່ໃສ.
ດັ່ງນັ້ນ ບໍ່ແມ່ນພຽງແຕ່ຈະເບິ່ງ BTC ຄົນດຽວ, ໃຫ້ຈົດຕາໄວ້ທີ່:
ລາຄາ BTC + BTC Dominance + Total Market Cap
ຊຸດປະສົມນີ້ສາມາດໃຫ້ພາບທີ່ຊັດເຈນຂຶ້ນກ່ຽວກັບໂຄງສ້າງຂອງຕະຫຼາດ.
📌 ຕິດຕາມ Crypto AnalyserX ສຳລັບການວິເຄາະ crypto ທີ່ກະທັດຮັດ, ຂໍ້ມູນເຂົ້າໃຈຕະຫຼາດ ແລະ ຄວາມຮູ້.
#Bitcoin #BTC #Crypto #BTCDominance #CryptoAnalysis #Altcoins #Web3
🚨 BITCOIN: ກ່ອນຈະເບິ່ງ Altcoins, ໃຫ້ເບິ່ງອັນນີ້ກ່ອນ
ມີນັກທຼາດຫຼາຍຄົນເບິ່ງພຽງລາຄາ BTC ເທົ່ານັ້ນ. ແຕ່ຍັງມີຕົວຊີ້ວັດອີກອັນໜຶ່ງທີ່ສາມາດບອກໄດ້ຫຼາຍວ່າ ຕະຫຼາດ crypto ທັງໝົດອາດຈະໄປທາງໃດ:
📊 Bitcoin Dominance (BTC.D)
ມັນແມ່ນຫຍັງ?
Bitcoin Dominance ສະແດງສ່ວນແບ່ງຂອງ Bitcoin ໃນມູນຄ່າລວມຂອງຕະຫຼາດ crypto.
🔎 ເປັນຫຍັງມັນສຳຄັນ?
• BTC.D ເພີ່ມຂຶ້ນ → ອາດຈະເຫັນວ່າ ທຶນກຳລັງໄປສຸມຢູ່ໃນ Bitcoin ຫຼາຍຂຶ້ນ.
• BTC.D ຫຼຸດລົງ → ອາດຈະເຫັນການໝຸນທຶນໄປທາງ Ethereum ແລະ altcoins.
• BTC.D + BTC ເພີ່ມຂຶ້ນ → ມັກຈະສະທ້ອນສະພາບຕະຫຼາດທີ່ນຳໂດຍ Bitcoin ທີ່ແຂງແຮງ.
• BTC.D ຫຼຸດລົງ ແຕ່ BTC ຍັງແຂງແຮງ → ອາດຈະບອກວ່າ ມີການເຂົ້າຮ່ວມຂອງຕະຫຼາດກວ້າງກວ່າ.
🧠 ຄວາມເຫັນຂອງຂ້ອຍ
ລາຄາ BTC ບອກເຮົາວ່າ Bitcoin ກຳລັງເຮັດຫຍັງຢູ່.
Bitcoin Dominance ຊ່ວຍໃຫ້ເຮົາເຂົ້າໃຈວ່າ ທຶນຂອງຕະຫຼາດ crypto ອາດຈະໄປສຸມຢູ່ໃສ.
ດັ່ງນັ້ນ ບໍ່ແມ່ນພຽງແຕ່ຈະເບິ່ງ BTC ຄົນດຽວ, ໃຫ້ຈົດຕາໄວ້ທີ່:
ລາຄາ BTC + BTC Dominance + Total Market Cap
ຊຸດປະສົມນີ້ສາມາດໃຫ້ພາບທີ່ຊັດເຈນຂຶ້ນກ່ຽວກັບໂຄງສ້າງຂອງຕະຫຼາດ.
📌 ຕິດຕາມ Crypto AnalyserX ສຳລັບການວິເຄາະ crypto ທີ່ກະທັດຮັດ, ຂໍ້ມູນເຂົ້າໃຈຕະຫຼາດ ແລະ ຄວາມຮູ້.
#Bitcoin #BTC #Crypto #BTCDominance #CryptoAnalysis #Altcoins #Web3
ມີນັກທຼາດຫຼາຍຄົນເບິ່ງພຽງລາຄາ BTC ເທົ່ານັ້ນ. ແຕ່ຍັງມີຕົວຊີ້ວັດອີກອັນໜຶ່ງທີ່ສາມາດບອກໄດ້ຫຼາຍວ່າ ຕະຫຼາດ crypto ທັງໝົດອາດຈະໄປທາງໃດ:
📊 Bitcoin Dominance (BTC.D)
ມັນແມ່ນຫຍັງ?
Bitcoin Dominance ສະແດງສ່ວນແບ່ງຂອງ Bitcoin ໃນມູນຄ່າລວມຂອງຕະຫຼາດ crypto.
🔎 ເປັນຫຍັງມັນສຳຄັນ?
• BTC.D ເພີ່ມຂຶ້ນ → ອາດຈະເຫັນວ່າ ທຶນກຳລັງໄປສຸມຢູ່ໃນ Bitcoin ຫຼາຍຂຶ້ນ.
• BTC.D ຫຼຸດລົງ → ອາດຈະເຫັນການໝຸນທຶນໄປທາງ Ethereum ແລະ altcoins.
• BTC.D + BTC ເພີ່ມຂຶ້ນ → ມັກຈະສະທ້ອນສະພາບຕະຫຼາດທີ່ນຳໂດຍ Bitcoin ທີ່ແຂງແຮງ.
• BTC.D ຫຼຸດລົງ ແຕ່ BTC ຍັງແຂງແຮງ → ອາດຈະບອກວ່າ ມີການເຂົ້າຮ່ວມຂອງຕະຫຼາດກວ້າງກວ່າ.
🧠 ຄວາມເຫັນຂອງຂ້ອຍ
ລາຄາ BTC ບອກເຮົາວ່າ Bitcoin ກຳລັງເຮັດຫຍັງຢູ່.
Bitcoin Dominance ຊ່ວຍໃຫ້ເຮົາເຂົ້າໃຈວ່າ ທຶນຂອງຕະຫຼາດ crypto ອາດຈະໄປສຸມຢູ່ໃສ.
ດັ່ງນັ້ນ ບໍ່ແມ່ນພຽງແຕ່ຈະເບິ່ງ BTC ຄົນດຽວ, ໃຫ້ຈົດຕາໄວ້ທີ່:
ລາຄາ BTC + BTC Dominance + Total Market Cap
ຊຸດປະສົມນີ້ສາມາດໃຫ້ພາບທີ່ຊັດເຈນຂຶ້ນກ່ຽວກັບໂຄງສ້າງຂອງຕະຫຼາດ.
📌 ຕິດຕາມ Crypto AnalyserX ສຳລັບການວິເຄາະ crypto ທີ່ກະທັດຮັດ, ຂໍ້ມູນເຂົ້າໃຈຕະຫຼາດ ແລະ ຄວາມຮູ້.
#Bitcoin #BTC #Crypto #BTCDominance #CryptoAnalysis #Altcoins #Web3

96
ເບິ່ງການແປ
BITCOIN: Is This the Breakout Bears Didn’t Expect?🚨 BITCOIN: Is This the Breakout Bears Didn’t Expect?$
Bitcoin has just moved back above a level that has been closely watched by the market: the Weekly MA50.
But is this the beginning of a new bullish phase—or just another temporary recovery? Let’s break it down. 👇
✪ Key Market Levels
• Weekly MA50: ~$78,700
• Current BTC zone: ~$80,375
• Major range: $71K–$82K
• Key breakout zone: $82.5K–$83K
• Potential upside level: $88K
✪ What the Chart Is Showing
Bitcoin has reclaimed the Weekly MA50 after several weeks of weakness.
Historically, reclaiming this moving average has sometimes preceded stronger bullish periods. The current structure also has similarities to the 2022–23 recovery phase, where repeated rejections were followed by a recovery and eventual breakout.
However, history does not guarantee the same outcome this time.
° The Bear Trap Question
Recent weakness created expectations of another major decline. Instead, BTC recovered and moved back above the MA50.
That makes the recent move interesting—but the real confirmation has not arrived yet.
✪ The Level That Matters Most
The bigger test is around $82.5K–$83K.
A sustained breakout above this area would provide stronger evidence that Bitcoin is leaving the current $71K–$82K range.
Until then, the market can still remain range-bound.
✪ MA50 Historical Context
The original analysis points to 7 previous occasions when Bitcoin moved below the Weekly MA50 and later reclaimed it:
• 5 were associated with major bullish phases
• 2 became failed signals, including periods mentioned around 2011 and the 2020 COVID crash
This suggests MA50 reclaiming can be useful context—but it is not a guaranteed bull-market signal.
🧠 My Take
The structure is becoming more constructive while BTC remains above the Weekly MA50.
But I would separate “bullish setup” from “confirmed breakout.”
The key sequence to watch is:
$78.7K reclaim → hold above MA50 → $82.5K–$83K breakout → confirmation of stronger momentum
If BTC fails to hold the MA50, the bullish thesis becomes weaker and the $71K–$82K range remains relevant.
🎯 $88K is the target mentioned in the original analysis, not a guaranteed outcome.
#Bitcoin #BTC #Crypto #BTCAnalysis #CryptoMarket #Web3
$BTC
{spot}(BTCUSDT)
BITCOIN: Is This the Breakout Bears Didn’t Expect?
🚨 BITCOIN: Is This the Breakout Bears Didn’t Expect?$
Bitcoin has just moved back above a level that has been closely watched by the market: the Weekly MA50.
But is this the beginning of a new bullish phase—or just another temporary recovery? Let’s break it down. 👇
✪ Key Market Levels
• Weekly MA50: ~$78,700
• Current BTC zone: ~$80,375
• Major range: $71K–$82K
• Key breakout zone: $82.5K–$83K
• Potential upside level: $88K
✪ What the Chart Is Showing
Bitcoin has reclaimed the Weekly MA50 after several weeks of weakness.
Historically, reclaiming this moving average has sometimes preceded stronger bullish periods. The current structure also has similarities to the 2022–23 recovery phase, where repeated rejections were followed by a recovery and eventual breakout.
However, history does not guarantee the same outcome this time.
° The Bear Trap Question
Recent weakness created expectations of another major decline. Instead, BTC recovered and moved back above the MA50.
That makes the recent move interesting—but the real confirmation has not arrived yet.
✪ The Level That Matters Most
The bigger test is around $82.5K–$83K.
A sustained breakout above this area would provide stronger evidence that Bitcoin is leaving the current $71K–$82K range.
Until then, the market can still remain range-bound.
✪ MA50 Historical Context
The original analysis points to 7 previous occasions when Bitcoin moved below the Weekly MA50 and later reclaimed it:
• 5 were associated with major bullish phases
• 2 became failed signals, including periods mentioned around 2011 and the 2020 COVID crash
This suggests MA50 reclaiming can be useful context—but it is not a guaranteed bull-market signal.
🧠 My Take
The structure is becoming more constructive while BTC remains above the Weekly MA50.
But I would separate “bullish setup” from “confirmed breakout.”
The key sequence to watch is:
$78.7K reclaim → hold above MA50 → $82.5K–$83K breakout → confirmation of stronger momentum
If BTC fails to hold the MA50, the bullish thesis becomes weaker and the $71K–$82K range remains relevant.
🎯 $88K is the target mentioned in the original analysis, not a guaranteed outcome.
#Bitcoin #BTC #Crypto #BTCAnalysis #CryptoMarket #Web3
$BTC
Bitcoin has just moved back above a level that has been closely watched by the market: the Weekly MA50.
But is this the beginning of a new bullish phase—or just another temporary recovery? Let’s break it down. 👇
✪ Key Market Levels
• Weekly MA50: ~$78,700
• Current BTC zone: ~$80,375
• Major range: $71K–$82K
• Key breakout zone: $82.5K–$83K
• Potential upside level: $88K
✪ What the Chart Is Showing
Bitcoin has reclaimed the Weekly MA50 after several weeks of weakness.
Historically, reclaiming this moving average has sometimes preceded stronger bullish periods. The current structure also has similarities to the 2022–23 recovery phase, where repeated rejections were followed by a recovery and eventual breakout.
However, history does not guarantee the same outcome this time.
° The Bear Trap Question
Recent weakness created expectations of another major decline. Instead, BTC recovered and moved back above the MA50.
That makes the recent move interesting—but the real confirmation has not arrived yet.
✪ The Level That Matters Most
The bigger test is around $82.5K–$83K.
A sustained breakout above this area would provide stronger evidence that Bitcoin is leaving the current $71K–$82K range.
Until then, the market can still remain range-bound.
✪ MA50 Historical Context
The original analysis points to 7 previous occasions when Bitcoin moved below the Weekly MA50 and later reclaimed it:
• 5 were associated with major bullish phases
• 2 became failed signals, including periods mentioned around 2011 and the 2020 COVID crash
This suggests MA50 reclaiming can be useful context—but it is not a guaranteed bull-market signal.
🧠 My Take
The structure is becoming more constructive while BTC remains above the Weekly MA50.
But I would separate “bullish setup” from “confirmed breakout.”
The key sequence to watch is:
$78.7K reclaim → hold above MA50 → $82.5K–$83K breakout → confirmation of stronger momentum
If BTC fails to hold the MA50, the bullish thesis becomes weaker and the $71K–$82K range remains relevant.
🎯 $88K is the target mentioned in the original analysis, not a guaranteed outcome.
#Bitcoin #BTC #Crypto #BTCAnalysis #CryptoMarket #Web3
$BTC
112
ເຂົ້າສູ່ລະບົບເພື່ອສຳຫຼວດເນື້ອຫາເພີ່ມເຕີມ
ເຂົ້າຮ່ວມກຸ່ມຜູ້ໃຊ້ຄຣິບໂຕທົ່ວໂລກໃນ Binance Square.
⚡️ ໄດ້ຮັບຂໍ້ມູນຫຼ້າສຸດ ແລະ ທີ່ມີປະໂຫຍດກ່ຽວກັບຄຣິບໂຕ.
💬 ໄດ້ຮັບຄວາມໄວ້ວາງໃຈຈາກຕະຫຼາດແລກປ່ຽນຄຣິບໂຕທີ່ໃຫຍ່ທີ່ສຸດໃນໂລກ.
👍 ຄົ້ນຫາຂໍ້ມູນເຊີງເລິກທີ່ແທ້ຈາກນັກສ້າງທີ່ໄດ້ຮັບການຢືນຢັນ.
ອີເມວ / ເບີໂທລະສັບ
ຫົວຂໍ້ທີ່ກໍາລັງນິຍົມ
AIStocksWhatNext
1.1M views
7,394 ກຳລັງສົນທະນາ
Пាចែក ແລະ ຮັບຮາງວັນຈາກການແຂ່ງຂັນ Trending Hashtag ຂອງພວກເຮົາ
✨ຫົວຂໍ້: ມີໂອກາດການລົງທຶນອື່ນໃດອີກ ຍັງເຫຼືອບໍ ໃນເວລາທີ່ຫຸ້ນ AI ຍັງຂຶ້ນຢ່າງຕໍ່ເນື່ອງ?
👉ວິທີເຂົ້າຮ່ວມ:
ໂພດຂໍ້ຄວາມສັ້ນຫຼືບົດຄວາມພ້ອມ hashtag #AIStocksWhatNext
ແບ່ງປັນວ່າທ່ານເບີກບວກ (bullish) ຫຼືຂາດບວກ (bearish) ແລະ ໂພດການຖືຫຸ້ນ AI ຫຼືການຊື້ຂາຍຂອງທ່ານ — ການໃຊ້ trade widget ອາດຊ່ວຍໃຫ້ມີສິດກໍານົດໄດ້ດີຂຶ້ນ.
ທ່ານຍັງສາມາດເສີມໃຫ້ໂພດຂອງທ່ານໂດຍການແບ່ງປັນຂໍ້ມູນ ຫຼື ກຣາຟ, ແລະຫຼີກລ້ຽງຮູບພາບທີ່ສ້າງຈາກ AI.
✍️ສ້າງເນື້ອຫາຕາມມຸມມອງດ້ານລຸ່ມນີ້:
- Nvidia ກ່າວວ່າຍອດຂາຍຊິບຈະເພີ່ມເປັນສອງເທົ່າໃນປີໜ້າ, ແລະ ບໍລິສັດ AI ຊັ້ນນໍາຍັງຕີຍອດລາຍຮັບສູງສຸດຕໍ່ເນື່ອງ—ການໃຊ້ຈ່າຍດ້ານ compute ທີ່ຢູ່ຫຼັງມັນກໍ່ຊັດເຈນຫຼາຍ. ຄວາມຕ້ອງການຂອງ AI ຈິງໆກໍາລັງຂຶ້ນບໍ? ແລະ ມັນຈະຢູ່ໄດ້ດົນປານໃດ? ຫຸ້ນ AI ຂຶ້ນທົ່ວກະດານ. ນີ້ແມ່ນການປະຕິບັດສະລຸດຈິງ (real breakout) ຫຼືແພ້ແຄ່ການເດັ້ງກັ້ນໄລຍະສັ້ນ?
- ຜູ້ນໍາໃນອຸດສາຫະກໍາເອີ້ນໃຫ້ຊະລໍການພັດທະນາ AI, ໃນຂະນະທີ່ Trump ວາງແຜນຈະສ້າງ “AI Force” ໂດຍອ້າງວ່າ AI ອາດຈະກວມ 25% ຂອງ GDP ຂອງສະຫະລັດ ໃນອະນາຄົດ. ທ່ານຢູ່ຝ່າຍໃດ? ການໜູນຊ່ວຍຈາກລະດັບລັດ (state-level backing) ຈະເປັນໄຊຊະນະໄລຍະຍາວສໍາລັບຫຸ້ນ AI ບໍ?
- ທ່ານກໍ່າລັງຊື້ຫຸ້ນ AI ບໍ? ແບ່ງປັນການຊື້ຂາຍ/ການຖືຄອງທີ່ກ່ຽວຂ້ອງກັບ AI ຂອງທ່ານຜ່ານ trade sharing widget ຂອງພວກເຮົາ.
⏰ໄລຍະການແຄມເປນ:
- 2026-09-22 7:00 - 2026-09-24 4:00 UTC
🎁ລາງວັນ:
- ໂພດທີ່ມີຄຸນສົມບັດຕາມກົດລະບຽບຂ້າງເທິງ ແລະ ມີຫຼາຍກວ່າ 100 ຄໍາຈະຖືກທວດສອບ ແລະ ອາດຈະໄດ້ຮັບການເພີ່ມເຂົ້າເບິ່ງແບບສຸ່ມ 500 ຫາ 3,000 ຄັ້ງ. ທ່ານຈະໄດ້ຮັບແຈ້ງເຕືອນຈາກເຈົ້າໜ້າທີ່ຂອງ feed ຂອງພວກເຮົາ ຖ້າໂພດຂອງທ່ານຖືກເລືອກ.
- ມີໂອກາດໃຫ້ບົດຄວາມຂອງທ່ານຖືກນໍາໄປສະແດງໃນ Binance Square Official
ຕ້ອງການໄອເດຍສໍາລັບໂພດຂອງທ່ານບໍ? ເຂົ້າໄປທີ່ໜ້າຫົວຂໍ້ #AIStocksWhatNext ຫຼື Square Guide on How to Post for Better Reach.
Binance Square Official
·630 ຖືກໃຈ
·1.9M views
USWeighsPromotingDollarStablecoinsAbroad
188 views
21 ກຳລັງສົນທະນາ
US10YTreasuryYieldHits19YearHigh
637 views
47 ກຳລັງສົນທະນາ