

Coinspeaker
12.4k ໂພສ

Coinspeaker
 Square Verified+
ລາຍງານ
ບລັອກຜູ້ໃຊ້
Coinspeaker
0 ກໍາລັງຕິດຕາມ
71.6K+ ຜູ້ຕິດຕາມ
107.5K+ Liked
ໂພສ
·
--
ບົດຄວາມ
XRP Price Forecast: Ripple Credit Partner, Clearpool, Is on the MoveXRP traded at $1.49 on October 6, down 1.5% over 24 hours, as Clearpool’s proposed move to the XRP Ledger (XRPL) advanced without a material token-price response. For the near-term XRP price forecast, the market is weighing a concrete expansion of credit infrastructure against a more difficult question: when will prospective lending translate into measurable network demand?
On October 5, Clearpool said about 97% of participating voters approved a 1:1 migration from Ethereum-based CPOOL to a new CLEAR token on XRPL, planned for Q4 2026. The vote follows a Ripple, Clearpool and Cicada Partners credit arrangement: Clearpool provides lending infrastructure, Cicada sources and assesses borrowers, and Ripple participates as a limited partner supplying capital.
The proposed pools would issue working-capital loans in RLUSD, Ripple’s dollar-pegged stablecoin. Clearpool’s governance materials describe the initiative as its first institutional credit product using RLUSD on XRPL.
Governance vote passed ✅
The Clearpool community has approved expansion to the XRP Ledger and the 1:1 migration of CPOOL → CLEAR with 97.16% in favor.
Migration is targeted for Q4. More details on next steps to come 🙏 pic.twitter.com/fyb7hcg5eB
— Clearpool (@ClearpoolFin) October 5, 2026
Market Intelligence: Crypto Security Analyst Recommends Best Anonymous Crypto Exchanges
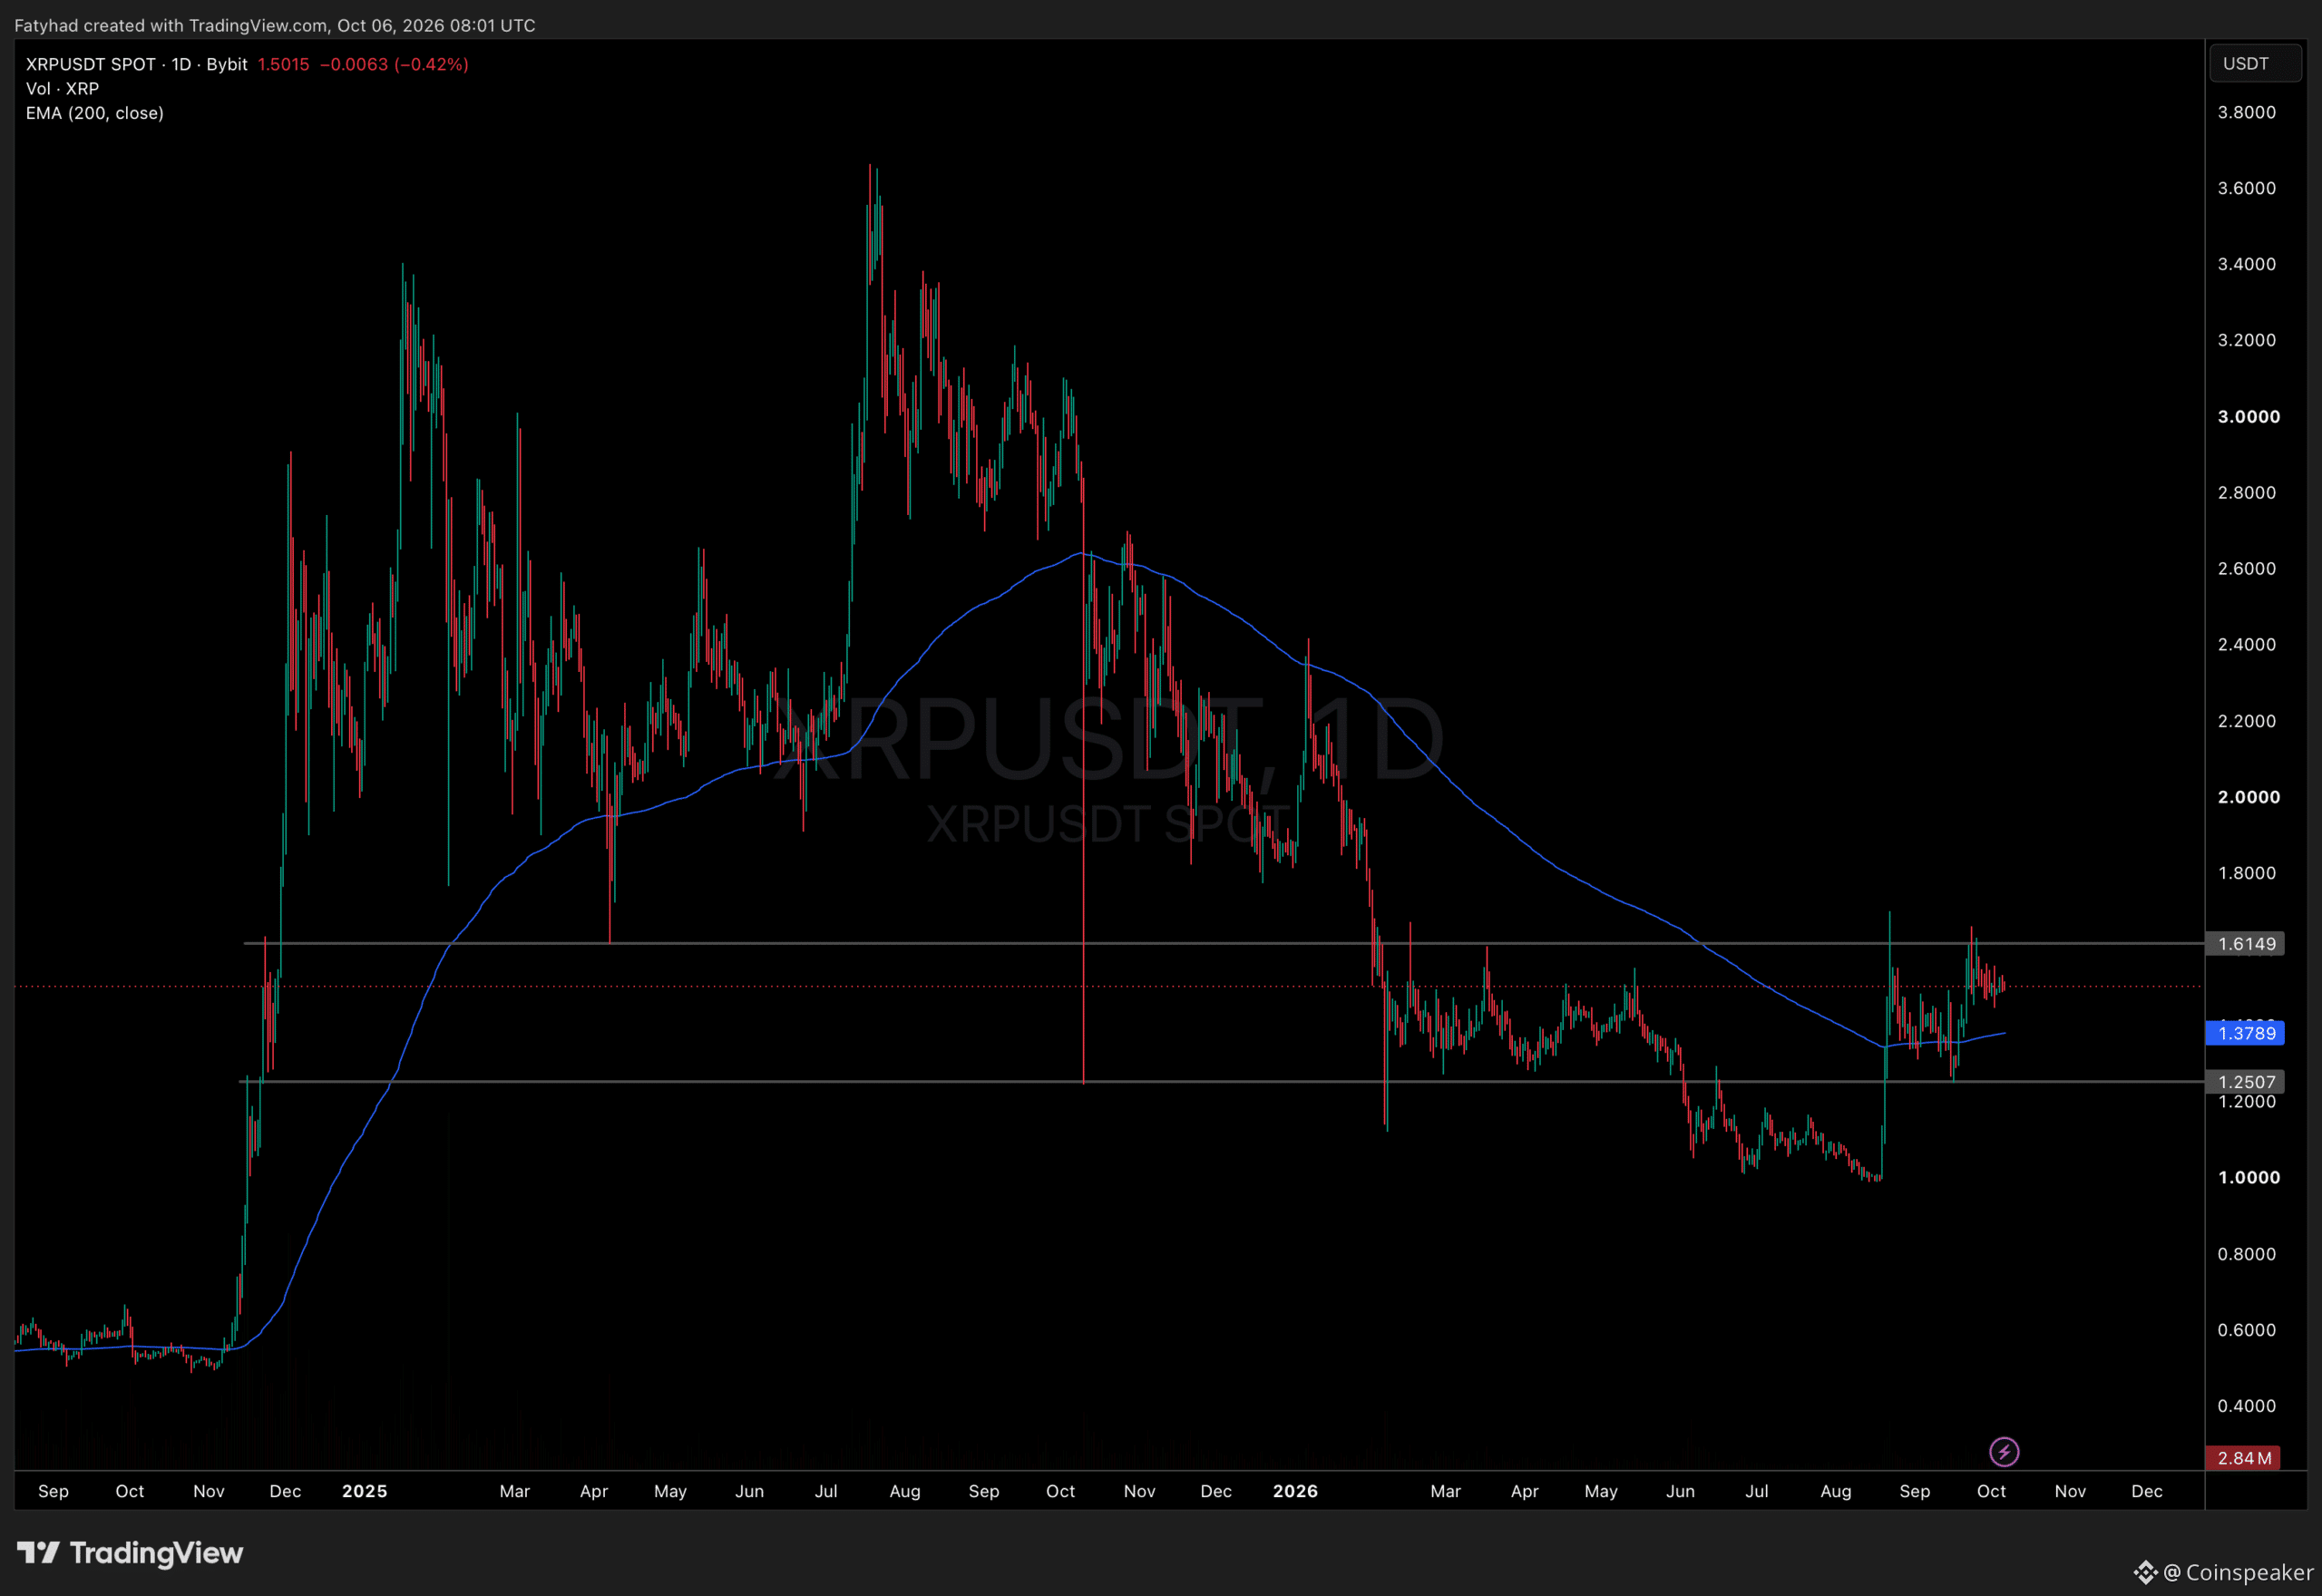
XRP Price Forecast: Can XRP Price Hold Above $1.38 and Test $1.60?
XRPUSDT Chart 1D TradingView
The scenarios are straightforward. If $1.38 holds as support, XRP could attempt a move toward $1.61; a sustained daily close above that level would mark its first real breakout in months. The base case is continued consolidation while traders wait for evidence of XRPL lending activity. A drop below $1.38 would weaken the setup and bring the $1.25 range floor into view, followed by the $1.00–$1.20 area where XRP bottomed in August. Market commentators cite $0.92 and $0.70 as lower supports.
What would change the XRP price forecast? Actual RLUSD credit-vault launches, disclosed loan volume, and institutional participation. Clearpool’s migration merits attention, but operational proof matters more than the vote alone.
Market Intelligence: Crypto Analyst Predicts Best Low-Cap Crypto
LiquidChain Targets Early Mover Interest as XRP Tests Key Levels
Top Crypto Picks for 2026: Why LiquidChain Could Lead the Next Wave
Clearpool’s move adds substance to XRPL’s institutional-credit narrative, yet XRP’s nearly flat daily change shows that the market has not priced in a major near-term payoff. That may disappoint holders seeking an immediate catalyst; the upside case still depends on execution and adoption. Ripple President Monica Long separately said at the XRP Seoul conference on October 3 that Ripple plans a credit service backed by XRP as collateral in 2027, another milestone to monitor.
LiquidChain ($LIQUID) is a Layer 3 project positioning itself as a cross-chain liquidity layer, designed to merge Bitcoin, Ethereum, and Solana liquidity into one execution environment. Its stated features include single-step execution, verifiable settlement, and a deploy-once architecture for developers seeking access across ecosystems.
LiquidChain’s current price is $0.014962, and its total raised is $980,892.84.
Those curious can research LiquidChain directly.
Layer 3 Is Already Here, Smart Money Knows It – Do You?
next
The post XRP Price Forecast: Ripple Credit Partner, Clearpool, is On The Move appeared first on Coinspeaker.
XRP Price Forecast: Ripple Credit Partner, Clearpool, Is on the Move
XRP traded at $1.49 on October 6, down 1.5% over 24 hours, as Clearpool’s proposed move to the XRP Ledger (XRPL) advanced without a material token-price response. For the near-term XRP price forecast, the market is weighing a concrete expansion of credit infrastructure against a more difficult question: when will prospective lending translate into measurable network demand?
On October 5, Clearpool said about 97% of participating voters approved a 1:1 migration from Ethereum-based CPOOL to a new CLEAR token on XRPL, planned for Q4 2026. The vote follows a Ripple, Clearpool and Cicada Partners credit arrangement: Clearpool provides lending infrastructure, Cicada sources and assesses borrowers, and Ripple participates as a limited partner supplying capital.
The proposed pools would issue working-capital loans in RLUSD, Ripple’s dollar-pegged stablecoin. Clearpool’s governance materials describe the initiative as its first institutional credit product using RLUSD on XRPL.
Governance vote passed ✅
The Clearpool community has approved expansion to the XRP Ledger and the 1:1 migration of CPOOL → CLEAR with 97.16% in favor.
Migration is targeted for Q4. More details on next steps to come 🙏 pic.twitter.com/fyb7hcg5eB
— Clearpool (@ClearpoolFin) October 5, 2026
Market Intelligence: Crypto Security Analyst Recommends Best Anonymous Crypto Exchanges
XRP Price Forecast: Can XRP Price Hold Above $1.38 and Test $1.60?
XRPUSDT Chart 1D TradingView
The scenarios are straightforward. If $1.38 holds as support, XRP could attempt a move toward $1.61; a sustained daily close above that level would mark its first real breakout in months. The base case is continued consolidation while traders wait for evidence of XRPL lending activity. A drop below $1.38 would weaken the setup and bring the $1.25 range floor into view, followed by the $1.00–$1.20 area where XRP bottomed in August. Market commentators cite $0.92 and $0.70 as lower supports.
What would change the XRP price forecast? Actual RLUSD credit-vault launches, disclosed loan volume, and institutional participation. Clearpool’s migration merits attention, but operational proof matters more than the vote alone.
Market Intelligence: Crypto Analyst Predicts Best Low-Cap Crypto
LiquidChain Targets Early Mover Interest as XRP Tests Key Levels
Top Crypto Picks for 2026: Why LiquidChain Could Lead the Next Wave
Clearpool’s move adds substance to XRPL’s institutional-credit narrative, yet XRP’s nearly flat daily change shows that the market has not priced in a major near-term payoff. That may disappoint holders seeking an immediate catalyst; the upside case still depends on execution and adoption. Ripple President Monica Long separately said at the XRP Seoul conference on October 3 that Ripple plans a credit service backed by XRP as collateral in 2027, another milestone to monitor.
LiquidChain ($LIQUID) is a Layer 3 project positioning itself as a cross-chain liquidity layer, designed to merge Bitcoin, Ethereum, and Solana liquidity into one execution environment. Its stated features include single-step execution, verifiable settlement, and a deploy-once architecture for developers seeking access across ecosystems.
LiquidChain’s current price is $0.014962, and its total raised is $980,892.84.
Those curious can research LiquidChain directly.
Layer 3 Is Already Here, Smart Money Knows It – Do You?
next
The post XRP Price Forecast: Ripple Credit Partner, Clearpool, is On The Move appeared first on Coinspeaker.
On October 5, Clearpool said about 97% of participating voters approved a 1:1 migration from Ethereum-based CPOOL to a new CLEAR token on XRPL, planned for Q4 2026. The vote follows a Ripple, Clearpool and Cicada Partners credit arrangement: Clearpool provides lending infrastructure, Cicada sources and assesses borrowers, and Ripple participates as a limited partner supplying capital.
The proposed pools would issue working-capital loans in RLUSD, Ripple’s dollar-pegged stablecoin. Clearpool’s governance materials describe the initiative as its first institutional credit product using RLUSD on XRPL.
Governance vote passed ✅
The Clearpool community has approved expansion to the XRP Ledger and the 1:1 migration of CPOOL → CLEAR with 97.16% in favor.
Migration is targeted for Q4. More details on next steps to come 🙏 pic.twitter.com/fyb7hcg5eB
— Clearpool (@ClearpoolFin) October 5, 2026
Market Intelligence: Crypto Security Analyst Recommends Best Anonymous Crypto Exchanges
XRP Price Forecast: Can XRP Price Hold Above $1.38 and Test $1.60?
XRPUSDT Chart 1D TradingView
The scenarios are straightforward. If $1.38 holds as support, XRP could attempt a move toward $1.61; a sustained daily close above that level would mark its first real breakout in months. The base case is continued consolidation while traders wait for evidence of XRPL lending activity. A drop below $1.38 would weaken the setup and bring the $1.25 range floor into view, followed by the $1.00–$1.20 area where XRP bottomed in August. Market commentators cite $0.92 and $0.70 as lower supports.
What would change the XRP price forecast? Actual RLUSD credit-vault launches, disclosed loan volume, and institutional participation. Clearpool’s migration merits attention, but operational proof matters more than the vote alone.
Market Intelligence: Crypto Analyst Predicts Best Low-Cap Crypto
LiquidChain Targets Early Mover Interest as XRP Tests Key Levels
Top Crypto Picks for 2026: Why LiquidChain Could Lead the Next Wave
Clearpool’s move adds substance to XRPL’s institutional-credit narrative, yet XRP’s nearly flat daily change shows that the market has not priced in a major near-term payoff. That may disappoint holders seeking an immediate catalyst; the upside case still depends on execution and adoption. Ripple President Monica Long separately said at the XRP Seoul conference on October 3 that Ripple plans a credit service backed by XRP as collateral in 2027, another milestone to monitor.
LiquidChain ($LIQUID) is a Layer 3 project positioning itself as a cross-chain liquidity layer, designed to merge Bitcoin, Ethereum, and Solana liquidity into one execution environment. Its stated features include single-step execution, verifiable settlement, and a deploy-once architecture for developers seeking access across ecosystems.
LiquidChain’s current price is $0.014962, and its total raised is $980,892.84.
Those curious can research LiquidChain directly.
Layer 3 Is Already Here, Smart Money Knows It – Do You?
next
The post XRP Price Forecast: Ripple Credit Partner, Clearpool, is On The Move appeared first on Coinspeaker.
150
·
--
ບົດຄວາມ
Ripple News: Why $1.53 Matters for the Token’s Next MoveIn Ripple news this week, XRP traded near $1.50 on Tuesday, October 6, ahead of a packed catalyst calendar. Evernorth is set to start trading on Nasdaq as XRPN on Thursday, October 8. Two XRP Ledger upgrades, PermissionDelegationV1_1 and BatchV1_1, could activate around October 8 and 9 if validator support holds.
Crypto sentiment scores sit at 62 out of 100, in bullish territory. Yet whale balances and derivatives positions remain quiet, suggesting traders are waiting for confirmation rather than betting ahead of the events. The real test is whether institutional access and better XRPL infrastructure turn into direct demand for the XRP token.
‼️EVERNORTH OFFICIALLY BEGINS TRADING ON OCT. 8‼️
With over 473M XRP in custody, this will make Evernorth the LARGEST traded pure-play XRP treasury company.✅
Documented.📝👇 pic.twitter.com/G3LRZla6Ec
— SMQKE (@SMQKEDQG) October 6, 2026
Supercharge Your Trading in 2026 With BloFin AI Trading Bots XRP Technical Setup: Is $1.53 the Level That Confirms an XRP Breakout?
XRPUSDT Chart 1D
Crypto analyst Ali Martinez says a four-hour close above roughly $1.53 could signal a bigger move, with $1.62 as the next target. At around $1.50, XRP has not yet met that condition.
A brief spike through resistance would not prove that buyers have accepted higher prices. A stronger breakout would mean sustained trading above $1.53, backed by rising spot volume.
The wider chart shows why $1.53 matters. Since late September, XRP has traded between about $1.45 and $1.55 on the four-hour chart. On the daily chart, it has been capped near $1.61 since February, while its 200-day moving average sits near $1.38. Daily volume stands near $1.9 billion.
Ripple News Today: Whale Balances and Derivatives Point to Cautious Positioning
Open Interest On Binance CryptoQuant
Large-holder balances showed little change over the previous week, according to the primary source’s review of market activity. That lack of movement offers little evidence that whales were building positions ahead of the listing or upgrades.
CryptoQuant analyst R3N put Binance XRP open interest at about $516.6 million. That was above 2026 lows but well below the more than $1.3 billion recorded around October 2025, indicating a less leveraged and more cautious market. Lower leverage can reduce immediate liquidation pressure, but it also shows that traders were not positioning aggressively for the catalyst window.
The analytical question is no longer whether the calendar contains potential catalysts; it is whether price, spot activity, and on-chain participation confirm that investors are responding. Institutional XRP demand would be more persuasive if it appeared as measurable token buying or sustained network use, rather than access to an equity that holds the asset.
Market Intelligence: Crypto Analyst Predicts Best New Crypto to Hodl
XRP Scenarios: Conditional Upside and the Risk of No Follow-Through
XRPUSDT Chart 1d
Bull scenario: A four-hour close above roughly $1.53 would support the technical setup toward the cited $1.62 level. That case would strengthen if Evernorth’s XRPN debut and the XRPL upgrades proceed as expected and are followed by evidence of fresh spot demand. The BatchV1_1 upgrade’s potential for grouped transactions and the PermissionDelegationV1_1 activation window provide relevant infrastructure context, but neither guarantees token buying.
Bear scenario: Validator support could fall below the required threshold, resetting an upgrade’s activation clock. The primary source cautions that both activation dates depend on support holding; a delayed upgrade would weaken the near-term catalyst narrative. The Evernorth shareholder approval and planned XRPN listing establish a route to public-market exposure, not automatic spot demand.
If whales and derivatives traders stay quiet after the events, the market may treat them as infrastructure upgrades rather than a new source of XRP buyers.
For Ripple news to shift the price, XRP requires a definite breakout. Ripple faces a busy week, yet the market must still provide confirmation.
DISCOVER: Best Meme Coins to Buy in 2026
next
The post Ripple News: Why $1.53 Matters for the Token’s Next Move appeared first on Coinspeaker.
Ripple News: Why $1.53 Matters for the Token’s Next Move
In Ripple news this week, XRP traded near $1.50 on Tuesday, October 6, ahead of a packed catalyst calendar. Evernorth is set to start trading on Nasdaq as XRPN on Thursday, October 8. Two XRP Ledger upgrades, PermissionDelegationV1_1 and BatchV1_1, could activate around October 8 and 9 if validator support holds.
Crypto sentiment scores sit at 62 out of 100, in bullish territory. Yet whale balances and derivatives positions remain quiet, suggesting traders are waiting for confirmation rather than betting ahead of the events. The real test is whether institutional access and better XRPL infrastructure turn into direct demand for the XRP token.
‼️EVERNORTH OFFICIALLY BEGINS TRADING ON OCT. 8‼️
With over 473M XRP in custody, this will make Evernorth the LARGEST traded pure-play XRP treasury company.✅
Documented.📝👇 pic.twitter.com/G3LRZla6Ec
— SMQKE (@SMQKEDQG) October 6, 2026
Supercharge Your Trading in 2026 With BloFin AI Trading Bots XRP Technical Setup: Is $1.53 the Level That Confirms an XRP Breakout?
XRPUSDT Chart 1D
Crypto analyst Ali Martinez says a four-hour close above roughly $1.53 could signal a bigger move, with $1.62 as the next target. At around $1.50, XRP has not yet met that condition.
A brief spike through resistance would not prove that buyers have accepted higher prices. A stronger breakout would mean sustained trading above $1.53, backed by rising spot volume.
The wider chart shows why $1.53 matters. Since late September, XRP has traded between about $1.45 and $1.55 on the four-hour chart. On the daily chart, it has been capped near $1.61 since February, while its 200-day moving average sits near $1.38. Daily volume stands near $1.9 billion.
Ripple News Today: Whale Balances and Derivatives Point to Cautious Positioning
Open Interest On Binance CryptoQuant
Large-holder balances showed little change over the previous week, according to the primary source’s review of market activity. That lack of movement offers little evidence that whales were building positions ahead of the listing or upgrades.
CryptoQuant analyst R3N put Binance XRP open interest at about $516.6 million. That was above 2026 lows but well below the more than $1.3 billion recorded around October 2025, indicating a less leveraged and more cautious market. Lower leverage can reduce immediate liquidation pressure, but it also shows that traders were not positioning aggressively for the catalyst window.
The analytical question is no longer whether the calendar contains potential catalysts; it is whether price, spot activity, and on-chain participation confirm that investors are responding. Institutional XRP demand would be more persuasive if it appeared as measurable token buying or sustained network use, rather than access to an equity that holds the asset.
Market Intelligence: Crypto Analyst Predicts Best New Crypto to Hodl
XRP Scenarios: Conditional Upside and the Risk of No Follow-Through
XRPUSDT Chart 1d
Bull scenario: A four-hour close above roughly $1.53 would support the technical setup toward the cited $1.62 level. That case would strengthen if Evernorth’s XRPN debut and the XRPL upgrades proceed as expected and are followed by evidence of fresh spot demand. The BatchV1_1 upgrade’s potential for grouped transactions and the PermissionDelegationV1_1 activation window provide relevant infrastructure context, but neither guarantees token buying.
Bear scenario: Validator support could fall below the required threshold, resetting an upgrade’s activation clock. The primary source cautions that both activation dates depend on support holding; a delayed upgrade would weaken the near-term catalyst narrative. The Evernorth shareholder approval and planned XRPN listing establish a route to public-market exposure, not automatic spot demand.
If whales and derivatives traders stay quiet after the events, the market may treat them as infrastructure upgrades rather than a new source of XRP buyers.
For Ripple news to shift the price, XRP requires a definite breakout. Ripple faces a busy week, yet the market must still provide confirmation.
DISCOVER: Best Meme Coins to Buy in 2026
next
The post Ripple News: Why $1.53 Matters for the Token’s Next Move appeared first on Coinspeaker.
Crypto sentiment scores sit at 62 out of 100, in bullish territory. Yet whale balances and derivatives positions remain quiet, suggesting traders are waiting for confirmation rather than betting ahead of the events. The real test is whether institutional access and better XRPL infrastructure turn into direct demand for the XRP token.
‼️EVERNORTH OFFICIALLY BEGINS TRADING ON OCT. 8‼️
With over 473M XRP in custody, this will make Evernorth the LARGEST traded pure-play XRP treasury company.✅
Documented.📝👇 pic.twitter.com/G3LRZla6Ec
— SMQKE (@SMQKEDQG) October 6, 2026
Supercharge Your Trading in 2026 With BloFin AI Trading Bots XRP Technical Setup: Is $1.53 the Level That Confirms an XRP Breakout?
XRPUSDT Chart 1D
Crypto analyst Ali Martinez says a four-hour close above roughly $1.53 could signal a bigger move, with $1.62 as the next target. At around $1.50, XRP has not yet met that condition.
A brief spike through resistance would not prove that buyers have accepted higher prices. A stronger breakout would mean sustained trading above $1.53, backed by rising spot volume.
The wider chart shows why $1.53 matters. Since late September, XRP has traded between about $1.45 and $1.55 on the four-hour chart. On the daily chart, it has been capped near $1.61 since February, while its 200-day moving average sits near $1.38. Daily volume stands near $1.9 billion.
Ripple News Today: Whale Balances and Derivatives Point to Cautious Positioning
Open Interest On Binance CryptoQuant
Large-holder balances showed little change over the previous week, according to the primary source’s review of market activity. That lack of movement offers little evidence that whales were building positions ahead of the listing or upgrades.
CryptoQuant analyst R3N put Binance XRP open interest at about $516.6 million. That was above 2026 lows but well below the more than $1.3 billion recorded around October 2025, indicating a less leveraged and more cautious market. Lower leverage can reduce immediate liquidation pressure, but it also shows that traders were not positioning aggressively for the catalyst window.
The analytical question is no longer whether the calendar contains potential catalysts; it is whether price, spot activity, and on-chain participation confirm that investors are responding. Institutional XRP demand would be more persuasive if it appeared as measurable token buying or sustained network use, rather than access to an equity that holds the asset.
Market Intelligence: Crypto Analyst Predicts Best New Crypto to Hodl
XRP Scenarios: Conditional Upside and the Risk of No Follow-Through
XRPUSDT Chart 1d
Bull scenario: A four-hour close above roughly $1.53 would support the technical setup toward the cited $1.62 level. That case would strengthen if Evernorth’s XRPN debut and the XRPL upgrades proceed as expected and are followed by evidence of fresh spot demand. The BatchV1_1 upgrade’s potential for grouped transactions and the PermissionDelegationV1_1 activation window provide relevant infrastructure context, but neither guarantees token buying.
Bear scenario: Validator support could fall below the required threshold, resetting an upgrade’s activation clock. The primary source cautions that both activation dates depend on support holding; a delayed upgrade would weaken the near-term catalyst narrative. The Evernorth shareholder approval and planned XRPN listing establish a route to public-market exposure, not automatic spot demand.
If whales and derivatives traders stay quiet after the events, the market may treat them as infrastructure upgrades rather than a new source of XRP buyers.
For Ripple news to shift the price, XRP requires a definite breakout. Ripple faces a busy week, yet the market must still provide confirmation.
DISCOVER: Best Meme Coins to Buy in 2026
next
The post Ripple News: Why $1.53 Matters for the Token’s Next Move appeared first on Coinspeaker.
229
·
--
ບົດຄວາມ
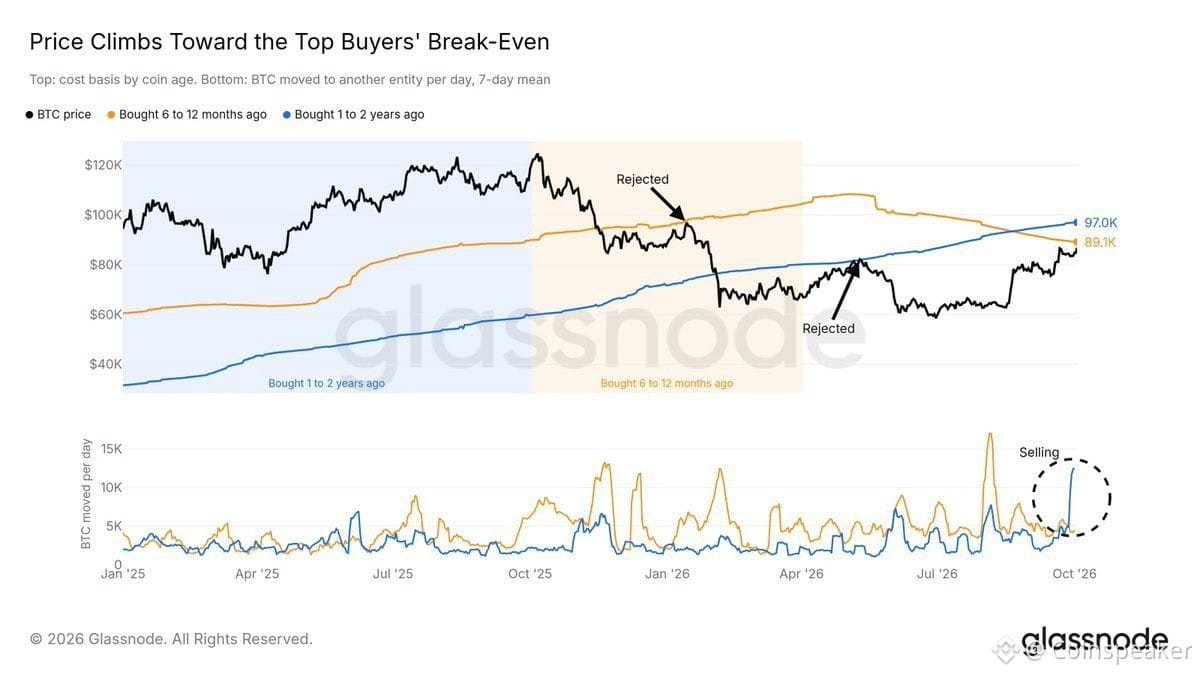
Bitcoin Price Forecast: Strategy Posts $21Billion Gain in Q3, Will Saylor Sell Again?Bitcoin trades near $85,356 on October 6, down about 0.6% over 24 hours. It remains below the $87,000–$87,400 zone that capped its recent rallies. Strategy’s record Q3 gain has added a new question to the short-term Bitcoin price forecast: does a strong quarter mean Michael Saylor is getting ready to sell, or does the latest data point the other way?
No. Strategy reported a $21 billion gain on its digital assets for the quarter ended September 30, after Bitcoin rose about 44% in Q3. The gain is unrealized. Fair-value accounting runs the rise in Bitcoin’s price through earnings, ending four straight quarters of losses.
The company’s latest moves point to buying, not selling. Last week, Strategy bought 334 BTC, worth about $29 million, and repurchased $176 million of its STRC preferred shares. As of October 4, it held 848,000 BTC, worth roughly $72 billion at today’s price, plus $5.7 billion in cash and other U.S. dollar assets.
The wider market is less clear. Investors are weighing softer U.S. jobs data against higher Treasury yields and rising oil prices.
Strategy reports a $21 billion gain on digital assets in Q3 2026. Last week, we acquired 334 $BTC and repurchased $176M of $STRC. As of 10/4/26, we hold 848,000 BTC and $5.7B of USD Assets. $MSTR https://t.co/jvwiJahdMm
— Michael Saylor (@saylor) October 5, 2026
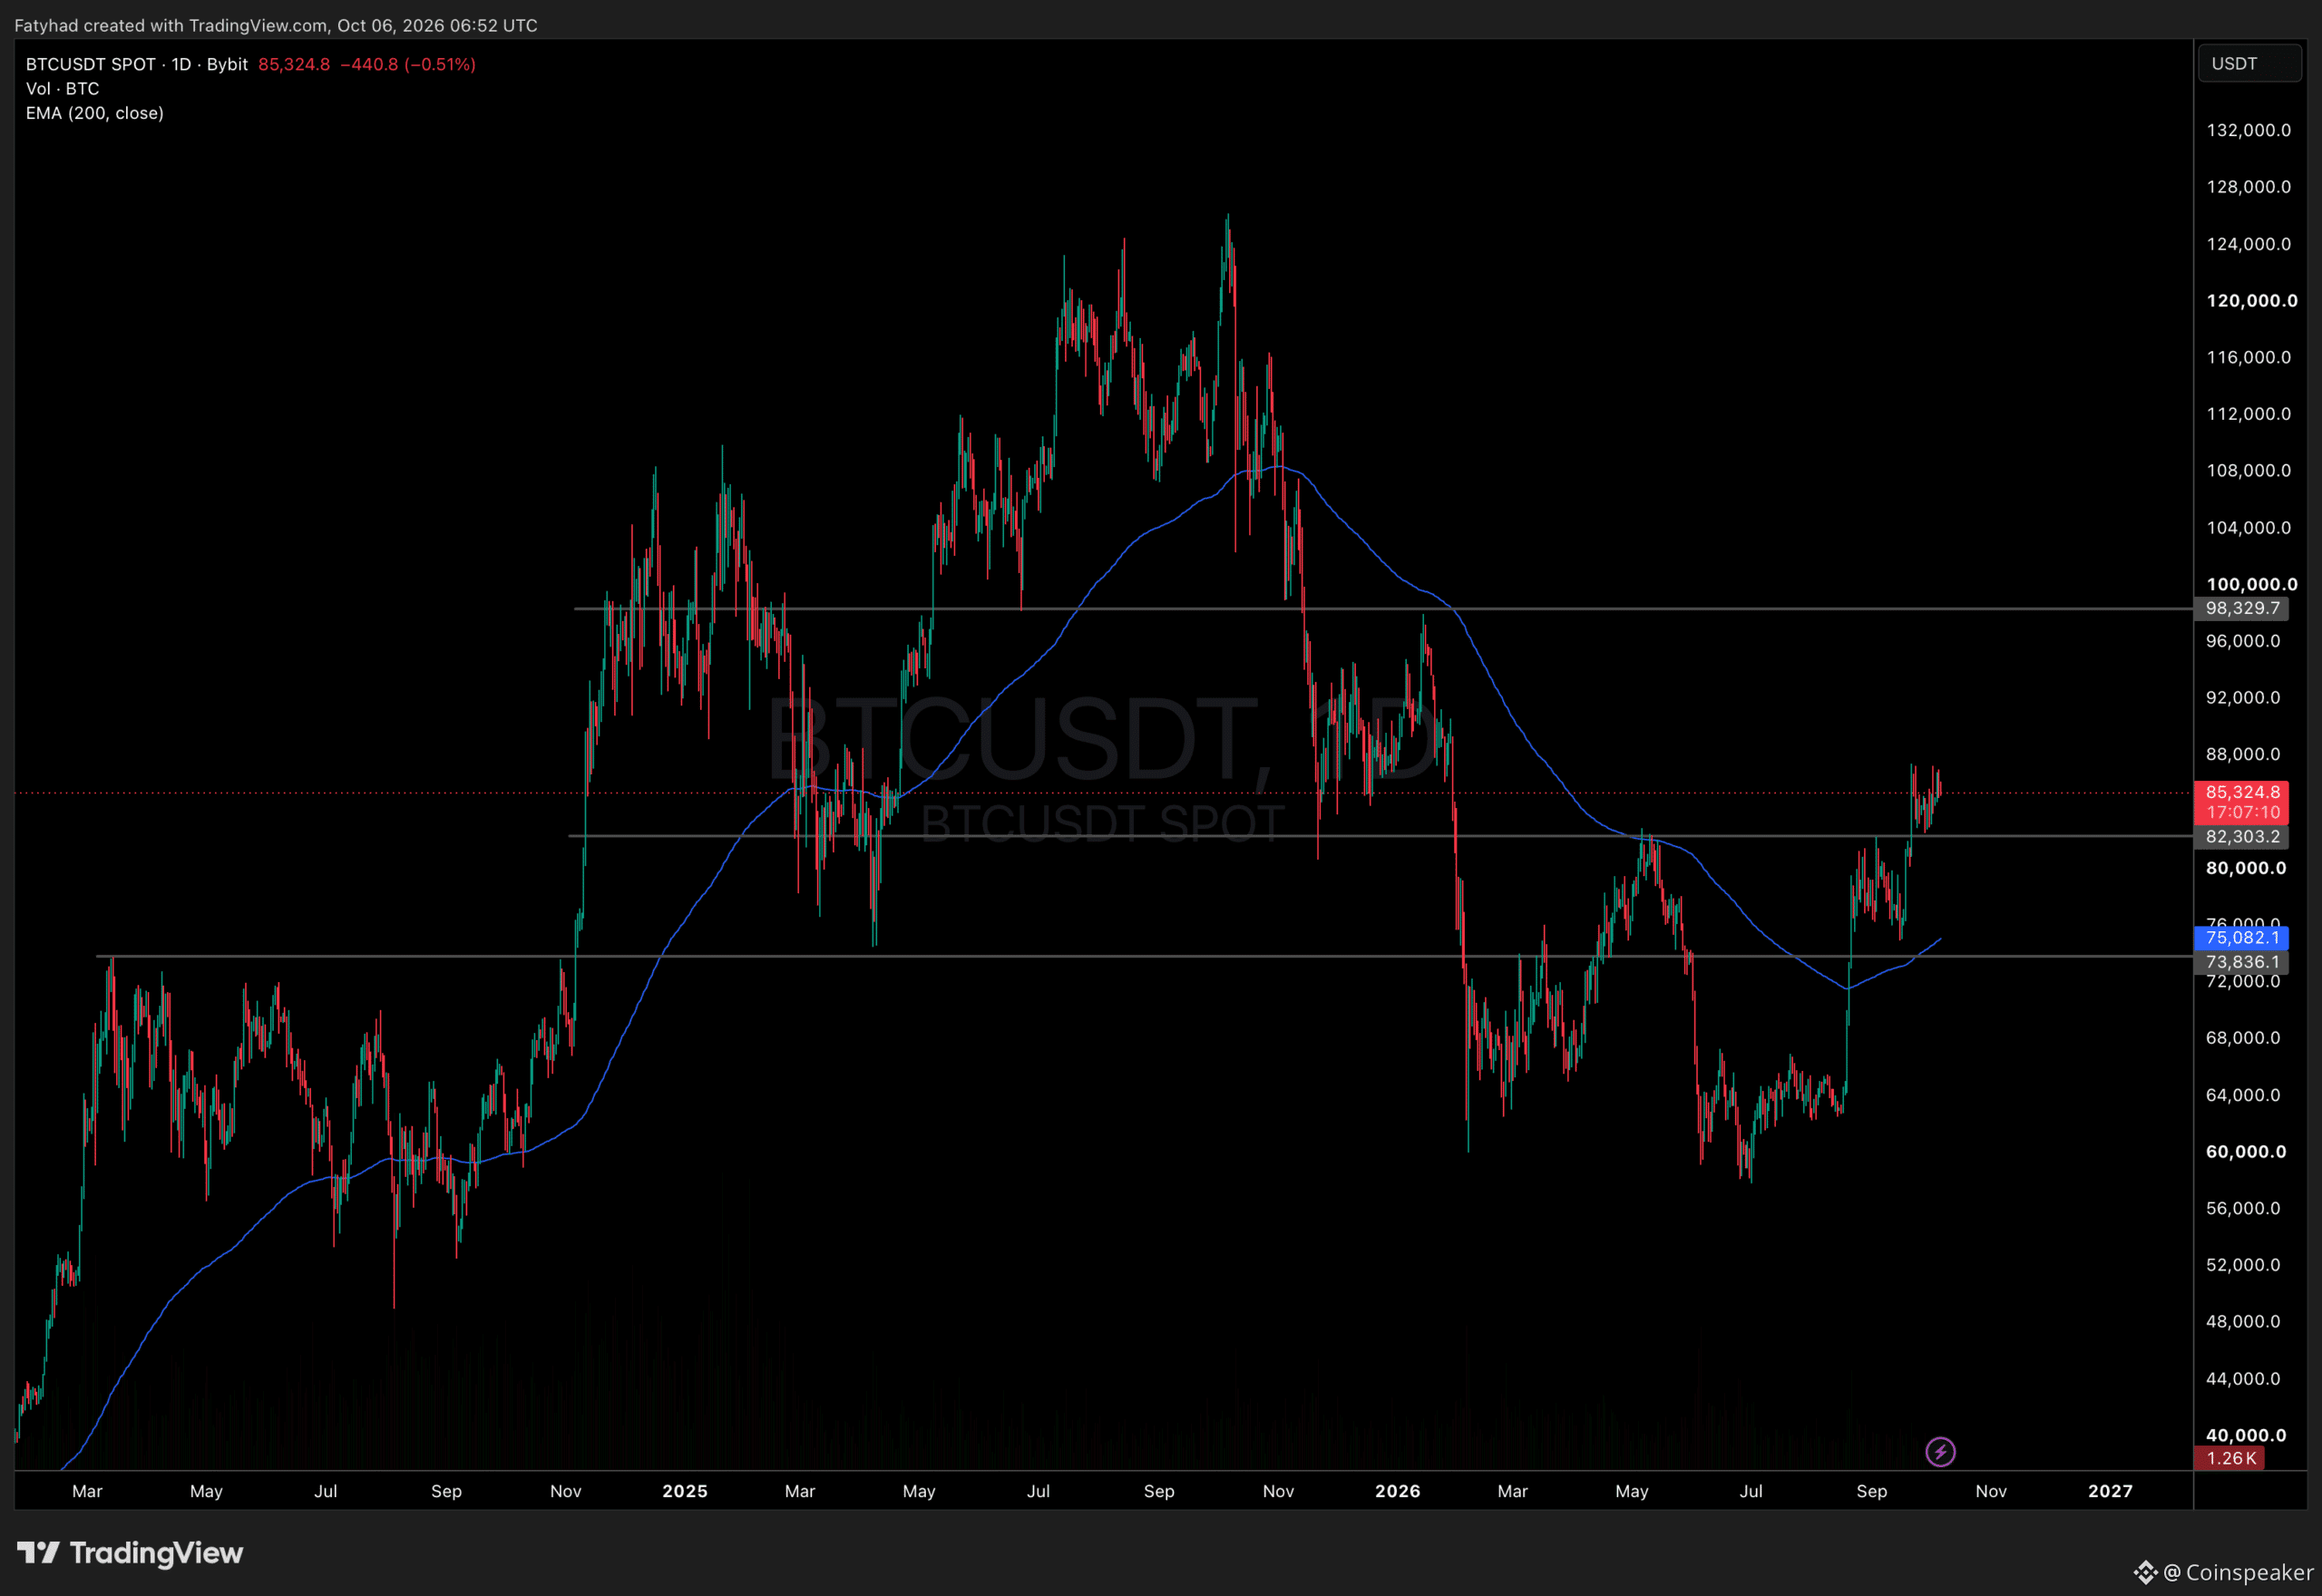
Join Coinspeaker’s $1,000 Prize Drop on Bybit Bitcoin Price Forecast: Can Bitcoin Price Hit $87,990 This Week?
BTCUSDT Chart 1D TradingView
Bitcoin sits about 2% below $87,000 and 2.4% below its recent high near $87,400. Daily volume rose about 31% to $26.3 billion.
The four-hour chart shows a clear range. Bitcoin has stalled near $87,000 three times since September 22, while holding support near $83,000 to $84,000.
Two levels matter most below the current price. First is $84,714, the average cost basis of U.S. spot Bitcoin ETF buyers, which one forecast treats as a key pivot. Next is $83,900, then $82,500.
That same forecast projects $87,990 within five days. Projections like this are not guarantees.
The Federal Reserve’s September meeting minutes, due October 7, are the next catalyst.
Market Intelligence: Crypto Analyst Predicts Best New Crypto to Hodl
Bitcoin Hyper Presale Nears $33.6M as BTC Tests $87,400
Bitcoin’s chart only turns bullish if it breaks the $87,000–$87,400 resistance zone. Until then, upside is conditional, and even a breakout would not guarantee a smooth run higher. That has some traders looking beyond BTC itself toward Bitcoin infrastructure projects, though early-stage tokens carry risks that established assets do not.
Bitcoin Hyper ($HYPER) is a Bitcoin Layer 2 project built on the Solana Virtual Machine (SVM). Its stated features include a decentralized canonical bridge for moving BTC and low-latency transaction processing. The pitch is simple: faster, cheaper smart contracts within the Bitcoin ecosystem.
The presale is currently priced at $HYPER at $0.0136872. The project reports $33,174,074 raised, close to its $33,603,059 target for the current stage, after which the price is set to rise. It also advertises staking rewards of up to 35% and lists audits from Coinsult and SpyWolf.
Its Decentralized Canonical Bridge aims to move BTC across chains without sacrificing Bitcoin’s underlying security model, addressing the network’s long-standing complaints of slow transactions and limited programmability.
Presale tokens carry no guarantee of listing performance or liquidity; investors should treat this as high-risk, early-stage exposure.
Those interested can research Bitcoin Hyper.
Don’t Miss Out Again: Join New Bitcoin Layer 2 Early Here next
The post Bitcoin Price Forecast: Strategy Posts $21Billion Gain in Q3, Will Saylor Sell Again? appeared first on Coinspeaker.
Bitcoin Price Forecast: Strategy Posts $21Billion Gain in Q3, Will Saylor Sell Again?
Bitcoin trades near $85,356 on October 6, down about 0.6% over 24 hours. It remains below the $87,000–$87,400 zone that capped its recent rallies. Strategy’s record Q3 gain has added a new question to the short-term Bitcoin price forecast: does a strong quarter mean Michael Saylor is getting ready to sell, or does the latest data point the other way?
No. Strategy reported a $21 billion gain on its digital assets for the quarter ended September 30, after Bitcoin rose about 44% in Q3. The gain is unrealized. Fair-value accounting runs the rise in Bitcoin’s price through earnings, ending four straight quarters of losses.
The company’s latest moves point to buying, not selling. Last week, Strategy bought 334 BTC, worth about $29 million, and repurchased $176 million of its STRC preferred shares. As of October 4, it held 848,000 BTC, worth roughly $72 billion at today’s price, plus $5.7 billion in cash and other U.S. dollar assets.
The wider market is less clear. Investors are weighing softer U.S. jobs data against higher Treasury yields and rising oil prices.
Strategy reports a $21 billion gain on digital assets in Q3 2026. Last week, we acquired 334 $BTC and repurchased $176M of $STRC. As of 10/4/26, we hold 848,000 BTC and $5.7B of USD Assets. $MSTR https://t.co/jvwiJahdMm
— Michael Saylor (@saylor) October 5, 2026
Join Coinspeaker’s $1,000 Prize Drop on Bybit Bitcoin Price Forecast: Can Bitcoin Price Hit $87,990 This Week?
BTCUSDT Chart 1D TradingView
Bitcoin sits about 2% below $87,000 and 2.4% below its recent high near $87,400. Daily volume rose about 31% to $26.3 billion.
The four-hour chart shows a clear range. Bitcoin has stalled near $87,000 three times since September 22, while holding support near $83,000 to $84,000.
Two levels matter most below the current price. First is $84,714, the average cost basis of U.S. spot Bitcoin ETF buyers, which one forecast treats as a key pivot. Next is $83,900, then $82,500.
That same forecast projects $87,990 within five days. Projections like this are not guarantees.
The Federal Reserve’s September meeting minutes, due October 7, are the next catalyst.
Market Intelligence: Crypto Analyst Predicts Best New Crypto to Hodl
Bitcoin Hyper Presale Nears $33.6M as BTC Tests $87,400
Bitcoin’s chart only turns bullish if it breaks the $87,000–$87,400 resistance zone. Until then, upside is conditional, and even a breakout would not guarantee a smooth run higher. That has some traders looking beyond BTC itself toward Bitcoin infrastructure projects, though early-stage tokens carry risks that established assets do not.
Bitcoin Hyper ($HYPER) is a Bitcoin Layer 2 project built on the Solana Virtual Machine (SVM). Its stated features include a decentralized canonical bridge for moving BTC and low-latency transaction processing. The pitch is simple: faster, cheaper smart contracts within the Bitcoin ecosystem.
The presale is currently priced at $HYPER at $0.0136872. The project reports $33,174,074 raised, close to its $33,603,059 target for the current stage, after which the price is set to rise. It also advertises staking rewards of up to 35% and lists audits from Coinsult and SpyWolf.
Its Decentralized Canonical Bridge aims to move BTC across chains without sacrificing Bitcoin’s underlying security model, addressing the network’s long-standing complaints of slow transactions and limited programmability.
Presale tokens carry no guarantee of listing performance or liquidity; investors should treat this as high-risk, early-stage exposure.
Those interested can research Bitcoin Hyper.
Don’t Miss Out Again: Join New Bitcoin Layer 2 Early Here next
The post Bitcoin Price Forecast: Strategy Posts $21Billion Gain in Q3, Will Saylor Sell Again? appeared first on Coinspeaker.
No. Strategy reported a $21 billion gain on its digital assets for the quarter ended September 30, after Bitcoin rose about 44% in Q3. The gain is unrealized. Fair-value accounting runs the rise in Bitcoin’s price through earnings, ending four straight quarters of losses.
The company’s latest moves point to buying, not selling. Last week, Strategy bought 334 BTC, worth about $29 million, and repurchased $176 million of its STRC preferred shares. As of October 4, it held 848,000 BTC, worth roughly $72 billion at today’s price, plus $5.7 billion in cash and other U.S. dollar assets.
The wider market is less clear. Investors are weighing softer U.S. jobs data against higher Treasury yields and rising oil prices.
Strategy reports a $21 billion gain on digital assets in Q3 2026. Last week, we acquired 334 $BTC and repurchased $176M of $STRC. As of 10/4/26, we hold 848,000 BTC and $5.7B of USD Assets. $MSTR https://t.co/jvwiJahdMm
— Michael Saylor (@saylor) October 5, 2026
Join Coinspeaker’s $1,000 Prize Drop on Bybit Bitcoin Price Forecast: Can Bitcoin Price Hit $87,990 This Week?
BTCUSDT Chart 1D TradingView
Bitcoin sits about 2% below $87,000 and 2.4% below its recent high near $87,400. Daily volume rose about 31% to $26.3 billion.
The four-hour chart shows a clear range. Bitcoin has stalled near $87,000 three times since September 22, while holding support near $83,000 to $84,000.
Two levels matter most below the current price. First is $84,714, the average cost basis of U.S. spot Bitcoin ETF buyers, which one forecast treats as a key pivot. Next is $83,900, then $82,500.
That same forecast projects $87,990 within five days. Projections like this are not guarantees.
The Federal Reserve’s September meeting minutes, due October 7, are the next catalyst.
Market Intelligence: Crypto Analyst Predicts Best New Crypto to Hodl
Bitcoin Hyper Presale Nears $33.6M as BTC Tests $87,400
Bitcoin’s chart only turns bullish if it breaks the $87,000–$87,400 resistance zone. Until then, upside is conditional, and even a breakout would not guarantee a smooth run higher. That has some traders looking beyond BTC itself toward Bitcoin infrastructure projects, though early-stage tokens carry risks that established assets do not.
Bitcoin Hyper ($HYPER) is a Bitcoin Layer 2 project built on the Solana Virtual Machine (SVM). Its stated features include a decentralized canonical bridge for moving BTC and low-latency transaction processing. The pitch is simple: faster, cheaper smart contracts within the Bitcoin ecosystem.
The presale is currently priced at $HYPER at $0.0136872. The project reports $33,174,074 raised, close to its $33,603,059 target for the current stage, after which the price is set to rise. It also advertises staking rewards of up to 35% and lists audits from Coinsult and SpyWolf.
Its Decentralized Canonical Bridge aims to move BTC across chains without sacrificing Bitcoin’s underlying security model, addressing the network’s long-standing complaints of slow transactions and limited programmability.
Presale tokens carry no guarantee of listing performance or liquidity; investors should treat this as high-risk, early-stage exposure.
Those interested can research Bitcoin Hyper.
Don’t Miss Out Again: Join New Bitcoin Layer 2 Early Here next
The post Bitcoin Price Forecast: Strategy Posts $21Billion Gain in Q3, Will Saylor Sell Again? appeared first on Coinspeaker.
45
·
--
ບົດຄວາມ
AI Predicts ADA As an 11% Surge Catches Traders Off GuardCardano jumped 11% on Monday. Nobody can point to why. No partnership announcement, no upgrade, and no listing. ADA simply outperformed every major altcoin while Bitcoin got rejected at $87,000 for the second time in days. AI Predicts ADA holds this move better than a typical news pump because a rally without a catalyst is usually built on positioning rather than headlines.
ADA trades at $0.2724, up 11.1% over 24 hours. The 24-hour range runs from $0.2442 to $0.2749, with $1.11 billion in volume and a market cap of $10.23 billion. The context supports the rotation reading. Bitcoin hit $87,000 on Monday morning, then sellers pushed it back below $85,500. Bitcoin dominance sits at 59%, and the total market cap is $2.93 trillion.
News-driven moves have a predictable shape. Price spikes, early holders sell into the headline, and the gain fades within days. The catalyst is also the exit signal. A move with no identifiable trigger behaves differently. Buyers are acting on the chart, on rotation out of Bitcoin, or on positioning. None of those produces an obvious moment to sell.
ADA was not alone. FET gained 15%, VIRTUAL 12%, ENA 7.5%, and NEAR 5%. Capital moved down the risk curve while Bitcoin stalled at resistance.
$ADA finally waking up.
The breakout is done.
The retest looks clean.
Now I want to see expansion toward $0.48. pic.twitter.com/U1MYBX22Iz
— The Moon Show (@TheMoonShow) October 5, 2026
Sign Up With MergeX And Trade Crypto Is This Recovery Different From the Last Ones?
The time frames say yes. ADA is up 11.1% over seven days and 27.9% over thirty days. Those numbers are nearly identical to the 24-hour gain, which means this single day did most of the monthly work.
That is worth flagging, honestly. A month of grinding sideways followed by one vertical day is not the same as sustained accumulation. The longer view is harsher still. ADA remains down 68.4% over twelve months.
What has changed is the floor. ADA bottomed near $0.155 in July and has built a series of higher lows since. Monday’s move pushed it decisively above $0.2371, a level that capped price through most of 2023 and again this summer.
Perpetual open interest stands at $1.5 billion against a $10.23 billion market cap. That ratio is high enough that leverage will amplify whatever comes next, in either direction.
Market Intelligence: Crypto Analyst Predicts Best New Crypto to Hodl
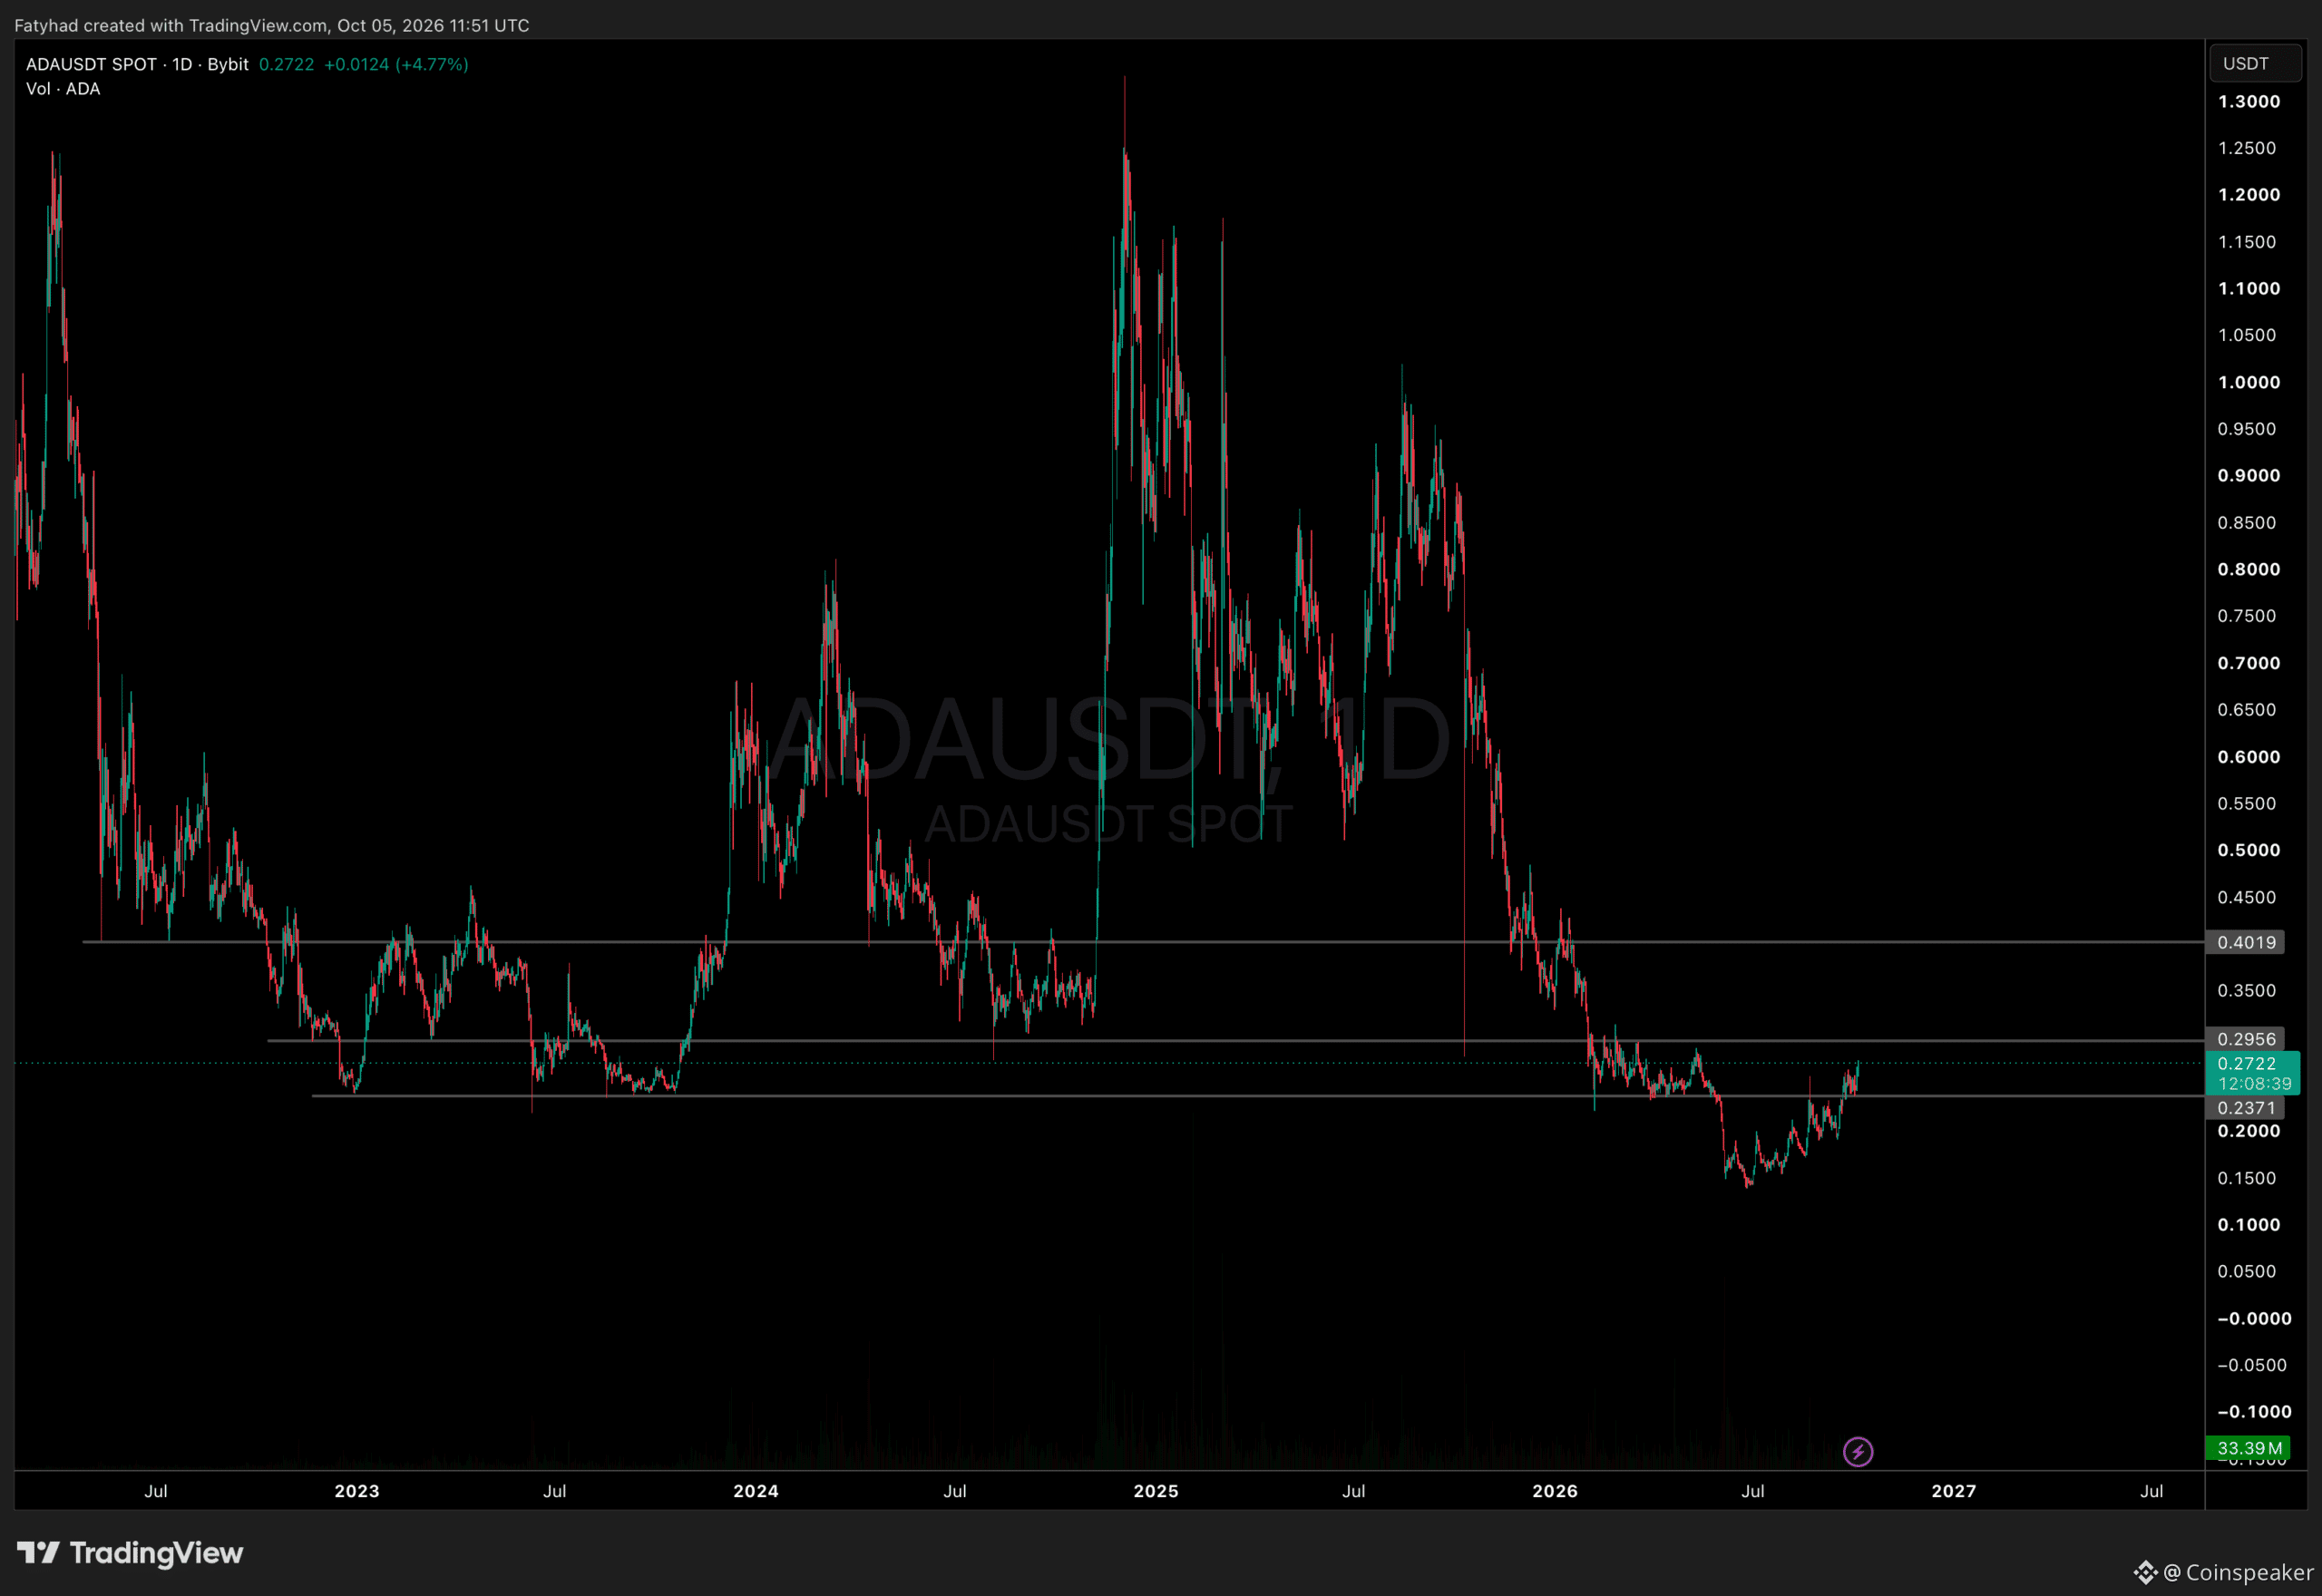
AI Predicts ADA Levels: Where Does This Stall?
ADAUSDT Chart 1D TradingView
The chart has a clean structure now, which it lacked three months ago. ADA closed above $0.2371 and is pressing toward the next barrier. Volume reached $1.11 billion, well above the quiet sessions that preceded this move.
AI Predicts ADA will be decided at these levels:
The floor: $0.2371. Reclaimed on this move. Daily closes above it keep the recovery intact.
The first ceiling: $0.2956. The level that stopped ADA in spring and again in June. It sits roughly 8% above spot.
The bigger target: $0.4019. The 2023 range high is the level that would confirm a real trend change. The immediate test is $0.2956. ADA has approached it twice this year without clearing it.
A rejection there sends the price back toward $0.2371, which would then prove whether old resistance has genuinely become support. Clearing it opens a gap with little overhead until $0.40.
Watch whether Bitcoin holds $87,000. The altcoin bid that drove Monday depends on Bitcoin stalling rather than falling.
DISCOVER: Best Meme Coins to Buy in 2026
Why Some ADA Traders Are Looking at LiquidChain Instead
Top Crypto Picks for 2026: Why LiquidChain Could Lead the Next Wave
Monday’s 11% move added roughly $1 billion to Cardano’s market value. That sounds large until you check the base. ADA’s market cap is $10.23 billion. Shifting a figure that size takes capital most rallies cannot summon. The token is still down 68.4% over twelve months, and recovering that gap requires buying on an entirely different scale.
That arithmetic is why some traders rotate further down the risk curve. Early-stage tokens carry no supply overhang to absorb first.
LiquidChain ($LIQUID) is one project drawing interest. It is a Layer 3 blockchain built to connect Bitcoin’s capital, Ethereum’s DeFi depth and Solana’s speed in one execution layer.
The pitch rests on two ideas. A Unified Liquidity Layer pools access across all three ecosystems. A Deploy-Once Architecture lets developers build once and reach each of them, instead of fragmenting across chains.
The $LIQUID token covers network fees and staking rewards. The presale is priced at $0.014962, with roughly $980,000 raised so far.
Early-stage infrastructure plays carry obvious risk. Those comfortable with that risk profile can research LiquidChain directly.
Layer 3 Is Already Here, Smart Money Knows It – Do You?
next
The post AI Predicts ADA as an 11% Surge Catches Traders Off Guard appeared first on Coinspeaker.
AI Predicts ADA As an 11% Surge Catches Traders Off Guard
Cardano jumped 11% on Monday. Nobody can point to why. No partnership announcement, no upgrade, and no listing. ADA simply outperformed every major altcoin while Bitcoin got rejected at $87,000 for the second time in days. AI Predicts ADA holds this move better than a typical news pump because a rally without a catalyst is usually built on positioning rather than headlines.
ADA trades at $0.2724, up 11.1% over 24 hours. The 24-hour range runs from $0.2442 to $0.2749, with $1.11 billion in volume and a market cap of $10.23 billion. The context supports the rotation reading. Bitcoin hit $87,000 on Monday morning, then sellers pushed it back below $85,500. Bitcoin dominance sits at 59%, and the total market cap is $2.93 trillion.
News-driven moves have a predictable shape. Price spikes, early holders sell into the headline, and the gain fades within days. The catalyst is also the exit signal. A move with no identifiable trigger behaves differently. Buyers are acting on the chart, on rotation out of Bitcoin, or on positioning. None of those produces an obvious moment to sell.
ADA was not alone. FET gained 15%, VIRTUAL 12%, ENA 7.5%, and NEAR 5%. Capital moved down the risk curve while Bitcoin stalled at resistance.
$ADA finally waking up.
The breakout is done.
The retest looks clean.
Now I want to see expansion toward $0.48. pic.twitter.com/U1MYBX22Iz
— The Moon Show (@TheMoonShow) October 5, 2026
Sign Up With MergeX And Trade Crypto Is This Recovery Different From the Last Ones?
The time frames say yes. ADA is up 11.1% over seven days and 27.9% over thirty days. Those numbers are nearly identical to the 24-hour gain, which means this single day did most of the monthly work.
That is worth flagging, honestly. A month of grinding sideways followed by one vertical day is not the same as sustained accumulation. The longer view is harsher still. ADA remains down 68.4% over twelve months.
What has changed is the floor. ADA bottomed near $0.155 in July and has built a series of higher lows since. Monday’s move pushed it decisively above $0.2371, a level that capped price through most of 2023 and again this summer.
Perpetual open interest stands at $1.5 billion against a $10.23 billion market cap. That ratio is high enough that leverage will amplify whatever comes next, in either direction.
Market Intelligence: Crypto Analyst Predicts Best New Crypto to Hodl
AI Predicts ADA Levels: Where Does This Stall?
ADAUSDT Chart 1D TradingView
The chart has a clean structure now, which it lacked three months ago. ADA closed above $0.2371 and is pressing toward the next barrier. Volume reached $1.11 billion, well above the quiet sessions that preceded this move.
AI Predicts ADA will be decided at these levels:
The floor: $0.2371. Reclaimed on this move. Daily closes above it keep the recovery intact.
The first ceiling: $0.2956. The level that stopped ADA in spring and again in June. It sits roughly 8% above spot.
The bigger target: $0.4019. The 2023 range high is the level that would confirm a real trend change. The immediate test is $0.2956. ADA has approached it twice this year without clearing it.
A rejection there sends the price back toward $0.2371, which would then prove whether old resistance has genuinely become support. Clearing it opens a gap with little overhead until $0.40.
Watch whether Bitcoin holds $87,000. The altcoin bid that drove Monday depends on Bitcoin stalling rather than falling.
DISCOVER: Best Meme Coins to Buy in 2026
Why Some ADA Traders Are Looking at LiquidChain Instead
Top Crypto Picks for 2026: Why LiquidChain Could Lead the Next Wave
Monday’s 11% move added roughly $1 billion to Cardano’s market value. That sounds large until you check the base. ADA’s market cap is $10.23 billion. Shifting a figure that size takes capital most rallies cannot summon. The token is still down 68.4% over twelve months, and recovering that gap requires buying on an entirely different scale.
That arithmetic is why some traders rotate further down the risk curve. Early-stage tokens carry no supply overhang to absorb first.
LiquidChain ($LIQUID) is one project drawing interest. It is a Layer 3 blockchain built to connect Bitcoin’s capital, Ethereum’s DeFi depth and Solana’s speed in one execution layer.
The pitch rests on two ideas. A Unified Liquidity Layer pools access across all three ecosystems. A Deploy-Once Architecture lets developers build once and reach each of them, instead of fragmenting across chains.
The $LIQUID token covers network fees and staking rewards. The presale is priced at $0.014962, with roughly $980,000 raised so far.
Early-stage infrastructure plays carry obvious risk. Those comfortable with that risk profile can research LiquidChain directly.
Layer 3 Is Already Here, Smart Money Knows It – Do You?
next
The post AI Predicts ADA as an 11% Surge Catches Traders Off Guard appeared first on Coinspeaker.
ADA trades at $0.2724, up 11.1% over 24 hours. The 24-hour range runs from $0.2442 to $0.2749, with $1.11 billion in volume and a market cap of $10.23 billion. The context supports the rotation reading. Bitcoin hit $87,000 on Monday morning, then sellers pushed it back below $85,500. Bitcoin dominance sits at 59%, and the total market cap is $2.93 trillion.
News-driven moves have a predictable shape. Price spikes, early holders sell into the headline, and the gain fades within days. The catalyst is also the exit signal. A move with no identifiable trigger behaves differently. Buyers are acting on the chart, on rotation out of Bitcoin, or on positioning. None of those produces an obvious moment to sell.
ADA was not alone. FET gained 15%, VIRTUAL 12%, ENA 7.5%, and NEAR 5%. Capital moved down the risk curve while Bitcoin stalled at resistance.
$ADA finally waking up.
The breakout is done.
The retest looks clean.
Now I want to see expansion toward $0.48. pic.twitter.com/U1MYBX22Iz
— The Moon Show (@TheMoonShow) October 5, 2026
Sign Up With MergeX And Trade Crypto Is This Recovery Different From the Last Ones?
The time frames say yes. ADA is up 11.1% over seven days and 27.9% over thirty days. Those numbers are nearly identical to the 24-hour gain, which means this single day did most of the monthly work.
That is worth flagging, honestly. A month of grinding sideways followed by one vertical day is not the same as sustained accumulation. The longer view is harsher still. ADA remains down 68.4% over twelve months.
What has changed is the floor. ADA bottomed near $0.155 in July and has built a series of higher lows since. Monday’s move pushed it decisively above $0.2371, a level that capped price through most of 2023 and again this summer.
Perpetual open interest stands at $1.5 billion against a $10.23 billion market cap. That ratio is high enough that leverage will amplify whatever comes next, in either direction.
Market Intelligence: Crypto Analyst Predicts Best New Crypto to Hodl
AI Predicts ADA Levels: Where Does This Stall?
ADAUSDT Chart 1D TradingView
The chart has a clean structure now, which it lacked three months ago. ADA closed above $0.2371 and is pressing toward the next barrier. Volume reached $1.11 billion, well above the quiet sessions that preceded this move.
AI Predicts ADA will be decided at these levels:
The floor: $0.2371. Reclaimed on this move. Daily closes above it keep the recovery intact.
The first ceiling: $0.2956. The level that stopped ADA in spring and again in June. It sits roughly 8% above spot.
The bigger target: $0.4019. The 2023 range high is the level that would confirm a real trend change. The immediate test is $0.2956. ADA has approached it twice this year without clearing it.
A rejection there sends the price back toward $0.2371, which would then prove whether old resistance has genuinely become support. Clearing it opens a gap with little overhead until $0.40.
Watch whether Bitcoin holds $87,000. The altcoin bid that drove Monday depends on Bitcoin stalling rather than falling.
DISCOVER: Best Meme Coins to Buy in 2026
Why Some ADA Traders Are Looking at LiquidChain Instead
Top Crypto Picks for 2026: Why LiquidChain Could Lead the Next Wave
Monday’s 11% move added roughly $1 billion to Cardano’s market value. That sounds large until you check the base. ADA’s market cap is $10.23 billion. Shifting a figure that size takes capital most rallies cannot summon. The token is still down 68.4% over twelve months, and recovering that gap requires buying on an entirely different scale.
That arithmetic is why some traders rotate further down the risk curve. Early-stage tokens carry no supply overhang to absorb first.
LiquidChain ($LIQUID) is one project drawing interest. It is a Layer 3 blockchain built to connect Bitcoin’s capital, Ethereum’s DeFi depth and Solana’s speed in one execution layer.
The pitch rests on two ideas. A Unified Liquidity Layer pools access across all three ecosystems. A Deploy-Once Architecture lets developers build once and reach each of them, instead of fragmenting across chains.
The $LIQUID token covers network fees and staking rewards. The presale is priced at $0.014962, with roughly $980,000 raised so far.
Early-stage infrastructure plays carry obvious risk. Those comfortable with that risk profile can research LiquidChain directly.
Layer 3 Is Already Here, Smart Money Knows It – Do You?
next
The post AI Predicts ADA as an 11% Surge Catches Traders Off Guard appeared first on Coinspeaker.
2
1.1k
·
--
ບົດຄວາມ
Claude AI Predicts BTC Path After the Monday Dump WarningAn analyst suggests Bitcoin tends to decline on Mondays following a rise on Sundays. The sample size is five weeks. Ali Martinez flagged the pattern on October 4, pointing to five consecutive Sunday-Monday pairs between August 29 and September 28. In each, Monday reversed Sunday’s direction.
Claude AI predicts BTC stays rangebound rather than dumping, because the chart signal behind the warning has a weaker record than the headline suggests. BTC trades near $86,044, up about 1.1% over 24 hours. Volume has jumped 81% to $22.2 billion, with a market cap of $1.72 trillion.
SUNDAY PUMP = MONDAY DUMP
1/6 🧵👇
— Ali Charts (@alicharts) October 4, 2026
Market Intelligence: Crypto Analyst Reveals Upcoming Coinbase Listings
How Strong Is Ali Martinez’s Sunday to Monday Pattern?
Weaker than five out of five implies. Five weeks is thirty-five trading days. Coin flips produce runs of five regularly, and the article notes the final Sunday gain was nearly flat. That makes the fifth data point marginal at best.
The second signal has more substance. Bitcoin’s four-hour chart flashed a TD Sequential sell signal. Comparable signals preceded declines of 1.74%, 4.37%, 3.11% and 1.96%.
Note what those numbers actually say. The average decline is roughly 2.8%. From $86,044, that is a move to about $83,600. This is a pullback thesis, not a crash thesis.
Ethereum and Solana flashed similar signals. Prior Solana declines reached 5.76%.
Bitcoin Price Cost
Bitcoin has been stuck in one place since September 22. The four-hour chart shows BTC trading between $86,500 and $87,500 for nearly two weeks. Both the warning and the Sunday gain happened inside that range.
A 2.8% decline from here does not break anything. It lands near $83,000, where a liquidation cluster sits, and that cluster is support rather than a trapdoor. The more interesting level is above. At $90,000, there is a major liquidation cluster of leveraged short positions. Forced closure would accelerate a move higher rather than slow it.
So the setup is asymmetric in a way that the Monday warning misses. Downside runs into support at $83,000. Upside runs into fuel at $90,000.
Claude AI Predicts BTC Levels: What Actually Breaks the Range?
BTCUSDT Price Chart 1D TradingView
Volume is the detail worth watching. It rose 81% in 24 hours while the price moved barely 1%. That combination usually precedes a resolution. Participation is building without direction, which rarely lasts.
Claude AI predicts BTC will be decided at these levels:
The ceiling: $87,500. The top of the two-week range. A daily close above it ends the consolidation.
The squeeze level: $90,000. The short liquidation cluster is the first genuine acceleration point.
The floor: $83,000. Where the TD Sequential target and the lower liquidation cluster meet. Below that, $82,000 is secondary support, with $75,000 as the deeper cluster.
The honest read is that both outcomes are live. A Monday pullback toward $83,000 fits the signals and changes nothing structurally. Watch $87,500 instead. Clearing it matters far more than whether Monday closes red.
Sign Up With MergeX And Trade Crypto The Ceiling Problem: Why Some Capital Rotates to Presales
Clearing $87,500 opens the path to $90,000. That is the bull case in this analysis, and it is roughly 4% from here.
Four percent is a real move. It is also a ceiling. Some market participants read capped upside as a reason to look past spot exposure toward infrastructure projects.
That shift carries a different risk profile. Early-stage tokens are not a leveraged version of Bitcoin. They are a separate bet with separate failure modes. A green week is not a due diligence shortcut.
Bitcoin Hyper ($HYPER) is one project drawing attention. It presents itself as a Bitcoin Layer 2 with Solana Virtual Machine integration. The pitch is smart contracts and faster, cheaper execution on top of Bitcoin.
Stated features include a decentralized canonical bridge for BTC transfers and low-latency Layer 2 processing. The project claims its SVM integration runs faster than Solana itself. That claim is the project’s own.
The presale is priced at $0.0136872. The project reports $33 million raised.
The core thesis is straightforward. Bitcoin settles slowly and lacks programmability. Bitcoin Hyper proposes a bridge and an execution layer to address both, while leaving Bitcoin’s security model intact.
Don’t Miss Out Again: Join New Bitcoin Layer 2 Early Here
Market Intelligence: Crypto Analyst Predicts Best Low-Cap Crypto
next
The post Claude AI Predicts BTC Path After the Monday Dump Warning appeared first on Coinspeaker.
Claude AI Predicts BTC Path After the Monday Dump Warning
An analyst suggests Bitcoin tends to decline on Mondays following a rise on Sundays. The sample size is five weeks. Ali Martinez flagged the pattern on October 4, pointing to five consecutive Sunday-Monday pairs between August 29 and September 28. In each, Monday reversed Sunday’s direction.
Claude AI predicts BTC stays rangebound rather than dumping, because the chart signal behind the warning has a weaker record than the headline suggests. BTC trades near $86,044, up about 1.1% over 24 hours. Volume has jumped 81% to $22.2 billion, with a market cap of $1.72 trillion.
SUNDAY PUMP = MONDAY DUMP
1/6 🧵👇
— Ali Charts (@alicharts) October 4, 2026
Market Intelligence: Crypto Analyst Reveals Upcoming Coinbase Listings
How Strong Is Ali Martinez’s Sunday to Monday Pattern?
Weaker than five out of five implies. Five weeks is thirty-five trading days. Coin flips produce runs of five regularly, and the article notes the final Sunday gain was nearly flat. That makes the fifth data point marginal at best.
The second signal has more substance. Bitcoin’s four-hour chart flashed a TD Sequential sell signal. Comparable signals preceded declines of 1.74%, 4.37%, 3.11% and 1.96%.
Note what those numbers actually say. The average decline is roughly 2.8%. From $86,044, that is a move to about $83,600. This is a pullback thesis, not a crash thesis.
Ethereum and Solana flashed similar signals. Prior Solana declines reached 5.76%.
Bitcoin Price Cost
Bitcoin has been stuck in one place since September 22. The four-hour chart shows BTC trading between $86,500 and $87,500 for nearly two weeks. Both the warning and the Sunday gain happened inside that range.
A 2.8% decline from here does not break anything. It lands near $83,000, where a liquidation cluster sits, and that cluster is support rather than a trapdoor. The more interesting level is above. At $90,000, there is a major liquidation cluster of leveraged short positions. Forced closure would accelerate a move higher rather than slow it.
So the setup is asymmetric in a way that the Monday warning misses. Downside runs into support at $83,000. Upside runs into fuel at $90,000.
Claude AI Predicts BTC Levels: What Actually Breaks the Range?
BTCUSDT Price Chart 1D TradingView
Volume is the detail worth watching. It rose 81% in 24 hours while the price moved barely 1%. That combination usually precedes a resolution. Participation is building without direction, which rarely lasts.
Claude AI predicts BTC will be decided at these levels:
The ceiling: $87,500. The top of the two-week range. A daily close above it ends the consolidation.
The squeeze level: $90,000. The short liquidation cluster is the first genuine acceleration point.
The floor: $83,000. Where the TD Sequential target and the lower liquidation cluster meet. Below that, $82,000 is secondary support, with $75,000 as the deeper cluster.
The honest read is that both outcomes are live. A Monday pullback toward $83,000 fits the signals and changes nothing structurally. Watch $87,500 instead. Clearing it matters far more than whether Monday closes red.
Sign Up With MergeX And Trade Crypto The Ceiling Problem: Why Some Capital Rotates to Presales
Clearing $87,500 opens the path to $90,000. That is the bull case in this analysis, and it is roughly 4% from here.
Four percent is a real move. It is also a ceiling. Some market participants read capped upside as a reason to look past spot exposure toward infrastructure projects.
That shift carries a different risk profile. Early-stage tokens are not a leveraged version of Bitcoin. They are a separate bet with separate failure modes. A green week is not a due diligence shortcut.
Bitcoin Hyper ($HYPER) is one project drawing attention. It presents itself as a Bitcoin Layer 2 with Solana Virtual Machine integration. The pitch is smart contracts and faster, cheaper execution on top of Bitcoin.
Stated features include a decentralized canonical bridge for BTC transfers and low-latency Layer 2 processing. The project claims its SVM integration runs faster than Solana itself. That claim is the project’s own.
The presale is priced at $0.0136872. The project reports $33 million raised.
The core thesis is straightforward. Bitcoin settles slowly and lacks programmability. Bitcoin Hyper proposes a bridge and an execution layer to address both, while leaving Bitcoin’s security model intact.
Don’t Miss Out Again: Join New Bitcoin Layer 2 Early Here
Market Intelligence: Crypto Analyst Predicts Best Low-Cap Crypto
next
The post Claude AI Predicts BTC Path After the Monday Dump Warning appeared first on Coinspeaker.
Claude AI predicts BTC stays rangebound rather than dumping, because the chart signal behind the warning has a weaker record than the headline suggests. BTC trades near $86,044, up about 1.1% over 24 hours. Volume has jumped 81% to $22.2 billion, with a market cap of $1.72 trillion.
SUNDAY PUMP = MONDAY DUMP
1/6 🧵👇
— Ali Charts (@alicharts) October 4, 2026
Market Intelligence: Crypto Analyst Reveals Upcoming Coinbase Listings
How Strong Is Ali Martinez’s Sunday to Monday Pattern?
Weaker than five out of five implies. Five weeks is thirty-five trading days. Coin flips produce runs of five regularly, and the article notes the final Sunday gain was nearly flat. That makes the fifth data point marginal at best.
The second signal has more substance. Bitcoin’s four-hour chart flashed a TD Sequential sell signal. Comparable signals preceded declines of 1.74%, 4.37%, 3.11% and 1.96%.
Note what those numbers actually say. The average decline is roughly 2.8%. From $86,044, that is a move to about $83,600. This is a pullback thesis, not a crash thesis.
Ethereum and Solana flashed similar signals. Prior Solana declines reached 5.76%.
Bitcoin Price Cost
Bitcoin has been stuck in one place since September 22. The four-hour chart shows BTC trading between $86,500 and $87,500 for nearly two weeks. Both the warning and the Sunday gain happened inside that range.
A 2.8% decline from here does not break anything. It lands near $83,000, where a liquidation cluster sits, and that cluster is support rather than a trapdoor. The more interesting level is above. At $90,000, there is a major liquidation cluster of leveraged short positions. Forced closure would accelerate a move higher rather than slow it.
So the setup is asymmetric in a way that the Monday warning misses. Downside runs into support at $83,000. Upside runs into fuel at $90,000.
Claude AI Predicts BTC Levels: What Actually Breaks the Range?
BTCUSDT Price Chart 1D TradingView
Volume is the detail worth watching. It rose 81% in 24 hours while the price moved barely 1%. That combination usually precedes a resolution. Participation is building without direction, which rarely lasts.
Claude AI predicts BTC will be decided at these levels:
The ceiling: $87,500. The top of the two-week range. A daily close above it ends the consolidation.
The squeeze level: $90,000. The short liquidation cluster is the first genuine acceleration point.
The floor: $83,000. Where the TD Sequential target and the lower liquidation cluster meet. Below that, $82,000 is secondary support, with $75,000 as the deeper cluster.
The honest read is that both outcomes are live. A Monday pullback toward $83,000 fits the signals and changes nothing structurally. Watch $87,500 instead. Clearing it matters far more than whether Monday closes red.
Sign Up With MergeX And Trade Crypto The Ceiling Problem: Why Some Capital Rotates to Presales
Clearing $87,500 opens the path to $90,000. That is the bull case in this analysis, and it is roughly 4% from here.
Four percent is a real move. It is also a ceiling. Some market participants read capped upside as a reason to look past spot exposure toward infrastructure projects.
That shift carries a different risk profile. Early-stage tokens are not a leveraged version of Bitcoin. They are a separate bet with separate failure modes. A green week is not a due diligence shortcut.
Bitcoin Hyper ($HYPER) is one project drawing attention. It presents itself as a Bitcoin Layer 2 with Solana Virtual Machine integration. The pitch is smart contracts and faster, cheaper execution on top of Bitcoin.
Stated features include a decentralized canonical bridge for BTC transfers and low-latency Layer 2 processing. The project claims its SVM integration runs faster than Solana itself. That claim is the project’s own.
The presale is priced at $0.0136872. The project reports $33 million raised.
The core thesis is straightforward. Bitcoin settles slowly and lacks programmability. Bitcoin Hyper proposes a bridge and an execution layer to address both, while leaving Bitcoin’s security model intact.
Don’t Miss Out Again: Join New Bitcoin Layer 2 Early Here
Market Intelligence: Crypto Analyst Predicts Best Low-Cap Crypto
next
The post Claude AI Predicts BTC Path After the Monday Dump Warning appeared first on Coinspeaker.
248
·
--
ບົດຄວາມ
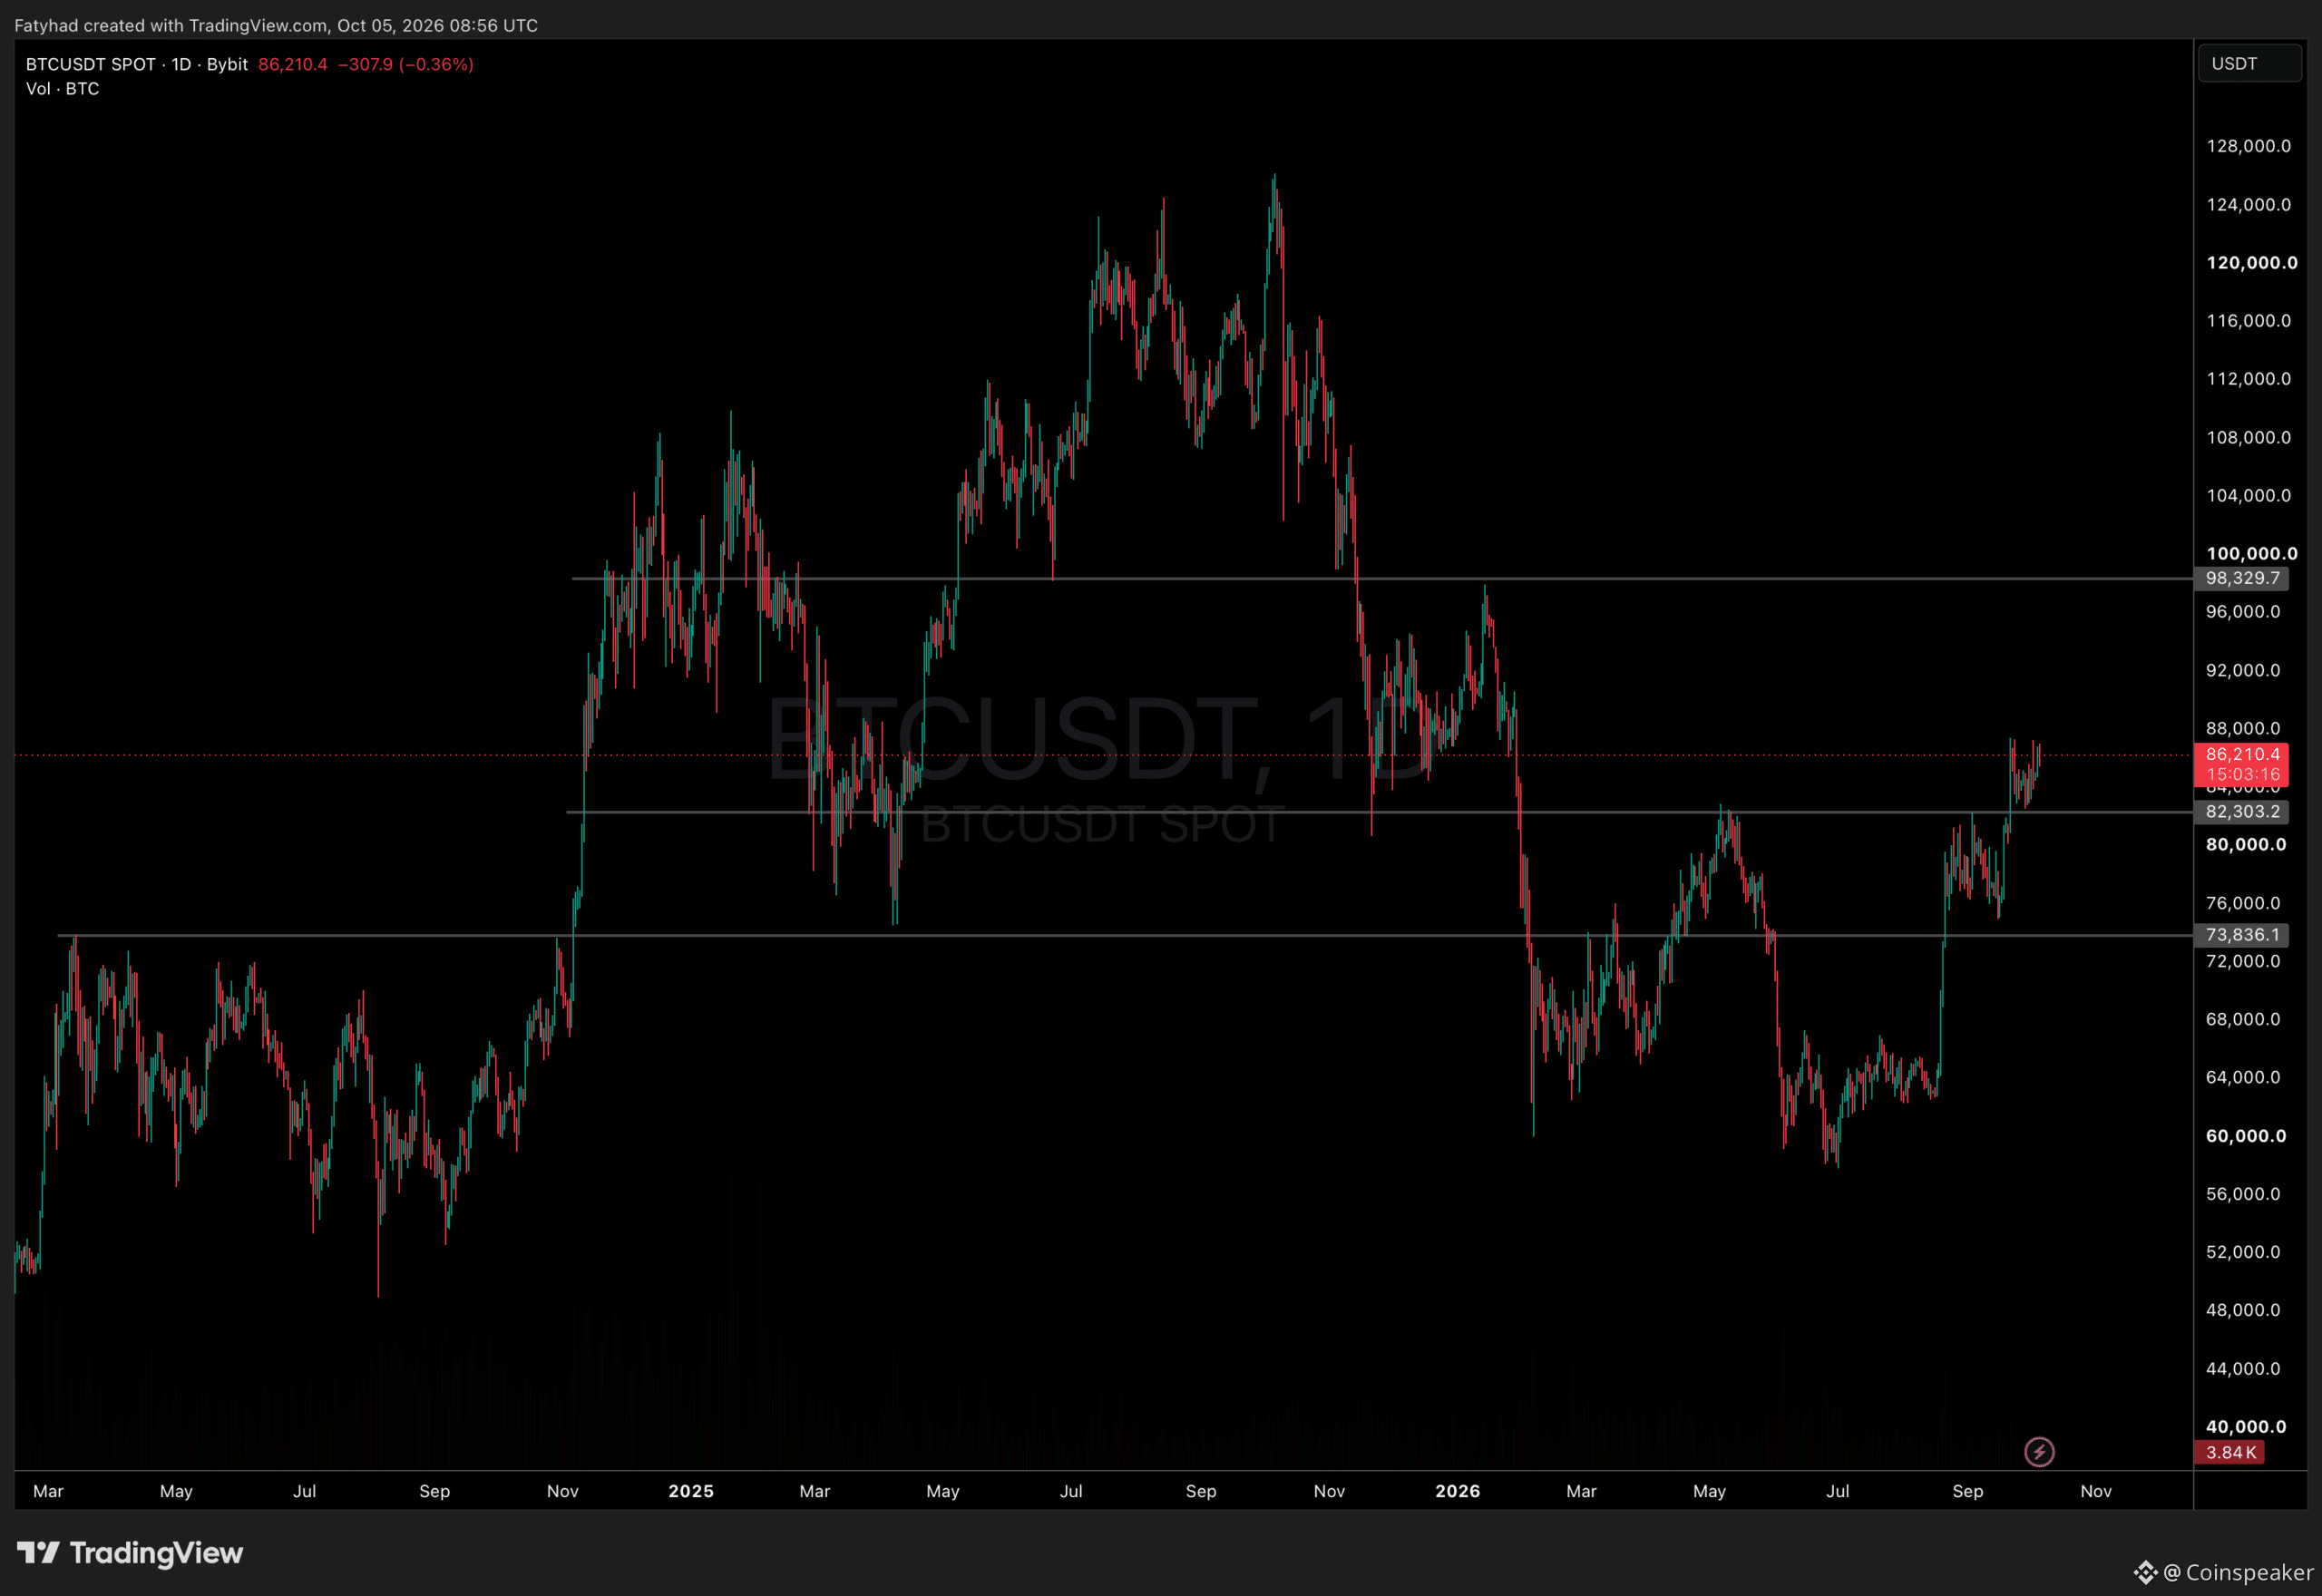
Bitcoin Price Forecast: New SEC Ruling Sends BTC Soaring Above $85,000Bitcoin trades near $86,044 on October 5, up about 1.1% over 24 hours. BTC briefly touched $86,999 before easing back. The short-term Bitcoin price forecast now centers on one question: can buyers push through resistance and reach the liquidation cluster waiting near $90,000?
Glassnode data shows Bitcoin’s largest overhead liquidation cluster sits near $90,000. If the price reaches that level, leveraged short positions would be forced to close. That forced buying could speed up a rally.
The risk runs both ways. Glassnode also flags smaller clusters near $83,000 and $75,000. A drop into either zone could trigger long liquidations and accelerate a decline.
Bitcoin’s market cap stands near $1.72 trillion. Daily volume rose about 81% to $22.2 billion, while BTC gained roughly 2.9% over the past week.
bitcoin:native's largest overhead liquidation cluster sits near $90k.
If price touches this level, leveraged shorts will be forced to closes their positions.
Zoom into the last two months and smaller clusters can be seen around $83k and $75k.
Either side could speed up the… pic.twitter.com/v5c1PTZGHa
— glassnode (@glassnode) October 4, 2026
Market Intelligence: Crypto Analyst Reveals Upcoming Coinbase Listings
Bitcoin Price Forecast: Can Bitcoin Break $87,400 This Week?
BTCUSDT Price Chart 1D TradingView
The four-hour chart shows Bitcoin stuck in a range since its September 22 rally. BTC has repeatedly stalled between $86,500 and $87,500, while finding support near $83,000.
Above $87,500, the $90,000 liquidation cluster becomes the next target, as discussed in this Bitcoin forecast for 2026.
Bull case: BTC clears $87,400 and holds. That would put $90,000 in play, where a short squeeze could add fuel.
Base case: Price stays between $82,000 and $87,500 as traders wait for a catalyst.
Bear case: A sustained break below $82,000 would weaken the recovery and bring $80,000 back into view. A slide toward $75,000 could trigger another wave of liquidations.
For another view of the $90,000 setup, see this BTC forecast and October macro analysis.
Bitcoin Hyper Targets Early-Mover Interest as Bitcoin Tests Resistance
A move toward $90,000 would extend the recovery, but the path is conditional, and the upside from the mid-$80,000s is not unlimited. That can push some market participants to look beyond spot exposure toward infrastructure projects; early-stage tokens carry a very different risk profile. A green week is not a due diligence shortcut.
Bitcoin Hyper ($HYPER) presents itself as a Bitcoin Layer 2 with Solana Virtual Machine (SVM) integration, aiming to bring smart contracts and faster, lower-cost execution to the Bitcoin ecosystem. Its stated features include a decentralized canonical bridge for BTC transfers and low-latency Layer 2 processing. The project claims its SVM integration delivers faster performance than Solana itself.
The presale price is $0.0136872, and the project reports $33 million raised.
Its core pitch: solve Bitcoin’s slow settlement and lack of programmability using a decentralized canonical bridge and low-latency execution layer, while preserving Bitcoin’s underlying security.
Don’t Miss Out Again: Join New Bitcoin Layer 2 Early Here
Market Intelligence: Crypto Analyst Predicts Best Low-Cap Crypto
next
The post Bitcoin Price Forecast: New SEC Ruling Sends BTC Soaring Above $85,000 appeared first on Coinspeaker.
Bitcoin Price Forecast: New SEC Ruling Sends BTC Soaring Above $85,000
Bitcoin trades near $86,044 on October 5, up about 1.1% over 24 hours. BTC briefly touched $86,999 before easing back. The short-term Bitcoin price forecast now centers on one question: can buyers push through resistance and reach the liquidation cluster waiting near $90,000?
Glassnode data shows Bitcoin’s largest overhead liquidation cluster sits near $90,000. If the price reaches that level, leveraged short positions would be forced to close. That forced buying could speed up a rally.
The risk runs both ways. Glassnode also flags smaller clusters near $83,000 and $75,000. A drop into either zone could trigger long liquidations and accelerate a decline.
Bitcoin’s market cap stands near $1.72 trillion. Daily volume rose about 81% to $22.2 billion, while BTC gained roughly 2.9% over the past week.
bitcoin:native's largest overhead liquidation cluster sits near $90k.
If price touches this level, leveraged shorts will be forced to closes their positions.
Zoom into the last two months and smaller clusters can be seen around $83k and $75k.
Either side could speed up the… pic.twitter.com/v5c1PTZGHa
— glassnode (@glassnode) October 4, 2026
Market Intelligence: Crypto Analyst Reveals Upcoming Coinbase Listings
Bitcoin Price Forecast: Can Bitcoin Break $87,400 This Week?
BTCUSDT Price Chart 1D TradingView
The four-hour chart shows Bitcoin stuck in a range since its September 22 rally. BTC has repeatedly stalled between $86,500 and $87,500, while finding support near $83,000.
Above $87,500, the $90,000 liquidation cluster becomes the next target, as discussed in this Bitcoin forecast for 2026.
Bull case: BTC clears $87,400 and holds. That would put $90,000 in play, where a short squeeze could add fuel.
Base case: Price stays between $82,000 and $87,500 as traders wait for a catalyst.
Bear case: A sustained break below $82,000 would weaken the recovery and bring $80,000 back into view. A slide toward $75,000 could trigger another wave of liquidations.
For another view of the $90,000 setup, see this BTC forecast and October macro analysis.
Bitcoin Hyper Targets Early-Mover Interest as Bitcoin Tests Resistance
A move toward $90,000 would extend the recovery, but the path is conditional, and the upside from the mid-$80,000s is not unlimited. That can push some market participants to look beyond spot exposure toward infrastructure projects; early-stage tokens carry a very different risk profile. A green week is not a due diligence shortcut.
Bitcoin Hyper ($HYPER) presents itself as a Bitcoin Layer 2 with Solana Virtual Machine (SVM) integration, aiming to bring smart contracts and faster, lower-cost execution to the Bitcoin ecosystem. Its stated features include a decentralized canonical bridge for BTC transfers and low-latency Layer 2 processing. The project claims its SVM integration delivers faster performance than Solana itself.
The presale price is $0.0136872, and the project reports $33 million raised.
Its core pitch: solve Bitcoin’s slow settlement and lack of programmability using a decentralized canonical bridge and low-latency execution layer, while preserving Bitcoin’s underlying security.
Don’t Miss Out Again: Join New Bitcoin Layer 2 Early Here
Market Intelligence: Crypto Analyst Predicts Best Low-Cap Crypto
next
The post Bitcoin Price Forecast: New SEC Ruling Sends BTC Soaring Above $85,000 appeared first on Coinspeaker.
Glassnode data shows Bitcoin’s largest overhead liquidation cluster sits near $90,000. If the price reaches that level, leveraged short positions would be forced to close. That forced buying could speed up a rally.
The risk runs both ways. Glassnode also flags smaller clusters near $83,000 and $75,000. A drop into either zone could trigger long liquidations and accelerate a decline.
Bitcoin’s market cap stands near $1.72 trillion. Daily volume rose about 81% to $22.2 billion, while BTC gained roughly 2.9% over the past week.
bitcoin:native's largest overhead liquidation cluster sits near $90k.
If price touches this level, leveraged shorts will be forced to closes their positions.
Zoom into the last two months and smaller clusters can be seen around $83k and $75k.
Either side could speed up the… pic.twitter.com/v5c1PTZGHa
— glassnode (@glassnode) October 4, 2026
Market Intelligence: Crypto Analyst Reveals Upcoming Coinbase Listings
Bitcoin Price Forecast: Can Bitcoin Break $87,400 This Week?
BTCUSDT Price Chart 1D TradingView
The four-hour chart shows Bitcoin stuck in a range since its September 22 rally. BTC has repeatedly stalled between $86,500 and $87,500, while finding support near $83,000.
Above $87,500, the $90,000 liquidation cluster becomes the next target, as discussed in this Bitcoin forecast for 2026.
Bull case: BTC clears $87,400 and holds. That would put $90,000 in play, where a short squeeze could add fuel.
Base case: Price stays between $82,000 and $87,500 as traders wait for a catalyst.
Bear case: A sustained break below $82,000 would weaken the recovery and bring $80,000 back into view. A slide toward $75,000 could trigger another wave of liquidations.
For another view of the $90,000 setup, see this BTC forecast and October macro analysis.
Bitcoin Hyper Targets Early-Mover Interest as Bitcoin Tests Resistance
A move toward $90,000 would extend the recovery, but the path is conditional, and the upside from the mid-$80,000s is not unlimited. That can push some market participants to look beyond spot exposure toward infrastructure projects; early-stage tokens carry a very different risk profile. A green week is not a due diligence shortcut.
Bitcoin Hyper ($HYPER) presents itself as a Bitcoin Layer 2 with Solana Virtual Machine (SVM) integration, aiming to bring smart contracts and faster, lower-cost execution to the Bitcoin ecosystem. Its stated features include a decentralized canonical bridge for BTC transfers and low-latency Layer 2 processing. The project claims its SVM integration delivers faster performance than Solana itself.
The presale price is $0.0136872, and the project reports $33 million raised.
Its core pitch: solve Bitcoin’s slow settlement and lack of programmability using a decentralized canonical bridge and low-latency execution layer, while preserving Bitcoin’s underlying security.
Don’t Miss Out Again: Join New Bitcoin Layer 2 Early Here
Market Intelligence: Crypto Analyst Predicts Best Low-Cap Crypto
next
The post Bitcoin Price Forecast: New SEC Ruling Sends BTC Soaring Above $85,000 appeared first on Coinspeaker.
181
·
--
ບົດຄວາມ
XRP Price Analysis: XRP Asia Launch Brings Another Catalyst for Ripple PriceXRP trades near $1.51 on October 5, up about 0.7% over 24 hours. Ripple and the XRP Ledger Foundation have added a new regional push to the list of catalysts, but XRP remains stuck in a tight range. For the near-term XRP price forecast, the key question is whether Asia-focused development can drive real demand, or whether price needs a technical break first.
XRP Asia launched at XRP Seoul 2026 on October 3. The Singapore-based group is led by Sabrina Tachdjian, a former Hedera Foundation executive. Its plans include developer education, regional hubs, and support to help projects secure funding and reach commercial launch.
The effort builds on existing XRP communities in Korea and Japan. Regional moves such as XRP Ledger access for Singapore users add context to the adoption story.
The market reaction has been muted. XRP is up about 2% over the past week and 7.4% over 30 days, but still roughly 50% lower than a year ago. That fits a long-term adoption story better than an immediate demand shock.
Strong accumulation of $XRP has continued for seven days.
The accumulation phase is not yet over. The next move will begin once this signal concludes.
MACD and EMA trends are building bullish momentum. pic.twitter.com/BRrhgLiLwf
— CW (@CW8900) October 5, 2026
Market Intelligence: Crypto Analyst Predicts Best Low-Cap Crypto
XRP Price Forecast: Can XRP Price Clear $1.55 This Week?
XRPUSDT Chart 1D TradingView
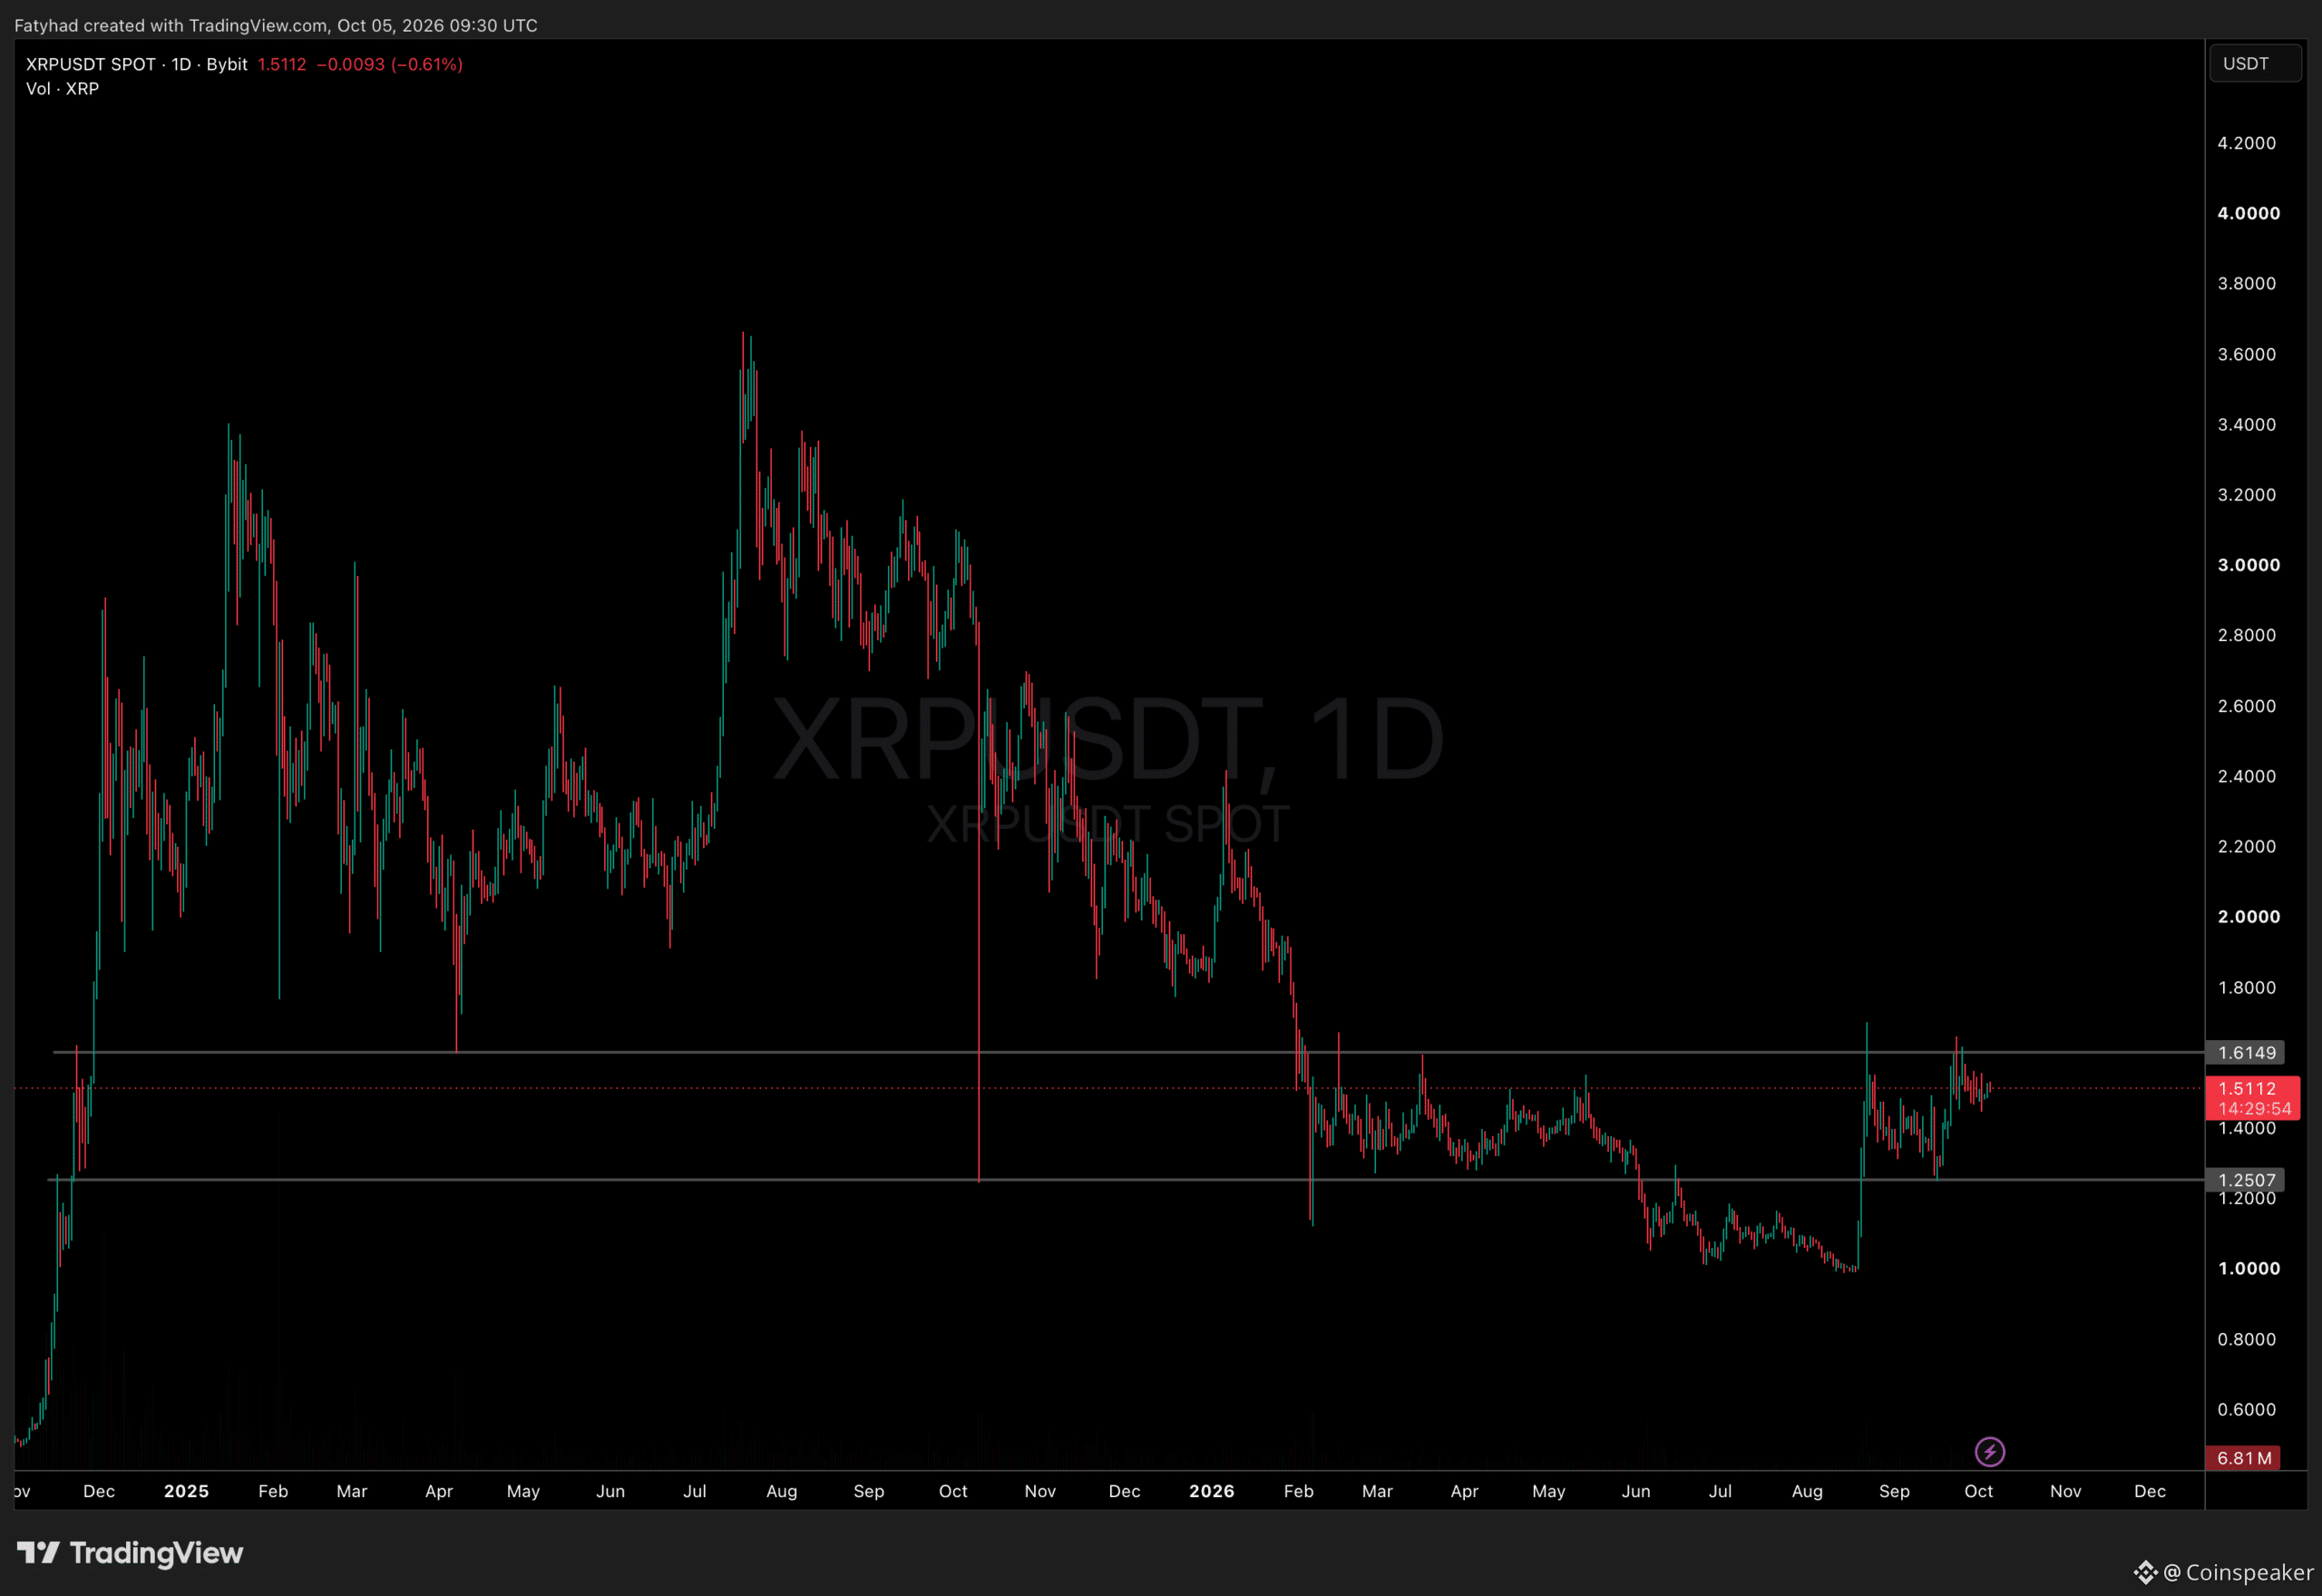
XRP is trading between $1.50 and $1.53. Daily volume stands near $1.66 billion, with a market cap of about $95.3 billion.
The hourly chart shows XRP failed near $1.555 on October 2, then dropped to about $1.465 before recovering. It has since climbed steadily but stalled near $1.52–$1.53.
Resistance: $1.52–$1.55, then $1.61, and the $1.70–$1.75 zone
Support: $1.45–$1.47, then $1.40 and $1.25
On the daily chart, XRP has been capped near $1.61 since February. A break above that level would be the first real trend test in months.
Bull case: XRP holds $1.45 and clears $1.55, opening a test of $1.59–$1.62.
Base case: XRP stays range-bound as traders wait for signs that adoption plans are boosting network activity.
Bear case: A drop below $1.45 weakens the setup, with $1.40 next.
Market Intelligence: Crypto Security Analyst Recommends Best Anonymous Crypto Exchanges
LiquidChain Targets Early Mover Upside as XRP Tests Key Levels
XRP Asia gives the longer-term adoption case another route into Asia-Pacific, but the chart has not repriced that prospect decisively. If XRP stays capped below $1.55, traders may look beyond a large-cap token for earlier-stage infrastructure exposure.
LiquidChain ($LIQUID) is a Layer 3 (L3) infrastructure project pitching a single execution environment that fuses Bitcoin, Ethereum, and Solana liquidity. Its stated features include a Unified Liquidity Layer, Single-Step Execution, Verifiable Settlement, and a Deploy-Once Architecture. The project lists its current price at exactly $0.014962 and total raised at $980K.
The proposition is developer access across ecosystems through one deployment, rather than a direct XRP substitute. But presale participation adds execution, adoption, and liquidity risks, and the supplied figures do not establish future demand.
Those curious can research LiquidChain directly.
Layer 3 Is Already Here, Smart Money Knows It – Do You? next
The post XRP Price Analysis: XRP Asia Launch Brings Another Catalyst for Ripple Price appeared first on Coinspeaker.
XRP Price Analysis: XRP Asia Launch Brings Another Catalyst for Ripple Price
XRP trades near $1.51 on October 5, up about 0.7% over 24 hours. Ripple and the XRP Ledger Foundation have added a new regional push to the list of catalysts, but XRP remains stuck in a tight range. For the near-term XRP price forecast, the key question is whether Asia-focused development can drive real demand, or whether price needs a technical break first.
XRP Asia launched at XRP Seoul 2026 on October 3. The Singapore-based group is led by Sabrina Tachdjian, a former Hedera Foundation executive. Its plans include developer education, regional hubs, and support to help projects secure funding and reach commercial launch.
The effort builds on existing XRP communities in Korea and Japan. Regional moves such as XRP Ledger access for Singapore users add context to the adoption story.
The market reaction has been muted. XRP is up about 2% over the past week and 7.4% over 30 days, but still roughly 50% lower than a year ago. That fits a long-term adoption story better than an immediate demand shock.
Strong accumulation of $XRP has continued for seven days.
The accumulation phase is not yet over. The next move will begin once this signal concludes.
MACD and EMA trends are building bullish momentum. pic.twitter.com/BRrhgLiLwf
— CW (@CW8900) October 5, 2026
Market Intelligence: Crypto Analyst Predicts Best Low-Cap Crypto
XRP Price Forecast: Can XRP Price Clear $1.55 This Week?
XRPUSDT Chart 1D TradingView
XRP is trading between $1.50 and $1.53. Daily volume stands near $1.66 billion, with a market cap of about $95.3 billion.
The hourly chart shows XRP failed near $1.555 on October 2, then dropped to about $1.465 before recovering. It has since climbed steadily but stalled near $1.52–$1.53.
Resistance: $1.52–$1.55, then $1.61, and the $1.70–$1.75 zone
Support: $1.45–$1.47, then $1.40 and $1.25
On the daily chart, XRP has been capped near $1.61 since February. A break above that level would be the first real trend test in months.
Bull case: XRP holds $1.45 and clears $1.55, opening a test of $1.59–$1.62.
Base case: XRP stays range-bound as traders wait for signs that adoption plans are boosting network activity.
Bear case: A drop below $1.45 weakens the setup, with $1.40 next.
Market Intelligence: Crypto Security Analyst Recommends Best Anonymous Crypto Exchanges
LiquidChain Targets Early Mover Upside as XRP Tests Key Levels
XRP Asia gives the longer-term adoption case another route into Asia-Pacific, but the chart has not repriced that prospect decisively. If XRP stays capped below $1.55, traders may look beyond a large-cap token for earlier-stage infrastructure exposure.
LiquidChain ($LIQUID) is a Layer 3 (L3) infrastructure project pitching a single execution environment that fuses Bitcoin, Ethereum, and Solana liquidity. Its stated features include a Unified Liquidity Layer, Single-Step Execution, Verifiable Settlement, and a Deploy-Once Architecture. The project lists its current price at exactly $0.014962 and total raised at $980K.
The proposition is developer access across ecosystems through one deployment, rather than a direct XRP substitute. But presale participation adds execution, adoption, and liquidity risks, and the supplied figures do not establish future demand.
Those curious can research LiquidChain directly.
Layer 3 Is Already Here, Smart Money Knows It – Do You? next
The post XRP Price Analysis: XRP Asia Launch Brings Another Catalyst for Ripple Price appeared first on Coinspeaker.
XRP Asia launched at XRP Seoul 2026 on October 3. The Singapore-based group is led by Sabrina Tachdjian, a former Hedera Foundation executive. Its plans include developer education, regional hubs, and support to help projects secure funding and reach commercial launch.
The effort builds on existing XRP communities in Korea and Japan. Regional moves such as XRP Ledger access for Singapore users add context to the adoption story.
The market reaction has been muted. XRP is up about 2% over the past week and 7.4% over 30 days, but still roughly 50% lower than a year ago. That fits a long-term adoption story better than an immediate demand shock.
Strong accumulation of $XRP has continued for seven days.
The accumulation phase is not yet over. The next move will begin once this signal concludes.
MACD and EMA trends are building bullish momentum. pic.twitter.com/BRrhgLiLwf
— CW (@CW8900) October 5, 2026
Market Intelligence: Crypto Analyst Predicts Best Low-Cap Crypto
XRP Price Forecast: Can XRP Price Clear $1.55 This Week?
XRPUSDT Chart 1D TradingView
XRP is trading between $1.50 and $1.53. Daily volume stands near $1.66 billion, with a market cap of about $95.3 billion.
The hourly chart shows XRP failed near $1.555 on October 2, then dropped to about $1.465 before recovering. It has since climbed steadily but stalled near $1.52–$1.53.
Resistance: $1.52–$1.55, then $1.61, and the $1.70–$1.75 zone
Support: $1.45–$1.47, then $1.40 and $1.25
On the daily chart, XRP has been capped near $1.61 since February. A break above that level would be the first real trend test in months.
Bull case: XRP holds $1.45 and clears $1.55, opening a test of $1.59–$1.62.
Base case: XRP stays range-bound as traders wait for signs that adoption plans are boosting network activity.
Bear case: A drop below $1.45 weakens the setup, with $1.40 next.
Market Intelligence: Crypto Security Analyst Recommends Best Anonymous Crypto Exchanges
LiquidChain Targets Early Mover Upside as XRP Tests Key Levels
XRP Asia gives the longer-term adoption case another route into Asia-Pacific, but the chart has not repriced that prospect decisively. If XRP stays capped below $1.55, traders may look beyond a large-cap token for earlier-stage infrastructure exposure.
LiquidChain ($LIQUID) is a Layer 3 (L3) infrastructure project pitching a single execution environment that fuses Bitcoin, Ethereum, and Solana liquidity. Its stated features include a Unified Liquidity Layer, Single-Step Execution, Verifiable Settlement, and a Deploy-Once Architecture. The project lists its current price at exactly $0.014962 and total raised at $980K.
The proposition is developer access across ecosystems through one deployment, rather than a direct XRP substitute. But presale participation adds execution, adoption, and liquidity risks, and the supplied figures do not establish future demand.
Those curious can research LiquidChain directly.
Layer 3 Is Already Here, Smart Money Knows It – Do You? next
The post XRP Price Analysis: XRP Asia Launch Brings Another Catalyst for Ripple Price appeared first on Coinspeaker.
246
·
--
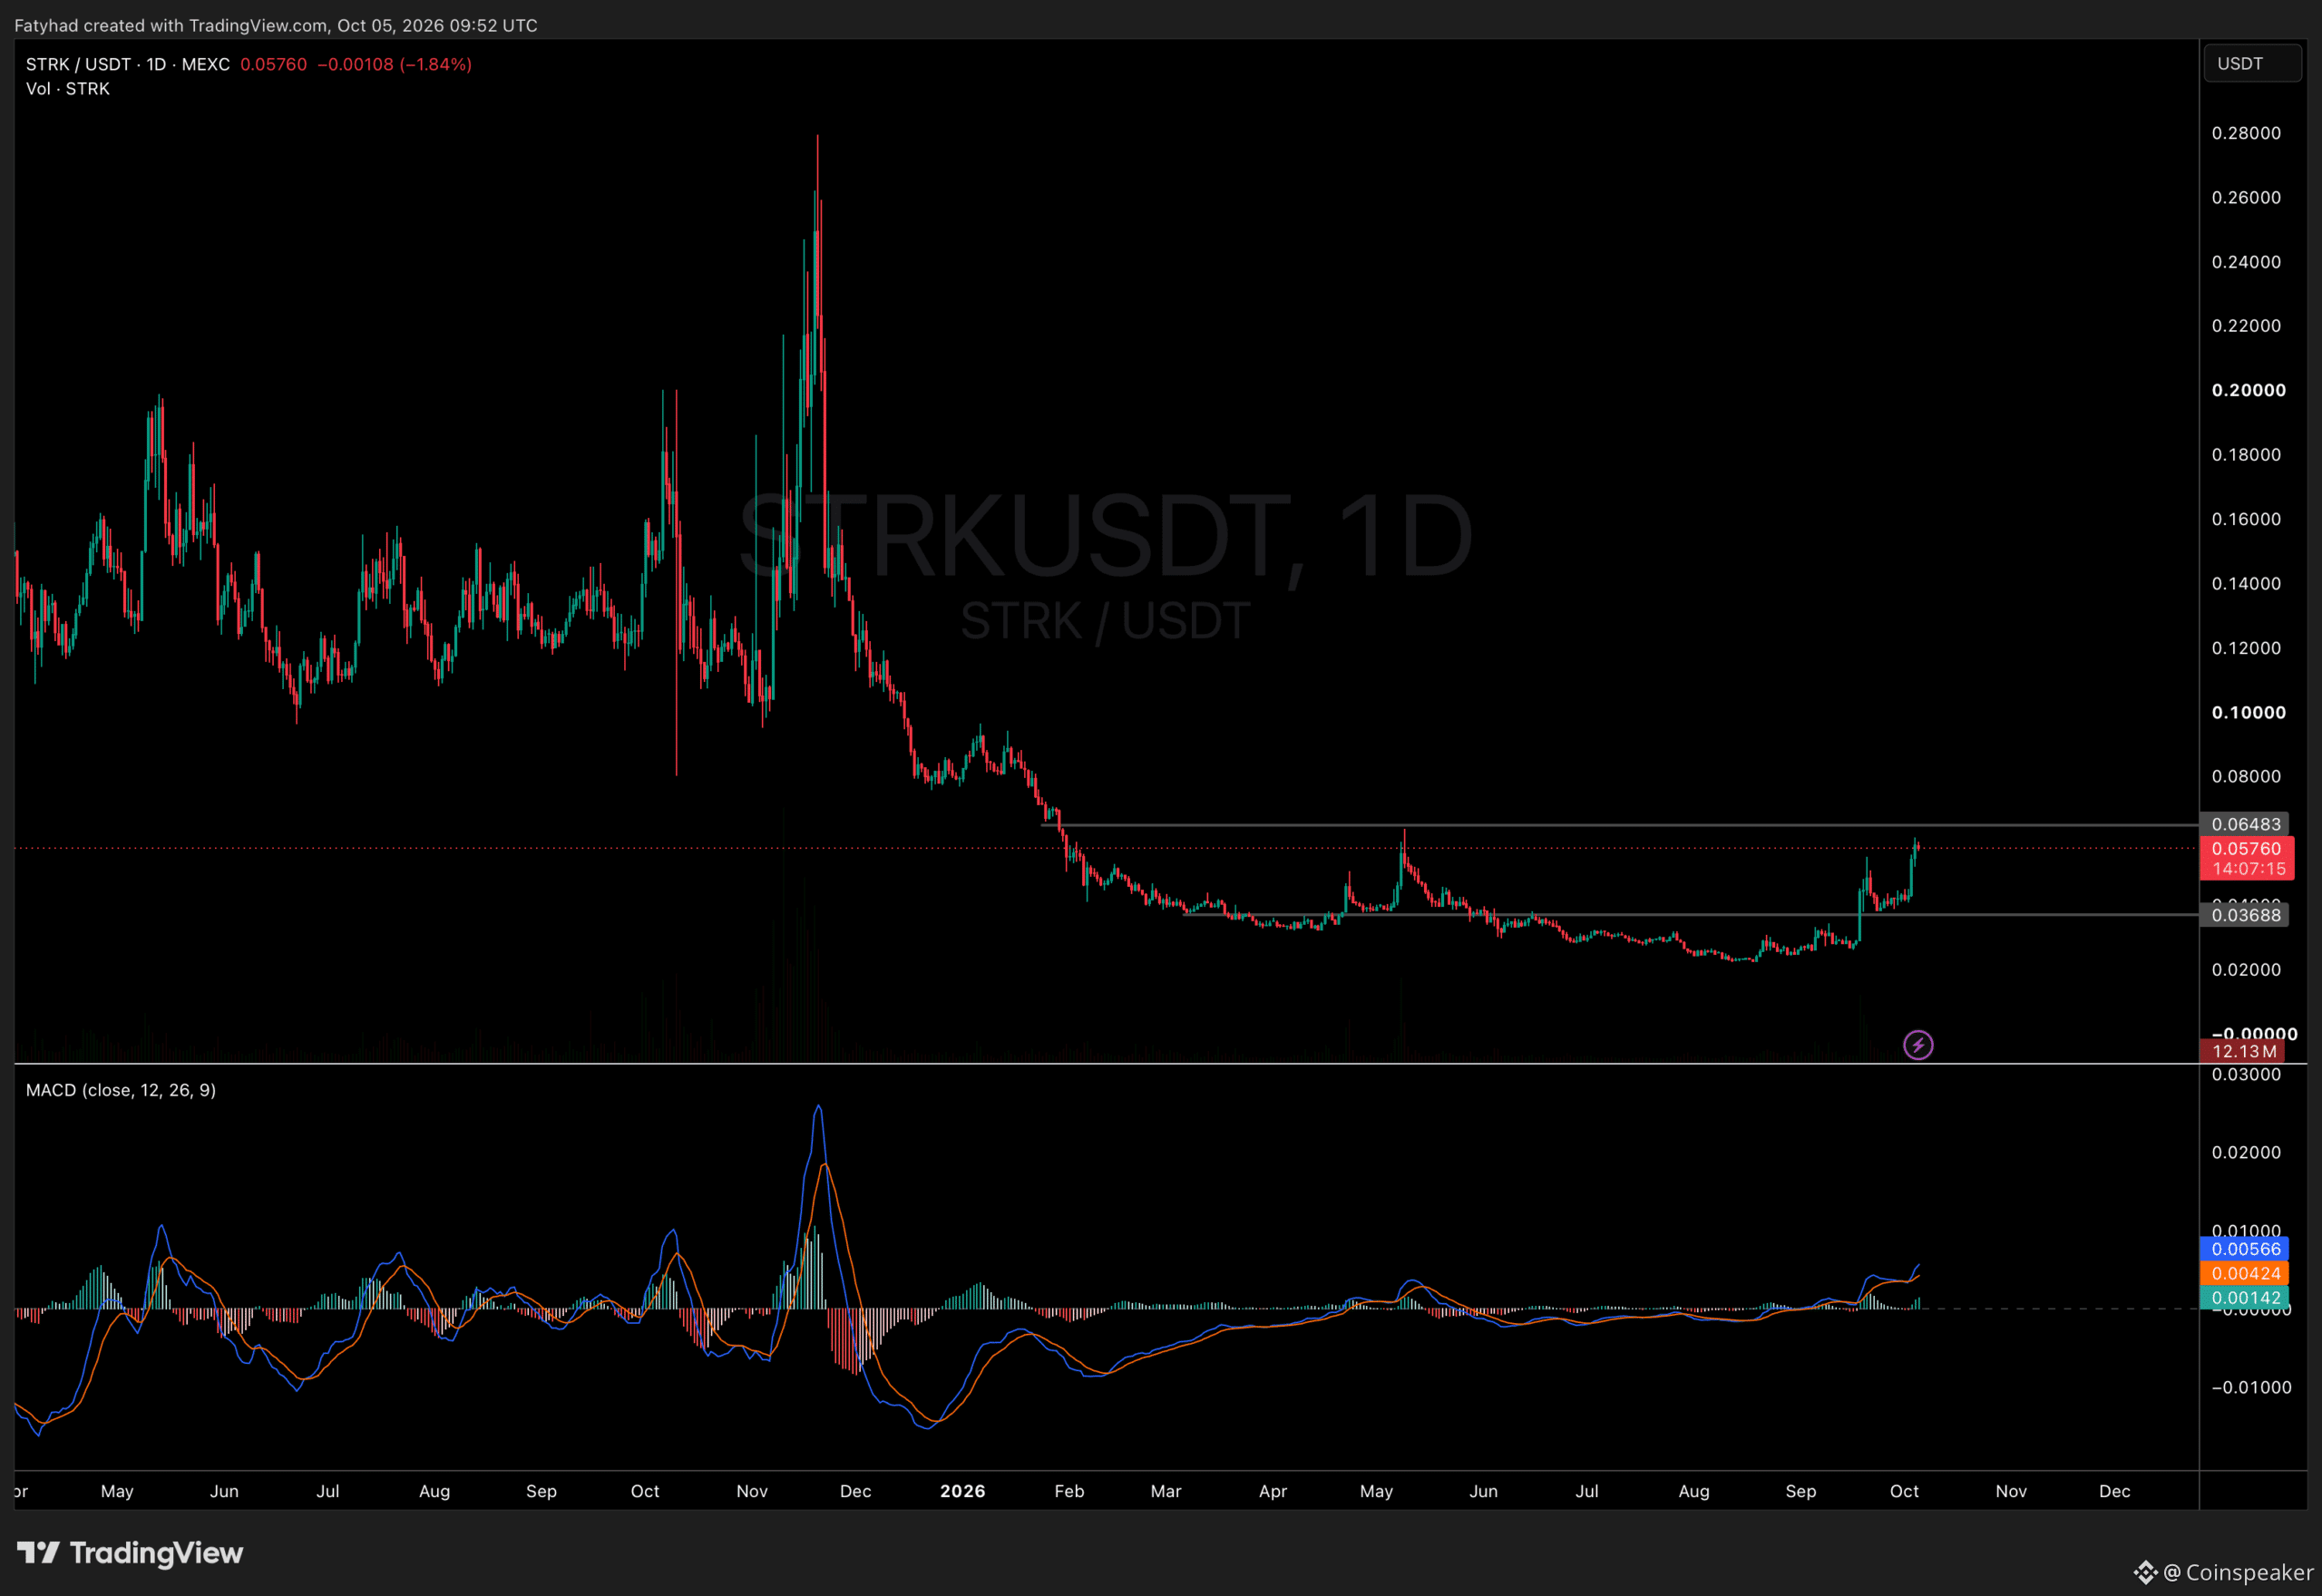
ບົດຄວາມ
STRK Breakout Now Depends on $0.05 Support HoldingStarknet crypto token trades near $0.0576, up about 8.7% over 24 hours. It briefly touched $0.0607, its highest level since May. The rally builds on a sharp breakout above $0.05 over the weekend. The next test is whether buyers can defend that level, now the key support behind the breakout.
STRK spent more than a week stuck near $0.041–$0.044 before breaking out on October 3. Since then, it has gained about 48% over seven days and nearly doubled over the past month. It remains about 62% lower than a year ago.
🔥 $STRK is finally getting a second narrative that actually changes demand.
The first one was simple: Starknet = Ethereum ZK L2 & the market stopped caring.
The new thesis is Bitcoin + privacy, and this one has a clearer connection to the token. That’s very important for… https://t.co/SpNhwQ03o6 pic.twitter.com/2KIQJv58xP
— Karamata_ 💎 (@Karamata2_2) October 5, 2026
Market Intelligence: Crypto Analyst Predicts Best Low-Cap Crypto
Starknet Crypto: Can STRK Hold $0.05 After Its Breakout?
STRKUSDT Chart 1D TradingView
Trading activity has surged. Daily volume stands near $155 million, and STRK’s market cap is about $428 million, putting it back among the top 100 tokens.
Momentum indicators back the move. On the daily chart, the MACD line sits at 0.0057, above its signal line at 0.0042, with a positive histogram. On the weekly chart, RSI has also turned higher after months of bullish divergence.
Still, price matters more than indicators. The daily chart shows two clear levels for Starknet crypto:
Resistance: $0.065, the May high
Support: $0.05, then $0.041 and $0.037
Bull case: STRK holds above $0.05 and breaks $0.065. That would mark its highest level since February and confirm the breakout.
Bear case: A decisive drop below $0.05 would weaken the setup and bring the $0.041 consolidation zone back into view.
Market Intelligence: Crypto Analyst Reveals Upcoming Coinbase Listings
Who Is Buying Starknet’s STRK Token?
bought $740k of starknet this week (yes, seriously).
here's the thinking, and i'll say up front that this is one of the grossest charts i've ever seen and makes me want to throw up.
it's down about 99% from the launch highs and it's been down only for 2.5 years. i'd guess 99… pic.twitter.com/J2Pr3NQMzg
— Pumponomics (@ThePumponomics) October 3, 2026
On-chain data points to accumulation, though not proof of broad demand. A wallet linked to Quanterty bought 17.4 million STRK, worth about $767,000. Pumpnomics said it bought about $740,000 in STRK over the past week.
STRK’s spot netflow on October 4 was negative $731,000, meaning more tokens left exchanges than arrived. That often signals buying, though withdrawals alone cannot confirm it.
Derivatives activity is rising too. CoinGlass data showed open interest up 4% to $86.5 million, with derivatives volume up 76%. That shows more active trading, but not whether traders lean long or short.
Derivatives, Reported Buying, and Privacy DeFi Interest: Is Starknet Seeing Real Network Demand?
Starknet Fees & Market Cap Chainspect
There are early signs. Starknet cleared $50,000 in weekly revenue for the first time, earning $53,676 over seven days, Chainspect data shows. The figure is small, but it shows fees starting to grow. Starknet’s total value locked stands near $307 million.
Privacy-focused DeFi may also be helping. X users Blue Clarity and Pumpnomics highlighted Starknet apps such as a privacy pool, private swaps, and perpetuals. STRK itself is not a privacy coin, and app interest alone does not guarantee lasting token demand.
Supply is worth watching. About 7.42 billion of STRK’s 10 billion maximum supply is in circulation, so future unlocks could add selling pressure.
For now, the key question is simple: can Starknet’s STRK hold $0.05 long enough to challenge $0.065?
Put Your Money Where Your Mouth is On Polymarket next
The post STRK Breakout Now Depends on $0.05 Support Holding appeared first on Coinspeaker.
STRK Breakout Now Depends on $0.05 Support Holding
Starknet crypto token trades near $0.0576, up about 8.7% over 24 hours. It briefly touched $0.0607, its highest level since May. The rally builds on a sharp breakout above $0.05 over the weekend. The next test is whether buyers can defend that level, now the key support behind the breakout.
STRK spent more than a week stuck near $0.041–$0.044 before breaking out on October 3. Since then, it has gained about 48% over seven days and nearly doubled over the past month. It remains about 62% lower than a year ago.
🔥 $STRK is finally getting a second narrative that actually changes demand.
The first one was simple: Starknet = Ethereum ZK L2 & the market stopped caring.
The new thesis is Bitcoin + privacy, and this one has a clearer connection to the token. That’s very important for… https://t.co/SpNhwQ03o6 pic.twitter.com/2KIQJv58xP
— Karamata_ 💎 (@Karamata2_2) October 5, 2026
Market Intelligence: Crypto Analyst Predicts Best Low-Cap Crypto
Starknet Crypto: Can STRK Hold $0.05 After Its Breakout?
STRKUSDT Chart 1D TradingView
Trading activity has surged. Daily volume stands near $155 million, and STRK’s market cap is about $428 million, putting it back among the top 100 tokens.
Momentum indicators back the move. On the daily chart, the MACD line sits at 0.0057, above its signal line at 0.0042, with a positive histogram. On the weekly chart, RSI has also turned higher after months of bullish divergence.
Still, price matters more than indicators. The daily chart shows two clear levels for Starknet crypto:
Resistance: $0.065, the May high
Support: $0.05, then $0.041 and $0.037
Bull case: STRK holds above $0.05 and breaks $0.065. That would mark its highest level since February and confirm the breakout.
Bear case: A decisive drop below $0.05 would weaken the setup and bring the $0.041 consolidation zone back into view.
Market Intelligence: Crypto Analyst Reveals Upcoming Coinbase Listings
Who Is Buying Starknet’s STRK Token?
bought $740k of starknet this week (yes, seriously).
here's the thinking, and i'll say up front that this is one of the grossest charts i've ever seen and makes me want to throw up.
it's down about 99% from the launch highs and it's been down only for 2.5 years. i'd guess 99… pic.twitter.com/J2Pr3NQMzg
— Pumponomics (@ThePumponomics) October 3, 2026
On-chain data points to accumulation, though not proof of broad demand. A wallet linked to Quanterty bought 17.4 million STRK, worth about $767,000. Pumpnomics said it bought about $740,000 in STRK over the past week.
STRK’s spot netflow on October 4 was negative $731,000, meaning more tokens left exchanges than arrived. That often signals buying, though withdrawals alone cannot confirm it.
Derivatives activity is rising too. CoinGlass data showed open interest up 4% to $86.5 million, with derivatives volume up 76%. That shows more active trading, but not whether traders lean long or short.
Derivatives, Reported Buying, and Privacy DeFi Interest: Is Starknet Seeing Real Network Demand?
Starknet Fees & Market Cap Chainspect
There are early signs. Starknet cleared $50,000 in weekly revenue for the first time, earning $53,676 over seven days, Chainspect data shows. The figure is small, but it shows fees starting to grow. Starknet’s total value locked stands near $307 million.
Privacy-focused DeFi may also be helping. X users Blue Clarity and Pumpnomics highlighted Starknet apps such as a privacy pool, private swaps, and perpetuals. STRK itself is not a privacy coin, and app interest alone does not guarantee lasting token demand.
Supply is worth watching. About 7.42 billion of STRK’s 10 billion maximum supply is in circulation, so future unlocks could add selling pressure.
For now, the key question is simple: can Starknet’s STRK hold $0.05 long enough to challenge $0.065?
Put Your Money Where Your Mouth is On Polymarket next
The post STRK Breakout Now Depends on $0.05 Support Holding appeared first on Coinspeaker.
STRK spent more than a week stuck near $0.041–$0.044 before breaking out on October 3. Since then, it has gained about 48% over seven days and nearly doubled over the past month. It remains about 62% lower than a year ago.
🔥 $STRK is finally getting a second narrative that actually changes demand.
The first one was simple: Starknet = Ethereum ZK L2 & the market stopped caring.
The new thesis is Bitcoin + privacy, and this one has a clearer connection to the token. That’s very important for… https://t.co/SpNhwQ03o6 pic.twitter.com/2KIQJv58xP
— Karamata_ 💎 (@Karamata2_2) October 5, 2026
Market Intelligence: Crypto Analyst Predicts Best Low-Cap Crypto
Starknet Crypto: Can STRK Hold $0.05 After Its Breakout?
STRKUSDT Chart 1D TradingView
Trading activity has surged. Daily volume stands near $155 million, and STRK’s market cap is about $428 million, putting it back among the top 100 tokens.
Momentum indicators back the move. On the daily chart, the MACD line sits at 0.0057, above its signal line at 0.0042, with a positive histogram. On the weekly chart, RSI has also turned higher after months of bullish divergence.
Still, price matters more than indicators. The daily chart shows two clear levels for Starknet crypto:
Resistance: $0.065, the May high
Support: $0.05, then $0.041 and $0.037
Bull case: STRK holds above $0.05 and breaks $0.065. That would mark its highest level since February and confirm the breakout.
Bear case: A decisive drop below $0.05 would weaken the setup and bring the $0.041 consolidation zone back into view.
Market Intelligence: Crypto Analyst Reveals Upcoming Coinbase Listings
Who Is Buying Starknet’s STRK Token?
bought $740k of starknet this week (yes, seriously).
here's the thinking, and i'll say up front that this is one of the grossest charts i've ever seen and makes me want to throw up.
it's down about 99% from the launch highs and it's been down only for 2.5 years. i'd guess 99… pic.twitter.com/J2Pr3NQMzg
— Pumponomics (@ThePumponomics) October 3, 2026
On-chain data points to accumulation, though not proof of broad demand. A wallet linked to Quanterty bought 17.4 million STRK, worth about $767,000. Pumpnomics said it bought about $740,000 in STRK over the past week.
STRK’s spot netflow on October 4 was negative $731,000, meaning more tokens left exchanges than arrived. That often signals buying, though withdrawals alone cannot confirm it.
Derivatives activity is rising too. CoinGlass data showed open interest up 4% to $86.5 million, with derivatives volume up 76%. That shows more active trading, but not whether traders lean long or short.
Derivatives, Reported Buying, and Privacy DeFi Interest: Is Starknet Seeing Real Network Demand?
Starknet Fees & Market Cap Chainspect
There are early signs. Starknet cleared $50,000 in weekly revenue for the first time, earning $53,676 over seven days, Chainspect data shows. The figure is small, but it shows fees starting to grow. Starknet’s total value locked stands near $307 million.
Privacy-focused DeFi may also be helping. X users Blue Clarity and Pumpnomics highlighted Starknet apps such as a privacy pool, private swaps, and perpetuals. STRK itself is not a privacy coin, and app interest alone does not guarantee lasting token demand.
Supply is worth watching. About 7.42 billion of STRK’s 10 billion maximum supply is in circulation, so future unlocks could add selling pressure.
For now, the key question is simple: can Starknet’s STRK hold $0.05 long enough to challenge $0.065?
Put Your Money Where Your Mouth is On Polymarket next
The post STRK Breakout Now Depends on $0.05 Support Holding appeared first on Coinspeaker.
495
·
--
ເປັນຄວາມຈິງບາງສ່ວນ
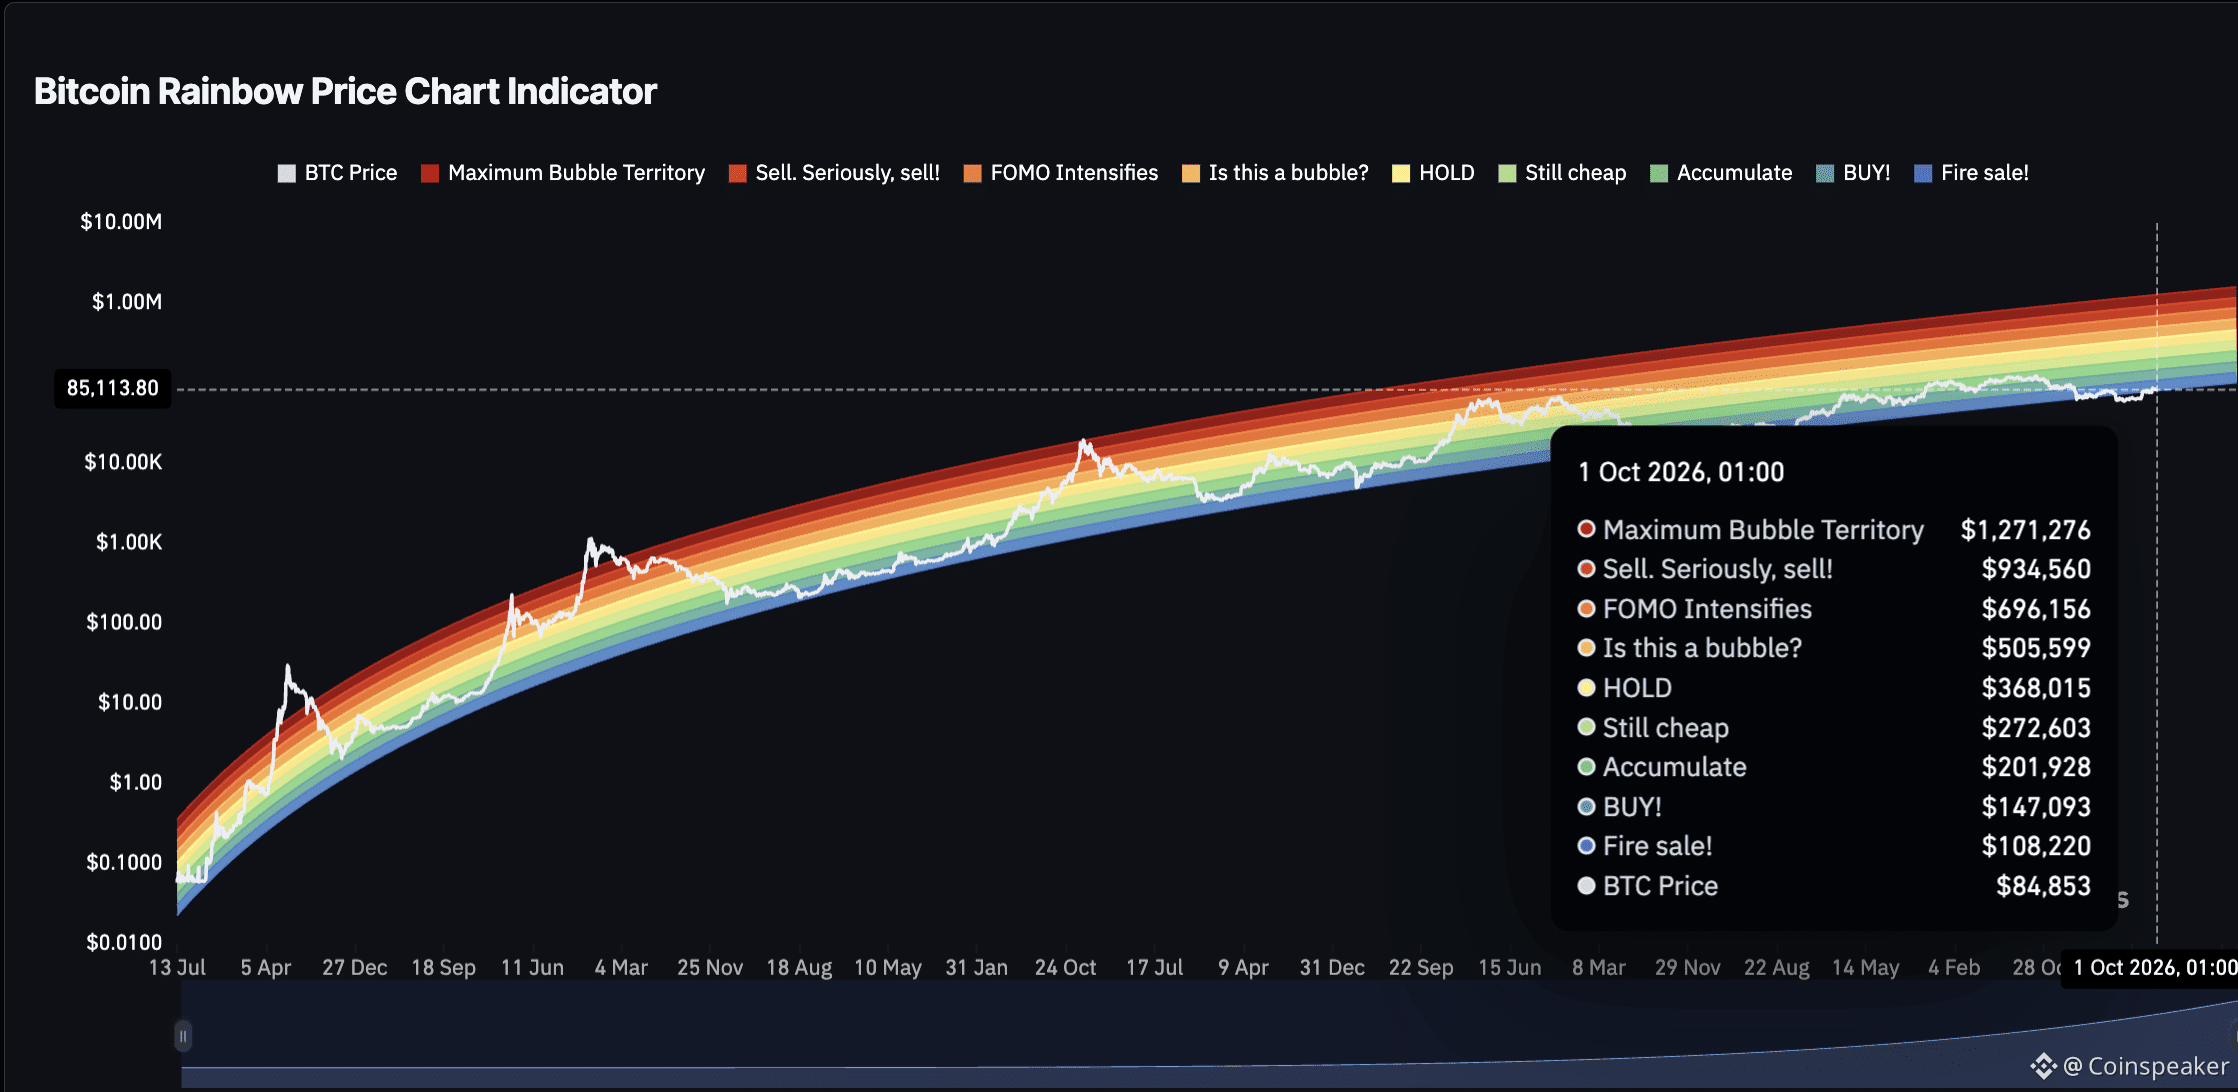
ບົດຄວາມ
Bitcoin Price Forecast: Rainbow Chart Highlights October 31 $1.36M TargetThe Bitcoin price forecast long-term valuation model, the Rainbow Chart, suggests that the cryptocurrency remains below its historical trend valuation as October begins. The outlook comes as Bitcoin failed to reclaim the $90,000 level, a move that could have opened the door to a push toward six-figure valuations.
At press time, Bitcoin was trading at $84,584, while remaining above its 50-day SMA of $78,136 and 200-day SMA of $71,404, indicating the broader uptrend remains intact.
(SOURCE: CoinGlass)
Although the Rainbow Chart’s October 31 valuation bands sit well above Bitcoin’s current price, the indicator is designed to gauge long-term valuation rather than forecast where $BTC will trade by month-end.
According to the chart, the highest valuation zone on October 31 is ‘Maximum Bubble Territory’ at $1.36M, a band historically associated with extreme market euphoria and cycle tops, a position we aren’t yet in.
What Does the Rainbow Chart Say About Bitcoin for October and Beyond?
Below, the ‘Sell. Seriously, SELL!’ zone is marked at $998,844, which corresponds to historically high valuations and increased profit-taking. The ‘FOMO Intensifies’ band is set at $733,467, indicating periods when speculative demand tends to rise.
Next is the ‘Is this a bubble?’ level at $547,041, followed by the ‘HODL!’ zone at $396,987, which is generally regarded as fair value. The ‘Still cheap’ band is positioned at $287,747, while ‘Accumulate’ is at $209,292, both suggesting undervaluation relative to Bitcoin’s long-term trend.
The ‘BUY!’ band is established at $153,802, representing significant undervaluation. The lowest band, ‘Basically a Fire Sale,’ is found at $115,355, a zone historically linked to deep discounts and extreme market pessimism.
Currently, Bitcoin is trading around $85,000, below the chart’s lowest valuation band. This highlights the discrepancy between current market prices and the model’s long-term trajectory.
Bitcoin Short-Term Price Forecast
$BTC longs are getting excited over the weekend.
We know how this'll end. pic.twitter.com/CMAZJzC0l3
— Ted (@TedPillows) October 4, 2026
While the Rainbow Chart mostly focuses on long-term valuation, Bitcoin’s recent rally toward $87,000 stalled in the short term after whales reportedly took profits on more than 30,000 BTC. The $87,000 region also coincided with the upper boundary of a trading channel that has capped prices for more than two weeks.
Not only were whales taking profits on the way up, selling more than 30,000 BTC, but $87,000 also marked the top of the channel that has rejected Bitcoin on multiple occasions.
After the rejection, $82,500 is the immediate downside target. The argument is that if Bitcoin falls to that level and whale accumulation resumes, it could confirm another rebound attempt toward $87,000.
It is highly unlikely that the Rainbow Chart’s Bitcoin Price Forecast of $1.36M by October 31 will come to fruition; however, that chart is merely a tool to show what prices could look like under different market structures.
Don’t Miss Out on Binance’s Latest Trading Pairs Bitcoin Hyper (HYPER): Scaling the King of Crypto via Solana’s Virtual Machine
Bitcoin Hyper (HYPER) is an upcoming Layer 2 blockchain on the Solana Virtual Machine (SVM) that settles directly to the Bitcoin mainnet.
Through a non-custodial canonical bridge, users can lock their BTC and mint wrapped Bitcoin on the L2, enabling near-instant finality for DeFi, NFTs, and other decentralized applications. The SVM periodically anchors transaction batches to the Bitcoin blockchain for security.
The native HYPER token is used for network gas fees, staking, governance, and premium features, with a total supply capped at 21 billion tokens. Allocations include 30% for development, 25% for treasury, and 20% for marketing.
The mainnet launch is set for Q4 2026 and will include the canonical bridge, ecosystem dApps, and exchange listings. A public presale has raised over $33.15M, nearing the $ 33.58 M target. Early contributors can buy HYPER at $0.0136867 and stake for an estimated 35% APY before the token generation event (TGE).
The public presale has raised over $33.15M and is rapidly approaching its current stage target of $33.58M. Early contributors can buy HYPER tokens at the current price of $0.0136867 and stake them immediately to earn an estimated 35% APY ahead of the token generation event (TGE).
For investors looking to gain exposure to the Bitcoin Layer 2 narrative, participating in the presale is straightforward. By visiting the official Bitcoin Hyper website, users can connect a compatible Web3 wallet to the secure widget and exchange SOL, ETH, BNB, USDC, or USDT for HYPER. The platform also supports direct purchases via traditional bank cards.
To stay updated on development milestones, mainnet announcements, and community events, you can follow Bitcoin Hyper on X and join their official Telegram channel.
Don’t Miss Out Again: Join New Bitcoin Layer 2 Early Here
Market Intelligence: Crypto Analyst Predicts Best Low-Cap Crypto
next
The post Bitcoin Price Forecast: Rainbow Chart Highlights October 31 $1.36M Target appeared first on Coinspeaker.
Bitcoin Price Forecast: Rainbow Chart Highlights October 31 $1.36M Target
The Bitcoin price forecast long-term valuation model, the Rainbow Chart, suggests that the cryptocurrency remains below its historical trend valuation as October begins. The outlook comes as Bitcoin failed to reclaim the $90,000 level, a move that could have opened the door to a push toward six-figure valuations.
At press time, Bitcoin was trading at $84,584, while remaining above its 50-day SMA of $78,136 and 200-day SMA of $71,404, indicating the broader uptrend remains intact.
(SOURCE: CoinGlass)
Although the Rainbow Chart’s October 31 valuation bands sit well above Bitcoin’s current price, the indicator is designed to gauge long-term valuation rather than forecast where $BTC will trade by month-end.
According to the chart, the highest valuation zone on October 31 is ‘Maximum Bubble Territory’ at $1.36M, a band historically associated with extreme market euphoria and cycle tops, a position we aren’t yet in.
What Does the Rainbow Chart Say About Bitcoin for October and Beyond?
Below, the ‘Sell. Seriously, SELL!’ zone is marked at $998,844, which corresponds to historically high valuations and increased profit-taking. The ‘FOMO Intensifies’ band is set at $733,467, indicating periods when speculative demand tends to rise.
Next is the ‘Is this a bubble?’ level at $547,041, followed by the ‘HODL!’ zone at $396,987, which is generally regarded as fair value. The ‘Still cheap’ band is positioned at $287,747, while ‘Accumulate’ is at $209,292, both suggesting undervaluation relative to Bitcoin’s long-term trend.
The ‘BUY!’ band is established at $153,802, representing significant undervaluation. The lowest band, ‘Basically a Fire Sale,’ is found at $115,355, a zone historically linked to deep discounts and extreme market pessimism.
Currently, Bitcoin is trading around $85,000, below the chart’s lowest valuation band. This highlights the discrepancy between current market prices and the model’s long-term trajectory.
Bitcoin Short-Term Price Forecast
$BTC longs are getting excited over the weekend.
We know how this'll end. pic.twitter.com/CMAZJzC0l3
— Ted (@TedPillows) October 4, 2026
While the Rainbow Chart mostly focuses on long-term valuation, Bitcoin’s recent rally toward $87,000 stalled in the short term after whales reportedly took profits on more than 30,000 BTC. The $87,000 region also coincided with the upper boundary of a trading channel that has capped prices for more than two weeks.
Not only were whales taking profits on the way up, selling more than 30,000 BTC, but $87,000 also marked the top of the channel that has rejected Bitcoin on multiple occasions.
After the rejection, $82,500 is the immediate downside target. The argument is that if Bitcoin falls to that level and whale accumulation resumes, it could confirm another rebound attempt toward $87,000.
It is highly unlikely that the Rainbow Chart’s Bitcoin Price Forecast of $1.36M by October 31 will come to fruition; however, that chart is merely a tool to show what prices could look like under different market structures.
Don’t Miss Out on Binance’s Latest Trading Pairs Bitcoin Hyper (HYPER): Scaling the King of Crypto via Solana’s Virtual Machine
Bitcoin Hyper (HYPER) is an upcoming Layer 2 blockchain on the Solana Virtual Machine (SVM) that settles directly to the Bitcoin mainnet.
Through a non-custodial canonical bridge, users can lock their BTC and mint wrapped Bitcoin on the L2, enabling near-instant finality for DeFi, NFTs, and other decentralized applications. The SVM periodically anchors transaction batches to the Bitcoin blockchain for security.
The native HYPER token is used for network gas fees, staking, governance, and premium features, with a total supply capped at 21 billion tokens. Allocations include 30% for development, 25% for treasury, and 20% for marketing.
The mainnet launch is set for Q4 2026 and will include the canonical bridge, ecosystem dApps, and exchange listings. A public presale has raised over $33.15M, nearing the $ 33.58 M target. Early contributors can buy HYPER at $0.0136867 and stake for an estimated 35% APY before the token generation event (TGE).
The public presale has raised over $33.15M and is rapidly approaching its current stage target of $33.58M. Early contributors can buy HYPER tokens at the current price of $0.0136867 and stake them immediately to earn an estimated 35% APY ahead of the token generation event (TGE).
For investors looking to gain exposure to the Bitcoin Layer 2 narrative, participating in the presale is straightforward. By visiting the official Bitcoin Hyper website, users can connect a compatible Web3 wallet to the secure widget and exchange SOL, ETH, BNB, USDC, or USDT for HYPER. The platform also supports direct purchases via traditional bank cards.
To stay updated on development milestones, mainnet announcements, and community events, you can follow Bitcoin Hyper on X and join their official Telegram channel.
Don’t Miss Out Again: Join New Bitcoin Layer 2 Early Here
Market Intelligence: Crypto Analyst Predicts Best Low-Cap Crypto
next
The post Bitcoin Price Forecast: Rainbow Chart Highlights October 31 $1.36M Target appeared first on Coinspeaker.
At press time, Bitcoin was trading at $84,584, while remaining above its 50-day SMA of $78,136 and 200-day SMA of $71,404, indicating the broader uptrend remains intact.
(SOURCE: CoinGlass)
Although the Rainbow Chart’s October 31 valuation bands sit well above Bitcoin’s current price, the indicator is designed to gauge long-term valuation rather than forecast where $BTC will trade by month-end.
According to the chart, the highest valuation zone on October 31 is ‘Maximum Bubble Territory’ at $1.36M, a band historically associated with extreme market euphoria and cycle tops, a position we aren’t yet in.
What Does the Rainbow Chart Say About Bitcoin for October and Beyond?
Below, the ‘Sell. Seriously, SELL!’ zone is marked at $998,844, which corresponds to historically high valuations and increased profit-taking. The ‘FOMO Intensifies’ band is set at $733,467, indicating periods when speculative demand tends to rise.
Next is the ‘Is this a bubble?’ level at $547,041, followed by the ‘HODL!’ zone at $396,987, which is generally regarded as fair value. The ‘Still cheap’ band is positioned at $287,747, while ‘Accumulate’ is at $209,292, both suggesting undervaluation relative to Bitcoin’s long-term trend.
The ‘BUY!’ band is established at $153,802, representing significant undervaluation. The lowest band, ‘Basically a Fire Sale,’ is found at $115,355, a zone historically linked to deep discounts and extreme market pessimism.
Currently, Bitcoin is trading around $85,000, below the chart’s lowest valuation band. This highlights the discrepancy between current market prices and the model’s long-term trajectory.
Bitcoin Short-Term Price Forecast
$BTC longs are getting excited over the weekend.
We know how this'll end. pic.twitter.com/CMAZJzC0l3
— Ted (@TedPillows) October 4, 2026
While the Rainbow Chart mostly focuses on long-term valuation, Bitcoin’s recent rally toward $87,000 stalled in the short term after whales reportedly took profits on more than 30,000 BTC. The $87,000 region also coincided with the upper boundary of a trading channel that has capped prices for more than two weeks.
Not only were whales taking profits on the way up, selling more than 30,000 BTC, but $87,000 also marked the top of the channel that has rejected Bitcoin on multiple occasions.
After the rejection, $82,500 is the immediate downside target. The argument is that if Bitcoin falls to that level and whale accumulation resumes, it could confirm another rebound attempt toward $87,000.
It is highly unlikely that the Rainbow Chart’s Bitcoin Price Forecast of $1.36M by October 31 will come to fruition; however, that chart is merely a tool to show what prices could look like under different market structures.
Don’t Miss Out on Binance’s Latest Trading Pairs Bitcoin Hyper (HYPER): Scaling the King of Crypto via Solana’s Virtual Machine
Bitcoin Hyper (HYPER) is an upcoming Layer 2 blockchain on the Solana Virtual Machine (SVM) that settles directly to the Bitcoin mainnet.
Through a non-custodial canonical bridge, users can lock their BTC and mint wrapped Bitcoin on the L2, enabling near-instant finality for DeFi, NFTs, and other decentralized applications. The SVM periodically anchors transaction batches to the Bitcoin blockchain for security.
The native HYPER token is used for network gas fees, staking, governance, and premium features, with a total supply capped at 21 billion tokens. Allocations include 30% for development, 25% for treasury, and 20% for marketing.
The mainnet launch is set for Q4 2026 and will include the canonical bridge, ecosystem dApps, and exchange listings. A public presale has raised over $33.15M, nearing the $ 33.58 M target. Early contributors can buy HYPER at $0.0136867 and stake for an estimated 35% APY before the token generation event (TGE).
The public presale has raised over $33.15M and is rapidly approaching its current stage target of $33.58M. Early contributors can buy HYPER tokens at the current price of $0.0136867 and stake them immediately to earn an estimated 35% APY ahead of the token generation event (TGE).
For investors looking to gain exposure to the Bitcoin Layer 2 narrative, participating in the presale is straightforward. By visiting the official Bitcoin Hyper website, users can connect a compatible Web3 wallet to the secure widget and exchange SOL, ETH, BNB, USDC, or USDT for HYPER. The platform also supports direct purchases via traditional bank cards.
To stay updated on development milestones, mainnet announcements, and community events, you can follow Bitcoin Hyper on X and join their official Telegram channel.
Don’t Miss Out Again: Join New Bitcoin Layer 2 Early Here
Market Intelligence: Crypto Analyst Predicts Best Low-Cap Crypto
next
The post Bitcoin Price Forecast: Rainbow Chart Highlights October 31 $1.36M Target appeared first on Coinspeaker.
1
1
411
·
--
ຢືນຢັນແລ້ວ
Shareholder Approval Moves Evernorth Closer to XRP Treasury LaunchIn Ripple news, Armada Acquisition Corp. II shareholders approved the SPAC’s merger with Evernorth at a September 30 meeting. The Ripple-backed XRP treasury company now expects the deal to close on October 7, with a Nasdaq debut under the ticker XRPN on October 8. Both dates remain subject to closing conditions.
At closing, Evernorth expects to hold about 473 million XRP. With XRP trading near $1.54, up 2.8% on the day, that stake is worth roughly $727 million.
Armada Acquisition Corp. II shareholders have approved the business combination with Evernorth. Thank you to every shareholder who voted, and to the XRP community that has followed every step.
Expected next:
Oct 7: Closing Oct 8: Nasdaq trading under XRPN
At closing, Evernorth… pic.twitter.com/TyYEHx6suq
— evernorthxrp (@evernorthxrp) October 1, 2026
Supercharge Your Trading in 2026 With BloFin AI Trading Bots Ripple News: Funding and Closing Conditions
The transaction is expected to generate approximately $300 million in gross cash proceeds before expenses. Evernorth’s announcement breaks that estimate into $225 million from related private placements, $30 million of incremental convertible-note financing, and approximately $48 million from Armada II’s trust proceeds; the components are approximate and should not be treated as a final proceeds figure.
Investors have also contributed XRP in kind, with approximately 473 million XRP expected to be held by Evernorth at closing. The combined company is expected to operate as Evernorth Holdings, Inc., and its Class A shares are scheduled to begin trading on Nasdaq under the ticker symbol XRPN on October 8, subject to applicable listing requirements.
A physical representation of the XRP cryptocurrency.
The announcement said 100% of both advanced and delayed funders participated. The transaction’s closing remains subject to satisfaction or waiver of the remaining conditions, so the approval vote does not establish that all financing has been completed or that the expected treasury balance is already in place.
XRPN Nasdaq Listing: The Proposed Treasury Model
Armada II is a Nasdaq-listed special purpose acquisition company sponsored by Arrington XRP Capital Fund, LP, and was founded on October 3, 2024. Evernorth’s named investors include Arrington Capital, SBI Group, Ripple, Pantera Capital, Kraken, and GSR, among others, according to the October 1 release.
Ripple’s stake is what ties this deal to wider Ripple news. Evernorth says it intends to pursue strategies designed to increase XRP per share through yield strategies, participation in the XRP ecosystem, and capital markets activities.
The company presents the structure as a regulated, liquid, and transparent way for investors to gain XRP exposure; that description is its stated proposition, not an independent assessment of the risks or likely returns.
“Going public will offer investors a regulated, transparent way to own XRP exposure and participate in the growth of the blockchain economy,” said Asheesh Birla, Evernorth’s founder and chief executive officer. “We’re grateful to our shareholders for their support as we complete this important transaction.”
DISCOVER: Claude AI Predicts BTC Path as a $215K Scenario Takes Shape
XRP Treasury: Approval Is Not Yet Execution
🚨 BREAKING: XRPN shareholders have APPROVED the Evernorth merger!
✅ Business Combination: 20.51M For vs 1.36M Against ✅ SPAC Merger: approved ✅ Domestication to Delaware: approved ✅ All advisory proposals: approved
📊94% of votes cast were in favor, with 69% of shares… https://t.co/1AP4qWCq7Z pic.twitter.com/bs0hgE8htq
— 𝗕𝗮𝗻𝗸XRP (@BankXRP) October 1, 2026
If completed, the business combination would bring a publicly traded company with a substantial, dedicated XRP treasury to Nasdaq. The XRPN listing and the company’s ability to grow XRP per share through its proposed strategies remain prospective, rather than outcomes established by the shareholder vote.
Evernorth’s announcement also identifies risks that include delays to or failure of the transaction, an inability to meet listing standards, XRP price volatility, changes in laws and regulations, and challenges executing the company’s strategy.
The analytical question is no longer whether shareholders approved the deal; it is whether closing, funding, listing, and treasury deployment proceed on the expected terms.
Market Intelligence: Crypto Security Analyst Recommends Best Anonymous Crypto Exchanges
next
The post Shareholder Approval Moves Evernorth Closer to XRP Treasury Launch appeared first on Coinspeaker.
Shareholder Approval Moves Evernorth Closer to XRP Treasury Launch
In Ripple news, Armada Acquisition Corp. II shareholders approved the SPAC’s merger with Evernorth at a September 30 meeting. The Ripple-backed XRP treasury company now expects the deal to close on October 7, with a Nasdaq debut under the ticker XRPN on October 8. Both dates remain subject to closing conditions.
At closing, Evernorth expects to hold about 473 million XRP. With XRP trading near $1.54, up 2.8% on the day, that stake is worth roughly $727 million.
Armada Acquisition Corp. II shareholders have approved the business combination with Evernorth. Thank you to every shareholder who voted, and to the XRP community that has followed every step.
Expected next:
Oct 7: Closing Oct 8: Nasdaq trading under XRPN
At closing, Evernorth… pic.twitter.com/TyYEHx6suq
— evernorthxrp (@evernorthxrp) October 1, 2026
Supercharge Your Trading in 2026 With BloFin AI Trading Bots Ripple News: Funding and Closing Conditions
The transaction is expected to generate approximately $300 million in gross cash proceeds before expenses. Evernorth’s announcement breaks that estimate into $225 million from related private placements, $30 million of incremental convertible-note financing, and approximately $48 million from Armada II’s trust proceeds; the components are approximate and should not be treated as a final proceeds figure.
Investors have also contributed XRP in kind, with approximately 473 million XRP expected to be held by Evernorth at closing. The combined company is expected to operate as Evernorth Holdings, Inc., and its Class A shares are scheduled to begin trading on Nasdaq under the ticker symbol XRPN on October 8, subject to applicable listing requirements.
A physical representation of the XRP cryptocurrency.
The announcement said 100% of both advanced and delayed funders participated. The transaction’s closing remains subject to satisfaction or waiver of the remaining conditions, so the approval vote does not establish that all financing has been completed or that the expected treasury balance is already in place.
XRPN Nasdaq Listing: The Proposed Treasury Model
Armada II is a Nasdaq-listed special purpose acquisition company sponsored by Arrington XRP Capital Fund, LP, and was founded on October 3, 2024. Evernorth’s named investors include Arrington Capital, SBI Group, Ripple, Pantera Capital, Kraken, and GSR, among others, according to the October 1 release.
Ripple’s stake is what ties this deal to wider Ripple news. Evernorth says it intends to pursue strategies designed to increase XRP per share through yield strategies, participation in the XRP ecosystem, and capital markets activities.
The company presents the structure as a regulated, liquid, and transparent way for investors to gain XRP exposure; that description is its stated proposition, not an independent assessment of the risks or likely returns.
“Going public will offer investors a regulated, transparent way to own XRP exposure and participate in the growth of the blockchain economy,” said Asheesh Birla, Evernorth’s founder and chief executive officer. “We’re grateful to our shareholders for their support as we complete this important transaction.”
DISCOVER: Claude AI Predicts BTC Path as a $215K Scenario Takes Shape
XRP Treasury: Approval Is Not Yet Execution
🚨 BREAKING: XRPN shareholders have APPROVED the Evernorth merger!
✅ Business Combination: 20.51M For vs 1.36M Against ✅ SPAC Merger: approved ✅ Domestication to Delaware: approved ✅ All advisory proposals: approved
📊94% of votes cast were in favor, with 69% of shares… https://t.co/1AP4qWCq7Z pic.twitter.com/bs0hgE8htq
— 𝗕𝗮𝗻𝗸XRP (@BankXRP) October 1, 2026
If completed, the business combination would bring a publicly traded company with a substantial, dedicated XRP treasury to Nasdaq. The XRPN listing and the company’s ability to grow XRP per share through its proposed strategies remain prospective, rather than outcomes established by the shareholder vote.
Evernorth’s announcement also identifies risks that include delays to or failure of the transaction, an inability to meet listing standards, XRP price volatility, changes in laws and regulations, and challenges executing the company’s strategy.
The analytical question is no longer whether shareholders approved the deal; it is whether closing, funding, listing, and treasury deployment proceed on the expected terms.
Market Intelligence: Crypto Security Analyst Recommends Best Anonymous Crypto Exchanges
next
The post Shareholder Approval Moves Evernorth Closer to XRP Treasury Launch appeared first on Coinspeaker.
At closing, Evernorth expects to hold about 473 million XRP. With XRP trading near $1.54, up 2.8% on the day, that stake is worth roughly $727 million.
Armada Acquisition Corp. II shareholders have approved the business combination with Evernorth. Thank you to every shareholder who voted, and to the XRP community that has followed every step.
Expected next:
Oct 7: Closing Oct 8: Nasdaq trading under XRPN
At closing, Evernorth… pic.twitter.com/TyYEHx6suq
— evernorthxrp (@evernorthxrp) October 1, 2026
Supercharge Your Trading in 2026 With BloFin AI Trading Bots Ripple News: Funding and Closing Conditions
The transaction is expected to generate approximately $300 million in gross cash proceeds before expenses. Evernorth’s announcement breaks that estimate into $225 million from related private placements, $30 million of incremental convertible-note financing, and approximately $48 million from Armada II’s trust proceeds; the components are approximate and should not be treated as a final proceeds figure.
Investors have also contributed XRP in kind, with approximately 473 million XRP expected to be held by Evernorth at closing. The combined company is expected to operate as Evernorth Holdings, Inc., and its Class A shares are scheduled to begin trading on Nasdaq under the ticker symbol XRPN on October 8, subject to applicable listing requirements.
A physical representation of the XRP cryptocurrency.
The announcement said 100% of both advanced and delayed funders participated. The transaction’s closing remains subject to satisfaction or waiver of the remaining conditions, so the approval vote does not establish that all financing has been completed or that the expected treasury balance is already in place.
XRPN Nasdaq Listing: The Proposed Treasury Model
Armada II is a Nasdaq-listed special purpose acquisition company sponsored by Arrington XRP Capital Fund, LP, and was founded on October 3, 2024. Evernorth’s named investors include Arrington Capital, SBI Group, Ripple, Pantera Capital, Kraken, and GSR, among others, according to the October 1 release.
Ripple’s stake is what ties this deal to wider Ripple news. Evernorth says it intends to pursue strategies designed to increase XRP per share through yield strategies, participation in the XRP ecosystem, and capital markets activities.
The company presents the structure as a regulated, liquid, and transparent way for investors to gain XRP exposure; that description is its stated proposition, not an independent assessment of the risks or likely returns.
“Going public will offer investors a regulated, transparent way to own XRP exposure and participate in the growth of the blockchain economy,” said Asheesh Birla, Evernorth’s founder and chief executive officer. “We’re grateful to our shareholders for their support as we complete this important transaction.”
DISCOVER: Claude AI Predicts BTC Path as a $215K Scenario Takes Shape
XRP Treasury: Approval Is Not Yet Execution
🚨 BREAKING: XRPN shareholders have APPROVED the Evernorth merger!
✅ Business Combination: 20.51M For vs 1.36M Against ✅ SPAC Merger: approved ✅ Domestication to Delaware: approved ✅ All advisory proposals: approved
📊94% of votes cast were in favor, with 69% of shares… https://t.co/1AP4qWCq7Z pic.twitter.com/bs0hgE8htq
— 𝗕𝗮𝗻𝗸XRP (@BankXRP) October 1, 2026
If completed, the business combination would bring a publicly traded company with a substantial, dedicated XRP treasury to Nasdaq. The XRPN listing and the company’s ability to grow XRP per share through its proposed strategies remain prospective, rather than outcomes established by the shareholder vote.
Evernorth’s announcement also identifies risks that include delays to or failure of the transaction, an inability to meet listing standards, XRP price volatility, changes in laws and regulations, and challenges executing the company’s strategy.
The analytical question is no longer whether shareholders approved the deal; it is whether closing, funding, listing, and treasury deployment proceed on the expected terms.
Market Intelligence: Crypto Security Analyst Recommends Best Anonymous Crypto Exchanges
next
The post Shareholder Approval Moves Evernorth Closer to XRP Treasury Launch appeared first on Coinspeaker.
1
324
·
--
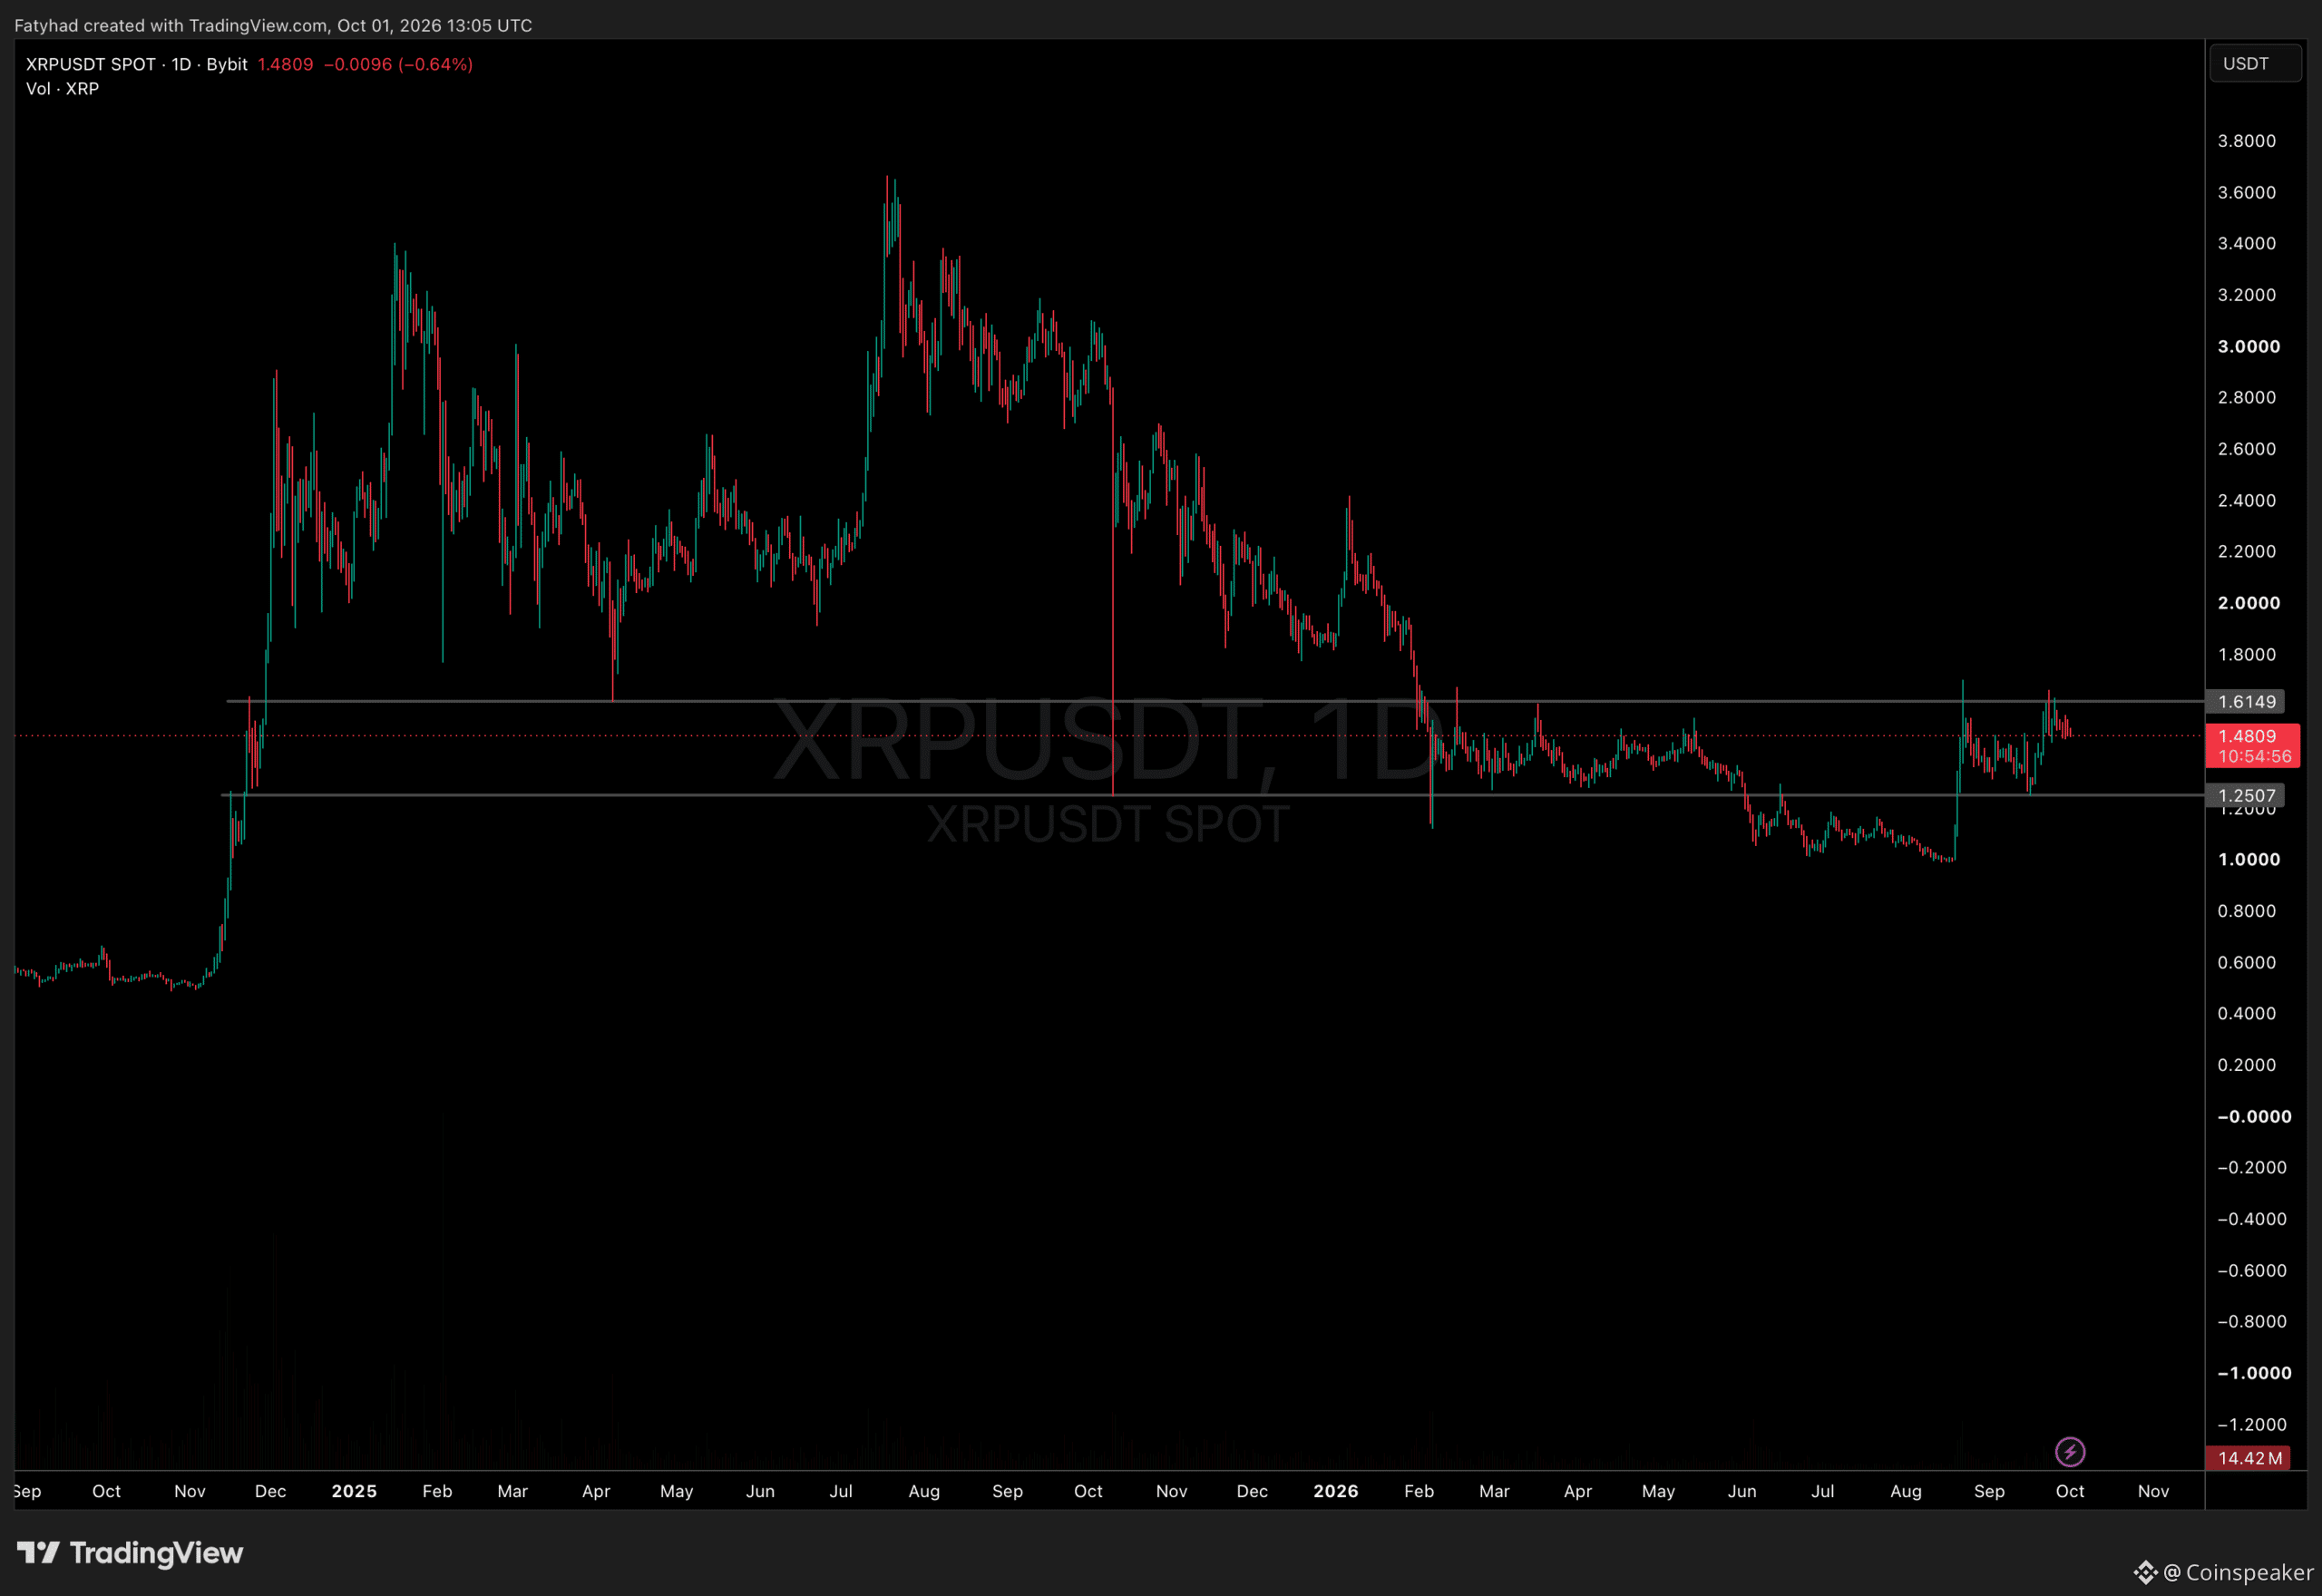
ບົດຄວາມ
XRP Price Forecast: Analyst Predicts $25 XRP in 4 YearsA $25 XRP price forecast for 2030 would require a dramatic repricing. From about $1.47 on October 1, 2026, XRP would need to rise roughly 1,588%. The token is now trading lower on the day, down about 3.4% in the last 24 hours. The $25 target remains one analyst scenario, not a market consensus.
So what would have to change to make it realistic? At $25, XRP’s market cap would reach about $1.58 trillion, up from roughly $93 billion today. That would put it close to Bitcoin’s current valuation of about $1.69 trillion.
🚨 JUST IN: Ripple locks 700 MILLION $XRP back into escrow
🔒 400M XRP 🔒 300M XRP 700M $XRP locked following today's 1B XRP escrow unlock.
Only 300M XRP remains outside these new locks. https://t.co/Ou6lNE7Zjg pic.twitter.com/u1vl0AIkob
— Xaif Crypto (@Xaif_Crypto) October 1, 2026
Put Your Money Where Your Mouth is On Polymarket Ripple in 4 Years: What Would a $25 XRP Price Require?
The forecast points to XRP’s history of sharp moves, including a 46% rally over 90 days. Still, the token remains far below its $3.65 all-time high from July 2025.
Reaching $1.58 trillion would take a major expansion of the overall crypto market, large market share gains for XRP, or both. A separate XRP forecast comparing a $5.40 target with the $25 projection shows how far apart analyst expectations still are.
For the four-year target, the market-cap arithmetic is the harder hurdle: reaching $1.58 trillion would require broad crypto-market expansion, substantial XRP share gains, or both. A separate XRP forecast comparing a $5.40 target with the $25 projection offers a useful measure of how wide analyst expectations remain.
For now, the immediate levels matter more than the headline number.
Market Intelligence: Crypto Security Analyst Recommends Best Anonymous Crypto Exchanges
XRP Price Forecast: Can XRP Price Reach $25 by 2030?
XRPUSDT Chart 1D TradingView
In the near term, the picture is much narrower. XRP has recovered from its September lows and is now consolidating. Traders are watching how the market absorbs Ripple’s 1 billion XRP escrow unlock on October 1. Daily volume sits around $3 billion. That shows activity, but not necessarily lasting demand.
The daily chart shows XRP stuck in a range it has held since February:
Resistance: $1.55–$1.59, then the $1.61 range ceiling and the wider $1.60–$1.70 zone
Support: $1.47–$1.50, then $1.38, with the range floor near $1.25
October outlook flags a symmetrical triangle on the four-hour chart. A breakout could target about $1.83, while a breakdown could put $1.25 at risk. For now, neither has happened. Here are some near-term possible scenarios:
XRP holds $1.47–$1.50, reclaims $1.59, and clears $1.70. That would make $1.83 the next technical target.
Price stays in its range as the triangle tightens. In this scenario, $25 remains far from current evidence.
XRP loses $1.47 support, opening a move toward $1.38, then the $1.25 range floor.
For any long-term XRP price forecast, the near-term levels matter first. XRP needs to break out of its eight-month range before a $25 target can be taken seriously.
Market Intelligence: Crypto Analyst Predicts Best Low-Cap Crypto
LiquidChain Targets Early Mover Upside as XRP Tests Key Levels
XRP’s rebound has improved the short-term picture, but resistance caps the near-term case. Even if buyers push through $1.70, a rise to $25 would still demand a much larger change in valuation and market share. That gap helps explain why some traders look beyond established assets toward infrastructure projects at an earlier stage. An earlier entry also brings greater execution and liquidity risk.
LiquidChain ($LIQUID) describes itself as a Layer 3 (L3) infrastructure project that fuses Bitcoin, Ethereum, and Solana liquidity into a single execution environment. Its Unified Liquidity Layer and Deploy-Once Architecture let developers build once and reach all three ecosystems instead of fragmenting liquidity across chains.
At this stage, the token price stands at $0.01496, while the total raised reaches $979K. As with any presale, capital is at risk, and the project remains unproven at scale, so due diligence matters here as much as anywhere else.
Those curious can research LiquidChain directly.
Layer 3 Is Already Here, Smart Money Knows It – Do You? next
The post XRP Price Forecast: Analyst Predicts $25 XRP in 4 Years appeared first on Coinspeaker.
XRP Price Forecast: Analyst Predicts $25 XRP in 4 Years
A $25 XRP price forecast for 2030 would require a dramatic repricing. From about $1.47 on October 1, 2026, XRP would need to rise roughly 1,588%. The token is now trading lower on the day, down about 3.4% in the last 24 hours. The $25 target remains one analyst scenario, not a market consensus.
So what would have to change to make it realistic? At $25, XRP’s market cap would reach about $1.58 trillion, up from roughly $93 billion today. That would put it close to Bitcoin’s current valuation of about $1.69 trillion.
🚨 JUST IN: Ripple locks 700 MILLION $XRP back into escrow
🔒 400M XRP 🔒 300M XRP 700M $XRP locked following today's 1B XRP escrow unlock.
Only 300M XRP remains outside these new locks. https://t.co/Ou6lNE7Zjg pic.twitter.com/u1vl0AIkob
— Xaif Crypto (@Xaif_Crypto) October 1, 2026
Put Your Money Where Your Mouth is On Polymarket Ripple in 4 Years: What Would a $25 XRP Price Require?
The forecast points to XRP’s history of sharp moves, including a 46% rally over 90 days. Still, the token remains far below its $3.65 all-time high from July 2025.
Reaching $1.58 trillion would take a major expansion of the overall crypto market, large market share gains for XRP, or both. A separate XRP forecast comparing a $5.40 target with the $25 projection shows how far apart analyst expectations still are.
For the four-year target, the market-cap arithmetic is the harder hurdle: reaching $1.58 trillion would require broad crypto-market expansion, substantial XRP share gains, or both. A separate XRP forecast comparing a $5.40 target with the $25 projection offers a useful measure of how wide analyst expectations remain.
For now, the immediate levels matter more than the headline number.
Market Intelligence: Crypto Security Analyst Recommends Best Anonymous Crypto Exchanges
XRP Price Forecast: Can XRP Price Reach $25 by 2030?
XRPUSDT Chart 1D TradingView
In the near term, the picture is much narrower. XRP has recovered from its September lows and is now consolidating. Traders are watching how the market absorbs Ripple’s 1 billion XRP escrow unlock on October 1. Daily volume sits around $3 billion. That shows activity, but not necessarily lasting demand.
The daily chart shows XRP stuck in a range it has held since February:
Resistance: $1.55–$1.59, then the $1.61 range ceiling and the wider $1.60–$1.70 zone
Support: $1.47–$1.50, then $1.38, with the range floor near $1.25
October outlook flags a symmetrical triangle on the four-hour chart. A breakout could target about $1.83, while a breakdown could put $1.25 at risk. For now, neither has happened. Here are some near-term possible scenarios:
XRP holds $1.47–$1.50, reclaims $1.59, and clears $1.70. That would make $1.83 the next technical target.
Price stays in its range as the triangle tightens. In this scenario, $25 remains far from current evidence.
XRP loses $1.47 support, opening a move toward $1.38, then the $1.25 range floor.
For any long-term XRP price forecast, the near-term levels matter first. XRP needs to break out of its eight-month range before a $25 target can be taken seriously.
Market Intelligence: Crypto Analyst Predicts Best Low-Cap Crypto
LiquidChain Targets Early Mover Upside as XRP Tests Key Levels
XRP’s rebound has improved the short-term picture, but resistance caps the near-term case. Even if buyers push through $1.70, a rise to $25 would still demand a much larger change in valuation and market share. That gap helps explain why some traders look beyond established assets toward infrastructure projects at an earlier stage. An earlier entry also brings greater execution and liquidity risk.
LiquidChain ($LIQUID) describes itself as a Layer 3 (L3) infrastructure project that fuses Bitcoin, Ethereum, and Solana liquidity into a single execution environment. Its Unified Liquidity Layer and Deploy-Once Architecture let developers build once and reach all three ecosystems instead of fragmenting liquidity across chains.
At this stage, the token price stands at $0.01496, while the total raised reaches $979K. As with any presale, capital is at risk, and the project remains unproven at scale, so due diligence matters here as much as anywhere else.
Those curious can research LiquidChain directly.
Layer 3 Is Already Here, Smart Money Knows It – Do You? next
The post XRP Price Forecast: Analyst Predicts $25 XRP in 4 Years appeared first on Coinspeaker.
So what would have to change to make it realistic? At $25, XRP’s market cap would reach about $1.58 trillion, up from roughly $93 billion today. That would put it close to Bitcoin’s current valuation of about $1.69 trillion.
🚨 JUST IN: Ripple locks 700 MILLION $XRP back into escrow
🔒 400M XRP 🔒 300M XRP 700M $XRP locked following today's 1B XRP escrow unlock.
Only 300M XRP remains outside these new locks. https://t.co/Ou6lNE7Zjg pic.twitter.com/u1vl0AIkob
— Xaif Crypto (@Xaif_Crypto) October 1, 2026
Put Your Money Where Your Mouth is On Polymarket Ripple in 4 Years: What Would a $25 XRP Price Require?
The forecast points to XRP’s history of sharp moves, including a 46% rally over 90 days. Still, the token remains far below its $3.65 all-time high from July 2025.
Reaching $1.58 trillion would take a major expansion of the overall crypto market, large market share gains for XRP, or both. A separate XRP forecast comparing a $5.40 target with the $25 projection shows how far apart analyst expectations still are.
For the four-year target, the market-cap arithmetic is the harder hurdle: reaching $1.58 trillion would require broad crypto-market expansion, substantial XRP share gains, or both. A separate XRP forecast comparing a $5.40 target with the $25 projection offers a useful measure of how wide analyst expectations remain.
For now, the immediate levels matter more than the headline number.
Market Intelligence: Crypto Security Analyst Recommends Best Anonymous Crypto Exchanges
XRP Price Forecast: Can XRP Price Reach $25 by 2030?
XRPUSDT Chart 1D TradingView
In the near term, the picture is much narrower. XRP has recovered from its September lows and is now consolidating. Traders are watching how the market absorbs Ripple’s 1 billion XRP escrow unlock on October 1. Daily volume sits around $3 billion. That shows activity, but not necessarily lasting demand.
The daily chart shows XRP stuck in a range it has held since February:
Resistance: $1.55–$1.59, then the $1.61 range ceiling and the wider $1.60–$1.70 zone
Support: $1.47–$1.50, then $1.38, with the range floor near $1.25
October outlook flags a symmetrical triangle on the four-hour chart. A breakout could target about $1.83, while a breakdown could put $1.25 at risk. For now, neither has happened. Here are some near-term possible scenarios:
XRP holds $1.47–$1.50, reclaims $1.59, and clears $1.70. That would make $1.83 the next technical target.
Price stays in its range as the triangle tightens. In this scenario, $25 remains far from current evidence.
XRP loses $1.47 support, opening a move toward $1.38, then the $1.25 range floor.
For any long-term XRP price forecast, the near-term levels matter first. XRP needs to break out of its eight-month range before a $25 target can be taken seriously.
Market Intelligence: Crypto Analyst Predicts Best Low-Cap Crypto
LiquidChain Targets Early Mover Upside as XRP Tests Key Levels
XRP’s rebound has improved the short-term picture, but resistance caps the near-term case. Even if buyers push through $1.70, a rise to $25 would still demand a much larger change in valuation and market share. That gap helps explain why some traders look beyond established assets toward infrastructure projects at an earlier stage. An earlier entry also brings greater execution and liquidity risk.
LiquidChain ($LIQUID) describes itself as a Layer 3 (L3) infrastructure project that fuses Bitcoin, Ethereum, and Solana liquidity into a single execution environment. Its Unified Liquidity Layer and Deploy-Once Architecture let developers build once and reach all three ecosystems instead of fragmenting liquidity across chains.
At this stage, the token price stands at $0.01496, while the total raised reaches $979K. As with any presale, capital is at risk, and the project remains unproven at scale, so due diligence matters here as much as anywhere else.
Those curious can research LiquidChain directly.
Layer 3 Is Already Here, Smart Money Knows It – Do You? next
The post XRP Price Forecast: Analyst Predicts $25 XRP in 4 Years appeared first on Coinspeaker.
1
463
·
--
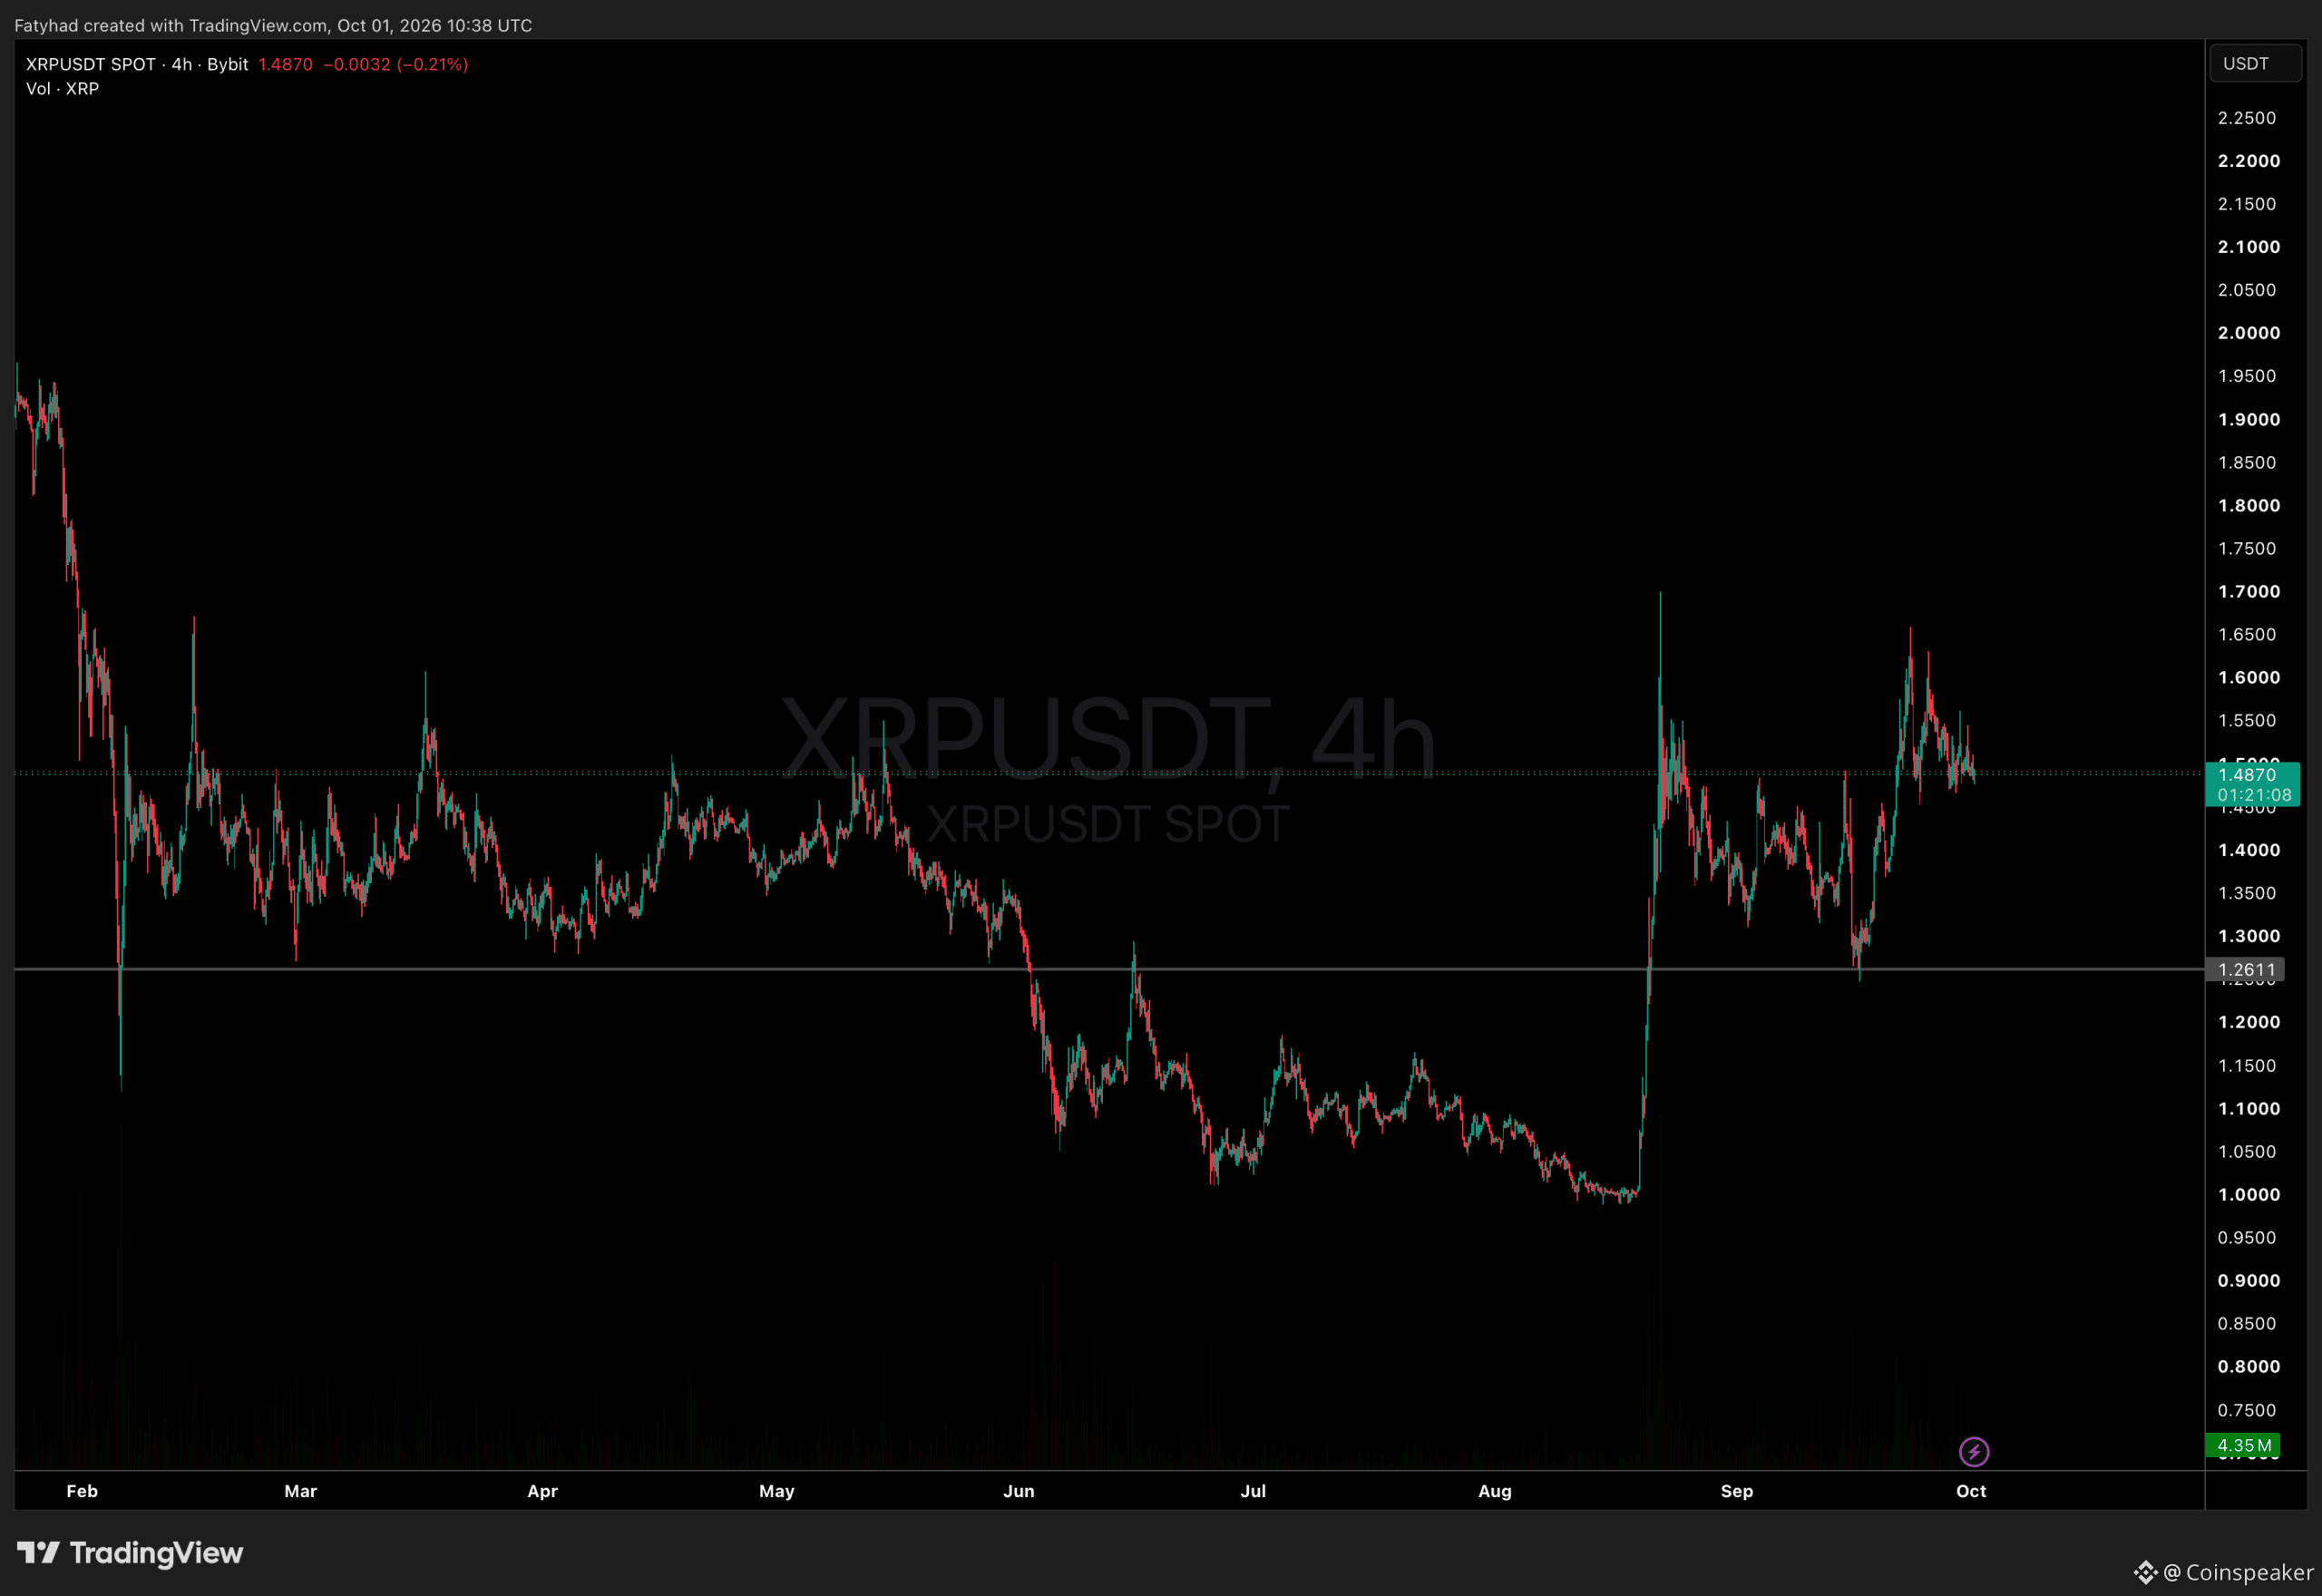
ບົດຄວາມ
Three Amendments Define the Path to XRPL LendingIn XRP news, the XRP Ledger has opened validator voting on LendingProtocolV1_1. The amendment would introduce closed-ended lending vaults. It would also recognize interest when borrowers pay, rather than when loans originate.
This vote alone will not launch XRPL lending on mainnet. The amendment needs support from more than 80% of trusted validators. That support must hold for two weeks. Two other amendments, LendingProtocol and SingleAssetVault, must also pass.
So this is not a simple vote on a vault feature. It is one governance gate in a rollout of three amendments. Clearing a single stage sets no launch timetable. It also says nothing about the demand for the eventual lending service.
LendingProtocolV1_1 is open for validator voting.
It introduces closed-ended vaults and cash-basis accounting for XRPL lending, and it must activate before LendingProtocol and SingleAssetVault can proceed.
Validators, read what changes and why it matters as you evaluate the…
— RippleX (@RippleXDev) September 30, 2026
Supercharge Your Trading in 2026 With BloFin AI Trading Bots XRPL Lending: What LendingProtocolV1_1 Changes
The XRPL Lending Protocol documentation describes LendingProtocolV1_1 as an extension of LendingProtocol and SingleAssetVault. Its central structural change is a closed-ended vault with three stages: subscription, investment, and redemption.
Once the subscription window closes, no new shares can be issued during investment or redemption, fixing the vault’s membership before its lending period begins.
The amendment replaces open-ended vaults with closed-ended ones, restricting new brokers to fixed-term deposits and redemptions. A cash-basis accounting shift records interest only upon payment, so AssetsTotal reflects received rather than expected interest; loans remain unchanged.
Three XRP Ledger amendments: LendingProtocol (engine), SingleAssetVault (pooling), and LendingProtocolV1_1 (vaults and accounting), must all be enabled.
The protocol supports fixed-term, uncollateralized loans with off-chain underwriting; broker first-loss capital provides partial default cover but does not remove credit risk. If the cover falls below the minimum, brokers cannot issue loans or collect fees.
DISCOVER: Claude AI Predicts BTC Path as a $215K Scenario Takes Shape
XRP Ledger Amendments: Validator Voting and the Launch Gate
XRPL network rules require more than 80% support from trusted validators for two weeks before an amendment can activate. If support falls below that threshold, the two-week period restarts. Validators check the amendment status at each flag ledger, usually about 15 minutes apart, while the network counts a majority every 256th ledger.
A conceptual representation of a blockchain network.
The current support for LendingProtocolV1_1 was not available in the materials reviewed, so its distance from activation cannot be established. The open vote is evidence that the amendment is at the validator-voting stage, not evidence that it has crossed the threshold; no launch or activation date has been confirmed.
The constructive path requires LendingProtocolV1_1 to maintain the required support for two weeks, followed by approval of LendingProtocol and SingleAssetVault. The rollout would remain incomplete if support fell below the threshold and the clock restarted, or if either of the other amendments failed to activate. The available source provides no evidence about how much activity the completed protocol would attract.
There is also a software consequence for validators. Servers running older xrpld releases without the amendment code can become amendment blocked. They would lose the ability to validate ledgers, process transactions, join consensus, or vote on future amendments until they run compatible software.
Validator voting, therefore, determines not only the amendment’s governance status but also which software versions can continue participating if it activates.
Market Intelligence: Crypto Security Analyst Recommends Best Anonymous Crypto Exchanges
XRP News: The Milestones That Matter
XRPUSDT Chart 4H TradingView
The next milestones are clear. The support level must hold above 80% for two weeks. Both LendingProtocol and SingleAssetVault must then be approved. These are the conditions for the full lending stack. They are not a guarantee of adoption. Meaningful XRPL DeFi activity still depends on the amendments clearing governance.
Closed-ended vaults could give lenders a defined timetable. Cash-basis accounting could make reported income less dependent on unpaid future interest. Those are design changes, not evidence of market demand. All three amendments must be enabled first. Until then, the vote is a launch gate rather than a mainnet launch.
The price action reflects that caution. XRP trades at $1.4870, down 0.21% on the day. The token has recovered from its August low near $1.00. It now sits in a range between $1.26 and $1.65.
So far, the governance vote has not moved the market. The latest XRP news has not produced a breakout. The $1.2611 level is the floor to watch. A daily close above $1.65 would signal that traders are pricing in the lending stack.
Market Intelligence: Crypto Analyst Reveals Upcoming Coinbase Listings
next
The post Three Amendments Define the Path to XRPL Lending appeared first on Coinspeaker.
Three Amendments Define the Path to XRPL Lending
In XRP news, the XRP Ledger has opened validator voting on LendingProtocolV1_1. The amendment would introduce closed-ended lending vaults. It would also recognize interest when borrowers pay, rather than when loans originate.
This vote alone will not launch XRPL lending on mainnet. The amendment needs support from more than 80% of trusted validators. That support must hold for two weeks. Two other amendments, LendingProtocol and SingleAssetVault, must also pass.
So this is not a simple vote on a vault feature. It is one governance gate in a rollout of three amendments. Clearing a single stage sets no launch timetable. It also says nothing about the demand for the eventual lending service.
LendingProtocolV1_1 is open for validator voting.
It introduces closed-ended vaults and cash-basis accounting for XRPL lending, and it must activate before LendingProtocol and SingleAssetVault can proceed.
Validators, read what changes and why it matters as you evaluate the…
— RippleX (@RippleXDev) September 30, 2026
Supercharge Your Trading in 2026 With BloFin AI Trading Bots XRPL Lending: What LendingProtocolV1_1 Changes
The XRPL Lending Protocol documentation describes LendingProtocolV1_1 as an extension of LendingProtocol and SingleAssetVault. Its central structural change is a closed-ended vault with three stages: subscription, investment, and redemption.
Once the subscription window closes, no new shares can be issued during investment or redemption, fixing the vault’s membership before its lending period begins.
The amendment replaces open-ended vaults with closed-ended ones, restricting new brokers to fixed-term deposits and redemptions. A cash-basis accounting shift records interest only upon payment, so AssetsTotal reflects received rather than expected interest; loans remain unchanged.
Three XRP Ledger amendments: LendingProtocol (engine), SingleAssetVault (pooling), and LendingProtocolV1_1 (vaults and accounting), must all be enabled.
The protocol supports fixed-term, uncollateralized loans with off-chain underwriting; broker first-loss capital provides partial default cover but does not remove credit risk. If the cover falls below the minimum, brokers cannot issue loans or collect fees.
DISCOVER: Claude AI Predicts BTC Path as a $215K Scenario Takes Shape
XRP Ledger Amendments: Validator Voting and the Launch Gate
XRPL network rules require more than 80% support from trusted validators for two weeks before an amendment can activate. If support falls below that threshold, the two-week period restarts. Validators check the amendment status at each flag ledger, usually about 15 minutes apart, while the network counts a majority every 256th ledger.
A conceptual representation of a blockchain network.
The current support for LendingProtocolV1_1 was not available in the materials reviewed, so its distance from activation cannot be established. The open vote is evidence that the amendment is at the validator-voting stage, not evidence that it has crossed the threshold; no launch or activation date has been confirmed.
The constructive path requires LendingProtocolV1_1 to maintain the required support for two weeks, followed by approval of LendingProtocol and SingleAssetVault. The rollout would remain incomplete if support fell below the threshold and the clock restarted, or if either of the other amendments failed to activate. The available source provides no evidence about how much activity the completed protocol would attract.
There is also a software consequence for validators. Servers running older xrpld releases without the amendment code can become amendment blocked. They would lose the ability to validate ledgers, process transactions, join consensus, or vote on future amendments until they run compatible software.
Validator voting, therefore, determines not only the amendment’s governance status but also which software versions can continue participating if it activates.
Market Intelligence: Crypto Security Analyst Recommends Best Anonymous Crypto Exchanges
XRP News: The Milestones That Matter
XRPUSDT Chart 4H TradingView
The next milestones are clear. The support level must hold above 80% for two weeks. Both LendingProtocol and SingleAssetVault must then be approved. These are the conditions for the full lending stack. They are not a guarantee of adoption. Meaningful XRPL DeFi activity still depends on the amendments clearing governance.
Closed-ended vaults could give lenders a defined timetable. Cash-basis accounting could make reported income less dependent on unpaid future interest. Those are design changes, not evidence of market demand. All three amendments must be enabled first. Until then, the vote is a launch gate rather than a mainnet launch.
The price action reflects that caution. XRP trades at $1.4870, down 0.21% on the day. The token has recovered from its August low near $1.00. It now sits in a range between $1.26 and $1.65.
So far, the governance vote has not moved the market. The latest XRP news has not produced a breakout. The $1.2611 level is the floor to watch. A daily close above $1.65 would signal that traders are pricing in the lending stack.
Market Intelligence: Crypto Analyst Reveals Upcoming Coinbase Listings
next
The post Three Amendments Define the Path to XRPL Lending appeared first on Coinspeaker.
This vote alone will not launch XRPL lending on mainnet. The amendment needs support from more than 80% of trusted validators. That support must hold for two weeks. Two other amendments, LendingProtocol and SingleAssetVault, must also pass.
So this is not a simple vote on a vault feature. It is one governance gate in a rollout of three amendments. Clearing a single stage sets no launch timetable. It also says nothing about the demand for the eventual lending service.
LendingProtocolV1_1 is open for validator voting.
It introduces closed-ended vaults and cash-basis accounting for XRPL lending, and it must activate before LendingProtocol and SingleAssetVault can proceed.
Validators, read what changes and why it matters as you evaluate the…
— RippleX (@RippleXDev) September 30, 2026
Supercharge Your Trading in 2026 With BloFin AI Trading Bots XRPL Lending: What LendingProtocolV1_1 Changes
The XRPL Lending Protocol documentation describes LendingProtocolV1_1 as an extension of LendingProtocol and SingleAssetVault. Its central structural change is a closed-ended vault with three stages: subscription, investment, and redemption.
Once the subscription window closes, no new shares can be issued during investment or redemption, fixing the vault’s membership before its lending period begins.
The amendment replaces open-ended vaults with closed-ended ones, restricting new brokers to fixed-term deposits and redemptions. A cash-basis accounting shift records interest only upon payment, so AssetsTotal reflects received rather than expected interest; loans remain unchanged.
Three XRP Ledger amendments: LendingProtocol (engine), SingleAssetVault (pooling), and LendingProtocolV1_1 (vaults and accounting), must all be enabled.
The protocol supports fixed-term, uncollateralized loans with off-chain underwriting; broker first-loss capital provides partial default cover but does not remove credit risk. If the cover falls below the minimum, brokers cannot issue loans or collect fees.
DISCOVER: Claude AI Predicts BTC Path as a $215K Scenario Takes Shape
XRP Ledger Amendments: Validator Voting and the Launch Gate
XRPL network rules require more than 80% support from trusted validators for two weeks before an amendment can activate. If support falls below that threshold, the two-week period restarts. Validators check the amendment status at each flag ledger, usually about 15 minutes apart, while the network counts a majority every 256th ledger.
A conceptual representation of a blockchain network.
The current support for LendingProtocolV1_1 was not available in the materials reviewed, so its distance from activation cannot be established. The open vote is evidence that the amendment is at the validator-voting stage, not evidence that it has crossed the threshold; no launch or activation date has been confirmed.
The constructive path requires LendingProtocolV1_1 to maintain the required support for two weeks, followed by approval of LendingProtocol and SingleAssetVault. The rollout would remain incomplete if support fell below the threshold and the clock restarted, or if either of the other amendments failed to activate. The available source provides no evidence about how much activity the completed protocol would attract.
There is also a software consequence for validators. Servers running older xrpld releases without the amendment code can become amendment blocked. They would lose the ability to validate ledgers, process transactions, join consensus, or vote on future amendments until they run compatible software.
Validator voting, therefore, determines not only the amendment’s governance status but also which software versions can continue participating if it activates.
Market Intelligence: Crypto Security Analyst Recommends Best Anonymous Crypto Exchanges
XRP News: The Milestones That Matter
XRPUSDT Chart 4H TradingView
The next milestones are clear. The support level must hold above 80% for two weeks. Both LendingProtocol and SingleAssetVault must then be approved. These are the conditions for the full lending stack. They are not a guarantee of adoption. Meaningful XRPL DeFi activity still depends on the amendments clearing governance.
Closed-ended vaults could give lenders a defined timetable. Cash-basis accounting could make reported income less dependent on unpaid future interest. Those are design changes, not evidence of market demand. All three amendments must be enabled first. Until then, the vote is a launch gate rather than a mainnet launch.
The price action reflects that caution. XRP trades at $1.4870, down 0.21% on the day. The token has recovered from its August low near $1.00. It now sits in a range between $1.26 and $1.65.
So far, the governance vote has not moved the market. The latest XRP news has not produced a breakout. The $1.2611 level is the floor to watch. A daily close above $1.65 would signal that traders are pricing in the lending stack.
Market Intelligence: Crypto Analyst Reveals Upcoming Coinbase Listings
next
The post Three Amendments Define the Path to XRPL Lending appeared first on Coinspeaker.
280
·
--
Polygon Puts Stablecoin Routing Behind Merchant CheckoutPolygon introduced Crypto Checkout on 1 October 2026, a merchant payments product that brings stablecoin and other digital dollars into everyday checkout. Users may employ various supported wallets, tokens, and blockchain networks, while businesses can select the assets they receive.
Merchants can set settlement in assets such as USDC and USDT, and the checkout flow aims to coordinate conversion and cross-chain routing without requiring a separate integration for each payment path.
This is not merely another crypto payment button. It aims to separate the asset and network a customer uses from the stablecoin a merchant prefers to receive. This approach reduces fragmentation that might block a purchase even when the buyer has adequate funds.
Introducing stablecoin payments at checkout, now live in Polygon OMS.
Add ‘pay with crypto’ to the checkout you already run. Customers can pay across wallets, tokens, and chains without leaving your store to swap, bridge, or cash out. pic.twitter.com/Jr20lr8bRx
— Polygon (@0xPolygon) September 30, 2026
Sign Up With MergeX And Trade Crypto Crypto Checkout News: Routing Moves Behind the Payment Flow
A buyer could start with a supported token on one blockchain while a business receives the Polygon stablecoin specified in its settlement configuration. The product is intended to work with existing crypto wallets, rather than requiring customers to create a Polygon-specific wallet to complete a purchase.
That distinction makes Crypto Checkout an abstraction layer connecting existing payment rails. It’s not a requirement that every customer use one Polygon wallet or hold the same token as the merchant. The proposition parallels the broader shift toward using stablecoins as settlement infrastructure, also reflected in stablecoin-based payment and settlement rails.
Polygon’s blog index places its September 30 announcement under the Open Money Stack label. That identifies the initiative’s broader context, but does not by itself establish the full architecture or the specific services included in every Crypto Checkout configuration.
Market Intelligence: Crypto Security Analyst Recommends Best Anonymous Crypto Exchanges
Polygon Stablecoin Payments: Why Multi-Chain Friction Matters
Stablecoins are being used beyond crypto exchanges, including in remittances, business-to-business settlement, card networks, and merchant payments. Their dollar-pegged value can give merchants blockchain-based settlement without requiring them to hold volatile assets such as Bitcoin or Ether.
Yet assets with the same ticker can remain distinct across networks. USDC or USDT on Ethereum is distinct from the same token on other blockchains; transferring funds into a merchant’s preferred version may involve a bridge, a swap, or extra gas tokens.
Each manual step adds friction and another point at which a customer may abandon a transaction. Polygon’s approach is to coordinate those operations within checkout, while merchants retain control over the settlement asset; that is the central promise behind the product’s multi-chain stablecoin payments design.
Other payment companies, exchanges, and blockchain networks are also building ways to use stablecoins outside trading platforms. Related efforts include cross-border stablecoin settlement initiatives and stablecoin rails for currency conversion and payments.
Polygon’s Competitive Test: Abstraction at Commerce Scale
Another milestone for Polygon.
$3 trillion stablecoin volume 🎉 pic.twitter.com/Set9BtnPIN
— Polygon (@0xPolygon) September 29, 2026
The analytical question is no longer whether crypto can move value across networks; it is whether that movement can be made reliable and legible enough for ordinary commerce. If the model works at scale, customers may not need to see the wallets, swaps, or routes operating beneath checkout.
That abstraction does not remove infrastructure risk; it relocates it. Supported liquidity routes, compliance, reconciliation, and settlement will shape whether the experience can function consistently across merchants and jurisdictions, while the actual scope of supported assets and networks remains decisive.
Market Intelligence: Crypto Analyst Reveals Upcoming Coinbase Listings
next
The post Polygon Puts Stablecoin Routing Behind Merchant Checkout appeared first on Coinspeaker.
Polygon Puts Stablecoin Routing Behind Merchant Checkout
Polygon introduced Crypto Checkout on 1 October 2026, a merchant payments product that brings stablecoin and other digital dollars into everyday checkout. Users may employ various supported wallets, tokens, and blockchain networks, while businesses can select the assets they receive.
Merchants can set settlement in assets such as USDC and USDT, and the checkout flow aims to coordinate conversion and cross-chain routing without requiring a separate integration for each payment path.
This is not merely another crypto payment button. It aims to separate the asset and network a customer uses from the stablecoin a merchant prefers to receive. This approach reduces fragmentation that might block a purchase even when the buyer has adequate funds.
Introducing stablecoin payments at checkout, now live in Polygon OMS.
Add ‘pay with crypto’ to the checkout you already run. Customers can pay across wallets, tokens, and chains without leaving your store to swap, bridge, or cash out. pic.twitter.com/Jr20lr8bRx
— Polygon (@0xPolygon) September 30, 2026
Sign Up With MergeX And Trade Crypto Crypto Checkout News: Routing Moves Behind the Payment Flow
A buyer could start with a supported token on one blockchain while a business receives the Polygon stablecoin specified in its settlement configuration. The product is intended to work with existing crypto wallets, rather than requiring customers to create a Polygon-specific wallet to complete a purchase.
That distinction makes Crypto Checkout an abstraction layer connecting existing payment rails. It’s not a requirement that every customer use one Polygon wallet or hold the same token as the merchant. The proposition parallels the broader shift toward using stablecoins as settlement infrastructure, also reflected in stablecoin-based payment and settlement rails.
Polygon’s blog index places its September 30 announcement under the Open Money Stack label. That identifies the initiative’s broader context, but does not by itself establish the full architecture or the specific services included in every Crypto Checkout configuration.
Market Intelligence: Crypto Security Analyst Recommends Best Anonymous Crypto Exchanges
Polygon Stablecoin Payments: Why Multi-Chain Friction Matters
Stablecoins are being used beyond crypto exchanges, including in remittances, business-to-business settlement, card networks, and merchant payments. Their dollar-pegged value can give merchants blockchain-based settlement without requiring them to hold volatile assets such as Bitcoin or Ether.
Yet assets with the same ticker can remain distinct across networks. USDC or USDT on Ethereum is distinct from the same token on other blockchains; transferring funds into a merchant’s preferred version may involve a bridge, a swap, or extra gas tokens.
Each manual step adds friction and another point at which a customer may abandon a transaction. Polygon’s approach is to coordinate those operations within checkout, while merchants retain control over the settlement asset; that is the central promise behind the product’s multi-chain stablecoin payments design.
Other payment companies, exchanges, and blockchain networks are also building ways to use stablecoins outside trading platforms. Related efforts include cross-border stablecoin settlement initiatives and stablecoin rails for currency conversion and payments.
Polygon’s Competitive Test: Abstraction at Commerce Scale
Another milestone for Polygon.
$3 trillion stablecoin volume 🎉 pic.twitter.com/Set9BtnPIN
— Polygon (@0xPolygon) September 29, 2026
The analytical question is no longer whether crypto can move value across networks; it is whether that movement can be made reliable and legible enough for ordinary commerce. If the model works at scale, customers may not need to see the wallets, swaps, or routes operating beneath checkout.
That abstraction does not remove infrastructure risk; it relocates it. Supported liquidity routes, compliance, reconciliation, and settlement will shape whether the experience can function consistently across merchants and jurisdictions, while the actual scope of supported assets and networks remains decisive.
Market Intelligence: Crypto Analyst Reveals Upcoming Coinbase Listings
next
The post Polygon Puts Stablecoin Routing Behind Merchant Checkout appeared first on Coinspeaker.
Merchants can set settlement in assets such as USDC and USDT, and the checkout flow aims to coordinate conversion and cross-chain routing without requiring a separate integration for each payment path.
This is not merely another crypto payment button. It aims to separate the asset and network a customer uses from the stablecoin a merchant prefers to receive. This approach reduces fragmentation that might block a purchase even when the buyer has adequate funds.
Introducing stablecoin payments at checkout, now live in Polygon OMS.
Add ‘pay with crypto’ to the checkout you already run. Customers can pay across wallets, tokens, and chains without leaving your store to swap, bridge, or cash out. pic.twitter.com/Jr20lr8bRx
— Polygon (@0xPolygon) September 30, 2026
Sign Up With MergeX And Trade Crypto Crypto Checkout News: Routing Moves Behind the Payment Flow
A buyer could start with a supported token on one blockchain while a business receives the Polygon stablecoin specified in its settlement configuration. The product is intended to work with existing crypto wallets, rather than requiring customers to create a Polygon-specific wallet to complete a purchase.
That distinction makes Crypto Checkout an abstraction layer connecting existing payment rails. It’s not a requirement that every customer use one Polygon wallet or hold the same token as the merchant. The proposition parallels the broader shift toward using stablecoins as settlement infrastructure, also reflected in stablecoin-based payment and settlement rails.
Polygon’s blog index places its September 30 announcement under the Open Money Stack label. That identifies the initiative’s broader context, but does not by itself establish the full architecture or the specific services included in every Crypto Checkout configuration.
Market Intelligence: Crypto Security Analyst Recommends Best Anonymous Crypto Exchanges
Polygon Stablecoin Payments: Why Multi-Chain Friction Matters
Stablecoins are being used beyond crypto exchanges, including in remittances, business-to-business settlement, card networks, and merchant payments. Their dollar-pegged value can give merchants blockchain-based settlement without requiring them to hold volatile assets such as Bitcoin or Ether.
Yet assets with the same ticker can remain distinct across networks. USDC or USDT on Ethereum is distinct from the same token on other blockchains; transferring funds into a merchant’s preferred version may involve a bridge, a swap, or extra gas tokens.
Each manual step adds friction and another point at which a customer may abandon a transaction. Polygon’s approach is to coordinate those operations within checkout, while merchants retain control over the settlement asset; that is the central promise behind the product’s multi-chain stablecoin payments design.
Other payment companies, exchanges, and blockchain networks are also building ways to use stablecoins outside trading platforms. Related efforts include cross-border stablecoin settlement initiatives and stablecoin rails for currency conversion and payments.
Polygon’s Competitive Test: Abstraction at Commerce Scale
Another milestone for Polygon.
$3 trillion stablecoin volume 🎉 pic.twitter.com/Set9BtnPIN
— Polygon (@0xPolygon) September 29, 2026
The analytical question is no longer whether crypto can move value across networks; it is whether that movement can be made reliable and legible enough for ordinary commerce. If the model works at scale, customers may not need to see the wallets, swaps, or routes operating beneath checkout.
That abstraction does not remove infrastructure risk; it relocates it. Supported liquidity routes, compliance, reconciliation, and settlement will shape whether the experience can function consistently across merchants and jurisdictions, while the actual scope of supported assets and networks remains decisive.
Market Intelligence: Crypto Analyst Reveals Upcoming Coinbase Listings
next
The post Polygon Puts Stablecoin Routing Behind Merchant Checkout appeared first on Coinspeaker.
116
·
--
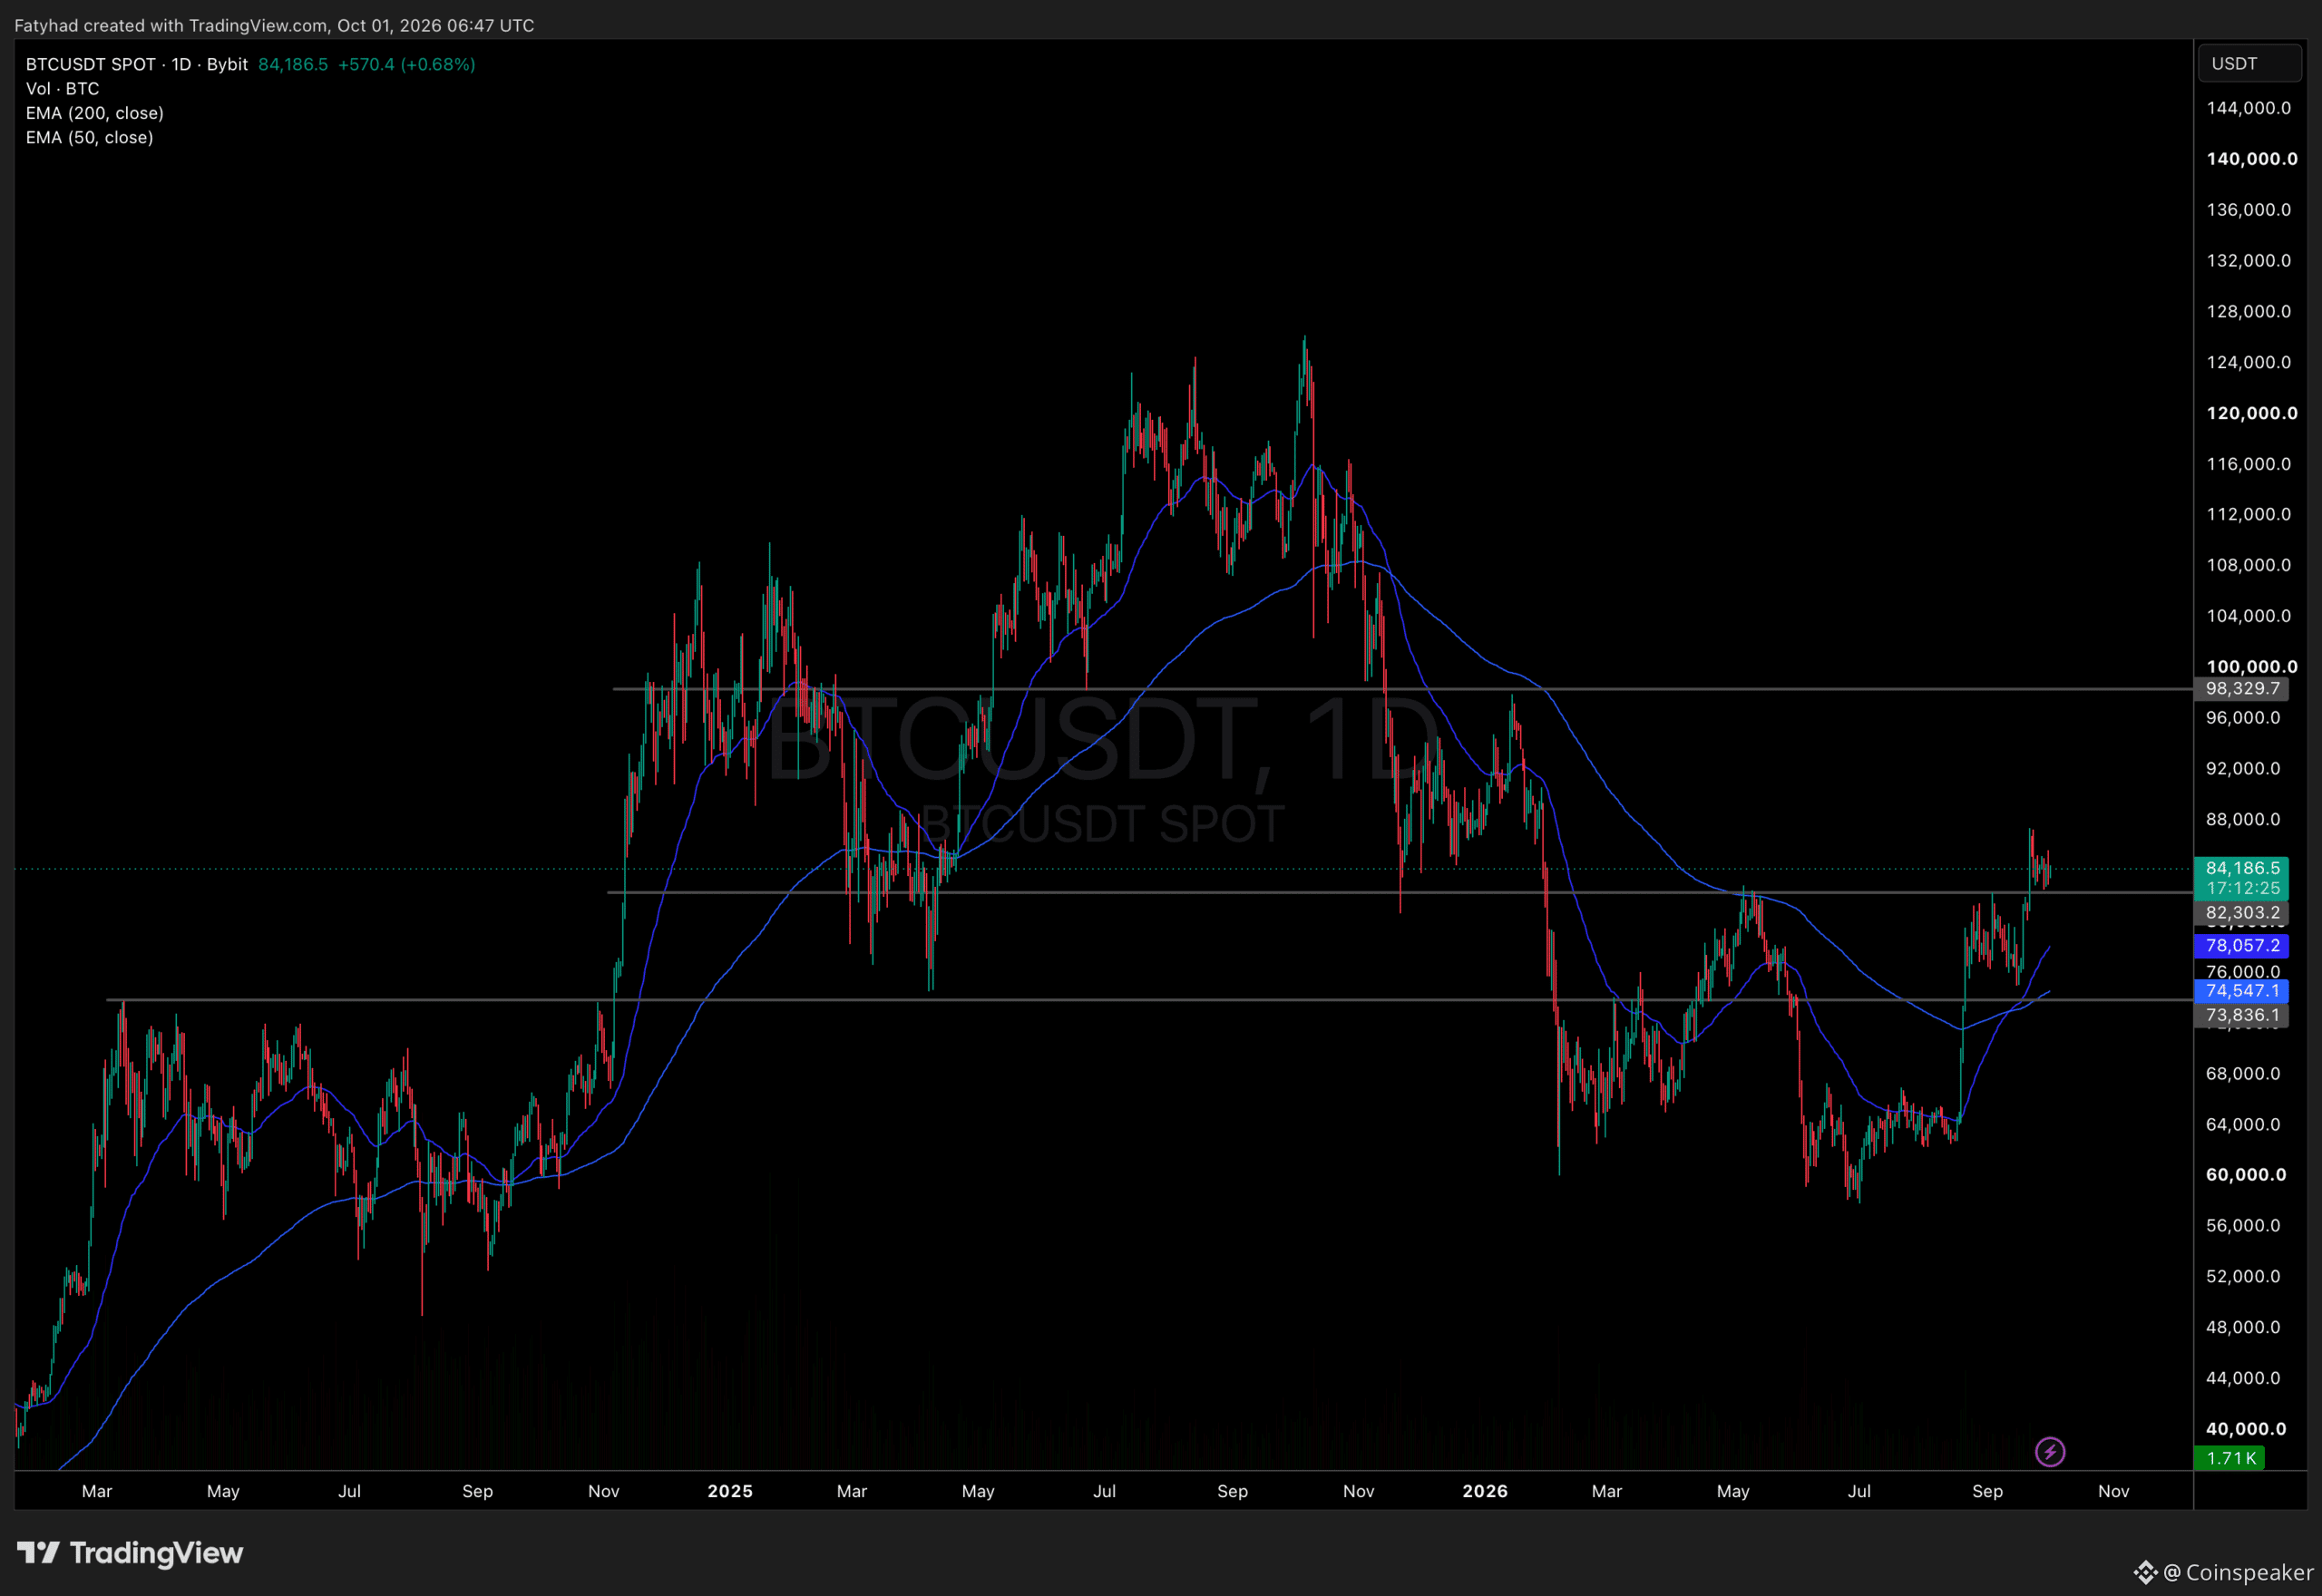
ບົດຄວາມ
Bitcoin Price Forecast: PCE Came Softer Than Expected, Now What?Bitcoin is trading near $84,116 on October 1, up about 1.3% over 24 hours. BTC briefly topped $85,500 after softer U.S. inflation data, before high bond yields erased much of the move. That leaves the short-term Bitcoin price forecast hinging on one question: can cooling inflation outweigh pressure from the bond market?
The August Personal Consumption Expenditures (PCE) report, released September 30, came in well below forecasts. Headline inflation rose 3.4% year over year, against expectations of 3.7%. Core PCE eased to 3.0%, below the 3.3% forecast. On a monthly basis, headline prices rose 0.3% and core rose 0.2%.
BREAKING: Bitcoin and Ethereum just printed their highest monthly close of 2026.$BTC surged +$25,800 and 44% in the past 3 months, delivering the best Q3 returns since 2017.$ETH surged 71.2% in the same period, its best quarter in history.
Macro indicators confirm crypto has… pic.twitter.com/hY1Z195n2m
— Bull Theory (@BullTheoryio) October 1, 2026
Join Coinspeaker’s $1,000 Prize Drop on Bybit How Did Bitcoin React to the Softer PCE Report?
BREAKING: US August PCE inflation, the Fed's preferred inflation metric, falls to 3.4%, below expectations of 3.7%.
Core PCE inflation fell to 3.0%, below expectations of 3.3%.
July headline and core PCE inflation were also revised down by 30 basis points each.
October rate…
— The Kobeissi Letter (@KobeissiLetter) September 30, 2026
July’s figures were also revised down by 30 basis points each. That makes the report softer than the headline alone suggests, and it pushed odds of an October Fed hike lower again. Polymarket had already shifted to favor no change before the release.
Bitcoin jumped to a 24-hour high of $85,518 on the news but quickly faded. Treasury yields stayed near 5.3%, and strong August consumer spending kept inflation concerns alive.
The data capped a strong quarter. Bitcoin gained about 44% in Q3, or roughly $25,800, its best third quarter since 2017. September also delivered Bitcoin’s highest monthly close of 2026, near $83,650.
Market Intelligence: Crypto Analyst Predicts Best Low-Cap Crypto
Bitcoin Price Forecast: Can BTC Reclaim $85,000 This Week?
BTCUSDT Chart 1D TradingView
Bitcoin now sits just below resistance at $84,972–$85,000. Daily volume stands near $35.8 billion, but the failed push above $85,500 shows buyers have not yet taken control. A weekly close above $85,000 would be a far cleaner signal than an intraday wick.
Support sits at $82,300–$82,900, where Bitcoin has bounced several times in recent sessions. Below that, $80,000 is the next reference, followed by the 50-day moving average near $78,000. On the upside, $87,400 is the next target, then the psychological $90,000 level.
Other signals are mixed. Bitcoin trades above its 365-day moving average, and futures leverage has declined. Lower leverage points to less crowded positioning, though not necessarily to fresh spot demand.
Bull case: Support holds and yields easing. A break above $85,000 could then open a test of $87,400, with $90,000 next.
Base case: Bitcoin stays trapped between $82,300 and $85,000 while markets reassess Fed policy.
Bear case: A sustained loss of the low-$82,000 zone weakens the structure and puts $80,000 in view, then the 50-day average near $78,000.
One soft PCE print is not a breakout catalyst on its own, especially with consumer spending still strong. What would change the Bitcoin price forecast? A lasting drop in yields, not a single favorable data point.
For the broader rate debate, see coverage of October rate expectations.
Market Intelligence: Crypto Analyst Predicts Best New Crypto to Hodl
Bitcoin Hyper Targets Early-Mover Interest as Bitcoin Tests $85K
Bitcoin’s rebound has not yet cleared resistance, and that limits the near-term case for chasing a move higher. For traders looking beyond the established asset, early-stage infrastructure offers a different risk profile. Not a substitute for Bitcoin exposure, and certainly not a guaranteed escape from volatility.
Bitcoin Hyper ($HYPER) is presented as a Bitcoin Layer 2 with Solana Virtual Machine (SVM) integration, designed to bring smart contracts and faster, lower-cost transactions to the Bitcoin ecosystem. Its stated proposition includes a decentralized canonical bridge for Bitcoin transfers. The project describes itself as the first Bitcoin Layer 2 with SVM integration and claims performance faster than Solana itself.
The presale has raised over $33 million to date, with tokens priced at $0.0136869. Early contributors can purchase HYPER tokens and immediately stake them to earn an estimated 35% APY ahead of the token generation event (TGE).
The project is currently working toward its mainnet launch, scheduled for Q4 2026. This launch window will see the deployment of the canonical bridge, the first wave of ecosystem dApps, and initial exchange listings.
To stay updated on development milestones, mainnet announcements, and community events, you can follow Bitcoin Hyper on X and join their official Telegram channel.
Don’t Miss Out Again: Join New Bitcoin Layer 2 Early Here next
The post Bitcoin Price Forecast: PCE Came Softer Than Expected, Now What? appeared first on Coinspeaker.
Bitcoin Price Forecast: PCE Came Softer Than Expected, Now What?
Bitcoin is trading near $84,116 on October 1, up about 1.3% over 24 hours. BTC briefly topped $85,500 after softer U.S. inflation data, before high bond yields erased much of the move. That leaves the short-term Bitcoin price forecast hinging on one question: can cooling inflation outweigh pressure from the bond market?
The August Personal Consumption Expenditures (PCE) report, released September 30, came in well below forecasts. Headline inflation rose 3.4% year over year, against expectations of 3.7%. Core PCE eased to 3.0%, below the 3.3% forecast. On a monthly basis, headline prices rose 0.3% and core rose 0.2%.
BREAKING: Bitcoin and Ethereum just printed their highest monthly close of 2026.$BTC surged +$25,800 and 44% in the past 3 months, delivering the best Q3 returns since 2017.$ETH surged 71.2% in the same period, its best quarter in history.
Macro indicators confirm crypto has… pic.twitter.com/hY1Z195n2m
— Bull Theory (@BullTheoryio) October 1, 2026
Join Coinspeaker’s $1,000 Prize Drop on Bybit How Did Bitcoin React to the Softer PCE Report?
BREAKING: US August PCE inflation, the Fed's preferred inflation metric, falls to 3.4%, below expectations of 3.7%.
Core PCE inflation fell to 3.0%, below expectations of 3.3%.
July headline and core PCE inflation were also revised down by 30 basis points each.
October rate…
— The Kobeissi Letter (@KobeissiLetter) September 30, 2026
July’s figures were also revised down by 30 basis points each. That makes the report softer than the headline alone suggests, and it pushed odds of an October Fed hike lower again. Polymarket had already shifted to favor no change before the release.
Bitcoin jumped to a 24-hour high of $85,518 on the news but quickly faded. Treasury yields stayed near 5.3%, and strong August consumer spending kept inflation concerns alive.
The data capped a strong quarter. Bitcoin gained about 44% in Q3, or roughly $25,800, its best third quarter since 2017. September also delivered Bitcoin’s highest monthly close of 2026, near $83,650.
Market Intelligence: Crypto Analyst Predicts Best Low-Cap Crypto
Bitcoin Price Forecast: Can BTC Reclaim $85,000 This Week?
BTCUSDT Chart 1D TradingView
Bitcoin now sits just below resistance at $84,972–$85,000. Daily volume stands near $35.8 billion, but the failed push above $85,500 shows buyers have not yet taken control. A weekly close above $85,000 would be a far cleaner signal than an intraday wick.
Support sits at $82,300–$82,900, where Bitcoin has bounced several times in recent sessions. Below that, $80,000 is the next reference, followed by the 50-day moving average near $78,000. On the upside, $87,400 is the next target, then the psychological $90,000 level.
Other signals are mixed. Bitcoin trades above its 365-day moving average, and futures leverage has declined. Lower leverage points to less crowded positioning, though not necessarily to fresh spot demand.
Bull case: Support holds and yields easing. A break above $85,000 could then open a test of $87,400, with $90,000 next.
Base case: Bitcoin stays trapped between $82,300 and $85,000 while markets reassess Fed policy.
Bear case: A sustained loss of the low-$82,000 zone weakens the structure and puts $80,000 in view, then the 50-day average near $78,000.
One soft PCE print is not a breakout catalyst on its own, especially with consumer spending still strong. What would change the Bitcoin price forecast? A lasting drop in yields, not a single favorable data point.
For the broader rate debate, see coverage of October rate expectations.
Market Intelligence: Crypto Analyst Predicts Best New Crypto to Hodl
Bitcoin Hyper Targets Early-Mover Interest as Bitcoin Tests $85K
Bitcoin’s rebound has not yet cleared resistance, and that limits the near-term case for chasing a move higher. For traders looking beyond the established asset, early-stage infrastructure offers a different risk profile. Not a substitute for Bitcoin exposure, and certainly not a guaranteed escape from volatility.
Bitcoin Hyper ($HYPER) is presented as a Bitcoin Layer 2 with Solana Virtual Machine (SVM) integration, designed to bring smart contracts and faster, lower-cost transactions to the Bitcoin ecosystem. Its stated proposition includes a decentralized canonical bridge for Bitcoin transfers. The project describes itself as the first Bitcoin Layer 2 with SVM integration and claims performance faster than Solana itself.
The presale has raised over $33 million to date, with tokens priced at $0.0136869. Early contributors can purchase HYPER tokens and immediately stake them to earn an estimated 35% APY ahead of the token generation event (TGE).
The project is currently working toward its mainnet launch, scheduled for Q4 2026. This launch window will see the deployment of the canonical bridge, the first wave of ecosystem dApps, and initial exchange listings.
To stay updated on development milestones, mainnet announcements, and community events, you can follow Bitcoin Hyper on X and join their official Telegram channel.
Don’t Miss Out Again: Join New Bitcoin Layer 2 Early Here next
The post Bitcoin Price Forecast: PCE Came Softer Than Expected, Now What? appeared first on Coinspeaker.
The August Personal Consumption Expenditures (PCE) report, released September 30, came in well below forecasts. Headline inflation rose 3.4% year over year, against expectations of 3.7%. Core PCE eased to 3.0%, below the 3.3% forecast. On a monthly basis, headline prices rose 0.3% and core rose 0.2%.
BREAKING: Bitcoin and Ethereum just printed their highest monthly close of 2026.$BTC surged +$25,800 and 44% in the past 3 months, delivering the best Q3 returns since 2017.$ETH surged 71.2% in the same period, its best quarter in history.
Macro indicators confirm crypto has… pic.twitter.com/hY1Z195n2m
— Bull Theory (@BullTheoryio) October 1, 2026
Join Coinspeaker’s $1,000 Prize Drop on Bybit How Did Bitcoin React to the Softer PCE Report?
BREAKING: US August PCE inflation, the Fed's preferred inflation metric, falls to 3.4%, below expectations of 3.7%.
Core PCE inflation fell to 3.0%, below expectations of 3.3%.
July headline and core PCE inflation were also revised down by 30 basis points each.
October rate…
— The Kobeissi Letter (@KobeissiLetter) September 30, 2026
July’s figures were also revised down by 30 basis points each. That makes the report softer than the headline alone suggests, and it pushed odds of an October Fed hike lower again. Polymarket had already shifted to favor no change before the release.
Bitcoin jumped to a 24-hour high of $85,518 on the news but quickly faded. Treasury yields stayed near 5.3%, and strong August consumer spending kept inflation concerns alive.
The data capped a strong quarter. Bitcoin gained about 44% in Q3, or roughly $25,800, its best third quarter since 2017. September also delivered Bitcoin’s highest monthly close of 2026, near $83,650.
Market Intelligence: Crypto Analyst Predicts Best Low-Cap Crypto
Bitcoin Price Forecast: Can BTC Reclaim $85,000 This Week?
BTCUSDT Chart 1D TradingView
Bitcoin now sits just below resistance at $84,972–$85,000. Daily volume stands near $35.8 billion, but the failed push above $85,500 shows buyers have not yet taken control. A weekly close above $85,000 would be a far cleaner signal than an intraday wick.
Support sits at $82,300–$82,900, where Bitcoin has bounced several times in recent sessions. Below that, $80,000 is the next reference, followed by the 50-day moving average near $78,000. On the upside, $87,400 is the next target, then the psychological $90,000 level.
Other signals are mixed. Bitcoin trades above its 365-day moving average, and futures leverage has declined. Lower leverage points to less crowded positioning, though not necessarily to fresh spot demand.
Bull case: Support holds and yields easing. A break above $85,000 could then open a test of $87,400, with $90,000 next.
Base case: Bitcoin stays trapped between $82,300 and $85,000 while markets reassess Fed policy.
Bear case: A sustained loss of the low-$82,000 zone weakens the structure and puts $80,000 in view, then the 50-day average near $78,000.
One soft PCE print is not a breakout catalyst on its own, especially with consumer spending still strong. What would change the Bitcoin price forecast? A lasting drop in yields, not a single favorable data point.
For the broader rate debate, see coverage of October rate expectations.
Market Intelligence: Crypto Analyst Predicts Best New Crypto to Hodl
Bitcoin Hyper Targets Early-Mover Interest as Bitcoin Tests $85K
Bitcoin’s rebound has not yet cleared resistance, and that limits the near-term case for chasing a move higher. For traders looking beyond the established asset, early-stage infrastructure offers a different risk profile. Not a substitute for Bitcoin exposure, and certainly not a guaranteed escape from volatility.
Bitcoin Hyper ($HYPER) is presented as a Bitcoin Layer 2 with Solana Virtual Machine (SVM) integration, designed to bring smart contracts and faster, lower-cost transactions to the Bitcoin ecosystem. Its stated proposition includes a decentralized canonical bridge for Bitcoin transfers. The project describes itself as the first Bitcoin Layer 2 with SVM integration and claims performance faster than Solana itself.
The presale has raised over $33 million to date, with tokens priced at $0.0136869. Early contributors can purchase HYPER tokens and immediately stake them to earn an estimated 35% APY ahead of the token generation event (TGE).
The project is currently working toward its mainnet launch, scheduled for Q4 2026. This launch window will see the deployment of the canonical bridge, the first wave of ecosystem dApps, and initial exchange listings.
To stay updated on development milestones, mainnet announcements, and community events, you can follow Bitcoin Hyper on X and join their official Telegram channel.
Don’t Miss Out Again: Join New Bitcoin Layer 2 Early Here next
The post Bitcoin Price Forecast: PCE Came Softer Than Expected, Now What? appeared first on Coinspeaker.
1
357
·
--
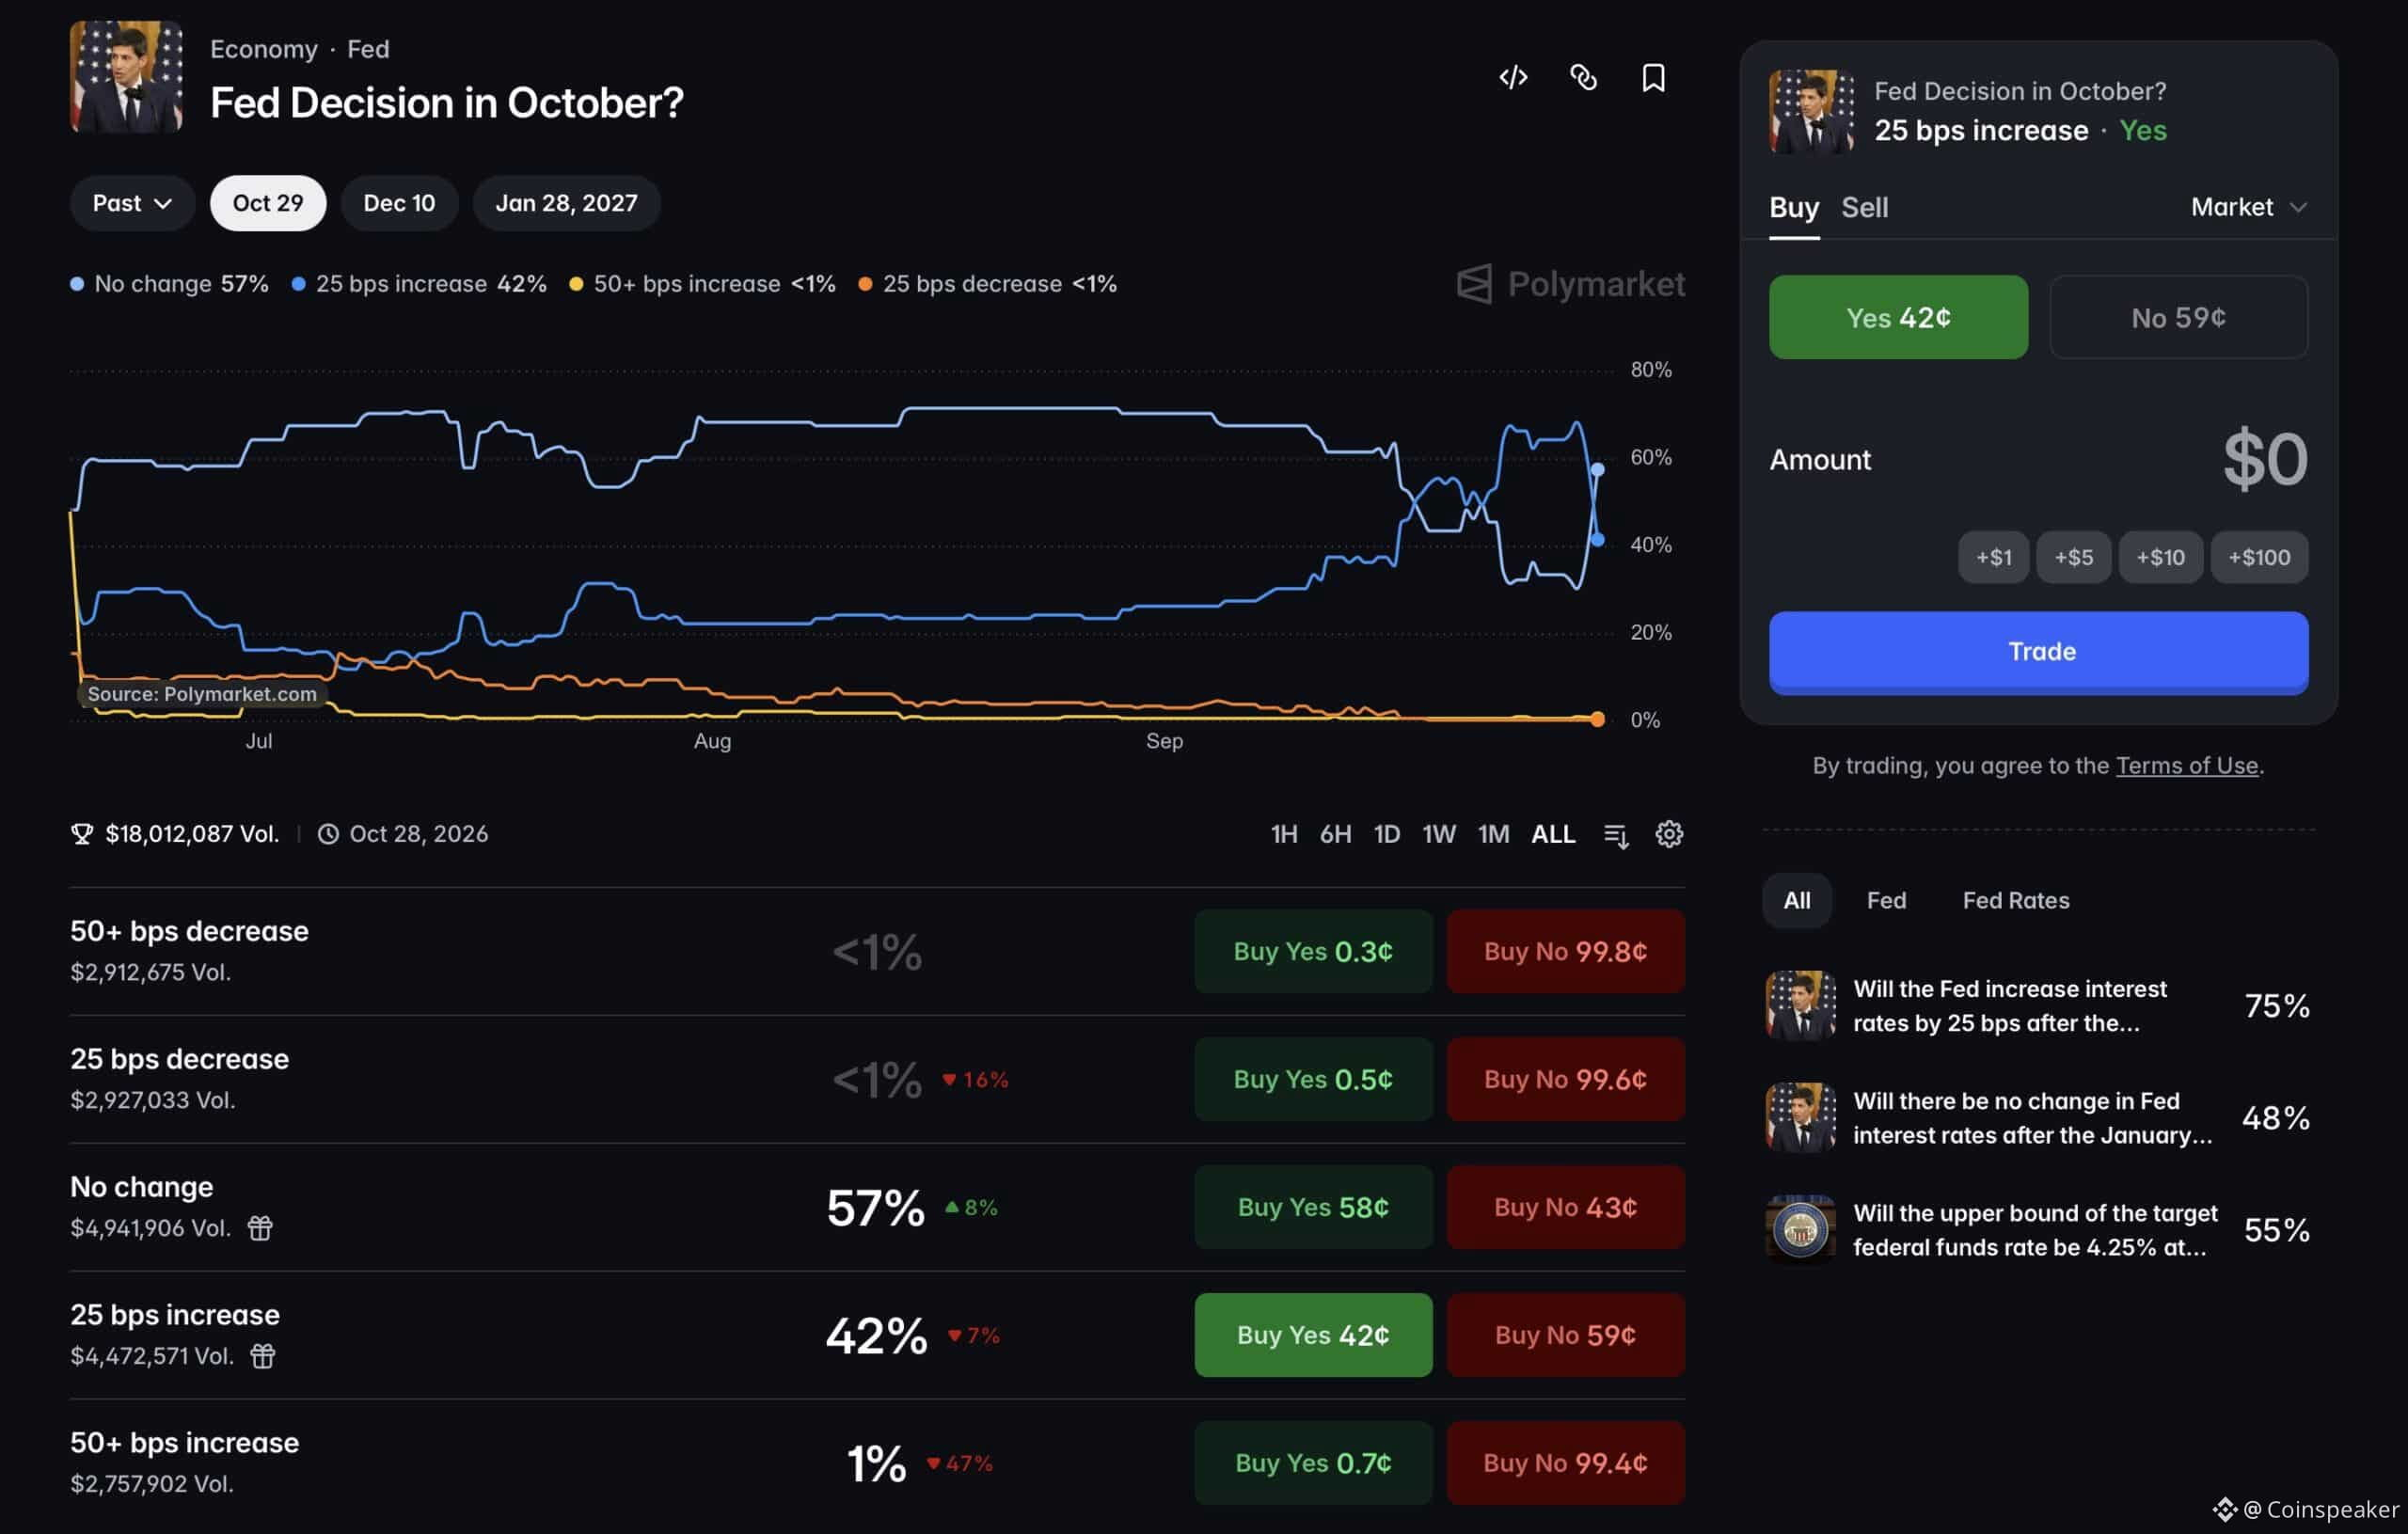
ບົດຄວາມ
October Rate Polymarket Odds Flip: Is a Fed Pause Likely?October rate Polymarket odds have flipped. On September 27, traders priced a 64% chance of a 25-basis-point hike at the Federal Reserve’s October 27–28 meeting. By September 30, the same Polymarket contract showed the reverse: no change at 57% and a 25-basis-point hike at 42%.
That shift matters for Bitcoin. Earlier, right after the Fed’s September 16 decision, Charles Schwab reported that CME FedWatch put the chance of an October hike at 49%. The new Polymarket reading shows how quickly rate expectations can swing, and why no single snapshot tells the full story.
The Fed’s September 16 hike set its target range at 3.75%–4.00%. Even with the latest repricing, neither outcome in October is locked in.
Rate expectations can hit Bitcoin through several channels at once. Broader rate-hike odds in prediction markets can also swing quickly as data and Fed comments change traders’ views.
Fed Decision in October Polymarket
Put Your Money Where Your Mouth is On Polymarket Bitcoin and Fed Rates: What Do the Latest October Rate Polymarket Odds Show?
Higher rates make cash and government bonds more attractive than speculative assets. They also raise borrowing costs and reduce the liquidity flowing into riskier investments.
Bitcoin is a macro-sensitive risk asset. It tied the market’s rate worries to the risk of tighter financial conditions.
The Polymarket contract on the Fed’s October decision has drawn about $18 million in volume. It now prices:
No change: 57%
25-basis-point hike: 42%
50+ basis-point hike: about 1%
Any rate cut: under 1%
For most of the summer, a hike led this market, often above 60%. The lines crossed several times in September before no change took the lead. A separate, smaller Polymarket contract shows the same shift, with no change, jumping from about 27% to over 60% on September 30.
The earlier hike odds reflected resilient U.S. growth, sticky inflation, and comments from Fed Governor Michael Barr. Barr suggested further tightening might be needed to bring inflation back to the Fed’s 2% target.
The 10-year Treasury yield hit 5.116%, its highest since July 2007.
JUST IN 🚨: U.S. 30-Year Treasury Yield closes at 5.59%, the highest closing level since 2001 👀 pic.twitter.com/RSYVyqi465
— Barchart (@Barchart) September 29, 2026
Market Intelligence: Crypto Analyst Reveals Upcoming Coinbase Listings
Bitcoin and Ethereum: Resilience Amid Higher Treasury Yields
Bitcoin’s price history in the primary report complicates any simple claim that a hike automatically weakens crypto. BTC climbed above $86,000 earlier in September, even though the Fed raised rates. Stronger exchange-traded fund flows, better regulatory sentiment and short covering acted as supports.
A physical representation of a Bitcoin coin.
The broader relationship between Treasury yields and Bitcoin’s macro resilience is therefore more informative than any one odds print. The rate outlook can weigh on risk assets while ETF demand or positioning provides a counterforce; those influences can coexist without producing a mechanically predictable price response.
October Rate Hike: What Bitcoin Traders Should Track
BTCUSDT Price Chart 1D TradingView
A resilience scenario might occur if hike probabilities remain under 50% or fall in similar market indicators. This continues while the main report’s supports, ETF flows, regulatory sentiment, and short covering, remain in place. A renewed pressure scenario would involve hawkish Fed communication, stronger inflation or growth data, rising Treasury yields, and hike odds moving toward or above the September 30 Polymarket snapshot.
The next assessment should compare the same contract type at clearly stated timestamps, rather than framing Polymarket and CME FedWatch as a continuous series.
Official Fed communication, Treasury yields, and Bitcoin’s ability to absorb tighter liquidity expectations remain the key variables. The analytical question is no longer whether one 42% figure predicts the October decision; it is whether tightening expectations are becoming a durable constraint on risk appetite.
Market Intelligence: Crypto Analyst Predicts Best Low-Cap Crypto
next
The post October Rate Polymarket Odds Flip: Is a Fed Pause Likely? appeared first on Coinspeaker.
October Rate Polymarket Odds Flip: Is a Fed Pause Likely?
October rate Polymarket odds have flipped. On September 27, traders priced a 64% chance of a 25-basis-point hike at the Federal Reserve’s October 27–28 meeting. By September 30, the same Polymarket contract showed the reverse: no change at 57% and a 25-basis-point hike at 42%.
That shift matters for Bitcoin. Earlier, right after the Fed’s September 16 decision, Charles Schwab reported that CME FedWatch put the chance of an October hike at 49%. The new Polymarket reading shows how quickly rate expectations can swing, and why no single snapshot tells the full story.
The Fed’s September 16 hike set its target range at 3.75%–4.00%. Even with the latest repricing, neither outcome in October is locked in.
Rate expectations can hit Bitcoin through several channels at once. Broader rate-hike odds in prediction markets can also swing quickly as data and Fed comments change traders’ views.
Fed Decision in October Polymarket
Put Your Money Where Your Mouth is On Polymarket Bitcoin and Fed Rates: What Do the Latest October Rate Polymarket Odds Show?
Higher rates make cash and government bonds more attractive than speculative assets. They also raise borrowing costs and reduce the liquidity flowing into riskier investments.
Bitcoin is a macro-sensitive risk asset. It tied the market’s rate worries to the risk of tighter financial conditions.
The Polymarket contract on the Fed’s October decision has drawn about $18 million in volume. It now prices:
No change: 57%
25-basis-point hike: 42%
50+ basis-point hike: about 1%
Any rate cut: under 1%
For most of the summer, a hike led this market, often above 60%. The lines crossed several times in September before no change took the lead. A separate, smaller Polymarket contract shows the same shift, with no change, jumping from about 27% to over 60% on September 30.
The earlier hike odds reflected resilient U.S. growth, sticky inflation, and comments from Fed Governor Michael Barr. Barr suggested further tightening might be needed to bring inflation back to the Fed’s 2% target.
The 10-year Treasury yield hit 5.116%, its highest since July 2007.
JUST IN 🚨: U.S. 30-Year Treasury Yield closes at 5.59%, the highest closing level since 2001 👀 pic.twitter.com/RSYVyqi465
— Barchart (@Barchart) September 29, 2026
Market Intelligence: Crypto Analyst Reveals Upcoming Coinbase Listings
Bitcoin and Ethereum: Resilience Amid Higher Treasury Yields
Bitcoin’s price history in the primary report complicates any simple claim that a hike automatically weakens crypto. BTC climbed above $86,000 earlier in September, even though the Fed raised rates. Stronger exchange-traded fund flows, better regulatory sentiment and short covering acted as supports.
A physical representation of a Bitcoin coin.
The broader relationship between Treasury yields and Bitcoin’s macro resilience is therefore more informative than any one odds print. The rate outlook can weigh on risk assets while ETF demand or positioning provides a counterforce; those influences can coexist without producing a mechanically predictable price response.
October Rate Hike: What Bitcoin Traders Should Track
BTCUSDT Price Chart 1D TradingView
A resilience scenario might occur if hike probabilities remain under 50% or fall in similar market indicators. This continues while the main report’s supports, ETF flows, regulatory sentiment, and short covering, remain in place. A renewed pressure scenario would involve hawkish Fed communication, stronger inflation or growth data, rising Treasury yields, and hike odds moving toward or above the September 30 Polymarket snapshot.
The next assessment should compare the same contract type at clearly stated timestamps, rather than framing Polymarket and CME FedWatch as a continuous series.
Official Fed communication, Treasury yields, and Bitcoin’s ability to absorb tighter liquidity expectations remain the key variables. The analytical question is no longer whether one 42% figure predicts the October decision; it is whether tightening expectations are becoming a durable constraint on risk appetite.
Market Intelligence: Crypto Analyst Predicts Best Low-Cap Crypto
next
The post October Rate Polymarket Odds Flip: Is a Fed Pause Likely? appeared first on Coinspeaker.
That shift matters for Bitcoin. Earlier, right after the Fed’s September 16 decision, Charles Schwab reported that CME FedWatch put the chance of an October hike at 49%. The new Polymarket reading shows how quickly rate expectations can swing, and why no single snapshot tells the full story.
The Fed’s September 16 hike set its target range at 3.75%–4.00%. Even with the latest repricing, neither outcome in October is locked in.
Rate expectations can hit Bitcoin through several channels at once. Broader rate-hike odds in prediction markets can also swing quickly as data and Fed comments change traders’ views.
Fed Decision in October Polymarket
Put Your Money Where Your Mouth is On Polymarket Bitcoin and Fed Rates: What Do the Latest October Rate Polymarket Odds Show?
Higher rates make cash and government bonds more attractive than speculative assets. They also raise borrowing costs and reduce the liquidity flowing into riskier investments.
Bitcoin is a macro-sensitive risk asset. It tied the market’s rate worries to the risk of tighter financial conditions.
The Polymarket contract on the Fed’s October decision has drawn about $18 million in volume. It now prices:
No change: 57%
25-basis-point hike: 42%
50+ basis-point hike: about 1%
Any rate cut: under 1%
For most of the summer, a hike led this market, often above 60%. The lines crossed several times in September before no change took the lead. A separate, smaller Polymarket contract shows the same shift, with no change, jumping from about 27% to over 60% on September 30.
The earlier hike odds reflected resilient U.S. growth, sticky inflation, and comments from Fed Governor Michael Barr. Barr suggested further tightening might be needed to bring inflation back to the Fed’s 2% target.
The 10-year Treasury yield hit 5.116%, its highest since July 2007.
JUST IN 🚨: U.S. 30-Year Treasury Yield closes at 5.59%, the highest closing level since 2001 👀 pic.twitter.com/RSYVyqi465
— Barchart (@Barchart) September 29, 2026
Market Intelligence: Crypto Analyst Reveals Upcoming Coinbase Listings
Bitcoin and Ethereum: Resilience Amid Higher Treasury Yields
Bitcoin’s price history in the primary report complicates any simple claim that a hike automatically weakens crypto. BTC climbed above $86,000 earlier in September, even though the Fed raised rates. Stronger exchange-traded fund flows, better regulatory sentiment and short covering acted as supports.
A physical representation of a Bitcoin coin.
The broader relationship between Treasury yields and Bitcoin’s macro resilience is therefore more informative than any one odds print. The rate outlook can weigh on risk assets while ETF demand or positioning provides a counterforce; those influences can coexist without producing a mechanically predictable price response.
October Rate Hike: What Bitcoin Traders Should Track
BTCUSDT Price Chart 1D TradingView
A resilience scenario might occur if hike probabilities remain under 50% or fall in similar market indicators. This continues while the main report’s supports, ETF flows, regulatory sentiment, and short covering, remain in place. A renewed pressure scenario would involve hawkish Fed communication, stronger inflation or growth data, rising Treasury yields, and hike odds moving toward or above the September 30 Polymarket snapshot.
The next assessment should compare the same contract type at clearly stated timestamps, rather than framing Polymarket and CME FedWatch as a continuous series.
Official Fed communication, Treasury yields, and Bitcoin’s ability to absorb tighter liquidity expectations remain the key variables. The analytical question is no longer whether one 42% figure predicts the October decision; it is whether tightening expectations are becoming a durable constraint on risk appetite.
Market Intelligence: Crypto Analyst Predicts Best Low-Cap Crypto
next
The post October Rate Polymarket Odds Flip: Is a Fed Pause Likely? appeared first on Coinspeaker.
166
·
--
Ethereum News: Glamsterdam Sepolia Test Set for October 6In the latest Ethereum news, the network’s Glamsterdam upgrade is scheduled to activate on Sepolia on October 6, 2026, at 13:53:36 UTC. This will test EIP-7732’s move of proposer-builder separation and settlement into the consensus protocol.
The activation is set for epoch 353,024, slot 11,296,768; Glamsterdam combines the Amsterdam execution-layer upgrade with Gloas on the consensus layer. Hoodi and mainnet activation dates have not been decided, so the schedule is for Sepolia only.
This is not simply a testnet date. It is a trial run for new protocol rules governing an exchange that has long depended on trusted middleware. Builder commitments, payload reveals, and proposer payments move closer to Ethereum’s consensus process.
JUST IN: Ethereum confirms the Glamsterdam upgrade will go live on Sepolia on October 6, bringing ePBS and Block Access Lists to the network. pic.twitter.com/onq6ezfyCV
— The Moon Show (@TheMoonShow) September 29, 2026
Sign Up With MergeX And Trade Crypto
DISCOVER: Polymarket’s $5M Market Puts Democrats Ahead in 2026
Ethereum Glamsterdam: How EIP-7732 Changes Block Production
Under EIP-7732’s proposer-builder design, a proposer places a builder’s commitment to an execution payload in the consensus block, and the builder subsequently reveals the payload. The protocol handles payment to the proposer, reducing reliance on trusted middleware for the exchange.
The design also separates consensus validation from execution validation, giving Ethereum validators more time to check execution payloads. A payload timeliness committee attests to whether the builder revealed the payload and whether its associated blob data was available on time. Validator operators and teams maintaining builder infrastructure will need to review the new duties and interfaces before the fork.
That change puts parts of the MEV infrastructure within a more protocol-defined process. The announcement does not say that all builder services or relay functions are removed. The practical shift is narrower: commitments, reveals, timeliness attestations, and proposer payments become part of protocol mechanics rather than depending entirely on an off-protocol exchange.
Market Intelligence: Crypto Analyst Reveals Upcoming Coinbase Listings
Ethereum News: What Else Will Sepolia Test Beyond ePBS?
⚡️Ethereum just casually hits 42,000+ TPS daily peak
With the upcoming Glamsterdam, this speed will only increase!$ETH is COMING pic.twitter.com/giWPYLTzdM
— Ethprofit.eth 🦇🔊 (@Ethprofit) September 30, 2026
Glamsterdam also includes block-level access lists under EIP-7928. These lists record the accounts and storage locations a block touches, along with post-transaction state changes. With that data, clients can read state and validate transactions in parallel. They can also compute state roots more efficiently.
Together, ePBS and access lists form the base for higher Layer 1 throughput. At the same time, they aim to keep block validation practical for node operators.
Gas accounting is changing, too. EIP-8037 raises the cost of creating state and meters it separately. EIP-8038 updates state-access costs. Other scheduled changes cover intrinsic transaction gas, calldata, access lists, and block gas accounting.
For developers following this Ethereum news, testing is the priority. Contracts and gas estimates should be checked against the new rules, especially where fixed gas stipends or hardcoded limits are involved.
Node operators must update both execution-layer and consensus-layer clients to compatible releases before the Sepolia activation. The client release tables will be updated as supported versions are confirmed. Operators using external block-building infrastructure should also check its Glamsterdam-specific upgrade instructions.
Market Intelligence: Crypto Analyst Predicts Next Crypto to Hit 1 Dollar
next
The post Ethereum News: Glamsterdam Sepolia Test Set for October 6 appeared first on Coinspeaker.
Ethereum News: Glamsterdam Sepolia Test Set for October 6
In the latest Ethereum news, the network’s Glamsterdam upgrade is scheduled to activate on Sepolia on October 6, 2026, at 13:53:36 UTC. This will test EIP-7732’s move of proposer-builder separation and settlement into the consensus protocol.
The activation is set for epoch 353,024, slot 11,296,768; Glamsterdam combines the Amsterdam execution-layer upgrade with Gloas on the consensus layer. Hoodi and mainnet activation dates have not been decided, so the schedule is for Sepolia only.
This is not simply a testnet date. It is a trial run for new protocol rules governing an exchange that has long depended on trusted middleware. Builder commitments, payload reveals, and proposer payments move closer to Ethereum’s consensus process.
JUST IN: Ethereum confirms the Glamsterdam upgrade will go live on Sepolia on October 6, bringing ePBS and Block Access Lists to the network. pic.twitter.com/onq6ezfyCV
— The Moon Show (@TheMoonShow) September 29, 2026
Sign Up With MergeX And Trade Crypto
DISCOVER: Polymarket’s $5M Market Puts Democrats Ahead in 2026
Ethereum Glamsterdam: How EIP-7732 Changes Block Production
Under EIP-7732’s proposer-builder design, a proposer places a builder’s commitment to an execution payload in the consensus block, and the builder subsequently reveals the payload. The protocol handles payment to the proposer, reducing reliance on trusted middleware for the exchange.
The design also separates consensus validation from execution validation, giving Ethereum validators more time to check execution payloads. A payload timeliness committee attests to whether the builder revealed the payload and whether its associated blob data was available on time. Validator operators and teams maintaining builder infrastructure will need to review the new duties and interfaces before the fork.
That change puts parts of the MEV infrastructure within a more protocol-defined process. The announcement does not say that all builder services or relay functions are removed. The practical shift is narrower: commitments, reveals, timeliness attestations, and proposer payments become part of protocol mechanics rather than depending entirely on an off-protocol exchange.
Market Intelligence: Crypto Analyst Reveals Upcoming Coinbase Listings
Ethereum News: What Else Will Sepolia Test Beyond ePBS?
⚡️Ethereum just casually hits 42,000+ TPS daily peak
With the upcoming Glamsterdam, this speed will only increase!$ETH is COMING pic.twitter.com/giWPYLTzdM
— Ethprofit.eth 🦇🔊 (@Ethprofit) September 30, 2026
Glamsterdam also includes block-level access lists under EIP-7928. These lists record the accounts and storage locations a block touches, along with post-transaction state changes. With that data, clients can read state and validate transactions in parallel. They can also compute state roots more efficiently.
Together, ePBS and access lists form the base for higher Layer 1 throughput. At the same time, they aim to keep block validation practical for node operators.
Gas accounting is changing, too. EIP-8037 raises the cost of creating state and meters it separately. EIP-8038 updates state-access costs. Other scheduled changes cover intrinsic transaction gas, calldata, access lists, and block gas accounting.
For developers following this Ethereum news, testing is the priority. Contracts and gas estimates should be checked against the new rules, especially where fixed gas stipends or hardcoded limits are involved.
Node operators must update both execution-layer and consensus-layer clients to compatible releases before the Sepolia activation. The client release tables will be updated as supported versions are confirmed. Operators using external block-building infrastructure should also check its Glamsterdam-specific upgrade instructions.
Market Intelligence: Crypto Analyst Predicts Next Crypto to Hit 1 Dollar
next
The post Ethereum News: Glamsterdam Sepolia Test Set for October 6 appeared first on Coinspeaker.
The activation is set for epoch 353,024, slot 11,296,768; Glamsterdam combines the Amsterdam execution-layer upgrade with Gloas on the consensus layer. Hoodi and mainnet activation dates have not been decided, so the schedule is for Sepolia only.
This is not simply a testnet date. It is a trial run for new protocol rules governing an exchange that has long depended on trusted middleware. Builder commitments, payload reveals, and proposer payments move closer to Ethereum’s consensus process.
JUST IN: Ethereum confirms the Glamsterdam upgrade will go live on Sepolia on October 6, bringing ePBS and Block Access Lists to the network. pic.twitter.com/onq6ezfyCV
— The Moon Show (@TheMoonShow) September 29, 2026
Sign Up With MergeX And Trade Crypto
DISCOVER: Polymarket’s $5M Market Puts Democrats Ahead in 2026
Ethereum Glamsterdam: How EIP-7732 Changes Block Production
Under EIP-7732’s proposer-builder design, a proposer places a builder’s commitment to an execution payload in the consensus block, and the builder subsequently reveals the payload. The protocol handles payment to the proposer, reducing reliance on trusted middleware for the exchange.
The design also separates consensus validation from execution validation, giving Ethereum validators more time to check execution payloads. A payload timeliness committee attests to whether the builder revealed the payload and whether its associated blob data was available on time. Validator operators and teams maintaining builder infrastructure will need to review the new duties and interfaces before the fork.
That change puts parts of the MEV infrastructure within a more protocol-defined process. The announcement does not say that all builder services or relay functions are removed. The practical shift is narrower: commitments, reveals, timeliness attestations, and proposer payments become part of protocol mechanics rather than depending entirely on an off-protocol exchange.
Market Intelligence: Crypto Analyst Reveals Upcoming Coinbase Listings
Ethereum News: What Else Will Sepolia Test Beyond ePBS?
⚡️Ethereum just casually hits 42,000+ TPS daily peak
With the upcoming Glamsterdam, this speed will only increase!$ETH is COMING pic.twitter.com/giWPYLTzdM
— Ethprofit.eth 🦇🔊 (@Ethprofit) September 30, 2026
Glamsterdam also includes block-level access lists under EIP-7928. These lists record the accounts and storage locations a block touches, along with post-transaction state changes. With that data, clients can read state and validate transactions in parallel. They can also compute state roots more efficiently.
Together, ePBS and access lists form the base for higher Layer 1 throughput. At the same time, they aim to keep block validation practical for node operators.
Gas accounting is changing, too. EIP-8037 raises the cost of creating state and meters it separately. EIP-8038 updates state-access costs. Other scheduled changes cover intrinsic transaction gas, calldata, access lists, and block gas accounting.
For developers following this Ethereum news, testing is the priority. Contracts and gas estimates should be checked against the new rules, especially where fixed gas stipends or hardcoded limits are involved.
Node operators must update both execution-layer and consensus-layer clients to compatible releases before the Sepolia activation. The client release tables will be updated as supported versions are confirmed. Operators using external block-building infrastructure should also check its Glamsterdam-specific upgrade instructions.
Market Intelligence: Crypto Analyst Predicts Next Crypto to Hit 1 Dollar
next
The post Ethereum News: Glamsterdam Sepolia Test Set for October 6 appeared first on Coinspeaker.
124
·
--
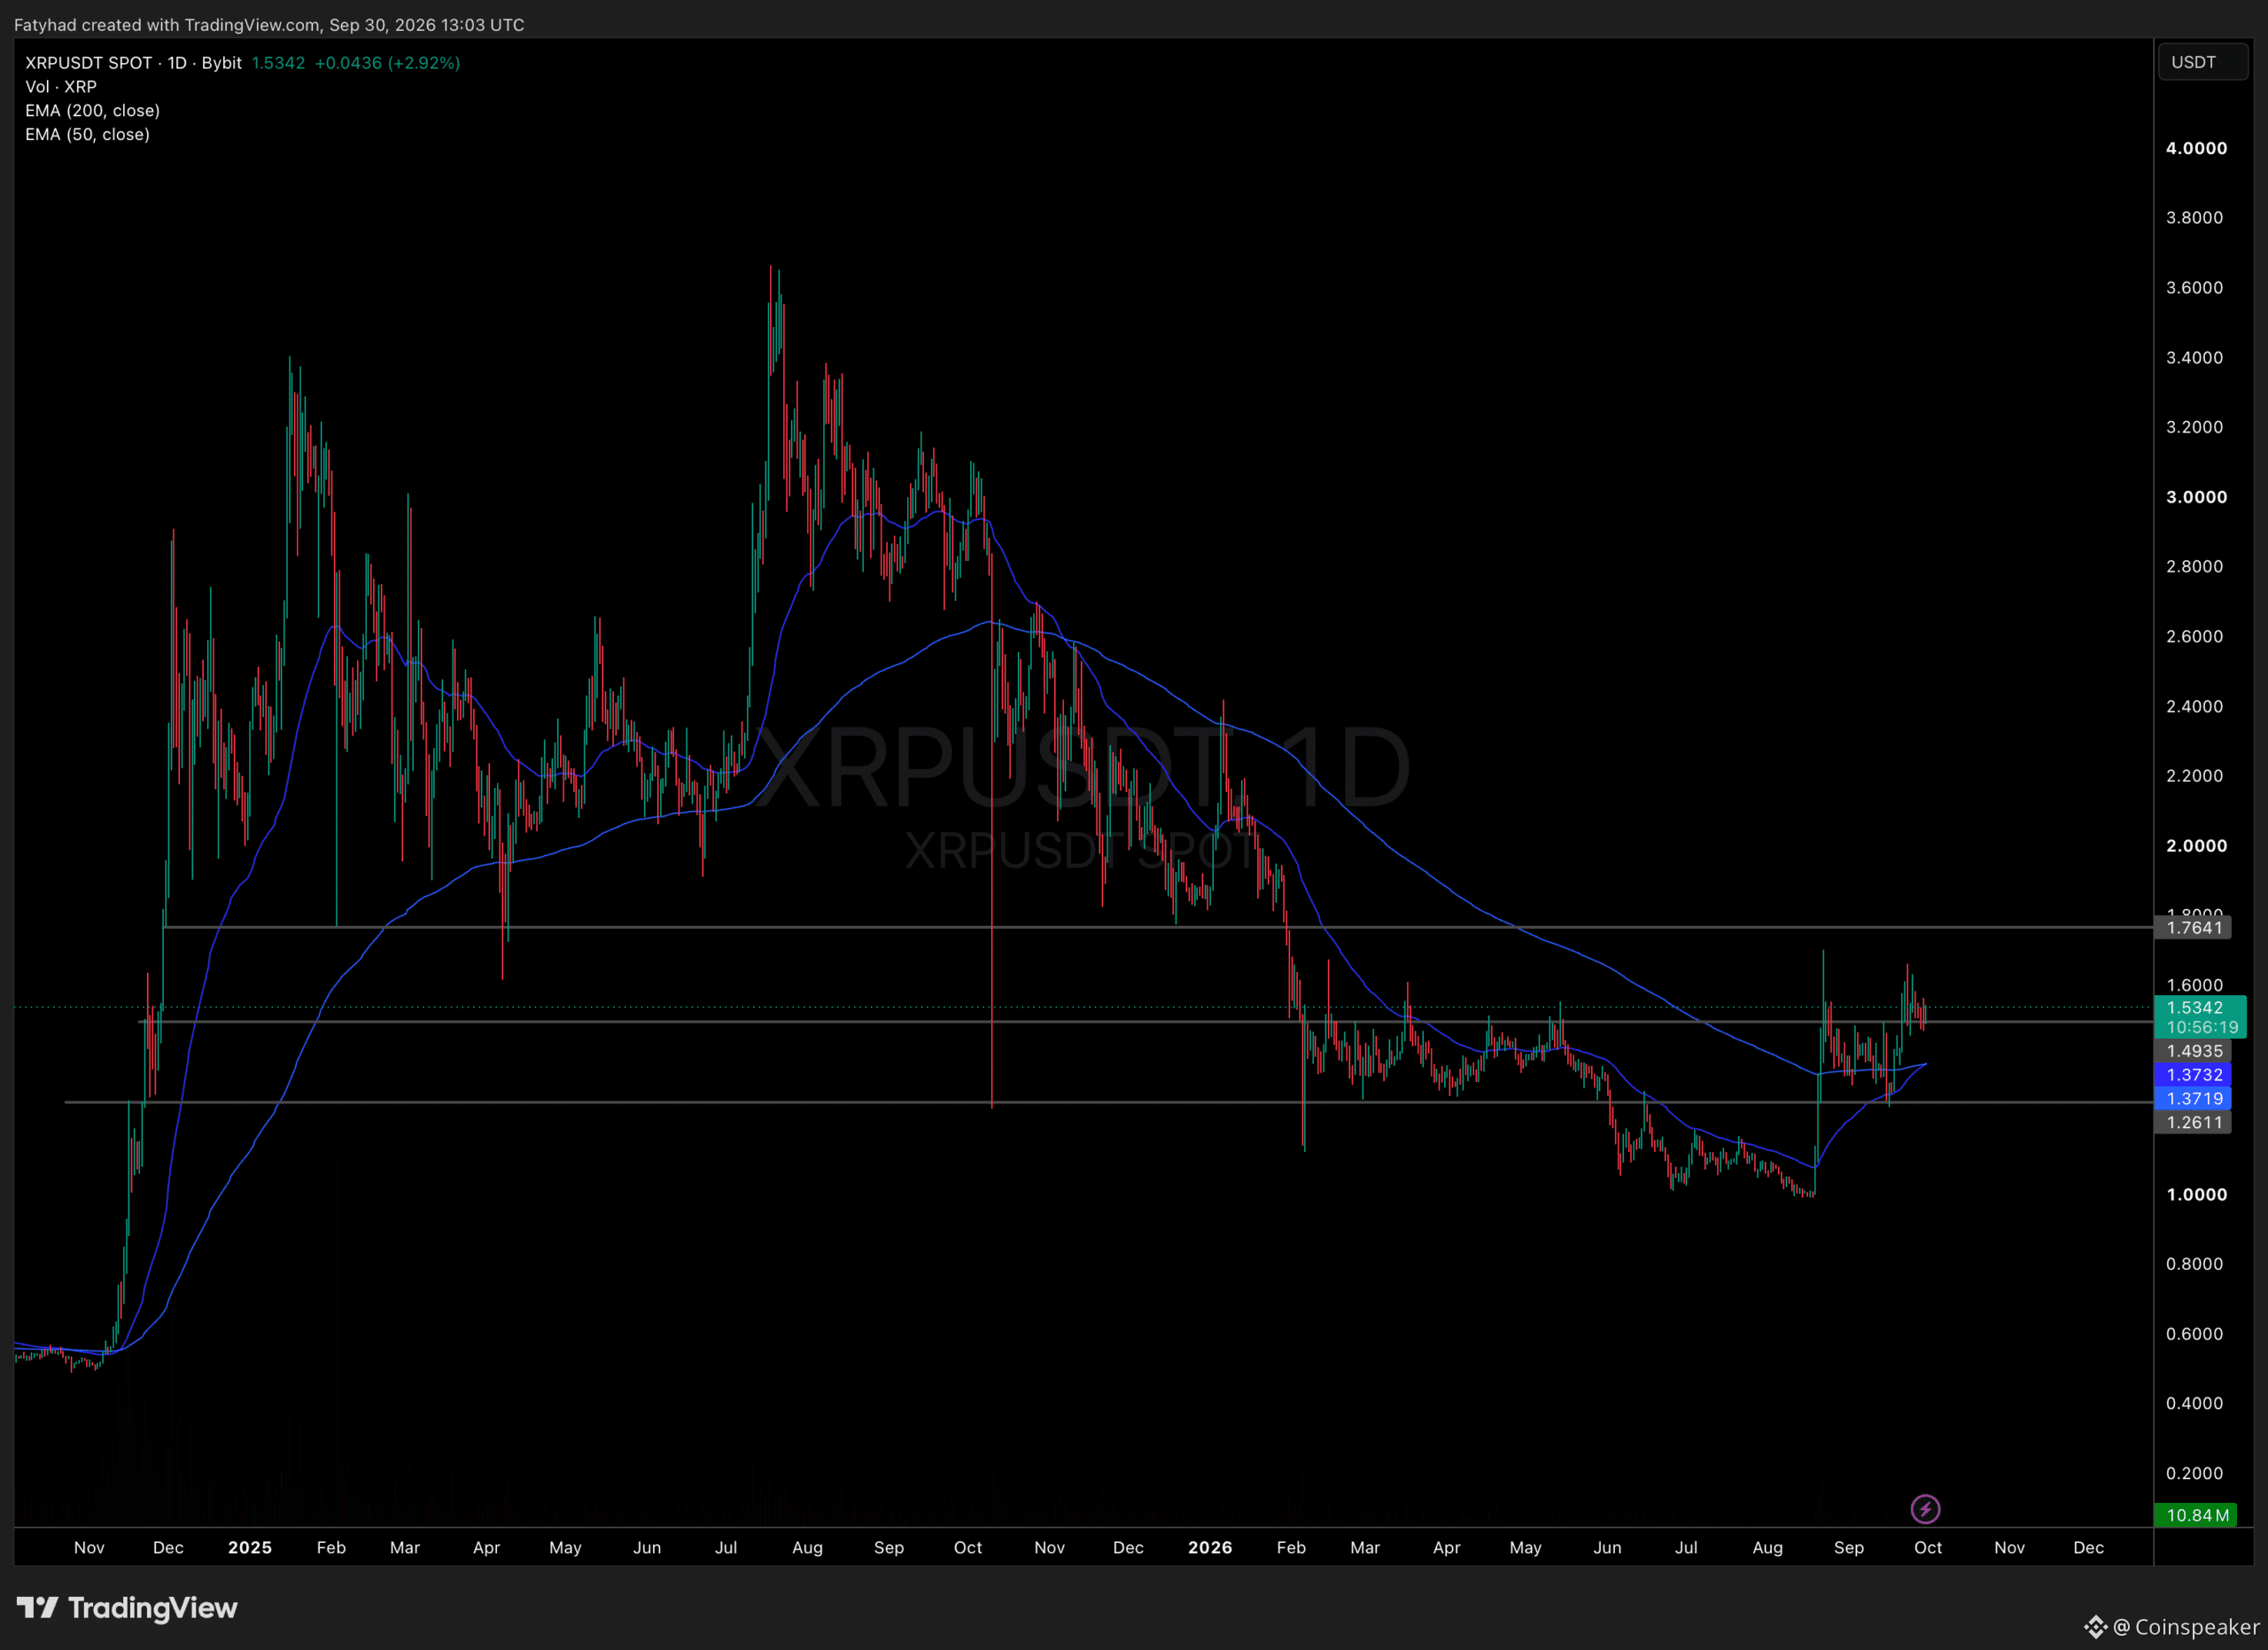
ບົດຄວາມ
XRP Price Forecast: Can XRP Break $1.70 After 1B Unlock?XRP is heading into Ripple’s October 1 escrow release while trading in a contested range, putting the short-term XRP price forecast in focus. Ripple trades near $1.53 on September 30, flat in the last 24 hours.
The key question is not just how many tokens unlock, but how many actually reach the market, and whether XRP can reclaim resistance at $1.60–$1.70.
Ripple is set to release up to 1 billion XRP, worth roughly $1.5 billion at current prices. That is a gross unlock, not a confirmed sale. Ripple may redistribute the tokens or return a large share to escrow, as it often does.
The unlock alone will not decide the price path. Bitcoin’s direction and Ripple’s follow-up disclosures matter too. Technically, the question is whether support holds before the market tests the resistance above.
$XRP has two dates worth watching.
Sept 30: Evernorth treasury merger vote Oct 1: 1B XRP escrow unlock One is institutional. One is supply.
Unlock ≠ all of it hitting the market. Most of it usually gets re-locked. Which one are you watching more the vote or the unlock?#XRP pic.twitter.com/lMz6di94kK
— Leanna Paul (@LPaul_x) September 29, 2026
Don’t Miss: ICOBench Experts Call the Next 1000x Crypto Coins for 2026
Bull, Base or Bear: What Is the XRP Price Forecast for October?
XRPUSDT Chart 1D
The daily chart shows XRP stuck below a ceiling it has failed to break since August. Spikes toward $1.66–$1.70 in late August and September were both sold off quickly. Above that, the next major resistance sits near $1.76.
On the downside, XRP is holding just above support near $1.49–$1.50. Below that, the 50-day and 200-day moving averages have converged near $1.37, with a deeper floor around $1.26.
Bull case: A sustained daily close above $1.60–$1.70 would improve the structure. FXEmpire has cited $1.80 as a first target, with $2.10 possible if momentum holds.
Base case: XRP consolidates between $1.49 and $1.70 while traders watch how much of the unlock is redistributed.
Bear case: A break below $1.49 could expose the moving averages near $1.37, then $1.26.
For any XRP price forecast this week, follow-through matters more than the unlock headline. For a broader look at the event and the $1.70 ceiling, see this XRP rebound and unlock analysis.
Market Intelligence: Crypto Analyst Predicts Best Low-Cap Crypto
LiquidChain Targets Cross-Chain Utility as XRP Tests Support
XRP’s setup offers potential upside if support holds, but the release adds a near-term supply variable, and no breakout is confirmed. That leaves traders weighing a defined technical trigger against uncertainty about how much unlocked XRP ultimately reaches exchanges.
LiquidChain is a Layer 3 infrastructure project whose website describes a cross-chain liquidity layer designed to combine Bitcoin, Ethereum, and Solana liquidity in one execution environment. At this stage, the token price stands at $0.01496, while the total raised reaches $979K.
Its Unified Liquidity Layer and Deploy-Once Architecture let developers build once and reach all three ecosystems instead of fragmenting liquidity across chains.
As with any presale, capital is at risk, and the project remains unproven at scale, so due diligence matters here as much as anywhere else.
Those curious can research LiquidChain directly.
Layer 3 Is Already Here, Smart Money Knows It – Do You? next
The post XRP Price Forecast: Can XRP Break $1.70 After 1B Unlock? appeared first on Coinspeaker.
XRP Price Forecast: Can XRP Break $1.70 After 1B Unlock?
XRP is heading into Ripple’s October 1 escrow release while trading in a contested range, putting the short-term XRP price forecast in focus. Ripple trades near $1.53 on September 30, flat in the last 24 hours.
The key question is not just how many tokens unlock, but how many actually reach the market, and whether XRP can reclaim resistance at $1.60–$1.70.
Ripple is set to release up to 1 billion XRP, worth roughly $1.5 billion at current prices. That is a gross unlock, not a confirmed sale. Ripple may redistribute the tokens or return a large share to escrow, as it often does.
The unlock alone will not decide the price path. Bitcoin’s direction and Ripple’s follow-up disclosures matter too. Technically, the question is whether support holds before the market tests the resistance above.
$XRP has two dates worth watching.
Sept 30: Evernorth treasury merger vote Oct 1: 1B XRP escrow unlock One is institutional. One is supply.
Unlock ≠ all of it hitting the market. Most of it usually gets re-locked. Which one are you watching more the vote or the unlock?#XRP pic.twitter.com/lMz6di94kK
— Leanna Paul (@LPaul_x) September 29, 2026
Don’t Miss: ICOBench Experts Call the Next 1000x Crypto Coins for 2026
Bull, Base or Bear: What Is the XRP Price Forecast for October?
XRPUSDT Chart 1D
The daily chart shows XRP stuck below a ceiling it has failed to break since August. Spikes toward $1.66–$1.70 in late August and September were both sold off quickly. Above that, the next major resistance sits near $1.76.
On the downside, XRP is holding just above support near $1.49–$1.50. Below that, the 50-day and 200-day moving averages have converged near $1.37, with a deeper floor around $1.26.
Bull case: A sustained daily close above $1.60–$1.70 would improve the structure. FXEmpire has cited $1.80 as a first target, with $2.10 possible if momentum holds.
Base case: XRP consolidates between $1.49 and $1.70 while traders watch how much of the unlock is redistributed.
Bear case: A break below $1.49 could expose the moving averages near $1.37, then $1.26.
For any XRP price forecast this week, follow-through matters more than the unlock headline. For a broader look at the event and the $1.70 ceiling, see this XRP rebound and unlock analysis.
Market Intelligence: Crypto Analyst Predicts Best Low-Cap Crypto
LiquidChain Targets Cross-Chain Utility as XRP Tests Support
XRP’s setup offers potential upside if support holds, but the release adds a near-term supply variable, and no breakout is confirmed. That leaves traders weighing a defined technical trigger against uncertainty about how much unlocked XRP ultimately reaches exchanges.
LiquidChain is a Layer 3 infrastructure project whose website describes a cross-chain liquidity layer designed to combine Bitcoin, Ethereum, and Solana liquidity in one execution environment. At this stage, the token price stands at $0.01496, while the total raised reaches $979K.
Its Unified Liquidity Layer and Deploy-Once Architecture let developers build once and reach all three ecosystems instead of fragmenting liquidity across chains.
As with any presale, capital is at risk, and the project remains unproven at scale, so due diligence matters here as much as anywhere else.
Those curious can research LiquidChain directly.
Layer 3 Is Already Here, Smart Money Knows It – Do You? next
The post XRP Price Forecast: Can XRP Break $1.70 After 1B Unlock? appeared first on Coinspeaker.
The key question is not just how many tokens unlock, but how many actually reach the market, and whether XRP can reclaim resistance at $1.60–$1.70.
Ripple is set to release up to 1 billion XRP, worth roughly $1.5 billion at current prices. That is a gross unlock, not a confirmed sale. Ripple may redistribute the tokens or return a large share to escrow, as it often does.
The unlock alone will not decide the price path. Bitcoin’s direction and Ripple’s follow-up disclosures matter too. Technically, the question is whether support holds before the market tests the resistance above.
$XRP has two dates worth watching.
Sept 30: Evernorth treasury merger vote Oct 1: 1B XRP escrow unlock One is institutional. One is supply.
Unlock ≠ all of it hitting the market. Most of it usually gets re-locked. Which one are you watching more the vote or the unlock?#XRP pic.twitter.com/lMz6di94kK
— Leanna Paul (@LPaul_x) September 29, 2026
Don’t Miss: ICOBench Experts Call the Next 1000x Crypto Coins for 2026
Bull, Base or Bear: What Is the XRP Price Forecast for October?
XRPUSDT Chart 1D
The daily chart shows XRP stuck below a ceiling it has failed to break since August. Spikes toward $1.66–$1.70 in late August and September were both sold off quickly. Above that, the next major resistance sits near $1.76.
On the downside, XRP is holding just above support near $1.49–$1.50. Below that, the 50-day and 200-day moving averages have converged near $1.37, with a deeper floor around $1.26.
Bull case: A sustained daily close above $1.60–$1.70 would improve the structure. FXEmpire has cited $1.80 as a first target, with $2.10 possible if momentum holds.
Base case: XRP consolidates between $1.49 and $1.70 while traders watch how much of the unlock is redistributed.
Bear case: A break below $1.49 could expose the moving averages near $1.37, then $1.26.
For any XRP price forecast this week, follow-through matters more than the unlock headline. For a broader look at the event and the $1.70 ceiling, see this XRP rebound and unlock analysis.
Market Intelligence: Crypto Analyst Predicts Best Low-Cap Crypto
LiquidChain Targets Cross-Chain Utility as XRP Tests Support
XRP’s setup offers potential upside if support holds, but the release adds a near-term supply variable, and no breakout is confirmed. That leaves traders weighing a defined technical trigger against uncertainty about how much unlocked XRP ultimately reaches exchanges.
LiquidChain is a Layer 3 infrastructure project whose website describes a cross-chain liquidity layer designed to combine Bitcoin, Ethereum, and Solana liquidity in one execution environment. At this stage, the token price stands at $0.01496, while the total raised reaches $979K.
Its Unified Liquidity Layer and Deploy-Once Architecture let developers build once and reach all three ecosystems instead of fragmenting liquidity across chains.
As with any presale, capital is at risk, and the project remains unproven at scale, so due diligence matters here as much as anywhere else.
Those curious can research LiquidChain directly.
Layer 3 Is Already Here, Smart Money Knows It – Do You? next
The post XRP Price Forecast: Can XRP Break $1.70 After 1B Unlock? appeared first on Coinspeaker.
2
1
1.9k
·
--
ຢືນຢັນແລ້ວ
BTG Pactual Fund Shares Join CSD BR’s Live XRPL TestIn Ripple news, Brazilian financial-market infrastructure operator CSD BR and Ripple announced that CSD BR will mirror selected BTG Pactual investment-fund shares on the XRP Ledger (XRPL) as an additional recording and audit layer. CSD BR, which reports more than BRL 22 trillion in registered assets, will retain its systems as the official source of record for registration, deposit, and settlement.
This is not a replacement for the securities registry. A live test assessing whether tokenized ownership on a public blockchain enhances verification in regulated markets, without altering current legal duties or processes.
A licensed central securities depository is recording securities ownership on a public blockchain for the first time — on the XRP Ledger. 🇧🇷
CSD BR is partnering with Ripple to bring Brazil's regulated capital markets onchain, starting with BTG Pactual fund shares, secured by…
— Ripple (@Ripple) September 30, 2026
Tired of Trading Limits? Unlock 100X Leverage With CoinSpeaker on Margex XRP Ledger: A Complementary Audit Layer
The first phase moves tokenization from controlled testing into live operation with BTG Pactual fund shares deposited at CSD BR, one of the more concrete developments in recent Ripple news.
The companies say the project will allow them to assess transparency, traceability, automation, and efficiency under real operating conditions. They describe it as the first use of a public blockchain by a central securities depository for financial assets and securities to mirror ownership records.
The distinction matters: XRPL provides a complementary record for querying and auditing, while CSD BR’s systems retain legal authority. The announcement says the model fits within the current regulatory framework. It does not change participants’ legal responsibilities and does not require new regulatory approvals.
Broader institutional activity around tokenized real-world assets on XRPL provides context, but this initiative is specifically a record-mirroring phase.
Market Intelligence: Crypto Analyst Reveals Upcoming Coinbase Listings
How CSD BR’s XRPL Mirroring Works
Shares in the selected funds will be represented as tokens on XRPL using its Multi-Purpose Token (MPT) standard. Authorized participants can query the mirrored data and check its consistency with CSD BR’s official records in near real time.
Although XRPL is a public blockchain, participation in this arrangement is restricted to corporate and banking clients in Brazil subject to Know Your Customer (KYC) and anti-money laundering (AML) procedures. Ripple’s custody infrastructure and XRPL’s native capabilities support the onchain environment, while CSD BR retains control over issuance, administration and participant authorization.
CSD BR will also retain the ability to freeze individual assets or reverse transactions through a clawback when required by a regulatory or judicial order. The operator claims its wider infrastructure can handle millions of transactions within minutes. This capacity figure does not represent a valuation or the fund shares involved in this phase; the announcement provides no pilot value, share count, or token identifiers.
Ripple News: Regulated Infrastructure and the Next Phases
🇧🇷 Brazil is putting $XRP into real-world financial infrastructure.
FROM: CSD BR is working with Ripple to use the XRP Ledger as a complementary registration and auditing layer, initially mirroring BTG Pactual fund shares. https://t.co/dMyGIA9VeB pic.twitter.com/2YWF03IiTh
— 𝗕𝗮𝗻𝗸XRP (@BankXRP) September 30, 2026
CSD BR is authorized by the Central Bank of Brazil to provide registration, depository, and settlement services, and by the Brazilian Securities and Exchange Commission (CVM) to provide registration and depository services. The partnership combines that regulated infrastructure with XRPL technology, with live transactions intended to test the model without changing current processes for investors, issuers, or participants.
Daniel Polano Spreafico, CSD BR’s Head of Products and Clients, said the partnership began with record mirroring to introduce new technology. And also to cautiously evaluate its performance under real operating conditions. His stated rationale was that current processes would remain unchanged in this phase, creating a foundation for possible later developments.
After the mirroring phase is validated, the companies envision considering native asset issuance and trading among authorized participants. Potential assets include Brazilian Real Estate Receivables Certificates (CRI) and Agribusiness Receivables Certificates (CRA). Later development is expected to address financial-market privacy requirements through advanced confidentiality mechanisms.
No timetable was provided, and the announcement does not say that XRPL records will become legally authoritative. Expansion to other asset classes, participants, or international markets remains a possibility rather than a confirmed deployment.
Market Intelligence: Crypto Analyst Reveals Upcoming Coinbase Listings
next
The post BTG Pactual Fund Shares Join CSD BR’s Live XRPL Test appeared first on Coinspeaker.
BTG Pactual Fund Shares Join CSD BR’s Live XRPL Test
In Ripple news, Brazilian financial-market infrastructure operator CSD BR and Ripple announced that CSD BR will mirror selected BTG Pactual investment-fund shares on the XRP Ledger (XRPL) as an additional recording and audit layer. CSD BR, which reports more than BRL 22 trillion in registered assets, will retain its systems as the official source of record for registration, deposit, and settlement.
This is not a replacement for the securities registry. A live test assessing whether tokenized ownership on a public blockchain enhances verification in regulated markets, without altering current legal duties or processes.
A licensed central securities depository is recording securities ownership on a public blockchain for the first time — on the XRP Ledger. 🇧🇷
CSD BR is partnering with Ripple to bring Brazil's regulated capital markets onchain, starting with BTG Pactual fund shares, secured by…
— Ripple (@Ripple) September 30, 2026
Tired of Trading Limits? Unlock 100X Leverage With CoinSpeaker on Margex XRP Ledger: A Complementary Audit Layer
The first phase moves tokenization from controlled testing into live operation with BTG Pactual fund shares deposited at CSD BR, one of the more concrete developments in recent Ripple news.
The companies say the project will allow them to assess transparency, traceability, automation, and efficiency under real operating conditions. They describe it as the first use of a public blockchain by a central securities depository for financial assets and securities to mirror ownership records.
The distinction matters: XRPL provides a complementary record for querying and auditing, while CSD BR’s systems retain legal authority. The announcement says the model fits within the current regulatory framework. It does not change participants’ legal responsibilities and does not require new regulatory approvals.
Broader institutional activity around tokenized real-world assets on XRPL provides context, but this initiative is specifically a record-mirroring phase.
Market Intelligence: Crypto Analyst Reveals Upcoming Coinbase Listings
How CSD BR’s XRPL Mirroring Works
Shares in the selected funds will be represented as tokens on XRPL using its Multi-Purpose Token (MPT) standard. Authorized participants can query the mirrored data and check its consistency with CSD BR’s official records in near real time.
Although XRPL is a public blockchain, participation in this arrangement is restricted to corporate and banking clients in Brazil subject to Know Your Customer (KYC) and anti-money laundering (AML) procedures. Ripple’s custody infrastructure and XRPL’s native capabilities support the onchain environment, while CSD BR retains control over issuance, administration and participant authorization.
CSD BR will also retain the ability to freeze individual assets or reverse transactions through a clawback when required by a regulatory or judicial order. The operator claims its wider infrastructure can handle millions of transactions within minutes. This capacity figure does not represent a valuation or the fund shares involved in this phase; the announcement provides no pilot value, share count, or token identifiers.
Ripple News: Regulated Infrastructure and the Next Phases
🇧🇷 Brazil is putting $XRP into real-world financial infrastructure.
FROM: CSD BR is working with Ripple to use the XRP Ledger as a complementary registration and auditing layer, initially mirroring BTG Pactual fund shares. https://t.co/dMyGIA9VeB pic.twitter.com/2YWF03IiTh
— 𝗕𝗮𝗻𝗸XRP (@BankXRP) September 30, 2026
CSD BR is authorized by the Central Bank of Brazil to provide registration, depository, and settlement services, and by the Brazilian Securities and Exchange Commission (CVM) to provide registration and depository services. The partnership combines that regulated infrastructure with XRPL technology, with live transactions intended to test the model without changing current processes for investors, issuers, or participants.
Daniel Polano Spreafico, CSD BR’s Head of Products and Clients, said the partnership began with record mirroring to introduce new technology. And also to cautiously evaluate its performance under real operating conditions. His stated rationale was that current processes would remain unchanged in this phase, creating a foundation for possible later developments.
After the mirroring phase is validated, the companies envision considering native asset issuance and trading among authorized participants. Potential assets include Brazilian Real Estate Receivables Certificates (CRI) and Agribusiness Receivables Certificates (CRA). Later development is expected to address financial-market privacy requirements through advanced confidentiality mechanisms.
No timetable was provided, and the announcement does not say that XRPL records will become legally authoritative. Expansion to other asset classes, participants, or international markets remains a possibility rather than a confirmed deployment.
Market Intelligence: Crypto Analyst Reveals Upcoming Coinbase Listings
next
The post BTG Pactual Fund Shares Join CSD BR’s Live XRPL Test appeared first on Coinspeaker.
This is not a replacement for the securities registry. A live test assessing whether tokenized ownership on a public blockchain enhances verification in regulated markets, without altering current legal duties or processes.
A licensed central securities depository is recording securities ownership on a public blockchain for the first time — on the XRP Ledger. 🇧🇷
CSD BR is partnering with Ripple to bring Brazil's regulated capital markets onchain, starting with BTG Pactual fund shares, secured by…
— Ripple (@Ripple) September 30, 2026
Tired of Trading Limits? Unlock 100X Leverage With CoinSpeaker on Margex XRP Ledger: A Complementary Audit Layer
The first phase moves tokenization from controlled testing into live operation with BTG Pactual fund shares deposited at CSD BR, one of the more concrete developments in recent Ripple news.
The companies say the project will allow them to assess transparency, traceability, automation, and efficiency under real operating conditions. They describe it as the first use of a public blockchain by a central securities depository for financial assets and securities to mirror ownership records.
The distinction matters: XRPL provides a complementary record for querying and auditing, while CSD BR’s systems retain legal authority. The announcement says the model fits within the current regulatory framework. It does not change participants’ legal responsibilities and does not require new regulatory approvals.
Broader institutional activity around tokenized real-world assets on XRPL provides context, but this initiative is specifically a record-mirroring phase.
Market Intelligence: Crypto Analyst Reveals Upcoming Coinbase Listings
How CSD BR’s XRPL Mirroring Works
Shares in the selected funds will be represented as tokens on XRPL using its Multi-Purpose Token (MPT) standard. Authorized participants can query the mirrored data and check its consistency with CSD BR’s official records in near real time.
Although XRPL is a public blockchain, participation in this arrangement is restricted to corporate and banking clients in Brazil subject to Know Your Customer (KYC) and anti-money laundering (AML) procedures. Ripple’s custody infrastructure and XRPL’s native capabilities support the onchain environment, while CSD BR retains control over issuance, administration and participant authorization.
CSD BR will also retain the ability to freeze individual assets or reverse transactions through a clawback when required by a regulatory or judicial order. The operator claims its wider infrastructure can handle millions of transactions within minutes. This capacity figure does not represent a valuation or the fund shares involved in this phase; the announcement provides no pilot value, share count, or token identifiers.
Ripple News: Regulated Infrastructure and the Next Phases
🇧🇷 Brazil is putting $XRP into real-world financial infrastructure.
FROM: CSD BR is working with Ripple to use the XRP Ledger as a complementary registration and auditing layer, initially mirroring BTG Pactual fund shares. https://t.co/dMyGIA9VeB pic.twitter.com/2YWF03IiTh
— 𝗕𝗮𝗻𝗸XRP (@BankXRP) September 30, 2026
CSD BR is authorized by the Central Bank of Brazil to provide registration, depository, and settlement services, and by the Brazilian Securities and Exchange Commission (CVM) to provide registration and depository services. The partnership combines that regulated infrastructure with XRPL technology, with live transactions intended to test the model without changing current processes for investors, issuers, or participants.
Daniel Polano Spreafico, CSD BR’s Head of Products and Clients, said the partnership began with record mirroring to introduce new technology. And also to cautiously evaluate its performance under real operating conditions. His stated rationale was that current processes would remain unchanged in this phase, creating a foundation for possible later developments.
After the mirroring phase is validated, the companies envision considering native asset issuance and trading among authorized participants. Potential assets include Brazilian Real Estate Receivables Certificates (CRI) and Agribusiness Receivables Certificates (CRA). Later development is expected to address financial-market privacy requirements through advanced confidentiality mechanisms.
No timetable was provided, and the announcement does not say that XRPL records will become legally authoritative. Expansion to other asset classes, participants, or international markets remains a possibility rather than a confirmed deployment.
Market Intelligence: Crypto Analyst Reveals Upcoming Coinbase Listings
next
The post BTG Pactual Fund Shares Join CSD BR’s Live XRPL Test appeared first on Coinspeaker.
3
3.8k
·
--
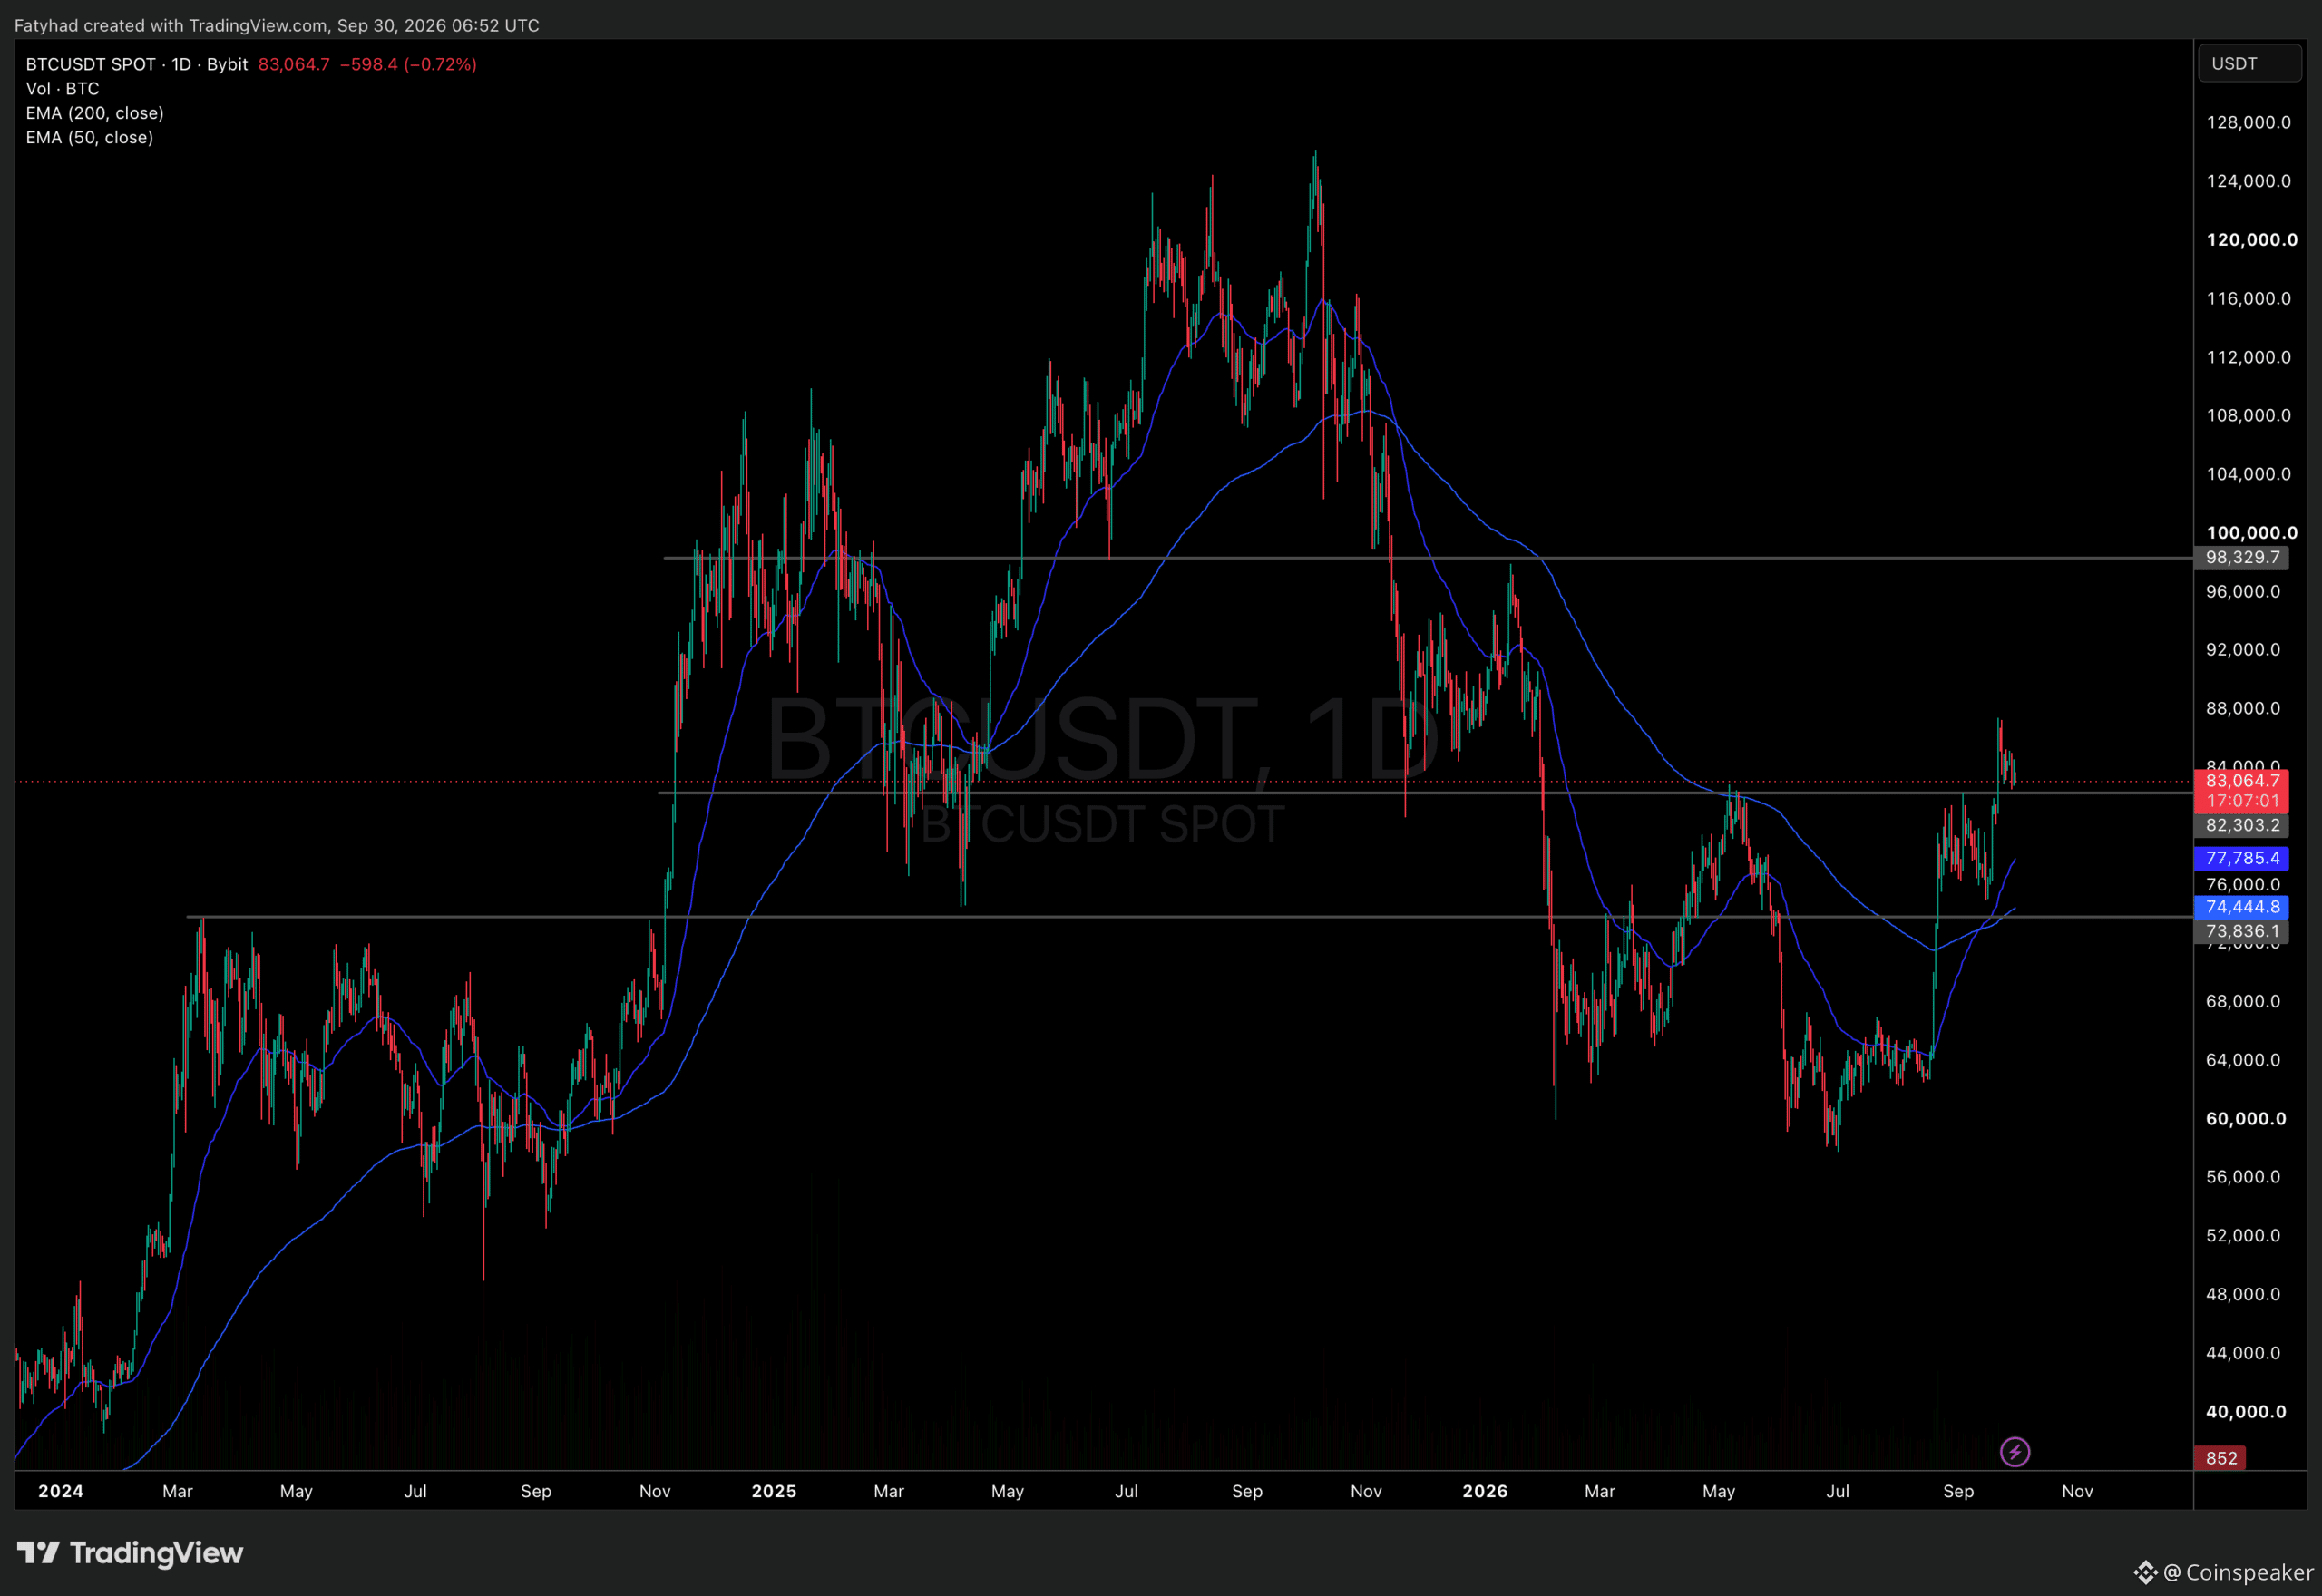
ບົດຄວາມ
Bitcoin Price Forecast: Another Fed Shock Coming for the Crypto Market?Bitcoin is back under pressure after the Federal Reserve’s September rate increase, with BTC reported at $83,100 on September 30, down 0.9%. For anyone watching the near-term Bitcoin price forecast, the next test is the August personal consumption expenditures (PCE) inflation report, due today: a hot reading could reinforce higher-for-longer expectations, while a softer one may ease the squeeze on risk assets.
The policy-rate target rose to 3.75%–4.00% on September 16, and the 10-year Treasury yield reached 5.24% on September 28. Bitcoin briefly rallied above $87,000 earlier in September, supported by exchange-traded fund (ETF) creations, short covering, and treasury demand, before slipping back. A chart of that reversal, or a market post marking the $84,000 level, would frame the immediate question: Can buyers reclaim it?
US PCE inflation data for August will be released later today.
Core PCE is the Fed's preferred measure of inflation, so this release will be closely watched as the markets search for a signal as to whether or not inflation is improving.
Prepare for volatility. pic.twitter.com/E4Nob8fw0u
— Satoshi Stacker (@StackerSatoshi) September 30, 2026
Institutional flows offer a counterweight to the macro strain. U.S. spot Bitcoin ETFs reportedly drew $2.39 billion for the week ending September 26, the largest weekly inflow total of 2026, while earlier outflows totaled about $746.3 million across September 15 and 16. That tug-of-war, rather than a clean trend, sets up the price levels that matter next.
Join Coinspeaker’s $1,000 Prize Drop on Bybit Bitcoin Price Forecast: Can BTC Price Reclaim $84,000 This Week?
BTCUSDT Chart 1D TradingView
BTC traded around $82,776–$83,093 on September 30, -1% in the last 24 hours. The visible setup for this Bitcoin price forecast shows volatile consolidation beneath resistance.
$84,000 is now a reclaim threshold, not established support. Above it, the next test is the ETF cohort cost basis near $84,714; a sustained move through that area would improve the near-term structure, though it would not by itself confirm a breakout. October Federal Open Market Committee (FOMC) scenarios likewise hinge on policy expectations and whether demand persists.
Bull case: softer PCE data, easing Treasury yields, and continued ETF creations could help BTC recover $84,000 and test $84,714.
Base case: inflation and yields keep prices choppy below those levels.
Bear case: a hotter report and further yield pressure leave $60,000 as a longer-term reference, with the June cycle low near $58,300 as a deeper downside context. It’s not an immediate target. The key invalidation for a recovery thesis is failure to reclaim resistance as macro pressure persists. What would change the read? A durable move above $84,714, backed by renewed demand.
For another view of rate-driven price paths, analysis of Bitcoin’s reaction to the Fed’s rate hike lays out scenarios, but forecasts remain conditional. Keep the focus on price, yields, and ETF flows rather than a single headline.
Market Intelligence: Crypto Analyst Predicts Best Low-Cap Crypto
Bitcoin Hyper Targets Early Mover Upside as Bitcoin Tests Key Levels
For holders watching BTC trade below resistance, the near-term discomfort is plain: ETF inflows have not prevented a retreat, and macro conditions can quickly reset risk appetite. That does not make a rotation into an early-stage token a hedge. It does explain why some market participants look beyond Bitcoin’s current price action, while accepting a very different risk profile.
Bitcoin Hyper ($HYPER) is a Bitcoin Layer 2 project combining the Solana Virtual Machine (SVM) with Bitcoin-related infrastructure. Its stated proposition is faster, lower-cost smart-contract execution, alongside a decentralized canonical bridge for BTC transfers. The project describes itself as the first Bitcoin Layer 2 with SVM integration; claims of performance beyond Solana should be treated as project messaging, not independently established results.
The listed presale price is $0.013687, and the project reports over $33 million raised. Staking is advertised at a 35% APY.
If you want to learn more about the project, research Bitcoin Hyper here and review the project’s terms before considering exposure.
Don’t Miss Out Again: Join New Bitcoin Layer 2 Early Here
Market Intelligence: Crypto Analyst Reveals Upcoming Coinbase Listings
next
The post Bitcoin Price Forecast: Another Fed Shock Coming for the Crypto Market? appeared first on Coinspeaker.
Bitcoin Price Forecast: Another Fed Shock Coming for the Crypto Market?
Bitcoin is back under pressure after the Federal Reserve’s September rate increase, with BTC reported at $83,100 on September 30, down 0.9%. For anyone watching the near-term Bitcoin price forecast, the next test is the August personal consumption expenditures (PCE) inflation report, due today: a hot reading could reinforce higher-for-longer expectations, while a softer one may ease the squeeze on risk assets.
The policy-rate target rose to 3.75%–4.00% on September 16, and the 10-year Treasury yield reached 5.24% on September 28. Bitcoin briefly rallied above $87,000 earlier in September, supported by exchange-traded fund (ETF) creations, short covering, and treasury demand, before slipping back. A chart of that reversal, or a market post marking the $84,000 level, would frame the immediate question: Can buyers reclaim it?
US PCE inflation data for August will be released later today.
Core PCE is the Fed's preferred measure of inflation, so this release will be closely watched as the markets search for a signal as to whether or not inflation is improving.
Prepare for volatility. pic.twitter.com/E4Nob8fw0u
— Satoshi Stacker (@StackerSatoshi) September 30, 2026
Institutional flows offer a counterweight to the macro strain. U.S. spot Bitcoin ETFs reportedly drew $2.39 billion for the week ending September 26, the largest weekly inflow total of 2026, while earlier outflows totaled about $746.3 million across September 15 and 16. That tug-of-war, rather than a clean trend, sets up the price levels that matter next.
Join Coinspeaker’s $1,000 Prize Drop on Bybit Bitcoin Price Forecast: Can BTC Price Reclaim $84,000 This Week?
BTCUSDT Chart 1D TradingView
BTC traded around $82,776–$83,093 on September 30, -1% in the last 24 hours. The visible setup for this Bitcoin price forecast shows volatile consolidation beneath resistance.
$84,000 is now a reclaim threshold, not established support. Above it, the next test is the ETF cohort cost basis near $84,714; a sustained move through that area would improve the near-term structure, though it would not by itself confirm a breakout. October Federal Open Market Committee (FOMC) scenarios likewise hinge on policy expectations and whether demand persists.
Bull case: softer PCE data, easing Treasury yields, and continued ETF creations could help BTC recover $84,000 and test $84,714.
Base case: inflation and yields keep prices choppy below those levels.
Bear case: a hotter report and further yield pressure leave $60,000 as a longer-term reference, with the June cycle low near $58,300 as a deeper downside context. It’s not an immediate target. The key invalidation for a recovery thesis is failure to reclaim resistance as macro pressure persists. What would change the read? A durable move above $84,714, backed by renewed demand.
For another view of rate-driven price paths, analysis of Bitcoin’s reaction to the Fed’s rate hike lays out scenarios, but forecasts remain conditional. Keep the focus on price, yields, and ETF flows rather than a single headline.
Market Intelligence: Crypto Analyst Predicts Best Low-Cap Crypto
Bitcoin Hyper Targets Early Mover Upside as Bitcoin Tests Key Levels
For holders watching BTC trade below resistance, the near-term discomfort is plain: ETF inflows have not prevented a retreat, and macro conditions can quickly reset risk appetite. That does not make a rotation into an early-stage token a hedge. It does explain why some market participants look beyond Bitcoin’s current price action, while accepting a very different risk profile.
Bitcoin Hyper ($HYPER) is a Bitcoin Layer 2 project combining the Solana Virtual Machine (SVM) with Bitcoin-related infrastructure. Its stated proposition is faster, lower-cost smart-contract execution, alongside a decentralized canonical bridge for BTC transfers. The project describes itself as the first Bitcoin Layer 2 with SVM integration; claims of performance beyond Solana should be treated as project messaging, not independently established results.
The listed presale price is $0.013687, and the project reports over $33 million raised. Staking is advertised at a 35% APY.
If you want to learn more about the project, research Bitcoin Hyper here and review the project’s terms before considering exposure.
Don’t Miss Out Again: Join New Bitcoin Layer 2 Early Here
Market Intelligence: Crypto Analyst Reveals Upcoming Coinbase Listings
next
The post Bitcoin Price Forecast: Another Fed Shock Coming for the Crypto Market? appeared first on Coinspeaker.
The policy-rate target rose to 3.75%–4.00% on September 16, and the 10-year Treasury yield reached 5.24% on September 28. Bitcoin briefly rallied above $87,000 earlier in September, supported by exchange-traded fund (ETF) creations, short covering, and treasury demand, before slipping back. A chart of that reversal, or a market post marking the $84,000 level, would frame the immediate question: Can buyers reclaim it?
US PCE inflation data for August will be released later today.
Core PCE is the Fed's preferred measure of inflation, so this release will be closely watched as the markets search for a signal as to whether or not inflation is improving.
Prepare for volatility. pic.twitter.com/E4Nob8fw0u
— Satoshi Stacker (@StackerSatoshi) September 30, 2026
Institutional flows offer a counterweight to the macro strain. U.S. spot Bitcoin ETFs reportedly drew $2.39 billion for the week ending September 26, the largest weekly inflow total of 2026, while earlier outflows totaled about $746.3 million across September 15 and 16. That tug-of-war, rather than a clean trend, sets up the price levels that matter next.
Join Coinspeaker’s $1,000 Prize Drop on Bybit Bitcoin Price Forecast: Can BTC Price Reclaim $84,000 This Week?
BTCUSDT Chart 1D TradingView
BTC traded around $82,776–$83,093 on September 30, -1% in the last 24 hours. The visible setup for this Bitcoin price forecast shows volatile consolidation beneath resistance.
$84,000 is now a reclaim threshold, not established support. Above it, the next test is the ETF cohort cost basis near $84,714; a sustained move through that area would improve the near-term structure, though it would not by itself confirm a breakout. October Federal Open Market Committee (FOMC) scenarios likewise hinge on policy expectations and whether demand persists.
Bull case: softer PCE data, easing Treasury yields, and continued ETF creations could help BTC recover $84,000 and test $84,714.
Base case: inflation and yields keep prices choppy below those levels.
Bear case: a hotter report and further yield pressure leave $60,000 as a longer-term reference, with the June cycle low near $58,300 as a deeper downside context. It’s not an immediate target. The key invalidation for a recovery thesis is failure to reclaim resistance as macro pressure persists. What would change the read? A durable move above $84,714, backed by renewed demand.
For another view of rate-driven price paths, analysis of Bitcoin’s reaction to the Fed’s rate hike lays out scenarios, but forecasts remain conditional. Keep the focus on price, yields, and ETF flows rather than a single headline.
Market Intelligence: Crypto Analyst Predicts Best Low-Cap Crypto
Bitcoin Hyper Targets Early Mover Upside as Bitcoin Tests Key Levels
For holders watching BTC trade below resistance, the near-term discomfort is plain: ETF inflows have not prevented a retreat, and macro conditions can quickly reset risk appetite. That does not make a rotation into an early-stage token a hedge. It does explain why some market participants look beyond Bitcoin’s current price action, while accepting a very different risk profile.
Bitcoin Hyper ($HYPER) is a Bitcoin Layer 2 project combining the Solana Virtual Machine (SVM) with Bitcoin-related infrastructure. Its stated proposition is faster, lower-cost smart-contract execution, alongside a decentralized canonical bridge for BTC transfers. The project describes itself as the first Bitcoin Layer 2 with SVM integration; claims of performance beyond Solana should be treated as project messaging, not independently established results.
The listed presale price is $0.013687, and the project reports over $33 million raised. Staking is advertised at a 35% APY.
If you want to learn more about the project, research Bitcoin Hyper here and review the project’s terms before considering exposure.
Don’t Miss Out Again: Join New Bitcoin Layer 2 Early Here
Market Intelligence: Crypto Analyst Reveals Upcoming Coinbase Listings
next
The post Bitcoin Price Forecast: Another Fed Shock Coming for the Crypto Market? appeared first on Coinspeaker.
337
·
--
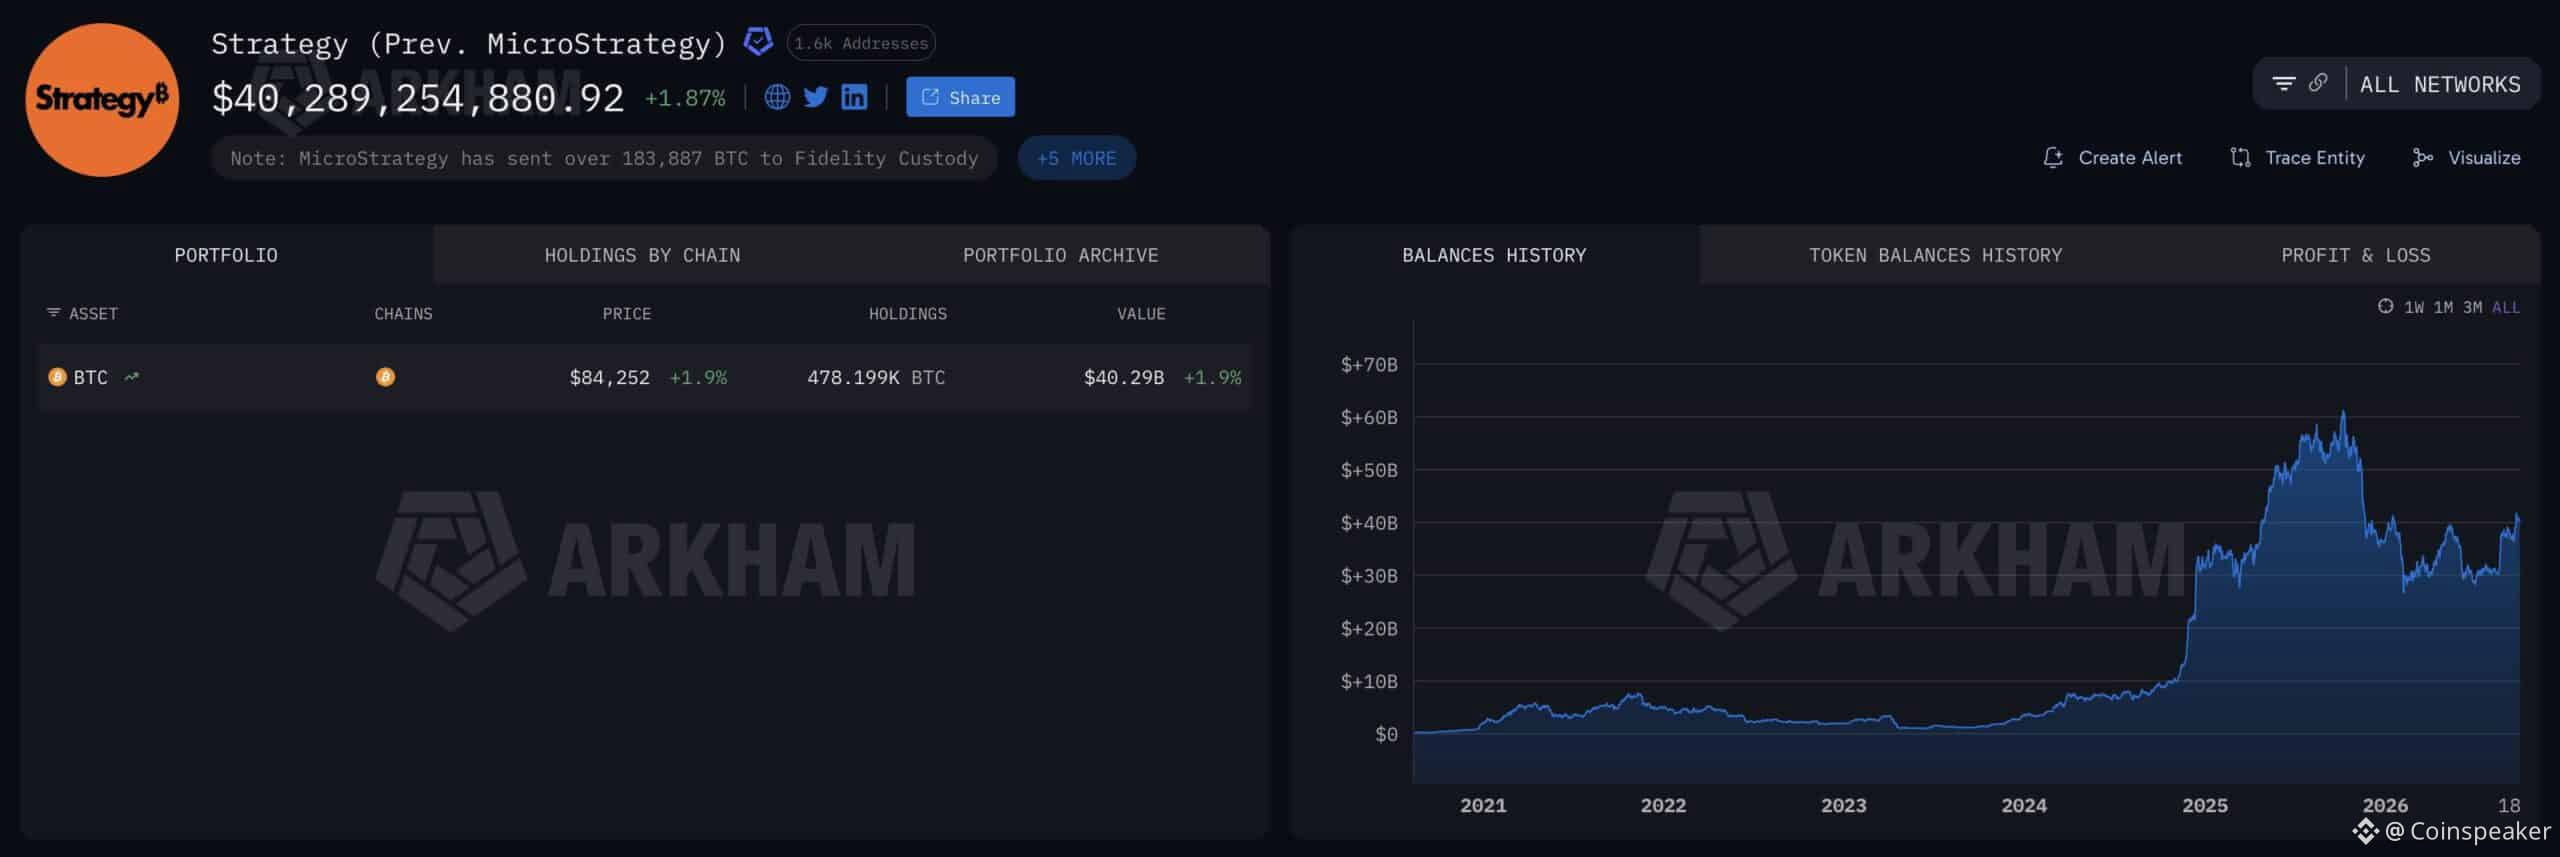
ບົດຄວາມ
AI Predicts Bitcoin Path As Strategy Moves 3,568 CoinsTwo warning lights came on at once this week, and neither is conclusive on its own. Strategy moved 3,568 BTC worth roughly $297 million out of its wallets over nine hours, according to Lookonchain. At the same time, Glassnode data shows spot traders rotating into altcoins at the fastest pace in a year. Claude AI predicts Bitcoin holds its breakout for now, but both signals argue for caution rather than chasing.
BTC trades near $84,285, up 0.94% on the day. The token is holding above the level it reclaimed last week, though the move has lost momentum.
Is Michael Saylor(@saylor)'s @Strategy dumping $BTC again, or just moving funds to new wallets?
Over the past 9 hours, #Strategy has transferred out 3,568 $BTC ($297M).https://t.co/bgZyNCEqBn pic.twitter.com/3vWTSs6ihX
— Lookonchain (@lookonchain) September 29, 2026
Supercharge Your Trading in 2026 With BloFin AI Trading Bots Is Strategy Selling or Just Moving Wallets?
Strategy (Prev. MicroStrategy) Arkham
Nobody outside the company knows yet, and that is the honest answer. What is verifiable is the flow. Over a nine-hour window, 3,568 BTC left addresses attributed to Strategy. At current Bitcoin prices that is about $297 million.
The timing is what makes it odd. Strategy bought 1,665 BTC at an average of $85,681 just days ago, its second consecutive weekly purchase. Buying one week and transferring out the next is not the behavior of a straightforward accumulator.
There are innocent explanations. Companies rotate custody providers, restructure wallet architecture, and reorganize holdings for accounting or security reasons. None of that requires selling a single coin.
There is also precedent for the less comfortable reading. Strategy sold 6,916 BTC over the summer to cover preferred dividends and reduce debt, at prices below $65,000.
Treat this as an open question. On-chain movement is not the same as a sale, and attributing intent to a wallet transfer is how people get caught out.
Put Your Money Where Your Mouth is On Polymarket Why Does Altcoin Volume Signal a Local Top?
Altcoins Share Glassnode
This signal is cleaner, and it is less comfortable. Total spot volume across crypto now runs close to four times Bitcoin’s own, the highest reading since September 2025. In plain terms, money is moving out of BTC and into everything else.
Glassnode’s framing is worth quoting directly: demand for higher risk like this has often lined up with local tops in Bitcoin. The logic is behavioral. Traders rotate into altcoins when they feel confident, which usually happens after a strong Bitcoin run rather than before one. By the time the crowd is chasing smaller caps, the easy move in BTC has already happened.
Look at the history on Glassnode’s chart, and the pattern repeats. The deep-red readings in early 2025 and mid 2025 both occurred near local highs, not at the start of new legs.
This does not mean a crash. It means the risk of buying here is higher than it was at $75,000 two weeks ago.
DISCOVER: Bitget Hack Shows Why XRP Cannot Be Frozen
AI Predicts Bitcoin Levels: Where Does the Trend Break?
BTCUSDT Chart 1D TradingView
The chart is still constructive, which is the counterweight to both signals above. Bitcoin holds above $82,303, the level that rejected it in May and September and now acts as support. The 50-day EMA at $77,594 sits above the 200-day EMA at $74,364, and both continue to rise.
AI predicts Bitcoin will be decided at these levels:
The line to hold: $82,303. Daily closes above it keep the breakout structure intact.
The test above: $88,000 to $90,000. The nearest supply band, and the level that would invalidate the local top argument.
The bigger target: $98,330. The final barrier before $100,000, realistically a year-end objective.
Below the breakout, $77,594 and then $74,364 form the backstop. That zone has absorbed every pullback since August.
The setup is finely balanced. Corporate buying and a rising moving average structure support the trend, while altcoin rotation and an unexplained $297 million transfer argue the other way.
Watch $82,303. Holding it means the signals were noise. Losing it means they were early.
Market Intelligence: Crypto Analyst Predicts Best New Crypto to Hodl
next
The post AI Predicts Bitcoin Path as Strategy Moves 3,568 Coins appeared first on Coinspeaker.
AI Predicts Bitcoin Path As Strategy Moves 3,568 Coins
Two warning lights came on at once this week, and neither is conclusive on its own. Strategy moved 3,568 BTC worth roughly $297 million out of its wallets over nine hours, according to Lookonchain. At the same time, Glassnode data shows spot traders rotating into altcoins at the fastest pace in a year. Claude AI predicts Bitcoin holds its breakout for now, but both signals argue for caution rather than chasing.
BTC trades near $84,285, up 0.94% on the day. The token is holding above the level it reclaimed last week, though the move has lost momentum.
Is Michael Saylor(@saylor)'s @Strategy dumping $BTC again, or just moving funds to new wallets?
Over the past 9 hours, #Strategy has transferred out 3,568 $BTC ($297M).https://t.co/bgZyNCEqBn pic.twitter.com/3vWTSs6ihX
— Lookonchain (@lookonchain) September 29, 2026
Supercharge Your Trading in 2026 With BloFin AI Trading Bots Is Strategy Selling or Just Moving Wallets?
Strategy (Prev. MicroStrategy) Arkham
Nobody outside the company knows yet, and that is the honest answer. What is verifiable is the flow. Over a nine-hour window, 3,568 BTC left addresses attributed to Strategy. At current Bitcoin prices that is about $297 million.
The timing is what makes it odd. Strategy bought 1,665 BTC at an average of $85,681 just days ago, its second consecutive weekly purchase. Buying one week and transferring out the next is not the behavior of a straightforward accumulator.
There are innocent explanations. Companies rotate custody providers, restructure wallet architecture, and reorganize holdings for accounting or security reasons. None of that requires selling a single coin.
There is also precedent for the less comfortable reading. Strategy sold 6,916 BTC over the summer to cover preferred dividends and reduce debt, at prices below $65,000.
Treat this as an open question. On-chain movement is not the same as a sale, and attributing intent to a wallet transfer is how people get caught out.
Put Your Money Where Your Mouth is On Polymarket Why Does Altcoin Volume Signal a Local Top?
Altcoins Share Glassnode
This signal is cleaner, and it is less comfortable. Total spot volume across crypto now runs close to four times Bitcoin’s own, the highest reading since September 2025. In plain terms, money is moving out of BTC and into everything else.
Glassnode’s framing is worth quoting directly: demand for higher risk like this has often lined up with local tops in Bitcoin. The logic is behavioral. Traders rotate into altcoins when they feel confident, which usually happens after a strong Bitcoin run rather than before one. By the time the crowd is chasing smaller caps, the easy move in BTC has already happened.
Look at the history on Glassnode’s chart, and the pattern repeats. The deep-red readings in early 2025 and mid 2025 both occurred near local highs, not at the start of new legs.
This does not mean a crash. It means the risk of buying here is higher than it was at $75,000 two weeks ago.
DISCOVER: Bitget Hack Shows Why XRP Cannot Be Frozen
AI Predicts Bitcoin Levels: Where Does the Trend Break?
BTCUSDT Chart 1D TradingView
The chart is still constructive, which is the counterweight to both signals above. Bitcoin holds above $82,303, the level that rejected it in May and September and now acts as support. The 50-day EMA at $77,594 sits above the 200-day EMA at $74,364, and both continue to rise.
AI predicts Bitcoin will be decided at these levels:
The line to hold: $82,303. Daily closes above it keep the breakout structure intact.
The test above: $88,000 to $90,000. The nearest supply band, and the level that would invalidate the local top argument.
The bigger target: $98,330. The final barrier before $100,000, realistically a year-end objective.
Below the breakout, $77,594 and then $74,364 form the backstop. That zone has absorbed every pullback since August.
The setup is finely balanced. Corporate buying and a rising moving average structure support the trend, while altcoin rotation and an unexplained $297 million transfer argue the other way.
Watch $82,303. Holding it means the signals were noise. Losing it means they were early.
Market Intelligence: Crypto Analyst Predicts Best New Crypto to Hodl
next
The post AI Predicts Bitcoin Path as Strategy Moves 3,568 Coins appeared first on Coinspeaker.
BTC trades near $84,285, up 0.94% on the day. The token is holding above the level it reclaimed last week, though the move has lost momentum.
Is Michael Saylor(@saylor)'s @Strategy dumping $BTC again, or just moving funds to new wallets?
Over the past 9 hours, #Strategy has transferred out 3,568 $BTC ($297M).https://t.co/bgZyNCEqBn pic.twitter.com/3vWTSs6ihX
— Lookonchain (@lookonchain) September 29, 2026
Supercharge Your Trading in 2026 With BloFin AI Trading Bots Is Strategy Selling or Just Moving Wallets?
Strategy (Prev. MicroStrategy) Arkham
Nobody outside the company knows yet, and that is the honest answer. What is verifiable is the flow. Over a nine-hour window, 3,568 BTC left addresses attributed to Strategy. At current Bitcoin prices that is about $297 million.
The timing is what makes it odd. Strategy bought 1,665 BTC at an average of $85,681 just days ago, its second consecutive weekly purchase. Buying one week and transferring out the next is not the behavior of a straightforward accumulator.
There are innocent explanations. Companies rotate custody providers, restructure wallet architecture, and reorganize holdings for accounting or security reasons. None of that requires selling a single coin.
There is also precedent for the less comfortable reading. Strategy sold 6,916 BTC over the summer to cover preferred dividends and reduce debt, at prices below $65,000.
Treat this as an open question. On-chain movement is not the same as a sale, and attributing intent to a wallet transfer is how people get caught out.
Put Your Money Where Your Mouth is On Polymarket Why Does Altcoin Volume Signal a Local Top?
Altcoins Share Glassnode
This signal is cleaner, and it is less comfortable. Total spot volume across crypto now runs close to four times Bitcoin’s own, the highest reading since September 2025. In plain terms, money is moving out of BTC and into everything else.
Glassnode’s framing is worth quoting directly: demand for higher risk like this has often lined up with local tops in Bitcoin. The logic is behavioral. Traders rotate into altcoins when they feel confident, which usually happens after a strong Bitcoin run rather than before one. By the time the crowd is chasing smaller caps, the easy move in BTC has already happened.
Look at the history on Glassnode’s chart, and the pattern repeats. The deep-red readings in early 2025 and mid 2025 both occurred near local highs, not at the start of new legs.
This does not mean a crash. It means the risk of buying here is higher than it was at $75,000 two weeks ago.
DISCOVER: Bitget Hack Shows Why XRP Cannot Be Frozen
AI Predicts Bitcoin Levels: Where Does the Trend Break?
BTCUSDT Chart 1D TradingView
The chart is still constructive, which is the counterweight to both signals above. Bitcoin holds above $82,303, the level that rejected it in May and September and now acts as support. The 50-day EMA at $77,594 sits above the 200-day EMA at $74,364, and both continue to rise.
AI predicts Bitcoin will be decided at these levels:
The line to hold: $82,303. Daily closes above it keep the breakout structure intact.
The test above: $88,000 to $90,000. The nearest supply band, and the level that would invalidate the local top argument.
The bigger target: $98,330. The final barrier before $100,000, realistically a year-end objective.
Below the breakout, $77,594 and then $74,364 form the backstop. That zone has absorbed every pullback since August.
The setup is finely balanced. Corporate buying and a rising moving average structure support the trend, while altcoin rotation and an unexplained $297 million transfer argue the other way.
Watch $82,303. Holding it means the signals were noise. Losing it means they were early.
Market Intelligence: Crypto Analyst Predicts Best New Crypto to Hodl
next
The post AI Predicts Bitcoin Path as Strategy Moves 3,568 Coins appeared first on Coinspeaker.
1
1
158
ເຂົ້າສູ່ລະບົບເພື່ອສຳຫຼວດເນື້ອຫາເພີ່ມເຕີມ
ເຂົ້າຮ່ວມກຸ່ມຜູ້ໃຊ້ຄຣິບໂຕທົ່ວໂລກໃນ Binance Square.
⚡️ ໄດ້ຮັບຂໍ້ມູນຫຼ້າສຸດ ແລະ ທີ່ມີປະໂຫຍດກ່ຽວກັບຄຣິບໂຕ.
💬 ໄດ້ຮັບຄວາມໄວ້ວາງໃຈຈາກຕະຫຼາດແລກປ່ຽນຄຣິບໂຕທີ່ໃຫຍ່ທີ່ສຸດໃນໂລກ.
👍 ຄົ້ນຫາຂໍ້ມູນເຊີງເລິກທີ່ແທ້ຈາກນັກສ້າງທີ່ໄດ້ຮັບການຢືນຢັນ.
ອີເມວ / ເບີໂທລະສັບ
ຫົວຂໍ້ທີ່ກໍາລັງນິຍົມ
BinanceLaunchesBinanceIntelligence
405,927 views
3,094 ກຳລັງສົນທະນາ
#BinanceLaunchesBinanceIntelligence
⚡ AI Meets Crypto Trading: Binance Intelligence is Live! ⚡
Trading just got a massive upgrade with Binance's new AI suite:
1️⃣ Binance AI: Personalized market dashboards & 4-hour macro market audio briefings.
2️⃣ Binance AI Pro: Build and run automated strategies using simple natural language prompts.
3️⃣ Binance Agent OS: Developer framework for autonomous financial AI agents.
Describe your strategy ➔ Paper test ➔ Execute 24/7.
Are you building your next trading strategy with AI? Drop your thoughts below! 👇
#BinanceLaunchesBinanceIntelligence #BinanceSquare #CryptoAI #Trading $EDEN
Hazi BNB
·1 ຖືກໃຈ
·888 views
BitcoinTargets2026OpenAt$87570
2,400 views
75 ກຳລັງສົນທະນາ
BitcoinRejectedAt$87KThirdTime
2,403 views
62 ກຳລັງສົນທະນາ