
ProTrader365
132 ໂພສ

ProTrader365
"Over 8 years in crypto have taught us one thing: winning isn’t luck; it’s strategy. We're here to help you master yours." ProTrader | Investor | Content Creator | Analyzer
0 ກໍາລັງຕິດຕາມ
1 ຜູ້ຕິດຕາມ
6 Liked
ໂພສ
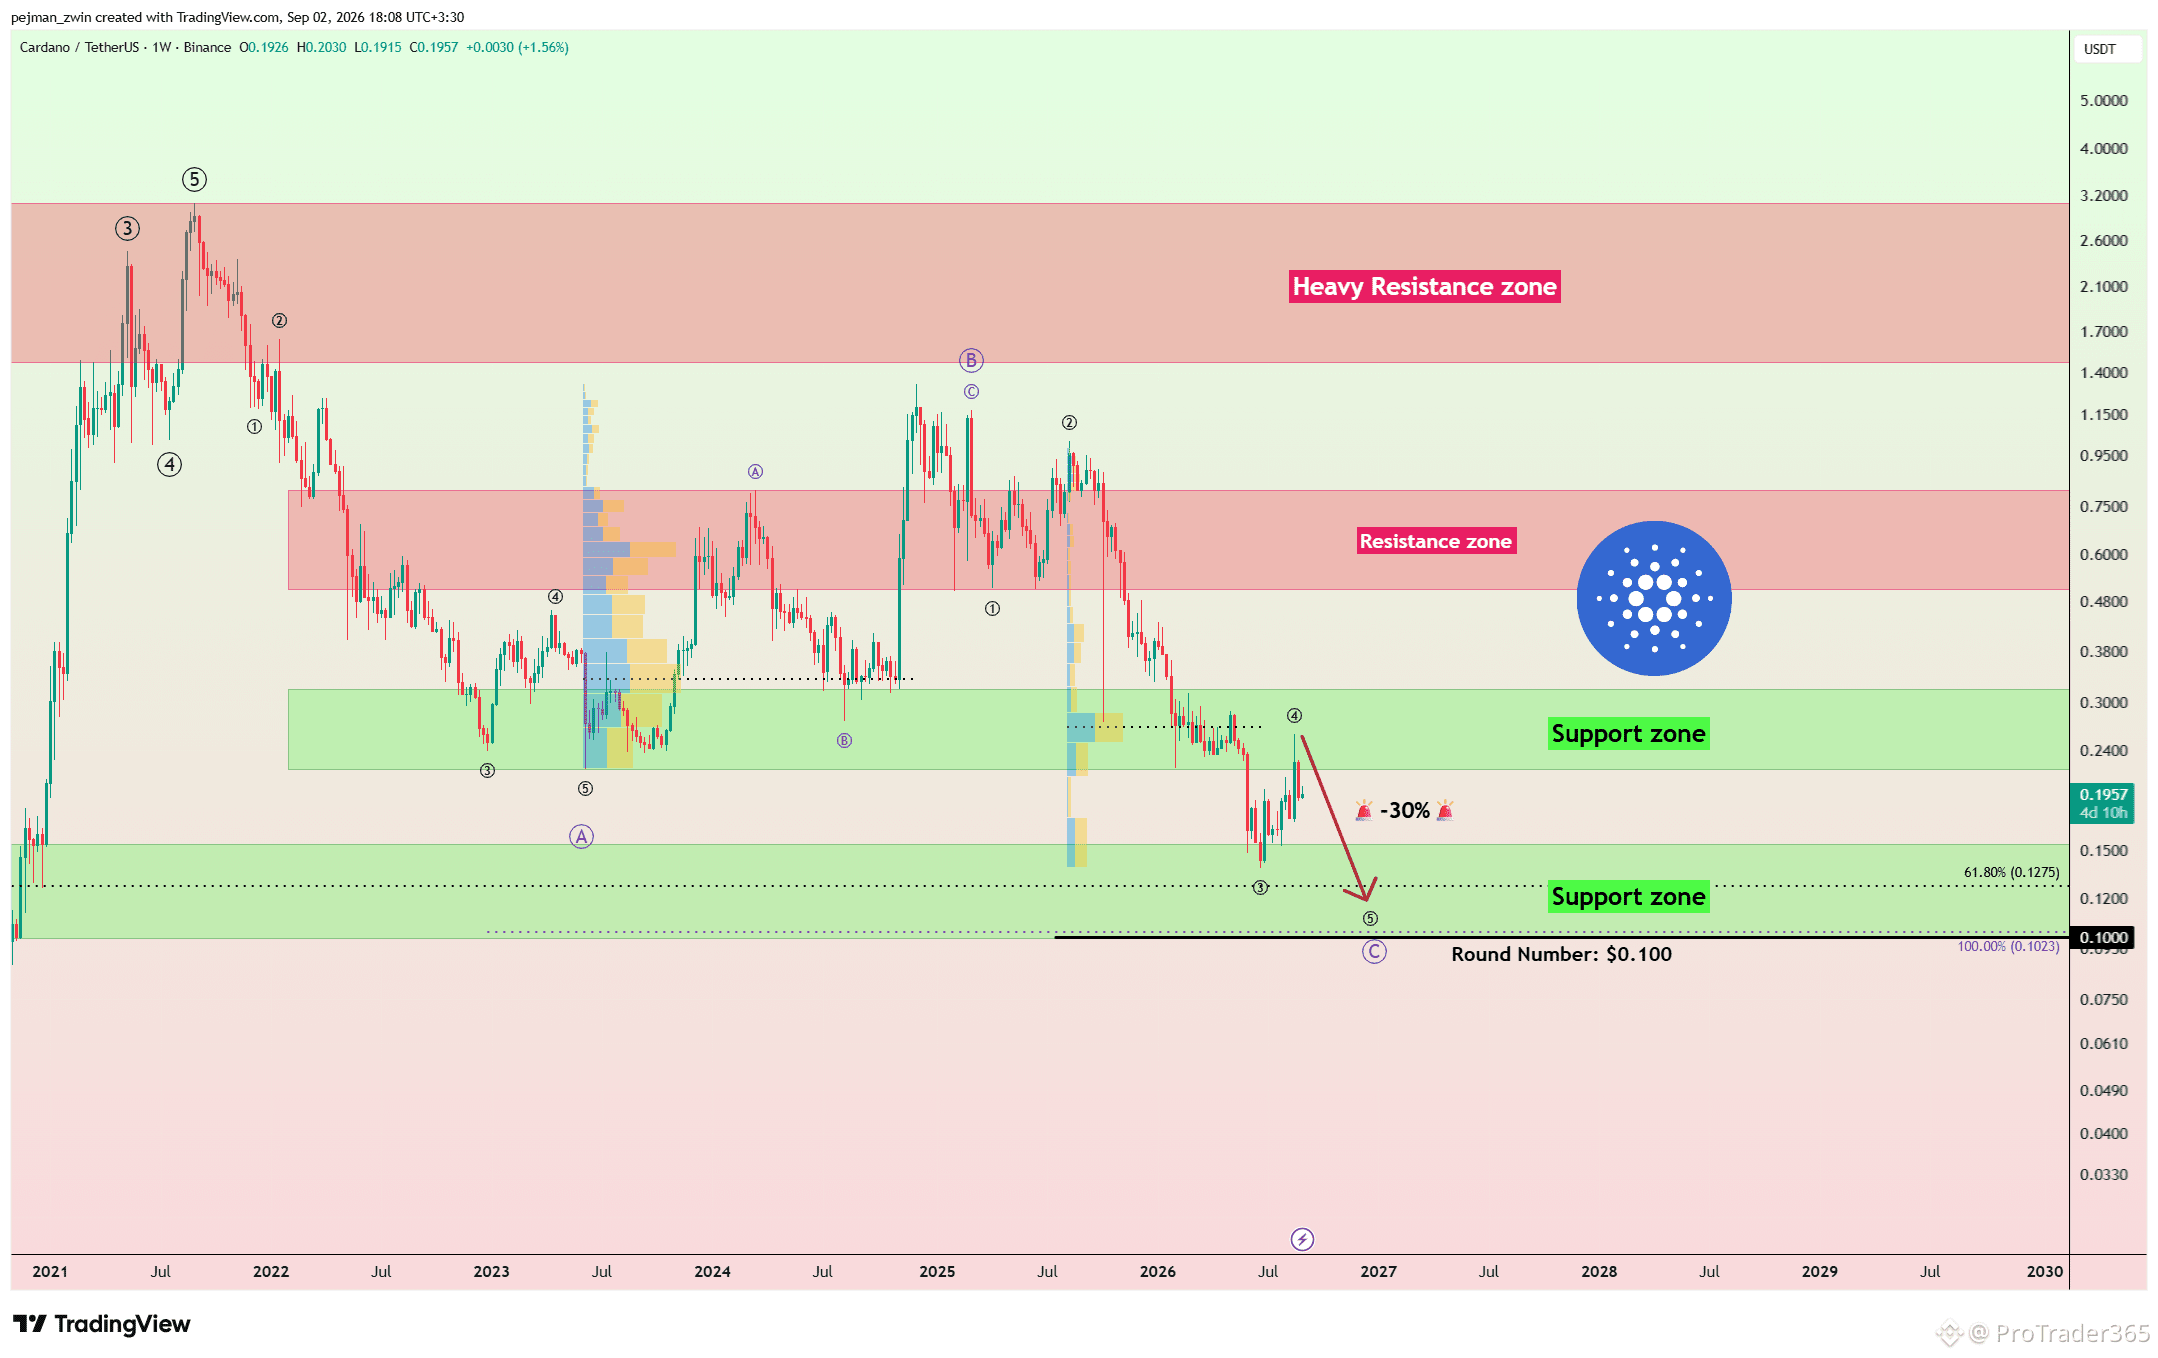
$ADA Could Face Another 30% Decline as Primary Wave 5 Develops ADA has broken below its weekly Support Zone and has so far failed to reclaim the important $0.34 trading level. The current price action suggests that ADA may now be completing a pullback toward the broken support structure. From an Elliott Wave perspective, ADA appears to have completed its Primary Wave 4 on the weekly timeframe, potentially opening the way for Primary Wave 5 to the downside. I expect ADA to potentially decline by at least 30%. If selling pressure remains strong, the broader Wave 5 structure could extend toward the major Support Zone near the psychological $0.10 round-number level, which may later become an important Potential Reversal Zone. As long as ADA remains below $0.34, the broader bearish scenario remains valid. Do you think ADA reaches the $0.10 area before the next major recovery? #Cardano
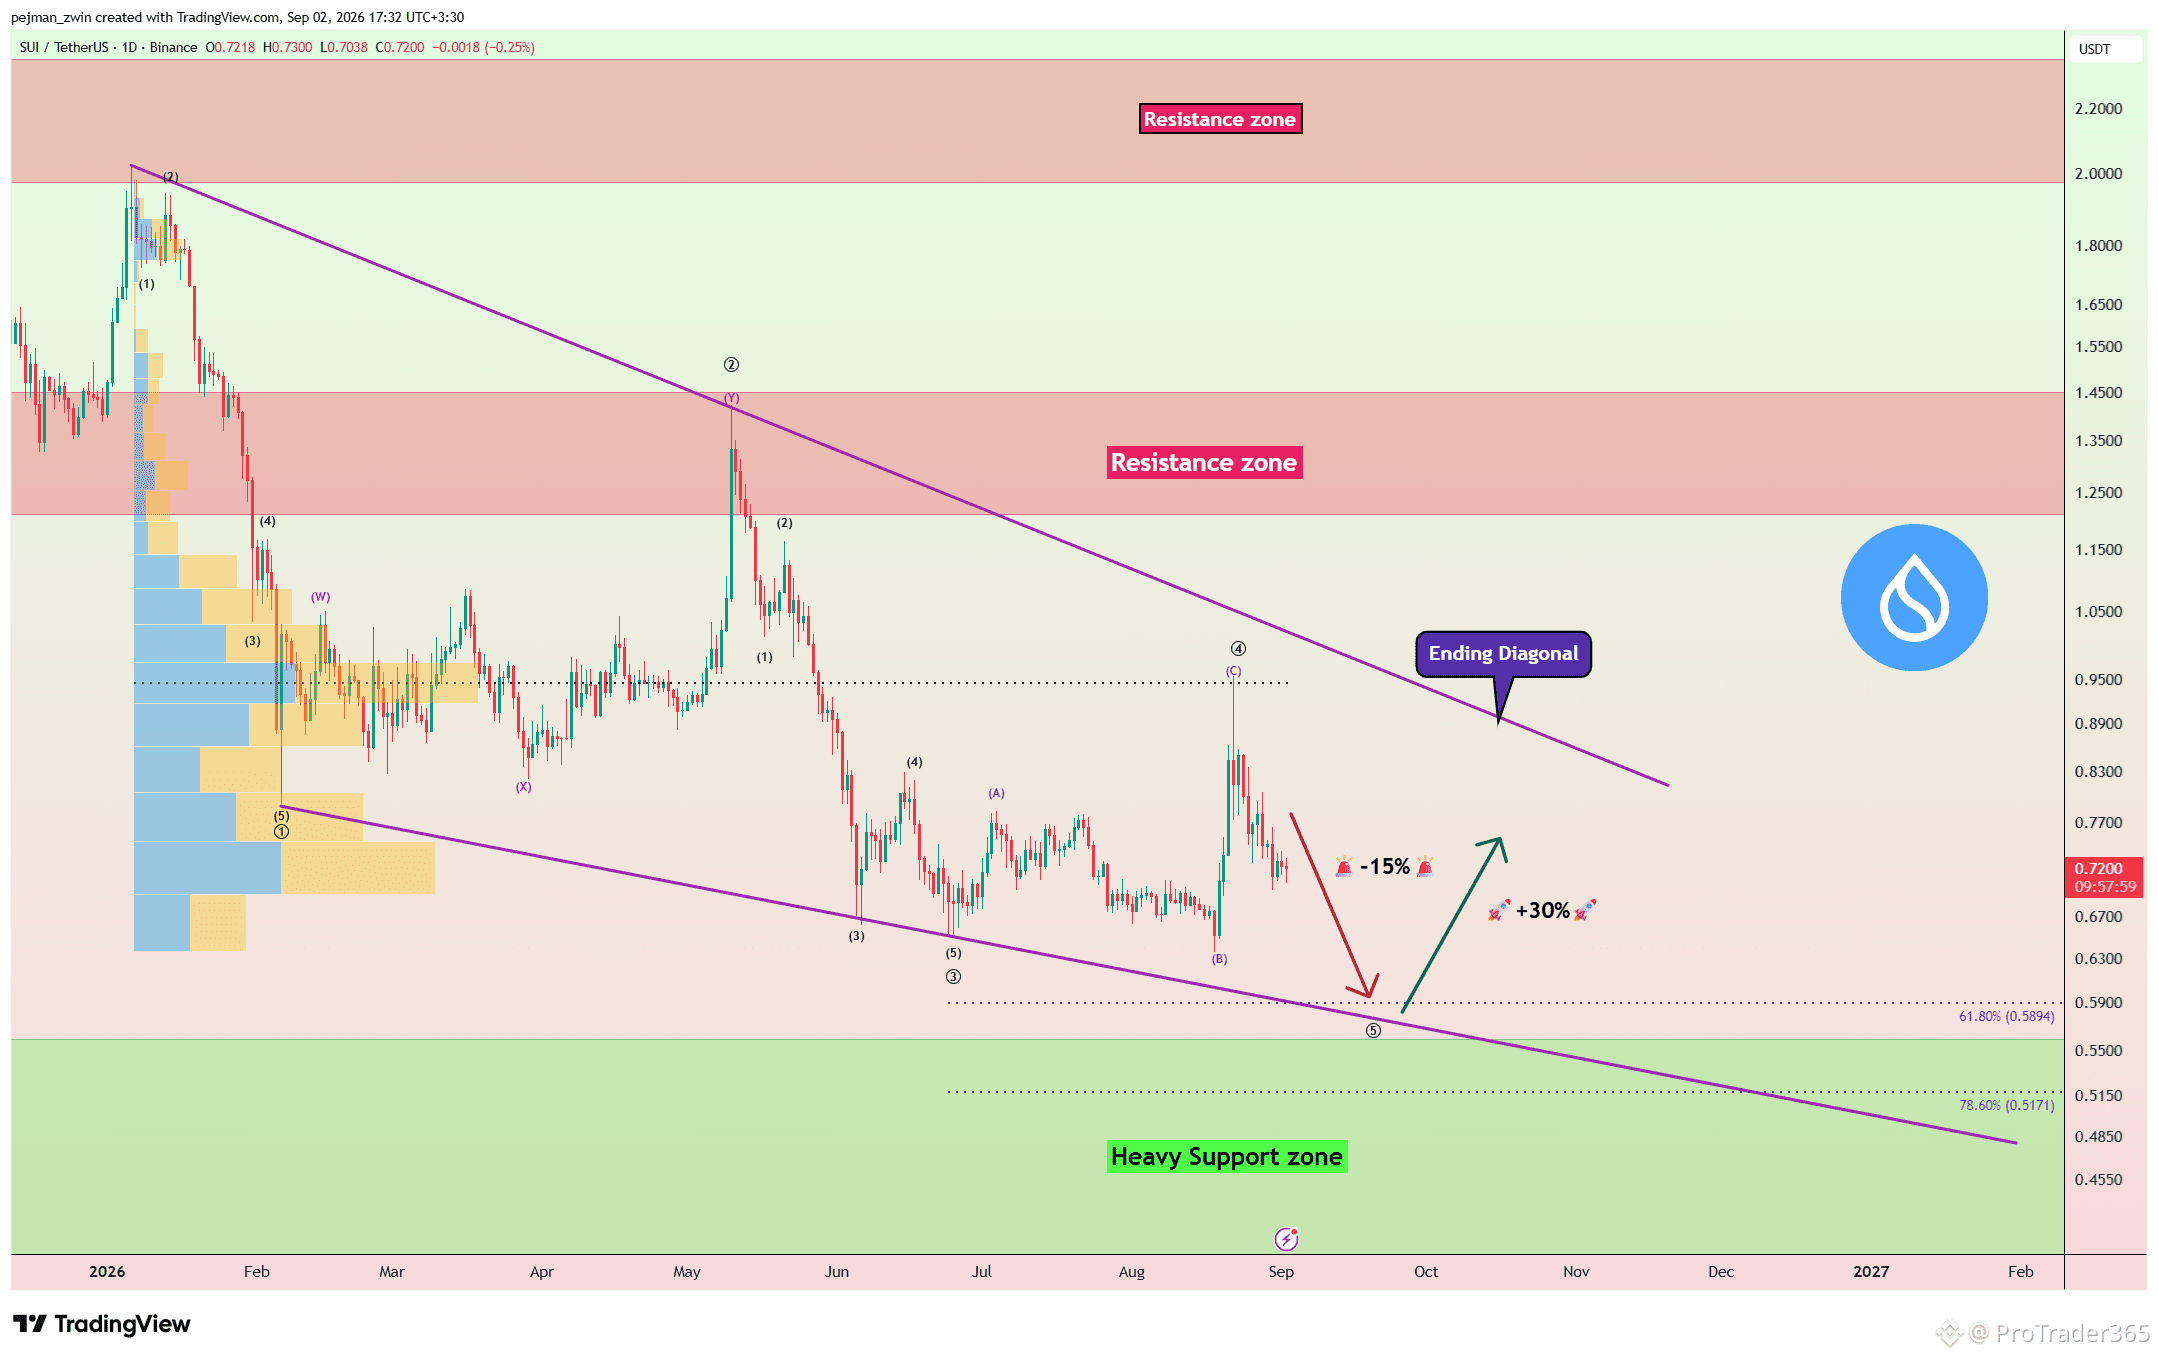
$SUI Could Drop Another 15% Before a Strong Bullish Reversal SUI failed to break above the important $0.95 trading level and has started to decline again. From an Elliott Wave perspective, SUI appears to have completed its Primary Wave 4, with the corrective structure taking the form of an Expanding Flat. The current price action also suggests that an Ending Diagonal may now be developing. I expect the decline to continue after a confirmed break below the key $0.67 trading level. In this scenario, price could fall by at least 15% toward the lower boundary of the Ending Diagonal and a strong Support Zone. If the Ending Diagonal completes there, I would then expect a strong bullish reversal with potential for at least a 30% recovery. Will SUI break below $0.67 first and complete the Ending Diagonal before the next major bullish move? #sui
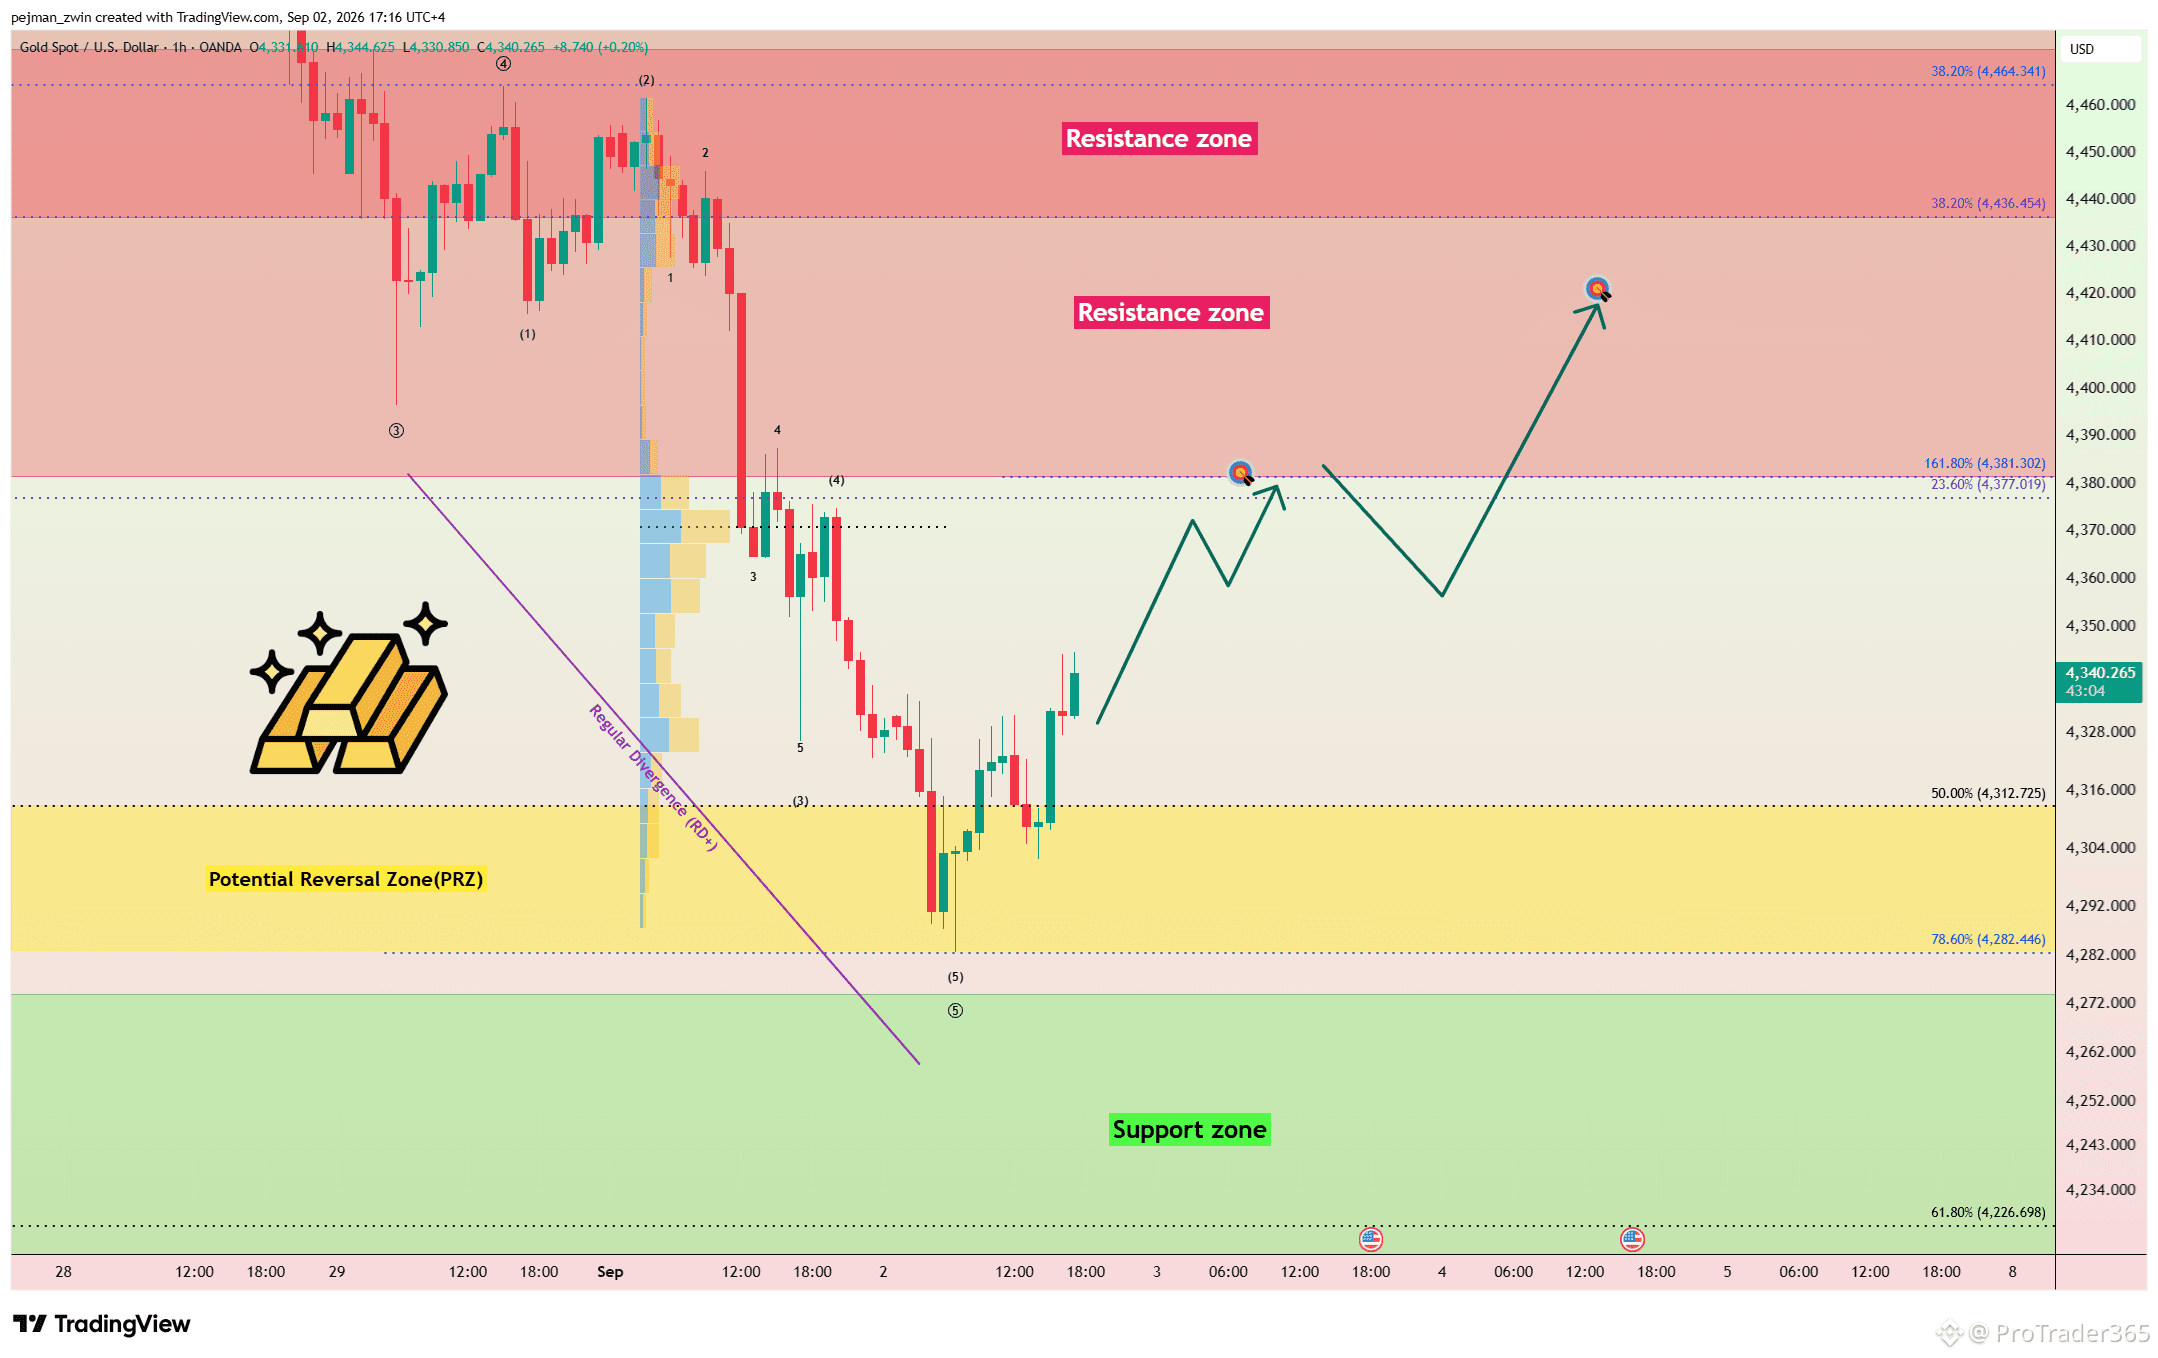
$XAUt Rebounds From the PRZ — Can Gold Reclaim $4,400? Gold continued to decline yesterday as tensions in the Middle East escalated again, although geopolitical developments appear to be having less impact on gold than in previous months. Price has now started to recover from the Potential Reversal Zone(PRZ)[$4,313-$4,283]. Technical Analysis From an Elliott Wave perspective, gold appears to have completed its Primary Wave 5 to the downside. A Positive Regular Divergence(RD+) is also visible between two Consecutive Valleys, suggesting bearish momentum may be weakening. I expect gold to continue higher toward $4,381. If bullish momentum increases, the recovery could extend toward $4,417. Stop Loss(SL): $4,277 Key Trading Levels: $4,370 _ $4,390 Can gold break above $4,390 and extend the recovery toward $4,417? #Gold
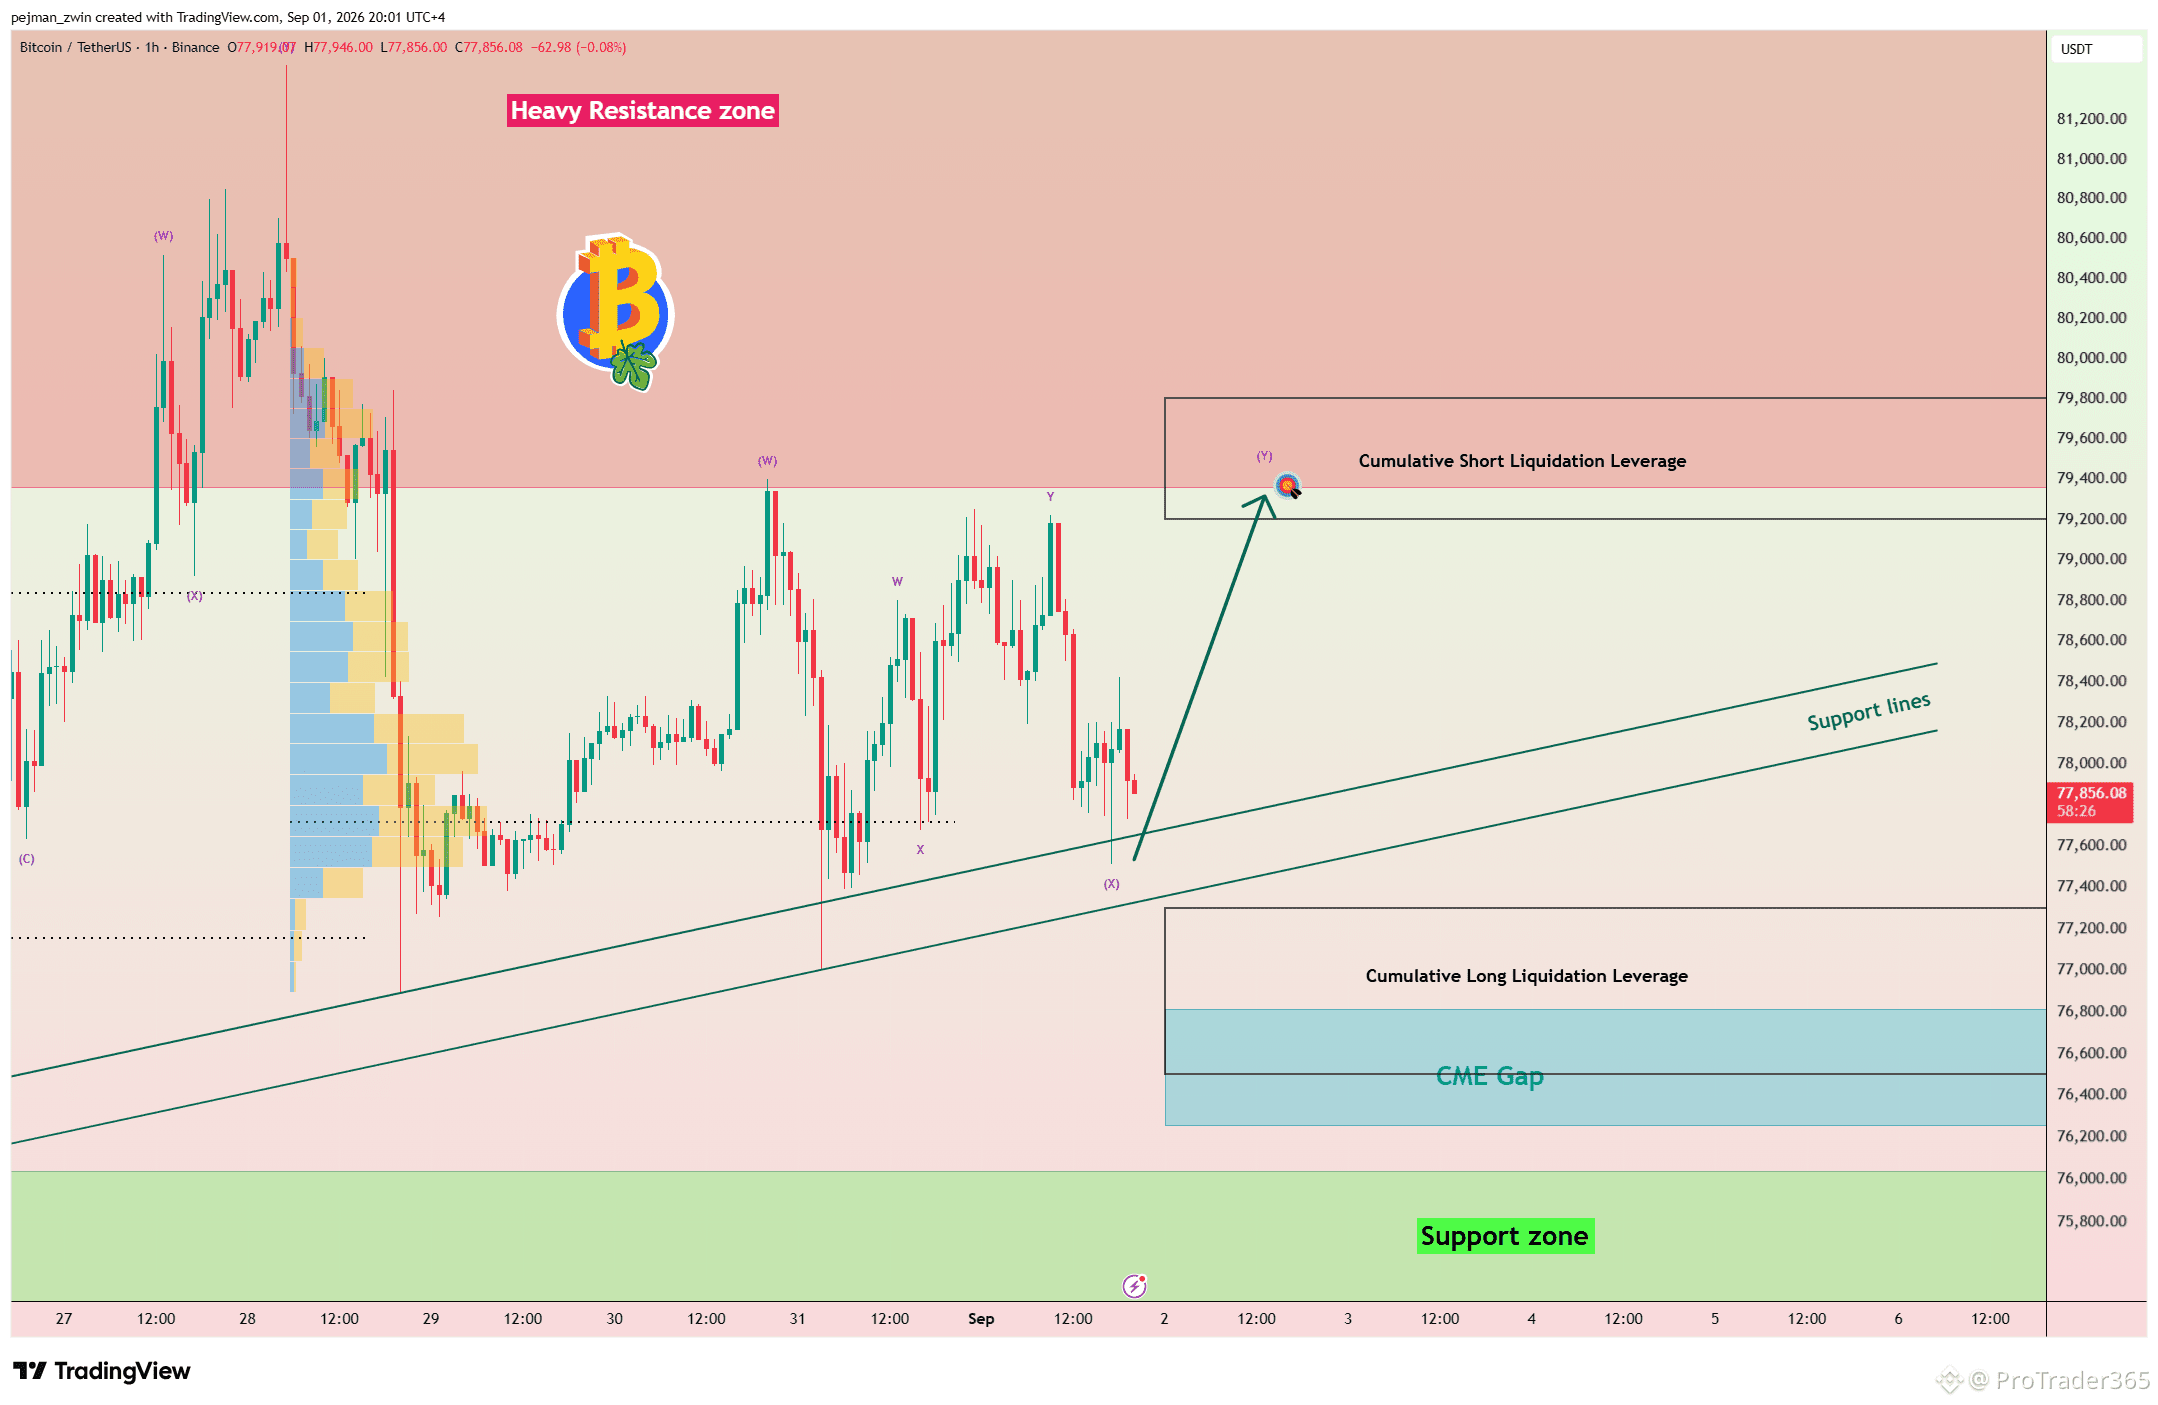
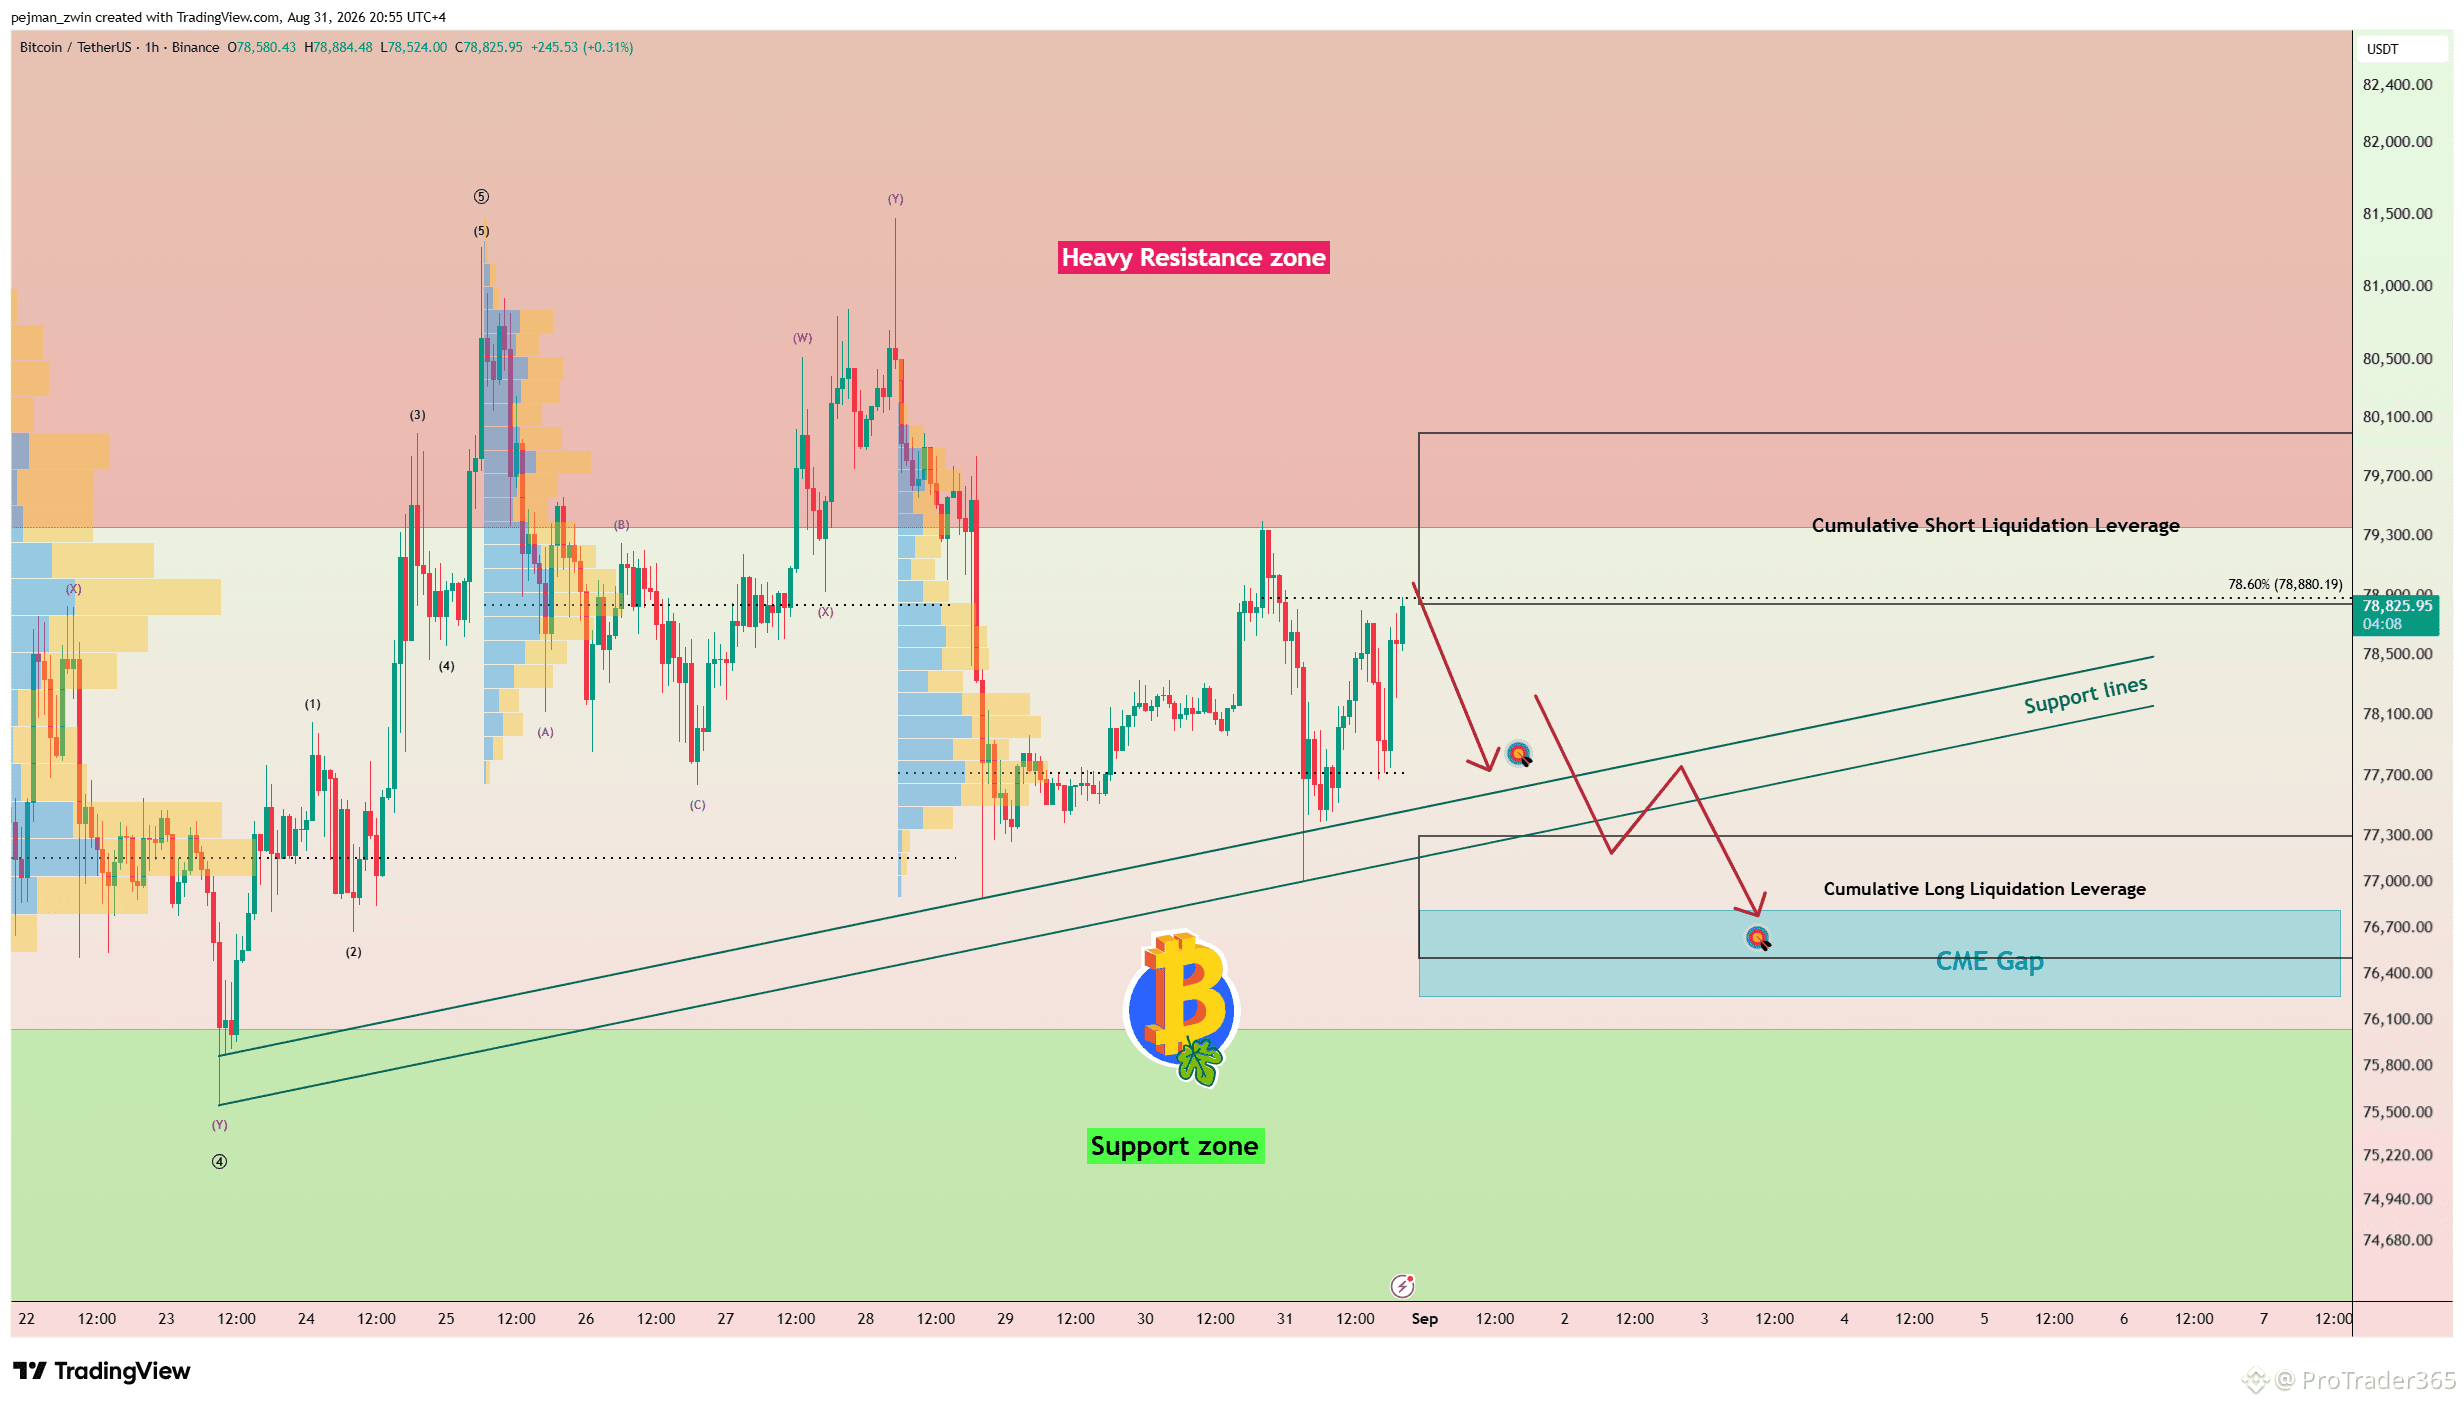
$BTC Holds Key Support — Could $80,000 Be the Next Move? Bitcoin is currently trading near the key trading levels of $77,720 and $77,000, while the Support Lines continue to hold. A confirmed breakdown below these levels will likely require stronger bearish momentum. Technical Analysis From an Elliott Wave perspective, Bitcoin appears to be developing a Complex Correction in the form of a Double Three Correction(W-X-Y). The current Wave X and its internal sub-waves appear to have been completed, potentially opening the way for another short-term bullish move. I expect Bitcoin to rise toward the Cumulative Short Liquidation Leverage($79,800-$79,200). Stronger bullish momentum could bring the $80,000 area back into focus. Stop Loss(SL): $76,970 CME Gap: $76,810-$76,255 Can Bitcoin defend $77,000 and reach the liquidation zone before another correction?
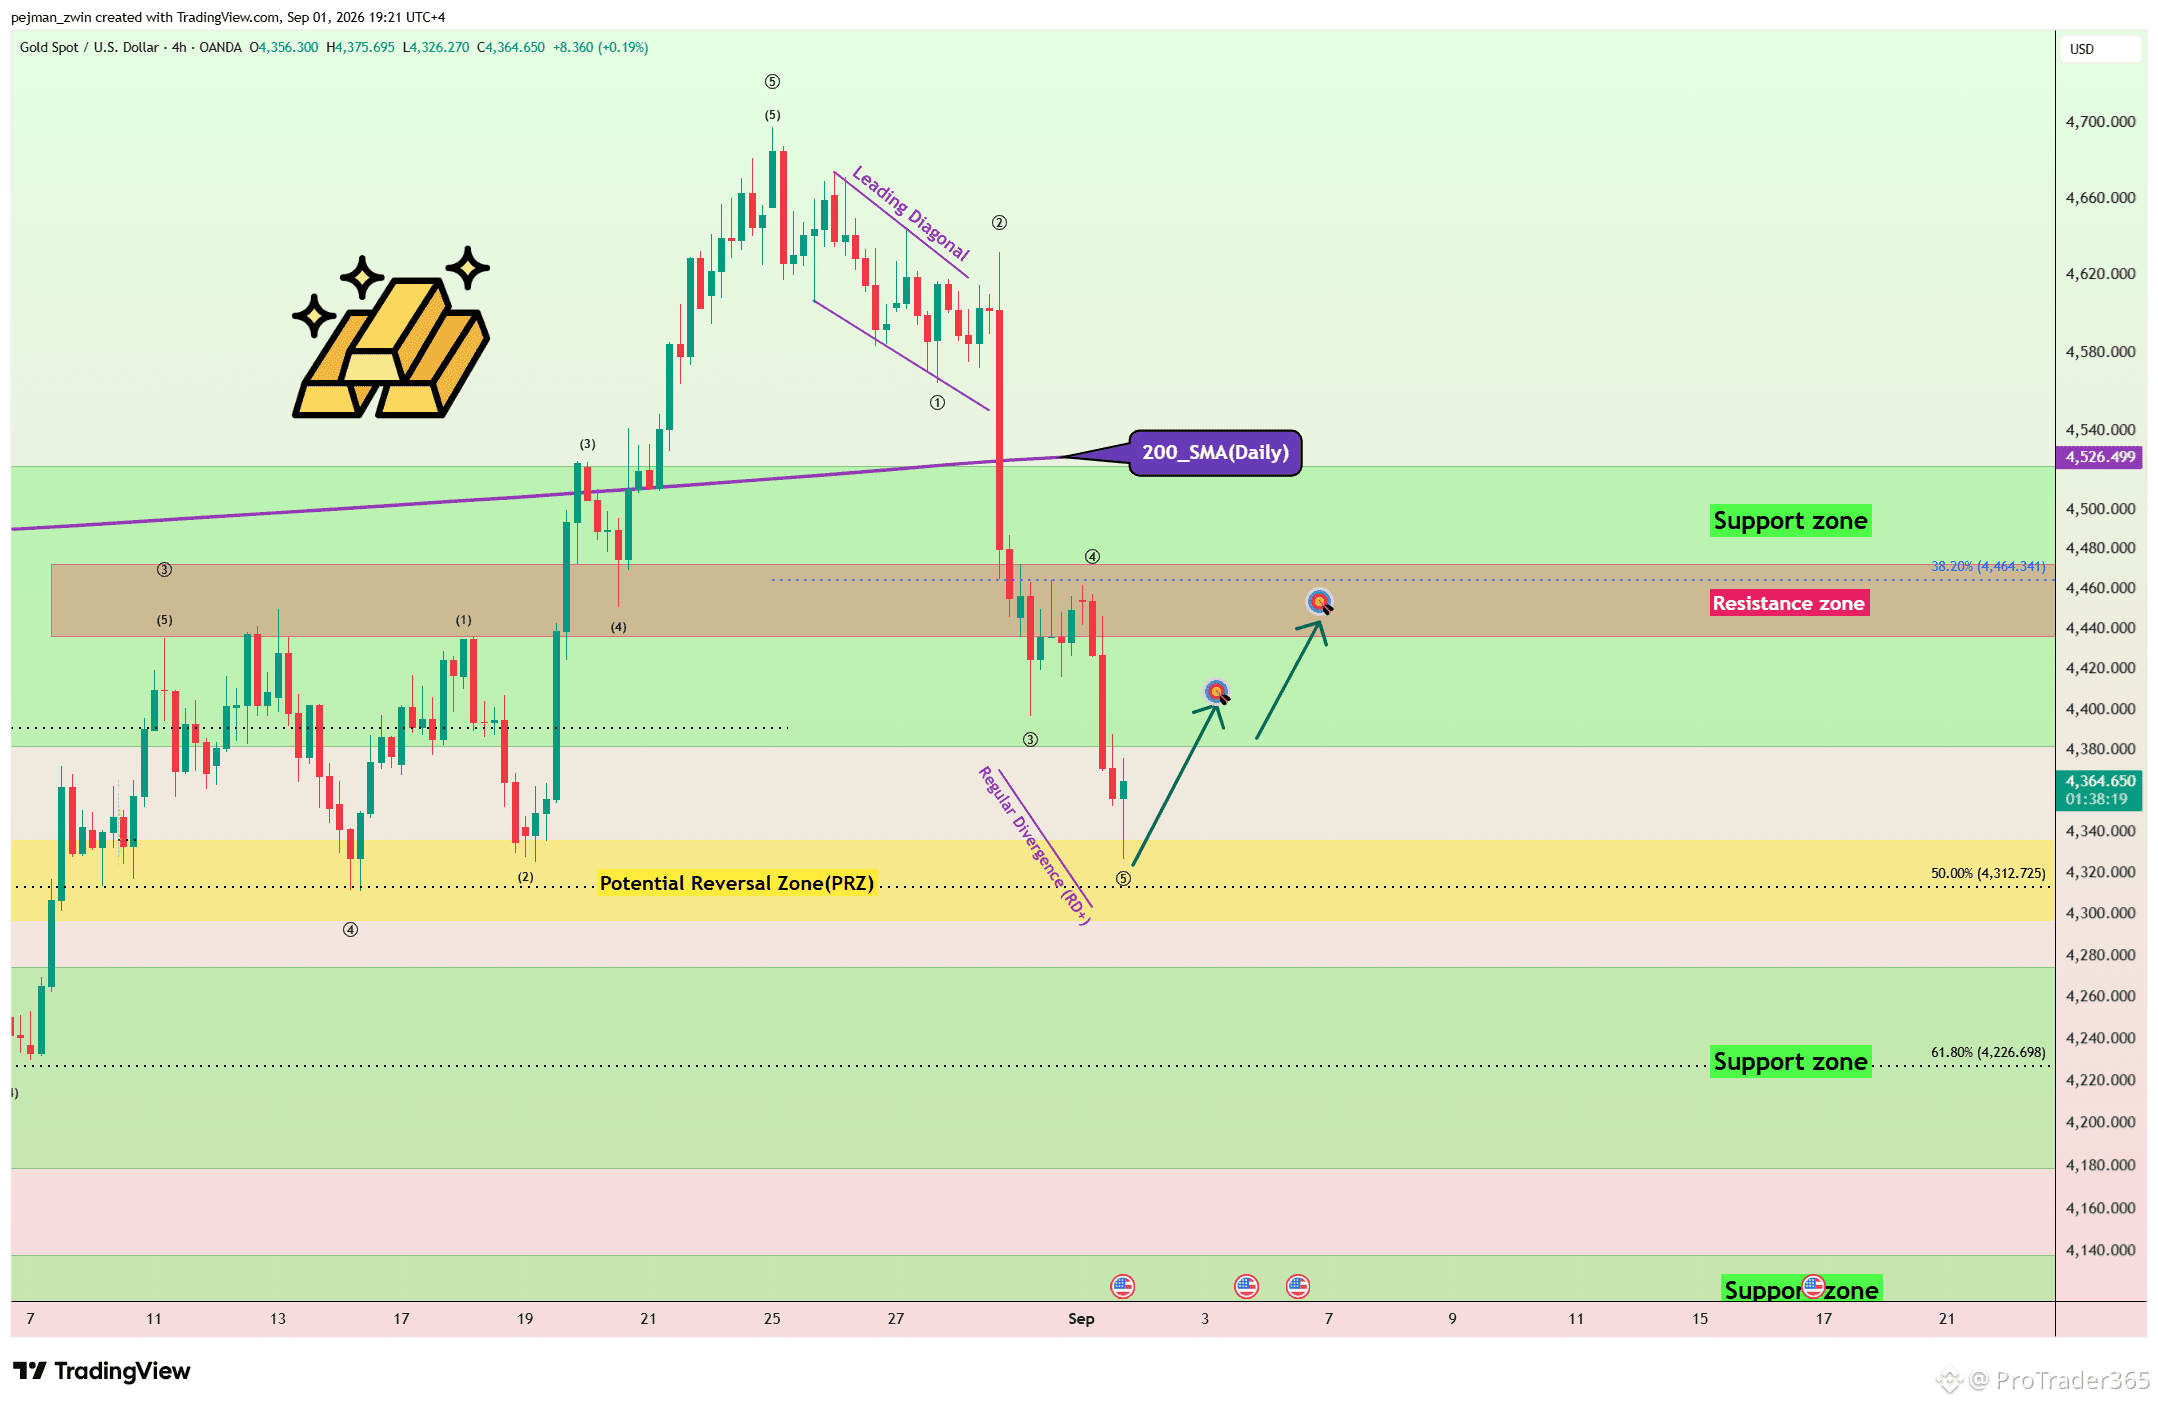
$XAUt Rebounds From the PRZ — Can Gold Reclaim $4,390? Gold reacted well to the Potential Reversal Zone(PRZ)[$4,336-$4,296] and has started to move higher. However, price remains below the 200_SMA(Daily), keeping the risk of a deeper correction alive. Technical Analysis From an Elliott Wave perspective, gold appears to be completing its fifth bearish wave, suggesting that the current downward sequence could be nearing completion. A Positive Regular Divergence(RD+) is also visible between two Consecutive Valleys, indicating that bearish momentum may be weakening. I expect gold to continue higher from the PRZ. A break above the key trading level of $4,390 could open the way toward $4,411 and then $4,441 near the Resistance Zone. Stop Loss(SL): $4,285 Can gold reclaim $4,390 and extend the recovery, or is this bounce only temporary? #Gold
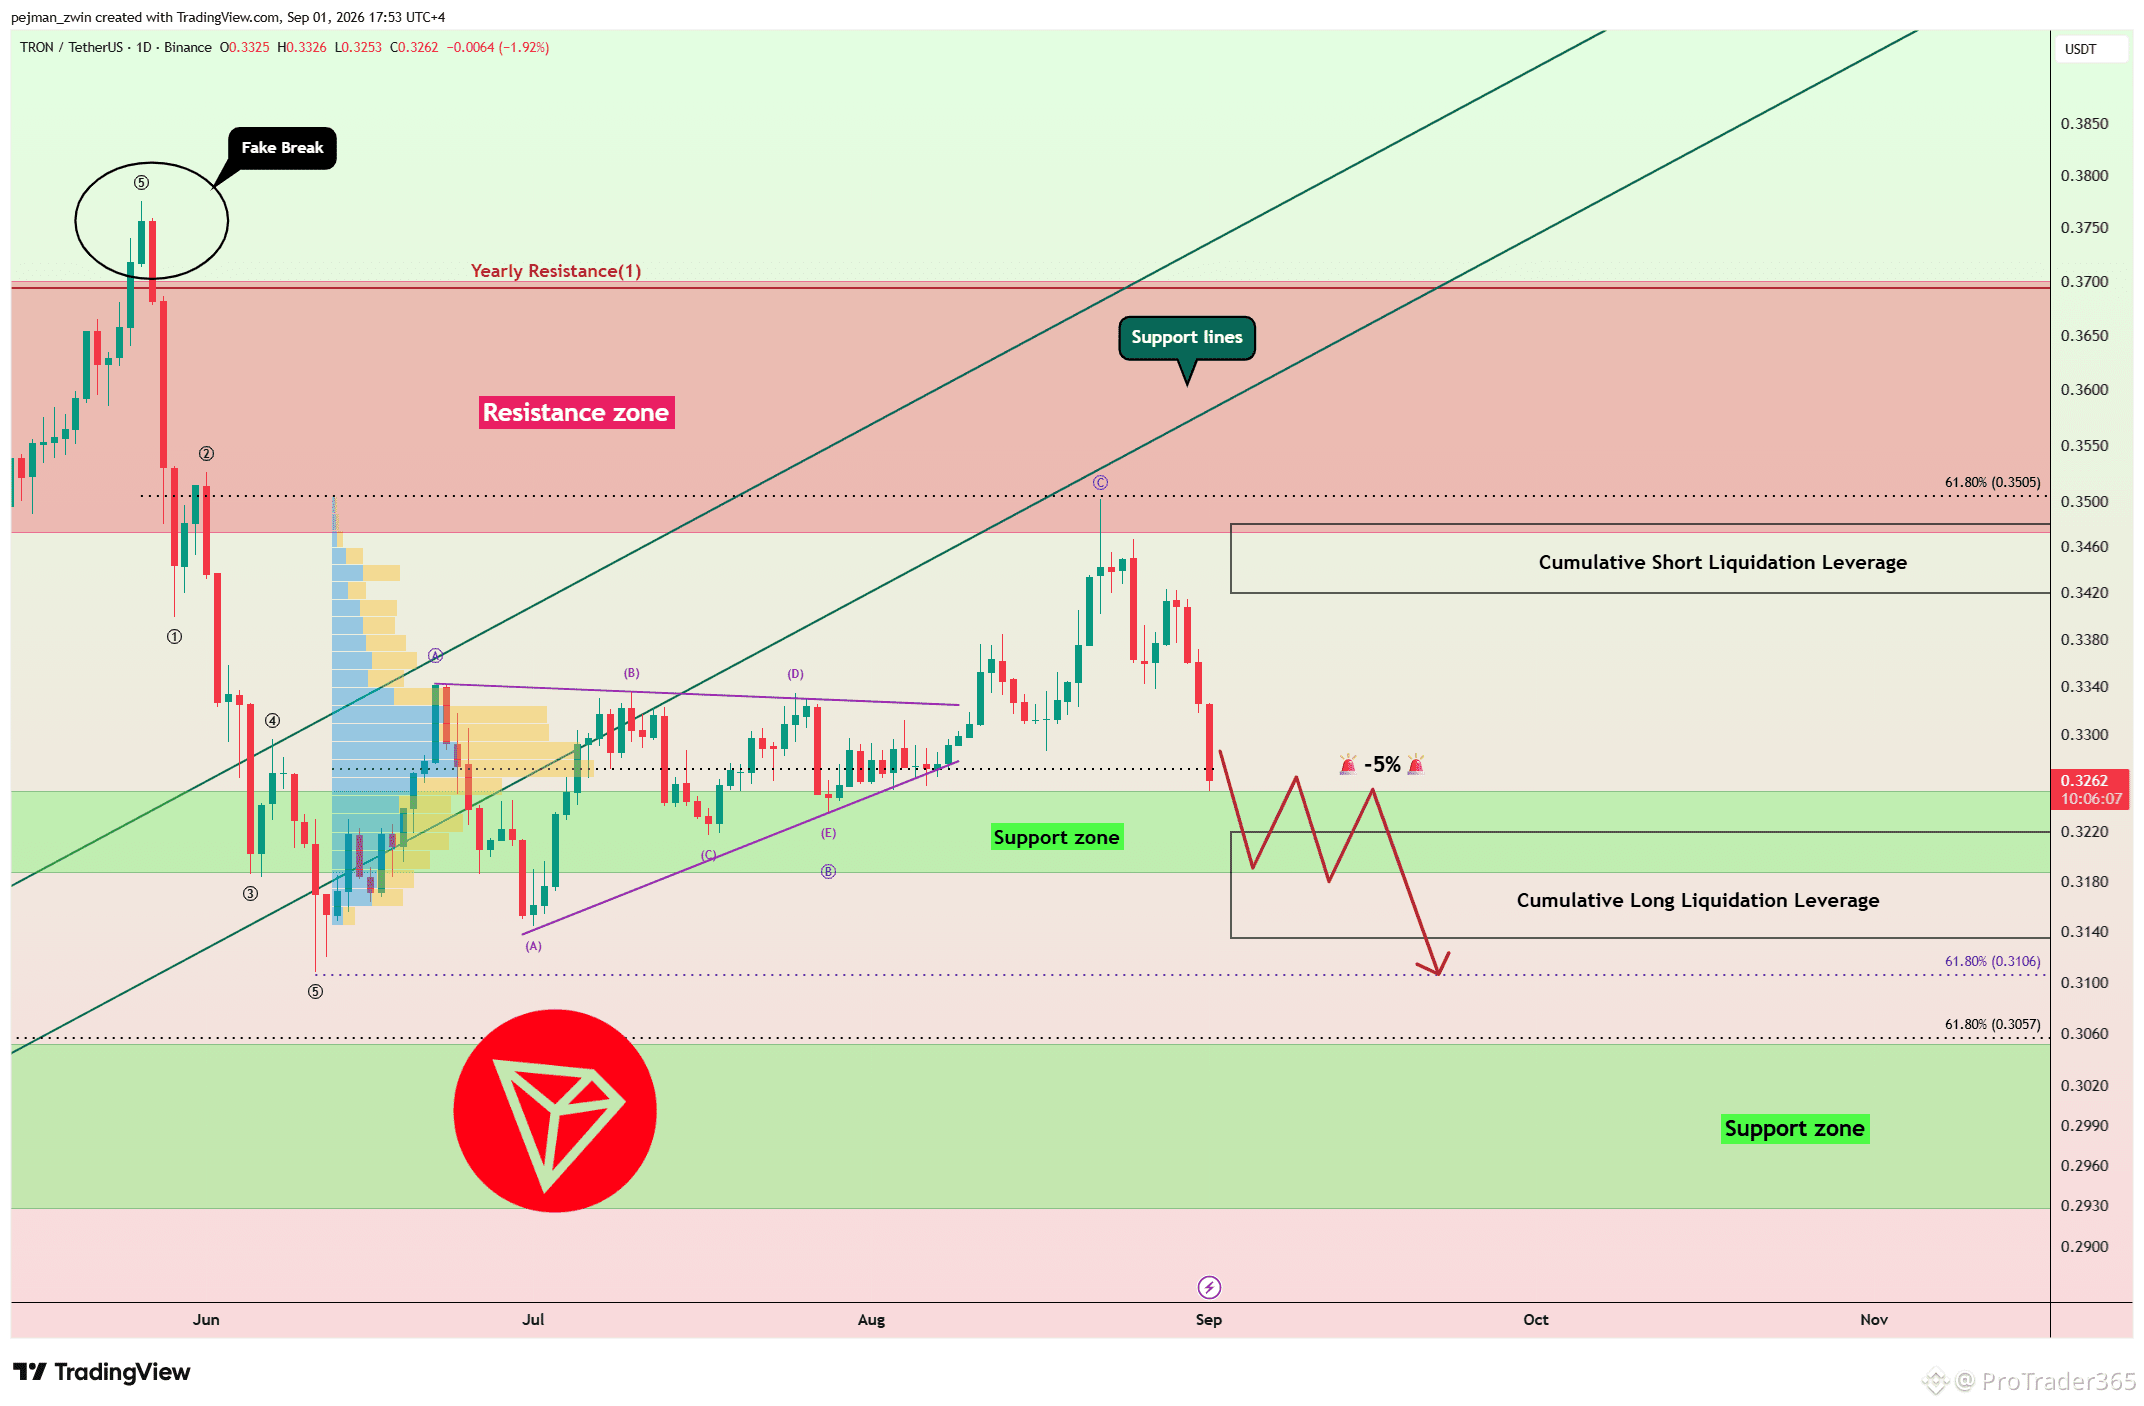
$TRX Could Extend Its Decline After Losing Key Support Lines TRX failed to break above the Resistance Zone and subsequently lost its key Support Lines. Over the past few days, price has also completed its pullback toward the broken structure, keeping the broader setup bearish. From an Elliott Wave perspective, the current structure suggests that additional bearish waves could still develop. I expect TRX to potentially decline by at least 5% after a confirmed breakdown of the Support Zone. However, the Cumulative Long Liquidation Leverage($0.313-$0.322) could create temporary upside volatility or a short-term reaction as price approaches this area. Despite possible rebounds, I expect the bearish trend to continue unless the broken support structure is successfully reclaimed. Will TRX break the Support Zone first, or rebound from the liquidation area?
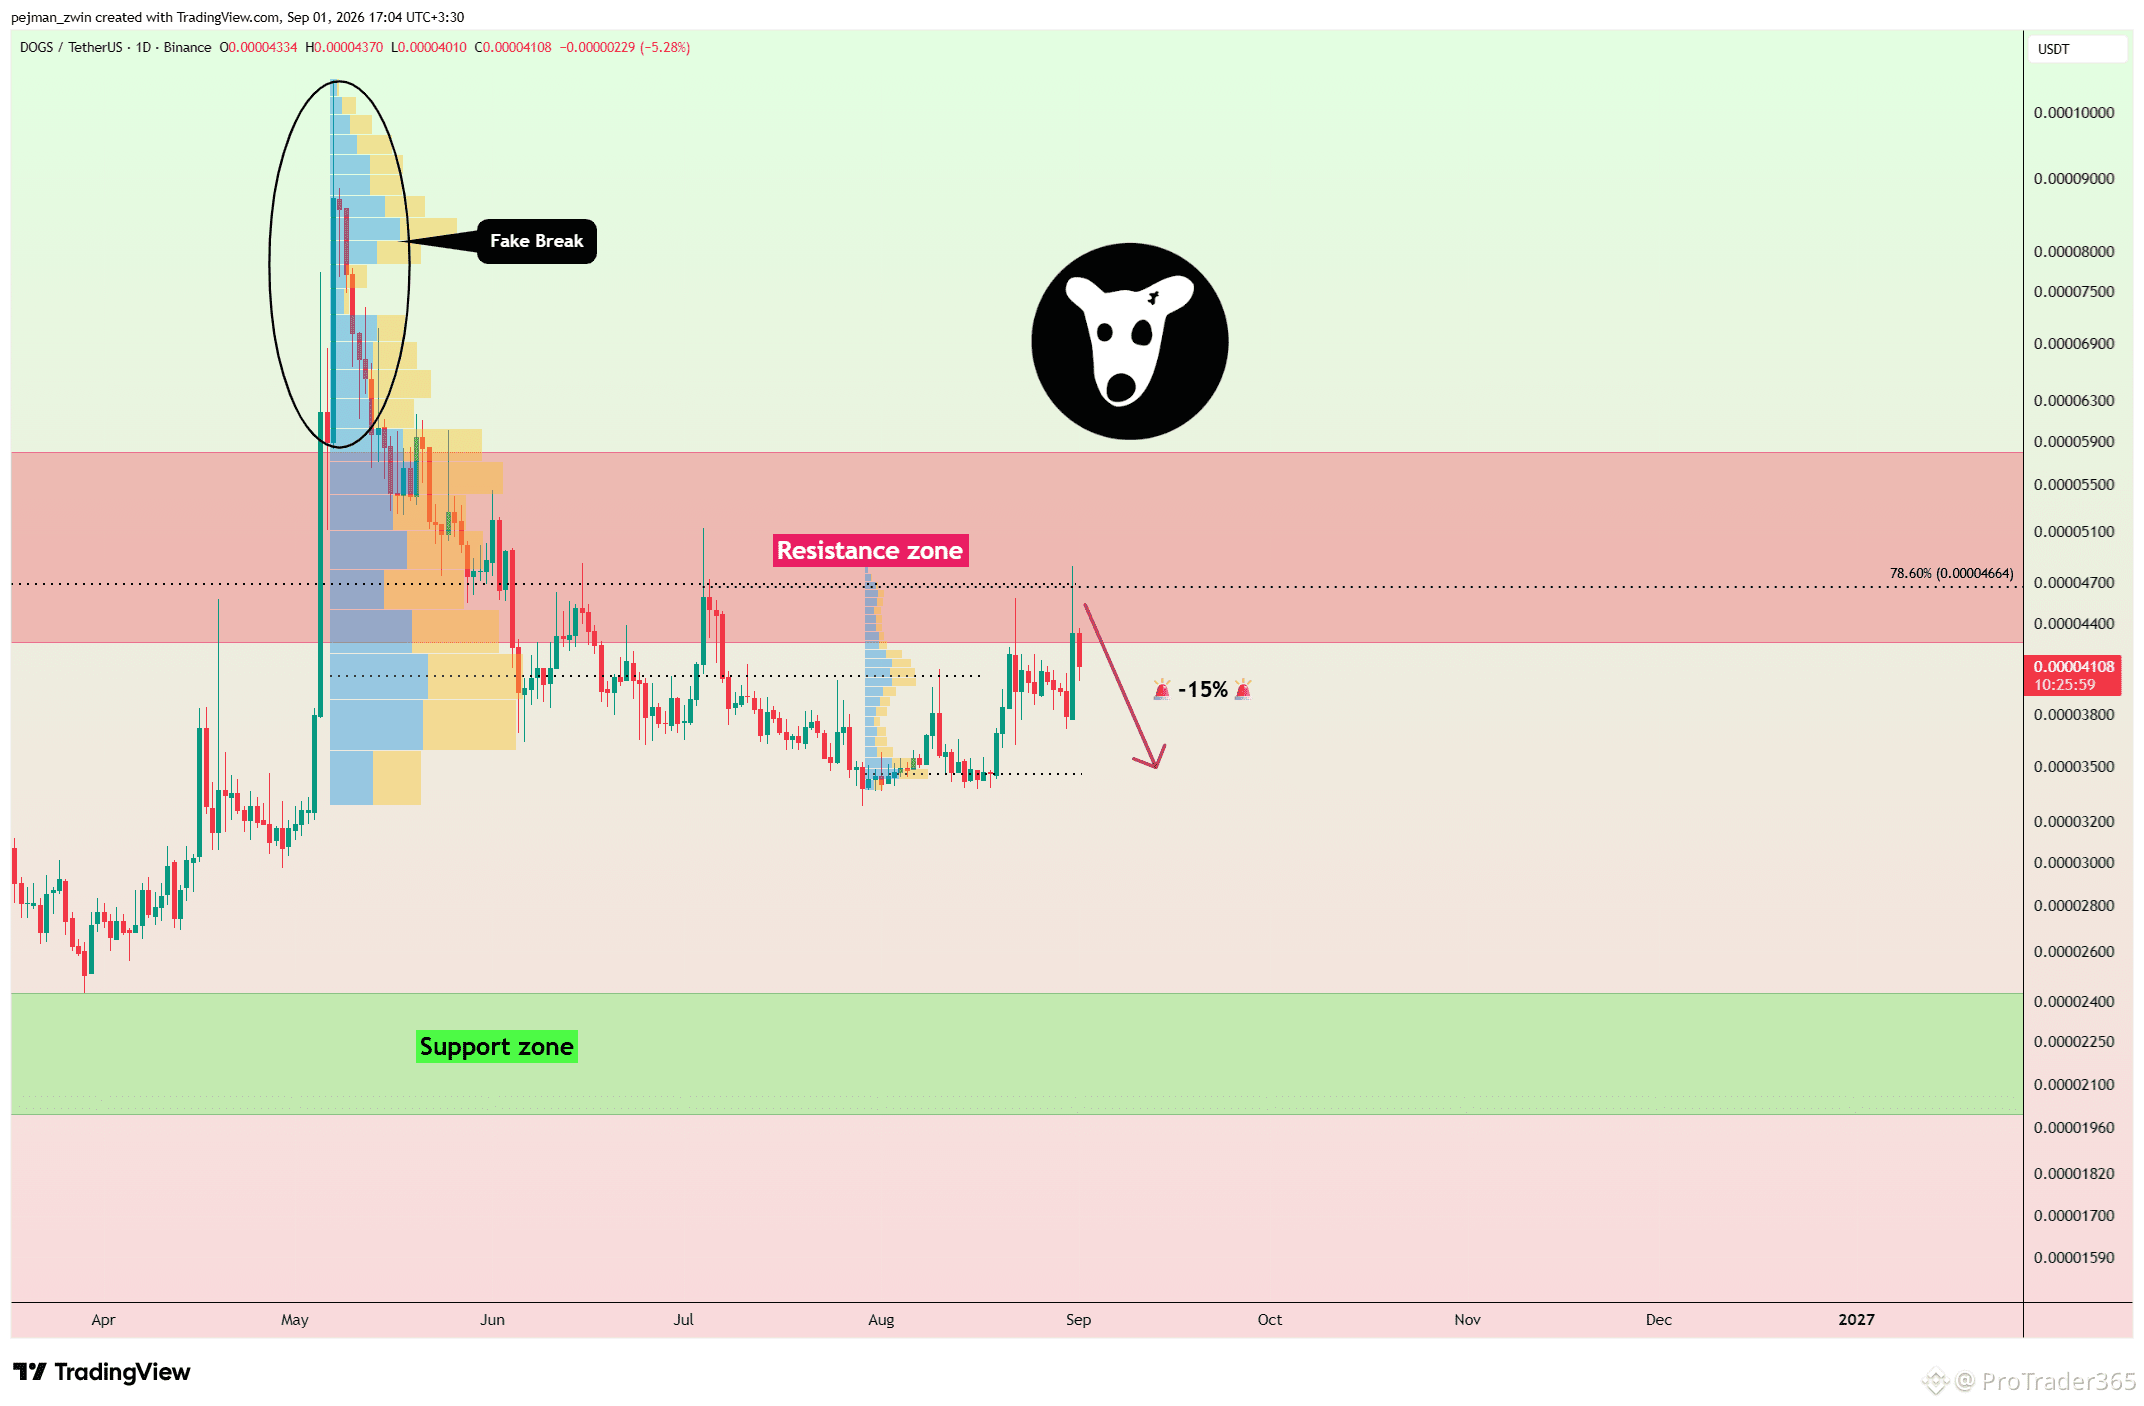
$DOGS Fake Breakout Could Trigger Another 15% Correction DOGS failed to break above the Resistance Zone and instead formed a Fake Breakout, pushing price back below the resistance area and the key $0.000047 trading level. More importantly, the previous daily candle also failed to close back above $0.000047, suggesting that sellers are still controlling the current price structure. As long as DOGS remains below the Resistance Zone and the $0.000047 level, I expect the corrective move to continue. From the current structure, DOGS could potentially decline by at least 15% toward the important $0.000035 trading level. A successful reclaim of $0.000047 would be the first sign that the bearish scenario is weakening. Do you think DOGS reaches $0.000035 first, or reclaims $0.000047? #DOGS #Meme Alpha#
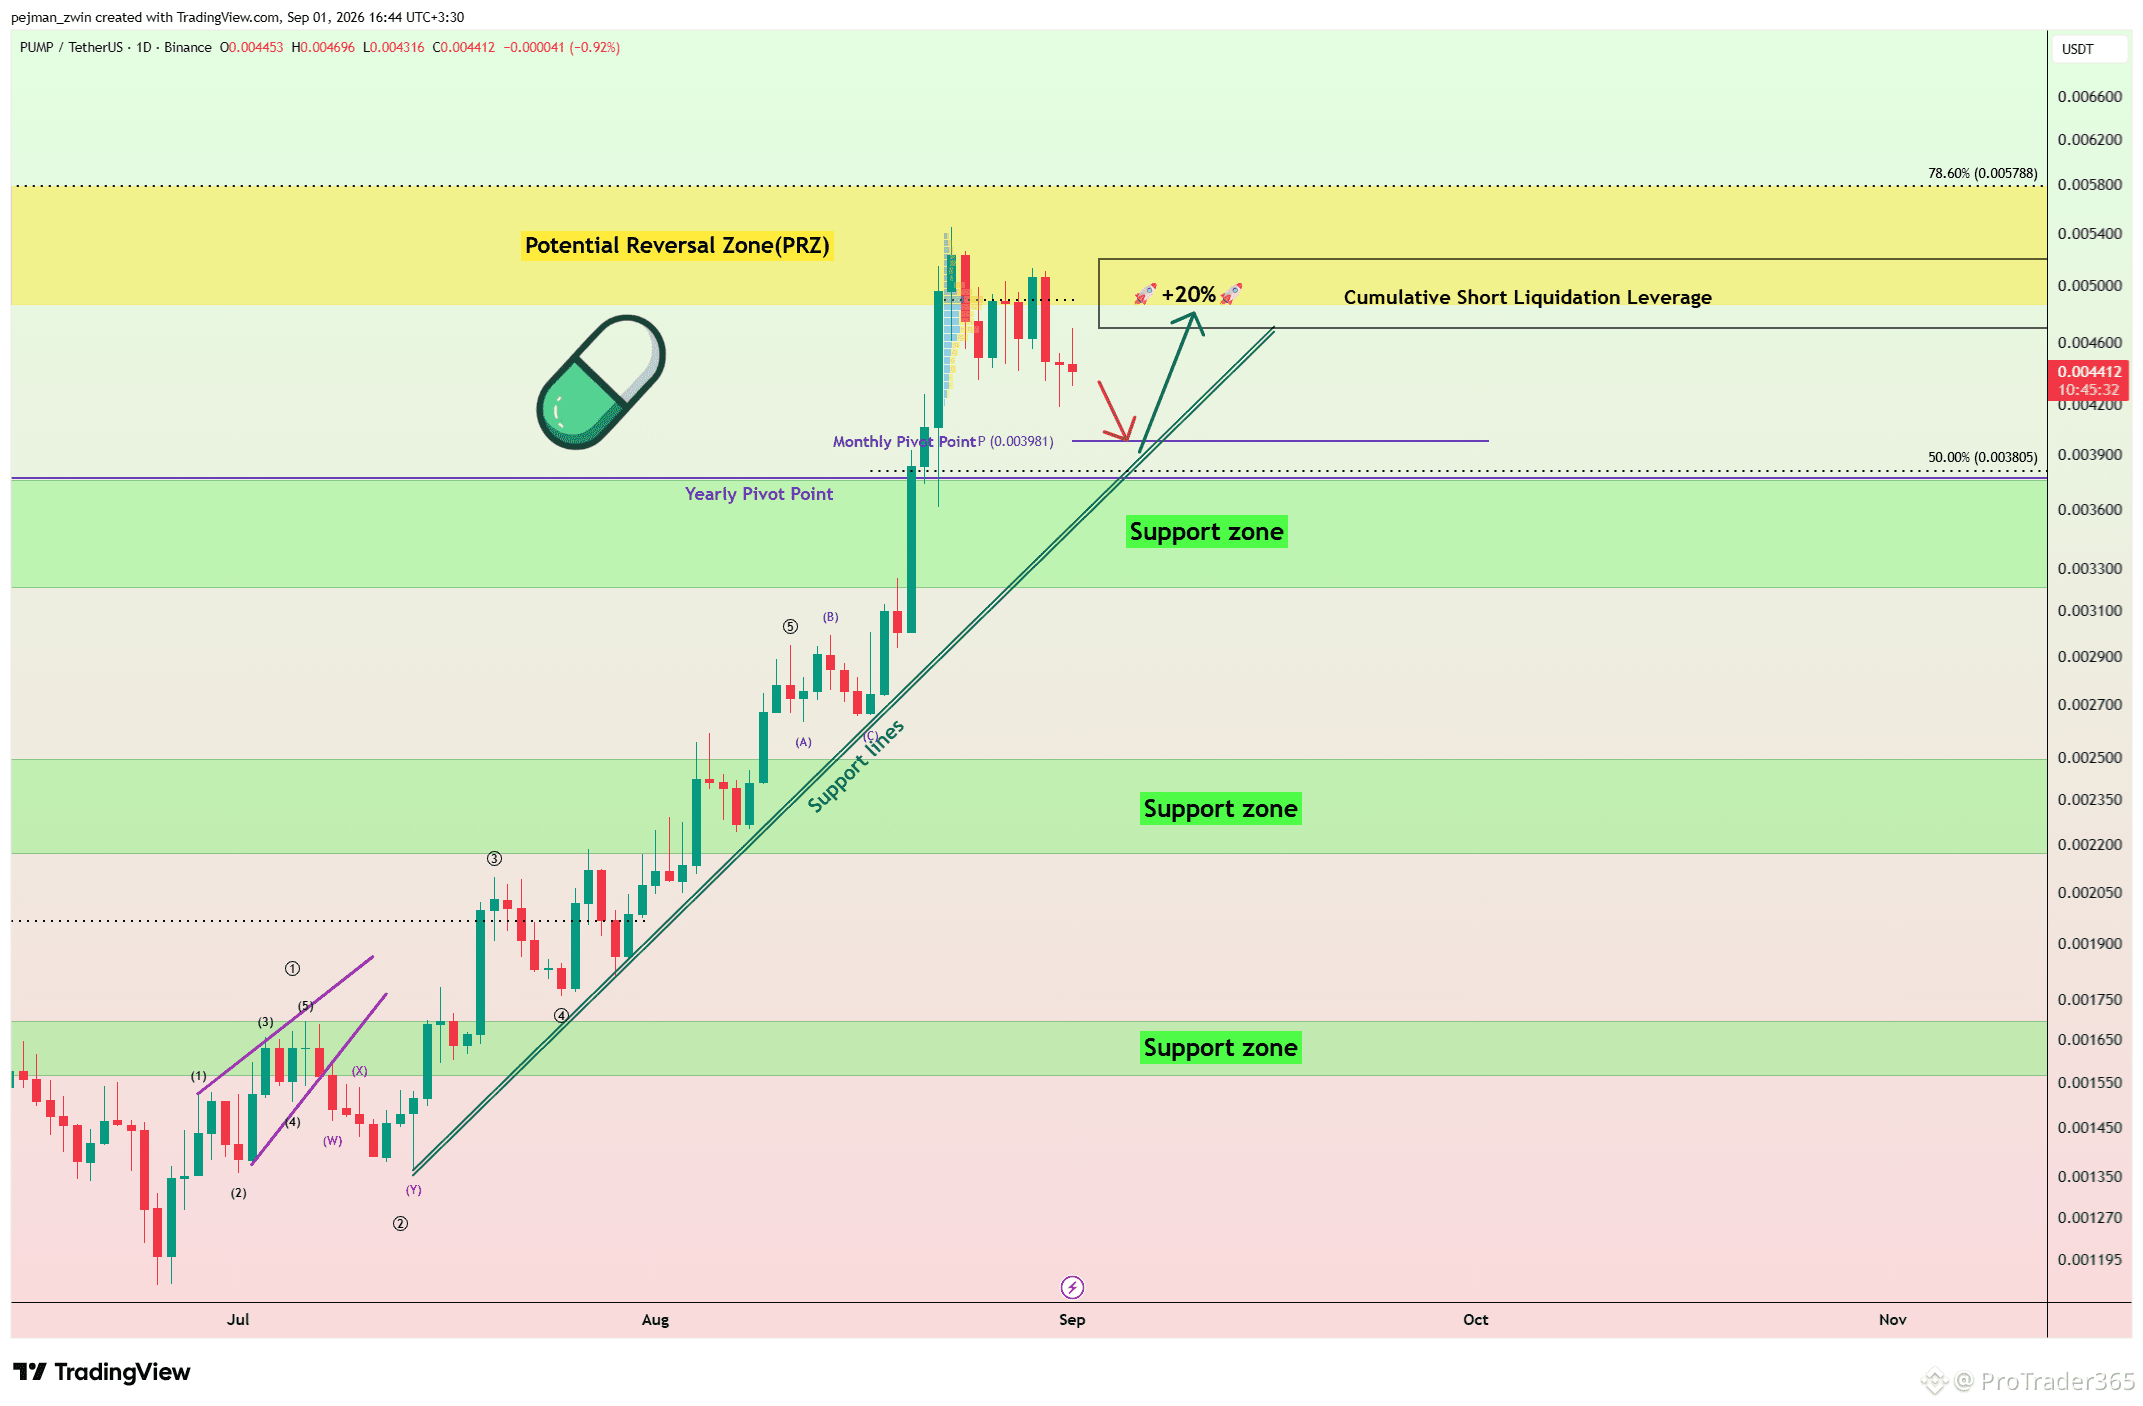
$PUMP Could Be Setting Up for a 20% Recovery Move PUMP experienced a strong pump before entering a corrective phase, and over the past 10 days the token has been moving in a short-term downtrend as part of this correction. Despite the pullback, the broader bullish momentum remains important. I expect the next bullish move to potentially begin from around the Support Lines, Monthly Pivot Point, and Yearly Pivot Point. If buyers react strongly from these areas, PUMP could recover by at least 20% and move toward the important trading levels at $0.0049 and $0.0051, as well as the Cumulative Short Liquidation Leverage($0.0047-$0.0052). As long as these key support areas remain intact, the current correction could become the foundation for the next bullish move. Do you think PUMP will start its next bullish move from these support areas? #pumpfun
$BTC Faces a Deeper Correction Risk Below $80,000 Bitcoin failed to break above the key $80,000 trading level and started to decline as Warsh’s hawkish inflation comments strengthened the U.S. dollar and pushed the U.S. 10-year Treasury yield higher. Technical Analysis Bitcoin is currently trading near the Cumulative Short Liquidation Leverage($80,000-$78,840) and the key $78,800 trading level. I expect Bitcoin to start declining from this area toward $77,720. If bearish momentum increases, price could break below the Support Lines and the crucial $77,000 trading level, opening the way toward the Cumulative Long Liquidation Leverage($77,300-$76,500) and potentially filling the lower CME Gap($76,810-$76,255). First Take Profit(TP): $77,720 Stop Loss(SL): $80,080 Which level will Bitcoin reach first: $76,500 or $80,080? #BTC Price Analysis# #What is your Bitcoin Price Prediction?#
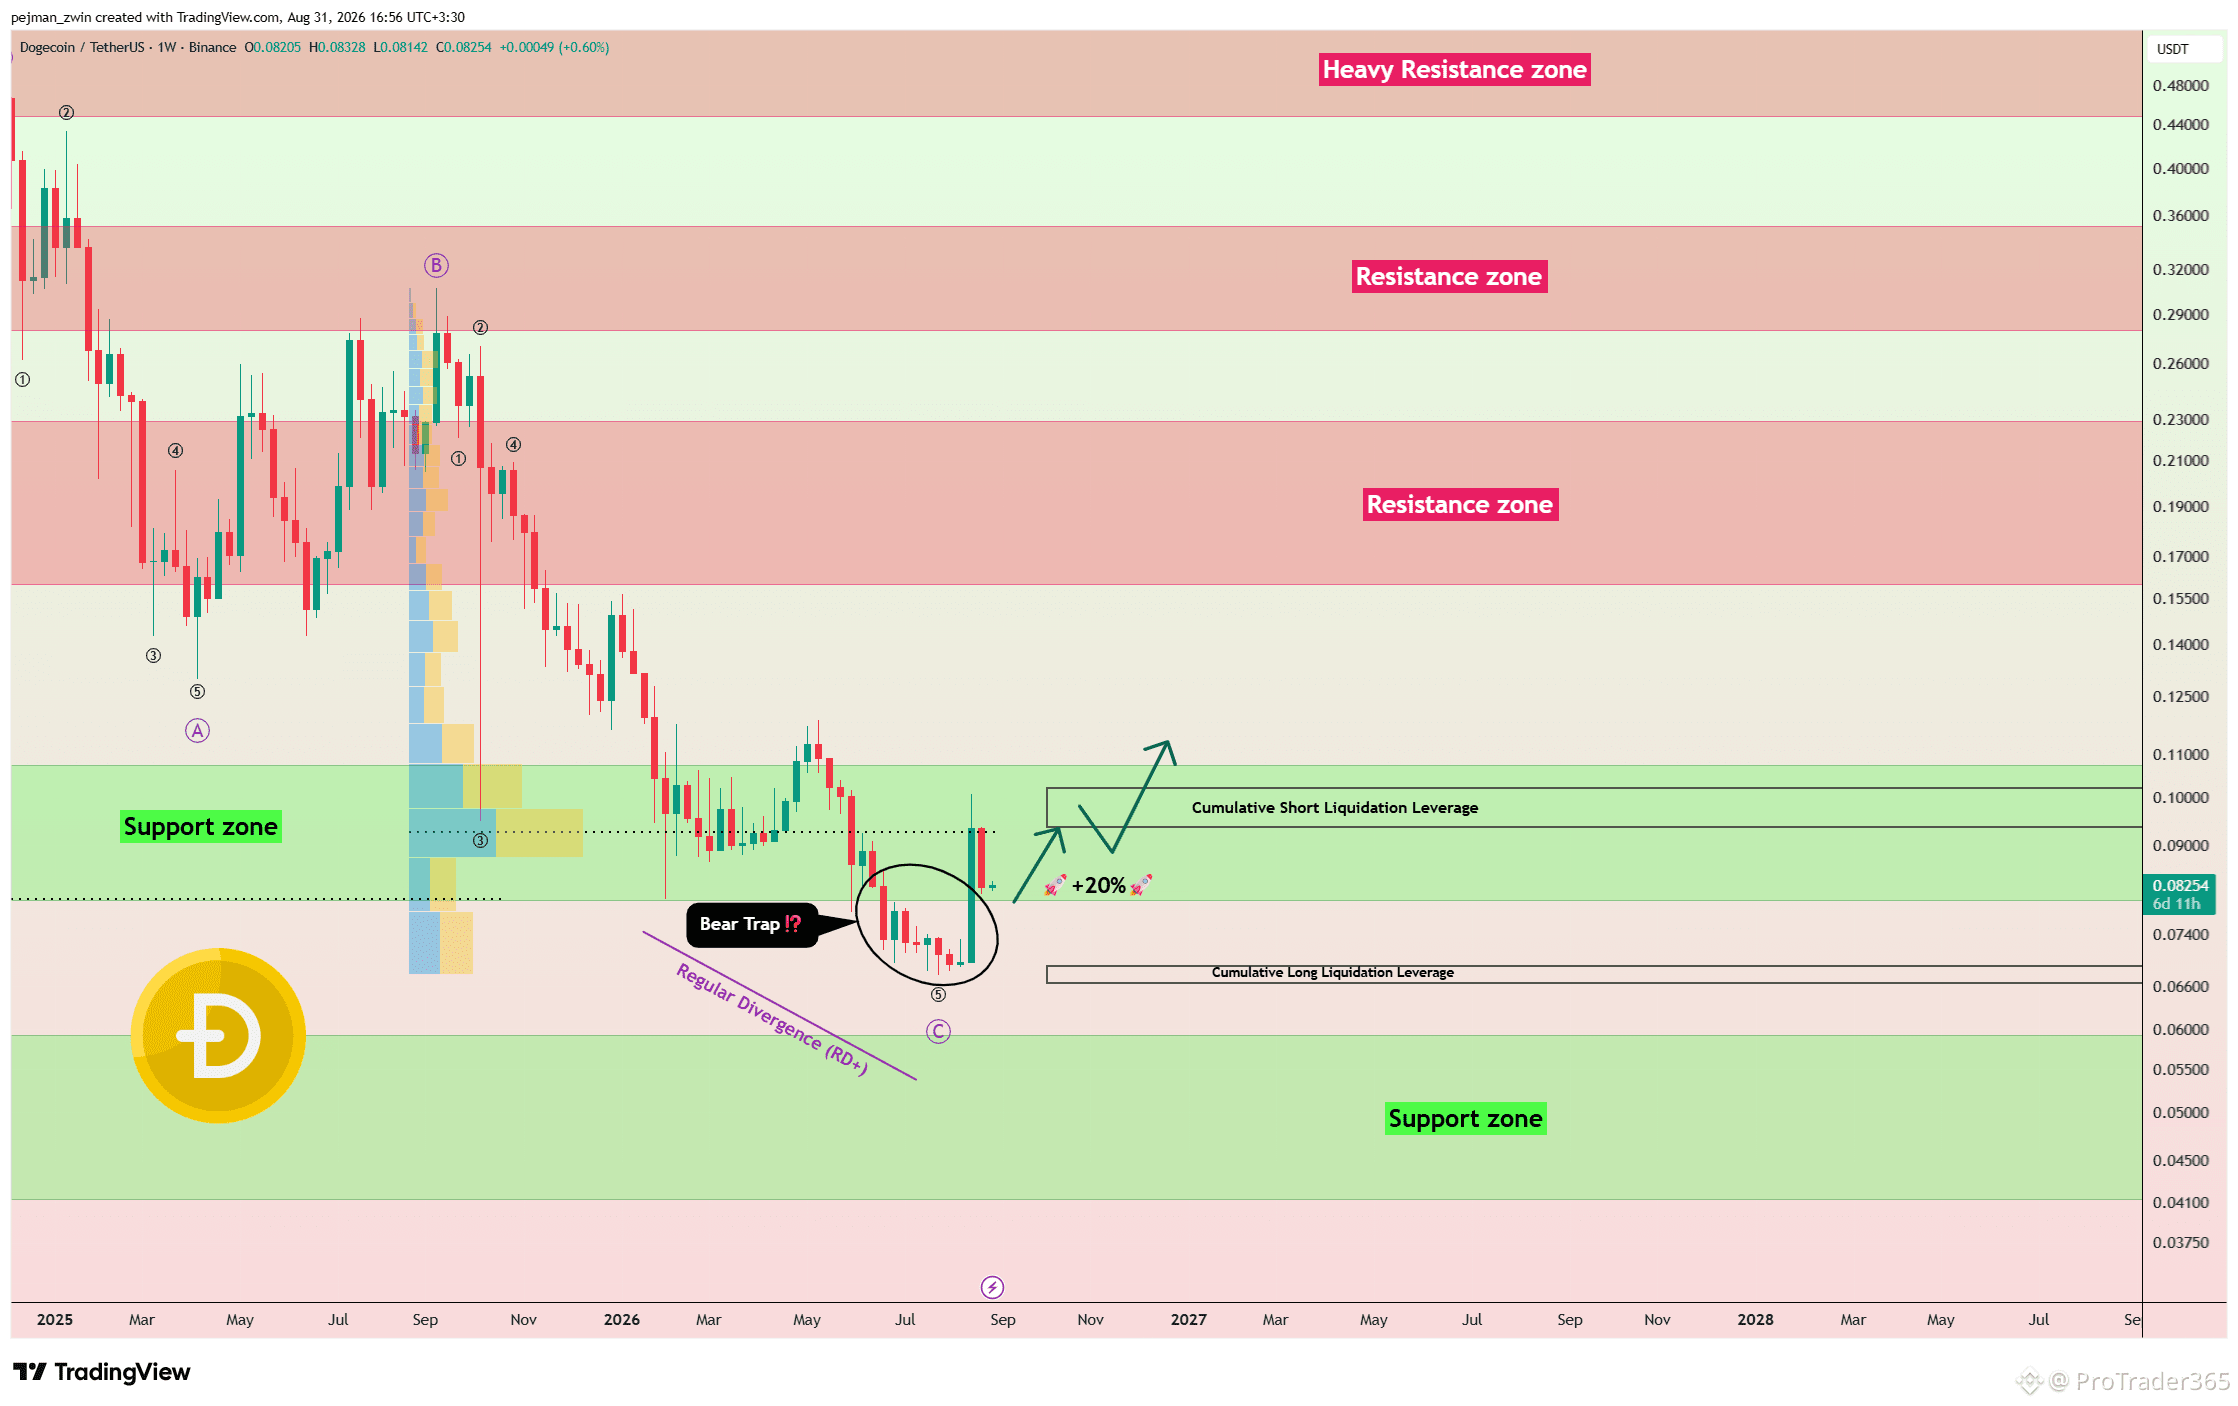
$DOGE Bear Trap Could Trigger the Next 20% Bullish Move DOGE appears to be recovering from a Bear Trap formed below the important $0.080 trading level and the Support Zone. When a trap is confirmed, price can often react strongly in the opposite direction with increased momentum. From an Elliott Wave perspective, the weekly corrective Zigzag structure appears to be complete, potentially opening the way for a short-term impulsive bullish wave. Positive divergence is also clearly visible between consecutive lows, adding further confirmation that bullish momentum may be developing. As long as the current support structure remains intact, I expect DOGE to potentially gain at least 20% toward the $0.0925 trading level and the Cumulative Short Liquidation Leverage($0.0937-$0.102). Can DOGE break above this liquidity zone and extend the bullish move further? #DOGE
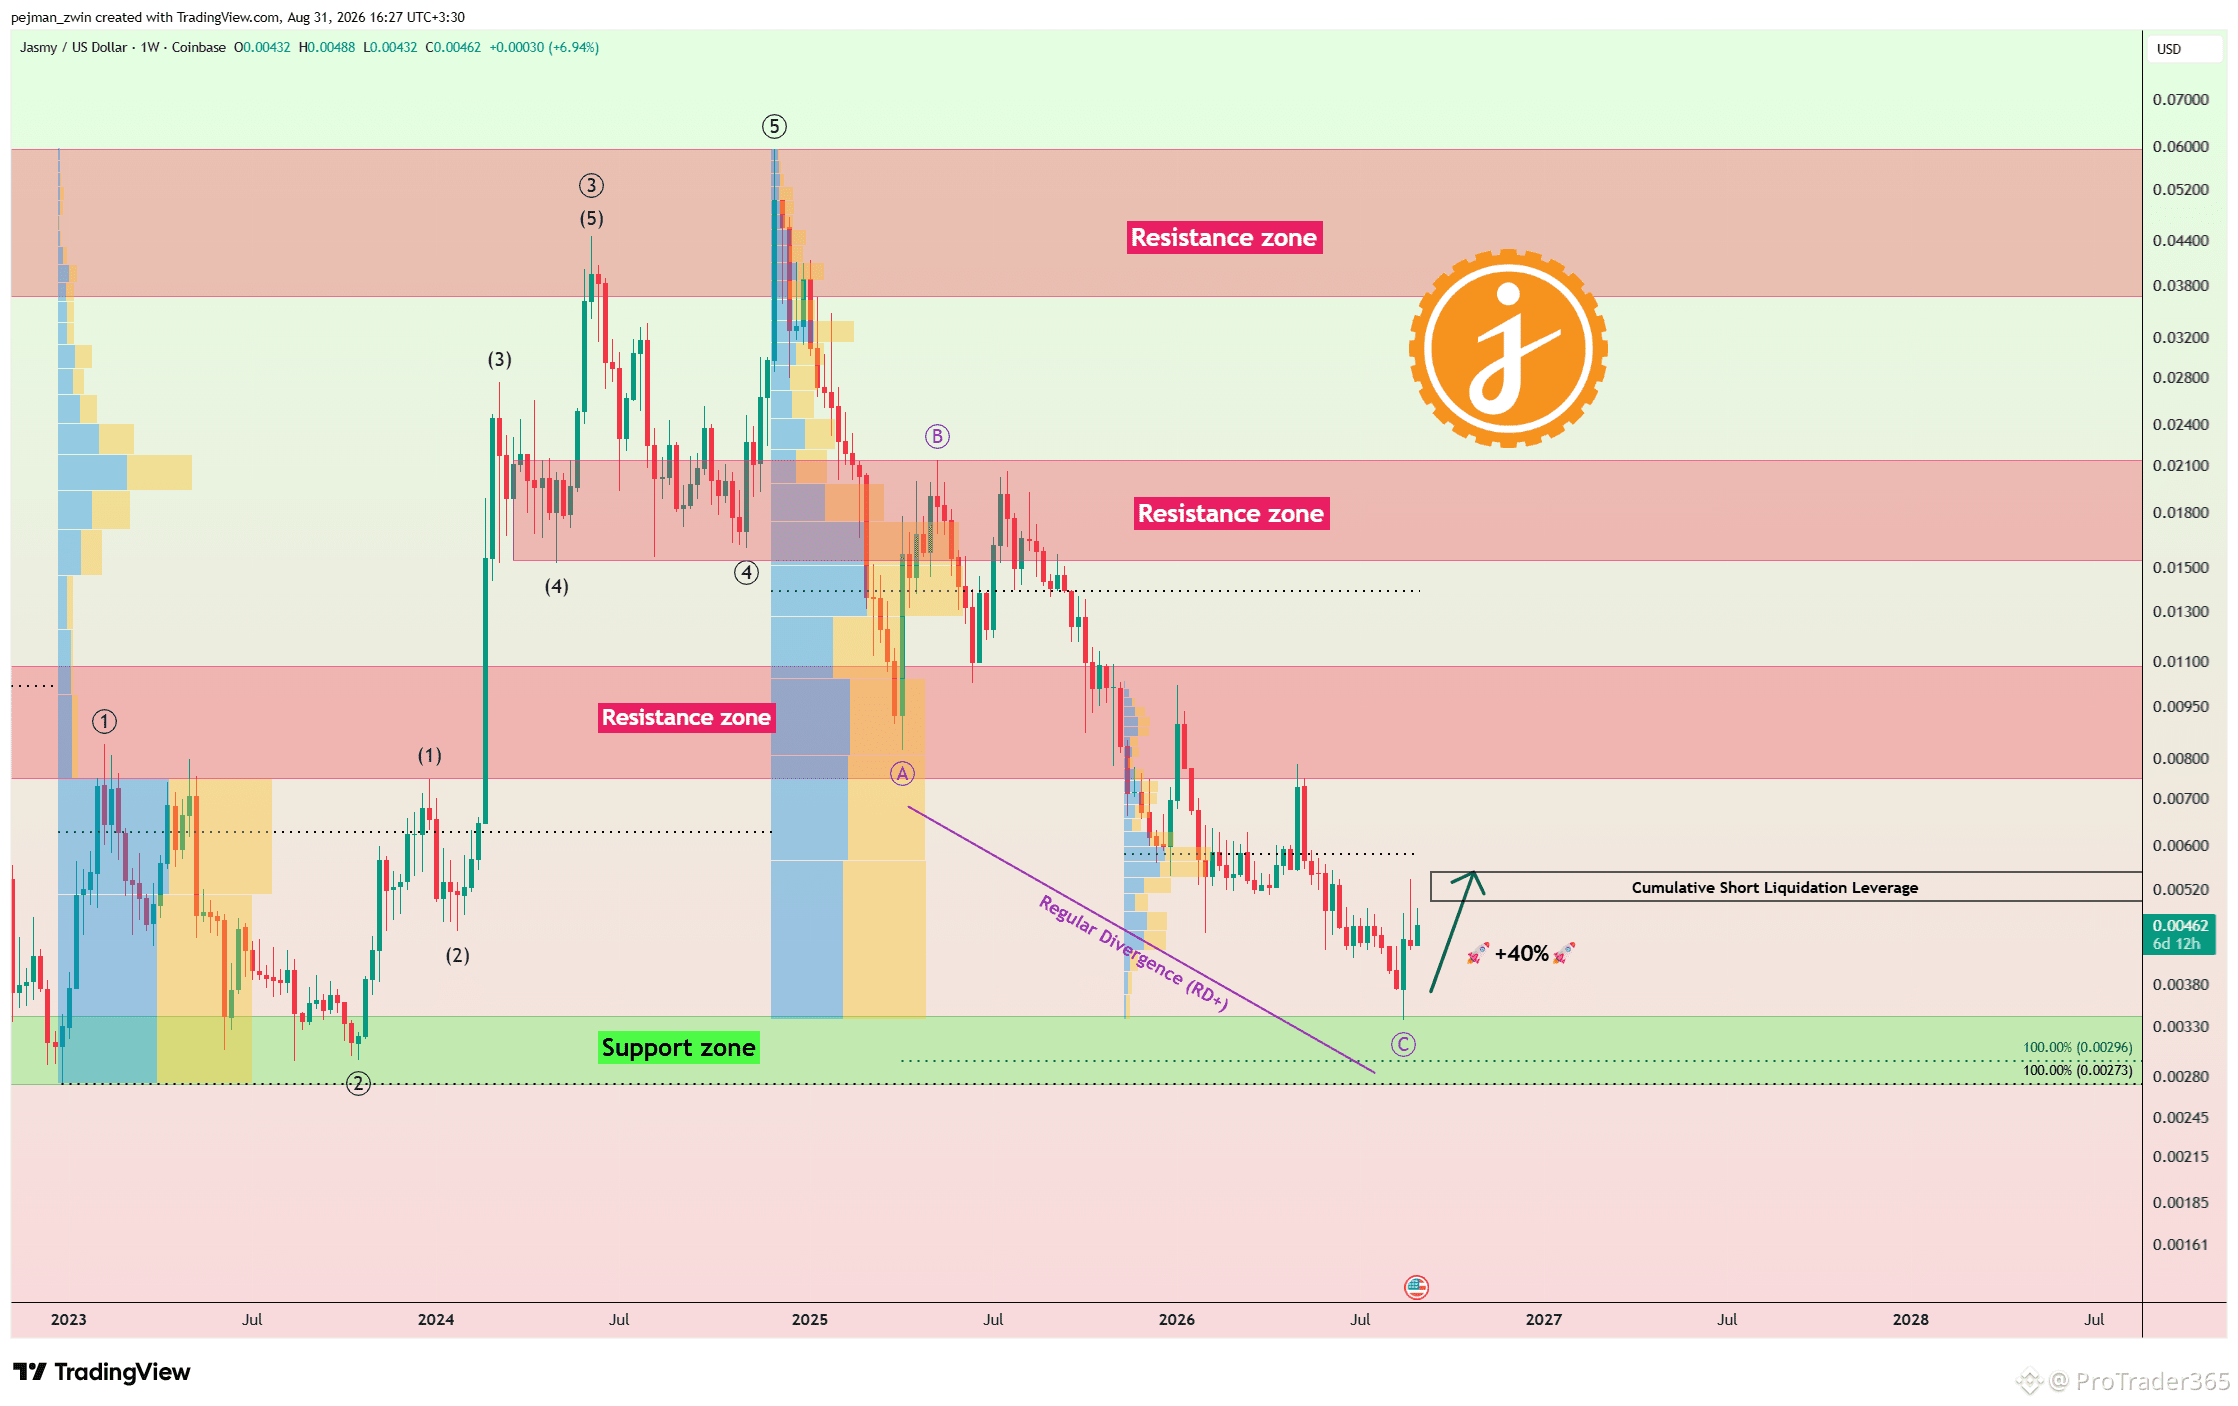
$JASMY Could Be Building a 40% Recovery Setup JASMY’s fundamentals are showing mixed but improving signals. Positive catalysts include the collaboration between Jasmy, Panasonic Advanced Technology and Jasmy Lab on the Smart Render distributed GPU service, while around 98.9% of the 50B max supply is already circulating, reducing future dilution risk. However, JasmyChain adoption remains limited, whale concentration is still high, and the Upbit and Bithumb delisting scheduled for September 14 could increase short-term volatility. From a technical perspective, JASMY reacted strongly from the Support Zone. Based on Elliott Wave Theory, the weekly corrective Zigzag structure may already be complete, while Positive Divergence is visible across price, volume and several indicators. As long as the Support Zone holds, I expect a potential 40% gain in the coming days and weeks. Key Levels: $0.0058 and $0.0063. A breakout could open the way toward $0.0073. Can JASMY break these Key Levels before the delisting volatility intensifies? #JASMY
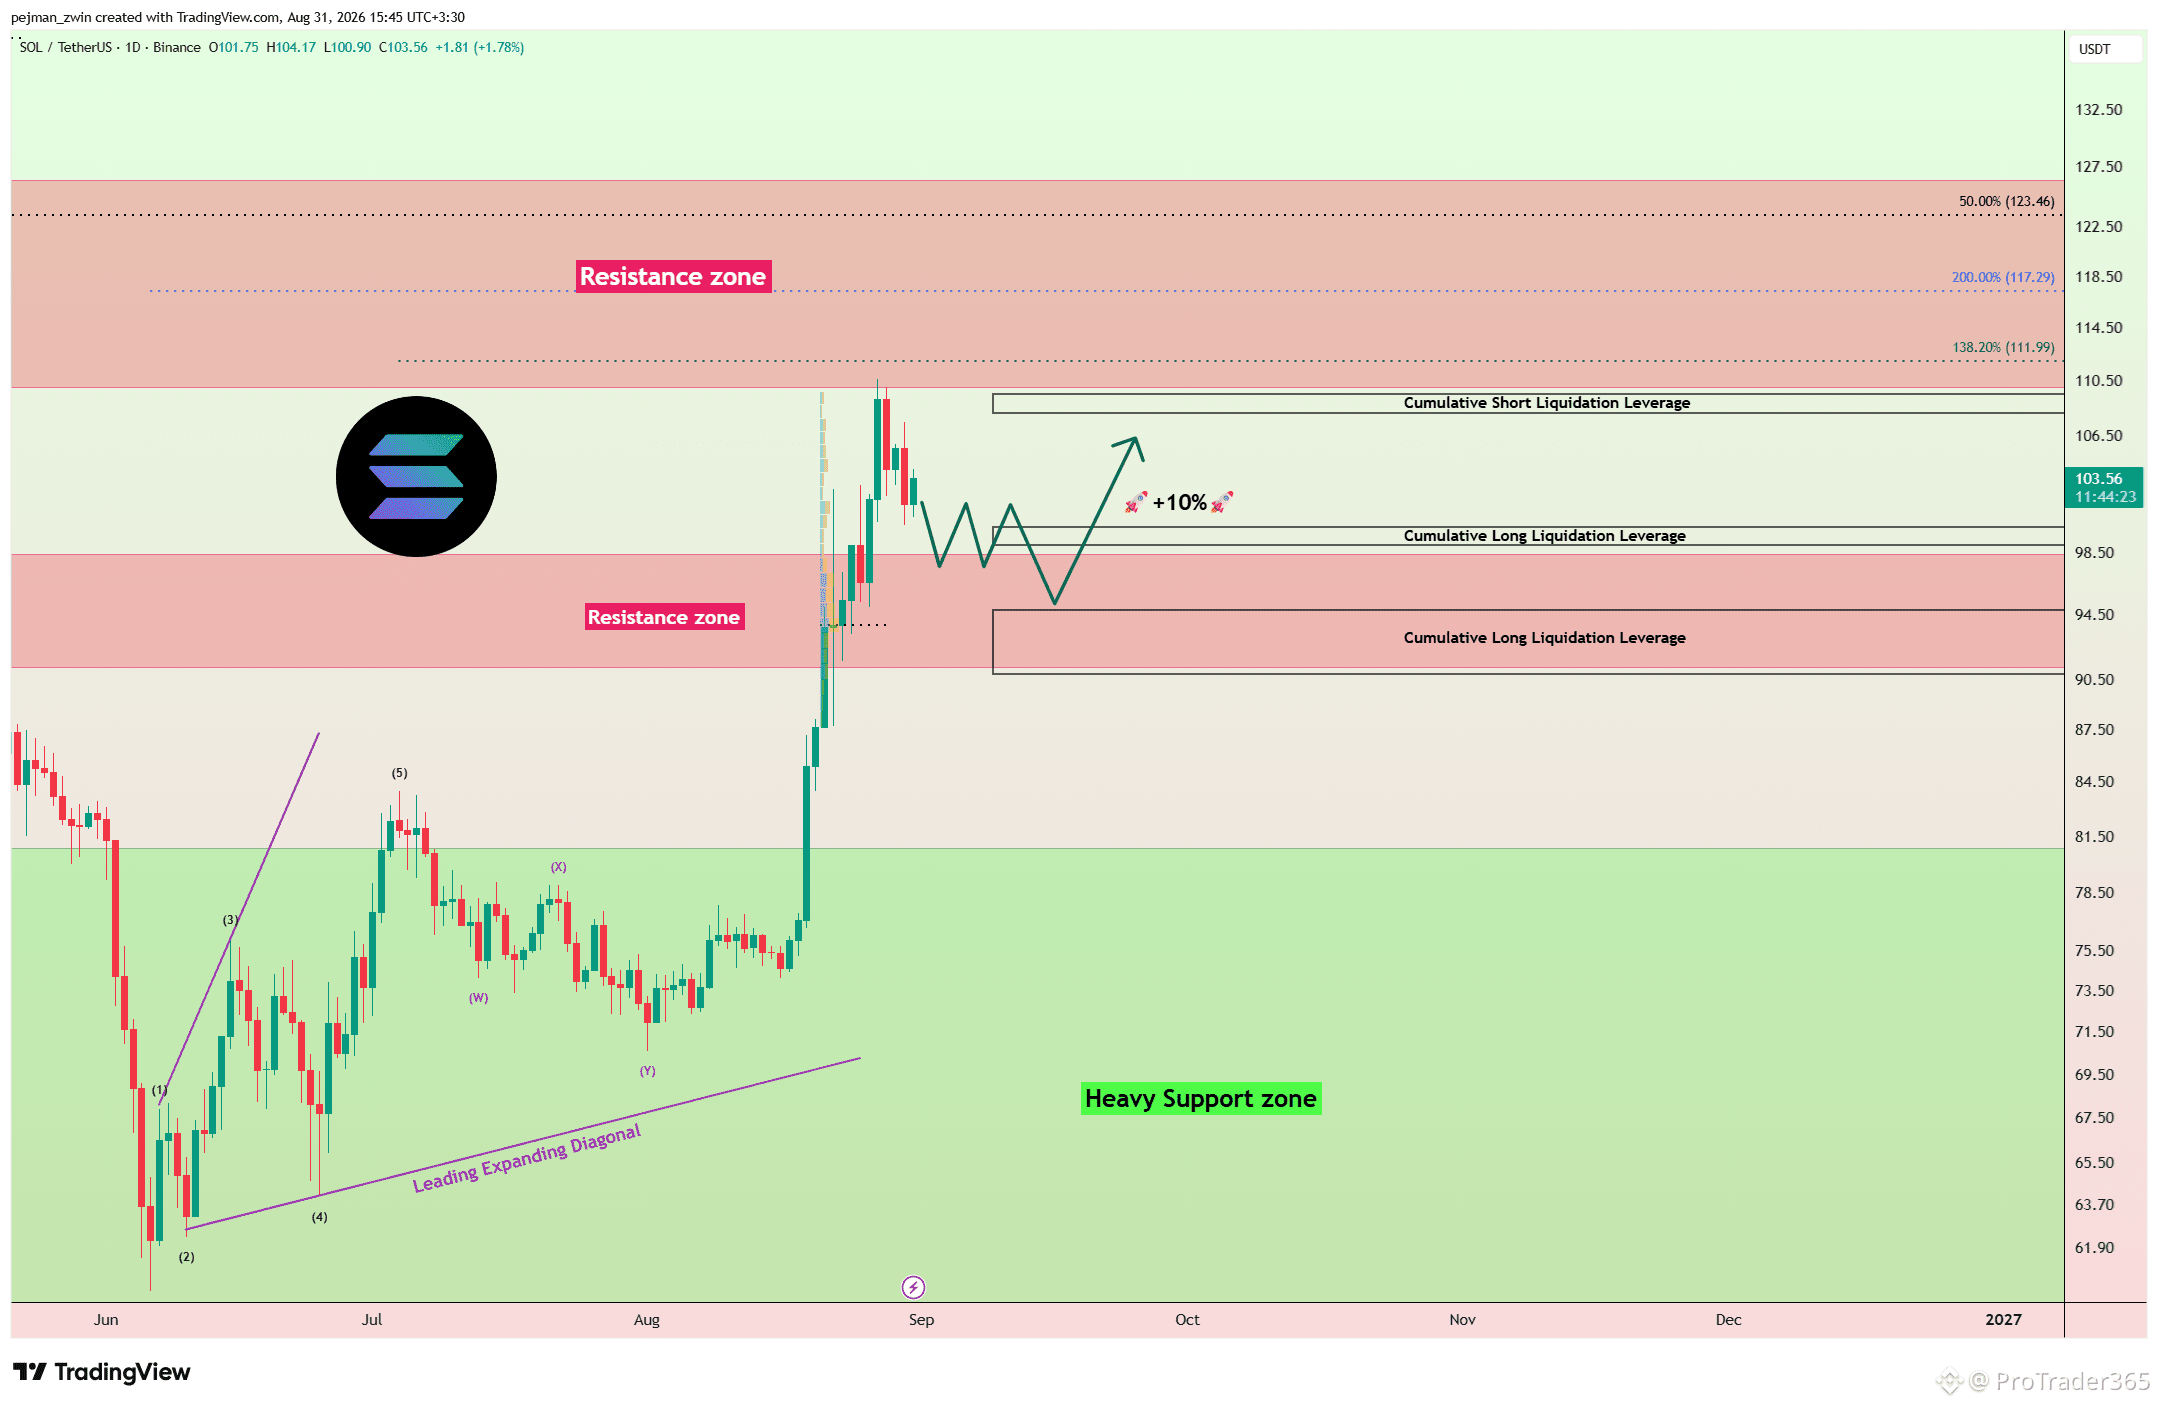
$SOL Pullback Could Set Up the Next 10% Bullish Move Solana broke above the Resistance Zone with strong volume, confirming significant buying pressure. Price is now pulling back toward the breakout area and approaching the Cumulative Long Liquidation Leverage($99.00-$100.20) and the deeper Cumulative Long Liquidation Leverage($90.80-$94.80). The $94 level remains an important trading level for maintaining the broader bullish structure. I expect Solana to potentially complete its pullback around these liquidity areas before starting another bullish move. If buyers successfully defend the support zones, price could gain at least 10% and target the Cumulative Short Liquidation Leverage($108.20-$109.50). Do you think Solana completes the pullback above $94 and starts the next bullish leg? #SOL #Solana
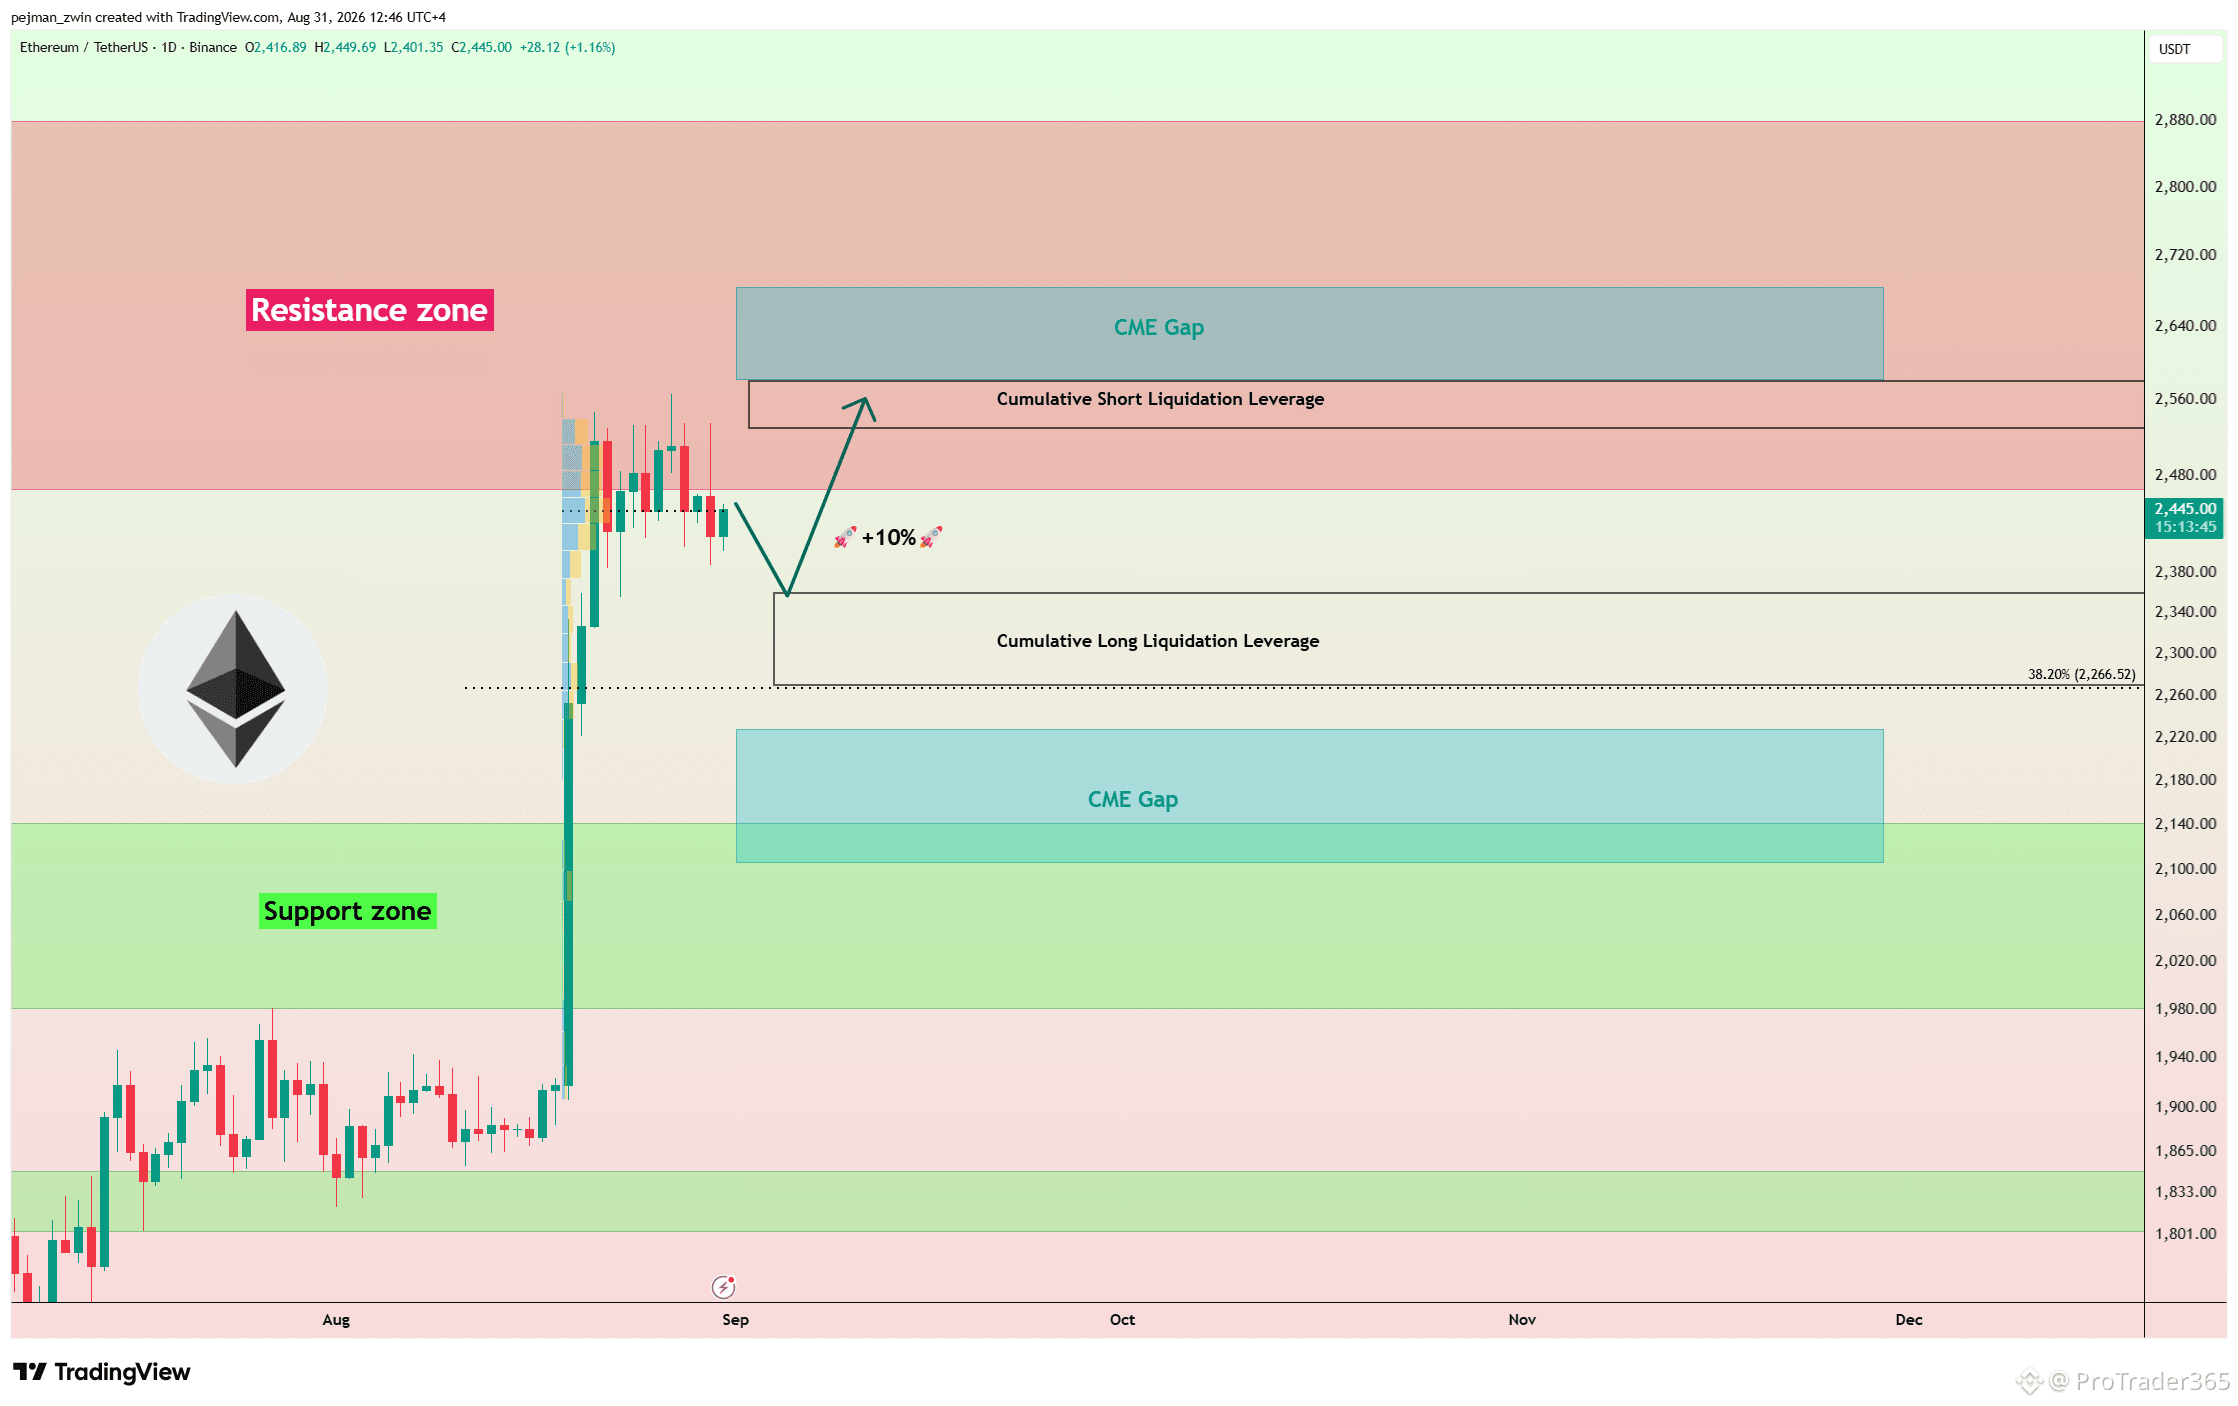
$ETH Could Outperform Bitcoin in the Next Bullish Move Ethereum appears to be in a stronger position than Bitcoin, while the ETH/BTC chart continues to show bullish strength. This relative strength could also create opportunities across high-potential projects within the Ethereum ecosystem. At the moment, Ethereum is trading near an important Resistance Zone. I expect Ethereum to potentially start another bullish move from the Cumulative Long Liquidation Leverage($2,270-$2,360) and gain at least 10%, targeting the Cumulative Short Liquidation Leverage($2,530-$2,580). If bullish momentum remains strong, Ethereum could continue higher and potentially fill the upper CME Gap($2,582-$2,684.5). Can Ethereum maintain its relative strength against Bitcoin and reach the upper CME Gap during the next bullish move? #ETH #Ethereum
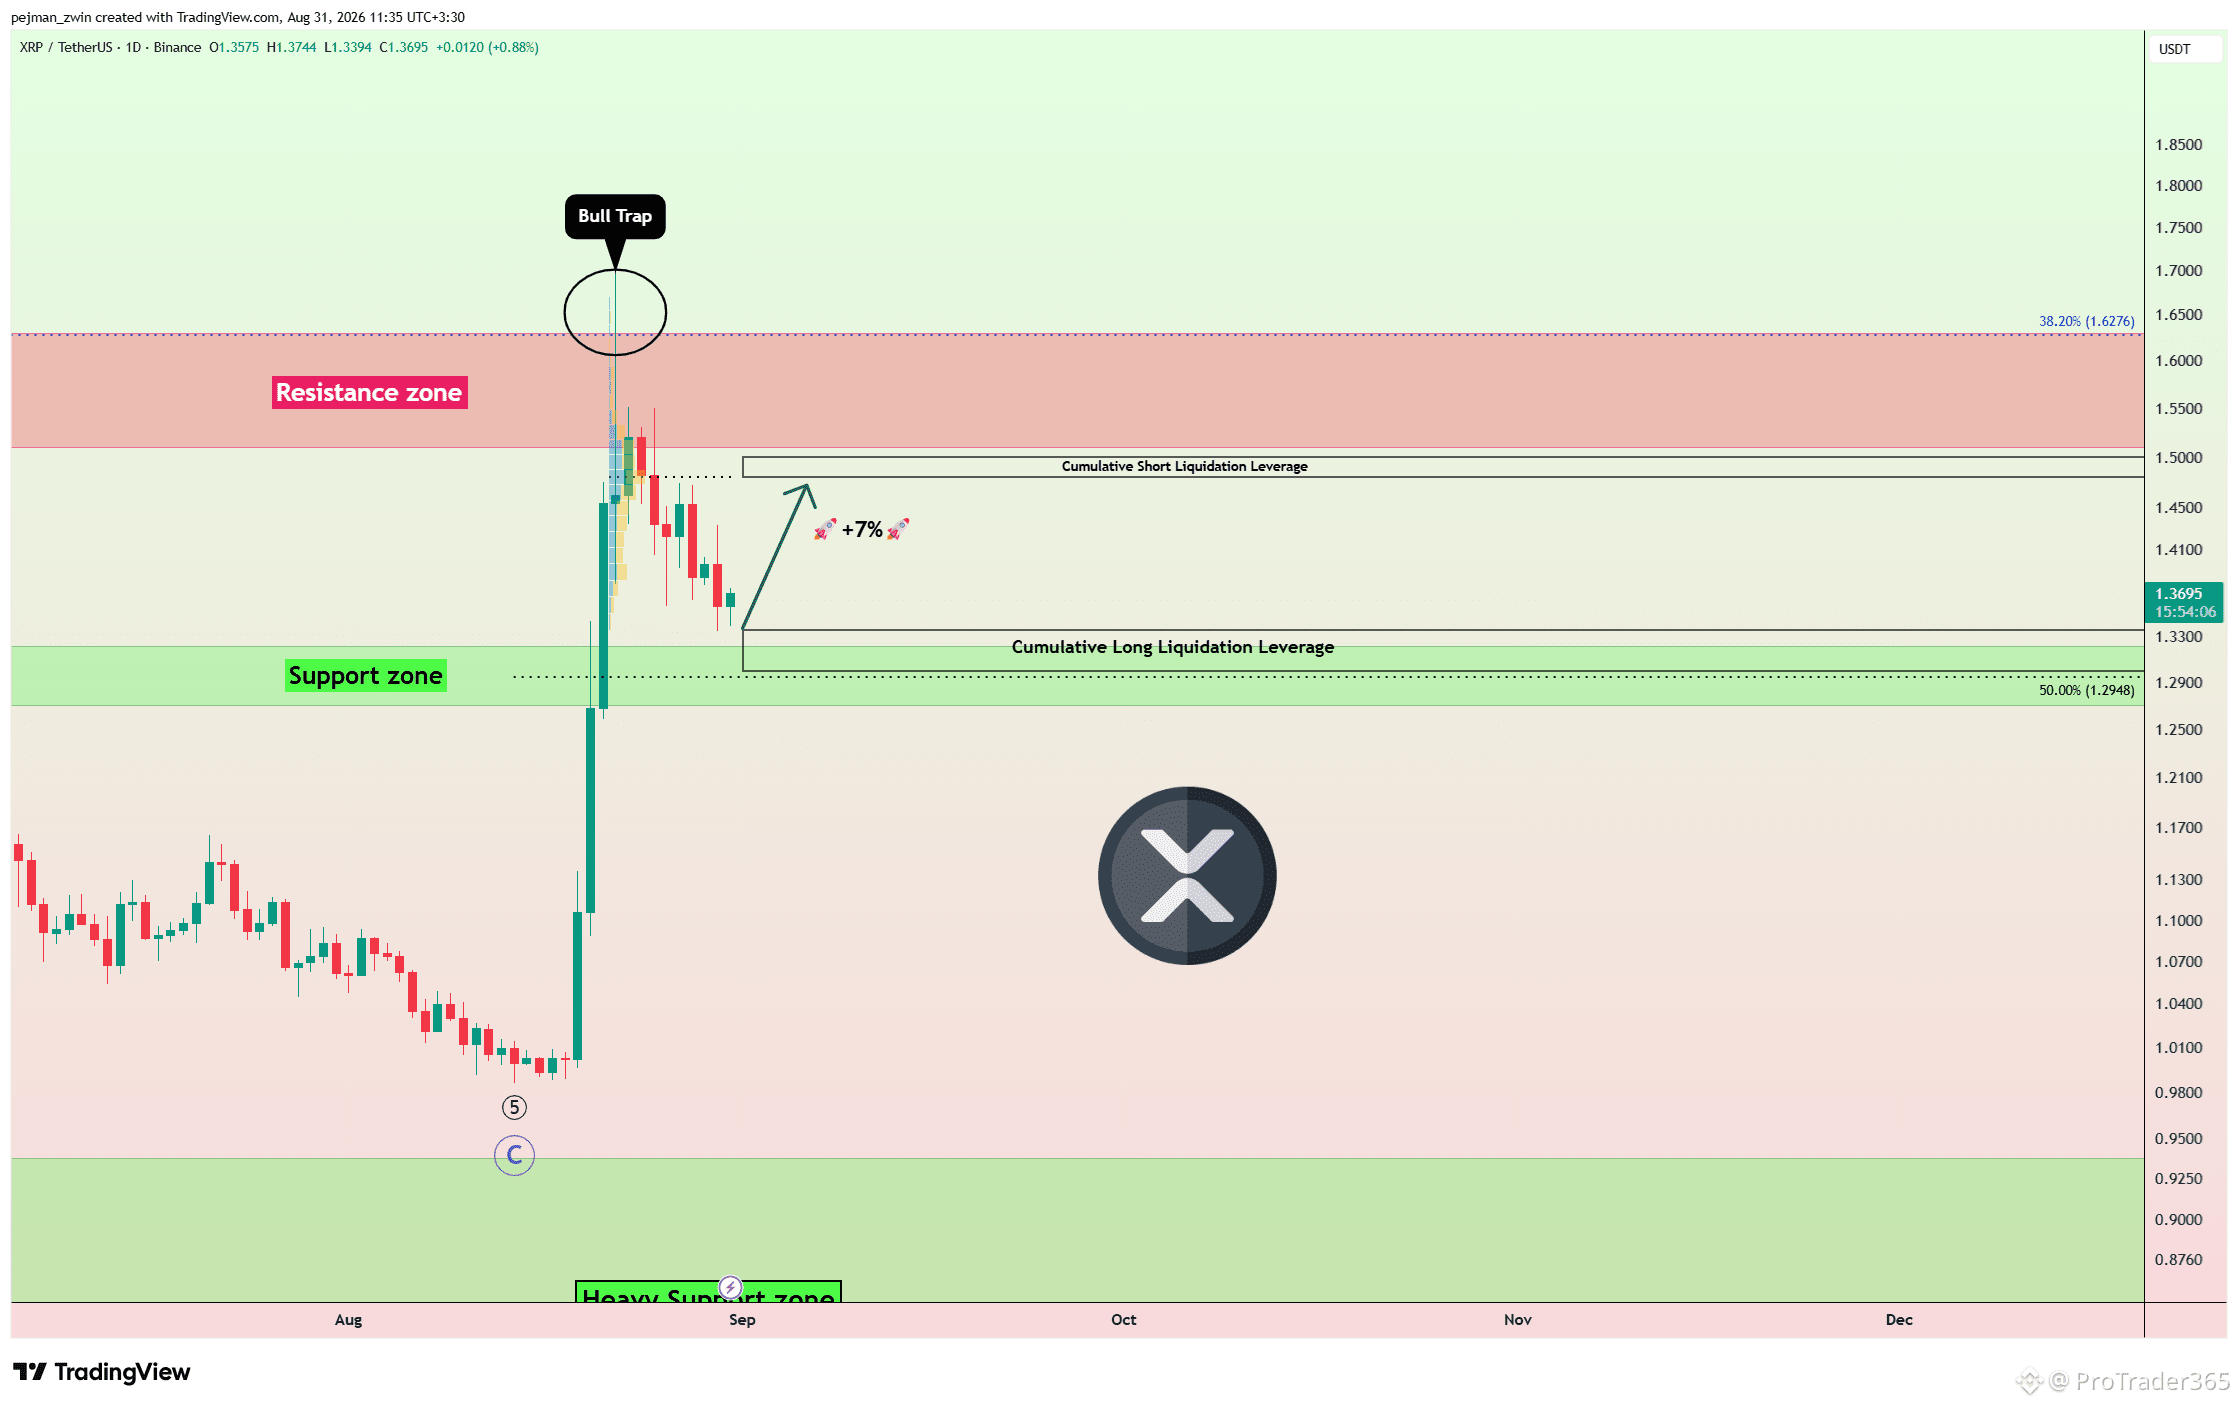
$XRP Tests a Key Support Confluence After a Bull Trap XRP failed to break above the Resistance Zone and formed a Bull Trap above it, triggering the current corrective phase. The price is now trading near an important support confluence formed by the Support Zone and the Cumulative Long Liquidation Leverage($1.30-$1.336). If buyers successfully defend this area, I expect XRP to begin another bullish move and gain at least 7%, targeting the important trading level at $1.48 and the Cumulative Short Liquidation Leverage($1.48-$1.50). The liquidity clustered around $1.48-$1.50 could become the next major target if bullish momentum returns. Do you think XRP can rebound from the current support area and reach $1.48 next? #XRP #Ripple
$BTC Faces a High-Volatility Test as Fed Chair Warsh Speaks Less than 15 minutes remain until Fed Chair Warsh speaks, and volatility could rise sharply across Bitcoin, Gold and the US Dollar. A mildly hawkish tone would likely support the USD and pressure Bitcoin and Gold initially. A strongly hawkish message could trigger a sharper risk-off move, while a dovish surprise would likely weaken the USD and support both assets. However, the first market reaction may be misleading. Chicago PMI, University of Michigan Sentiment and potentially payroll revisions are also due around the same time, significantly increasing the risk of whipsaw. The key is to avoid reacting blindly to the first candle and wait for the market to separate Warsh’s message from the economic data. Do you expect Warsh to sound hawkish or deliver a dovish surprise? #FedRate #BTC Price Analysis#
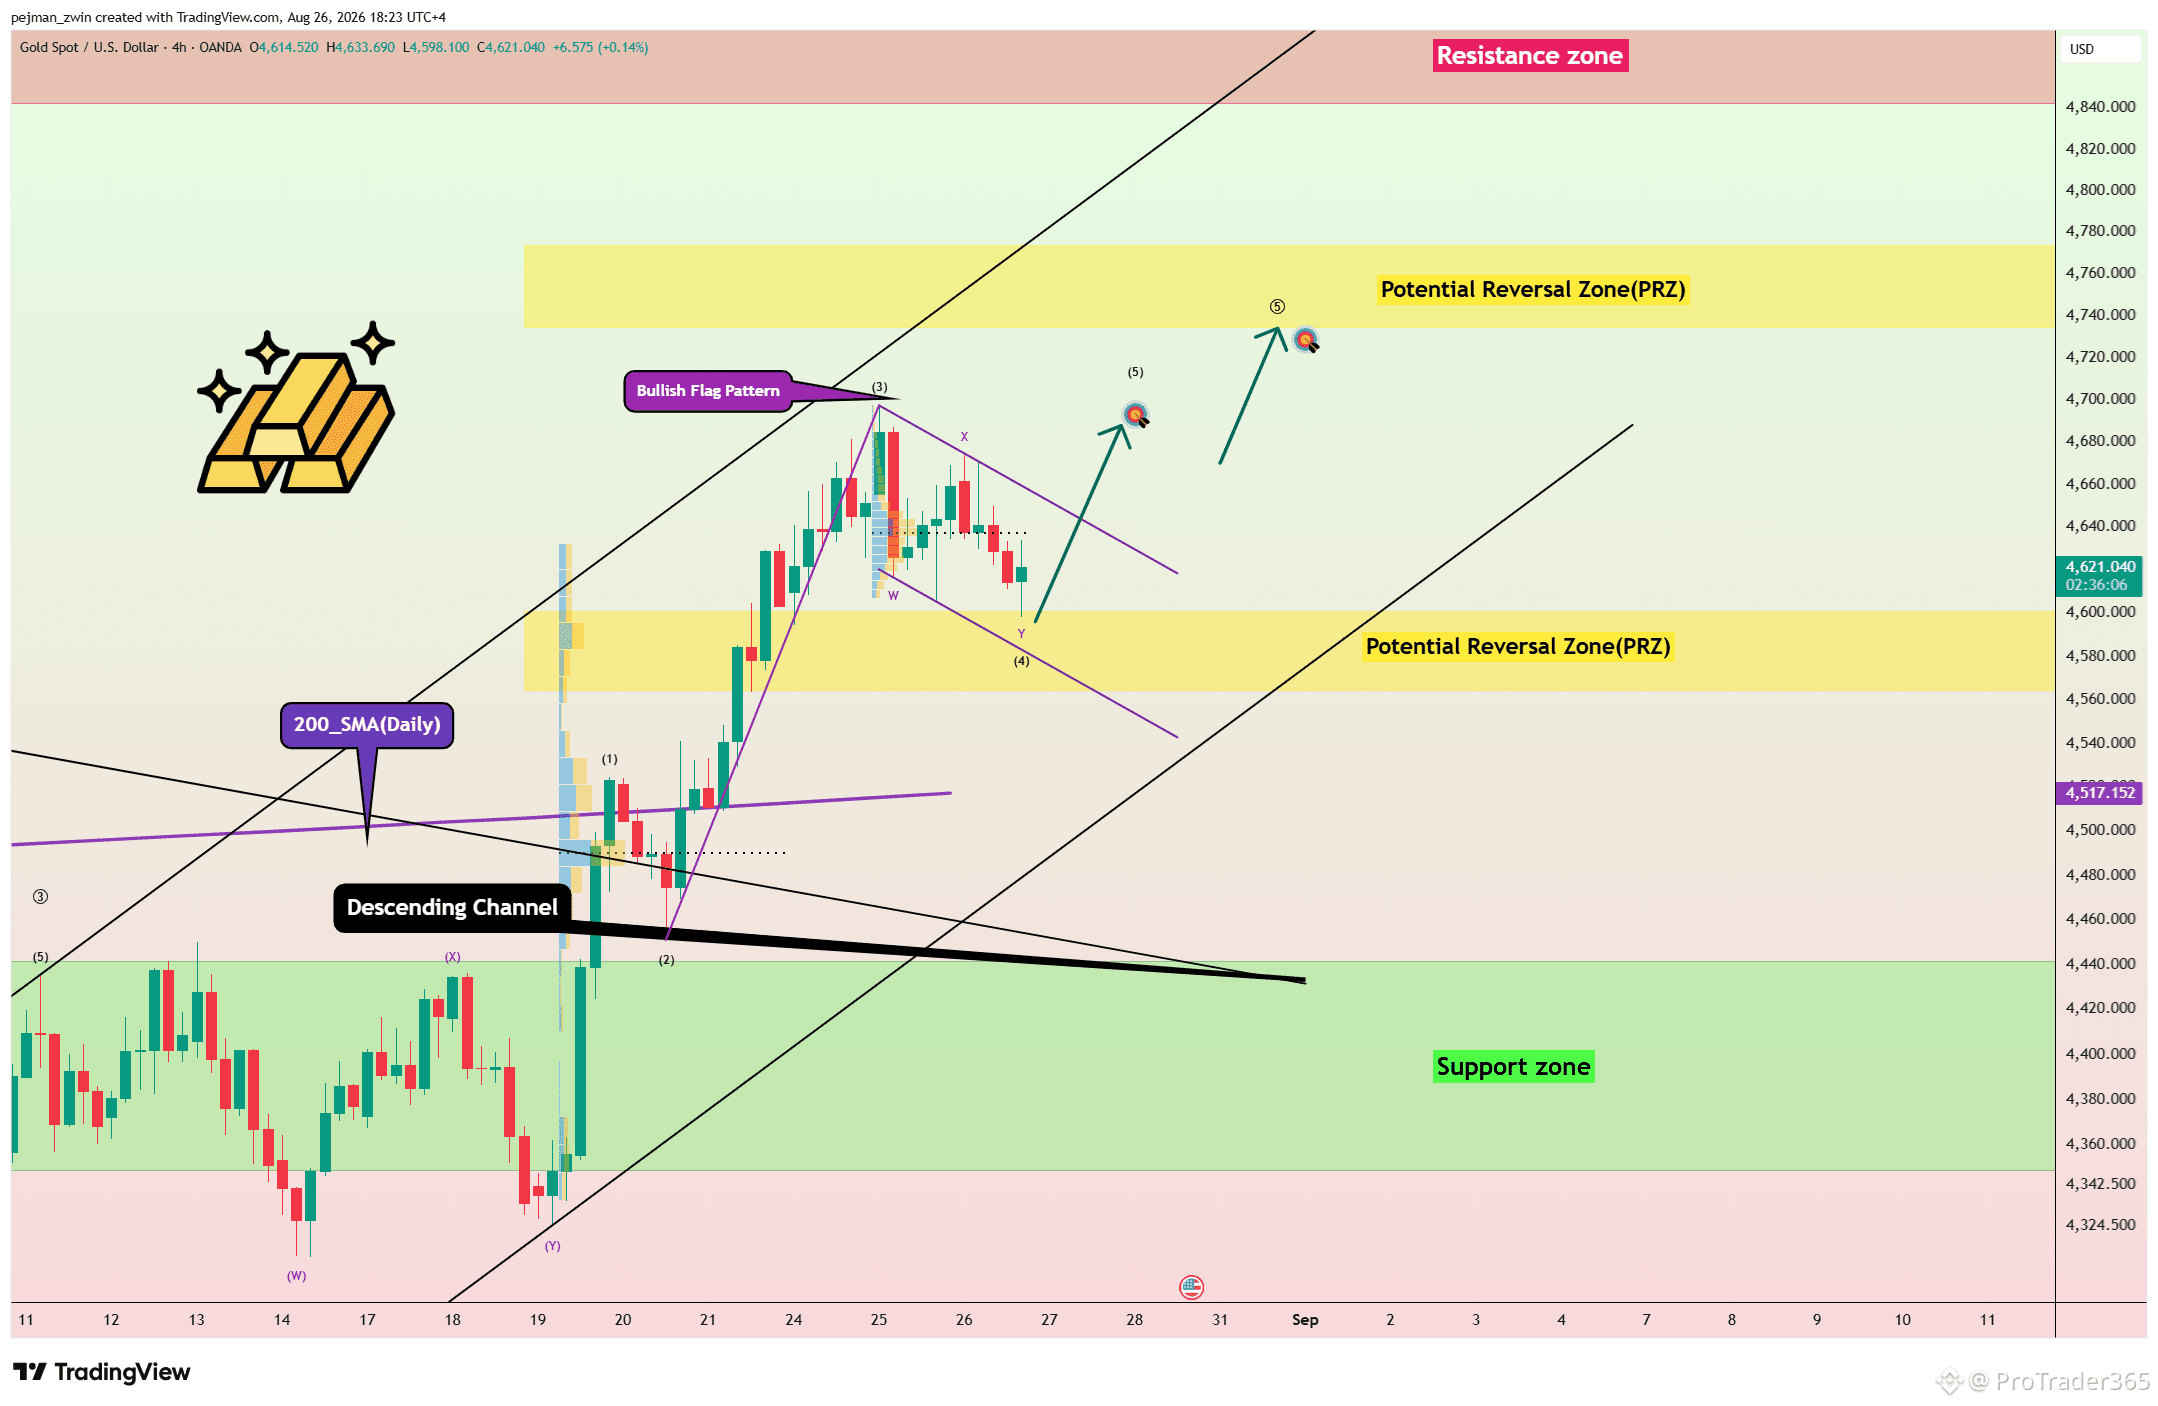
$XAUt Bullish Flag Could Open the Door Toward $4,720 Gold has continued its bullish trend after breaking above the Descending Channel and the 200_SMA(Daily). Price is now starting another bullish move from the Potential Reversal Zone(PRZ), while a Bullish Flag Pattern appears to be forming. Technical Analysis From an Elliott Wave perspective, gold appears to have completed Primary Wave 4 as a Double Three Correction(WXY). From a classical technical analysis perspective, the Bullish Flag Pattern also supports bullish continuation. I expect gold, after breaking the key $4,637 level, to break above the upper trendline of the Bullish Flag and rise toward $4,693. If bullish momentum increases, the move could extend toward the Potential Reversal Zone(PRZ)[$4,720-$4,640]. Stop Loss(SL): $4,561 Can gold reach the Potential Reversal Zone(PRZ) before another correction? #Gold
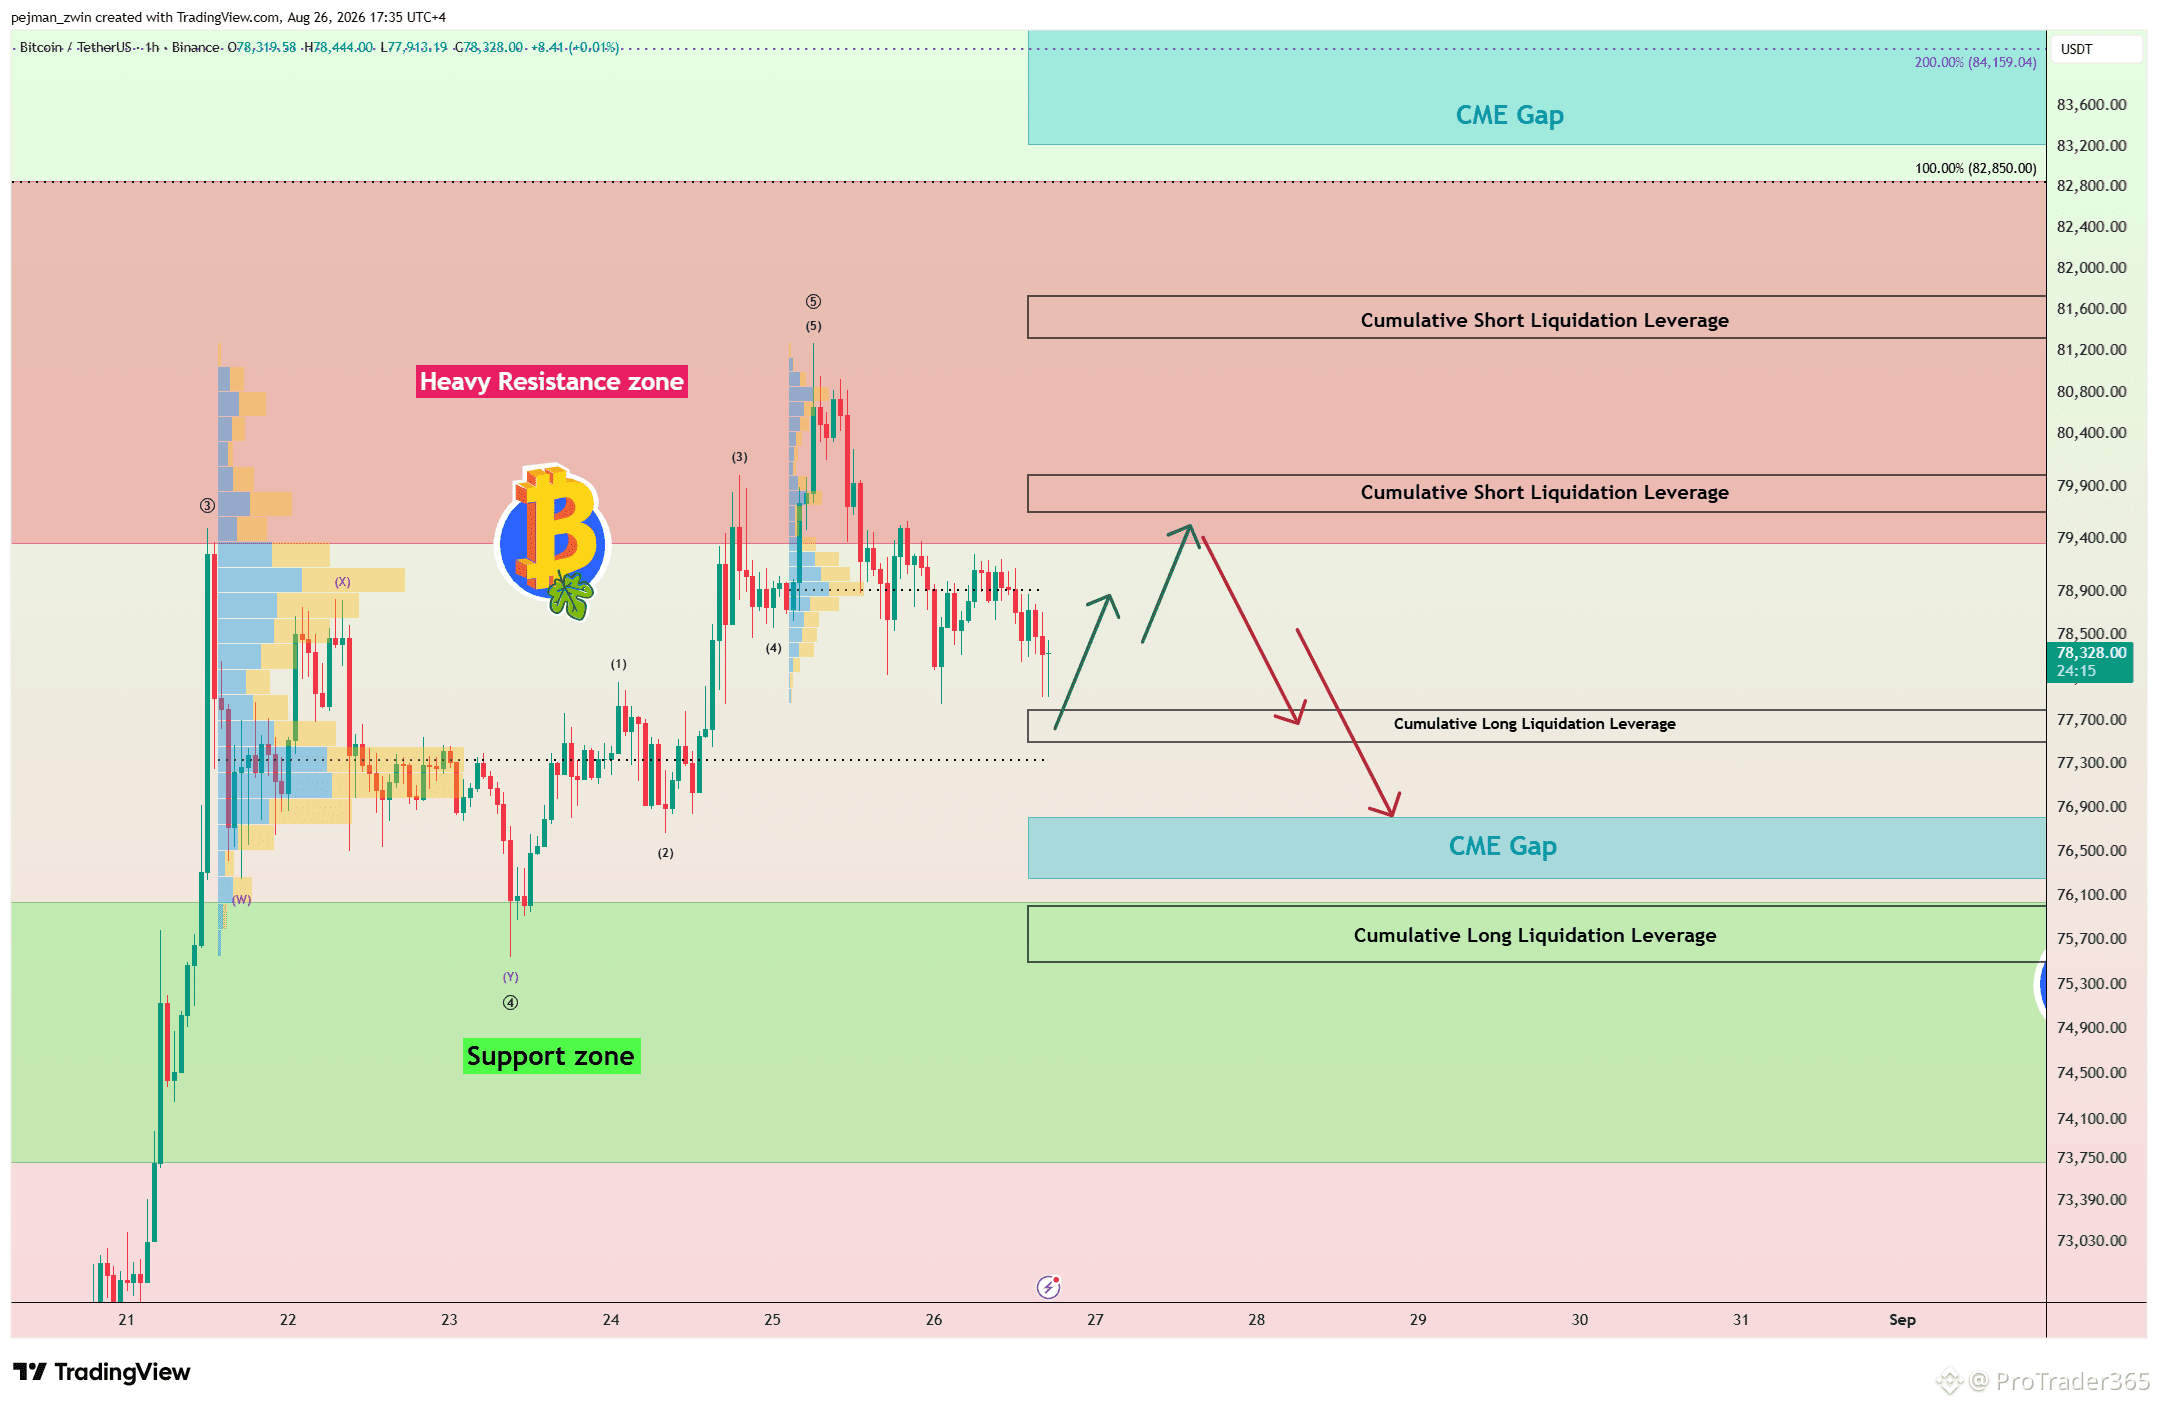
$BTC Tests $77,350 After Another Failed Breakout Bitcoin made another attempt to break above the Heavy Resistance Zone, but the breakout appears to have failed, triggering another correction. Price is now trading near the Cumulative Long Liquidation Leverage and the key trading level of $77,350. Technical Analysis Bitcoin is testing an important support confluence around $77,350. Liquidation zones can act as short-term liquidity magnets, where concentrated leveraged positions may trigger sharp reactions once price reaches them. I expect Bitcoin to begin another bullish move from this area and advance toward the Cumulative Short Liquidation Leverage. After reaching that zone, another correction could begin, potentially pushing Bitcoin toward the CME Gap($76,810-$76,255) and eventually filling it. Key Trading Level: $77,350 Can Bitcoin reclaim $80,000 before another major correction? #BTC Price Analysis# #Bitcoin Price Prediction: What is Bitcoins next move?#
Gold Breaks the 200 SMA: Is a PRZ Reversal Coming Next?
$XAUt has finally broken above the Descending Channel and the 200 SMA on the daily chart, confirming an important technical breakout.
However, price is now approaching the Potential Reversal Zone (PRZ) and the upper trendline of a potential Ascending Channel, where additional selling pressure could appear.
From an Elliott Wave perspective, gold appears to be completing main wave 5 inside the PRZ, suggesting that a corrective phase could begin soon. A decline from this area could also act as a pullback to retest the recently broken Descending Channel and the 200 SMA.
I expect gold to start declining from the PRZ and move at least toward $4,547.230.
🎯 Take Profit: $4,547.230
🛑 Stop Loss: $4,727.000
Key level to watch: $4,520
Full chart with detailed levels and analysis here 👇
https://www.tradingview.com/chart/XAUUSD/cyKGMTZc-Gold-Breaks-the-200-SMA-Is-a-PRZ-Reversal-Coming-Next/
Do you think gold will start a correction from the PRZ?
🔴 Yes
🟢 No #Gold
$XAUt has finally broken above the Descending Channel and the 200 SMA on the daily chart, confirming an important technical breakout.
However, price is now approaching the Potential Reversal Zone (PRZ) and the upper trendline of a potential Ascending Channel, where additional selling pressure could appear.
From an Elliott Wave perspective, gold appears to be completing main wave 5 inside the PRZ, suggesting that a corrective phase could begin soon. A decline from this area could also act as a pullback to retest the recently broken Descending Channel and the 200 SMA.
I expect gold to start declining from the PRZ and move at least toward $4,547.230.
🎯 Take Profit: $4,547.230
🛑 Stop Loss: $4,727.000
Key level to watch: $4,520
Full chart with detailed levels and analysis here 👇
https://www.tradingview.com/chart/XAUUSD/cyKGMTZc-Gold-Breaks-the-200-SMA-Is-a-PRZ-Reversal-Coming-Next/
Do you think gold will start a correction from the PRZ?
🔴 Yes
🟢 No #Gold
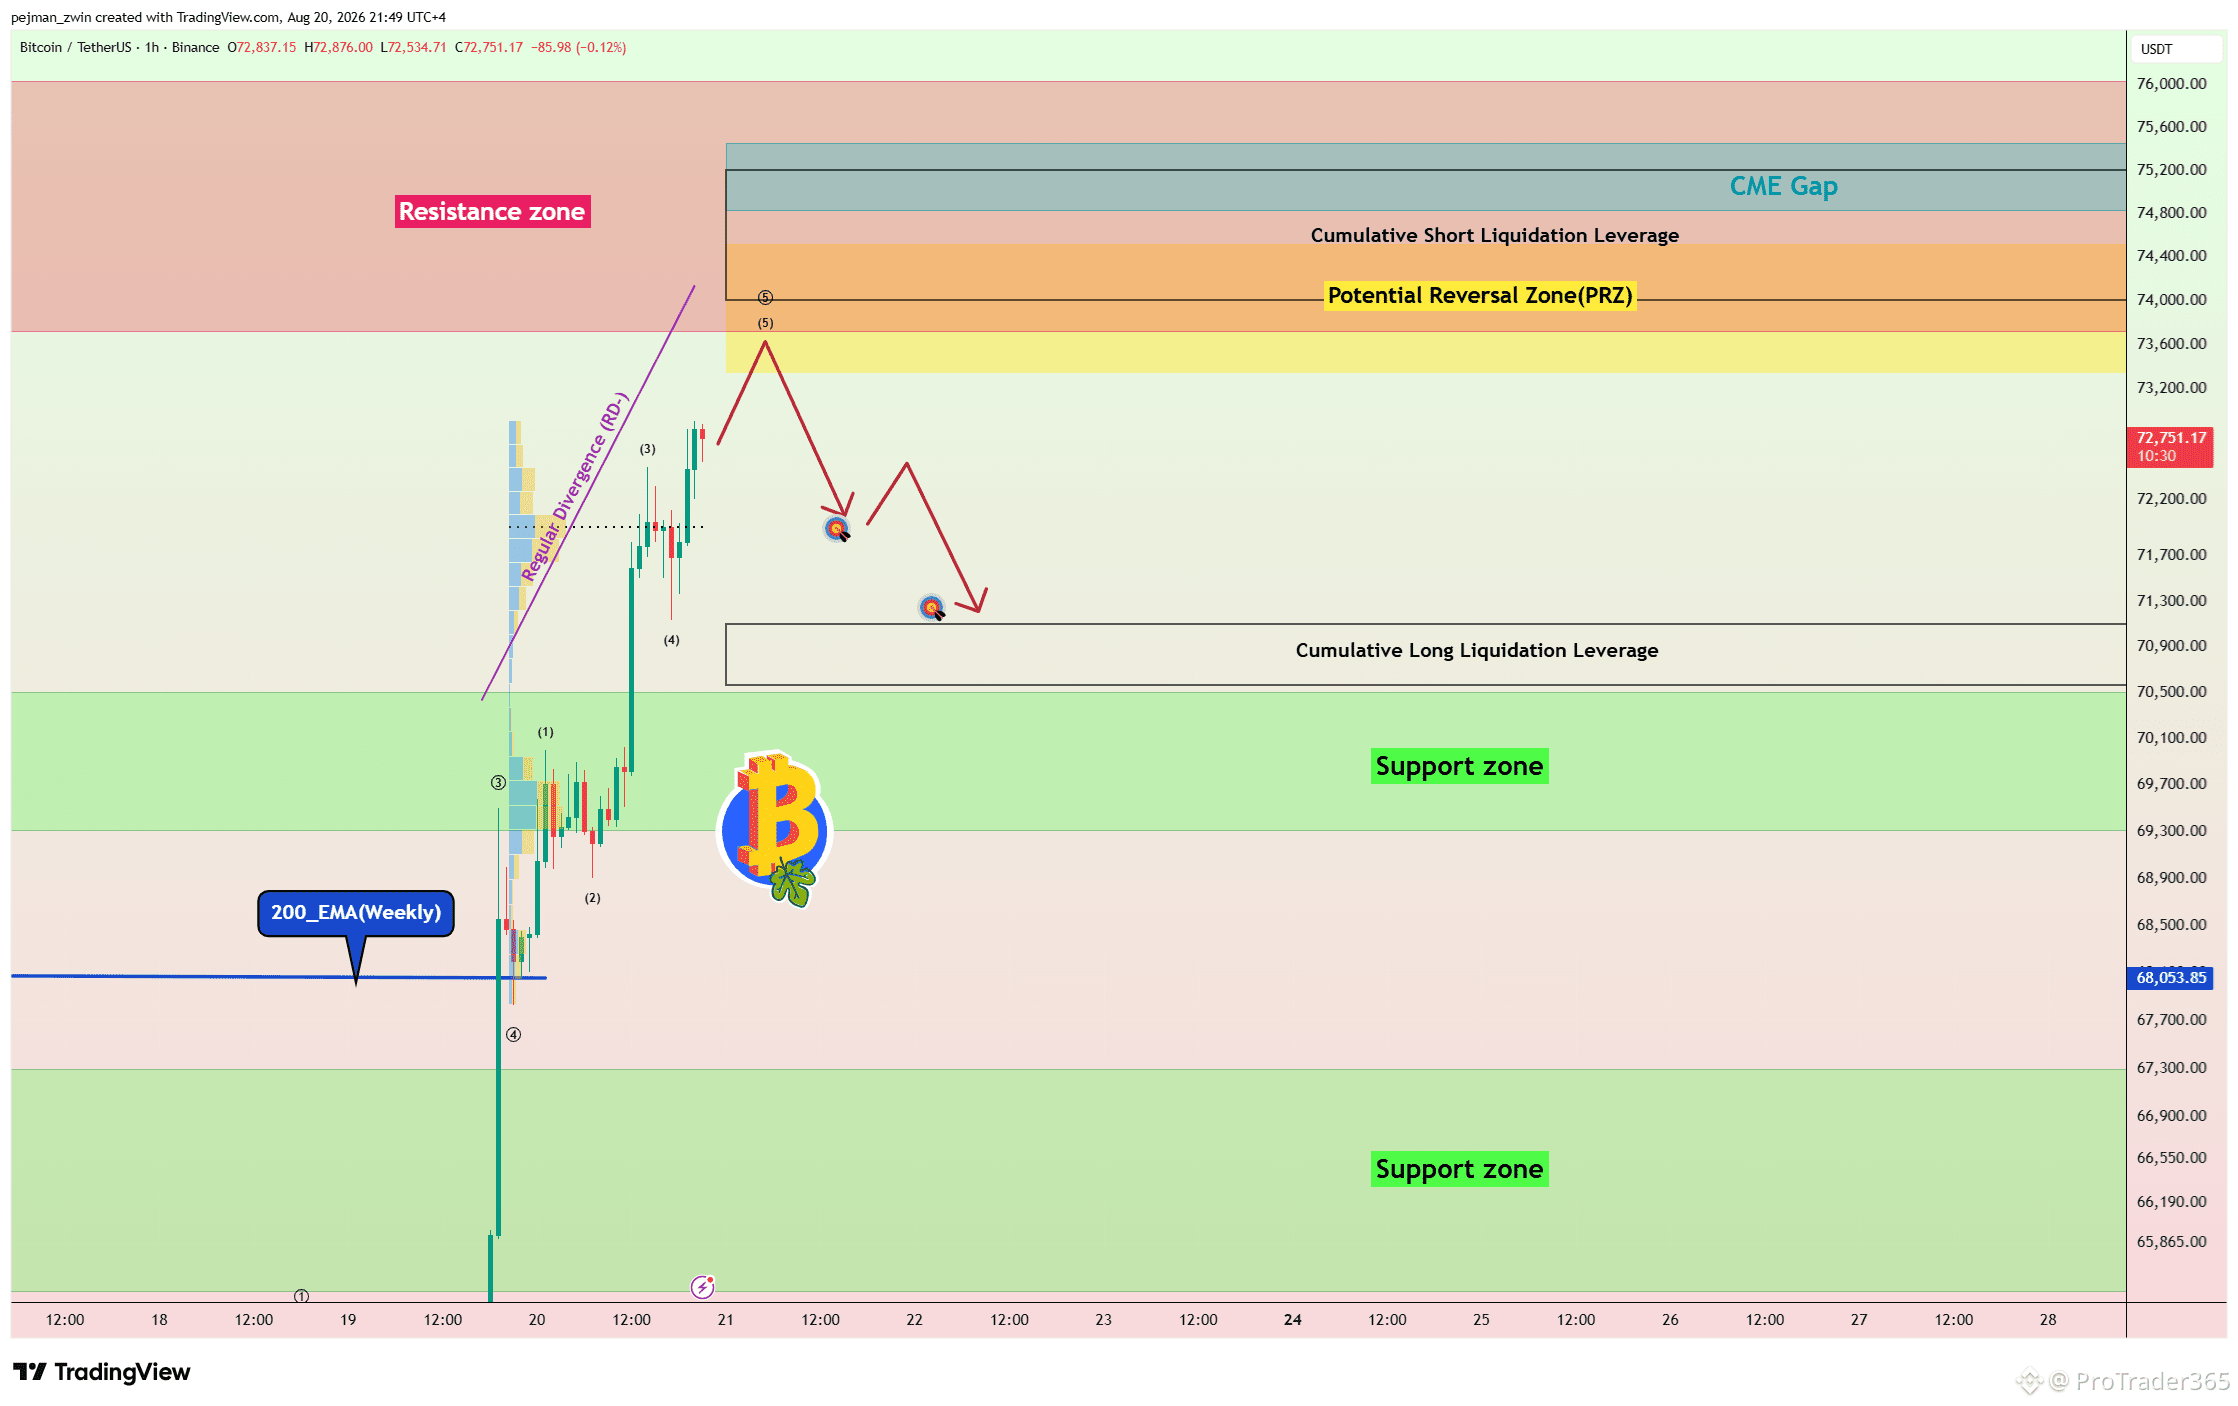
Bitcoin Near a Major PRZ: Correction Before the Next Rally? $BTC ’s latest rally has been supported by strong ETF inflows, improving regulatory optimism around the CLARITY Act, and a major short squeeze that helped BTC break above the $69,000-$70,000 area. The initial momentum was boosted by the U.S. Treasury’s larger long-term bond buybacks, which temporarily eased yield pressure and improved risk appetite. More than $1B in Bitcoin ETF inflows over three sessions, combined with forced short covering, accelerated the move higher. Technically, Bitcoin has successfully broken above the 200 EMA on the weekly chart and is now approaching the Resistance Zone, the Potential Reversal Zone (PRZ), and the Cumulative Short Liquidation Leverage ($75,200-$74,000). There is also potential to fill the CME Gap ($75,455-$74,830). From an Elliott Wave perspective, BTC appears to be completing Sub-Wave 5 of Primary Wave 5. A Negative Regular Divergence is visible between consecutive peaks, while price is rising against weakening volume — a common warning that bullish momentum may be fading. I expect Bitcoin to need at least a correction before continuing its broader bullish trend. This pullback could begin around the PRZ and Short Liquidation zone, with an initial target of $72,200. Stronger momentum could extend the correction toward the Cumulative Long Liquidation area. 🎯 First Target: $72,200 🎯 Second Target: $71,100-$70,560 🛑 Stop Loss: $75,500 (Worst case) Key level to watch: $70,000 Full chart with detailed levels and analysis here 👇 https://www.tradingview.com/chart/BTCUSDT/g6rKSSOp-Bitcoin-Near-a-Major-PRZ-Correction-Before-the-Next-Rally/ Do you think Bitcoin needs a correction before pushing higher, or can it extend the rally above $76,000 first?
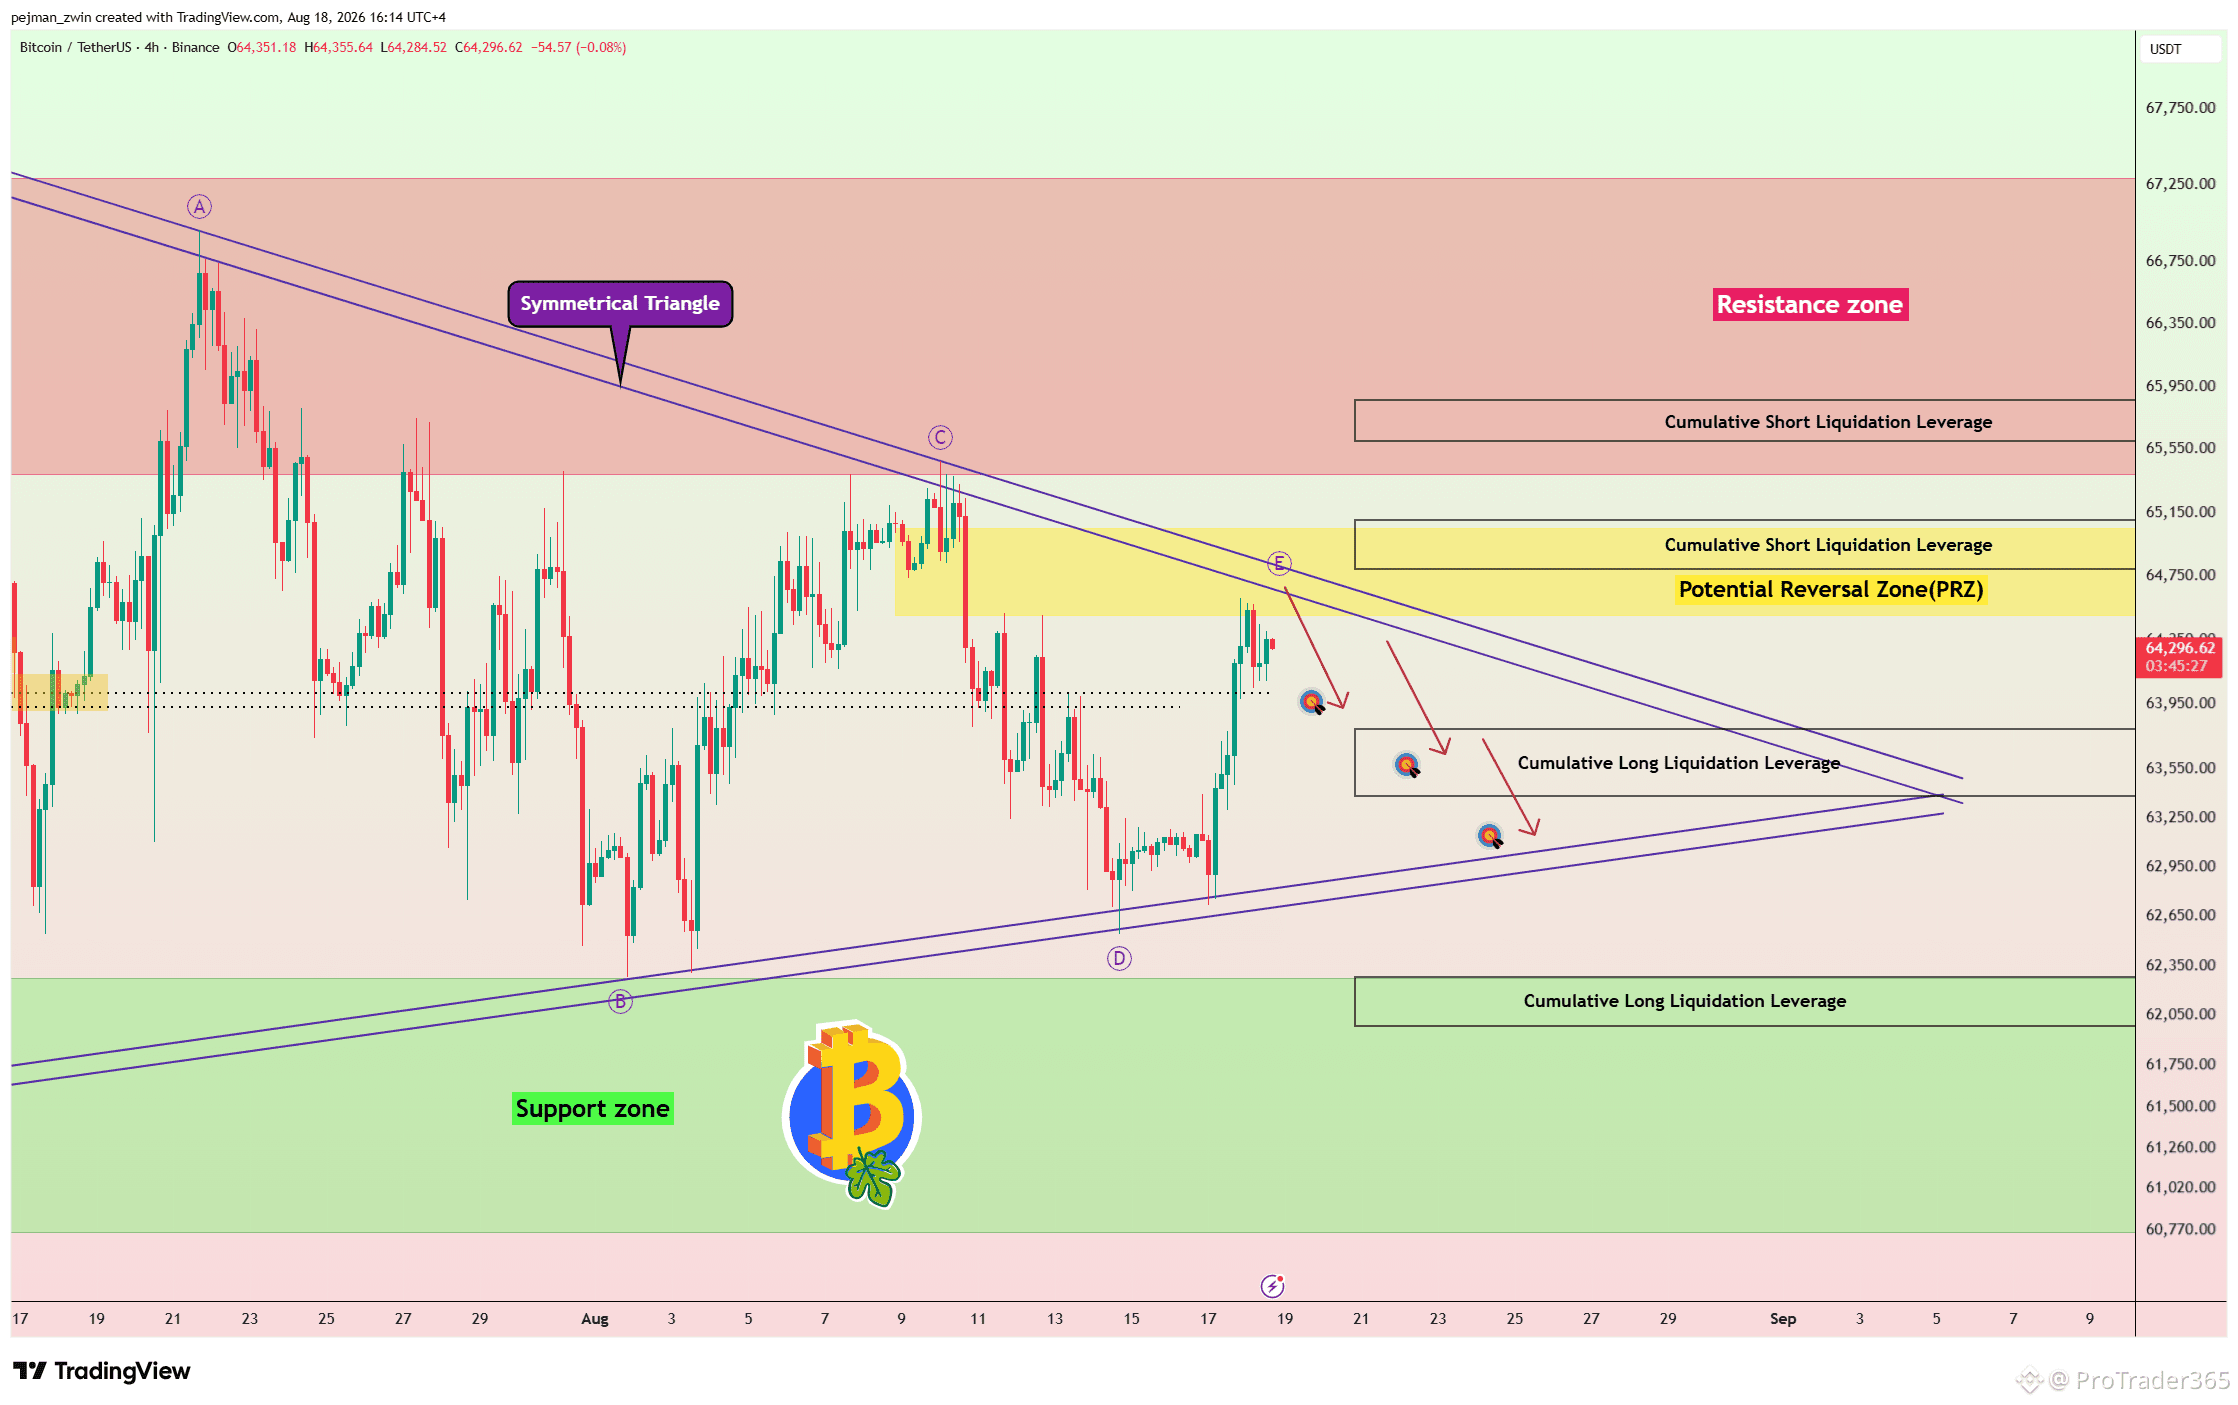
Bitcoin Tests the Triangle Top — Are Bears About to Return? As expected in my previous ideas, $BTC rebounded from the lower trendline of the Symmetrical Triangle and started a bullish move. BTC is now trading near the Potential Reversal Zone (PRZ), the Cumulative Short Liquidation Leverage, and the upper trendline of the Symmetrical Triangle — an important technical confluence. I expect Bitcoin to begin another bearish move after testing the upper trendline of the Symmetrical Triangle and decline at least toward the key level of $64,000. If BTC successfully breaks below $64,000, the decline could extend toward the Cumulative Long Liquidation Leverage zone. 🎯 First Target: $64,103 🎯 Second Target: $63,790-$63,380 🛑 Stop Loss: $65,140 (Worst case) Key level to watch: $64,000 Full chart with detailed levels and analysis here 👇 https://www.tradingview.com/chart/BTCUSDT/T3rEh63t-Bitcoin-Tests-the-Triangle-Top-Are-Bears-About-to-Return/ Which level do you think Bitcoin will reach first? 🔴 $63,790 🟢 $65,140
ເຂົ້າສູ່ລະບົບເພື່ອສຳຫຼວດເນື້ອຫາເພີ່ມເຕີມ