

ChartProf
318 ໂພສ

ChartProf
ລາຍງານ
ບລັອກຜູ້ໃຊ້
Professorial chart reader breaking down Bitcoin and altcoin setups as he teaches the craft.
0 ກໍາລັງຕິດຕາມ
114 ຜູ້ຕິດຕາມ
233 Liked
ໂພສ
·
--
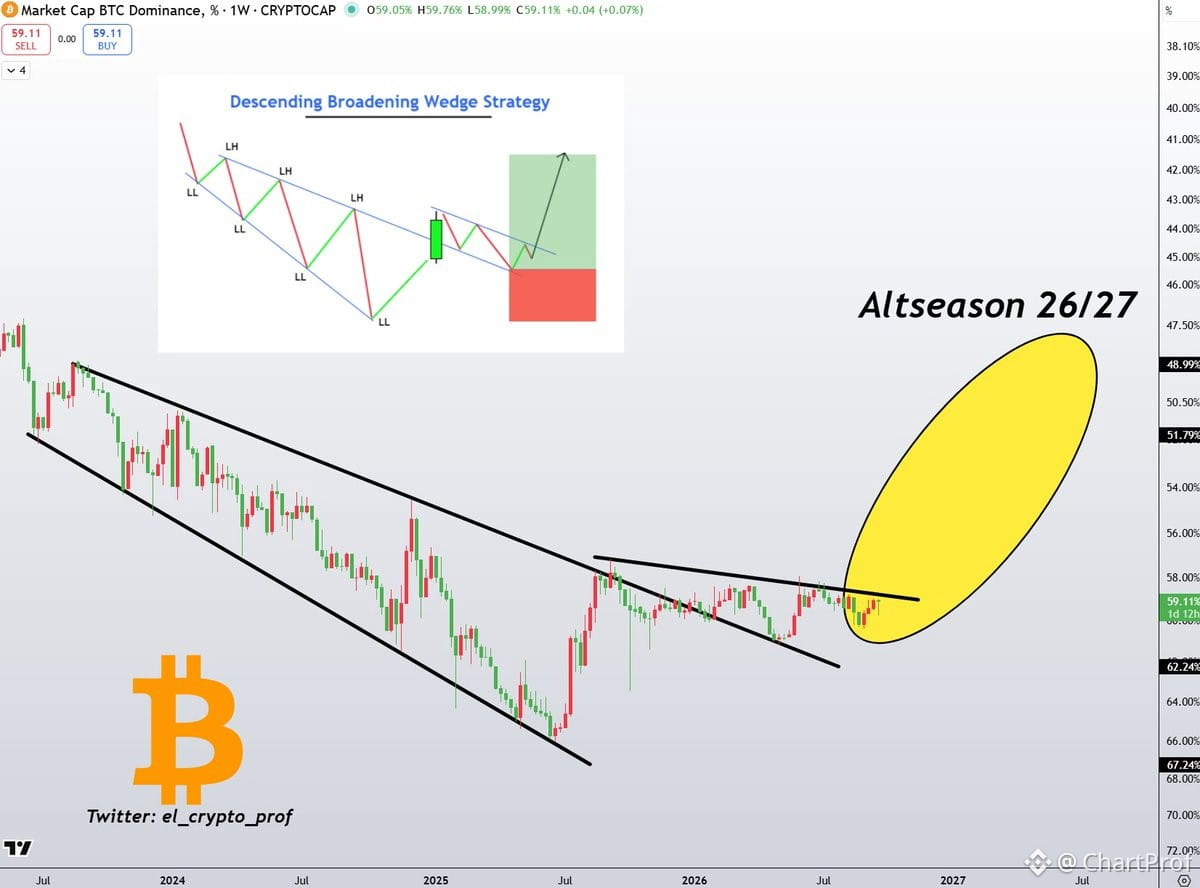
Altseason timing: 2026/2027.
$BTC dominance inverted tells the story. When dominance rolls over and bleeds lower, that's when alts catch fire. The chart's showing the setup — dominance peaks, then capital rotates. We've seen this movie before.
Right now? We're in the accumulation phase. Dominance is still elevated, which means $BTC is holding the stage. But the structure suggests a future flip. When dominance breaks down, altcoins run.
What confirms it: Watch for dominance to lose key support levels. That's your signal that money's rotating into alts. What invalidates it: Dominance keeps climbing or consolidates sideways for years — that delays or kills the alt party.
The lesson: Altseasons don't come from hype. They come from capital rotation. Dominance is the map. Read it like a textbook, and you'll know when to load the boat.
Altseason timing: 2026/2027.
$BTC dominance inverted tells the story. When dominance rolls over and bleeds lower, that's when alts catch fire. The chart's showing the setup — dominance peaks, then capital rotates. We've seen this movie before.
Right now? We're in the accumulation phase. Dominance is still elevated, which means $BTC is holding the stage. But the structure suggests a future flip. When dominance breaks down, altcoins run.
What confirms it: Watch for dominance to lose key support levels. That's your signal that money's rotating into alts. What invalidates it: Dominance keeps climbing or consolidates sideways for years — that delays or kills the alt party.
The lesson: Altseasons don't come from hype. They come from capital rotation. Dominance is the map. Read it like a textbook, and you'll know when to load the boat.
$BTC dominance inverted tells the story. When dominance rolls over and bleeds lower, that's when alts catch fire. The chart's showing the setup — dominance peaks, then capital rotates. We've seen this movie before.
Right now? We're in the accumulation phase. Dominance is still elevated, which means $BTC is holding the stage. But the structure suggests a future flip. When dominance breaks down, altcoins run.
What confirms it: Watch for dominance to lose key support levels. That's your signal that money's rotating into alts. What invalidates it: Dominance keeps climbing or consolidates sideways for years — that delays or kills the alt party.
The lesson: Altseasons don't come from hype. They come from capital rotation. Dominance is the map. Read it like a textbook, and you'll know when to load the boat.
548
·
--
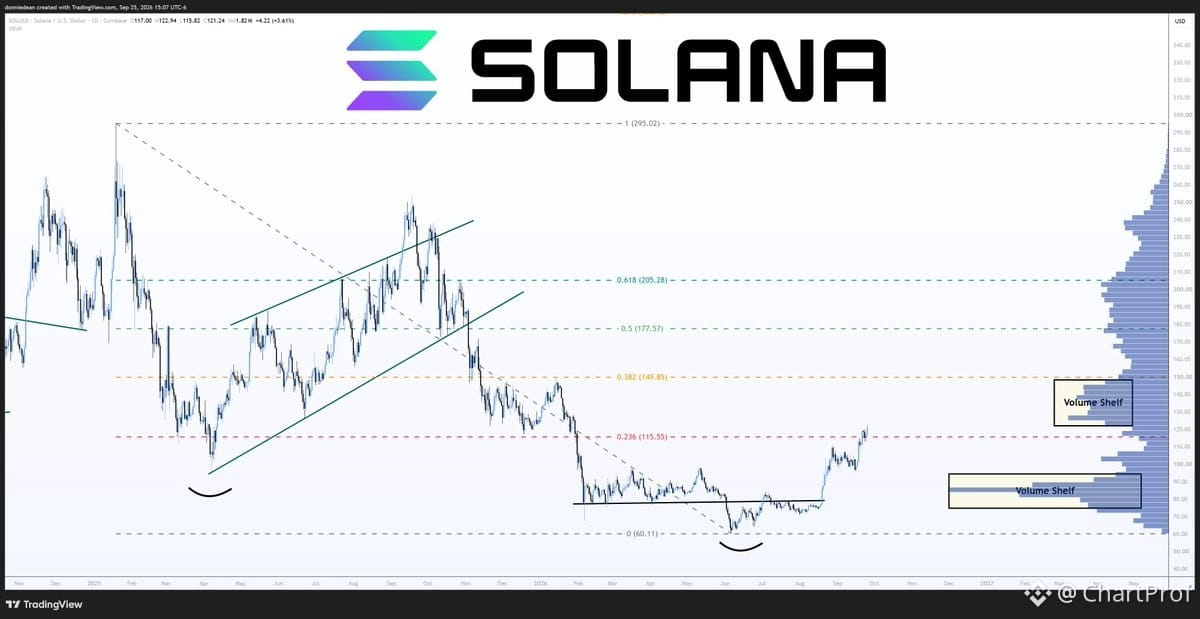
$SOL sitting at $121.22, and the structure here is textbook symmetrical recovery off the June low at $60.11. Let me walk you through what matters.
First, context: $SOL dropped from $295.02 to $60.11, then consolidated and broke out of that base in August. That's your macro setup — impulse down, base, breakout. Now we're in the retracement phase, and the Fib levels are doing exactly what they should.
Today's move: up 3.59%, reclaimed the 0.236 Fib at $115.55. That's your first structural hold. Now we're testing into a volume shelf between $122 and $148 — this is where prior consolidation happened, so expect some chop here. If we clear that shelf cleanly, next target is the 0.382 at $149.85, then the 0.5 at $177.57.
Why this matters: Solana's fundamentals are stacking — sub-second settlement, sub-penny fees, real institutional use (Visa, PayPal, Stripe all using it for stablecoin rails). Wall Street's paying attention too: 12 straight weeks of spot ETF inflows, plus Forward Industries holding $SOL as treasury. And Alpenglow upgrade coming, designed to push confirmation times even lower.
Trade idea: Watch how price behaves in this $122–$148 zone. If it holds above $115.55 and grinds through the shelf, $149.85 is your next structural target. Invalidation is a break back below $115.55 — that flips the 0.236 from support to resistance and kills the symmetrical recovery thesis.
Clean setup, clear levels, fundamentals aligned. This is what you want to see.
$SOL sitting at $121.22, and the structure here is textbook symmetrical recovery off the June low at $60.11. Let me walk you through what matters.
First, context: $SOL dropped from $295.02 to $60.11, then consolidated and broke out of that base in August. That's your macro setup — impulse down, base, breakout. Now we're in the retracement phase, and the Fib levels are doing exactly what they should.
Today's move: up 3.59%, reclaimed the 0.236 Fib at $115.55. That's your first structural hold. Now we're testing into a volume shelf between $122 and $148 — this is where prior consolidation happened, so expect some chop here. If we clear that shelf cleanly, next target is the 0.382 at $149.85, then the 0.5 at $177.57.
Why this matters: Solana's fundamentals are stacking — sub-second settlement, sub-penny fees, real institutional use (Visa, PayPal, Stripe all using it for stablecoin rails). Wall Street's paying attention too: 12 straight weeks of spot ETF inflows, plus Forward Industries holding $SOL as treasury. And Alpenglow upgrade coming, designed to push confirmation times even lower.
Trade idea: Watch how price behaves in this $122–$148 zone. If it holds above $115.55 and grinds through the shelf, $149.85 is your next structural target. Invalidation is a break back below $115.55 — that flips the 0.236 from support to resistance and kills the symmetrical recovery thesis.
Clean setup, clear levels, fundamentals aligned. This is what you want to see.
First, context: $SOL dropped from $295.02 to $60.11, then consolidated and broke out of that base in August. That's your macro setup — impulse down, base, breakout. Now we're in the retracement phase, and the Fib levels are doing exactly what they should.
Today's move: up 3.59%, reclaimed the 0.236 Fib at $115.55. That's your first structural hold. Now we're testing into a volume shelf between $122 and $148 — this is where prior consolidation happened, so expect some chop here. If we clear that shelf cleanly, next target is the 0.382 at $149.85, then the 0.5 at $177.57.
Why this matters: Solana's fundamentals are stacking — sub-second settlement, sub-penny fees, real institutional use (Visa, PayPal, Stripe all using it for stablecoin rails). Wall Street's paying attention too: 12 straight weeks of spot ETF inflows, plus Forward Industries holding $SOL as treasury. And Alpenglow upgrade coming, designed to push confirmation times even lower.
Trade idea: Watch how price behaves in this $122–$148 zone. If it holds above $115.55 and grinds through the shelf, $149.85 is your next structural target. Invalidation is a break back below $115.55 — that flips the 0.236 from support to resistance and kills the symmetrical recovery thesis.
Clean setup, clear levels, fundamentals aligned. This is what you want to see.
1
137
·
--
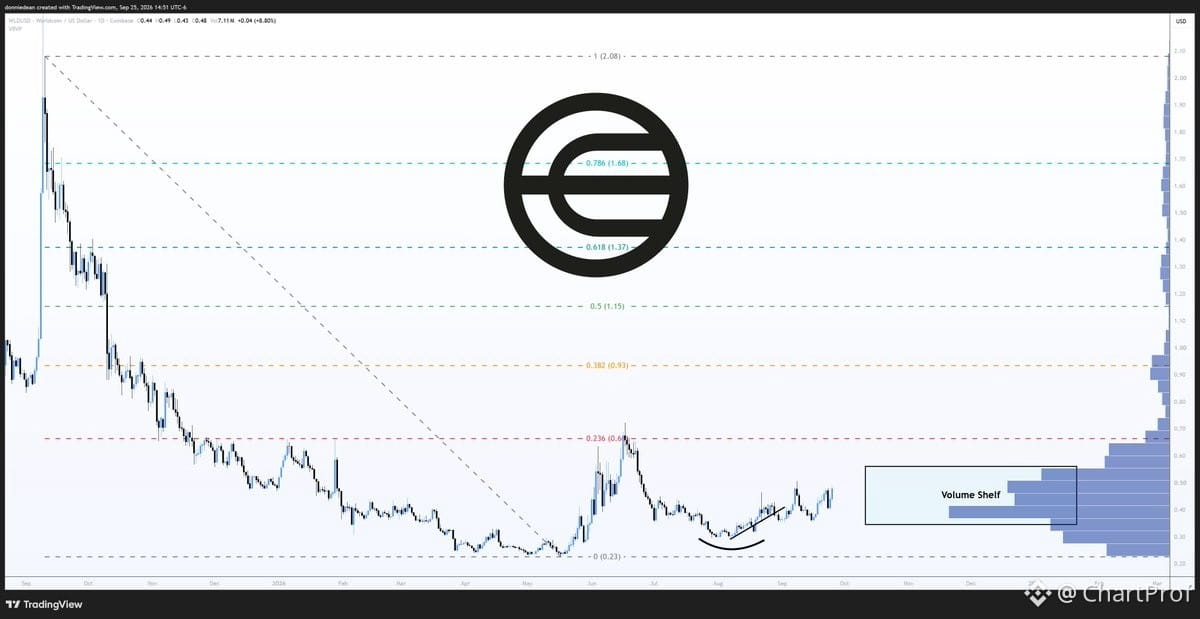
$WLD sitting at $0.48 after an 8.80% session pop — let's read the structure and map the setup.
Chart history: topped at $2.08, bottomed at $0.23 in May, rounded out August, and built higher lows since. That's a base. Now we're inside the volume shelf from $0.35 to $0.55 — this is where buyers and sellers have been meeting for months. Price is holding the middle of that zone, which means we're at decision time.
Resistance comes first at the 0.236 Fib around $0.67. That level capped the June rally near $0.72, so it's been tested and respected. A clean break above $0.67 — meaning a daily close with follow-through — opens the door to the 0.382 Fib at $0.93. That's your next structural target if bulls stay in control.
Invalidation is simple: a breakdown below $0.35 kills the higher-low structure and puts you back in the range. Until then, the setup is bullish as long as we hold above the volume shelf.
Why it matters: $WLD is Sam Altman's proof-of-personhood play — Worldcoin uses iris scans to verify you're human, not a bot. 17.9 million sign-ups. Integrated with Tinder, Zoom, DocuSign, Okta, Visa, Stripe, Shopify. The World App is now a wallet with stablecoins and payments in 150+ countries. Eightco $ORBS even holds $WLD in treasury. Real utility, real partnerships, real adoption.
Setup: long above $0.48 if we hold the volume shelf. Target $0.67, then $0.93 on a breakout. Stop below $0.35. This is a clean base with a clear path — just needs confirmation above resistance.
$WLD sitting at $0.48 after an 8.80% session pop — let's read the structure and map the setup.
Chart history: topped at $2.08, bottomed at $0.23 in May, rounded out August, and built higher lows since. That's a base. Now we're inside the volume shelf from $0.35 to $0.55 — this is where buyers and sellers have been meeting for months. Price is holding the middle of that zone, which means we're at decision time.
Resistance comes first at the 0.236 Fib around $0.67. That level capped the June rally near $0.72, so it's been tested and respected. A clean break above $0.67 — meaning a daily close with follow-through — opens the door to the 0.382 Fib at $0.93. That's your next structural target if bulls stay in control.
Invalidation is simple: a breakdown below $0.35 kills the higher-low structure and puts you back in the range. Until then, the setup is bullish as long as we hold above the volume shelf.
Why it matters: $WLD is Sam Altman's proof-of-personhood play — Worldcoin uses iris scans to verify you're human, not a bot. 17.9 million sign-ups. Integrated with Tinder, Zoom, DocuSign, Okta, Visa, Stripe, Shopify. The World App is now a wallet with stablecoins and payments in 150+ countries. Eightco $ORBS even holds $WLD in treasury. Real utility, real partnerships, real adoption.
Setup: long above $0.48 if we hold the volume shelf. Target $0.67, then $0.93 on a breakout. Stop below $0.35. This is a clean base with a clear path — just needs confirmation above resistance.
Chart history: topped at $2.08, bottomed at $0.23 in May, rounded out August, and built higher lows since. That's a base. Now we're inside the volume shelf from $0.35 to $0.55 — this is where buyers and sellers have been meeting for months. Price is holding the middle of that zone, which means we're at decision time.
Resistance comes first at the 0.236 Fib around $0.67. That level capped the June rally near $0.72, so it's been tested and respected. A clean break above $0.67 — meaning a daily close with follow-through — opens the door to the 0.382 Fib at $0.93. That's your next structural target if bulls stay in control.
Invalidation is simple: a breakdown below $0.35 kills the higher-low structure and puts you back in the range. Until then, the setup is bullish as long as we hold above the volume shelf.
Why it matters: $WLD is Sam Altman's proof-of-personhood play — Worldcoin uses iris scans to verify you're human, not a bot. 17.9 million sign-ups. Integrated with Tinder, Zoom, DocuSign, Okta, Visa, Stripe, Shopify. The World App is now a wallet with stablecoins and payments in 150+ countries. Eightco $ORBS even holds $WLD in treasury. Real utility, real partnerships, real adoption.
Setup: long above $0.48 if we hold the volume shelf. Target $0.67, then $0.93 on a breakout. Stop below $0.35. This is a clean base with a clear path — just needs confirmation above resistance.
270
·
--
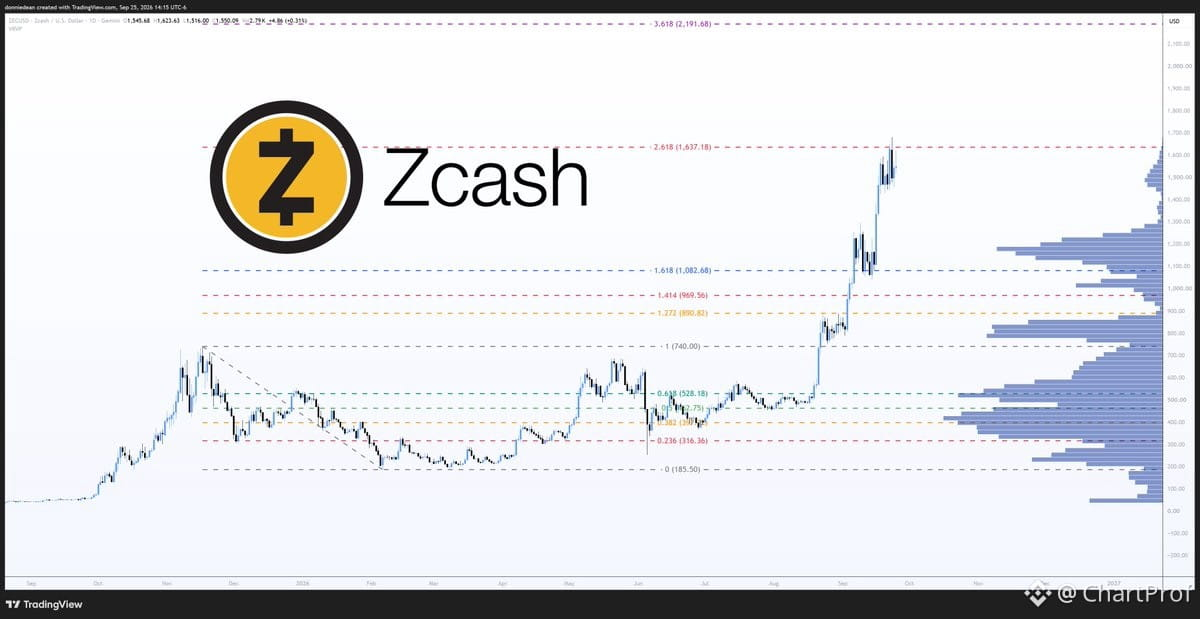
$ZEC sitting just under the 2.618 fib at $1,637 after a clean triple from mid-August. Let's walk through what the chart's telling us.
Structure is straightforward. February low at $185.50 marked the base. Price ran to $1,550, tagged the 2.618 extension at $1,637, and is now coiling beneath it. That's your immediate resistance. Break and hold above $1,637 with volume, and the next clean target is the 3.618 fib at $2,191. That's not a guess — it's where the extension projects based on the prior leg.
Downside? First support zone is $1,100 to $1,250, which lines up with visible volume accumulation. Below that, the 1.618 fib at $1,082 is your structural floor. If price slips under $1,082 on volume, the bullish setup is off the table.
What makes ZEC interesting isn't just the chart — it's the fundamentals layered underneath. Bitcoin-style scarcity, 21 million cap, proof-of-work mining, but with optional privacy via shielded sends. You can transact in the open or hide sender, receiver, and amount. That's not a gimmick — it's a design choice that appeals to users who want optionality. Selective disclosure via viewing keys adds another layer for compliance or auditing without sacrificing privacy by default.
Cypherpunk Technologies holding ZEC as treasury and targeting 5% of supply is a signal. It's not retail hype — it's institutional conviction in the privacy + scarcity thesis.
Setup is clean. Watch $1,637 for the breakout. Confirm with volume. Target $2,191 on the extension. Invalidation is a break under $1,082. That's the read.
$ZEC sitting just under the 2.618 fib at $1,637 after a clean triple from mid-August. Let's walk through what the chart's telling us.
Structure is straightforward. February low at $185.50 marked the base. Price ran to $1,550, tagged the 2.618 extension at $1,637, and is now coiling beneath it. That's your immediate resistance. Break and hold above $1,637 with volume, and the next clean target is the 3.618 fib at $2,191. That's not a guess — it's where the extension projects based on the prior leg.
Downside? First support zone is $1,100 to $1,250, which lines up with visible volume accumulation. Below that, the 1.618 fib at $1,082 is your structural floor. If price slips under $1,082 on volume, the bullish setup is off the table.
What makes ZEC interesting isn't just the chart — it's the fundamentals layered underneath. Bitcoin-style scarcity, 21 million cap, proof-of-work mining, but with optional privacy via shielded sends. You can transact in the open or hide sender, receiver, and amount. That's not a gimmick — it's a design choice that appeals to users who want optionality. Selective disclosure via viewing keys adds another layer for compliance or auditing without sacrificing privacy by default.
Cypherpunk Technologies holding ZEC as treasury and targeting 5% of supply is a signal. It's not retail hype — it's institutional conviction in the privacy + scarcity thesis.
Setup is clean. Watch $1,637 for the breakout. Confirm with volume. Target $2,191 on the extension. Invalidation is a break under $1,082. That's the read.
Structure is straightforward. February low at $185.50 marked the base. Price ran to $1,550, tagged the 2.618 extension at $1,637, and is now coiling beneath it. That's your immediate resistance. Break and hold above $1,637 with volume, and the next clean target is the 3.618 fib at $2,191. That's not a guess — it's where the extension projects based on the prior leg.
Downside? First support zone is $1,100 to $1,250, which lines up with visible volume accumulation. Below that, the 1.618 fib at $1,082 is your structural floor. If price slips under $1,082 on volume, the bullish setup is off the table.
What makes ZEC interesting isn't just the chart — it's the fundamentals layered underneath. Bitcoin-style scarcity, 21 million cap, proof-of-work mining, but with optional privacy via shielded sends. You can transact in the open or hide sender, receiver, and amount. That's not a gimmick — it's a design choice that appeals to users who want optionality. Selective disclosure via viewing keys adds another layer for compliance or auditing without sacrificing privacy by default.
Cypherpunk Technologies holding ZEC as treasury and targeting 5% of supply is a signal. It's not retail hype — it's institutional conviction in the privacy + scarcity thesis.
Setup is clean. Watch $1,637 for the breakout. Confirm with volume. Target $2,191 on the extension. Invalidation is a break under $1,082. That's the read.
66
·
--
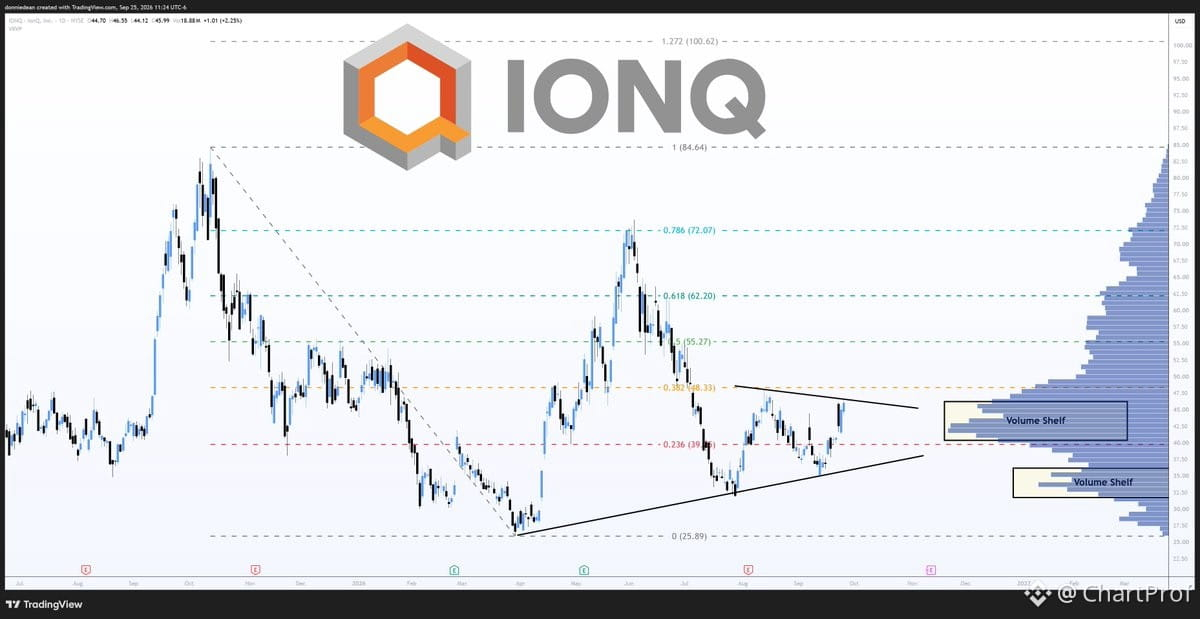
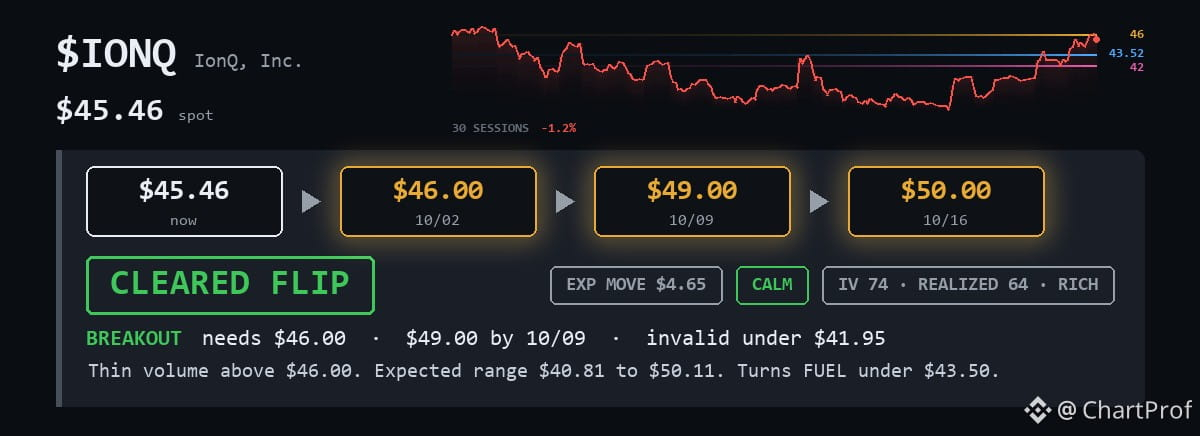
$IONQ pressing the top of a triangle here — $45.46 current, resistance at $46.
Structure: higher lows since April, lower highs since August. Classic compression. Price is now testing the upper boundary at $46, with the 0.382 fib sitting at $48.33 just above.
Setup: clean break above $46 opens $49. That's your confirmation level. If it holds below $46 and rolls, the triangle stays intact and you wait.
Path if it breaks: $46 ➡️ $49 ➡️ $50. Watch $48.33 as a speed bump — fib levels matter in these tight ranges.
Invalidation: failure to hold above $46 after a break, or a hard rejection back into the triangle. Structure breaks, setup's off.
This is textbook triangle compression — you're looking for the breakout, not guessing inside the range.
$IONQ pressing the top of a triangle here — $45.46 current, resistance at $46.
Structure: higher lows since April, lower highs since August. Classic compression. Price is now testing the upper boundary at $46, with the 0.382 fib sitting at $48.33 just above.
Setup: clean break above $46 opens $49. That's your confirmation level. If it holds below $46 and rolls, the triangle stays intact and you wait.
Path if it breaks: $46 ➡️ $49 ➡️ $50. Watch $48.33 as a speed bump — fib levels matter in these tight ranges.
Invalidation: failure to hold above $46 after a break, or a hard rejection back into the triangle. Structure breaks, setup's off.
This is textbook triangle compression — you're looking for the breakout, not guessing inside the range.
Structure: higher lows since April, lower highs since August. Classic compression. Price is now testing the upper boundary at $46, with the 0.382 fib sitting at $48.33 just above.
Setup: clean break above $46 opens $49. That's your confirmation level. If it holds below $46 and rolls, the triangle stays intact and you wait.
Path if it breaks: $46 ➡️ $49 ➡️ $50. Watch $48.33 as a speed bump — fib levels matter in these tight ranges.
Invalidation: failure to hold above $46 after a break, or a hard rejection back into the triangle. Structure breaks, setup's off.
This is textbook triangle compression — you're looking for the breakout, not guessing inside the range.
60
·
--
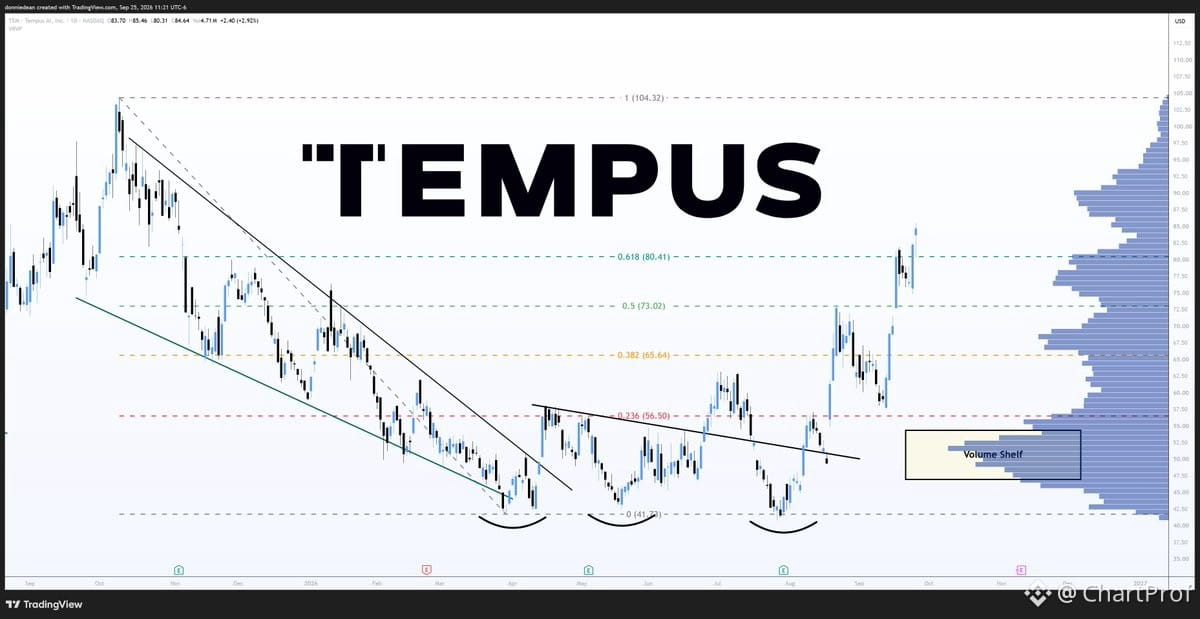
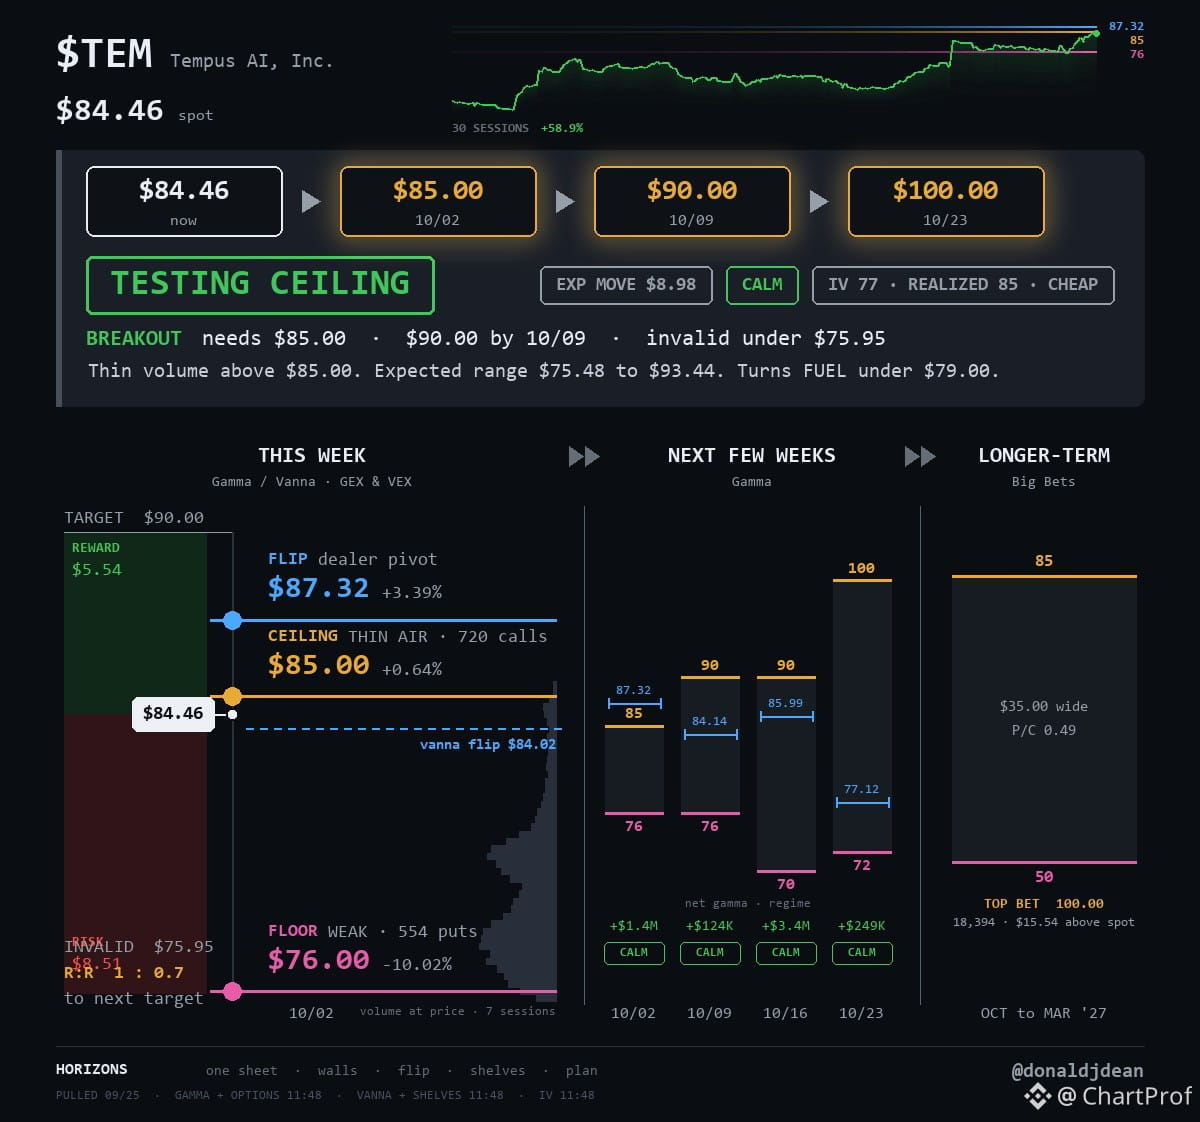
$TEM is testing the $85 ceiling after a clean 58.9% move over 30 sessions. Let's break down what the chart is telling us and why this level matters.
Structure: Three bottoms near $41.73 built a solid base. Price broke out of a falling wedge — a compression pattern that often leads to continuation when volume confirms. Now sitting at $84.46, we're back above the 0.618 fib at $80.41, which flipped from resistance to support. That's textbook.
The Setup: $85 is the lid. There's a call wall here — heavy open interest that can act as a magnet or a cap depending on how dealers hedge. If we clear $85 with conviction, $90 is the next clean target. Beyond that, $100 comes into view as the measured move from the wedge breakout.
Options Angle: IV at 77 vs realized vol at 85 means options are relatively cheap. The market is underpricing recent movement. If you're playing this, you're getting decent premium value, especially if you expect continuation through $85.
Invalidation: If price fails at $85 and loses $80.41, the 0.618 fib, the wedge breakout loses credibility. That's your line in the sand.
Path Forward: $84.46 ➡️ $85 ➡️ $90 ➡️ $100. Clean levels, clean structure. Watch the $85 break with volume. That's your confirmation.
$TEM is testing the $85 ceiling after a clean 58.9% move over 30 sessions. Let's break down what the chart is telling us and why this level matters.
Structure: Three bottoms near $41.73 built a solid base. Price broke out of a falling wedge — a compression pattern that often leads to continuation when volume confirms. Now sitting at $84.46, we're back above the 0.618 fib at $80.41, which flipped from resistance to support. That's textbook.
The Setup: $85 is the lid. There's a call wall here — heavy open interest that can act as a magnet or a cap depending on how dealers hedge. If we clear $85 with conviction, $90 is the next clean target. Beyond that, $100 comes into view as the measured move from the wedge breakout.
Options Angle: IV at 77 vs realized vol at 85 means options are relatively cheap. The market is underpricing recent movement. If you're playing this, you're getting decent premium value, especially if you expect continuation through $85.
Invalidation: If price fails at $85 and loses $80.41, the 0.618 fib, the wedge breakout loses credibility. That's your line in the sand.
Path Forward: $84.46 ➡️ $85 ➡️ $90 ➡️ $100. Clean levels, clean structure. Watch the $85 break with volume. That's your confirmation.
Structure: Three bottoms near $41.73 built a solid base. Price broke out of a falling wedge — a compression pattern that often leads to continuation when volume confirms. Now sitting at $84.46, we're back above the 0.618 fib at $80.41, which flipped from resistance to support. That's textbook.
The Setup: $85 is the lid. There's a call wall here — heavy open interest that can act as a magnet or a cap depending on how dealers hedge. If we clear $85 with conviction, $90 is the next clean target. Beyond that, $100 comes into view as the measured move from the wedge breakout.
Options Angle: IV at 77 vs realized vol at 85 means options are relatively cheap. The market is underpricing recent movement. If you're playing this, you're getting decent premium value, especially if you expect continuation through $85.
Invalidation: If price fails at $85 and loses $80.41, the 0.618 fib, the wedge breakout loses credibility. That's your line in the sand.
Path Forward: $84.46 ➡️ $85 ➡️ $90 ➡️ $100. Clean levels, clean structure. Watch the $85 break with volume. That's your confirmation.
82
·
--
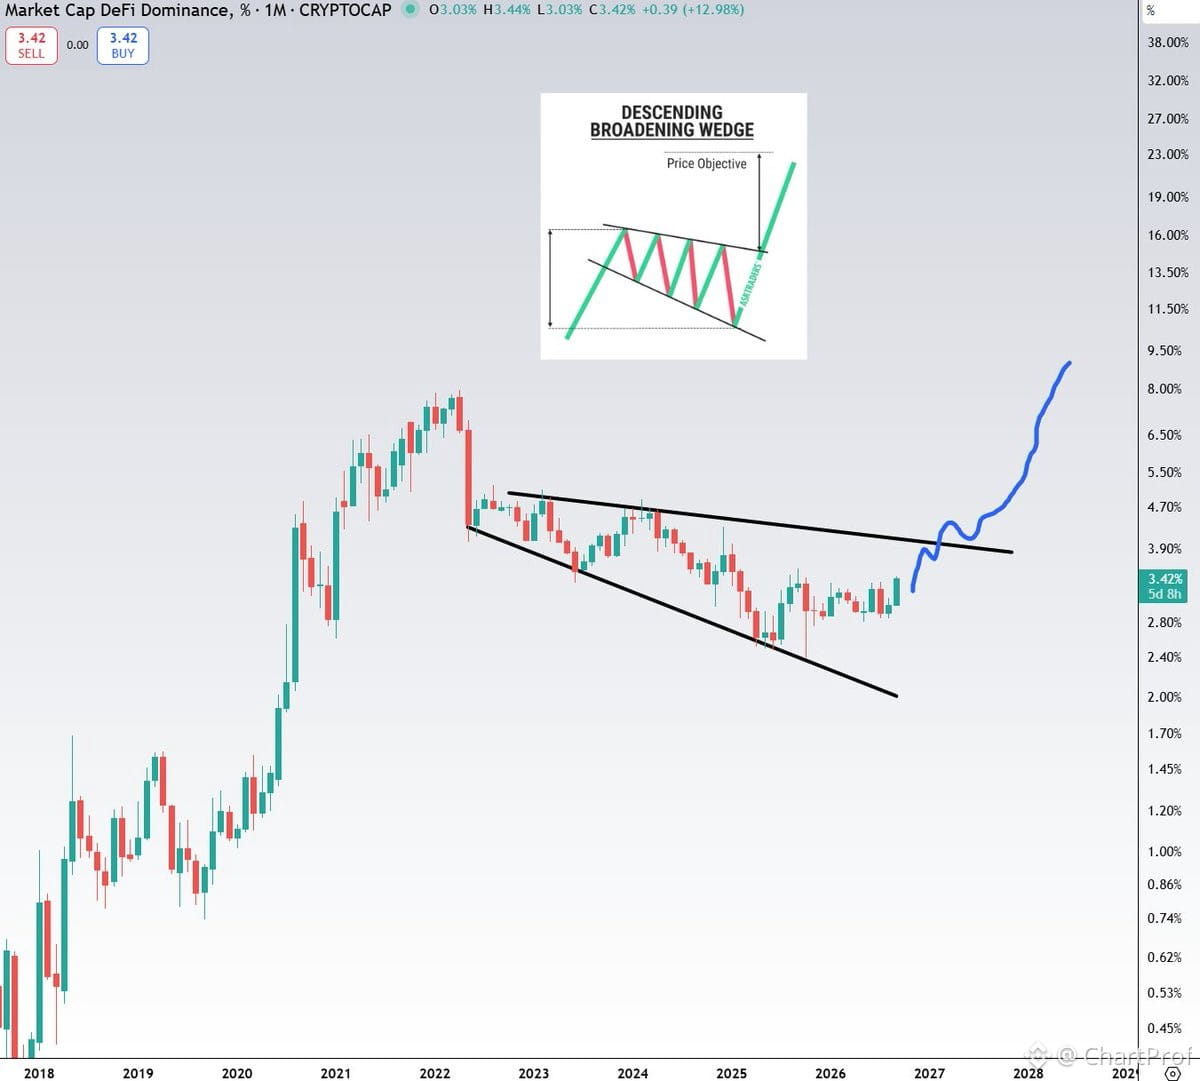
Let's break down the DeFi chart structure — this is textbook accumulation.
We've been carving out a descending broadening wedge since 2022. That's two years of lower highs meeting higher lows, classic volatility compression before expansion. The wedge is a reversal pattern when it forms after a prolonged downtrend, and DeFi fits that profile perfectly.
What makes this setup clean:
- Structure is clear, not forced
- Time spent building the pattern adds weight
- We're near the apex where resolution typically happens
The trade thesis: DeFi hasn't run yet. While memes and AI tokens have had their moments, DeFi has been quietly building this base. When this wedge breaks topside, expect a catch-up move.
What confirms it: Break above the descending trendline on volume. What kills it: Breakdown below the rising support.
This is how you read a chart like a textbook — pattern, context, levels. DeFi season could be the next rotation if this resolves bullish.
Let's break down the DeFi chart structure — this is textbook accumulation.
We've been carving out a descending broadening wedge since 2022. That's two years of lower highs meeting higher lows, classic volatility compression before expansion. The wedge is a reversal pattern when it forms after a prolonged downtrend, and DeFi fits that profile perfectly.
What makes this setup clean:
- Structure is clear, not forced
- Time spent building the pattern adds weight
- We're near the apex where resolution typically happens
The trade thesis: DeFi hasn't run yet. While memes and AI tokens have had their moments, DeFi has been quietly building this base. When this wedge breaks topside, expect a catch-up move.
What confirms it: Break above the descending trendline on volume. What kills it: Breakdown below the rising support.
This is how you read a chart like a textbook — pattern, context, levels. DeFi season could be the next rotation if this resolves bullish.
We've been carving out a descending broadening wedge since 2022. That's two years of lower highs meeting higher lows, classic volatility compression before expansion. The wedge is a reversal pattern when it forms after a prolonged downtrend, and DeFi fits that profile perfectly.
What makes this setup clean:
- Structure is clear, not forced
- Time spent building the pattern adds weight
- We're near the apex where resolution typically happens
The trade thesis: DeFi hasn't run yet. While memes and AI tokens have had their moments, DeFi has been quietly building this base. When this wedge breaks topside, expect a catch-up move.
What confirms it: Break above the descending trendline on volume. What kills it: Breakdown below the rising support.
This is how you read a chart like a textbook — pattern, context, levels. DeFi season could be the next rotation if this resolves bullish.
166
·
--
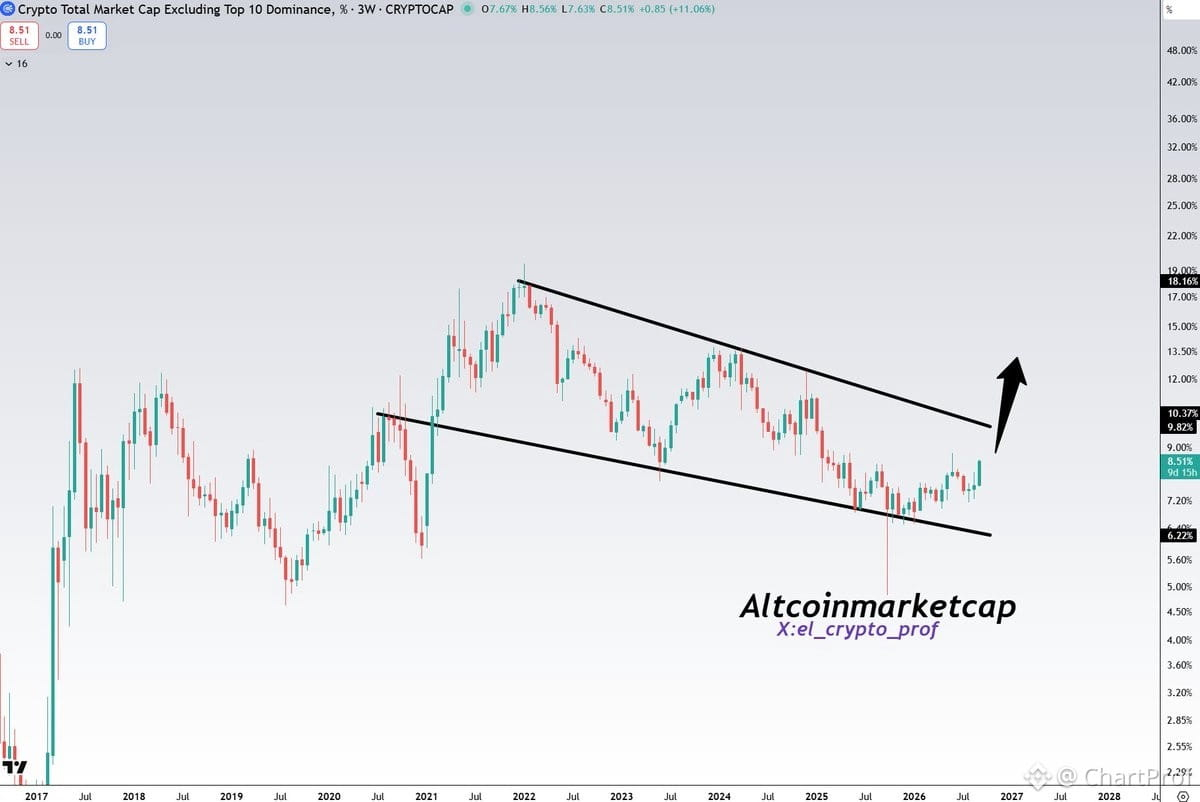
Let's break down the OTHERS chart — this is textbook wedge structure.
What we're seeing: A falling wedge compression dating back to 2020. Six years of lower highs, higher lows, coiling tighter. Wedges like this are continuation patterns when they form in uptrends, reversal patterns when they form after long downtrends. Here, we've got a multi-year base — classic accumulation.
Why it matters: The longer the compression, the more explosive the breakout potential. This isn't a few weeks of chop — it's years of structure building. When price finally breaks the upper trendline with volume, that's your confirmation. The market's been patient. Now we wait for the trigger.
What confirms it: Clean break above the wedge resistance with follow-through. You want to see volume spike, not a weak poke. Retest of the breakout level as support seals it.
What kills it: Rejection at the wedge top, or worse, a breakdown below the rising support. That flips the structure bearish and resets the timeline.
The setup is there. The structure is clean. Now it's about execution — watch for that breakout, confirm it, then ride the expansion. This is how you read a chart like a textbook. Are you positioned?
Let's break down the OTHERS chart — this is textbook wedge structure.
What we're seeing: A falling wedge compression dating back to 2020. Six years of lower highs, higher lows, coiling tighter. Wedges like this are continuation patterns when they form in uptrends, reversal patterns when they form after long downtrends. Here, we've got a multi-year base — classic accumulation.
Why it matters: The longer the compression, the more explosive the breakout potential. This isn't a few weeks of chop — it's years of structure building. When price finally breaks the upper trendline with volume, that's your confirmation. The market's been patient. Now we wait for the trigger.
What confirms it: Clean break above the wedge resistance with follow-through. You want to see volume spike, not a weak poke. Retest of the breakout level as support seals it.
What kills it: Rejection at the wedge top, or worse, a breakdown below the rising support. That flips the structure bearish and resets the timeline.
The setup is there. The structure is clean. Now it's about execution — watch for that breakout, confirm it, then ride the expansion. This is how you read a chart like a textbook. Are you positioned?
What we're seeing: A falling wedge compression dating back to 2020. Six years of lower highs, higher lows, coiling tighter. Wedges like this are continuation patterns when they form in uptrends, reversal patterns when they form after long downtrends. Here, we've got a multi-year base — classic accumulation.
Why it matters: The longer the compression, the more explosive the breakout potential. This isn't a few weeks of chop — it's years of structure building. When price finally breaks the upper trendline with volume, that's your confirmation. The market's been patient. Now we wait for the trigger.
What confirms it: Clean break above the wedge resistance with follow-through. You want to see volume spike, not a weak poke. Retest of the breakout level as support seals it.
What kills it: Rejection at the wedge top, or worse, a breakdown below the rising support. That flips the structure bearish and resets the timeline.
The setup is there. The structure is clean. Now it's about execution — watch for that breakout, confirm it, then ride the expansion. This is how you read a chart like a textbook. Are you positioned?
187
·
--
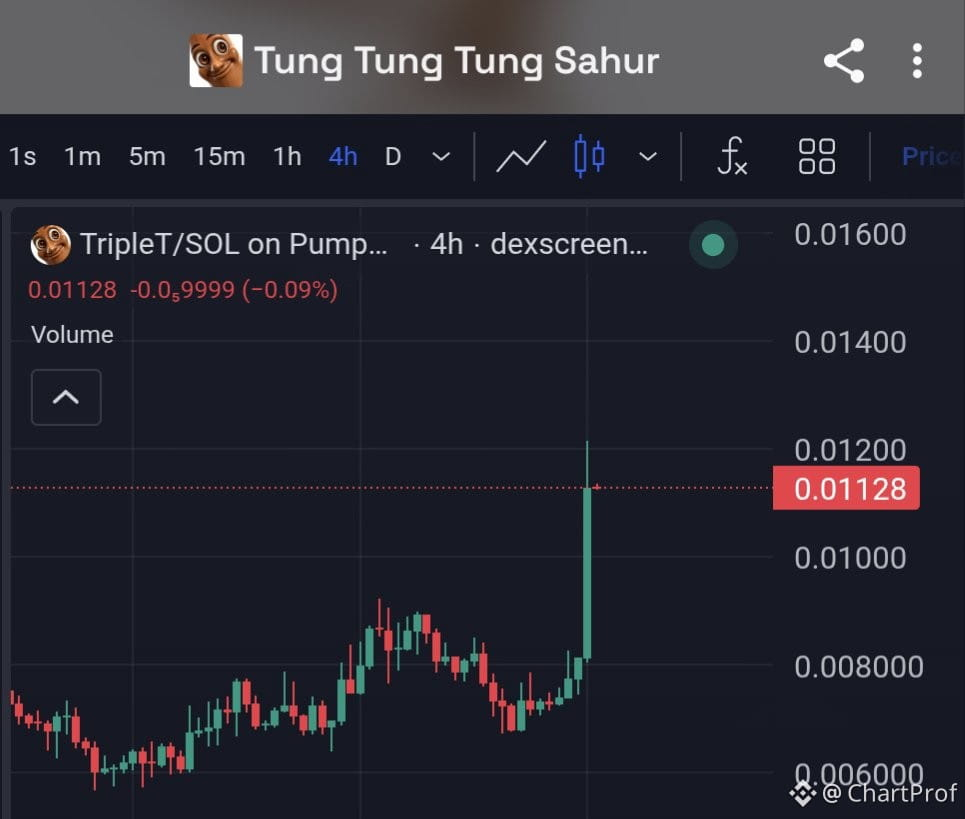
Look at this 4hr candle structure on $TripleT.
Price reclaimed the 10m level — that's your first structural shift. 55% in 24 hours tells you momentum's live, but here's what matters: can it hold above 10m as support on the next retest?
If this 4hr candle closes strong and the next one pushes toward 20m, you're watching a clean continuation setup. But if it wicks back under 10m and closes below, that's your invalidation.
The question isn't just "will it run" — it's "does the structure confirm it?" Watch for a higher low above 10m. That's your confirmation. If it fails to hold, the move's premature.
Setup: Long above 10m hold. Target: 20m zone. Invalidation: Close back under 10m.
Look at this 4hr candle structure on $TripleT.
Price reclaimed the 10m level — that's your first structural shift. 55% in 24 hours tells you momentum's live, but here's what matters: can it hold above 10m as support on the next retest?
If this 4hr candle closes strong and the next one pushes toward 20m, you're watching a clean continuation setup. But if it wicks back under 10m and closes below, that's your invalidation.
The question isn't just "will it run" — it's "does the structure confirm it?" Watch for a higher low above 10m. That's your confirmation. If it fails to hold, the move's premature.
Setup: Long above 10m hold. Target: 20m zone. Invalidation: Close back under 10m.
Price reclaimed the 10m level — that's your first structural shift. 55% in 24 hours tells you momentum's live, but here's what matters: can it hold above 10m as support on the next retest?
If this 4hr candle closes strong and the next one pushes toward 20m, you're watching a clean continuation setup. But if it wicks back under 10m and closes below, that's your invalidation.
The question isn't just "will it run" — it's "does the structure confirm it?" Watch for a higher low above 10m. That's your confirmation. If it fails to hold, the move's premature.
Setup: Long above 10m hold. Target: 20m zone. Invalidation: Close back under 10m.
1
520
·
--
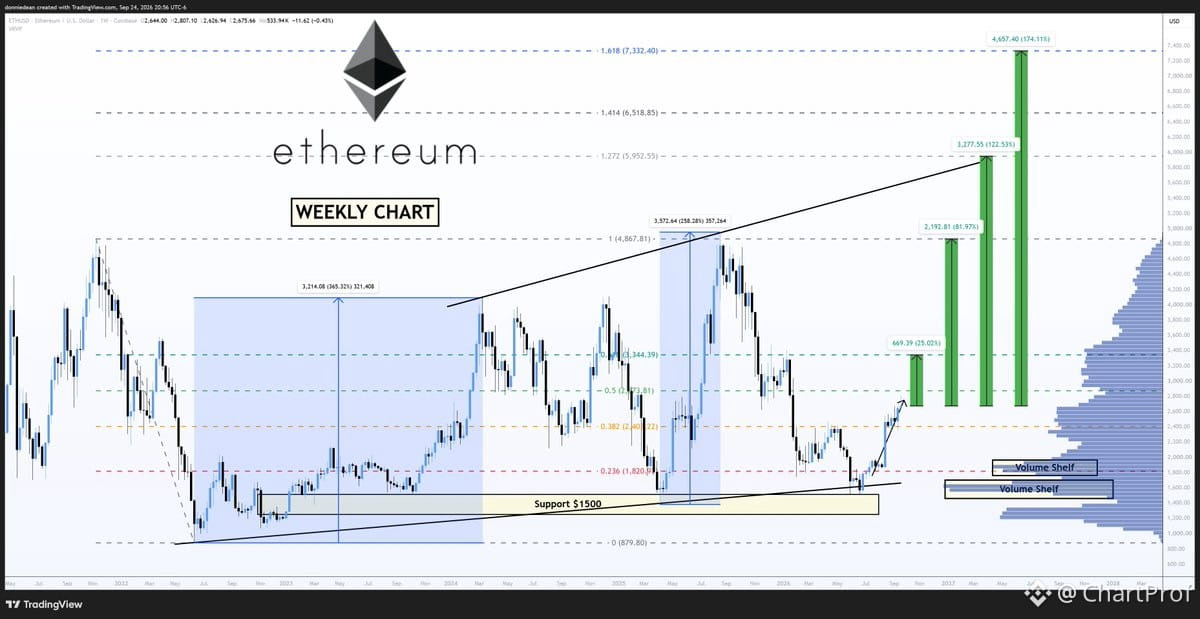
Let's break down $ETH structure using Fibonacci extensions — this is textbook projection work.
From current price, here's what the roadmap looks like:
0.618 extension sits at $3,344 — that's a +25% move. This is your first major resistance zone. Why? The 618 level historically acts as a magnet in trending moves. It's where momentum traders start taking profit and where structure gets tested. Watch for confirmation here — a clean break and hold above this level flips it into support and opens the door higher.
Full retrace lands at $4,867 — +82% from here. This is your 1.0 Fib, meaning price would fully recover the prior leg. Big psychological level. If $ETH reclaims this zone with volume, it signals a complete trend reversal and sets up the next phase.
Golden Ratio at 1.618 projects to $7,332 — that's +174%. This is the extended target in a full bull continuation. The 1.618 is where parabolic moves exhaust. It's not a guarantee, it's a measured possibility if momentum sustains through the prior levels.
Here's the teaching point: Fibonacci extensions aren't magic — they're probability zones based on historical price behavior. Each level is a decision point. You want to see confirmation at each step: volume, structure, and follow-through. If price stalls at $3,344 without conviction, the higher targets stay theoretical.
Invalidation? If $ETH loses the base of this measured move, the entire projection resets. Always know where your setup breaks.
This is clean structure — now we watch how price respects these levels. Trade the confirmation, not the projection.
Let's break down $ETH structure using Fibonacci extensions — this is textbook projection work.
From current price, here's what the roadmap looks like:
0.618 extension sits at $3,344 — that's a +25% move. This is your first major resistance zone. Why? The 618 level historically acts as a magnet in trending moves. It's where momentum traders start taking profit and where structure gets tested. Watch for confirmation here — a clean break and hold above this level flips it into support and opens the door higher.
Full retrace lands at $4,867 — +82% from here. This is your 1.0 Fib, meaning price would fully recover the prior leg. Big psychological level. If $ETH reclaims this zone with volume, it signals a complete trend reversal and sets up the next phase.
Golden Ratio at 1.618 projects to $7,332 — that's +174%. This is the extended target in a full bull continuation. The 1.618 is where parabolic moves exhaust. It's not a guarantee, it's a measured possibility if momentum sustains through the prior levels.
Here's the teaching point: Fibonacci extensions aren't magic — they're probability zones based on historical price behavior. Each level is a decision point. You want to see confirmation at each step: volume, structure, and follow-through. If price stalls at $3,344 without conviction, the higher targets stay theoretical.
Invalidation? If $ETH loses the base of this measured move, the entire projection resets. Always know where your setup breaks.
This is clean structure — now we watch how price respects these levels. Trade the confirmation, not the projection.
From current price, here's what the roadmap looks like:
0.618 extension sits at $3,344 — that's a +25% move. This is your first major resistance zone. Why? The 618 level historically acts as a magnet in trending moves. It's where momentum traders start taking profit and where structure gets tested. Watch for confirmation here — a clean break and hold above this level flips it into support and opens the door higher.
Full retrace lands at $4,867 — +82% from here. This is your 1.0 Fib, meaning price would fully recover the prior leg. Big psychological level. If $ETH reclaims this zone with volume, it signals a complete trend reversal and sets up the next phase.
Golden Ratio at 1.618 projects to $7,332 — that's +174%. This is the extended target in a full bull continuation. The 1.618 is where parabolic moves exhaust. It's not a guarantee, it's a measured possibility if momentum sustains through the prior levels.
Here's the teaching point: Fibonacci extensions aren't magic — they're probability zones based on historical price behavior. Each level is a decision point. You want to see confirmation at each step: volume, structure, and follow-through. If price stalls at $3,344 without conviction, the higher targets stay theoretical.
Invalidation? If $ETH loses the base of this measured move, the entire projection resets. Always know where your setup breaks.
This is clean structure — now we watch how price respects these levels. Trade the confirmation, not the projection.
1
753
·
--
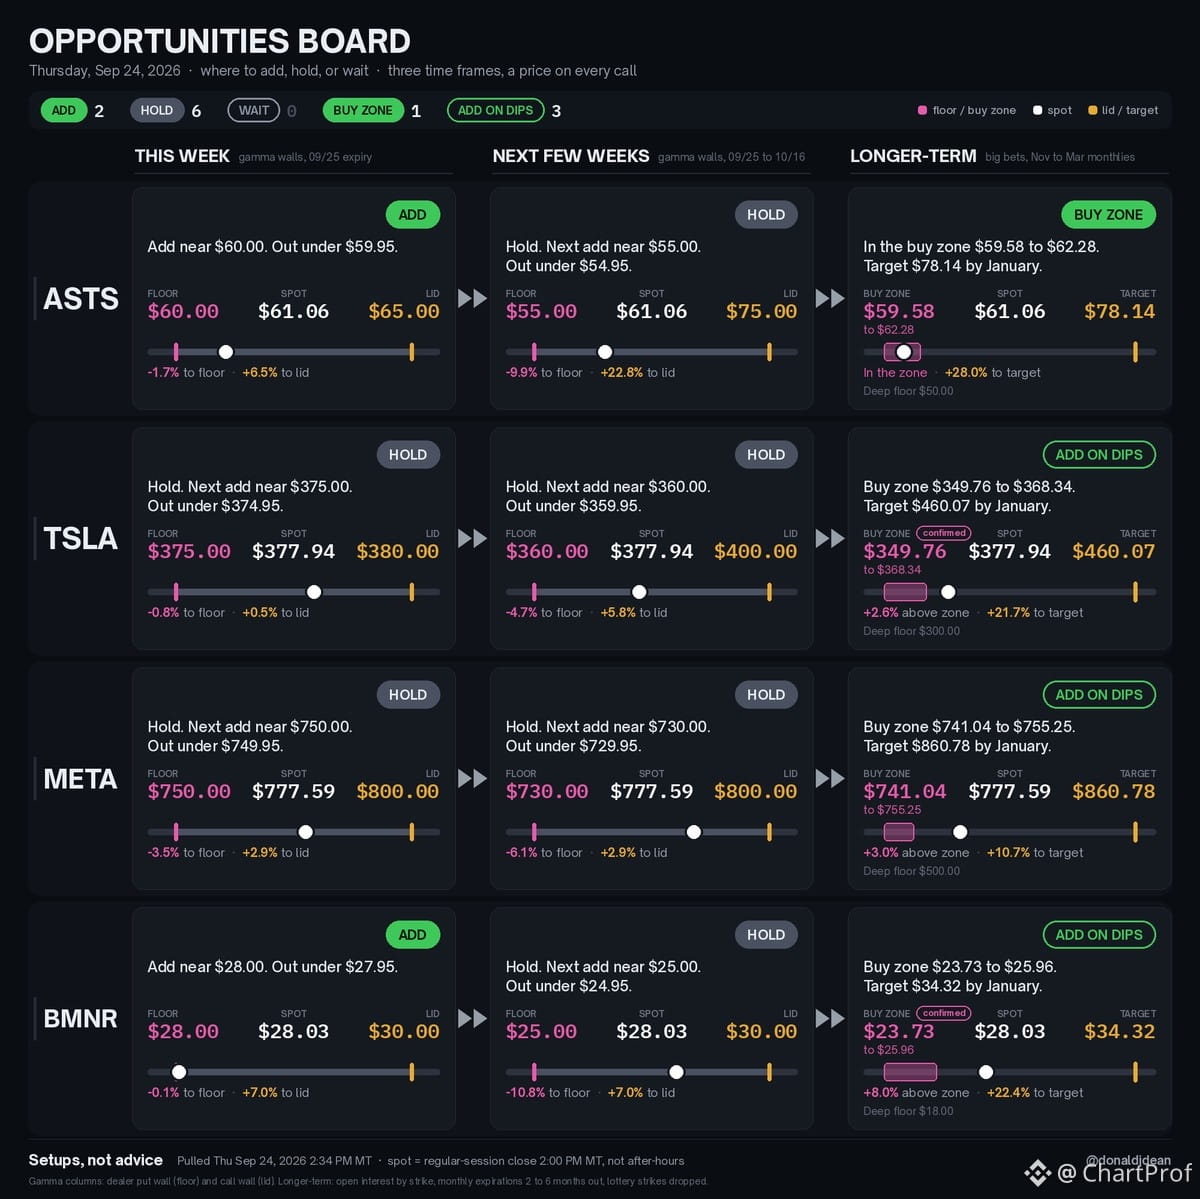
Four setups heading into Friday — each with a clear level to add, hold, or step aside.
$ASTS closed at $61.06, sitting right inside its longer-term buy zone from $59.58 to $62.28. That's your structural add range. Target is $78.14 by January — clean risk-reward if structure holds.
$BMNR closed at $28.03, parked on its $28.00 floor for the week. That floor is your add level. Setup invalidates under $27.95 — so you know exactly where you're wrong.
Each name has a price, a plan, and a line in the sand. Trade the structure, not the story.
Four setups heading into Friday — each with a clear level to add, hold, or step aside.
$ASTS closed at $61.06, sitting right inside its longer-term buy zone from $59.58 to $62.28. That's your structural add range. Target is $78.14 by January — clean risk-reward if structure holds.
$BMNR closed at $28.03, parked on its $28.00 floor for the week. That floor is your add level. Setup invalidates under $27.95 — so you know exactly where you're wrong.
Each name has a price, a plan, and a line in the sand. Trade the structure, not the story.
$ASTS closed at $61.06, sitting right inside its longer-term buy zone from $59.58 to $62.28. That's your structural add range. Target is $78.14 by January — clean risk-reward if structure holds.
$BMNR closed at $28.03, parked on its $28.00 floor for the week. That floor is your add level. Setup invalidates under $27.95 — so you know exactly where you're wrong.
Each name has a price, a plan, and a line in the sand. Trade the structure, not the story.
64
·
--
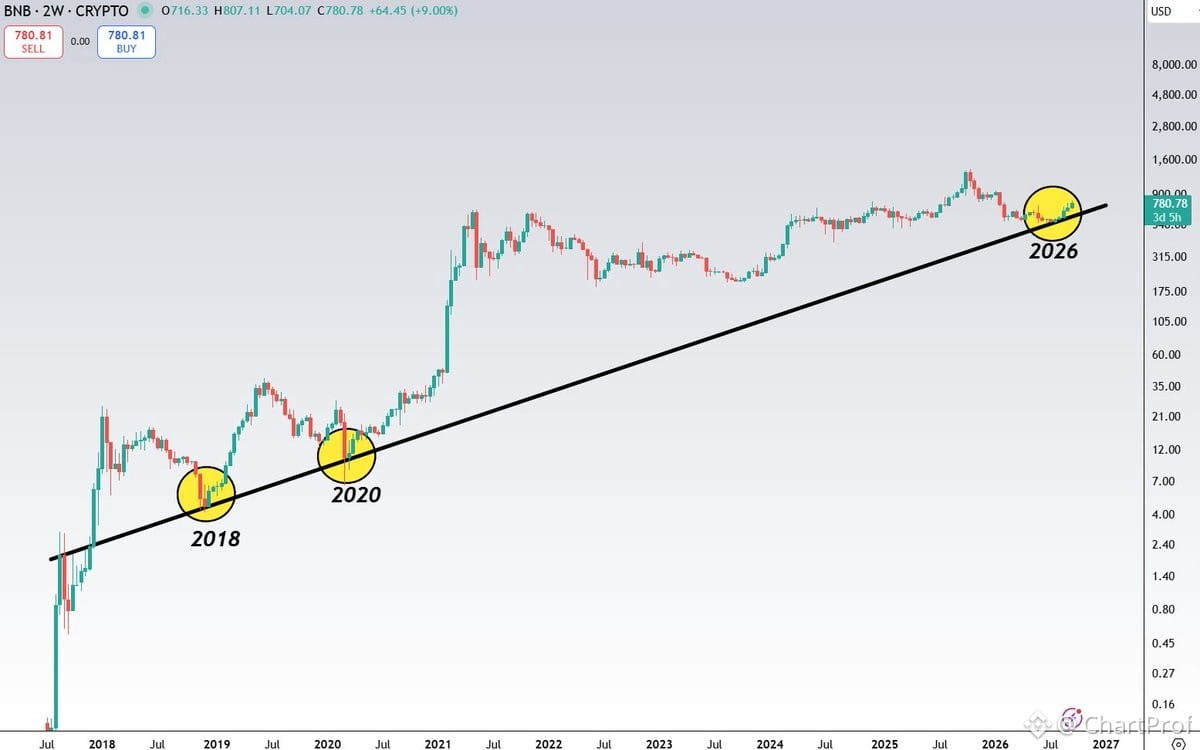
Let's walk through what this chart is actually showing us.
$BNB just touched a trendline that's been relevant for nearly a decade — and historically, that exact touch has marked the start of two previous major altcoin rallies. That's not coincidence. That's structure.
Here's the setup:
When $BNB tests long-term support like this, it tends to signal broader market rotation into alts. Think of it as a leading indicator — $BNB moves, liquidity follows, altcoins catch fire.
The pattern is clean: trendline touch → confirmation bounce → altcoin season ignition.
What confirms it? Watch for $BNB to hold above this level on the weekly close. If it does, that's your green light. If it breaks below and stays there, the setup invalidates and we wait.
Invalidation is simple: a weekly close beneath the trendline negates the bullish structure.
This is textbook technical analysis — long-term trendlines matter, especially when they've worked twice before. The third touch is where you pay attention. Structure is setting up. Now we watch the follow-through.
Let's walk through what this chart is actually showing us.
$BNB just touched a trendline that's been relevant for nearly a decade — and historically, that exact touch has marked the start of two previous major altcoin rallies. That's not coincidence. That's structure.
Here's the setup:
When $BNB tests long-term support like this, it tends to signal broader market rotation into alts. Think of it as a leading indicator — $BNB moves, liquidity follows, altcoins catch fire.
The pattern is clean: trendline touch → confirmation bounce → altcoin season ignition.
What confirms it? Watch for $BNB to hold above this level on the weekly close. If it does, that's your green light. If it breaks below and stays there, the setup invalidates and we wait.
Invalidation is simple: a weekly close beneath the trendline negates the bullish structure.
This is textbook technical analysis — long-term trendlines matter, especially when they've worked twice before. The third touch is where you pay attention. Structure is setting up. Now we watch the follow-through.
$BNB just touched a trendline that's been relevant for nearly a decade — and historically, that exact touch has marked the start of two previous major altcoin rallies. That's not coincidence. That's structure.
Here's the setup:
When $BNB tests long-term support like this, it tends to signal broader market rotation into alts. Think of it as a leading indicator — $BNB moves, liquidity follows, altcoins catch fire.
The pattern is clean: trendline touch → confirmation bounce → altcoin season ignition.
What confirms it? Watch for $BNB to hold above this level on the weekly close. If it does, that's your green light. If it breaks below and stays there, the setup invalidates and we wait.
Invalidation is simple: a weekly close beneath the trendline negates the bullish structure.
This is textbook technical analysis — long-term trendlines matter, especially when they've worked twice before. The third touch is where you pay attention. Structure is setting up. Now we watch the follow-through.
1
128
·
--
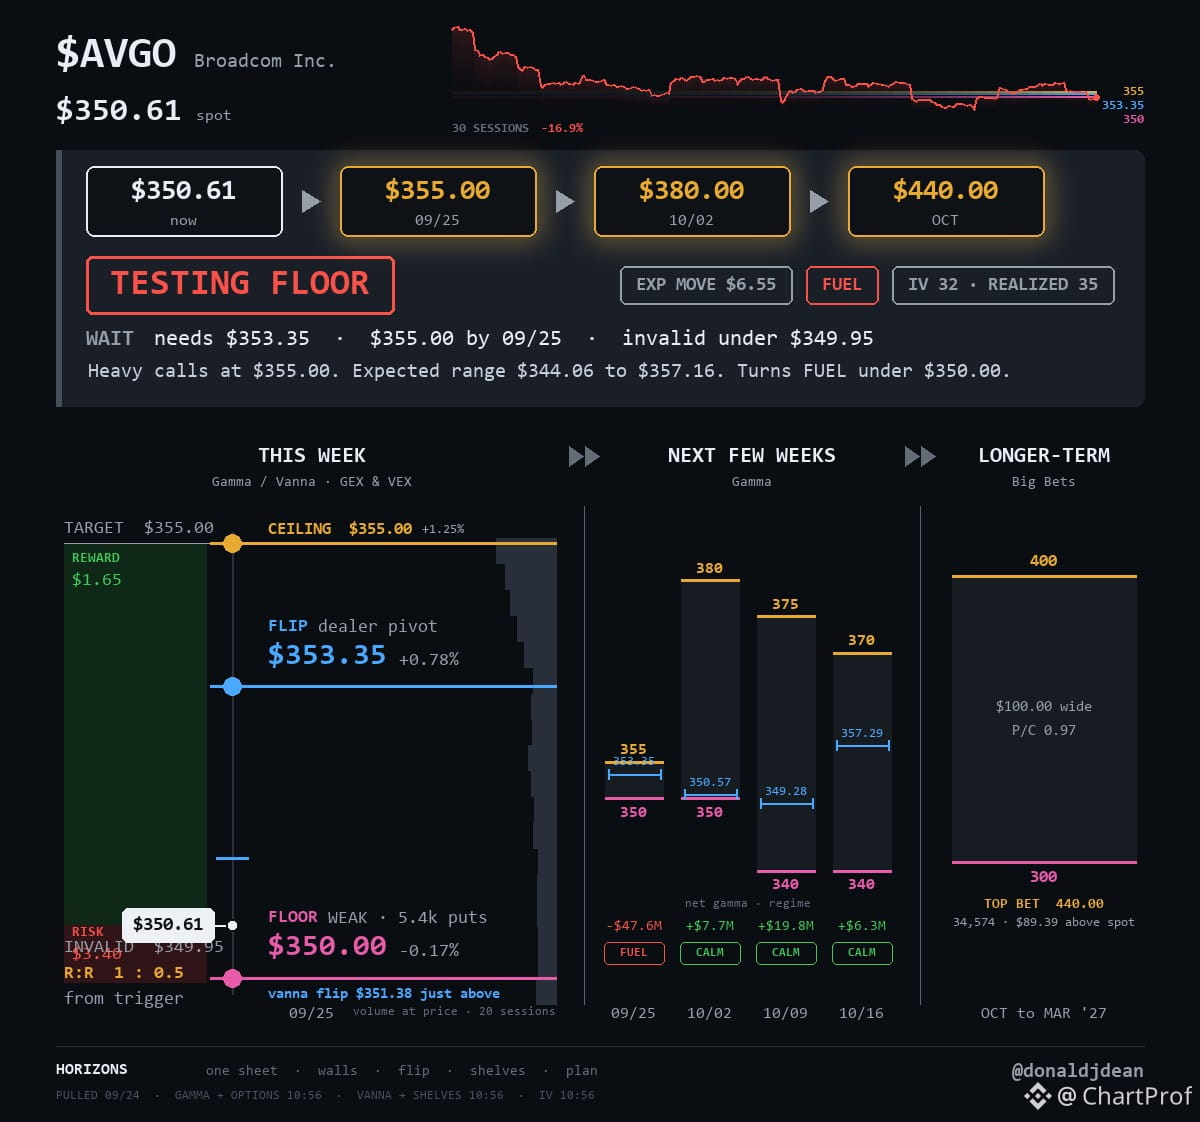
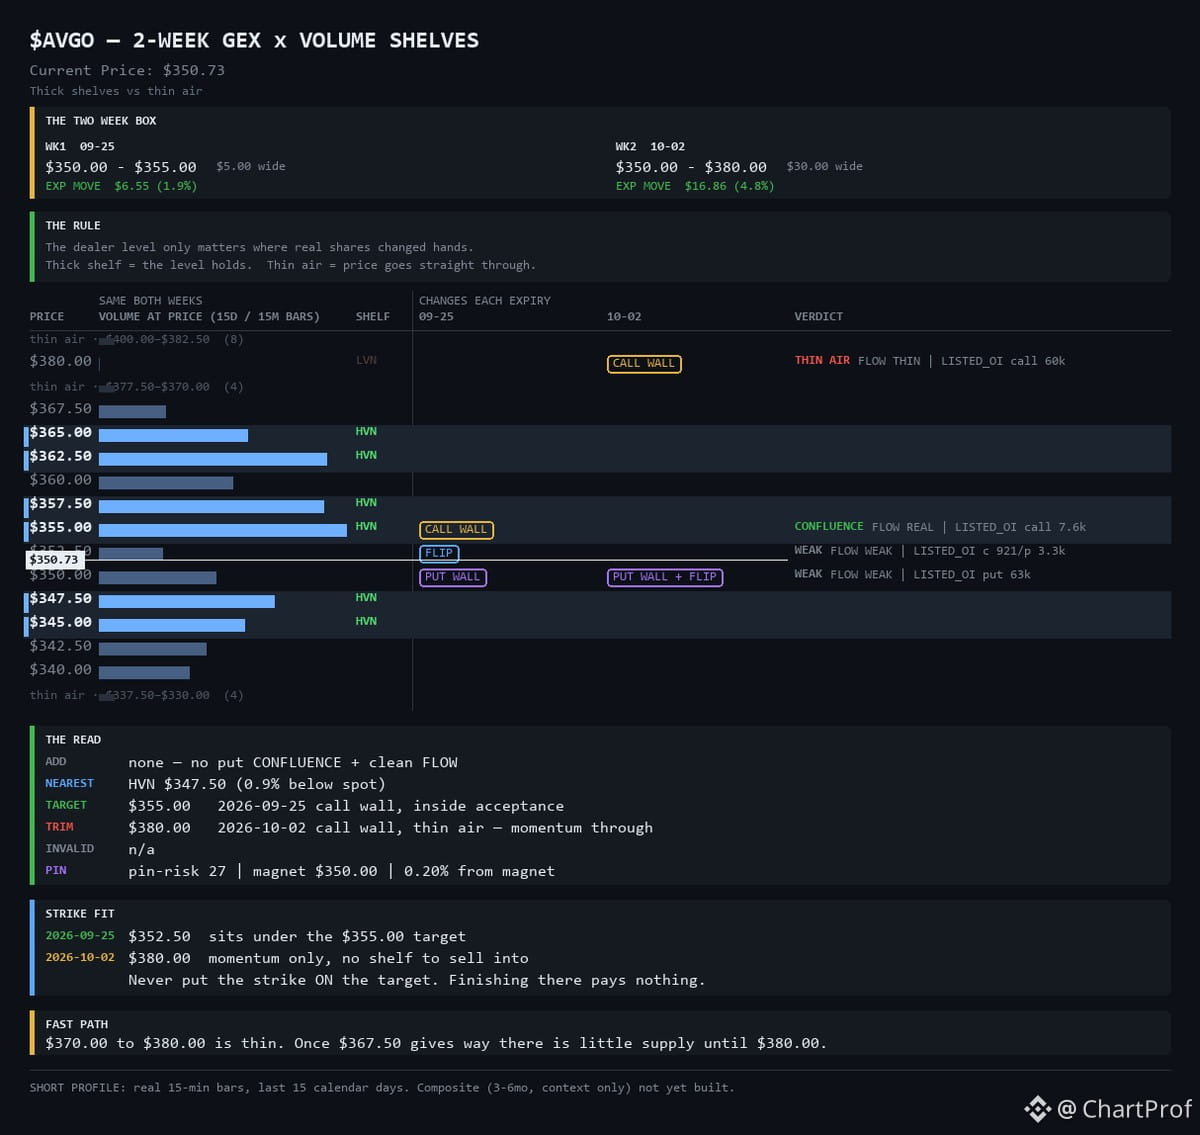
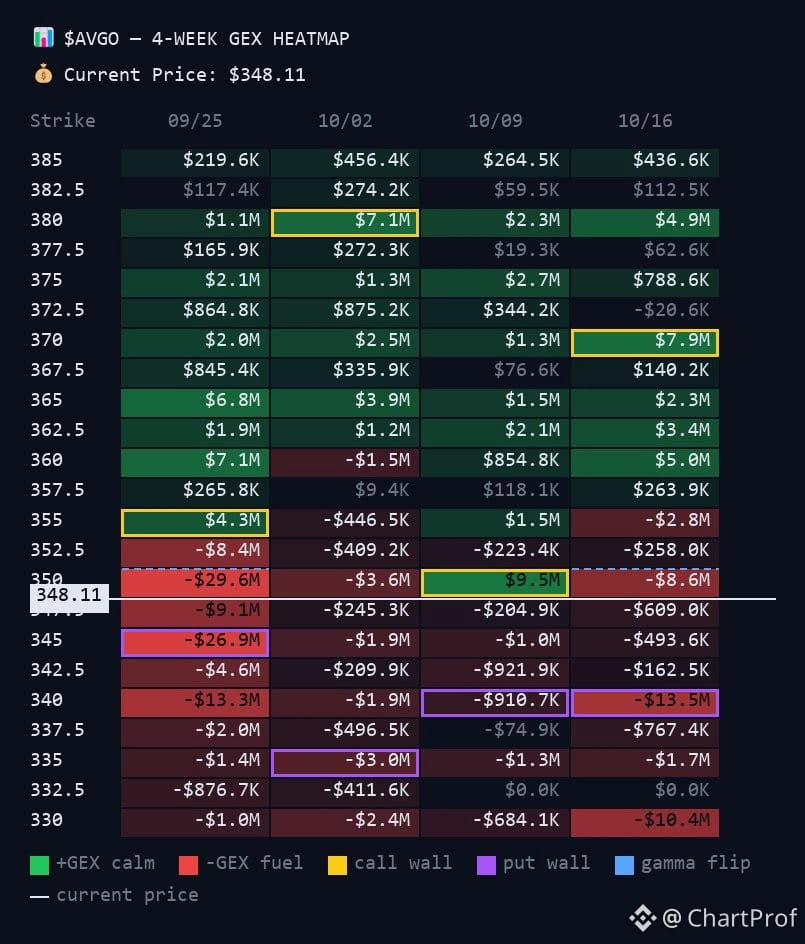
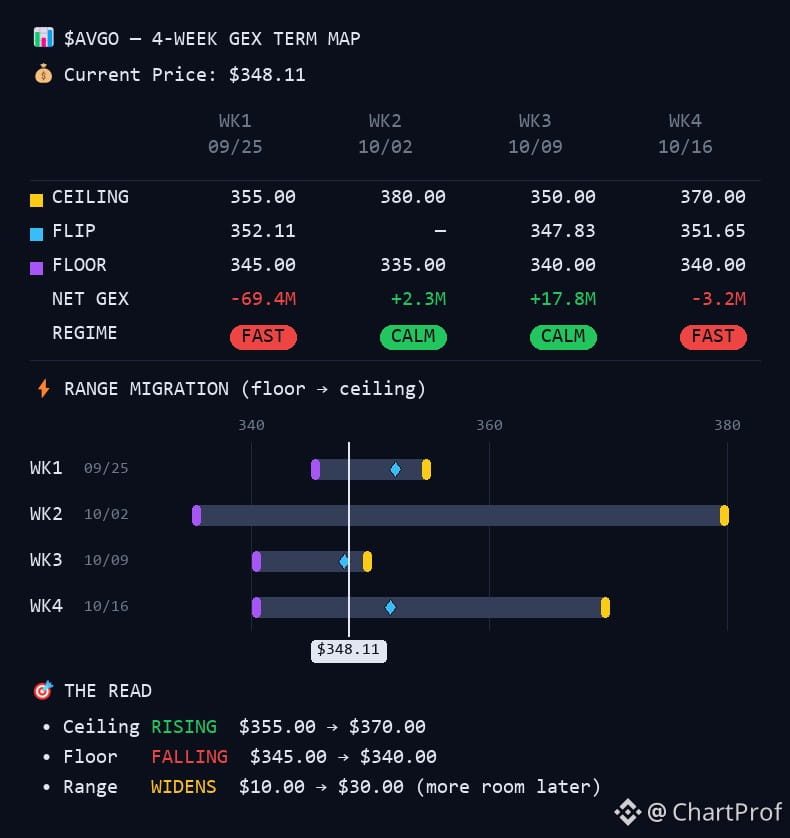
$AVGO sitting 61 cents above a weak $350 floor right now — testing support but not confirming it yet. The flip sits at $353.35, meaning price needs to reclaim that level before $355 becomes the magnet.
Here's the structure:
$355 = ceiling and target if floor holds
$353.35 = the flip — reclaim this and you're back in structure
$350 = current floor, still weak
If $AVGO holds above $350, expect a pull toward $355 this week. That's where price wants to go if structure stays intact.
Invalidation is clean: sub-$349.95 kills the setup. Below $350, this turns into a fuel zone — meaning you're looking for a bounce entry, not a breakout chase.
Don't chase into $360 while the floor is still unconfirmed. Wait for the flip at $353.35 or a clean reclaim of $350 with volume before adding calls.
Path if it works: $350.61 → $355 → $380 → $440
But first, prove the floor.
$AVGO sitting 61 cents above a weak $350 floor right now — testing support but not confirming it yet. The flip sits at $353.35, meaning price needs to reclaim that level before $355 becomes the magnet.
Here's the structure:
$355 = ceiling and target if floor holds
$353.35 = the flip — reclaim this and you're back in structure
$350 = current floor, still weak
If $AVGO holds above $350, expect a pull toward $355 this week. That's where price wants to go if structure stays intact.
Invalidation is clean: sub-$349.95 kills the setup. Below $350, this turns into a fuel zone — meaning you're looking for a bounce entry, not a breakout chase.
Don't chase into $360 while the floor is still unconfirmed. Wait for the flip at $353.35 or a clean reclaim of $350 with volume before adding calls.
Path if it works: $350.61 → $355 → $380 → $440
But first, prove the floor.
Here's the structure:
$355 = ceiling and target if floor holds
$353.35 = the flip — reclaim this and you're back in structure
$350 = current floor, still weak
If $AVGO holds above $350, expect a pull toward $355 this week. That's where price wants to go if structure stays intact.
Invalidation is clean: sub-$349.95 kills the setup. Below $350, this turns into a fuel zone — meaning you're looking for a bounce entry, not a breakout chase.
Don't chase into $360 while the floor is still unconfirmed. Wait for the flip at $353.35 or a clean reclaim of $350 with volume before adding calls.
Path if it works: $350.61 → $355 → $380 → $440
But first, prove the floor.
31
·
--
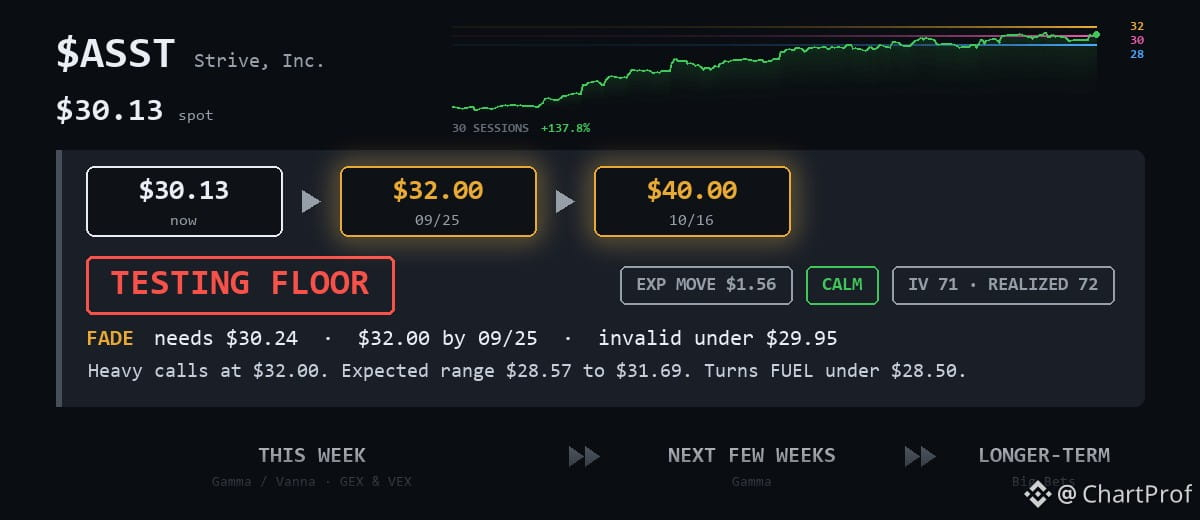
$ASST sitting right on $30 support — 13 cents above the floor. This is a floor test, not a breakout setup.
Price path reads clean: $30.13 → $30 → $32
$32 is the ceiling this week. $30 is the floor. Right now we're testing whether $30 holds or folds.
As long as $30 holds, $32 stays the target overhead. Lose $30 and the structure shifts.
Below $28.50, this flips to FUEL mode — that's where dealer positioning reverses and moves accelerate instead of getting cushioned. That's $1.63 lower from here.
Watch the $30 level. Hold it and you're in structure. Break it and you're out.
$ASST sitting right on $30 support — 13 cents above the floor. This is a floor test, not a breakout setup.
Price path reads clean: $30.13 → $30 → $32
$32 is the ceiling this week. $30 is the floor. Right now we're testing whether $30 holds or folds.
As long as $30 holds, $32 stays the target overhead. Lose $30 and the structure shifts.
Below $28.50, this flips to FUEL mode — that's where dealer positioning reverses and moves accelerate instead of getting cushioned. That's $1.63 lower from here.
Watch the $30 level. Hold it and you're in structure. Break it and you're out.
Price path reads clean: $30.13 → $30 → $32
$32 is the ceiling this week. $30 is the floor. Right now we're testing whether $30 holds or folds.
As long as $30 holds, $32 stays the target overhead. Lose $30 and the structure shifts.
Below $28.50, this flips to FUEL mode — that's where dealer positioning reverses and moves accelerate instead of getting cushioned. That's $1.63 lower from here.
Watch the $30 level. Hold it and you're in structure. Break it and you're out.
15
·
--
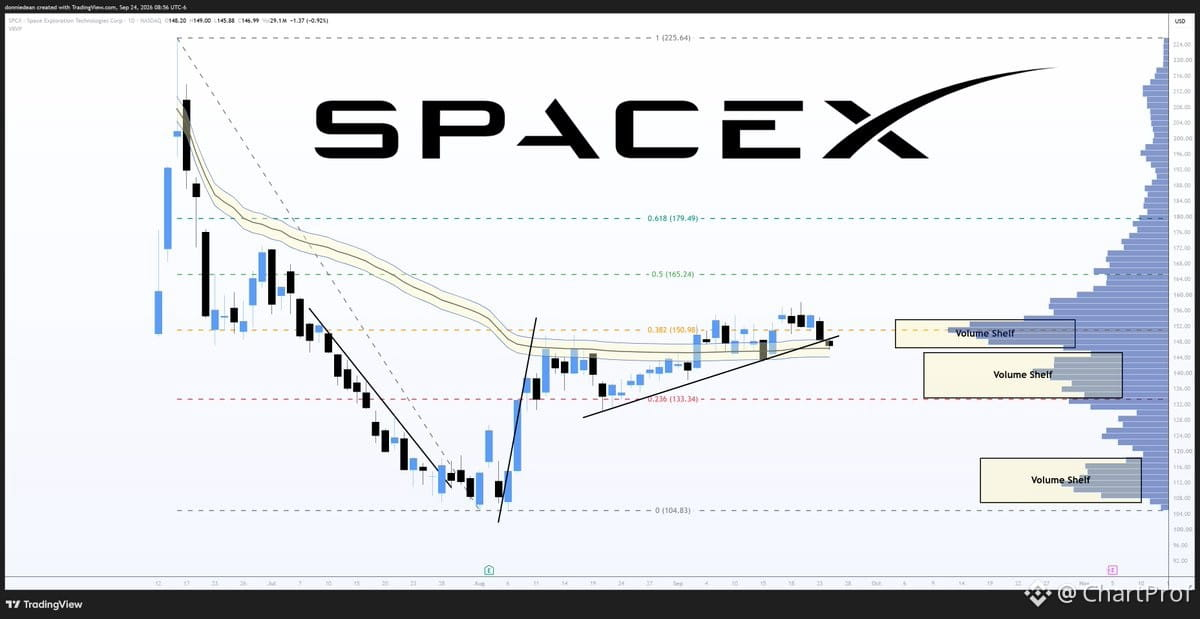
$SPCX SpaceX — Clean Structure Read
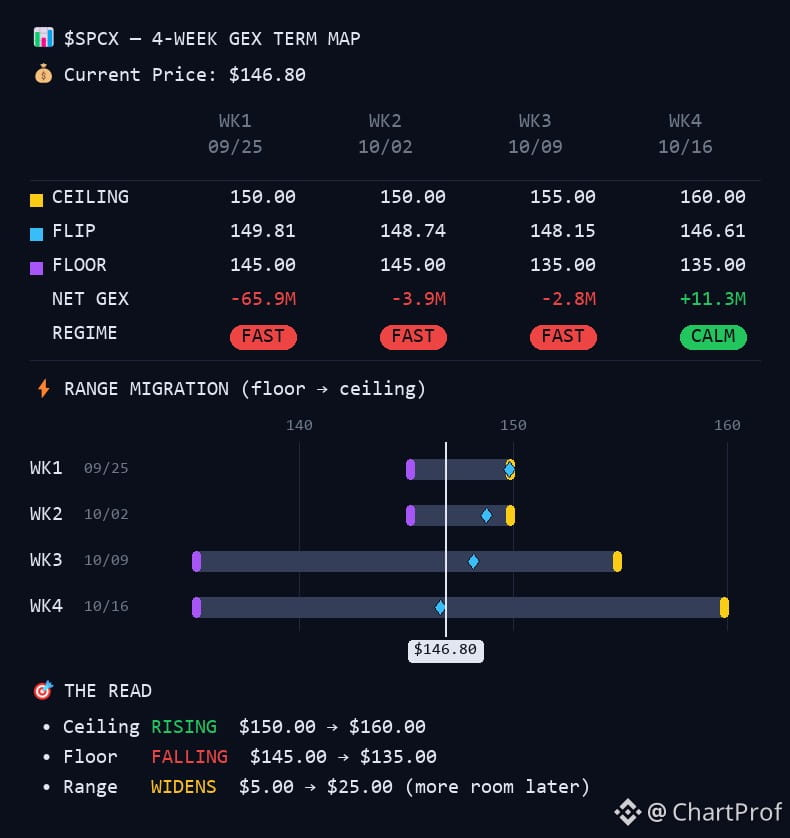
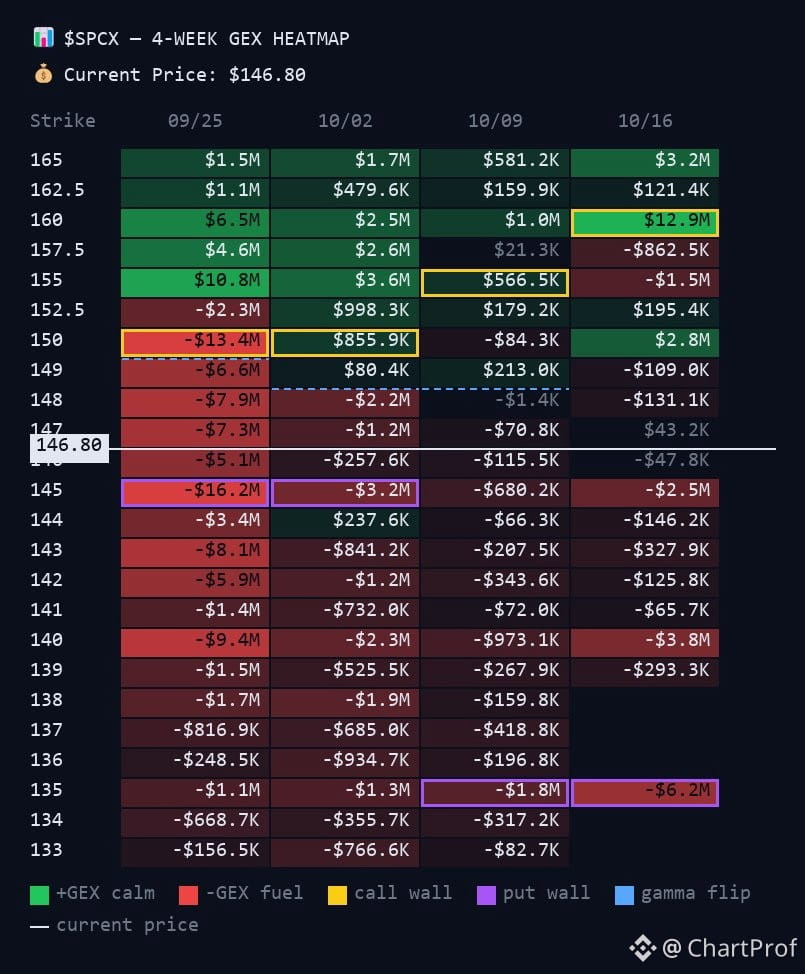
Price is testing the $145 put wall right now — soft fail so far, not a dip to buy. The $150 call wall is acting as the ceiling. Spot sits at $146.77, still below the flip level at $149.28, which is just under that top.
The unlock overhang is still weighing on this name — that's your macro headwind.
Here's the structure:
• $150.00 — the ceiling (call wall resistance)
• $146.77 — current price
• $145.00 — the floor (put wall support)
This week is a soft test of that $145 floor with the $150 lid overhead. The flip at $149.28 sits right between them — that's your breakout confirmation level if we reclaim it with conviction.
Right now, you're stuck in a tight range. No setup until we either break and hold above $149.28 (bullish structure flip) or lose $145 clean (bearish breakdown).
Watch the flip. That's your tell.
$SPCX SpaceX — Clean Structure Read
Price is testing the $145 put wall right now — soft fail so far, not a dip to buy. The $150 call wall is acting as the ceiling. Spot sits at $146.77, still below the flip level at $149.28, which is just under that top.
The unlock overhang is still weighing on this name — that's your macro headwind.
Here's the structure:
• $150.00 — the ceiling (call wall resistance)
• $146.77 — current price
• $145.00 — the floor (put wall support)
This week is a soft test of that $145 floor with the $150 lid overhead. The flip at $149.28 sits right between them — that's your breakout confirmation level if we reclaim it with conviction.
Right now, you're stuck in a tight range. No setup until we either break and hold above $149.28 (bullish structure flip) or lose $145 clean (bearish breakdown).
Watch the flip. That's your tell.
Price is testing the $145 put wall right now — soft fail so far, not a dip to buy. The $150 call wall is acting as the ceiling. Spot sits at $146.77, still below the flip level at $149.28, which is just under that top.
The unlock overhang is still weighing on this name — that's your macro headwind.
Here's the structure:
• $150.00 — the ceiling (call wall resistance)
• $146.77 — current price
• $145.00 — the floor (put wall support)
This week is a soft test of that $145 floor with the $150 lid overhead. The flip at $149.28 sits right between them — that's your breakout confirmation level if we reclaim it with conviction.
Right now, you're stuck in a tight range. No setup until we either break and hold above $149.28 (bullish structure flip) or lose $145 clean (bearish breakdown).
Watch the flip. That's your tell.
59
·
--
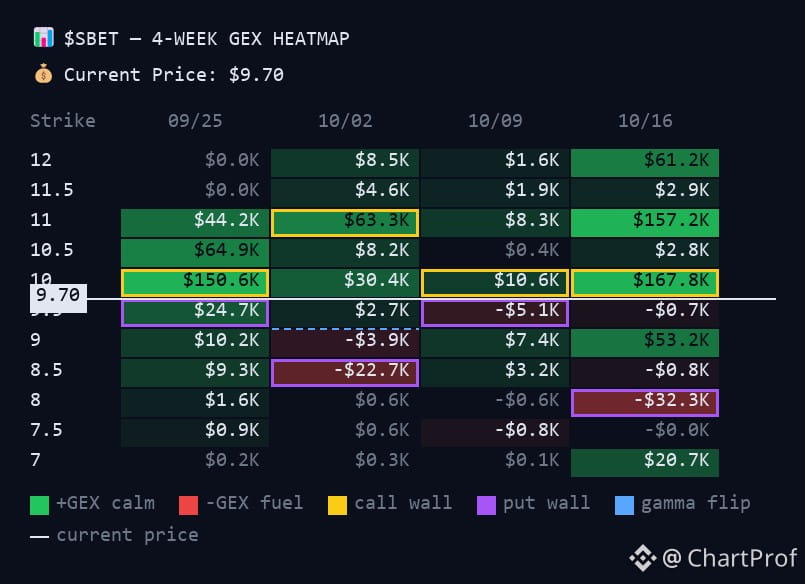
$SBET SharpLink Gaming
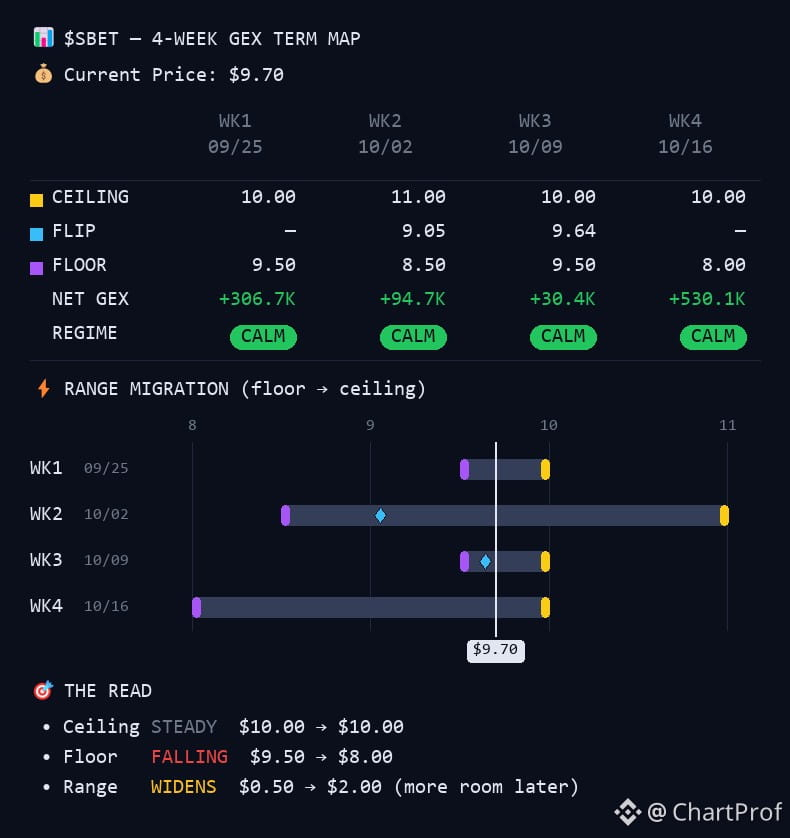
Price testing the $10 lid right now. $9.50 put wall holding as the floor. Spot at $9.72.
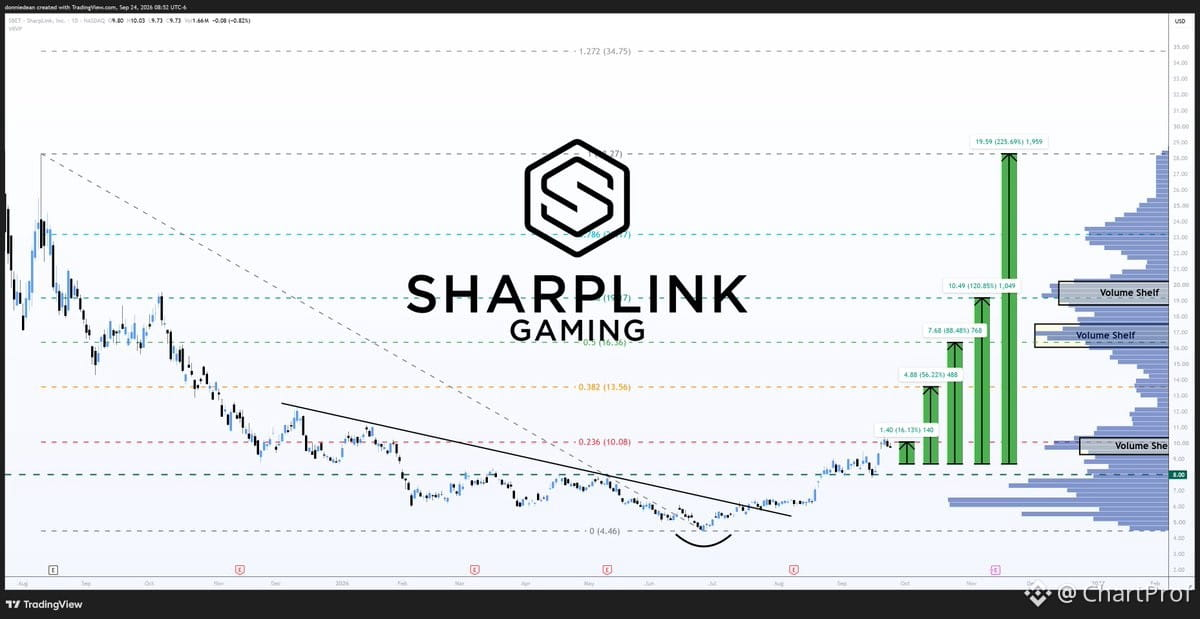
The 0.236 fib lands at $10.08 — right on top of that ceiling. Clean confluence.
This week's range:
$10.00 — ceiling
$9.72 — current price
$9.50 — floor
Flip sits lower at $9.05, below the floor.
What this means: You've got a defined box. $10 is resistance until it's not. $9.50 is support until it breaks. If $9.50 fails, $9.05 is your next structure.
Watch for a break above $10 with volume — that's your confirmation. Below $9.50, you're looking at $9.05. Simple structure, clear levels.
$SBET SharpLink Gaming
Price testing the $10 lid right now. $9.50 put wall holding as the floor. Spot at $9.72.
The 0.236 fib lands at $10.08 — right on top of that ceiling. Clean confluence.
This week's range:
$10.00 — ceiling
$9.72 — current price
$9.50 — floor
Flip sits lower at $9.05, below the floor.
What this means: You've got a defined box. $10 is resistance until it's not. $9.50 is support until it breaks. If $9.50 fails, $9.05 is your next structure.
Watch for a break above $10 with volume — that's your confirmation. Below $9.50, you're looking at $9.05. Simple structure, clear levels.
Price testing the $10 lid right now. $9.50 put wall holding as the floor. Spot at $9.72.
The 0.236 fib lands at $10.08 — right on top of that ceiling. Clean confluence.
This week's range:
$10.00 — ceiling
$9.72 — current price
$9.50 — floor
Flip sits lower at $9.05, below the floor.
What this means: You've got a defined box. $10 is resistance until it's not. $9.50 is support until it breaks. If $9.50 fails, $9.05 is your next structure.
Watch for a break above $10 with volume — that's your confirmation. Below $9.50, you're looking at $9.05. Simple structure, clear levels.
42
·
--
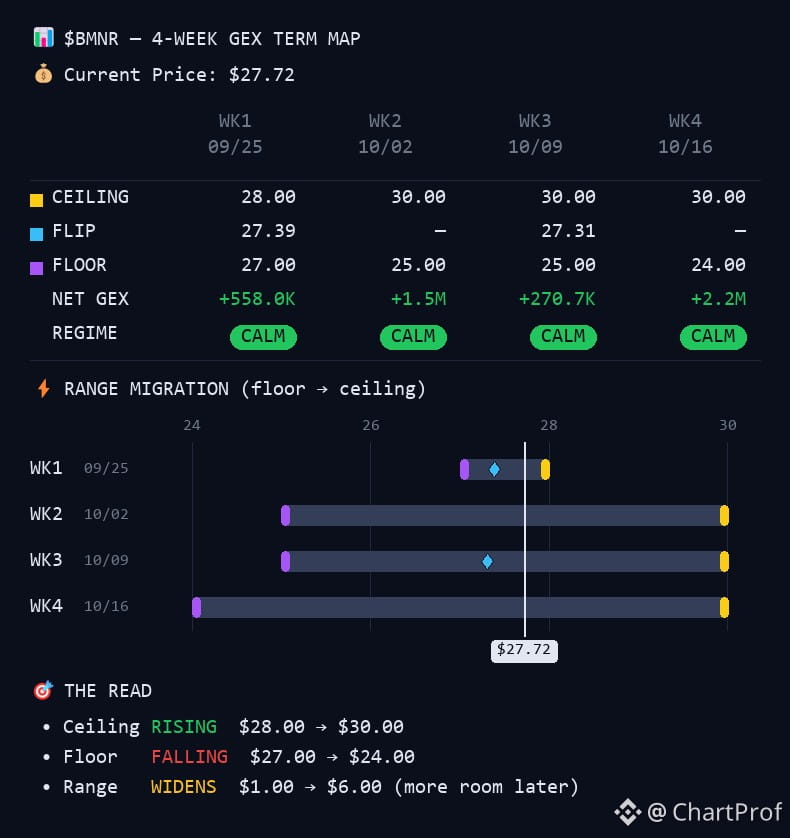
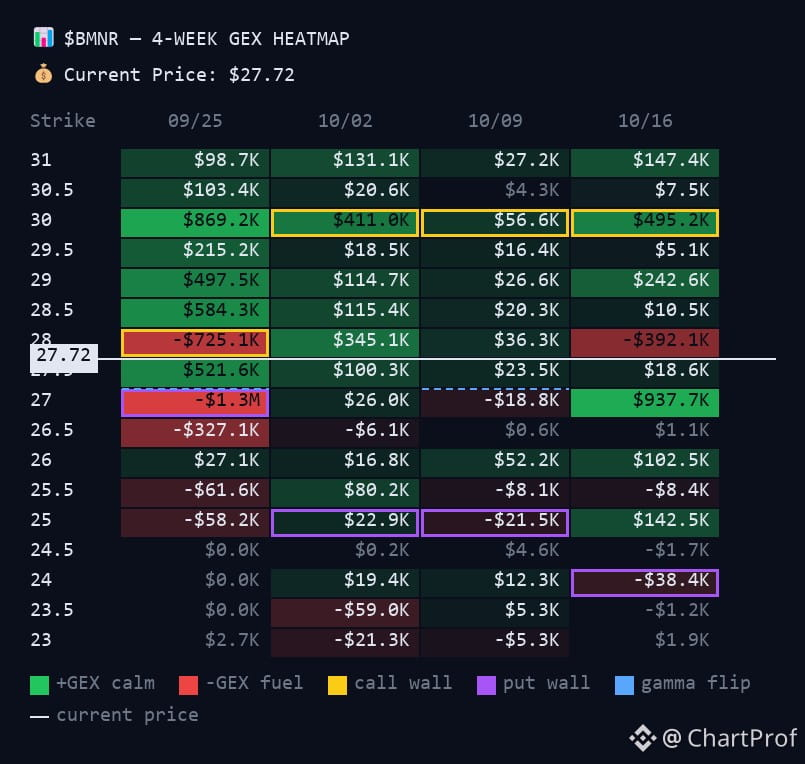
$BMNR BitMine Immersion
Price squeezed between $27 floor and $28 ceiling. Right now sitting at $27.72.
Key structure:
• $28.00 = resistance ceiling
• $27.39 = flip level (just above put wall)
• $27.00 = support floor / put wall
• $26.71 = 0.236 fib reclaim if we lose $27
This week's range is identical — $27 to $28 box. Price is pinned. The $27 put wall is holding as your downside anchor. If that breaks, next meaningful level is the fib at $26.71.
Flip above $27.39 with volume starts to open the door toward $28. Until then, you're rangebound inside a tight $1 box. Watch for a break of either boundary with conviction before leaning directional.
$BMNR BitMine Immersion
Price squeezed between $27 floor and $28 ceiling. Right now sitting at $27.72.
Key structure:
• $28.00 = resistance ceiling
• $27.39 = flip level (just above put wall)
• $27.00 = support floor / put wall
• $26.71 = 0.236 fib reclaim if we lose $27
This week's range is identical — $27 to $28 box. Price is pinned. The $27 put wall is holding as your downside anchor. If that breaks, next meaningful level is the fib at $26.71.
Flip above $27.39 with volume starts to open the door toward $28. Until then, you're rangebound inside a tight $1 box. Watch for a break of either boundary with conviction before leaning directional.
Price squeezed between $27 floor and $28 ceiling. Right now sitting at $27.72.
Key structure:
• $28.00 = resistance ceiling
• $27.39 = flip level (just above put wall)
• $27.00 = support floor / put wall
• $26.71 = 0.236 fib reclaim if we lose $27
This week's range is identical — $27 to $28 box. Price is pinned. The $27 put wall is holding as your downside anchor. If that breaks, next meaningful level is the fib at $26.71.
Flip above $27.39 with volume starts to open the door toward $28. Until then, you're rangebound inside a tight $1 box. Watch for a break of either boundary with conviction before leaning directional.
24
·
--
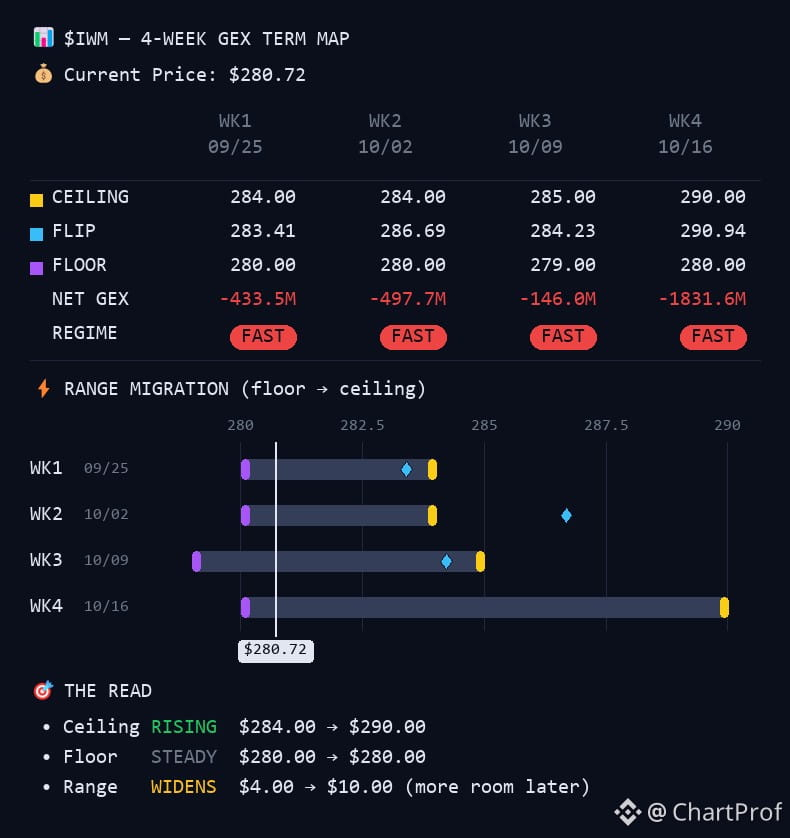
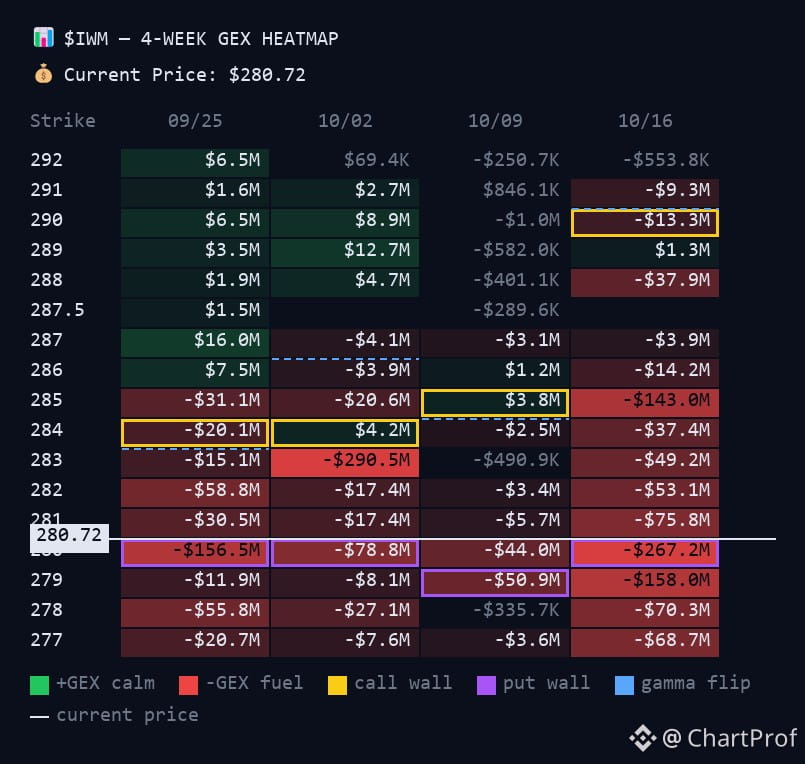
$IWM Russell 2000 Gamma Map
Price is hugging the floor at $280.71 inside a tight $280 to $284 box. The stamped flip sits above the call wall at $285.30, so $284 is the near lid.
$284.00, the ceiling
$280.71, where price is now
$280.00, the floor
$285.30, the flip
Read it clean: we're pinned low in the range. $280 is your hard floor — break that and we're looking for the next support pocket. $284 is your ceiling — resistance stacks there before the flip at $285.30. That flip is your gamma pivot — above it, calls start working and the structure opens up. Below $280, the floor breaks and we're hunting lower.
Setup: range-bound until one side breaks. Watch $280 for support failure or $284 for breakout confirmation into the flip. Structure is tight, so the move will be clean once it picks a side.
$IWM Russell 2000 Gamma Map
Price is hugging the floor at $280.71 inside a tight $280 to $284 box. The stamped flip sits above the call wall at $285.30, so $284 is the near lid.
$284.00, the ceiling
$280.71, where price is now
$280.00, the floor
$285.30, the flip
Read it clean: we're pinned low in the range. $280 is your hard floor — break that and we're looking for the next support pocket. $284 is your ceiling — resistance stacks there before the flip at $285.30. That flip is your gamma pivot — above it, calls start working and the structure opens up. Below $280, the floor breaks and we're hunting lower.
Setup: range-bound until one side breaks. Watch $280 for support failure or $284 for breakout confirmation into the flip. Structure is tight, so the move will be clean once it picks a side.
Price is hugging the floor at $280.71 inside a tight $280 to $284 box. The stamped flip sits above the call wall at $285.30, so $284 is the near lid.
$284.00, the ceiling
$280.71, where price is now
$280.00, the floor
$285.30, the flip
Read it clean: we're pinned low in the range. $280 is your hard floor — break that and we're looking for the next support pocket. $284 is your ceiling — resistance stacks there before the flip at $285.30. That flip is your gamma pivot — above it, calls start working and the structure opens up. Below $280, the floor breaks and we're hunting lower.
Setup: range-bound until one side breaks. Watch $280 for support failure or $284 for breakout confirmation into the flip. Structure is tight, so the move will be clean once it picks a side.
34
·
--
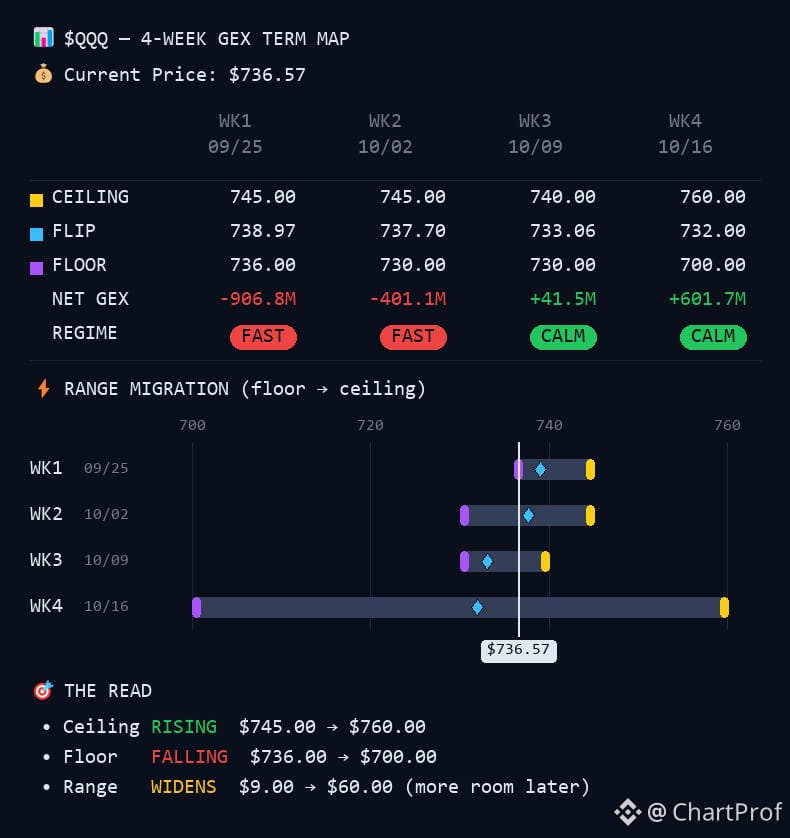
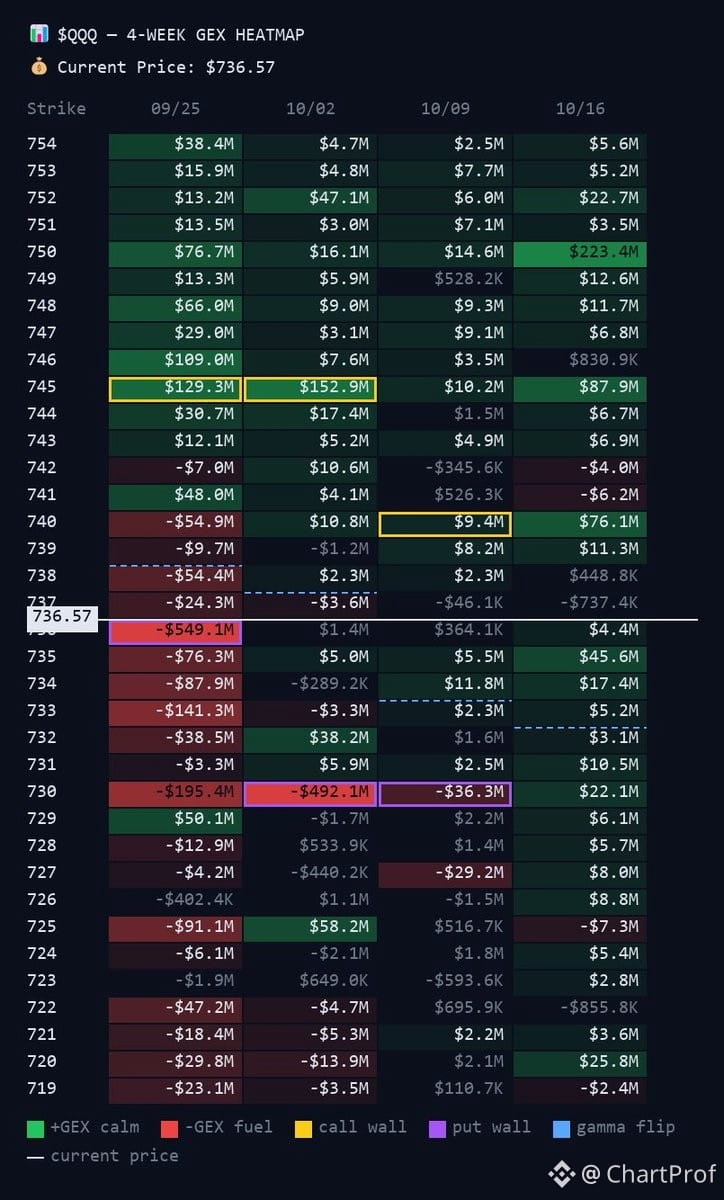
Reading $QQQ gamma structure like a textbook right now.
We're trading under the flip at $736.64, boxed between $730 floor and $745 ceiling. That's your range — simple as that. Four-week gamma map still points toward $760, but this week's ceiling caps us at $745. Until we reclaim the flip and hold above it, we're range-bound.
Here's the setup:
$745 — weekly ceiling, resistance
$738.31 — the flip level
$736.64 — current price
$730 — floor, support
What confirms the move? Clean break and hold above $738.31 opens $745. Lose $730 and we're looking lower. Structure is clean, levels are clear. Trade the box or wait for the break — don't guess in the middle.
Reading $QQQ gamma structure like a textbook right now.
We're trading under the flip at $736.64, boxed between $730 floor and $745 ceiling. That's your range — simple as that. Four-week gamma map still points toward $760, but this week's ceiling caps us at $745. Until we reclaim the flip and hold above it, we're range-bound.
Here's the setup:
$745 — weekly ceiling, resistance
$738.31 — the flip level
$736.64 — current price
$730 — floor, support
What confirms the move? Clean break and hold above $738.31 opens $745. Lose $730 and we're looking lower. Structure is clean, levels are clear. Trade the box or wait for the break — don't guess in the middle.
We're trading under the flip at $736.64, boxed between $730 floor and $745 ceiling. That's your range — simple as that. Four-week gamma map still points toward $760, but this week's ceiling caps us at $745. Until we reclaim the flip and hold above it, we're range-bound.
Here's the setup:
$745 — weekly ceiling, resistance
$738.31 — the flip level
$736.64 — current price
$730 — floor, support
What confirms the move? Clean break and hold above $738.31 opens $745. Lose $730 and we're looking lower. Structure is clean, levels are clear. Trade the box or wait for the break — don't guess in the middle.
75
·
--
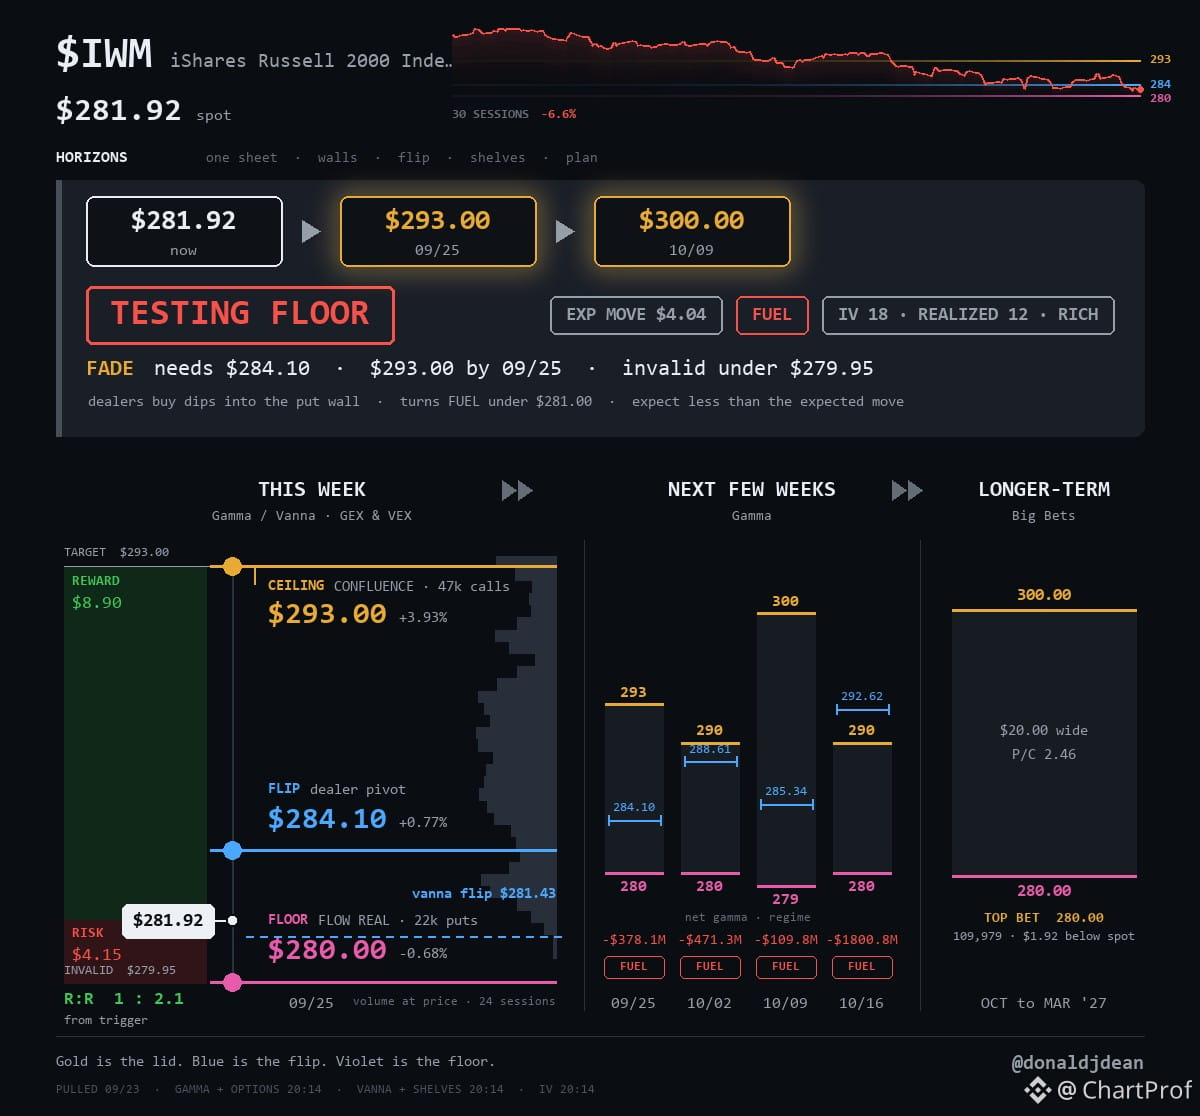
$IWM Russell 2000 ETF — Testing The Floor
Price: $281.92
Path: $281.92 ➡️ $293 ➡️ $300
Structure:
$293.00 — ceiling, 47k calls stacked
$284.10 — flip level (reclaim this, structure shifts)
$280.00 — floor, 22k puts defending
Context:
Down 6.6% over 30 sessions. Now $1.92 above the floor. Coiling. Every week on the map adds fuel — moves get bigger, faster, and that cuts both ways.
Setup:
Reclaim $284.10 ➡️ $293 opens
Lose $279.95 ➡️ setup invalidated
Options:
IV 18 vs realized 12. Protection costs more than the moves have been paying. Rich premium, tight realized range. That's your edge or your trap depending on how you trade it.
This is a flip-or-fail setup. Clean levels, clear invalidation. Trade the reclaim or wait for the breakdown — don't get caught in the middle.
$IWM Russell 2000 ETF — Testing The Floor
Price: $281.92
Path: $281.92 ➡️ $293 ➡️ $300
Structure:
$293.00 — ceiling, 47k calls stacked
$284.10 — flip level (reclaim this, structure shifts)
$280.00 — floor, 22k puts defending
Context:
Down 6.6% over 30 sessions. Now $1.92 above the floor. Coiling. Every week on the map adds fuel — moves get bigger, faster, and that cuts both ways.
Setup:
Reclaim $284.10 ➡️ $293 opens
Lose $279.95 ➡️ setup invalidated
Options:
IV 18 vs realized 12. Protection costs more than the moves have been paying. Rich premium, tight realized range. That's your edge or your trap depending on how you trade it.
This is a flip-or-fail setup. Clean levels, clear invalidation. Trade the reclaim or wait for the breakdown — don't get caught in the middle.
Price: $281.92
Path: $281.92 ➡️ $293 ➡️ $300
Structure:
$293.00 — ceiling, 47k calls stacked
$284.10 — flip level (reclaim this, structure shifts)
$280.00 — floor, 22k puts defending
Context:
Down 6.6% over 30 sessions. Now $1.92 above the floor. Coiling. Every week on the map adds fuel — moves get bigger, faster, and that cuts both ways.
Setup:
Reclaim $284.10 ➡️ $293 opens
Lose $279.95 ➡️ setup invalidated
Options:
IV 18 vs realized 12. Protection costs more than the moves have been paying. Rich premium, tight realized range. That's your edge or your trap depending on how you trade it.
This is a flip-or-fail setup. Clean levels, clear invalidation. Trade the reclaim or wait for the breakdown — don't get caught in the middle.
83
ເຂົ້າສູ່ລະບົບເພື່ອສຳຫຼວດເນື້ອຫາເພີ່ມເຕີມ
ເຂົ້າຮ່ວມກຸ່ມຜູ້ໃຊ້ຄຣິບໂຕທົ່ວໂລກໃນ Binance Square.
⚡️ ໄດ້ຮັບຂໍ້ມູນຫຼ້າສຸດ ແລະ ທີ່ມີປະໂຫຍດກ່ຽວກັບຄຣິບໂຕ.
💬 ໄດ້ຮັບຄວາມໄວ້ວາງໃຈຈາກຕະຫຼາດແລກປ່ຽນຄຣິບໂຕທີ່ໃຫຍ່ທີ່ສຸດໃນໂລກ.
👍 ຄົ້ນຫາຂໍ້ມູນເຊີງເລິກທີ່ແທ້ຈາກນັກສ້າງທີ່ໄດ້ຮັບການຢືນຢັນ.
ອີເມວ / ເບີໂທລະສັບ
ຫົວຂໍ້ທີ່ກໍາລັງນິຍົມ
BitgetHackerMoves$83MStolenXRP
224 views
20 ກຳລັງສົນທະນາ
On September 24, 2026, Bitget suffered a major security breach, with around $387M–$390M in assets reportedly stolen.
A big part of the stolen funds was $XRP .
Around 103M $XRP, worth roughly $157M–$160M at the time, was moved into five wallets controlled by the attacker.
By September 26, about 54M XRP ($83M) had already been moved out of three of those wallets.
Two wallets that each held around 20M XRP were almost completely emptied, while another was reduced to about 5.8M XRP.
That left roughly 49M XRP, worth around $75M at the time, still sitting in the original wallets.
The transfers also picked up overnight, with the funds being split across new wallets. Some reports say part of the XRP was later moved through THORChain toward Bitcoin.
Definitely a situation I’m keeping an eye on as the funds continue to move.
#BitgetHackerMoves$83MStolenXRP
jujucrypt
·2 ຖືກໃຈ
·376 views
SOLSpotETFWeeklyInflow$188M
252 views
33 ກຳລັງສົນທະນາ
StrategyStriveAdd2305BitcoinThisWeek
28,779 views
870 ກຳລັງສົນທະນາ