
Chart-Sniper
614 ໂພສ

Chart-Sniper
ລາຍງານ
ບລັອກຜູ້ໃຊ້
🎯 ChartSniper is your go-to spot for spotting top crypto gainers and breakout setups in real time. I focus on clean chart analysis, key support and resistance.
ເປີດການຊື້ຂາຍ
ຜູ້ຊື້ຂາຍຊົ່ວຄາວ
4.8 ເດືອນ
5 ກໍາລັງຕິດຕາມ
49 ຜູ້ຕິດຕາມ
139 Liked
ໂພສ
Portfolio
·
--
ບົດຄວາມ
ເບິ່ງການແປ
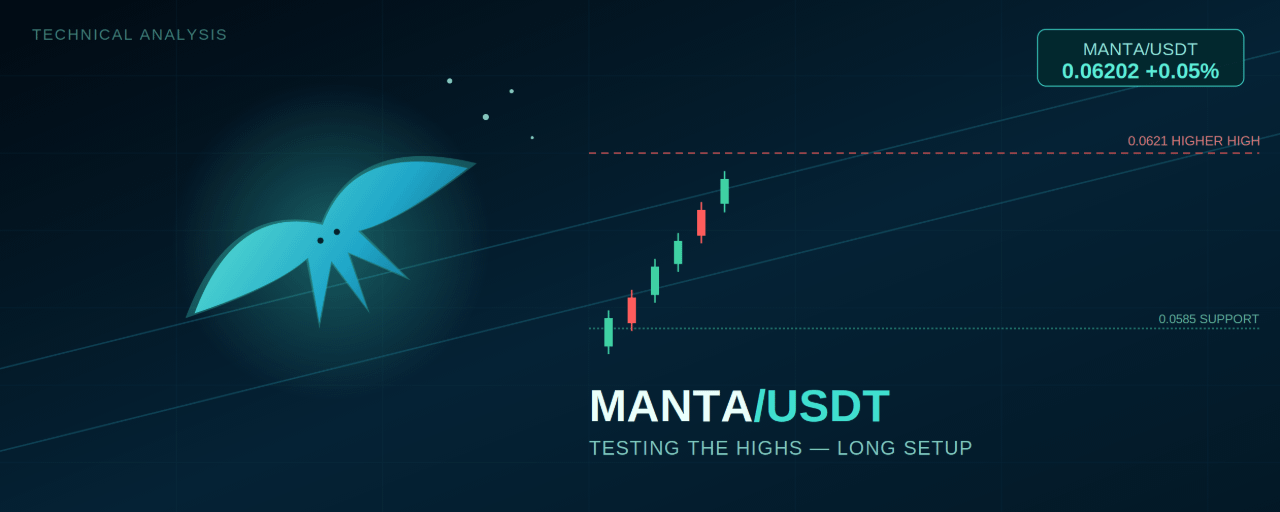
MANTA/USDT: Testing the Highs After a Flawless Ascending Channel Run$MANTA
{future}(MANTAUSDT)
Manta Network has been quietly putting together one of the more disciplined uptrends on the board — a steady climb of higher lows and higher highs, all contained neatly inside a single rising channel. Now, with price pressing right back up against its recent peak, the setup is shaping into a classic breakout-retest opportunity for traders leaning long.
Reading the Structure
The move started from a Higher Low near 0.0552 and has climbed in textbook fashion ever since — a Lower High around 0.0578, a second Lower High near 0.0592, and finally a Higher High at 0.0621. Every leg of this advance has stayed contained inside a well-defined ascending channel, with price respecting both the rising support line beneath it and a parallel line above.
Price is now trading at 0.06202, right at the 0.00% fib level (the recent Higher High), having pulled back only modestly along the way. A Fibonacci retracement from the Higher Low to the Higher High maps out the key support levels below: 38.2% at 0.05924, 50% around 0.0585, and 61.8% at 0.05747 — all of which lined up closely with the channel's lower boundary during the pullback phases, reinforcing the same zones from two different tools at once.
Momentum Still Points Up
RSI (14) reads 62.53 with its moving average at 56.80 — both above the 50 midline and both trending upward. RSI spiked toward 70+ earlier during the steepest part of the rally and has since cooled into a healthier range without breaking down, which is typical of a trend digesting gains rather than reversing.
Trade Setup — Long Bias
Price sitting right at the recent high, inside an intact rising channel, with momentum still constructive, favors a breakout-continuation approach.
Aggressive entry: 0.0620–0.0623, on a confirmed break and hold above the 0.0621 Higher HighConservative entry: 0.0592–0.0598, on a retest of the 38.2% fib level and the channel's lower trendline holding as supportStop-loss: Below 0.05747 (the 61.8% fib) — a break here would put price back below the channel entirely and undercut the higher-low structureTarget 1: 0.0650 (aligned with the channel's upper trendline projection)Target 2: 0.0680Target 3 (extended): 0.0700+, only on strong volume confirming a clean breakout above the channel
Invalidation to watch: A decisive close back below 0.0585 (the 50% fib) would suggest the breakout attempt has failed and the pullback is turning into something deeper, shifting focus back toward the 0.0552 Higher Low.
The Bottom Line
MANTA/USDT is doing exactly what a strong trend should do — grinding higher inside a clean channel and now testing the top of its recent range with momentum intact. As long as the channel and the 0.0585 pivot hold, the bias stays long, with 0.0650 and then 0.0680 as the next levels to watch on a confirmed breakout.
This analysis is based on technical chart structure and is for informational purposes only. It is not financial advice. Cryptocurrency markets are highly volatile — always do your own research and manage risk according to your own trading plan before entering any position.
@Binance_Square_Official #BTCBreaks80K #BuffettBecomesBerkshireChairmanEmeritus #ZcashSpotETFTops$230MMonthlyInflow #Binance #ChartSniper
MANTA/USDT: Testing the Highs After a Flawless Ascending Channel Run
$MANTA
Manta Network has been quietly putting together one of the more disciplined uptrends on the board — a steady climb of higher lows and higher highs, all contained neatly inside a single rising channel. Now, with price pressing right back up against its recent peak, the setup is shaping into a classic breakout-retest opportunity for traders leaning long.
Reading the Structure
The move started from a Higher Low near 0.0552 and has climbed in textbook fashion ever since — a Lower High around 0.0578, a second Lower High near 0.0592, and finally a Higher High at 0.0621. Every leg of this advance has stayed contained inside a well-defined ascending channel, with price respecting both the rising support line beneath it and a parallel line above.
Price is now trading at 0.06202, right at the 0.00% fib level (the recent Higher High), having pulled back only modestly along the way. A Fibonacci retracement from the Higher Low to the Higher High maps out the key support levels below: 38.2% at 0.05924, 50% around 0.0585, and 61.8% at 0.05747 — all of which lined up closely with the channel's lower boundary during the pullback phases, reinforcing the same zones from two different tools at once.
Momentum Still Points Up
RSI (14) reads 62.53 with its moving average at 56.80 — both above the 50 midline and both trending upward. RSI spiked toward 70+ earlier during the steepest part of the rally and has since cooled into a healthier range without breaking down, which is typical of a trend digesting gains rather than reversing.
Trade Setup — Long Bias
Price sitting right at the recent high, inside an intact rising channel, with momentum still constructive, favors a breakout-continuation approach.
Aggressive entry: 0.0620–0.0623, on a confirmed break and hold above the 0.0621 Higher HighConservative entry: 0.0592–0.0598, on a retest of the 38.2% fib level and the channel's lower trendline holding as supportStop-loss: Below 0.05747 (the 61.8% fib) — a break here would put price back below the channel entirely and undercut the higher-low structureTarget 1: 0.0650 (aligned with the channel's upper trendline projection)Target 2: 0.0680Target 3 (extended): 0.0700+, only on strong volume confirming a clean breakout above the channel
Invalidation to watch: A decisive close back below 0.0585 (the 50% fib) would suggest the breakout attempt has failed and the pullback is turning into something deeper, shifting focus back toward the 0.0552 Higher Low.
The Bottom Line
MANTA/USDT is doing exactly what a strong trend should do — grinding higher inside a clean channel and now testing the top of its recent range with momentum intact. As long as the channel and the 0.0585 pivot hold, the bias stays long, with 0.0650 and then 0.0680 as the next levels to watch on a confirmed breakout.
This analysis is based on technical chart structure and is for informational purposes only. It is not financial advice. Cryptocurrency markets are highly volatile — always do your own research and manage risk according to your own trading plan before entering any position.
@Binance Square Official #BTCBreaks80K #BuffettBecomesBerkshireChairmanEmeritus #ZcashSpotETFTops$230MMonthlyInflow #Binance #ChartSniper
Manta Network has been quietly putting together one of the more disciplined uptrends on the board — a steady climb of higher lows and higher highs, all contained neatly inside a single rising channel. Now, with price pressing right back up against its recent peak, the setup is shaping into a classic breakout-retest opportunity for traders leaning long.
Reading the Structure
The move started from a Higher Low near 0.0552 and has climbed in textbook fashion ever since — a Lower High around 0.0578, a second Lower High near 0.0592, and finally a Higher High at 0.0621. Every leg of this advance has stayed contained inside a well-defined ascending channel, with price respecting both the rising support line beneath it and a parallel line above.
Price is now trading at 0.06202, right at the 0.00% fib level (the recent Higher High), having pulled back only modestly along the way. A Fibonacci retracement from the Higher Low to the Higher High maps out the key support levels below: 38.2% at 0.05924, 50% around 0.0585, and 61.8% at 0.05747 — all of which lined up closely with the channel's lower boundary during the pullback phases, reinforcing the same zones from two different tools at once.
Momentum Still Points Up
RSI (14) reads 62.53 with its moving average at 56.80 — both above the 50 midline and both trending upward. RSI spiked toward 70+ earlier during the steepest part of the rally and has since cooled into a healthier range without breaking down, which is typical of a trend digesting gains rather than reversing.
Trade Setup — Long Bias
Price sitting right at the recent high, inside an intact rising channel, with momentum still constructive, favors a breakout-continuation approach.
Aggressive entry: 0.0620–0.0623, on a confirmed break and hold above the 0.0621 Higher HighConservative entry: 0.0592–0.0598, on a retest of the 38.2% fib level and the channel's lower trendline holding as supportStop-loss: Below 0.05747 (the 61.8% fib) — a break here would put price back below the channel entirely and undercut the higher-low structureTarget 1: 0.0650 (aligned with the channel's upper trendline projection)Target 2: 0.0680Target 3 (extended): 0.0700+, only on strong volume confirming a clean breakout above the channel
Invalidation to watch: A decisive close back below 0.0585 (the 50% fib) would suggest the breakout attempt has failed and the pullback is turning into something deeper, shifting focus back toward the 0.0552 Higher Low.
The Bottom Line
MANTA/USDT is doing exactly what a strong trend should do — grinding higher inside a clean channel and now testing the top of its recent range with momentum intact. As long as the channel and the 0.0585 pivot hold, the bias stays long, with 0.0650 and then 0.0680 as the next levels to watch on a confirmed breakout.
This analysis is based on technical chart structure and is for informational purposes only. It is not financial advice. Cryptocurrency markets are highly volatile — always do your own research and manage risk according to your own trading plan before entering any position.
@Binance Square Official #BTCBreaks80K #BuffettBecomesBerkshireChairmanEmeritus #ZcashSpotETFTops$230MMonthlyInflow #Binance #ChartSniper
168
·
--
ບົດຄວາມ
ເບິ່ງການແປ
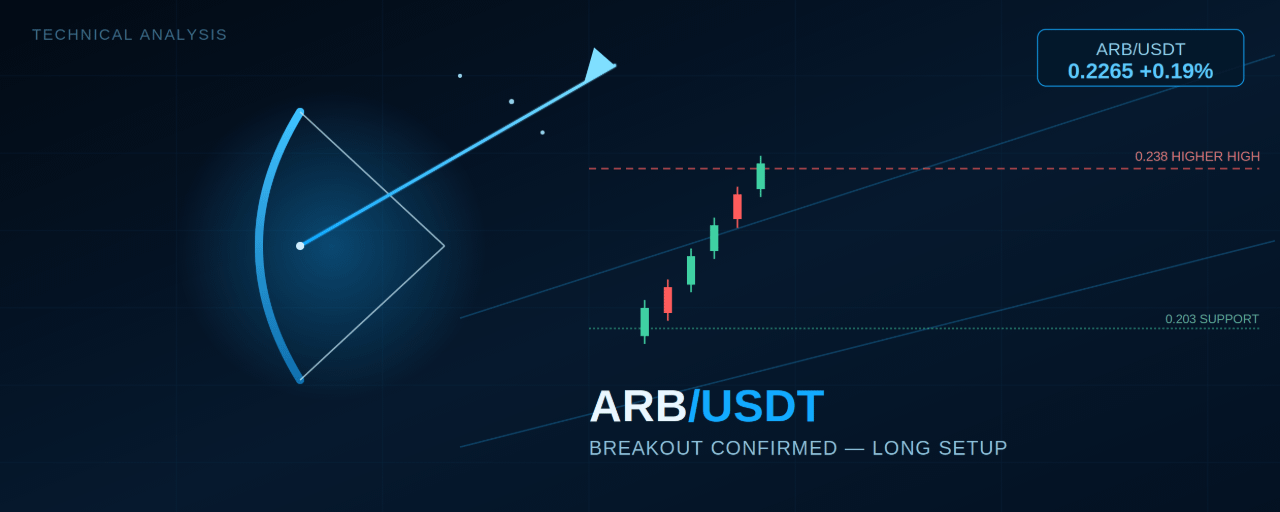
ARB/USDT: Breakout Confirmed — The Broadening Channel Points Higher$ARB
{future}(ARBUSDT)
Arbitrum has broken out of a multi-day consolidation range with real conviction, and the follow-through since that breakout has been exactly what trend traders want to see: a sharp impulsive move, a shallow pullback that held key support, and a fresh push back toward the highs. The structure on the 15-minute perpetual chart lines up clearly in favor of continuation.
Reading the Structure
ARB spent the better part of two sessions grinding sideways between roughly 0.145 and 0.165, printing a series of Lower Highs and a final Lower Low before buyers finally took control. From that Lower Low, price launched into a powerful impulsive rally that produced the session's Higher High near 0.238 — a clean breakout above the entire prior range.
Since that high, ARB pulled back into a Fibonacci retracement zone built from the Lower Low to the Higher High. The 50% level (0.203) lined up almost exactly with a horizontal support shelf that had previously acted as resistance during the consolidation — a textbook "old resistance becomes new support" retest. That confluence held, buyers stepped back in, and price has since reclaimed ground, now trading at 0.22649, up 0.19% and pressing back toward the recent high.
Zooming out, the entire move is developing inside a broadening ascending structure — two rising trendlines expanding apart — with the upper boundary currently projecting up toward the 0.27–0.28 region. That's the structural target if this leg continues to expand the way the pattern suggests.
Momentum Still Has Room
RSI sits at 67.44 with its moving average at 60.97, both comfortably above 50 and both pointing higher. RSI did tag overbought territory briefly during the initial breakout candle, which is normal for a strong impulsive move, and it has since cooled slightly during the pullback without breaking down — a sign the trend has more room to run rather than being exhausted.
Trade Setup — Long Bias
Aggressive entry: 0.2260–0.2280, riding the current push back toward the recent highConservative entry: 0.2100–0.2135, on a retest of the 38.2%–50% fib pocket and the horizontal support shelf holding againStop-loss: Below 0.1930 (the 61.8% fib) — a break of this level would undo the higher-low structure from this breakout leg entirelyTarget 1: 0.2380 (retest and break of the session Higher High)Target 2: 0.2600Target 3 (extended): 0.2750–0.2800, aligning with the upper boundary of the broadening channel — only on strong volume confirmation
Invalidation to watch: A close back below 0.2030 (the reclaimed support shelf) would signal the breakout is failing, opening the door for a retest of the 0.193 zone and a reassessment of the bullish structure.
The Bottom Line
ARB/USDT has broken decisively out of its prior range, defended the retest of that breakout level, and is now pushing back toward its recent high with momentum still intact. As long as 0.203 holds as support, the broader structure favors buyers looking for continuation toward 0.26 and, eventually, the 0.27–0.28 zone.
This analysis is based on technical chart structure and is for informational purposes only. It is not financial advice. Cryptocurrency markets are highly volatile — always do your own research and manage risk according to your own trading plan before entering any position.
@Binance_Square_Official #BTCBreaks80K #BuffettBecomesBerkshireChairmanEmeritus #ZcashSpotETFTops$230MMonthlyInflow #ChartSniper #Binance
ARB/USDT: Breakout Confirmed — The Broadening Channel Points Higher
$ARB
Arbitrum has broken out of a multi-day consolidation range with real conviction, and the follow-through since that breakout has been exactly what trend traders want to see: a sharp impulsive move, a shallow pullback that held key support, and a fresh push back toward the highs. The structure on the 15-minute perpetual chart lines up clearly in favor of continuation.
Reading the Structure
ARB spent the better part of two sessions grinding sideways between roughly 0.145 and 0.165, printing a series of Lower Highs and a final Lower Low before buyers finally took control. From that Lower Low, price launched into a powerful impulsive rally that produced the session's Higher High near 0.238 — a clean breakout above the entire prior range.
Since that high, ARB pulled back into a Fibonacci retracement zone built from the Lower Low to the Higher High. The 50% level (0.203) lined up almost exactly with a horizontal support shelf that had previously acted as resistance during the consolidation — a textbook "old resistance becomes new support" retest. That confluence held, buyers stepped back in, and price has since reclaimed ground, now trading at 0.22649, up 0.19% and pressing back toward the recent high.
Zooming out, the entire move is developing inside a broadening ascending structure — two rising trendlines expanding apart — with the upper boundary currently projecting up toward the 0.27–0.28 region. That's the structural target if this leg continues to expand the way the pattern suggests.
Momentum Still Has Room
RSI sits at 67.44 with its moving average at 60.97, both comfortably above 50 and both pointing higher. RSI did tag overbought territory briefly during the initial breakout candle, which is normal for a strong impulsive move, and it has since cooled slightly during the pullback without breaking down — a sign the trend has more room to run rather than being exhausted.
Trade Setup — Long Bias
Aggressive entry: 0.2260–0.2280, riding the current push back toward the recent highConservative entry: 0.2100–0.2135, on a retest of the 38.2%–50% fib pocket and the horizontal support shelf holding againStop-loss: Below 0.1930 (the 61.8% fib) — a break of this level would undo the higher-low structure from this breakout leg entirelyTarget 1: 0.2380 (retest and break of the session Higher High)Target 2: 0.2600Target 3 (extended): 0.2750–0.2800, aligning with the upper boundary of the broadening channel — only on strong volume confirmation
Invalidation to watch: A close back below 0.2030 (the reclaimed support shelf) would signal the breakout is failing, opening the door for a retest of the 0.193 zone and a reassessment of the bullish structure.
The Bottom Line
ARB/USDT has broken decisively out of its prior range, defended the retest of that breakout level, and is now pushing back toward its recent high with momentum still intact. As long as 0.203 holds as support, the broader structure favors buyers looking for continuation toward 0.26 and, eventually, the 0.27–0.28 zone.
This analysis is based on technical chart structure and is for informational purposes only. It is not financial advice. Cryptocurrency markets are highly volatile — always do your own research and manage risk according to your own trading plan before entering any position.
@Binance Square Official #BTCBreaks80K #BuffettBecomesBerkshireChairmanEmeritus #ZcashSpotETFTops$230MMonthlyInflow #ChartSniper #Binance
Arbitrum has broken out of a multi-day consolidation range with real conviction, and the follow-through since that breakout has been exactly what trend traders want to see: a sharp impulsive move, a shallow pullback that held key support, and a fresh push back toward the highs. The structure on the 15-minute perpetual chart lines up clearly in favor of continuation.
Reading the Structure
ARB spent the better part of two sessions grinding sideways between roughly 0.145 and 0.165, printing a series of Lower Highs and a final Lower Low before buyers finally took control. From that Lower Low, price launched into a powerful impulsive rally that produced the session's Higher High near 0.238 — a clean breakout above the entire prior range.
Since that high, ARB pulled back into a Fibonacci retracement zone built from the Lower Low to the Higher High. The 50% level (0.203) lined up almost exactly with a horizontal support shelf that had previously acted as resistance during the consolidation — a textbook "old resistance becomes new support" retest. That confluence held, buyers stepped back in, and price has since reclaimed ground, now trading at 0.22649, up 0.19% and pressing back toward the recent high.
Zooming out, the entire move is developing inside a broadening ascending structure — two rising trendlines expanding apart — with the upper boundary currently projecting up toward the 0.27–0.28 region. That's the structural target if this leg continues to expand the way the pattern suggests.
Momentum Still Has Room
RSI sits at 67.44 with its moving average at 60.97, both comfortably above 50 and both pointing higher. RSI did tag overbought territory briefly during the initial breakout candle, which is normal for a strong impulsive move, and it has since cooled slightly during the pullback without breaking down — a sign the trend has more room to run rather than being exhausted.
Trade Setup — Long Bias
Aggressive entry: 0.2260–0.2280, riding the current push back toward the recent highConservative entry: 0.2100–0.2135, on a retest of the 38.2%–50% fib pocket and the horizontal support shelf holding againStop-loss: Below 0.1930 (the 61.8% fib) — a break of this level would undo the higher-low structure from this breakout leg entirelyTarget 1: 0.2380 (retest and break of the session Higher High)Target 2: 0.2600Target 3 (extended): 0.2750–0.2800, aligning with the upper boundary of the broadening channel — only on strong volume confirmation
Invalidation to watch: A close back below 0.2030 (the reclaimed support shelf) would signal the breakout is failing, opening the door for a retest of the 0.193 zone and a reassessment of the bullish structure.
The Bottom Line
ARB/USDT has broken decisively out of its prior range, defended the retest of that breakout level, and is now pushing back toward its recent high with momentum still intact. As long as 0.203 holds as support, the broader structure favors buyers looking for continuation toward 0.26 and, eventually, the 0.27–0.28 zone.
This analysis is based on technical chart structure and is for informational purposes only. It is not financial advice. Cryptocurrency markets are highly volatile — always do your own research and manage risk according to your own trading plan before entering any position.
@Binance Square Official #BTCBreaks80K #BuffettBecomesBerkshireChairmanEmeritus #ZcashSpotETFTops$230MMonthlyInflow #ChartSniper #Binance
176
·
--
ບົດຄວາມ
ເບິ່ງການແປ
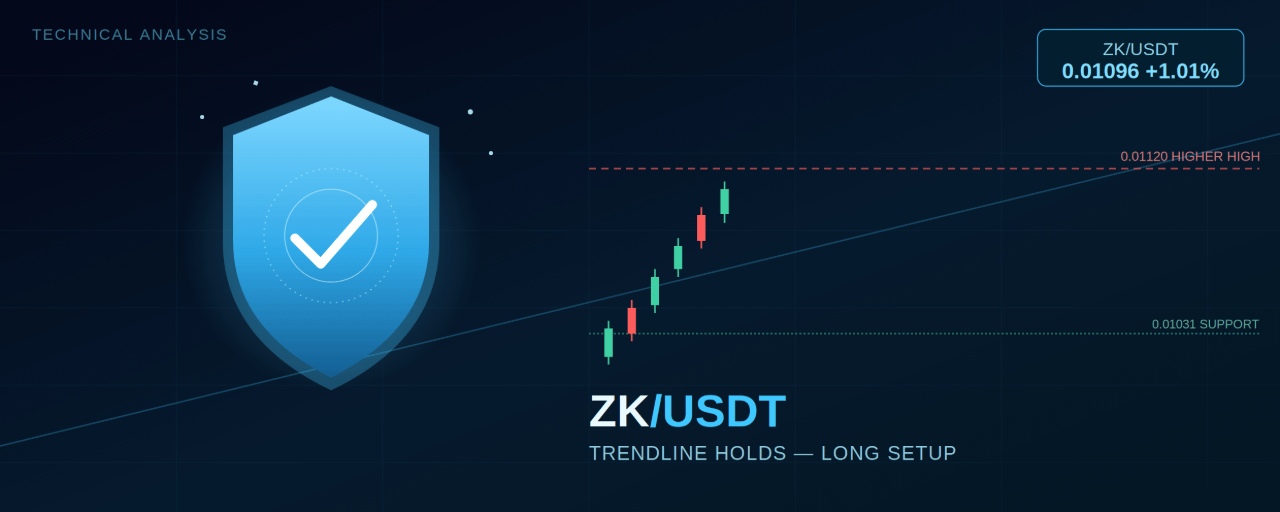
ZK/USDT: The Trendline Keeps Doing Its Job — Long Setup in Play$ZK
{future}(ZKUSDT)
ZKsync has been one of the steadier grinders on the board over the past 24 hours, climbing in a disciplined stair-step pattern along a single rising trendline that hasn't been broken once. After tagging a fresh Higher High and pulling back to test that same trendline, price is bouncing again — and the structure still favors buyers.
Reading the Structure
The move traces back to a low near 0.0089, and from there ZK has respected one continuous rising trendline through an entire session's worth of higher lows and higher highs. Along the way it cleared a Lower High around 0.0110, consolidated, and then launched into a sharp impulsive candle that produced the session's Higher High.
Since that Higher High, price pulled back into a Fibonacci zone built from the recent swing low to that high: the 38.2% level sits at 0.01064, the 50% level just below it, and the 61.8% level at 0.01040 — all clustering right around where the rising trendline itself is currently running. That confluence held. Price bounced from this zone and is now back at 0.01096, up 1.01% on the session, with RSI at 61.11 and its moving average at 58.74 — both above 50 and both turning back up alongside price.
Why the Bounce Matters
This is the second time in the session that the trendline plus a fib support cluster has caught a pullback and turned it back into a rally. That kind of repeated respect for the same dynamic support is exactly what you want to see in a trend you're looking to trade with, not against. As long as price continues to hold above that trendline, dips are still more likely to be bought than sold.
Trade Setup — Long Bias
Aggressive entry: 0.01090–0.01100, on the current bounce continuing with RSI holding above 55Conservative entry: 0.01064–0.01070, on a deeper retest of the 38.2% fib level and rising trendline confluenceStop-loss: Below 0.01031 (the horizontal support shelf) — a break here would put price below both the trendline and the 100% fib low, invalidating the setupTarget 1: 0.01120 (retest of the session's Higher High / 0% fib)Target 2: 0.01160–0.01191 (the marked supply zone above the prior high)Target 3 (extended): 0.01250, only on strong continuation with volume backing the breakout
Invalidation to watch: A decisive close below the rising trendline, followed by a break of 0.01031, would end the higher-low sequence and shift the bias toward a deeper correction back into the 0.00980–0.01000 area.
The Bottom Line
ZK/USDT remains in a clean, well-respected uptrend. The pullback into the fib/trendline confluence held, momentum has turned back up, and as long as 0.01031 isn't lost, the path of least resistance stays higher — with 0.01120 as the first real test on the way toward the 0.0116–0.0119 zone.
This analysis is based on technical chart structure and is for informational purposes only. It is not financial advice. Cryptocurrency markets are highly volatile — always do your own research and manage risk according to your own trading plan before entering any position.
@Binance_Square_Official #BTCBreaks80K #BuffettBecomesBerkshireChairmanEmeritus #ZcashSpotETFTops$230MMonthlyInflow #Binance #ChartSniper
ZK/USDT: The Trendline Keeps Doing Its Job — Long Setup in Play
$ZK
ZKsync has been one of the steadier grinders on the board over the past 24 hours, climbing in a disciplined stair-step pattern along a single rising trendline that hasn't been broken once. After tagging a fresh Higher High and pulling back to test that same trendline, price is bouncing again — and the structure still favors buyers.
Reading the Structure
The move traces back to a low near 0.0089, and from there ZK has respected one continuous rising trendline through an entire session's worth of higher lows and higher highs. Along the way it cleared a Lower High around 0.0110, consolidated, and then launched into a sharp impulsive candle that produced the session's Higher High.
Since that Higher High, price pulled back into a Fibonacci zone built from the recent swing low to that high: the 38.2% level sits at 0.01064, the 50% level just below it, and the 61.8% level at 0.01040 — all clustering right around where the rising trendline itself is currently running. That confluence held. Price bounced from this zone and is now back at 0.01096, up 1.01% on the session, with RSI at 61.11 and its moving average at 58.74 — both above 50 and both turning back up alongside price.
Why the Bounce Matters
This is the second time in the session that the trendline plus a fib support cluster has caught a pullback and turned it back into a rally. That kind of repeated respect for the same dynamic support is exactly what you want to see in a trend you're looking to trade with, not against. As long as price continues to hold above that trendline, dips are still more likely to be bought than sold.
Trade Setup — Long Bias
Aggressive entry: 0.01090–0.01100, on the current bounce continuing with RSI holding above 55Conservative entry: 0.01064–0.01070, on a deeper retest of the 38.2% fib level and rising trendline confluenceStop-loss: Below 0.01031 (the horizontal support shelf) — a break here would put price below both the trendline and the 100% fib low, invalidating the setupTarget 1: 0.01120 (retest of the session's Higher High / 0% fib)Target 2: 0.01160–0.01191 (the marked supply zone above the prior high)Target 3 (extended): 0.01250, only on strong continuation with volume backing the breakout
Invalidation to watch: A decisive close below the rising trendline, followed by a break of 0.01031, would end the higher-low sequence and shift the bias toward a deeper correction back into the 0.00980–0.01000 area.
The Bottom Line
ZK/USDT remains in a clean, well-respected uptrend. The pullback into the fib/trendline confluence held, momentum has turned back up, and as long as 0.01031 isn't lost, the path of least resistance stays higher — with 0.01120 as the first real test on the way toward the 0.0116–0.0119 zone.
This analysis is based on technical chart structure and is for informational purposes only. It is not financial advice. Cryptocurrency markets are highly volatile — always do your own research and manage risk according to your own trading plan before entering any position.
@Binance Square Official #BTCBreaks80K #BuffettBecomesBerkshireChairmanEmeritus #ZcashSpotETFTops$230MMonthlyInflow #Binance #ChartSniper
ZKsync has been one of the steadier grinders on the board over the past 24 hours, climbing in a disciplined stair-step pattern along a single rising trendline that hasn't been broken once. After tagging a fresh Higher High and pulling back to test that same trendline, price is bouncing again — and the structure still favors buyers.
Reading the Structure
The move traces back to a low near 0.0089, and from there ZK has respected one continuous rising trendline through an entire session's worth of higher lows and higher highs. Along the way it cleared a Lower High around 0.0110, consolidated, and then launched into a sharp impulsive candle that produced the session's Higher High.
Since that Higher High, price pulled back into a Fibonacci zone built from the recent swing low to that high: the 38.2% level sits at 0.01064, the 50% level just below it, and the 61.8% level at 0.01040 — all clustering right around where the rising trendline itself is currently running. That confluence held. Price bounced from this zone and is now back at 0.01096, up 1.01% on the session, with RSI at 61.11 and its moving average at 58.74 — both above 50 and both turning back up alongside price.
Why the Bounce Matters
This is the second time in the session that the trendline plus a fib support cluster has caught a pullback and turned it back into a rally. That kind of repeated respect for the same dynamic support is exactly what you want to see in a trend you're looking to trade with, not against. As long as price continues to hold above that trendline, dips are still more likely to be bought than sold.
Trade Setup — Long Bias
Aggressive entry: 0.01090–0.01100, on the current bounce continuing with RSI holding above 55Conservative entry: 0.01064–0.01070, on a deeper retest of the 38.2% fib level and rising trendline confluenceStop-loss: Below 0.01031 (the horizontal support shelf) — a break here would put price below both the trendline and the 100% fib low, invalidating the setupTarget 1: 0.01120 (retest of the session's Higher High / 0% fib)Target 2: 0.01160–0.01191 (the marked supply zone above the prior high)Target 3 (extended): 0.01250, only on strong continuation with volume backing the breakout
Invalidation to watch: A decisive close below the rising trendline, followed by a break of 0.01031, would end the higher-low sequence and shift the bias toward a deeper correction back into the 0.00980–0.01000 area.
The Bottom Line
ZK/USDT remains in a clean, well-respected uptrend. The pullback into the fib/trendline confluence held, momentum has turned back up, and as long as 0.01031 isn't lost, the path of least resistance stays higher — with 0.01120 as the first real test on the way toward the 0.0116–0.0119 zone.
This analysis is based on technical chart structure and is for informational purposes only. It is not financial advice. Cryptocurrency markets are highly volatile — always do your own research and manage risk according to your own trading plan before entering any position.
@Binance Square Official #BTCBreaks80K #BuffettBecomesBerkshireChairmanEmeritus #ZcashSpotETFTops$230MMonthlyInflow #Binance #ChartSniper
145
·
--
ບົດຄວາມ
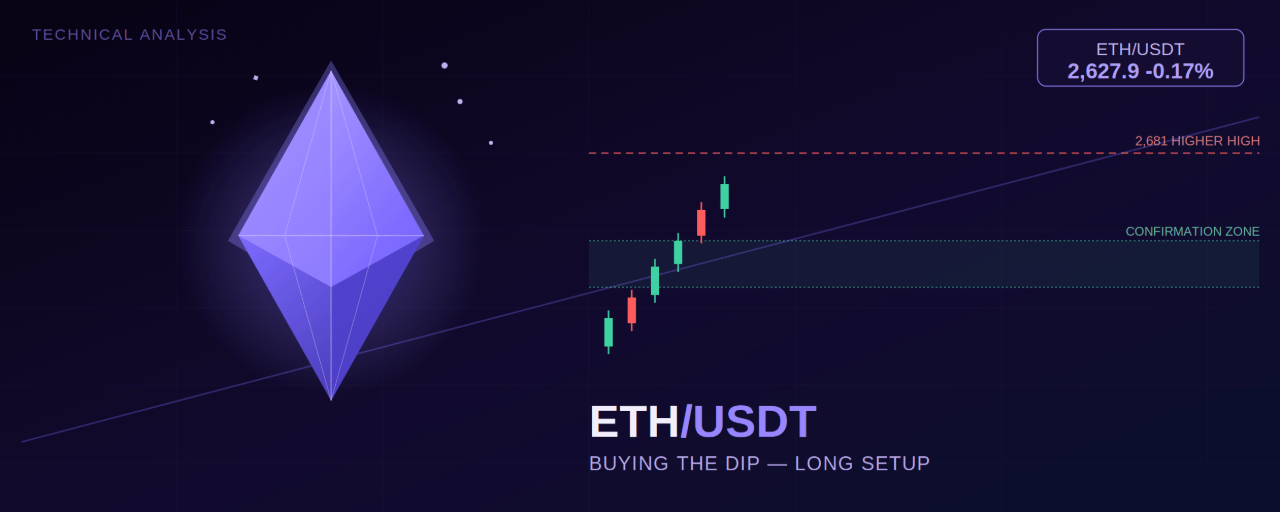
ETH/USDT: Aĉeti la Dipon Ene de Tekstlibra Altiĝanta Tendenco$ETH
Ethereum faris unu el siaj plej klaraj impulsaj raliĝoj en la lastaj sesioj, saltante for de svinga minimumo kaj veturante altiĝantan tendencan linion ĝis nova Supera Maksimumo. Nun, kiam la prezo malvarmiĝas en malprofundan retiriĝon, la demando, kiun komercistoj demandas, estas simpla: ĉu ĉi tio estas la dip por aĉeti, aŭ la komenco de io pli profunda? Jen kiel la strukturo kongruas.
Nota: grafilo de la fonto estas ETH/USD ĉe Bitstamp prefere ol ETH/USDT rekte — la du sekvas unu la alian preskaŭ ekzakte, do la niveloj malsupre validas ankaŭ por ETH/USDT.
ETH/USDT: Aĉeti la Dipon Ene de Tekstlibra Altiĝanta Tendenco
$ETH
Ethereum faris unu el siaj plej klaraj impulsaj raliĝoj en la lastaj sesioj, saltante for de svinga minimumo kaj veturante altiĝantan tendencan linion ĝis nova Supera Maksimumo. Nun, kiam la prezo malvarmiĝas en malprofundan retiriĝon, la demando, kiun komercistoj demandas, estas simpla: ĉu ĉi tio estas la dip por aĉeti, aŭ la komenco de io pli profunda? Jen kiel la strukturo kongruas.
Nota: grafilo de la fonto estas ETH/USD ĉe Bitstamp prefere ol ETH/USDT rekte — la du sekvas unu la alian preskaŭ ekzakte, do la niveloj malsupre validas ankaŭ por ETH/USDT.
Ethereum faris unu el siaj plej klaraj impulsaj raliĝoj en la lastaj sesioj, saltante for de svinga minimumo kaj veturante altiĝantan tendencan linion ĝis nova Supera Maksimumo. Nun, kiam la prezo malvarmiĝas en malprofundan retiriĝon, la demando, kiun komercistoj demandas, estas simpla: ĉu ĉi tio estas la dip por aĉeti, aŭ la komenco de io pli profunda? Jen kiel la strukturo kongruas.
Nota: grafilo de la fonto estas ETH/USD ĉe Bitstamp prefere ol ETH/USDT rekte — la du sekvas unu la alian preskaŭ ekzakte, do la niveloj malsupre validas ankaŭ por ETH/USDT.
131
·
--
ບົດຄວາມ
ເບິ່ງການແປ
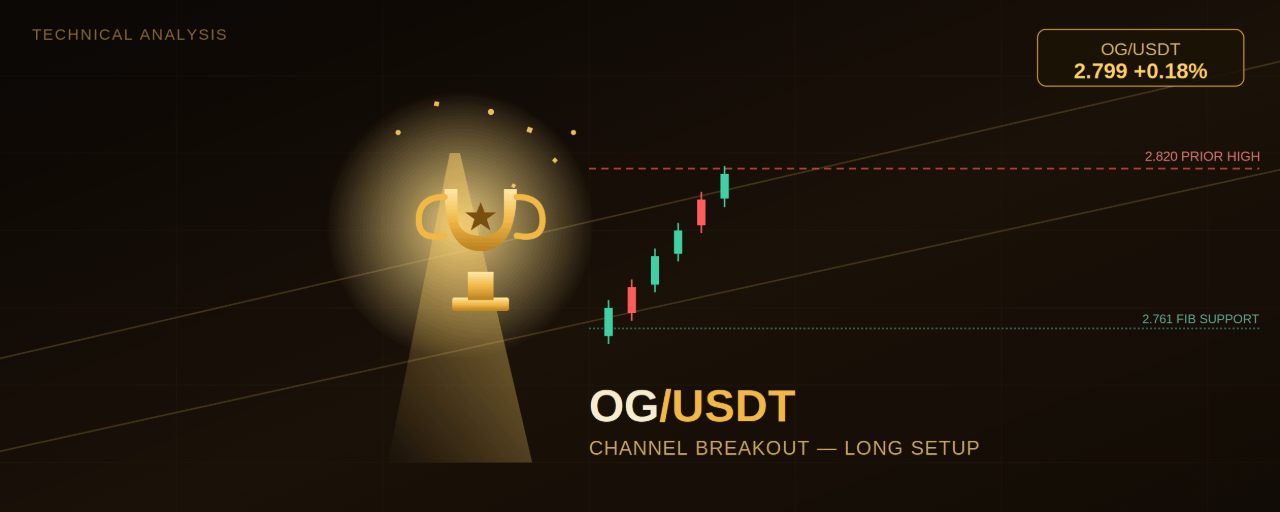
OG/USDT: The Rising Channel Is Setting Up Another Leg Toward the Highs$OG
{future}(OGUSDT)
OG Fan Token has spent the last day carving out a textbook ascending channel — and after a clean bounce from its Fibonacci demand zone, price is once again pressing toward the top of the structure. For traders tracking the 5-minute chart, this is shaping up to be a continuation setup worth watching closely, with the long side clearly favored while the channel structure holds.
Reading the Structure
The move started with a Higher High early in the session, followed by a sharp pullback into a Lower Low near 2.730. From that low, buyers stepped in decisively, and price has been climbing inside a well-defined rising channel ever since — higher lows and higher highs, bounded by two clean ascending trendlines.
A Fibonacci retracement drawn from the Lower Low up to the most recent Higher High (around 2.820) maps out the key levels in play: the 38.2% retracement at 2.780, the 50% level just below it, and the 61.8% level at 2.761. That 2.761–2.780 pocket is exactly where price pulled back to after tagging the Higher High — and it held. Buyers defended that zone, and price has since reclaimed the 38.2% level and is now trading at 2.799, just below the prior swing high.
Momentum Backs the Bulls
RSI is reading 61.45 with its moving average at 55.62 — both firmly above the 50 midline and both angled upward. That's the momentum signature of a healthy pullback-and-continuation move rather than an exhausted rally. There's no bearish divergence here: price and RSI are moving in the same direction, which supports the case for another push higher rather than a stall.
Trade Setup — Long Bias
With the channel intact, the fib demand zone respected, and RSI confirming, the long setup is the clear play here as long as price stays above the 61.8% level.
Aggressive entry: 2.795–2.805 (current market), riding the move as price pushes back toward the prior highConservative entry: 2.780–2.785, on a pullback retest of the reclaimed 38.2% level holding as supportStop-loss: Below 2.761 (the 61.8% fib / demand zone low) — a break and close under this level would invalidate the higher-low structure and open the door to a deeper retracement toward the channel's lower trendlineTarget 1: 2.820 (the prior Higher High / 0% fib level)Target 2: 2.840–2.850 (the supply zone above, aligned with the upper channel trendline)Target 3 (extended): 2.880–2.900, only on a strong breakout with volume confirmation above 2.850
Invalidation to watch: If price loses 2.761 and closes below it, the higher-low sequence breaks down and the channel's lower boundary (currently trending up near 2.75–2.76) becomes the next real test. A clean break of that trendline would shift the bias from continuation to correction.
The Bottom Line
OG/USDT is doing exactly what a healthy uptrend should do — pulling back into a fib support zone, holding it, and pushing back toward resistance with rising momentum. As long as the 2.761 level holds on any retest, the path of least resistance stays up, with 2.820 and then 2.840–2.850 as the levels to watch on the way toward a potential channel extension.
This analysis is based on technical chart structure and is for informational purposes only. It is not financial advice. Cryptocurrency markets are highly volatile — always do your own research and manage risk according to your own trading plan before entering any position.
@Binance_Square_Official #BTCBreaks80K #BuffettBecomesBerkshireChairmanEmeritus #ZcashSpotETFTops$230MMonthlyInflow #Binance #ChartSniper
OG/USDT: The Rising Channel Is Setting Up Another Leg Toward the Highs
$OG
OG Fan Token has spent the last day carving out a textbook ascending channel — and after a clean bounce from its Fibonacci demand zone, price is once again pressing toward the top of the structure. For traders tracking the 5-minute chart, this is shaping up to be a continuation setup worth watching closely, with the long side clearly favored while the channel structure holds.
Reading the Structure
The move started with a Higher High early in the session, followed by a sharp pullback into a Lower Low near 2.730. From that low, buyers stepped in decisively, and price has been climbing inside a well-defined rising channel ever since — higher lows and higher highs, bounded by two clean ascending trendlines.
A Fibonacci retracement drawn from the Lower Low up to the most recent Higher High (around 2.820) maps out the key levels in play: the 38.2% retracement at 2.780, the 50% level just below it, and the 61.8% level at 2.761. That 2.761–2.780 pocket is exactly where price pulled back to after tagging the Higher High — and it held. Buyers defended that zone, and price has since reclaimed the 38.2% level and is now trading at 2.799, just below the prior swing high.
Momentum Backs the Bulls
RSI is reading 61.45 with its moving average at 55.62 — both firmly above the 50 midline and both angled upward. That's the momentum signature of a healthy pullback-and-continuation move rather than an exhausted rally. There's no bearish divergence here: price and RSI are moving in the same direction, which supports the case for another push higher rather than a stall.
Trade Setup — Long Bias
With the channel intact, the fib demand zone respected, and RSI confirming, the long setup is the clear play here as long as price stays above the 61.8% level.
Aggressive entry: 2.795–2.805 (current market), riding the move as price pushes back toward the prior highConservative entry: 2.780–2.785, on a pullback retest of the reclaimed 38.2% level holding as supportStop-loss: Below 2.761 (the 61.8% fib / demand zone low) — a break and close under this level would invalidate the higher-low structure and open the door to a deeper retracement toward the channel's lower trendlineTarget 1: 2.820 (the prior Higher High / 0% fib level)Target 2: 2.840–2.850 (the supply zone above, aligned with the upper channel trendline)Target 3 (extended): 2.880–2.900, only on a strong breakout with volume confirmation above 2.850
Invalidation to watch: If price loses 2.761 and closes below it, the higher-low sequence breaks down and the channel's lower boundary (currently trending up near 2.75–2.76) becomes the next real test. A clean break of that trendline would shift the bias from continuation to correction.
The Bottom Line
OG/USDT is doing exactly what a healthy uptrend should do — pulling back into a fib support zone, holding it, and pushing back toward resistance with rising momentum. As long as the 2.761 level holds on any retest, the path of least resistance stays up, with 2.820 and then 2.840–2.850 as the levels to watch on the way toward a potential channel extension.
This analysis is based on technical chart structure and is for informational purposes only. It is not financial advice. Cryptocurrency markets are highly volatile — always do your own research and manage risk according to your own trading plan before entering any position.
@Binance Square Official #BTCBreaks80K #BuffettBecomesBerkshireChairmanEmeritus #ZcashSpotETFTops$230MMonthlyInflow #Binance #ChartSniper
OG Fan Token has spent the last day carving out a textbook ascending channel — and after a clean bounce from its Fibonacci demand zone, price is once again pressing toward the top of the structure. For traders tracking the 5-minute chart, this is shaping up to be a continuation setup worth watching closely, with the long side clearly favored while the channel structure holds.
Reading the Structure
The move started with a Higher High early in the session, followed by a sharp pullback into a Lower Low near 2.730. From that low, buyers stepped in decisively, and price has been climbing inside a well-defined rising channel ever since — higher lows and higher highs, bounded by two clean ascending trendlines.
A Fibonacci retracement drawn from the Lower Low up to the most recent Higher High (around 2.820) maps out the key levels in play: the 38.2% retracement at 2.780, the 50% level just below it, and the 61.8% level at 2.761. That 2.761–2.780 pocket is exactly where price pulled back to after tagging the Higher High — and it held. Buyers defended that zone, and price has since reclaimed the 38.2% level and is now trading at 2.799, just below the prior swing high.
Momentum Backs the Bulls
RSI is reading 61.45 with its moving average at 55.62 — both firmly above the 50 midline and both angled upward. That's the momentum signature of a healthy pullback-and-continuation move rather than an exhausted rally. There's no bearish divergence here: price and RSI are moving in the same direction, which supports the case for another push higher rather than a stall.
Trade Setup — Long Bias
With the channel intact, the fib demand zone respected, and RSI confirming, the long setup is the clear play here as long as price stays above the 61.8% level.
Aggressive entry: 2.795–2.805 (current market), riding the move as price pushes back toward the prior highConservative entry: 2.780–2.785, on a pullback retest of the reclaimed 38.2% level holding as supportStop-loss: Below 2.761 (the 61.8% fib / demand zone low) — a break and close under this level would invalidate the higher-low structure and open the door to a deeper retracement toward the channel's lower trendlineTarget 1: 2.820 (the prior Higher High / 0% fib level)Target 2: 2.840–2.850 (the supply zone above, aligned with the upper channel trendline)Target 3 (extended): 2.880–2.900, only on a strong breakout with volume confirmation above 2.850
Invalidation to watch: If price loses 2.761 and closes below it, the higher-low sequence breaks down and the channel's lower boundary (currently trending up near 2.75–2.76) becomes the next real test. A clean break of that trendline would shift the bias from continuation to correction.
The Bottom Line
OG/USDT is doing exactly what a healthy uptrend should do — pulling back into a fib support zone, holding it, and pushing back toward resistance with rising momentum. As long as the 2.761 level holds on any retest, the path of least resistance stays up, with 2.820 and then 2.840–2.850 as the levels to watch on the way toward a potential channel extension.
This analysis is based on technical chart structure and is for informational purposes only. It is not financial advice. Cryptocurrency markets are highly volatile — always do your own research and manage risk according to your own trading plan before entering any position.
@Binance Square Official #BTCBreaks80K #BuffettBecomesBerkshireChairmanEmeritus #ZcashSpotETFTops$230MMonthlyInflow #Binance #ChartSniper
1
561
·
--
ບົດຄວາມ
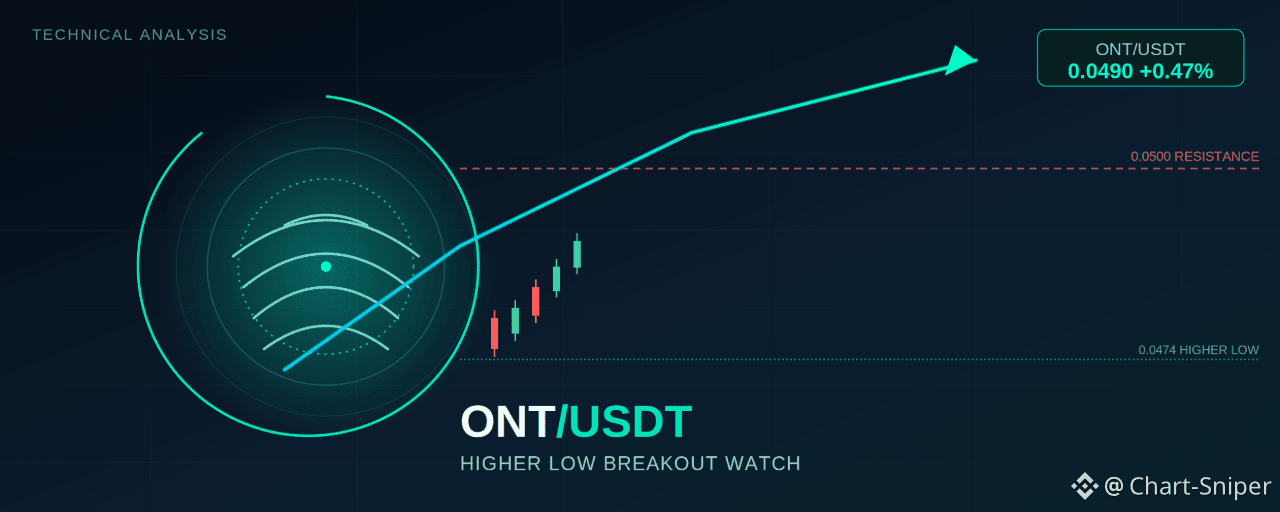
ONT/USDT: I-Higher Low Engase Iguqule Lo Mkhuba Wokwehla Uye Ohlangothini Oluhlukile$ONT
I-Ontology (ONT) isichithe ingxenye enkulu yezikhathi ezintathu igaya phansi ibhekene ne-Tether, kodwa ishadi lamaminithi angu-15 manje selibonisa izimpawu zangempela zokuqala zokuthi abathengisi sebephelelwe amandla. Ngemuva kokubeka i-Lower Low entsha, intengo isidale i-Higher Low — futhi le shintsho elilodwa ekwakhekeni wukugqabhuka komkhuba wokwehla okumele abatshalizimali/bahwebi bayibheke ngokucophelela manje.
Ukuqonda Ukwakheka
Ishadi likhuluma indaba ecacile yokwehla okunciphayo okuncibilikayo. ONT/USDT ikhombise i-Lower Low (okwehlayo okuphansi), bese iyavuka iye ku-Lower High (okuphakeme okuphansi), yabe isiphenduka futhi yaya ku-Lower High yesibili, ekugcineni yathola abathengi ku-Higher Low eduze kuka-0.0474. Lokho HL kuyintuthuko ebalulekile—yisignali yokuqala kulandelana okukhombisa ukuthi abathengisi abasenamandla okucindezela intengo iye phansi okusha.
ONT/USDT: I-Higher Low Engase Iguqule Lo Mkhuba Wokwehla Uye Ohlangothini Oluhlukile
$ONT
I-Ontology (ONT) isichithe ingxenye enkulu yezikhathi ezintathu igaya phansi ibhekene ne-Tether, kodwa ishadi lamaminithi angu-15 manje selibonisa izimpawu zangempela zokuqala zokuthi abathengisi sebephelelwe amandla. Ngemuva kokubeka i-Lower Low entsha, intengo isidale i-Higher Low — futhi le shintsho elilodwa ekwakhekeni wukugqabhuka komkhuba wokwehla okumele abatshalizimali/bahwebi bayibheke ngokucophelela manje.
Ukuqonda Ukwakheka
Ishadi likhuluma indaba ecacile yokwehla okunciphayo okuncibilikayo. ONT/USDT ikhombise i-Lower Low (okwehlayo okuphansi), bese iyavuka iye ku-Lower High (okuphakeme okuphansi), yabe isiphenduka futhi yaya ku-Lower High yesibili, ekugcineni yathola abathengi ku-Higher Low eduze kuka-0.0474. Lokho HL kuyintuthuko ebalulekile—yisignali yokuqala kulandelana okukhombisa ukuthi abathengisi abasenamandla okucindezela intengo iye phansi okusha.
I-Ontology (ONT) isichithe ingxenye enkulu yezikhathi ezintathu igaya phansi ibhekene ne-Tether, kodwa ishadi lamaminithi angu-15 manje selibonisa izimpawu zangempela zokuqala zokuthi abathengisi sebephelelwe amandla. Ngemuva kokubeka i-Lower Low entsha, intengo isidale i-Higher Low — futhi le shintsho elilodwa ekwakhekeni wukugqabhuka komkhuba wokwehla okumele abatshalizimali/bahwebi bayibheke ngokucophelela manje.
Ukuqonda Ukwakheka
Ishadi likhuluma indaba ecacile yokwehla okunciphayo okuncibilikayo. ONT/USDT ikhombise i-Lower Low (okwehlayo okuphansi), bese iyavuka iye ku-Lower High (okuphakeme okuphansi), yabe isiphenduka futhi yaya ku-Lower High yesibili, ekugcineni yathola abathengi ku-Higher Low eduze kuka-0.0474. Lokho HL kuyintuthuko ebalulekile—yisignali yokuqala kulandelana okukhombisa ukuthi abathengisi abasenamandla okucindezela intengo iye phansi okusha.
157
·
--
ບົດຄວາມ
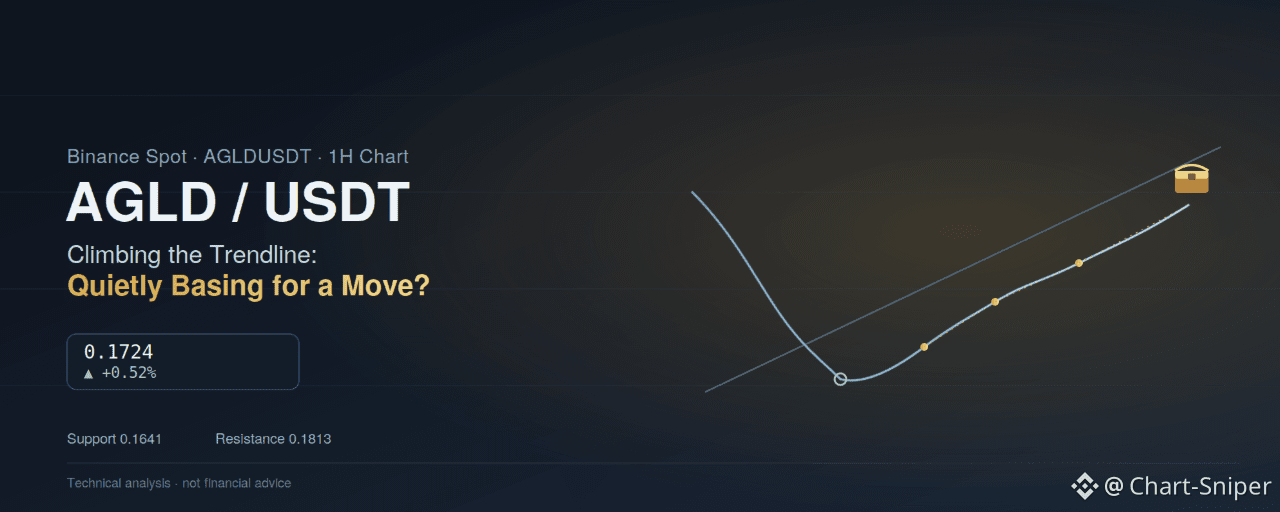
AGLD/USDT Iyasukuma Ngaphezu Komugqa Okhuphukayo—Ingabe I-Adventure Gold Iyakheleka Ngokuthula Ukuze Iyinyakaze?$AGLD
Ishadi le-1H | I-Binance Spot | AGLDUSDT | September 16, 2026
I-Adventure Gold (AGLD) iyathengiswa ku-0.1724, ikhuphuke kancane +0.52% kule sikhathi ngemva kokuvula ku-0.1716 futhi ihamba phakathi kuka-0.1716 no-0.1729. Uma kuqhathaniswa nezilungiselelo ezisheshayo, eziqhumayo kwenye indawo ebhodini okwamanje, ishadi le-AGLD liyaqina—kodwa ngaphansi kwalokho ukuthula kukhona isakhiwo okufanele sibhekwe: itokheni eye yehla ngamandla isuka phezulu kwakamuva, yathola phansi, futhi ibilokhu ikhuphuka kancane kancane emuva kwethrendi elivikeliwe (defended trendline) usuku olungaphezu kwelilodwa, ibheke ekumelaneni (resistance) okwamisa ukugxuma kwayo kokugcina.
AGLD/USDT Iyasukuma Ngaphezu Komugqa Okhuphukayo—Ingabe I-Adventure Gold Iyakheleka Ngokuthula Ukuze Iyinyakaze?
$AGLD
Ishadi le-1H | I-Binance Spot | AGLDUSDT | September 16, 2026
I-Adventure Gold (AGLD) iyathengiswa ku-0.1724, ikhuphuke kancane +0.52% kule sikhathi ngemva kokuvula ku-0.1716 futhi ihamba phakathi kuka-0.1716 no-0.1729. Uma kuqhathaniswa nezilungiselelo ezisheshayo, eziqhumayo kwenye indawo ebhodini okwamanje, ishadi le-AGLD liyaqina—kodwa ngaphansi kwalokho ukuthula kukhona isakhiwo okufanele sibhekwe: itokheni eye yehla ngamandla isuka phezulu kwakamuva, yathola phansi, futhi ibilokhu ikhuphuka kancane kancane emuva kwethrendi elivikeliwe (defended trendline) usuku olungaphezu kwelilodwa, ibheke ekumelaneni (resistance) okwamisa ukugxuma kwayo kokugcina.
Ishadi le-1H | I-Binance Spot | AGLDUSDT | September 16, 2026
I-Adventure Gold (AGLD) iyathengiswa ku-0.1724, ikhuphuke kancane +0.52% kule sikhathi ngemva kokuvula ku-0.1716 futhi ihamba phakathi kuka-0.1716 no-0.1729. Uma kuqhathaniswa nezilungiselelo ezisheshayo, eziqhumayo kwenye indawo ebhodini okwamanje, ishadi le-AGLD liyaqina—kodwa ngaphansi kwalokho ukuthula kukhona isakhiwo okufanele sibhekwe: itokheni eye yehla ngamandla isuka phezulu kwakamuva, yathola phansi, futhi ibilokhu ikhuphuka kancane kancane emuva kwethrendi elivikeliwe (defended trendline) usuku olungaphezu kwelilodwa, ibheke ekumelaneni (resistance) okwamisa ukugxuma kwayo kokugcina.
113
·
--
ບົດຄວາມ
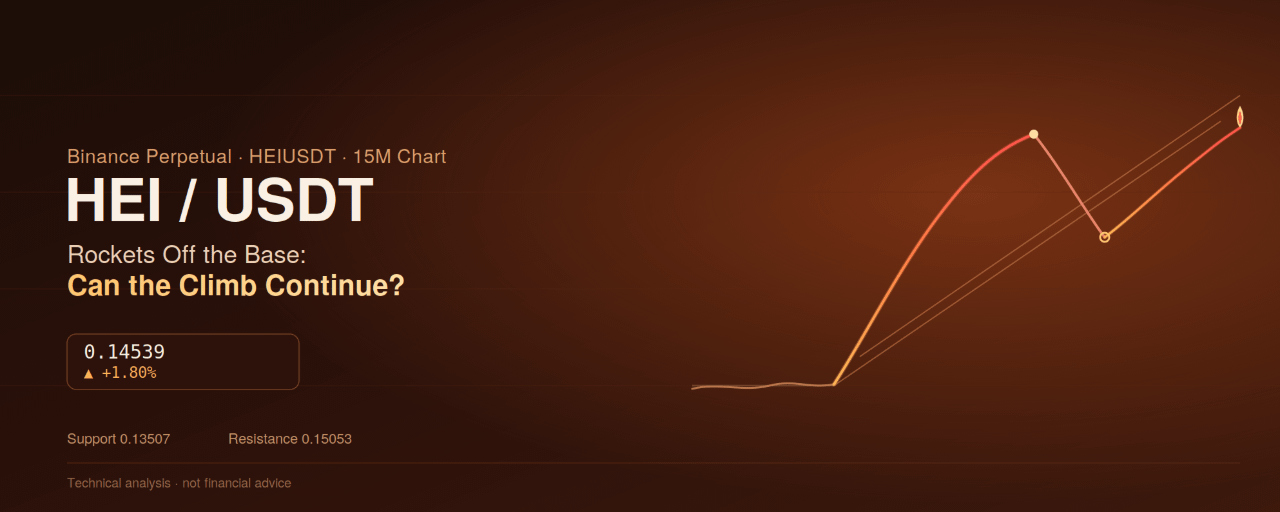
HEI/USDT ພຸ້ງອອກຈາກຖານຫຼາຍມື້ — ຊ່ອງນີ້ຍັງສາມາດຂຶ້ນຕໍ່ໄດ້ບໍ?$HEI
15M ຊາດ | Binance Perpetual | HEIUSDT | ວັນທີ 16 ກັນຍາ 2026
Heima (HEI) ກຳລັງຊື້ຂາຍຢູ່ທີ່ 0.14539, ເພີ່ມຂຶ້ນ +1.80% ຢ່າງແຮງຫຼັງຈາກເປີດຢູ່ທີ່ 0.14282 ແລະແກວ່ງລະຫວ່າງ 0.14143 ແລະ 0.14608. ຕົວເລກປະຈຳວັນນີ້ກໍແທบຈະບໍ່ທັນສະທ້ອນຂະໜາດຂອງສິ່ງທີ່ເກີດຂຶ້ນໃນ 24 ຊົ່ວໂມງຜ່ານມາ: HEI ໄດ້ຫັກອອກຈາກຖານອັນຍາວ ແລະຮາບພຽງໄປແລ້ວ ແລະຂຶ້ນໄປຢ່າງເກືອບແບບເປັນເສັ້ນໂค້ງ (parabolic), ພຸ້ງຂຶ້ນຫຼາຍກວ່າ 30% ຈາກລາຄາຕ່ຳສຸດໃນຊ່ວງເຊົ້າ ຈົນເຖິງລາຄາສູງໃໝ່ ກ່ອນຈະເຢັນລົງກັບເປັນການດຶງຖອນຢ່າງຄລາສສິກ (textbook pullback) ທີ່ຕອນນີ້ກຳລັງຄ່ອຍໆກັບມາສູ່ຝ່າຍຂຶ້ນ.
HEI/USDT ພຸ້ງອອກຈາກຖານຫຼາຍມື້ — ຊ່ອງນີ້ຍັງສາມາດຂຶ້ນຕໍ່ໄດ້ບໍ?
$HEI
15M ຊາດ | Binance Perpetual | HEIUSDT | ວັນທີ 16 ກັນຍາ 2026
Heima (HEI) ກຳລັງຊື້ຂາຍຢູ່ທີ່ 0.14539, ເພີ່ມຂຶ້ນ +1.80% ຢ່າງແຮງຫຼັງຈາກເປີດຢູ່ທີ່ 0.14282 ແລະແກວ່ງລະຫວ່າງ 0.14143 ແລະ 0.14608. ຕົວເລກປະຈຳວັນນີ້ກໍແທบຈະບໍ່ທັນສະທ້ອນຂະໜາດຂອງສິ່ງທີ່ເກີດຂຶ້ນໃນ 24 ຊົ່ວໂມງຜ່ານມາ: HEI ໄດ້ຫັກອອກຈາກຖານອັນຍາວ ແລະຮາບພຽງໄປແລ້ວ ແລະຂຶ້ນໄປຢ່າງເກືອບແບບເປັນເສັ້ນໂค້ງ (parabolic), ພຸ້ງຂຶ້ນຫຼາຍກວ່າ 30% ຈາກລາຄາຕ່ຳສຸດໃນຊ່ວງເຊົ້າ ຈົນເຖິງລາຄາສູງໃໝ່ ກ່ອນຈະເຢັນລົງກັບເປັນການດຶງຖອນຢ່າງຄລາສສິກ (textbook pullback) ທີ່ຕອນນີ້ກຳລັງຄ່ອຍໆກັບມາສູ່ຝ່າຍຂຶ້ນ.
15M ຊາດ | Binance Perpetual | HEIUSDT | ວັນທີ 16 ກັນຍາ 2026
Heima (HEI) ກຳລັງຊື້ຂາຍຢູ່ທີ່ 0.14539, ເພີ່ມຂຶ້ນ +1.80% ຢ່າງແຮງຫຼັງຈາກເປີດຢູ່ທີ່ 0.14282 ແລະແກວ່ງລະຫວ່າງ 0.14143 ແລະ 0.14608. ຕົວເລກປະຈຳວັນນີ້ກໍແທบຈະບໍ່ທັນສະທ້ອນຂະໜາດຂອງສິ່ງທີ່ເກີດຂຶ້ນໃນ 24 ຊົ່ວໂມງຜ່ານມາ: HEI ໄດ້ຫັກອອກຈາກຖານອັນຍາວ ແລະຮາບພຽງໄປແລ້ວ ແລະຂຶ້ນໄປຢ່າງເກືອບແບບເປັນເສັ້ນໂค້ງ (parabolic), ພຸ້ງຂຶ້ນຫຼາຍກວ່າ 30% ຈາກລາຄາຕ່ຳສຸດໃນຊ່ວງເຊົ້າ ຈົນເຖິງລາຄາສູງໃໝ່ ກ່ອນຈະເຢັນລົງກັບເປັນການດຶງຖອນຢ່າງຄລາສສິກ (textbook pullback) ທີ່ຕອນນີ້ກຳລັງຄ່ອຍໆກັບມາສູ່ຝ່າຍຂຶ້ນ.
127
·
--
ບົດຄວາມ
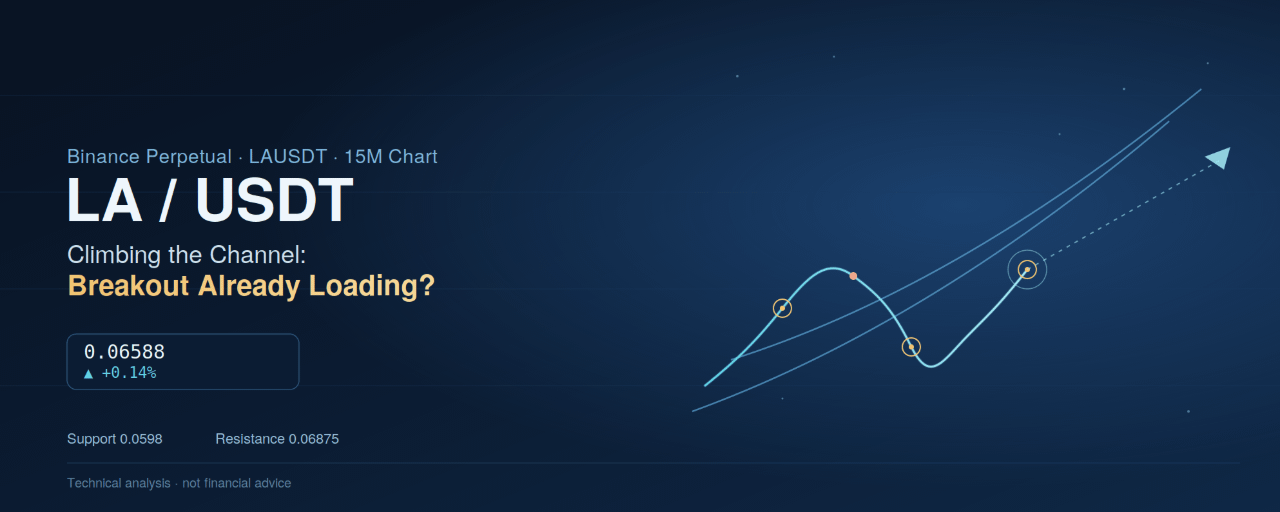
I-LA/USDT Iyakhuphuka Ngesikhathi Ngenkathi Ikhuphuka — Ingabe Ukuqhuma Okulandelayo Sekuqaliwe Ukulayisha?$LA
15M Charta | Binance Perpetual | LAUSDT | Septembari 16, 2026
I-Lagrange (LA) iyahweba ku-0.06588, ikhuphuke kancane +0.14% esikhathini seseshini ngemva kokuvula ku-0.06578 futhi ihamba phakathi kwephezulu elingu-0.06597 nelezansi elingu-0.06561. Ikhandlela lansuku zonke libukeka liyisicaba, kodwa isakhiwo esingaphansi akusona esinganyakazi — ngemuva kokwehla okubukhali ezinsukwini ezimbili ezedlule ekuqaleni kwaleli sonto, u-LA ube esengosuku nengxenye yakugcina ekha umzila okhuphukayo wangempela, ubhampisa kusuka emgqeni wawo ophansi okwesithathu njengoba ugaya ubheke ukumelana okuvimbe umzamo wakhe wokugcina wokukhuphuka.
I-LA/USDT Iyakhuphuka Ngesikhathi Ngenkathi Ikhuphuka — Ingabe Ukuqhuma Okulandelayo Sekuqaliwe Ukulayisha?
$LA
15M Charta | Binance Perpetual | LAUSDT | Septembari 16, 2026
I-Lagrange (LA) iyahweba ku-0.06588, ikhuphuke kancane +0.14% esikhathini seseshini ngemva kokuvula ku-0.06578 futhi ihamba phakathi kwephezulu elingu-0.06597 nelezansi elingu-0.06561. Ikhandlela lansuku zonke libukeka liyisicaba, kodwa isakhiwo esingaphansi akusona esinganyakazi — ngemuva kokwehla okubukhali ezinsukwini ezimbili ezedlule ekuqaleni kwaleli sonto, u-LA ube esengosuku nengxenye yakugcina ekha umzila okhuphukayo wangempela, ubhampisa kusuka emgqeni wawo ophansi okwesithathu njengoba ugaya ubheke ukumelana okuvimbe umzamo wakhe wokugcina wokukhuphuka.
15M Charta | Binance Perpetual | LAUSDT | Septembari 16, 2026
I-Lagrange (LA) iyahweba ku-0.06588, ikhuphuke kancane +0.14% esikhathini seseshini ngemva kokuvula ku-0.06578 futhi ihamba phakathi kwephezulu elingu-0.06597 nelezansi elingu-0.06561. Ikhandlela lansuku zonke libukeka liyisicaba, kodwa isakhiwo esingaphansi akusona esinganyakazi — ngemuva kokwehla okubukhali ezinsukwini ezimbili ezedlule ekuqaleni kwaleli sonto, u-LA ube esengosuku nengxenye yakugcina ekha umzila okhuphukayo wangempela, ubhampisa kusuka emgqeni wawo ophansi okwesithathu njengoba ugaya ubheke ukumelana okuvimbe umzamo wakhe wokugcina wokukhuphuka.
260
·
--
📉 $ZEC USDT — ການຕັ້ງຄ່າ SHORT
ZEC ຢູ່ປະມານ $1,178–$1,217, ຫຼັງຈາກການປັບຕົວແຮງຢ່າງສົດໃໝ່ຈາກເໜືອ $1,200. ແຮງເຄື່ອນຍັງບໍ່ສະໝໍ່າສະເໝີ, ມີຜູ້ຂາຍເຄື່ອນໄຫວຫຼັງຈາກການປ່ຽນທິດທາງ.
🔴 ເຂົ້າ SHORT: ລາຄາຕະຫຼາດ
🛑 SL: $1,300
🎯 TP1: $1,100
🎯 TP2: $1,020
🎯 TP3: $950
⚡ ການເຂົ້າ: ລາຄາຕະຫຼາດ — ສາມາດໃຊ້ໄດ້ຕອນນີ້.
⚠️ ບໍ່ແມ່ນຄໍາແນະນໍາດ້ານການເງິນ. ຈັດການຄວາມສ່ຽງແນະນໍາຢ່າງລະມັດລະວັງ.
@Binance_Square_Official #FedRateWatch #ZcashRises6% #XRPSinks10% #Binance #ChartSniper
{future}(ZECUSDT)
📉 $ZEC USDT — ການຕັ້ງຄ່າ SHORT
ZEC ຢູ່ປະມານ $1,178–$1,217, ຫຼັງຈາກການປັບຕົວແຮງຢ່າງສົດໃໝ່ຈາກເໜືອ $1,200. ແຮງເຄື່ອນຍັງບໍ່ສະໝໍ່າສະເໝີ, ມີຜູ້ຂາຍເຄື່ອນໄຫວຫຼັງຈາກການປ່ຽນທິດທາງ.
🔴 ເຂົ້າ SHORT: ລາຄາຕະຫຼາດ
🛑 SL: $1,300
🎯 TP1: $1,100
🎯 TP2: $1,020
🎯 TP3: $950
⚡ ການເຂົ້າ: ລາຄາຕະຫຼາດ — ສາມາດໃຊ້ໄດ້ຕອນນີ້.
⚠️ ບໍ່ແມ່ນຄໍາແນະນໍາດ້ານການເງິນ. ຈັດການຄວາມສ່ຽງແນະນໍາຢ່າງລະມັດລະວັງ.
@Binance Square Official #FedRateWatch #ZcashRises6% #XRPSinks10% #Binance #ChartSniper
ZEC ຢູ່ປະມານ $1,178–$1,217, ຫຼັງຈາກການປັບຕົວແຮງຢ່າງສົດໃໝ່ຈາກເໜືອ $1,200. ແຮງເຄື່ອນຍັງບໍ່ສະໝໍ່າສະເໝີ, ມີຜູ້ຂາຍເຄື່ອນໄຫວຫຼັງຈາກການປ່ຽນທິດທາງ.
🔴 ເຂົ້າ SHORT: ລາຄາຕະຫຼາດ
🛑 SL: $1,300
🎯 TP1: $1,100
🎯 TP2: $1,020
🎯 TP3: $950
⚡ ການເຂົ້າ: ລາຄາຕະຫຼາດ — ສາມາດໃຊ້ໄດ້ຕອນນີ້.
⚠️ ບໍ່ແມ່ນຄໍາແນະນໍາດ້ານການເງິນ. ຈັດການຄວາມສ່ຽງແນະນໍາຢ່າງລະມັດລະວັງ.
@Binance Square Official #FedRateWatch #ZcashRises6% #XRPSinks10% #Binance #ChartSniper
191
·
--

ບົດຄວາມ
I-CATI/USDT Yakha Izitebhisi Ezisuka Ezingxenyeni Zasezansi — Ingabe Umzila Olandelayo Phezulu Uyafika?$CATI
1H Chart | Binance Perpetual | CATIUSDT | September 11, 2026
I-Catizen (CATI) iyahweba ku-0.06116, ikhuphuke ngo-+0.81% ngosuku ngemva kokuvulwa ngo-0.06066 futhi ihambe phakathi kwephezulu elingu-0.06148 kanye ne-lows elingu-0.06061. Lokho kuwuhla lwansuku zonke oluthule, kodwa luhlala phezulu kwesinye sezinhlelo zokubuyisela ezakhayo kakhulu esikhaleni — ithokheni eyawa kanzima, yathola phansi okusimame, futhi ibisonta eledlule lakha ngempela izitebhisi zama-high aphezulu ngaphansi kocwecwe oluchazwe kahle lokumelana.
Funda Isakhiwo
I-CATI/USDT Yakha Izitebhisi Ezisuka Ezingxenyeni Zasezansi — Ingabe Umzila Olandelayo Phezulu Uyafika?
$CATI
1H Chart | Binance Perpetual | CATIUSDT | September 11, 2026
I-Catizen (CATI) iyahweba ku-0.06116, ikhuphuke ngo-+0.81% ngosuku ngemva kokuvulwa ngo-0.06066 futhi ihambe phakathi kwephezulu elingu-0.06148 kanye ne-lows elingu-0.06061. Lokho kuwuhla lwansuku zonke oluthule, kodwa luhlala phezulu kwesinye sezinhlelo zokubuyisela ezakhayo kakhulu esikhaleni — ithokheni eyawa kanzima, yathola phansi okusimame, futhi ibisonta eledlule lakha ngempela izitebhisi zama-high aphezulu ngaphansi kocwecwe oluchazwe kahle lokumelana.
Funda Isakhiwo
1H Chart | Binance Perpetual | CATIUSDT | September 11, 2026
I-Catizen (CATI) iyahweba ku-0.06116, ikhuphuke ngo-+0.81% ngosuku ngemva kokuvulwa ngo-0.06066 futhi ihambe phakathi kwephezulu elingu-0.06148 kanye ne-lows elingu-0.06061. Lokho kuwuhla lwansuku zonke oluthule, kodwa luhlala phezulu kwesinye sezinhlelo zokubuyisela ezakhayo kakhulu esikhaleni — ithokheni eyawa kanzima, yathola phansi okusimame, futhi ibisonta eledlule lakha ngempela izitebhisi zama-high aphezulu ngaphansi kocwecwe oluchazwe kahle lokumelana.
Funda Isakhiwo
1
127
·
--

ບົດຄວາມ
NOT/USDT បង្កើតជាកូអ៊ីលនៅចំណុចប្រសព្វ — តើ Notcoin នឹងបំបែកទៅខាងណា?$NOT
1H សម្គាល់ | Binance Spot | NOTUSDT | ថ្ងៃទី 11 ខែកញ្ញា ឆ្នាំ 2026
Notcoin (NOT) កំពុងជួញដូរ នៅ 0.000431 កើនឡើងតិចតួច +0.70% ក្នុងមួយថ្ងៃ បន្ទាប់ពីបើកនៅ 0.000428 និងមានចន្លោះពី 0.000428 ទៅ 0.000432។ មិនដូចចលនាខ្លាំង និងសម្រេចចិត្ត ដែលបង្ហាញឡើងនៅកន្លែងផ្សេងៗលើបន្ទះនៅពេលនេះ ផែនទីរបស់ NOT ប្រាប់រឿងអំពីភាពស្ទាក់ស្ទើរ — គឺថូខឹនមួយដែលជាប់នៅចន្លោះរវាង uptrend ដែលខូច ហើយជើងទម្រ (support shelf) ដែលរក្សាបានលើសពីមួយសប្តាហ៍ ដោយតម្លៃកំពុងបង្រួមចូលក្នុងចន្លោះតូចជាងៗ និងតូចជាងៗ ខណៈដែលវាកាន់តែខិតជិតចំណុចសម្រេចច្បាស់មួយ។
NOT/USDT បង្កើតជាកូអ៊ីលនៅចំណុចប្រសព្វ — តើ Notcoin នឹងបំបែកទៅខាងណា?
$NOT
1H សម្គាល់ | Binance Spot | NOTUSDT | ថ្ងៃទី 11 ខែកញ្ញា ឆ្នាំ 2026
Notcoin (NOT) កំពុងជួញដូរ នៅ 0.000431 កើនឡើងតិចតួច +0.70% ក្នុងមួយថ្ងៃ បន្ទាប់ពីបើកនៅ 0.000428 និងមានចន្លោះពី 0.000428 ទៅ 0.000432។ មិនដូចចលនាខ្លាំង និងសម្រេចចិត្ត ដែលបង្ហាញឡើងនៅកន្លែងផ្សេងៗលើបន្ទះនៅពេលនេះ ផែនទីរបស់ NOT ប្រាប់រឿងអំពីភាពស្ទាក់ស្ទើរ — គឺថូខឹនមួយដែលជាប់នៅចន្លោះរវាង uptrend ដែលខូច ហើយជើងទម្រ (support shelf) ដែលរក្សាបានលើសពីមួយសប្តាហ៍ ដោយតម្លៃកំពុងបង្រួមចូលក្នុងចន្លោះតូចជាងៗ និងតូចជាងៗ ខណៈដែលវាកាន់តែខិតជិតចំណុចសម្រេចច្បាស់មួយ។
1H សម្គាល់ | Binance Spot | NOTUSDT | ថ្ងៃទី 11 ខែកញ្ញា ឆ្នាំ 2026
Notcoin (NOT) កំពុងជួញដូរ នៅ 0.000431 កើនឡើងតិចតួច +0.70% ក្នុងមួយថ្ងៃ បន្ទាប់ពីបើកនៅ 0.000428 និងមានចន្លោះពី 0.000428 ទៅ 0.000432។ មិនដូចចលនាខ្លាំង និងសម្រេចចិត្ត ដែលបង្ហាញឡើងនៅកន្លែងផ្សេងៗលើបន្ទះនៅពេលនេះ ផែនទីរបស់ NOT ប្រាប់រឿងអំពីភាពស្ទាក់ស្ទើរ — គឺថូខឹនមួយដែលជាប់នៅចន្លោះរវាង uptrend ដែលខូច ហើយជើងទម្រ (support shelf) ដែលរក្សាបានលើសពីមួយសប្តាហ៍ ដោយតម្លៃកំពុងបង្រួមចូលក្នុងចន្លោះតូចជាងៗ និងតូចជាងៗ ខណៈដែលវាកាន់តែខិតជិតចំណុចសម្រេចច្បាស់មួយ។
138
·
--

ບົດຄວາມ
Sumasabog ang THETA/USDT Mula sa mga Ibaba — Nagsisimula Na ba ang Isang Bagong Uptrend?$THETA
1H Iskedyul | Binance Perpetual | THETAUSDT | Setyembre 11, 2026
Ang Theta Token ay nagte-trade sa 0.1906, tumaas nang +1.06% ngayong araw matapos magbukas sa 0.1886 at umiindayog sa pagitan ng mababang 0.1884 at mataas na 0.1914. Ang daily candle ay mukhang hindi masyadong kapansin-pansin sa sarili nito, ngunit nakatayo ito sa ibabaw ng isa sa pinakamatalas na impulsive moves na ginawa ng THETA sa loob ng mga linggo—isang rally na nagtulak sa presyo mula sa bagong mababang malapit sa 0.1685 hanggang sa mas mataas na high na lampas sa 0.2073 sa loob lamang ng ilang oras, bago bumagal sa isang malusog na retracement na ngayon ay naghahanda ng susunod na puntong pangdesisyon.
Sumasabog ang THETA/USDT Mula sa mga Ibaba — Nagsisimula Na ba ang Isang Bagong Uptrend?
$THETA
1H Iskedyul | Binance Perpetual | THETAUSDT | Setyembre 11, 2026
Ang Theta Token ay nagte-trade sa 0.1906, tumaas nang +1.06% ngayong araw matapos magbukas sa 0.1886 at umiindayog sa pagitan ng mababang 0.1884 at mataas na 0.1914. Ang daily candle ay mukhang hindi masyadong kapansin-pansin sa sarili nito, ngunit nakatayo ito sa ibabaw ng isa sa pinakamatalas na impulsive moves na ginawa ng THETA sa loob ng mga linggo—isang rally na nagtulak sa presyo mula sa bagong mababang malapit sa 0.1685 hanggang sa mas mataas na high na lampas sa 0.2073 sa loob lamang ng ilang oras, bago bumagal sa isang malusog na retracement na ngayon ay naghahanda ng susunod na puntong pangdesisyon.
1H Iskedyul | Binance Perpetual | THETAUSDT | Setyembre 11, 2026
Ang Theta Token ay nagte-trade sa 0.1906, tumaas nang +1.06% ngayong araw matapos magbukas sa 0.1886 at umiindayog sa pagitan ng mababang 0.1884 at mataas na 0.1914. Ang daily candle ay mukhang hindi masyadong kapansin-pansin sa sarili nito, ngunit nakatayo ito sa ibabaw ng isa sa pinakamatalas na impulsive moves na ginawa ng THETA sa loob ng mga linggo—isang rally na nagtulak sa presyo mula sa bagong mababang malapit sa 0.1685 hanggang sa mas mataas na high na lampas sa 0.2073 sa loob lamang ng ilang oras, bago bumagal sa isang malusog na retracement na ngayon ay naghahanda ng susunod na puntong pangdesisyon.
70
·
--

ບົດຄວາມ
AT/USDT ຄືນທຸກລະດັບທີ່ສູນເສຍ — ທິດທາງປ່ຽນແລ້ວບໍ?$AT
Chart 1H | Binance Perpetual | ATUSDT | 11 ກັນຍາ 2026
AT ກຳລັງຊື້ຂາຍຢູ່ທີ່ 0.1529, ເພີ່ມຂຶ້ນ +0.53% ໃນແຕ່ລະຊ່ວງ ຫຼັງຈາກພິມຄ່າສູງ 0.1536 ແລະຄ່າຕໍ່າ 0.1519. ຈໍານວນປະຈໍາວັນທີ່ບໍ່ຫຼາຍນີ້ ກຳລັງບອກບໍ່ໝົດສິ່ງທີ່ເກີດຂຶ້ນໃນຊາດ: ໃນ 24 ຊົ່ວໂມງທີ່ຜ່ານມາ, AT ໄດ້ຈັດຮອບການປັບທິດທີ່ແຮງສຸດໜຶ່ງຂອງຊ່ວງທີ່ຜ່ານມາ, ພຸ່ງຜ່ານກຸ່ມຂອງລະດັບຕ້ານທານກ່ອນໜ້າທີ່ເຄີຍຈຳກັດທຸກຄັ້ງທີ່ຂຶ້ນລະດັບຕັ້ງແຕ່ high ຂອງ 7 ກັນຍາ. ນີ້ແມ່ນການເຄື່ອນໄຫວທີ່ປ່ຽນ "ເຝົ້າເບິ່ງແລະລໍຖ້າ" ຈາກຊາດໃຫ້ກາຍເປັນການຕັ້ງຄ່າທີ່ເປັນກິດຈະກໍາ.
AT/USDT ຄືນທຸກລະດັບທີ່ສູນເສຍ — ທິດທາງປ່ຽນແລ້ວບໍ?
$AT
Chart 1H | Binance Perpetual | ATUSDT | 11 ກັນຍາ 2026
AT ກຳລັງຊື້ຂາຍຢູ່ທີ່ 0.1529, ເພີ່ມຂຶ້ນ +0.53% ໃນແຕ່ລະຊ່ວງ ຫຼັງຈາກພິມຄ່າສູງ 0.1536 ແລະຄ່າຕໍ່າ 0.1519. ຈໍານວນປະຈໍາວັນທີ່ບໍ່ຫຼາຍນີ້ ກຳລັງບອກບໍ່ໝົດສິ່ງທີ່ເກີດຂຶ້ນໃນຊາດ: ໃນ 24 ຊົ່ວໂມງທີ່ຜ່ານມາ, AT ໄດ້ຈັດຮອບການປັບທິດທີ່ແຮງສຸດໜຶ່ງຂອງຊ່ວງທີ່ຜ່ານມາ, ພຸ່ງຜ່ານກຸ່ມຂອງລະດັບຕ້ານທານກ່ອນໜ້າທີ່ເຄີຍຈຳກັດທຸກຄັ້ງທີ່ຂຶ້ນລະດັບຕັ້ງແຕ່ high ຂອງ 7 ກັນຍາ. ນີ້ແມ່ນການເຄື່ອນໄຫວທີ່ປ່ຽນ "ເຝົ້າເບິ່ງແລະລໍຖ້າ" ຈາກຊາດໃຫ້ກາຍເປັນການຕັ້ງຄ່າທີ່ເປັນກິດຈະກໍາ.
Chart 1H | Binance Perpetual | ATUSDT | 11 ກັນຍາ 2026
AT ກຳລັງຊື້ຂາຍຢູ່ທີ່ 0.1529, ເພີ່ມຂຶ້ນ +0.53% ໃນແຕ່ລະຊ່ວງ ຫຼັງຈາກພິມຄ່າສູງ 0.1536 ແລະຄ່າຕໍ່າ 0.1519. ຈໍານວນປະຈໍາວັນທີ່ບໍ່ຫຼາຍນີ້ ກຳລັງບອກບໍ່ໝົດສິ່ງທີ່ເກີດຂຶ້ນໃນຊາດ: ໃນ 24 ຊົ່ວໂມງທີ່ຜ່ານມາ, AT ໄດ້ຈັດຮອບການປັບທິດທີ່ແຮງສຸດໜຶ່ງຂອງຊ່ວງທີ່ຜ່ານມາ, ພຸ່ງຜ່ານກຸ່ມຂອງລະດັບຕ້ານທານກ່ອນໜ້າທີ່ເຄີຍຈຳກັດທຸກຄັ້ງທີ່ຂຶ້ນລະດັບຕັ້ງແຕ່ high ຂອງ 7 ກັນຍາ. ນີ້ແມ່ນການເຄື່ອນໄຫວທີ່ປ່ຽນ "ເຝົ້າເບິ່ງແລະລໍຖ້າ" ຈາກຊາດໃຫ້ກາຍເປັນການຕັ້ງຄ່າທີ່ເປັນກິດຈະກໍາ.
104
·
--

ບົດຄວາມ
I-LIT/USDT Yenqatshiwe Futhi — Ingabe I-Downtrend Ilungele Elinye Isinyathelo Esiya Phansi?$LIT
15M Chart | Binance Perpetual | LITUSDT | 11 September 2026
I-Lighter (LIT) iyahweba ku-4.4168 ngemva kokuvula iseshini ku-4.4160 futhi ishintshashintsha phakathi kwephuzu eliphakeme elingu-4.4340 neliphansi elingu-4.3645 — ikhandlela elizolile, cishe eliyi-flat phezulu, kodwa ukwakheka okungaphansi kukhuluma indaba enesinqumo kakhulu. Selokhu kwafakwa i-high ephakeme ngase-5.25 ngo-September 9, i-LIT ibe iqopha umsele wokwehla wencwadi: ama-higher highs aphansi, ukuphuka okuqondile komkhawulo ophansi wohla lwangaphambilini, kanye nokwenqatshwa emugqeni wokumelana osobala okube sekuzanywa futhi kwenqatshwa izikhathi ezintathu ezahlukene.
I-LIT/USDT Yenqatshiwe Futhi — Ingabe I-Downtrend Ilungele Elinye Isinyathelo Esiya Phansi?
$LIT
15M Chart | Binance Perpetual | LITUSDT | 11 September 2026
I-Lighter (LIT) iyahweba ku-4.4168 ngemva kokuvula iseshini ku-4.4160 futhi ishintshashintsha phakathi kwephuzu eliphakeme elingu-4.4340 neliphansi elingu-4.3645 — ikhandlela elizolile, cishe eliyi-flat phezulu, kodwa ukwakheka okungaphansi kukhuluma indaba enesinqumo kakhulu. Selokhu kwafakwa i-high ephakeme ngase-5.25 ngo-September 9, i-LIT ibe iqopha umsele wokwehla wencwadi: ama-higher highs aphansi, ukuphuka okuqondile komkhawulo ophansi wohla lwangaphambilini, kanye nokwenqatshwa emugqeni wokumelana osobala okube sekuzanywa futhi kwenqatshwa izikhathi ezintathu ezahlukene.
15M Chart | Binance Perpetual | LITUSDT | 11 September 2026
I-Lighter (LIT) iyahweba ku-4.4168 ngemva kokuvula iseshini ku-4.4160 futhi ishintshashintsha phakathi kwephuzu eliphakeme elingu-4.4340 neliphansi elingu-4.3645 — ikhandlela elizolile, cishe eliyi-flat phezulu, kodwa ukwakheka okungaphansi kukhuluma indaba enesinqumo kakhulu. Selokhu kwafakwa i-high ephakeme ngase-5.25 ngo-September 9, i-LIT ibe iqopha umsele wokwehla wencwadi: ama-higher highs aphansi, ukuphuka okuqondile komkhawulo ophansi wohla lwangaphambilini, kanye nokwenqatshwa emugqeni wokumelana osobala okube sekuzanywa futhi kwenqatshwa izikhathi ezintathu ezahlukene.
234
·
--

ບົດຄວາມ
MMT/USDT: Ukulahlekelwa Umfutho — Umphumela Wamadomino Usawisa Ukusekelwa$MMT
Aset: MMT/USDT Perpetual | Timeframe: 15M | Exchange: Binance
Ikatshaneli ka-MMT ifundeka njengokuchitheka kwamadomino awela. Ngemva kokuhlanganisa izinsuku ezimbili ebangeni lika-0.1670–0.1710 (elibhalwe nge-Lower High ecacile), abathengisi bathatha izintambo ngoSepthemba 9–10 futhi badudulela intengo iqonde ngqo idlule ngaphansi kokusekelwa ngendlela eyodwa esheshayo enolaka ku-Lower Low eseduze kuka-0.155. Kusukela lapho, lo mbhangqwana ubelokhu ugaya wehla ngaphakathi komugqa wesitayela wokwehla ocacile, ekugcineni wenza i-Higher Low ku-0.1484 ngaphambi komzamo wokubuyela phezulu osheshayo ku-0.1550 — okwadayishelwa ngokushesha emuva emgqeni wendlela. Manje intengo isingu-0.1508, yehle ngo-0.79% esikhathini seseshini, futhi isabambekile ngaphansi kwalowo mugqa wokwehla wokumelana.
MMT/USDT: Ukulahlekelwa Umfutho — Umphumela Wamadomino Usawisa Ukusekelwa
$MMT
Aset: MMT/USDT Perpetual | Timeframe: 15M | Exchange: Binance
Ikatshaneli ka-MMT ifundeka njengokuchitheka kwamadomino awela. Ngemva kokuhlanganisa izinsuku ezimbili ebangeni lika-0.1670–0.1710 (elibhalwe nge-Lower High ecacile), abathengisi bathatha izintambo ngoSepthemba 9–10 futhi badudulela intengo iqonde ngqo idlule ngaphansi kokusekelwa ngendlela eyodwa esheshayo enolaka ku-Lower Low eseduze kuka-0.155. Kusukela lapho, lo mbhangqwana ubelokhu ugaya wehla ngaphakathi komugqa wesitayela wokwehla ocacile, ekugcineni wenza i-Higher Low ku-0.1484 ngaphambi komzamo wokubuyela phezulu osheshayo ku-0.1550 — okwadayishelwa ngokushesha emuva emgqeni wendlela. Manje intengo isingu-0.1508, yehle ngo-0.79% esikhathini seseshini, futhi isabambekile ngaphansi kwalowo mugqa wokwehla wokumelana.
Aset: MMT/USDT Perpetual | Timeframe: 15M | Exchange: Binance
Ikatshaneli ka-MMT ifundeka njengokuchitheka kwamadomino awela. Ngemva kokuhlanganisa izinsuku ezimbili ebangeni lika-0.1670–0.1710 (elibhalwe nge-Lower High ecacile), abathengisi bathatha izintambo ngoSepthemba 9–10 futhi badudulela intengo iqonde ngqo idlule ngaphansi kokusekelwa ngendlela eyodwa esheshayo enolaka ku-Lower Low eseduze kuka-0.155. Kusukela lapho, lo mbhangqwana ubelokhu ugaya wehla ngaphakathi komugqa wesitayela wokwehla ocacile, ekugcineni wenza i-Higher Low ku-0.1484 ngaphambi komzamo wokubuyela phezulu osheshayo ku-0.1550 — okwadayishelwa ngokushesha emuva emgqeni wendlela. Manje intengo isingu-0.1508, yehle ngo-0.79% esikhathini seseshini, futhi isabambekile ngaphansi kwalowo mugqa wokwehla wokumelana.
322
·
--

ບົດຄວາມ
PUMP/USDT: Deg-degan Ngalemati — Struktur Retak Ing Bawah Dhukungan Utama$PUMP
Assset: PUMP/USDT Perpetual | Wektu: 1H | Bursa: Binance
PUMP nembé ngirim pelajaran buku babagan carane cepet sentimen bisa berbalik ing token sing cedhak meme. Sawisé reli saka basis awal September cedhak 0.0035 dadi leg impulsif sing rapi menyang 0.0048, rega mbentuk Higher High — banjur langsung wiwit nulis struktur sing luwih endhek. Grafik 1H saiki nuduhake urutan LH → HH → LL → HL sing wis rampung, lan candle paling anyar mung wae wis nyabrang ngisor HL, nge-wick liwat level Fibonacci 0 (0.003506) sadurunge nutup ing 0.003539, mudhun luwih saka 4% ing sesi kasebut.
PUMP/USDT: Deg-degan Ngalemati — Struktur Retak Ing Bawah Dhukungan Utama
$PUMP
Assset: PUMP/USDT Perpetual | Wektu: 1H | Bursa: Binance
PUMP nembé ngirim pelajaran buku babagan carane cepet sentimen bisa berbalik ing token sing cedhak meme. Sawisé reli saka basis awal September cedhak 0.0035 dadi leg impulsif sing rapi menyang 0.0048, rega mbentuk Higher High — banjur langsung wiwit nulis struktur sing luwih endhek. Grafik 1H saiki nuduhake urutan LH → HH → LL → HL sing wis rampung, lan candle paling anyar mung wae wis nyabrang ngisor HL, nge-wick liwat level Fibonacci 0 (0.003506) sadurunge nutup ing 0.003539, mudhun luwih saka 4% ing sesi kasebut.
Assset: PUMP/USDT Perpetual | Wektu: 1H | Bursa: Binance
PUMP nembé ngirim pelajaran buku babagan carane cepet sentimen bisa berbalik ing token sing cedhak meme. Sawisé reli saka basis awal September cedhak 0.0035 dadi leg impulsif sing rapi menyang 0.0048, rega mbentuk Higher High — banjur langsung wiwit nulis struktur sing luwih endhek. Grafik 1H saiki nuduhake urutan LH → HH → LL → HL sing wis rampung, lan candle paling anyar mung wae wis nyabrang ngisor HL, nge-wick liwat level Fibonacci 0 (0.003506) sadurunge nutup ing 0.003539, mudhun luwih saka 4% ing sesi kasebut.
195
·
--
📈 $DEXE USDT — ការរៀបចំ LONG
DEXE កំពុងជួញដូរនៅជុំវិញ $1.96 ហើយសម្ពាធលក់ថ្មីៗកំពុងបង្កើតតំបន់គាំទ្រដែលអាចមាន។ ការកាន់ខាងលើ $1.90–$1.95 អាចធ្វើឲ្យមានការស្ទុះងើបឡើងទៅកាន់កម្រិតធន់បន្ទាប់។ រចនាសម្ព័ន្ធបច្ចេកទេសគាំទ្រការរៀបចំស្ទុះងើបដោយប្រុងប្រយ័ត្ន។
🟢 ចូល: $1.96
🛑 SL: $1.84
🎯 TP1: $2.10
🎯 TP2: $2.25
🎯 TP3: $2.40
⚡ អាចចូលបានឥឡូវនេះ។
⚠️ មិនមែនជាការណែនាំផ្នែកហិរញ្ញវត្ថុ។ គ្រប់គ្រងហានិភ័យដោយប្រុងប្រយ័ត្ន។
@Binance_Square_Official #USAugustPPIRisesLessThanExpected #SECApprovesNasdaqTexasCommodityTrustRule #ECBRaisesRatesSecondTimeTo2.5% #Binance #ChartSniper
{future}(DEXEUSDT)
📈 $DEXE USDT — ការរៀបចំ LONG
DEXE កំពុងជួញដូរនៅជុំវិញ $1.96 ហើយសម្ពាធលក់ថ្មីៗកំពុងបង្កើតតំបន់គាំទ្រដែលអាចមាន។ ការកាន់ខាងលើ $1.90–$1.95 អាចធ្វើឲ្យមានការស្ទុះងើបឡើងទៅកាន់កម្រិតធន់បន្ទាប់។ រចនាសម្ព័ន្ធបច្ចេកទេសគាំទ្រការរៀបចំស្ទុះងើបដោយប្រុងប្រយ័ត្ន។
🟢 ចូល: $1.96
🛑 SL: $1.84
🎯 TP1: $2.10
🎯 TP2: $2.25
🎯 TP3: $2.40
⚡ អាចចូលបានឥឡូវនេះ។
⚠️ មិនមែនជាការណែនាំផ្នែកហិរញ្ញវត្ថុ។ គ្រប់គ្រងហានិភ័យដោយប្រុងប្រយ័ត្ន។
@Binance Square Official #USAugustPPIRisesLessThanExpected #SECApprovesNasdaqTexasCommodityTrustRule #ECBRaisesRatesSecondTimeTo2.5% #Binance #ChartSniper
DEXE កំពុងជួញដូរនៅជុំវិញ $1.96 ហើយសម្ពាធលក់ថ្មីៗកំពុងបង្កើតតំបន់គាំទ្រដែលអាចមាន។ ការកាន់ខាងលើ $1.90–$1.95 អាចធ្វើឲ្យមានការស្ទុះងើបឡើងទៅកាន់កម្រិតធន់បន្ទាប់។ រចនាសម្ព័ន្ធបច្ចេកទេសគាំទ្រការរៀបចំស្ទុះងើបដោយប្រុងប្រយ័ត្ន។
🟢 ចូល: $1.96
🛑 SL: $1.84
🎯 TP1: $2.10
🎯 TP2: $2.25
🎯 TP3: $2.40
⚡ អាចចូលបានឥឡូវនេះ។
⚠️ មិនមែនជាការណែនាំផ្នែកហិរញ្ញវត្ថុ។ គ្រប់គ្រងហានិភ័យដោយប្រុងប្រយ័ត្ន។
@Binance Square Official #USAugustPPIRisesLessThanExpected #SECApprovesNasdaqTexasCommodityTrustRule #ECBRaisesRatesSecondTimeTo2.5% #Binance #ChartSniper
206
·
--
📉 $SAGA USDT — SHORT SETUP
SAGA li faʻatautaia i tafatafa o le $0.0142, ua paʻu i le tusa ma le 3–4% i le 24H. O loʻo tumau pea le tau i lalo o le teteʻe lata mai i le $0.0150, e faʻaalia ai le mamafa bearish ina ua maeʻa le teena.
🔴 SHORT ENTRY: $0.01420
🛑 SL: $0.01480
🎯 TP1: $0.01370
🎯 TP2: $0.01320
🎯 TP3: $0.01280
⚡ E mafai ona ulufale i le taimi nei i le tau o le maketi.
⚠️ E le o se fautuaga tau tupe. Faʻafoe le lamatiaga ma le faaeteete.
@Binance_Square_Official #USAugustPPIRisesLessThanExpected #SECApprovesNasdaqTexasCommodityTrustRule #ECBRaisesRatesSecondTimeTo2.5% #Binance #ChartSniper
{future}(SAGAUSDT)
📉 $SAGA USDT — SHORT SETUP
SAGA li faʻatautaia i tafatafa o le $0.0142, ua paʻu i le tusa ma le 3–4% i le 24H. O loʻo tumau pea le tau i lalo o le teteʻe lata mai i le $0.0150, e faʻaalia ai le mamafa bearish ina ua maeʻa le teena.
🔴 SHORT ENTRY: $0.01420
🛑 SL: $0.01480
🎯 TP1: $0.01370
🎯 TP2: $0.01320
🎯 TP3: $0.01280
⚡ E mafai ona ulufale i le taimi nei i le tau o le maketi.
⚠️ E le o se fautuaga tau tupe. Faʻafoe le lamatiaga ma le faaeteete.
@Binance Square Official #USAugustPPIRisesLessThanExpected #SECApprovesNasdaqTexasCommodityTrustRule #ECBRaisesRatesSecondTimeTo2.5% #Binance #ChartSniper
SAGA li faʻatautaia i tafatafa o le $0.0142, ua paʻu i le tusa ma le 3–4% i le 24H. O loʻo tumau pea le tau i lalo o le teteʻe lata mai i le $0.0150, e faʻaalia ai le mamafa bearish ina ua maeʻa le teena.
🔴 SHORT ENTRY: $0.01420
🛑 SL: $0.01480
🎯 TP1: $0.01370
🎯 TP2: $0.01320
🎯 TP3: $0.01280
⚡ E mafai ona ulufale i le taimi nei i le tau o le maketi.
⚠️ E le o se fautuaga tau tupe. Faʻafoe le lamatiaga ma le faaeteete.
@Binance Square Official #USAugustPPIRisesLessThanExpected #SECApprovesNasdaqTexasCommodityTrustRule #ECBRaisesRatesSecondTimeTo2.5% #Binance #ChartSniper
127
·
--
ບົດຄວາມ
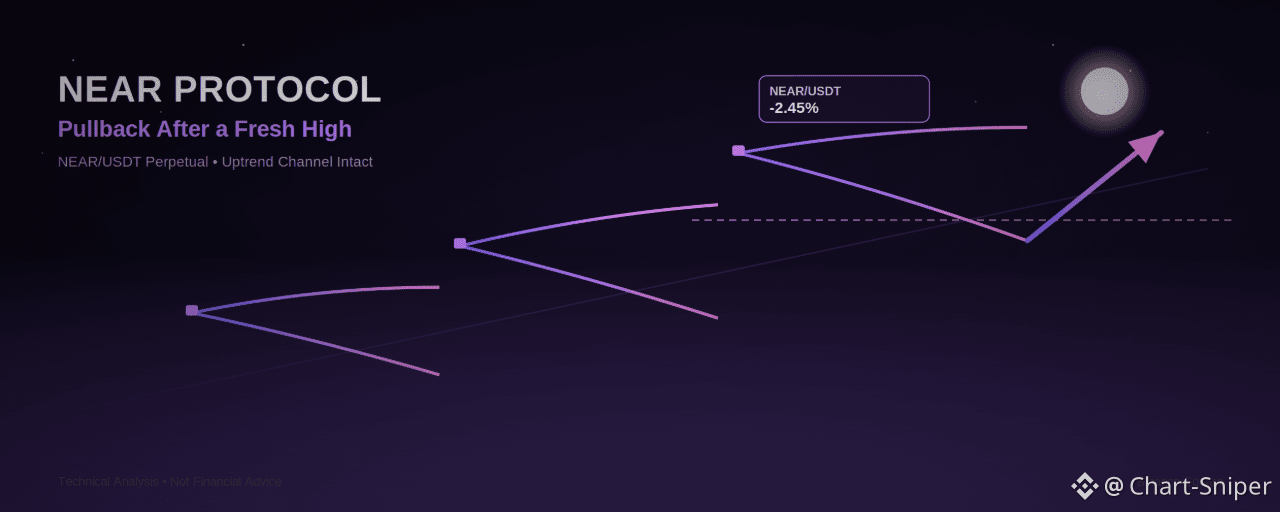
NEAR Protocol Lumiliit Mula sa Bagong High — Nakatayo Pa Ba ang Uptrend Bridge?$NEAR
Ang NEAR (NEAR/USDT Perpetual) ay lumalamig na matapos ma-hit ang bagong lokal na high. Sa 1H chart, binuksan ang presyo sa 2.616, umabot sa 2.639, pagkatapos ay bumaliktad pababa hanggang sa low na 2.526 bago tumira sa bandang 2.552, na naglagay ng kandila pababa ng -2.45%. Matapos ang malakas na rally sa maraming araw mula sa early-September low, ito ay mukhang isang regular na pullback sa loob pa rin ng isang uptrend na buo kaysa sa pagbabago ng trend — pero ang susunod na ilang kandila sa kasalukuyang support shelf ang magsasabi ng tunay na kuwento.
Pagbabasa ng Estruktura
Ang mas malawak na paggalaw sa chart na ito ay isang malinis at impulsibong rally: ang presyo ay nag-bottom sa isang Lower Low (LL) malapit sa 1.882, umakyat sa Lower High (LH) area, muling bumaba, pagkatapos ay mapagpasyang tumulak pataas sa isang serye ng Higher Highs (HH) — unang sinubukang ang resistance sa mid-2.30s hanggang 2.40s (ang "Retracement Area" na kahon sa chart), nag-konsolida roon, at saka itinulak paakyat hanggang sa pinakahuling HH sa 2.639.
NEAR Protocol Lumiliit Mula sa Bagong High — Nakatayo Pa Ba ang Uptrend Bridge?
$NEAR
Ang NEAR (NEAR/USDT Perpetual) ay lumalamig na matapos ma-hit ang bagong lokal na high. Sa 1H chart, binuksan ang presyo sa 2.616, umabot sa 2.639, pagkatapos ay bumaliktad pababa hanggang sa low na 2.526 bago tumira sa bandang 2.552, na naglagay ng kandila pababa ng -2.45%. Matapos ang malakas na rally sa maraming araw mula sa early-September low, ito ay mukhang isang regular na pullback sa loob pa rin ng isang uptrend na buo kaysa sa pagbabago ng trend — pero ang susunod na ilang kandila sa kasalukuyang support shelf ang magsasabi ng tunay na kuwento.
Pagbabasa ng Estruktura
Ang mas malawak na paggalaw sa chart na ito ay isang malinis at impulsibong rally: ang presyo ay nag-bottom sa isang Lower Low (LL) malapit sa 1.882, umakyat sa Lower High (LH) area, muling bumaba, pagkatapos ay mapagpasyang tumulak pataas sa isang serye ng Higher Highs (HH) — unang sinubukang ang resistance sa mid-2.30s hanggang 2.40s (ang "Retracement Area" na kahon sa chart), nag-konsolida roon, at saka itinulak paakyat hanggang sa pinakahuling HH sa 2.639.
Ang NEAR (NEAR/USDT Perpetual) ay lumalamig na matapos ma-hit ang bagong lokal na high. Sa 1H chart, binuksan ang presyo sa 2.616, umabot sa 2.639, pagkatapos ay bumaliktad pababa hanggang sa low na 2.526 bago tumira sa bandang 2.552, na naglagay ng kandila pababa ng -2.45%. Matapos ang malakas na rally sa maraming araw mula sa early-September low, ito ay mukhang isang regular na pullback sa loob pa rin ng isang uptrend na buo kaysa sa pagbabago ng trend — pero ang susunod na ilang kandila sa kasalukuyang support shelf ang magsasabi ng tunay na kuwento.
Pagbabasa ng Estruktura
Ang mas malawak na paggalaw sa chart na ito ay isang malinis at impulsibong rally: ang presyo ay nag-bottom sa isang Lower Low (LL) malapit sa 1.882, umakyat sa Lower High (LH) area, muling bumaba, pagkatapos ay mapagpasyang tumulak pataas sa isang serye ng Higher Highs (HH) — unang sinubukang ang resistance sa mid-2.30s hanggang 2.40s (ang "Retracement Area" na kahon sa chart), nag-konsolida roon, at saka itinulak paakyat hanggang sa pinakahuling HH sa 2.639.
74
ເຂົ້າສູ່ລະບົບເພື່ອສຳຫຼວດເນື້ອຫາເພີ່ມເຕີມ
ເຂົ້າຮ່ວມກຸ່ມຜູ້ໃຊ້ຄຣິບໂຕທົ່ວໂລກໃນ Binance Square.
⚡️ ໄດ້ຮັບຂໍ້ມູນຫຼ້າສຸດ ແລະ ທີ່ມີປະໂຫຍດກ່ຽວກັບຄຣິບໂຕ.
💬 ໄດ້ຮັບຄວາມໄວ້ວາງໃຈຈາກຕະຫຼາດແລກປ່ຽນຄຣິບໂຕທີ່ໃຫຍ່ທີ່ສຸດໃນໂລກ.
👍 ຄົ້ນຫາຂໍ້ມູນເຊີງເລິກທີ່ແທ້ຈາກນັກສ້າງທີ່ໄດ້ຮັບການຢືນຢັນ.
ອີເມວ / ເບີໂທລະສັບ
ຫົວຂໍ້ທີ່ກໍາລັງນິຍົມ
BOJRaisesRatesTo31YearHigh
125,629 views
1,957 ກຳລັງສົນທະນາ
#BOJRaisesRatesTo31YearHigh
#BOJRaisesRatesTo31YearHigh 🇯🇵📈
Ibhange laseJapane selithathe isinyathelo esikhulu esinye ngokukhuphula inzalo iye ezingeni eliphakeme kakhulu eminyakeni engu-31, okwenza ukuba izimakethe zomhlaba zibe semqondweni. Lesi sinyathelo sibonisa ukuqhubeka kokushintsha kude nenqubomgomo yemali eyaqina kakhulu (ultra-loose) eyayisetshenziswa isikhathi eside eJapane. Inzalo yaseJapane ephakeme ingaqinisa i-yen, ithinte namazinga enzalo emabhondi emhlabeni jikelele, futhi ingase ithinte nokugeleza kwemali (capital flows) phakathi kwezimakethe zezezimali. I-Crypto kanye nama-asethi anobungozi nakho kungase kusabele njengoba abatshalizimali behlola kabusha uketshezi (liquidity) kanye nokulinganisa ubungozi. Abahwebi manje sebegxile kakhulu kumazwi alandelayo e-BOJ ukuze bathole izinkomba mayelana nezinqumo zesikhathi esizayo zamazinga enzalo. Ukuhlukahluka (volatility) kungase kukhule njengoba izimakethe ziqonda ushintsho lwenqubomgomo nomthelela walo ongaba khona emhlabeni wonke. #BOJ #Japan #Crypto #Markets #InterestRates $NVDAB
maqsoodahmed1
·1 ຖືກໃຈ
·112 views
BuffettStepsDownAsBerkshireChairman
59,422 views
970 ກຳລັງສົນທະນາ
XRPExchangeReservesHitSevenYearLow
63,200 views
906 ກຳລັງສົນທະນາ