
TEKT0NIC 1
1k ໂພສ

TEKT0NIC 1
ລາຍງານ
ບລັອກຜູ້ໃຊ້
Passionate about crypto and blockchain | Crypto Enthusiastic | Technical Analysis | Fundamental News
0 ກໍາລັງຕິດຕາມ
8 ຜູ້ຕິດຕາມ
37 Liked
ໂພສ
·
--
ເບິ່ງການແປ
The Market’s Next Round Numbers Are $83,000 Bitcoin and $3,000 Ether Those are the breaks. They are not automatic tickets to $100,000 and $5,000. According to the levels that have capped this rebound, $BTC still has to take out the May-highs zone near $83,000. $ETH still has to take out $3,000. Traders treating those as triggers for $100,000 and $5,000 are pricing a full trend restart if those shelves flip from resistance to support. Key Details: > Bitcoin first hurdle: $83,000. Next round number after that: $100,000. > Ether first hurdle: $3,000. Next round number after that: $5,000. > Current area: Bitcoin in the high $70,000s, Ether around $2,500. > A flip means a hold above the level, not a single wick through it. $83,000 and $3,000 are the confirmation lines. $100,000 and $5,000 are the targets people write once those lines are accepted. Fail $83,000 again and Bitcoin is still range-bound. Fail $3,000 and Ether is still a catch-up trade that has not started. Levels: $83K $BTC and $3K $ETH First — $100K and $5K Only After Those Hold #BTC Price Analysis# #Bitcoin Price Prediction: What is Bitcoins next move?#
The Market’s Next Round Numbers Are $83,000 Bitcoin and $3,000 Ether Those are the breaks. They are not automatic tickets to $100,000 and $5,000. According to the levels that have capped this rebound, $BTC still has to take out the May-highs zone near $83,000. $ETH still has to take out $3,000. Traders treating those as triggers for $100,000 and $5,000 are pricing a full trend restart if those shelves flip from resistance to support. Key Details: > Bitcoin first hurdle: $83,000. Next round number after that: $100,000. > Ether first hurdle: $3,000. Next round number after that: $5,000. > Current area: Bitcoin in the high $70,000s, Ether around $2,500. > A flip means a hold above the level, not a single wick through it. $83,000 and $3,000 are the confirmation lines. $100,000 and $5,000 are the targets people write once those lines are accepted. Fail $83,000 again and Bitcoin is still range-bound. Fail $3,000 and Ether is still a catch-up trade that has not started. Levels: $83K $BTC and $3K $ETH First — $100K and $5K Only After Those Hold #BTC Price Analysis# #Bitcoin Price Prediction: What is Bitcoins next move?#
·
--
ເບິ່ງການແປ
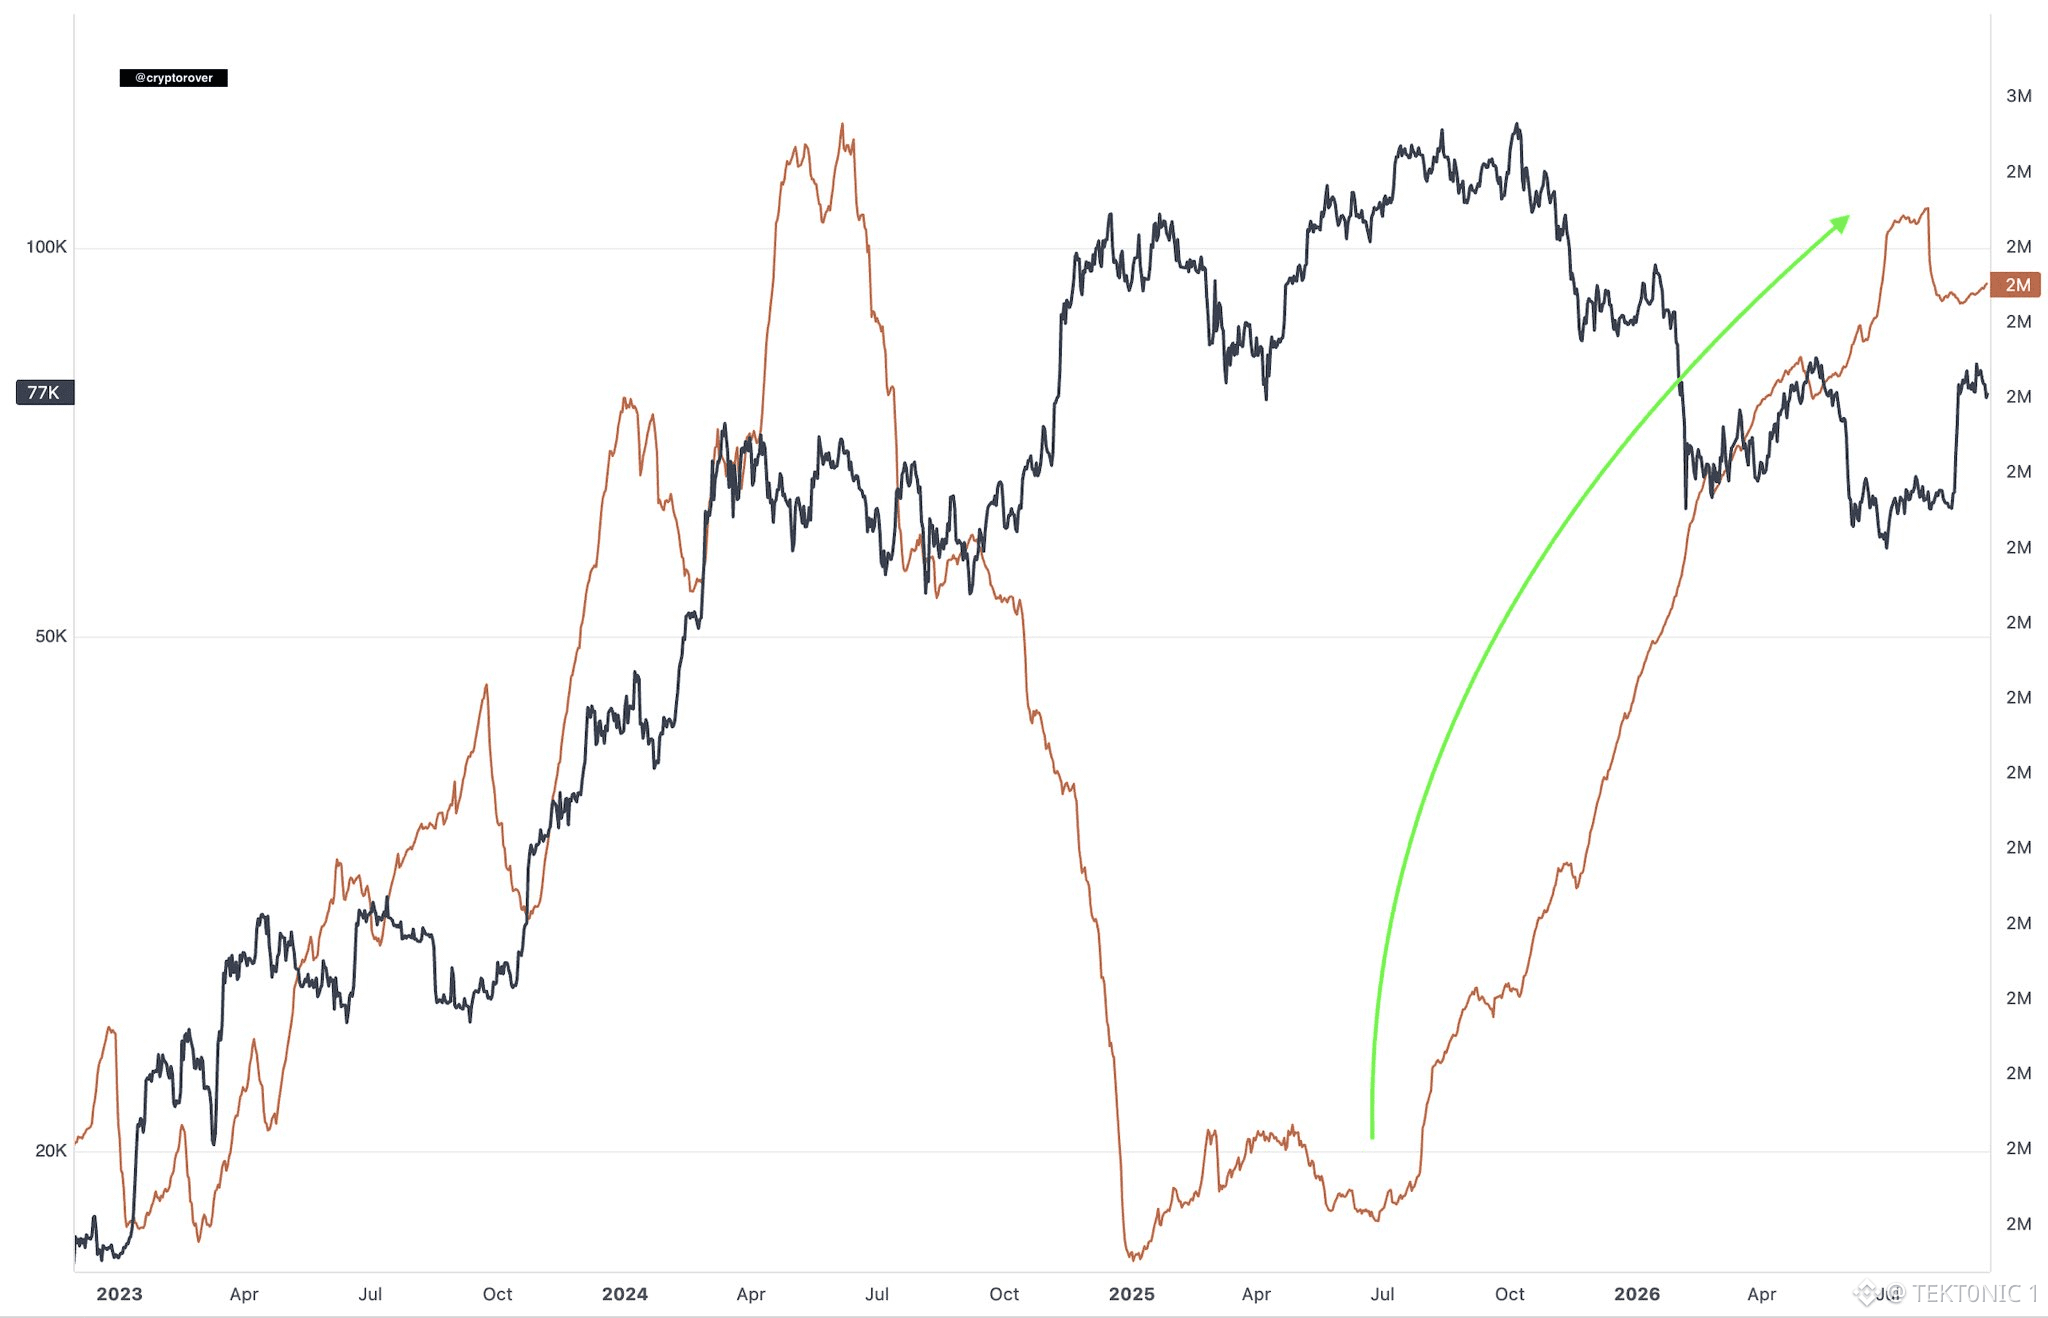
Large-Holder Bitcoin Supply Has Been Rebuilding Into the $77,000 Area The orange line on this overlay is the accumulation side of the tape. Price is the black line. According to the chart, $BTC is near $77,000. The second series — the whale/large-holder cohort on the right-hand scale — collapsed in late 2024, then turned up through 2025 and 2026 and is back near the 2 million mark. That recovery is what the green arrow is marking. Key Details: > Bitcoin price on this view: about $77,000, still below the $100,000 handle and the $126,000 high. > The orange cohort fell hard, then spent more than a year grinding higher. > The latest reading is back around 2 million on that scale. > Price and the cohort are no longer moving in lockstep: holdings rebuilt while price chopped. A rising large-holder line into a $77,000 base is constructive. It is not the same thing as a breakout. Whales can add for months and still sell into $83,000. Confirmation remains a hold of $80,000 and a close through $82,000–$83,000. Whale-Scale Bitcoin Holdings Back Near 2M While Price Sits at $77K #BTC Price Analysis# #Bitcoin Price Prediction: What is Bitcoins next move?# $ETH $BTC
Large-Holder Bitcoin Supply Has Been Rebuilding Into the $77,000 Area The orange line on this overlay is the accumulation side of the tape. Price is the black line. According to the chart, $BTC is near $77,000. The second series — the whale/large-holder cohort on the right-hand scale — collapsed in late 2024, then turned up through 2025 and 2026 and is back near the 2 million mark. That recovery is what the green arrow is marking. Key Details: > Bitcoin price on this view: about $77,000, still below the $100,000 handle and the $126,000 high. > The orange cohort fell hard, then spent more than a year grinding higher. > The latest reading is back around 2 million on that scale. > Price and the cohort are no longer moving in lockstep: holdings rebuilt while price chopped. A rising large-holder line into a $77,000 base is constructive. It is not the same thing as a breakout. Whales can add for months and still sell into $83,000. Confirmation remains a hold of $80,000 and a close through $82,000–$83,000. Whale-Scale Bitcoin Holdings Back Near 2M While Price Sits at $77K #BTC Price Analysis# #Bitcoin Price Prediction: What is Bitcoins next move?# $ETH $BTC
·
--
ເບິ່ງການແປ
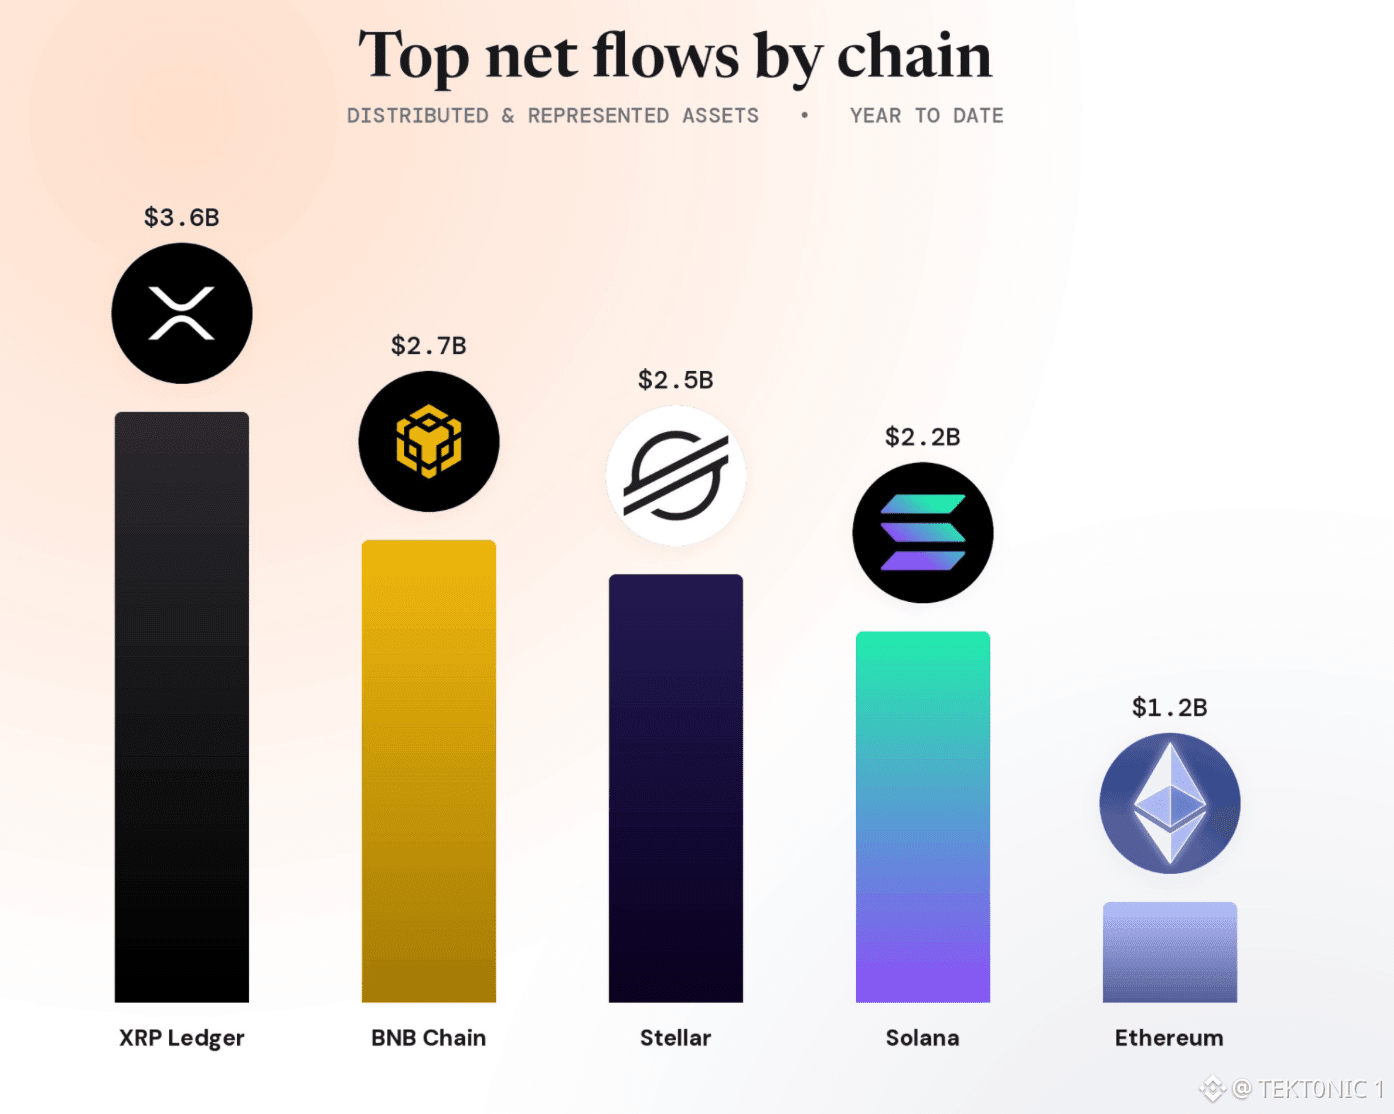
RWA capital is moving across more chains. year to date, the XRP Ledger has attracted around $3.6b in net RWA flows, leading all major chains. here’s how the top 5 look: > XRP Ledger — $3.6b > BNB Chain — $2.7b > Stellar — $2.5b > Solana — $2.2b > Ethereum — $1.2b and the growth isn’t limited to one type of asset. XRPL’s recent inflows have been driven heavily by tokenized commodities and asset-backed credit, while Stellar has crossed $3b in total RWA value with Treasuries, money-market funds, credit and gold all represented on the network. ethereum still has the largest overall RWA base, but the flow data shows capital is spreading across other ecosystems. tokenization is becoming a multi-chain market. and these numbers are starting to show it. #BTC Price Analysis# #Altcoin Season# #RWA $XRP $SOL
RWA capital is moving across more chains. year to date, the XRP Ledger has attracted around $3.6b in net RWA flows, leading all major chains. here’s how the top 5 look: > XRP Ledger — $3.6b > BNB Chain — $2.7b > Stellar — $2.5b > Solana — $2.2b > Ethereum — $1.2b and the growth isn’t limited to one type of asset. XRPL’s recent inflows have been driven heavily by tokenized commodities and asset-backed credit, while Stellar has crossed $3b in total RWA value with Treasuries, money-market funds, credit and gold all represented on the network. ethereum still has the largest overall RWA base, but the flow data shows capital is spreading across other ecosystems. tokenization is becoming a multi-chain market. and these numbers are starting to show it. #BTC Price Analysis# #Altcoin Season# #RWA $XRP $SOL
27
·
--
ເບິ່ງການແປ
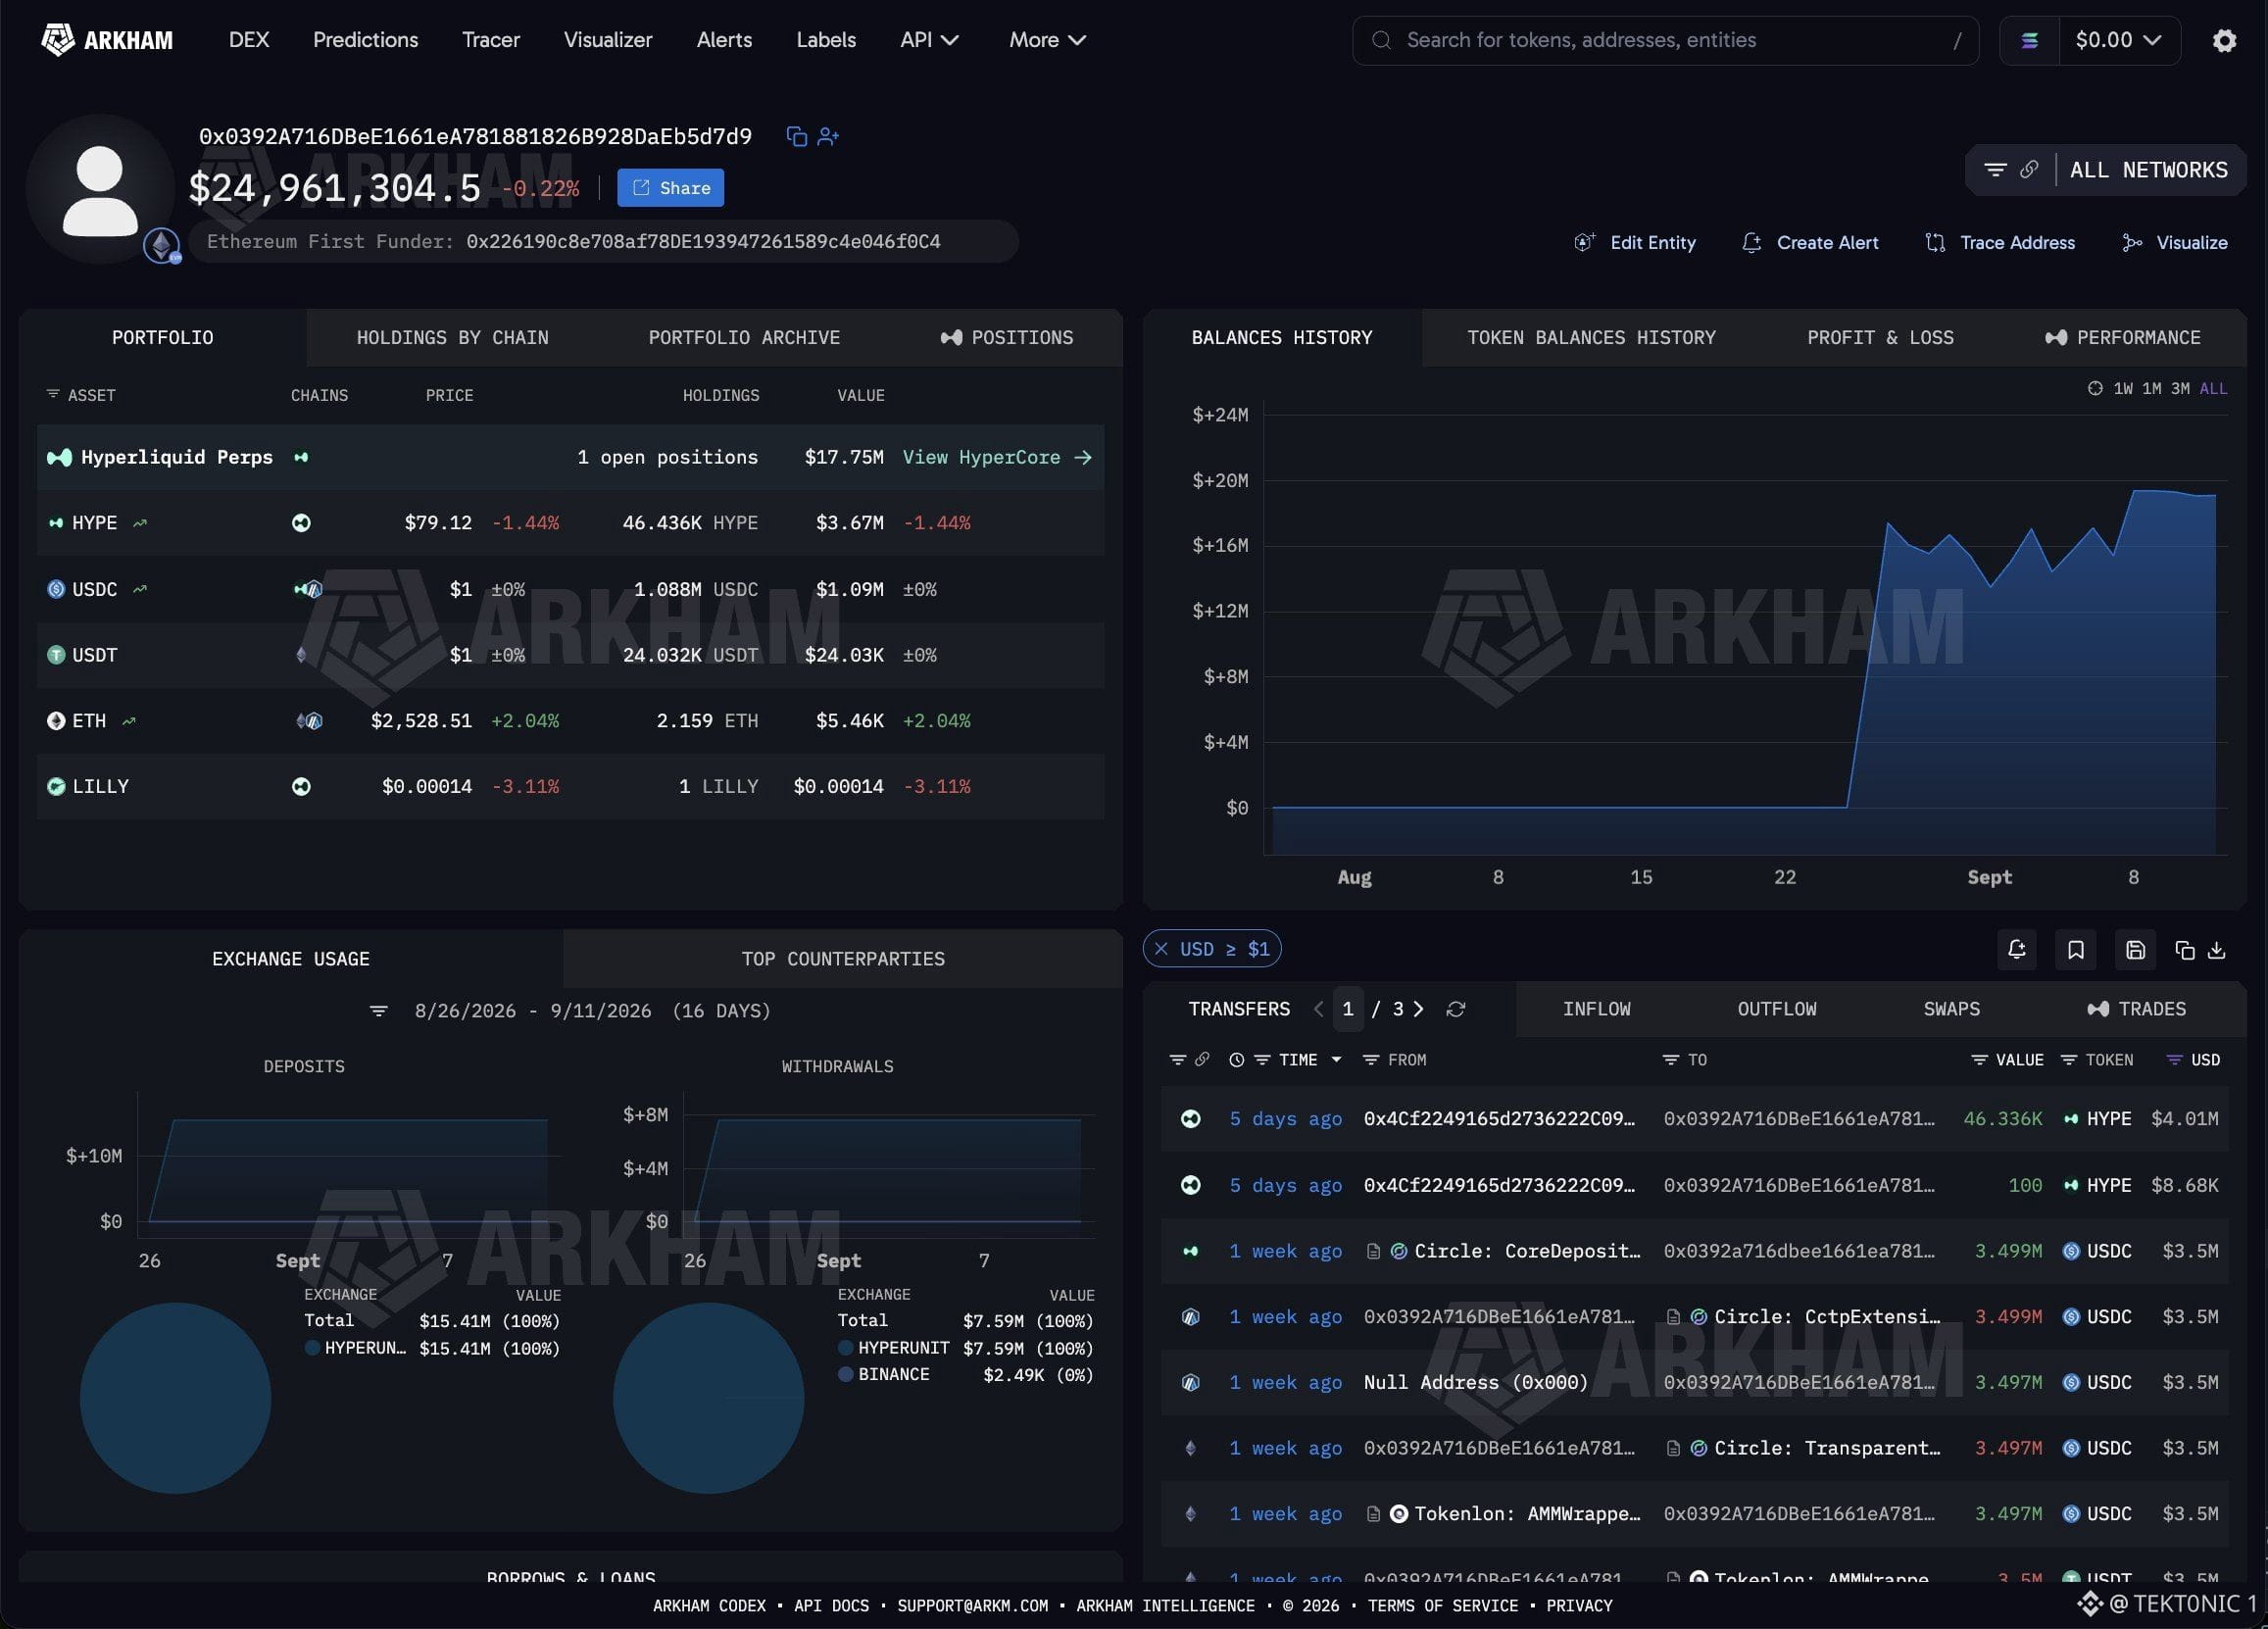
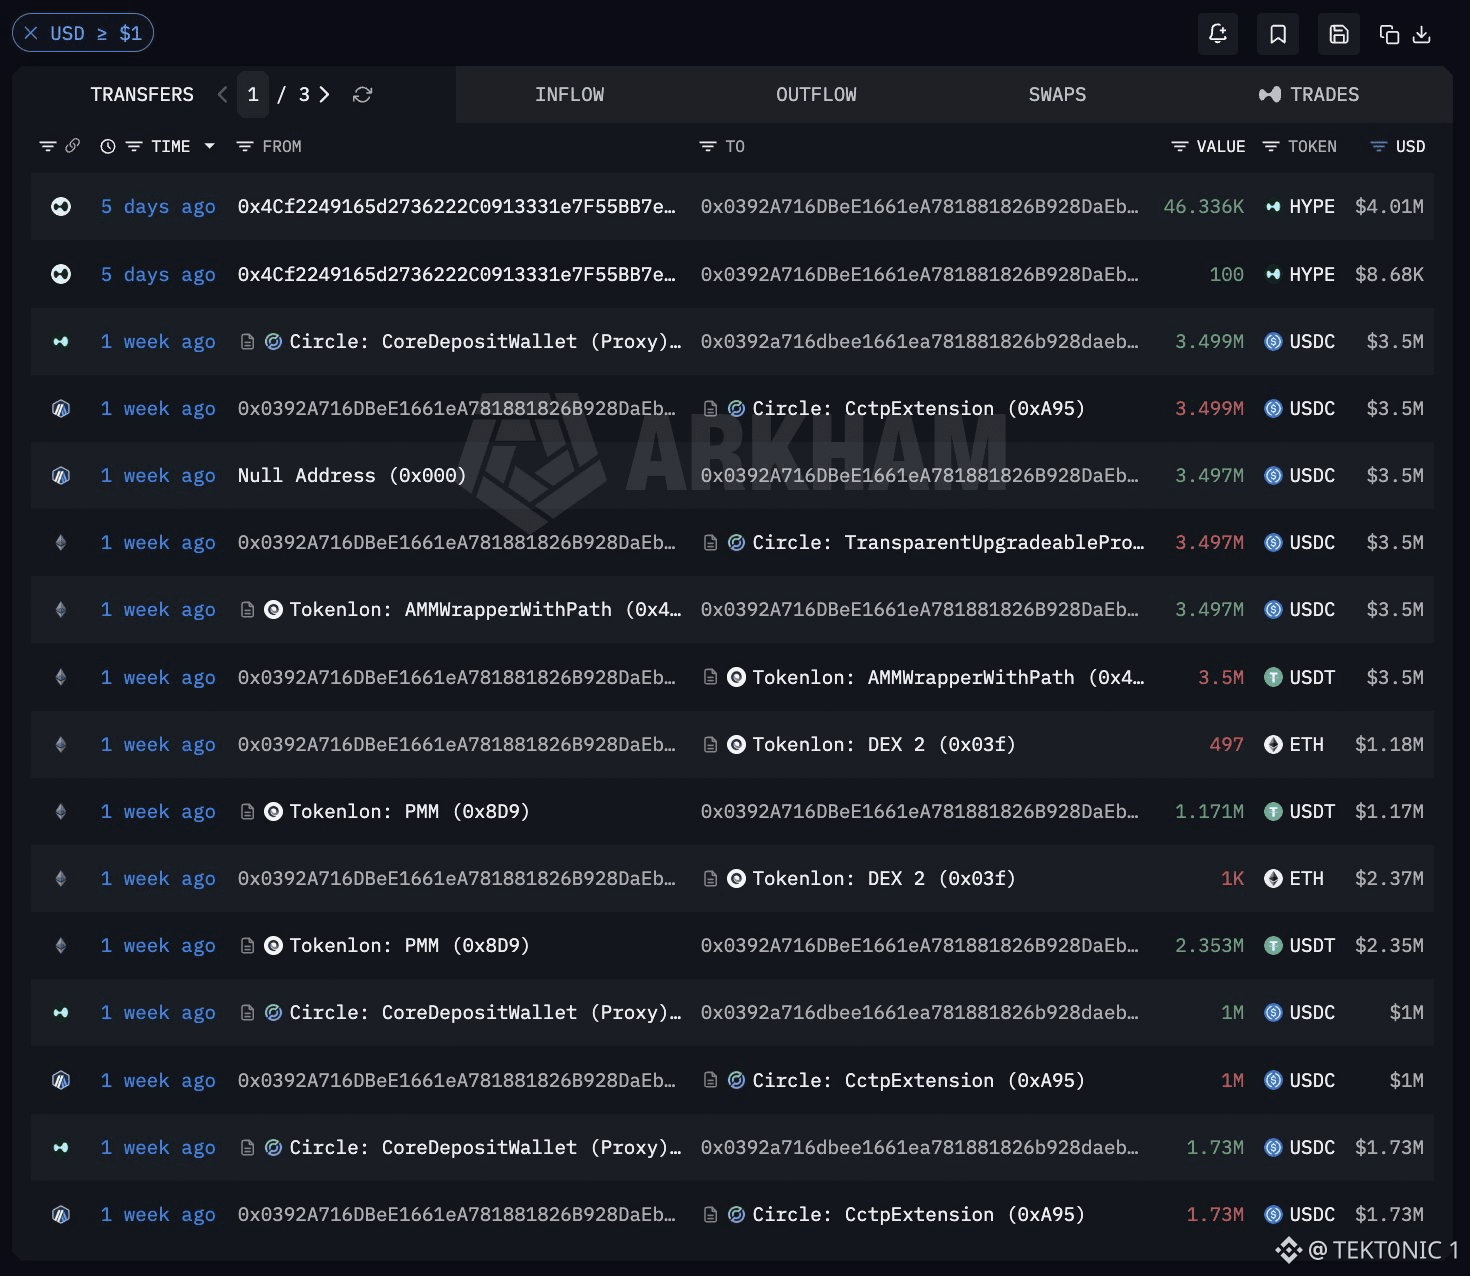
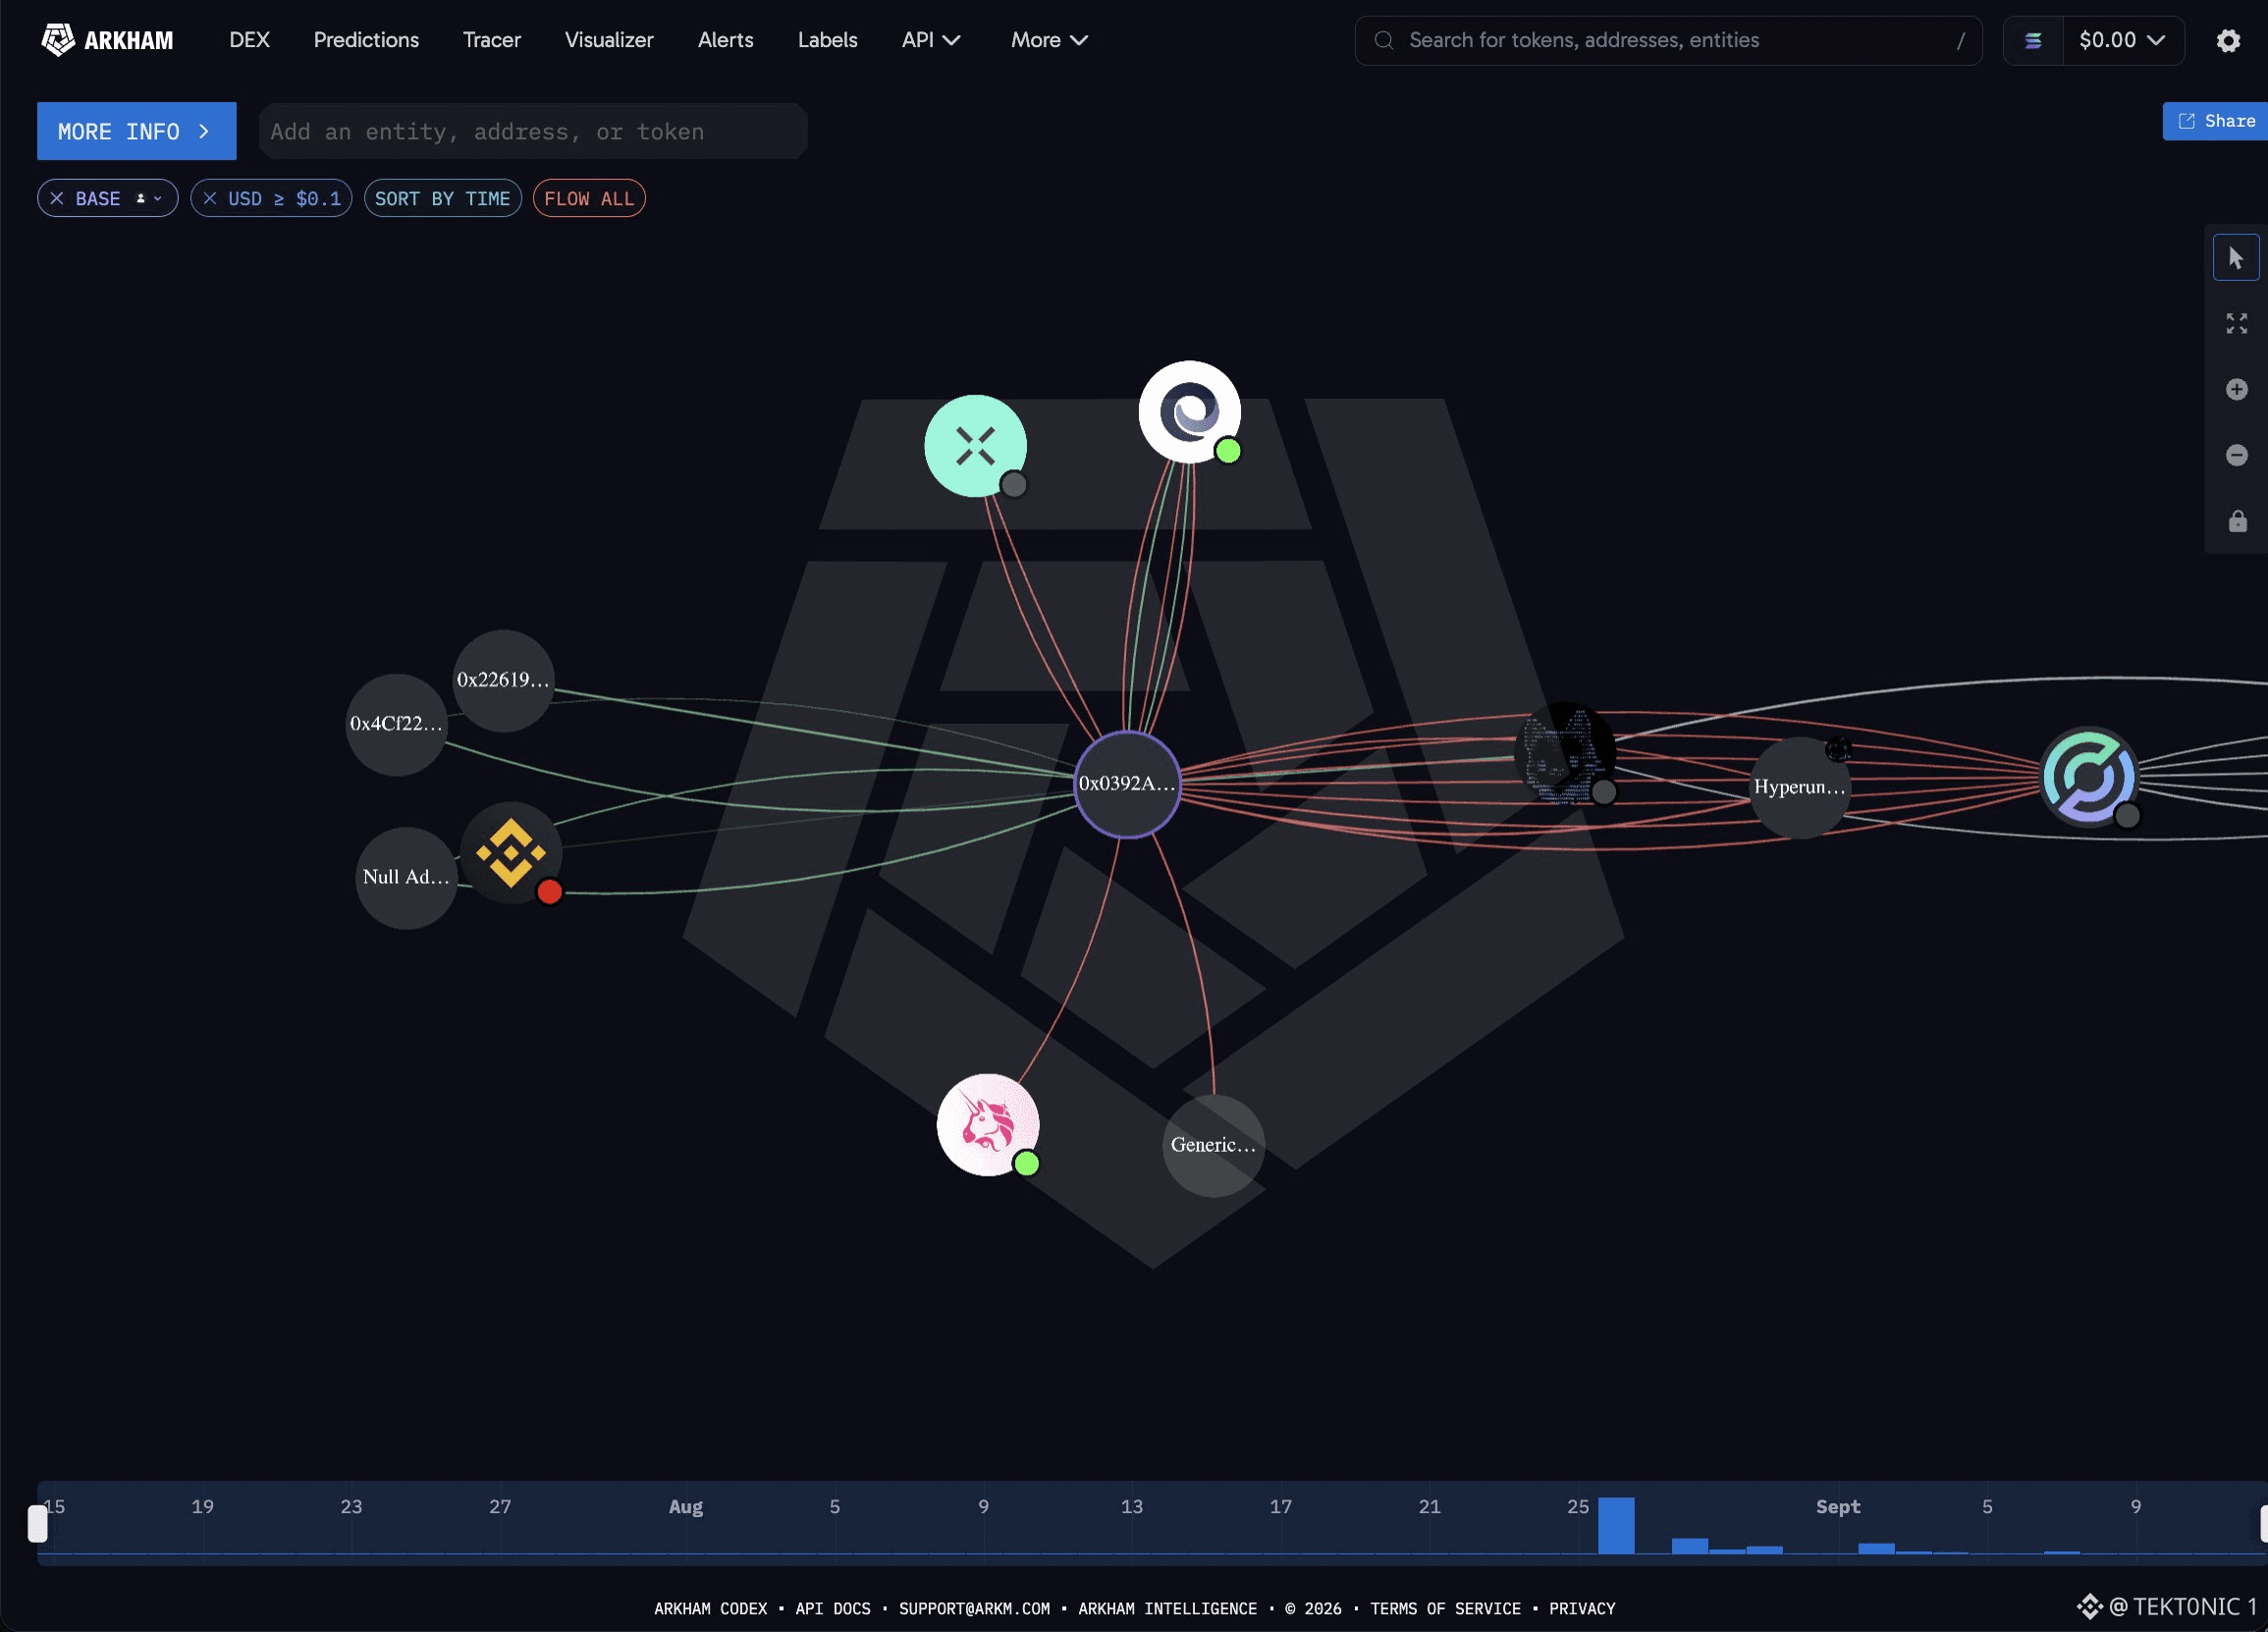
this Hyperliquid wallet is green again on a crowded ETH long. 0x039 funded a fresh address about two weeks ago. Arkham shows the book at $24.96 million now, with one perp position marked at $17.75 million plus 46,436 $HYPE . deposits over the last 16 days were $15.41 million, almost all through Hyperunit. the trade is an 8x $ETH long. entry was $2,486. notional is $114.37 million. ten days ago, when ETH printed $2,372, the account was down about $4.9 million. ETH is back through the entry. unrealized PnL is +$1.98 million. that matters because the same book that looked stopped out below $2,400 is now covering the hole without cutting the size. the catch: this is mark-to-market on 8x. a move back under $2,486 wipes the $1.98 million and puts the $4.9 million drawdown back on the screen. one wallet is not the whole bid. so the long survived the dip. it has not been reduced. $ETH still has to hold the entry for the profit to stick. #BTC Price Analysis# #HyperLiquid #Ethereum $HYPE
this Hyperliquid wallet is green again on a crowded ETH long. 0x039 funded a fresh address about two weeks ago. Arkham shows the book at $24.96 million now, with one perp position marked at $17.75 million plus 46,436 $HYPE . deposits over the last 16 days were $15.41 million, almost all through Hyperunit. the trade is an 8x $ETH long. entry was $2,486. notional is $114.37 million. ten days ago, when ETH printed $2,372, the account was down about $4.9 million. ETH is back through the entry. unrealized PnL is +$1.98 million. that matters because the same book that looked stopped out below $2,400 is now covering the hole without cutting the size. the catch: this is mark-to-market on 8x. a move back under $2,486 wipes the $1.98 million and puts the $4.9 million drawdown back on the screen. one wallet is not the whole bid. so the long survived the dip. it has not been reduced. $ETH still has to hold the entry for the profit to stick. #BTC Price Analysis# #HyperLiquid #Ethereum $HYPE
28
·
--
ເບິ່ງການແປ
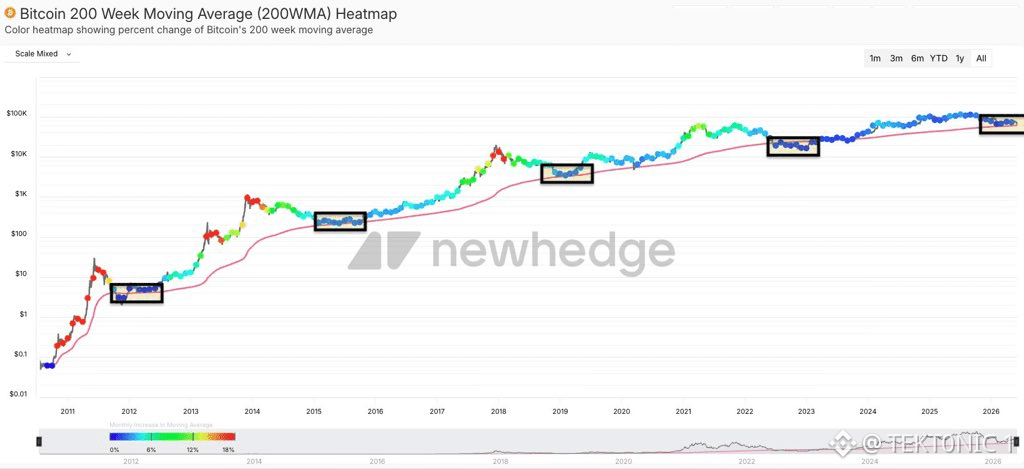
Bitcoin Is Back on Its 200-Week Average — The Line That Has Marked Prior Cycle Floors The long-term mean is holding. That is a support test, not a slogan. According to the Newhedge 200-week moving-average heatmap, $BTC is sitting on the rising 200-week line again in 2026. The same chart boxed similar tags in 2012, 2015, 2019, and 2022. Those prior touches preceded large multi-year advances. Color on the dots is the pace of change in the average itself. Key Details: > The 200-week average is the typical weekly close over about four years. It rises slowly and rarely rolls over. > Price is tagging that line again in the latest boxed zone. > Earlier boxes at the 200-week line lined up with bear-market lows, not tops. > The average is still sloping up, which means the long-term trend has not broken even after the drop from $126,000. “Never bet against the 200-week” has been a useful rule on this chart. It is not a law. The risk is a weekly close that loses the line and stays lost. The opportunity is the same one those older boxes marked: a long-term mean that has so far absorbed every major drawdown. Bitcoin Tagging the 200-Week Average Again — Same Zone That Marked 2015, 2019, and 2022 Lows #BTC Price Analysis# #Bitcoin Price Prediction: What is Bitcoins next move?# $BTC $ETH
Bitcoin Is Back on Its 200-Week Average — The Line That Has Marked Prior Cycle Floors The long-term mean is holding. That is a support test, not a slogan. According to the Newhedge 200-week moving-average heatmap, $BTC is sitting on the rising 200-week line again in 2026. The same chart boxed similar tags in 2012, 2015, 2019, and 2022. Those prior touches preceded large multi-year advances. Color on the dots is the pace of change in the average itself. Key Details: > The 200-week average is the typical weekly close over about four years. It rises slowly and rarely rolls over. > Price is tagging that line again in the latest boxed zone. > Earlier boxes at the 200-week line lined up with bear-market lows, not tops. > The average is still sloping up, which means the long-term trend has not broken even after the drop from $126,000. “Never bet against the 200-week” has been a useful rule on this chart. It is not a law. The risk is a weekly close that loses the line and stays lost. The opportunity is the same one those older boxes marked: a long-term mean that has so far absorbed every major drawdown. Bitcoin Tagging the 200-Week Average Again — Same Zone That Marked 2015, 2019, and 2022 Lows #BTC Price Analysis# #Bitcoin Price Prediction: What is Bitcoins next move?# $BTC $ETH
36
·
--
ເບິ່ງການແປ
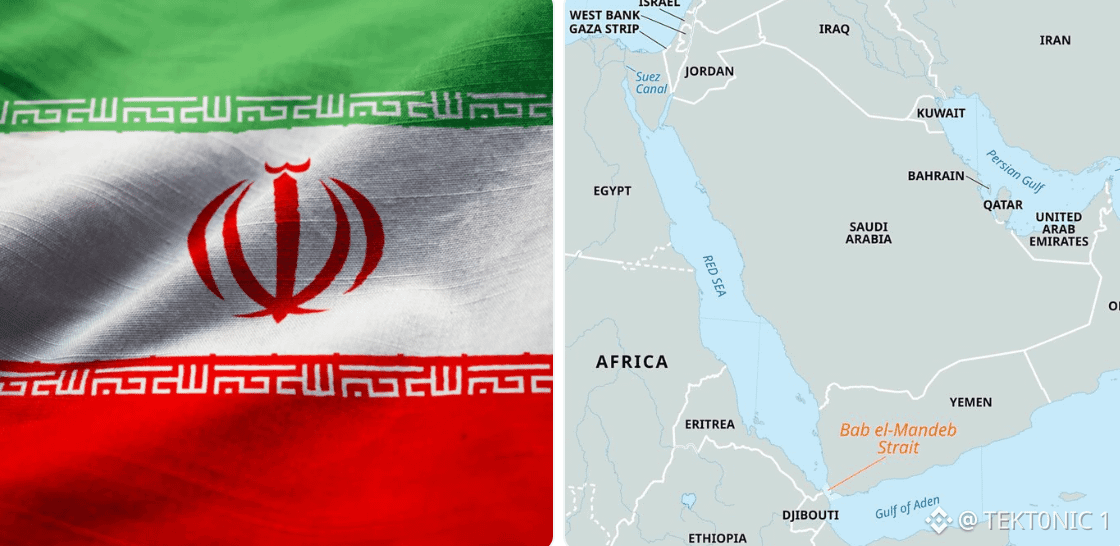
the Houthis now sit on the rock that splits Bab el-Mandeb. Perim Island, also called Mayun, fell after Yemeni government forces pulled off. Mocha and Dhubab went in the same two-day push. Perim divides the strait into its two shipping lanes, which is why the island matters more than another coastal town. Q2 flows through Bab el-Mandeb averaged 8.1 million barrels a day, per the EIA, about 8% of global supply. that volume had already jumped after Hormuz tightened and more Gulf crude was sent to Yanbu for the Red Sea route. Kpler had crossings drop from 30 to 15 on Friday. Hormuz traffic is already crushed. the Saudi East-West line that exists to bypass it was hit and shut in the same window. Brent has been trading above $100. two oil chokepoints are now under pressure at once. cargo that leaves one gate still has to clear the other. the catch: seizing Perim is not the same as closing the strait. ships are still moving, just fewer of them. the price is pricing disruption risk, not a confirmed zero-flow print. #BTC Price Analysis# #Bitcoin Price Prediction: What is Bitcoins next move?# $BTC $SOL
the Houthis now sit on the rock that splits Bab el-Mandeb. Perim Island, also called Mayun, fell after Yemeni government forces pulled off. Mocha and Dhubab went in the same two-day push. Perim divides the strait into its two shipping lanes, which is why the island matters more than another coastal town. Q2 flows through Bab el-Mandeb averaged 8.1 million barrels a day, per the EIA, about 8% of global supply. that volume had already jumped after Hormuz tightened and more Gulf crude was sent to Yanbu for the Red Sea route. Kpler had crossings drop from 30 to 15 on Friday. Hormuz traffic is already crushed. the Saudi East-West line that exists to bypass it was hit and shut in the same window. Brent has been trading above $100. two oil chokepoints are now under pressure at once. cargo that leaves one gate still has to clear the other. the catch: seizing Perim is not the same as closing the strait. ships are still moving, just fewer of them. the price is pricing disruption risk, not a confirmed zero-flow print. #BTC Price Analysis# #Bitcoin Price Prediction: What is Bitcoins next move?# $BTC $SOL
43
·
--
ເບິ່ງການແປ
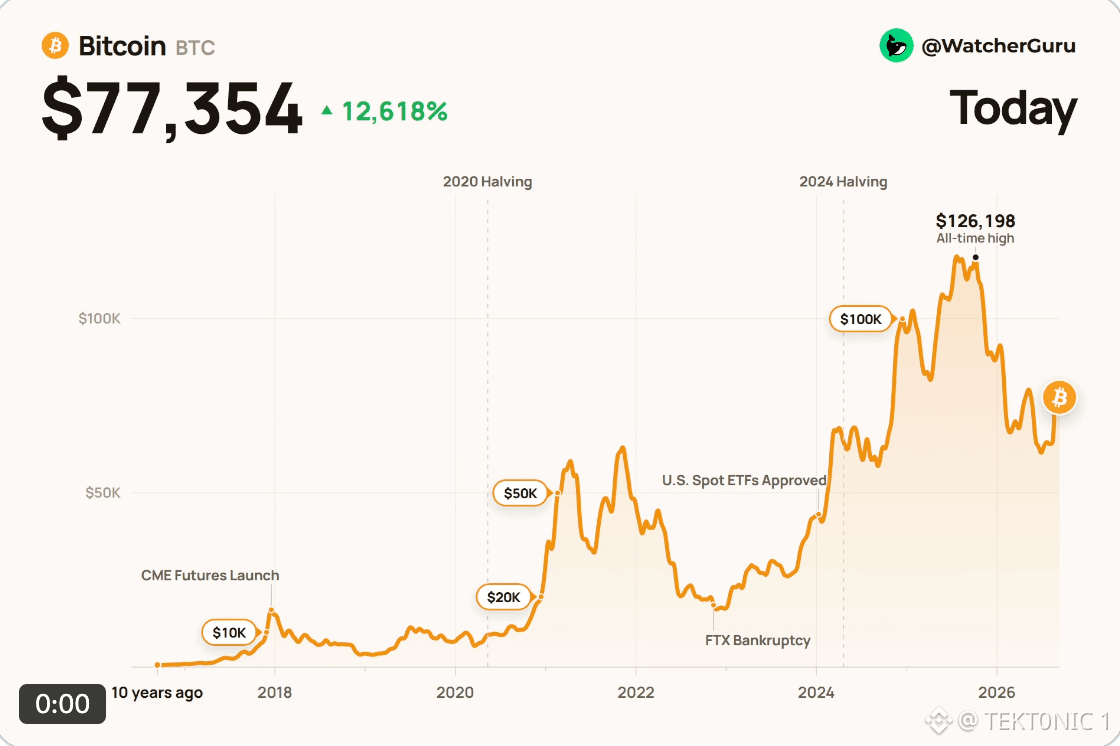
Bitcoin Is $77,354 Today. Ten Years Ago It Was $608. The long chart still does the work the daily range hides. According to the 10-year view, $BTC is $77,354, up about 12,618% from $608 a decade ago. The path in between includes the CME futures launch, two halvings, FTX, U.S. spot ETF approval, a $126,198 all-time high, and the 2026 drawdown back toward the high $70,000s. Key Details: > Today: $77,354. > Ten years ago: about $608. > Gain over that stretch: about +12,618%, or roughly 127 times. > Cycle high on this chart: $126,198. Current price is still well below that peak. A 127× decade is the savings-rate argument. It does not tell you what next week’s Fed meeting does to $80,000. The honest split is: long-term holders are still up multiples from 2016. Traders working the 2025 high are still underwater. Bitcoin: $608 a Decade Ago, $77,354 Today, Still Below the $126,198 High #BTC Price Analysis# #Bitcoin Price Prediction: What is Bitcoins next move?# $BTC $XRP
Bitcoin Is $77,354 Today. Ten Years Ago It Was $608. The long chart still does the work the daily range hides. According to the 10-year view, $BTC is $77,354, up about 12,618% from $608 a decade ago. The path in between includes the CME futures launch, two halvings, FTX, U.S. spot ETF approval, a $126,198 all-time high, and the 2026 drawdown back toward the high $70,000s. Key Details: > Today: $77,354. > Ten years ago: about $608. > Gain over that stretch: about +12,618%, or roughly 127 times. > Cycle high on this chart: $126,198. Current price is still well below that peak. A 127× decade is the savings-rate argument. It does not tell you what next week’s Fed meeting does to $80,000. The honest split is: long-term holders are still up multiples from 2016. Traders working the 2025 high are still underwater. Bitcoin: $608 a Decade Ago, $77,354 Today, Still Below the $126,198 High #BTC Price Analysis# #Bitcoin Price Prediction: What is Bitcoins next move?# $BTC $XRP
49
·
--
ເບິ່ງການແປ
Grayscale turned an old Zcash trust into a listed product — and the asset line jumped. ZCSH started trading on NYSE Arca on August 25 as a spot grantor trust. it holds ZEC at Coinbase Custody, tracks the CoinDesk Zcash benchmark, and takes a 2.50% sponsor fee. about 559,000 ZEC were in the fund on the September 10 print. since listing the product has taken in about $179 million over 11 sessions. AUM is now above $700 million. that growth rate puts it in the top 1% of nearly 4,000 ETPs. $ZEC itself is up 59% over the same window. some of the first bid was close to home. DCG International, inside the same group as the sponsor, was reported as a large early buyer. price appreciation plus creations will both lift AUM, so the rank is a mix of flows and a running coin. the catch: a 2.50% fee and an 11-day sample are not a cycle. bitcoin ETPs still dwarf this book. if $ZEC gives back the 59%, the AUM print comes with it. so the listing found demand. the next test is whether creations continue when the token stops running. #BTC Price Analysis# #Bitcoin Price Prediction: What is Bitcoins next move?# $BTC
Grayscale turned an old Zcash trust into a listed product — and the asset line jumped. ZCSH started trading on NYSE Arca on August 25 as a spot grantor trust. it holds ZEC at Coinbase Custody, tracks the CoinDesk Zcash benchmark, and takes a 2.50% sponsor fee. about 559,000 ZEC were in the fund on the September 10 print. since listing the product has taken in about $179 million over 11 sessions. AUM is now above $700 million. that growth rate puts it in the top 1% of nearly 4,000 ETPs. $ZEC itself is up 59% over the same window. some of the first bid was close to home. DCG International, inside the same group as the sponsor, was reported as a large early buyer. price appreciation plus creations will both lift AUM, so the rank is a mix of flows and a running coin. the catch: a 2.50% fee and an 11-day sample are not a cycle. bitcoin ETPs still dwarf this book. if $ZEC gives back the 59%, the AUM print comes with it. so the listing found demand. the next test is whether creations continue when the token stops running. #BTC Price Analysis# #Bitcoin Price Prediction: What is Bitcoins next move?# $BTC

12
·
--
ເບິ່ງການແປ
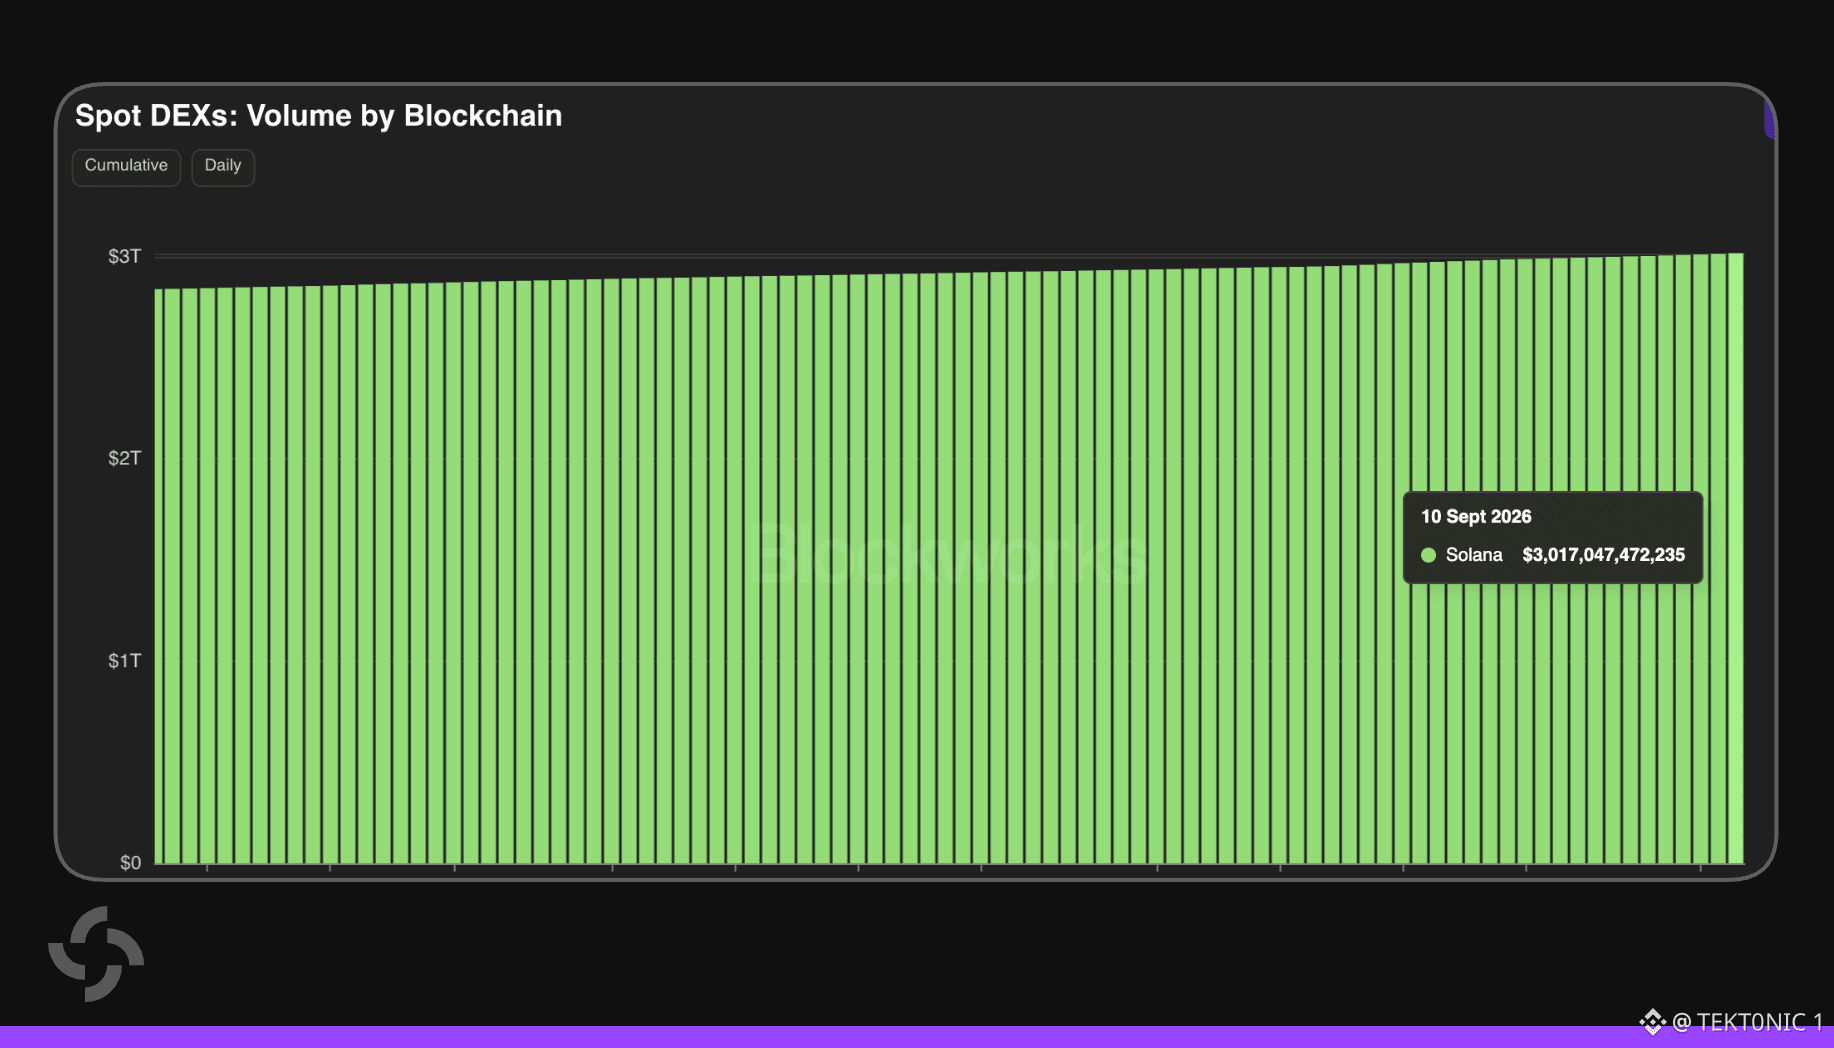
Solana’s Cumulative DEX Volume Has Cleared $3 Trillion That is lifetime spot DEX trading on the chain, not a one-day print. According to Blockworks data as of September 10, 2026, Solana’s cumulative spot DEX volume stands at $3.017 trillion. The cumulative series has been grinding higher in a near-straight line as daily flow keeps adding to the total. Key Details: > Cumulative Solana spot DEX volume: $3.017 trillion. > Date on the print: September 10, 2026. > This is all-time volume added together, so it rises even on quiet days. > DEX volume counts trades. It does not equal unique users or net new capital. $3 trillion is a scale number. It says Solana has been the default cheap venue for on-chain spot for a long time. It does not, by itself, say the next month will be stronger than the last. Watch daily volume and app revenue if you want to know whether the engine is still accelerating. Solana DEX Volume: $3.02 Trillion Cumulative as of Sept. 10 #BTC Price Analysis# #Bitcoin Price Prediction: What is Bitcoins next move?# $BTC $SOL #Bullish
Solana’s Cumulative DEX Volume Has Cleared $3 Trillion That is lifetime spot DEX trading on the chain, not a one-day print. According to Blockworks data as of September 10, 2026, Solana’s cumulative spot DEX volume stands at $3.017 trillion. The cumulative series has been grinding higher in a near-straight line as daily flow keeps adding to the total. Key Details: > Cumulative Solana spot DEX volume: $3.017 trillion. > Date on the print: September 10, 2026. > This is all-time volume added together, so it rises even on quiet days. > DEX volume counts trades. It does not equal unique users or net new capital. $3 trillion is a scale number. It says Solana has been the default cheap venue for on-chain spot for a long time. It does not, by itself, say the next month will be stronger than the last. Watch daily volume and app revenue if you want to know whether the engine is still accelerating. Solana DEX Volume: $3.02 Trillion Cumulative as of Sept. 10 #BTC Price Analysis# #Bitcoin Price Prediction: What is Bitcoins next move?# $BTC $SOL #Bullish
·
--
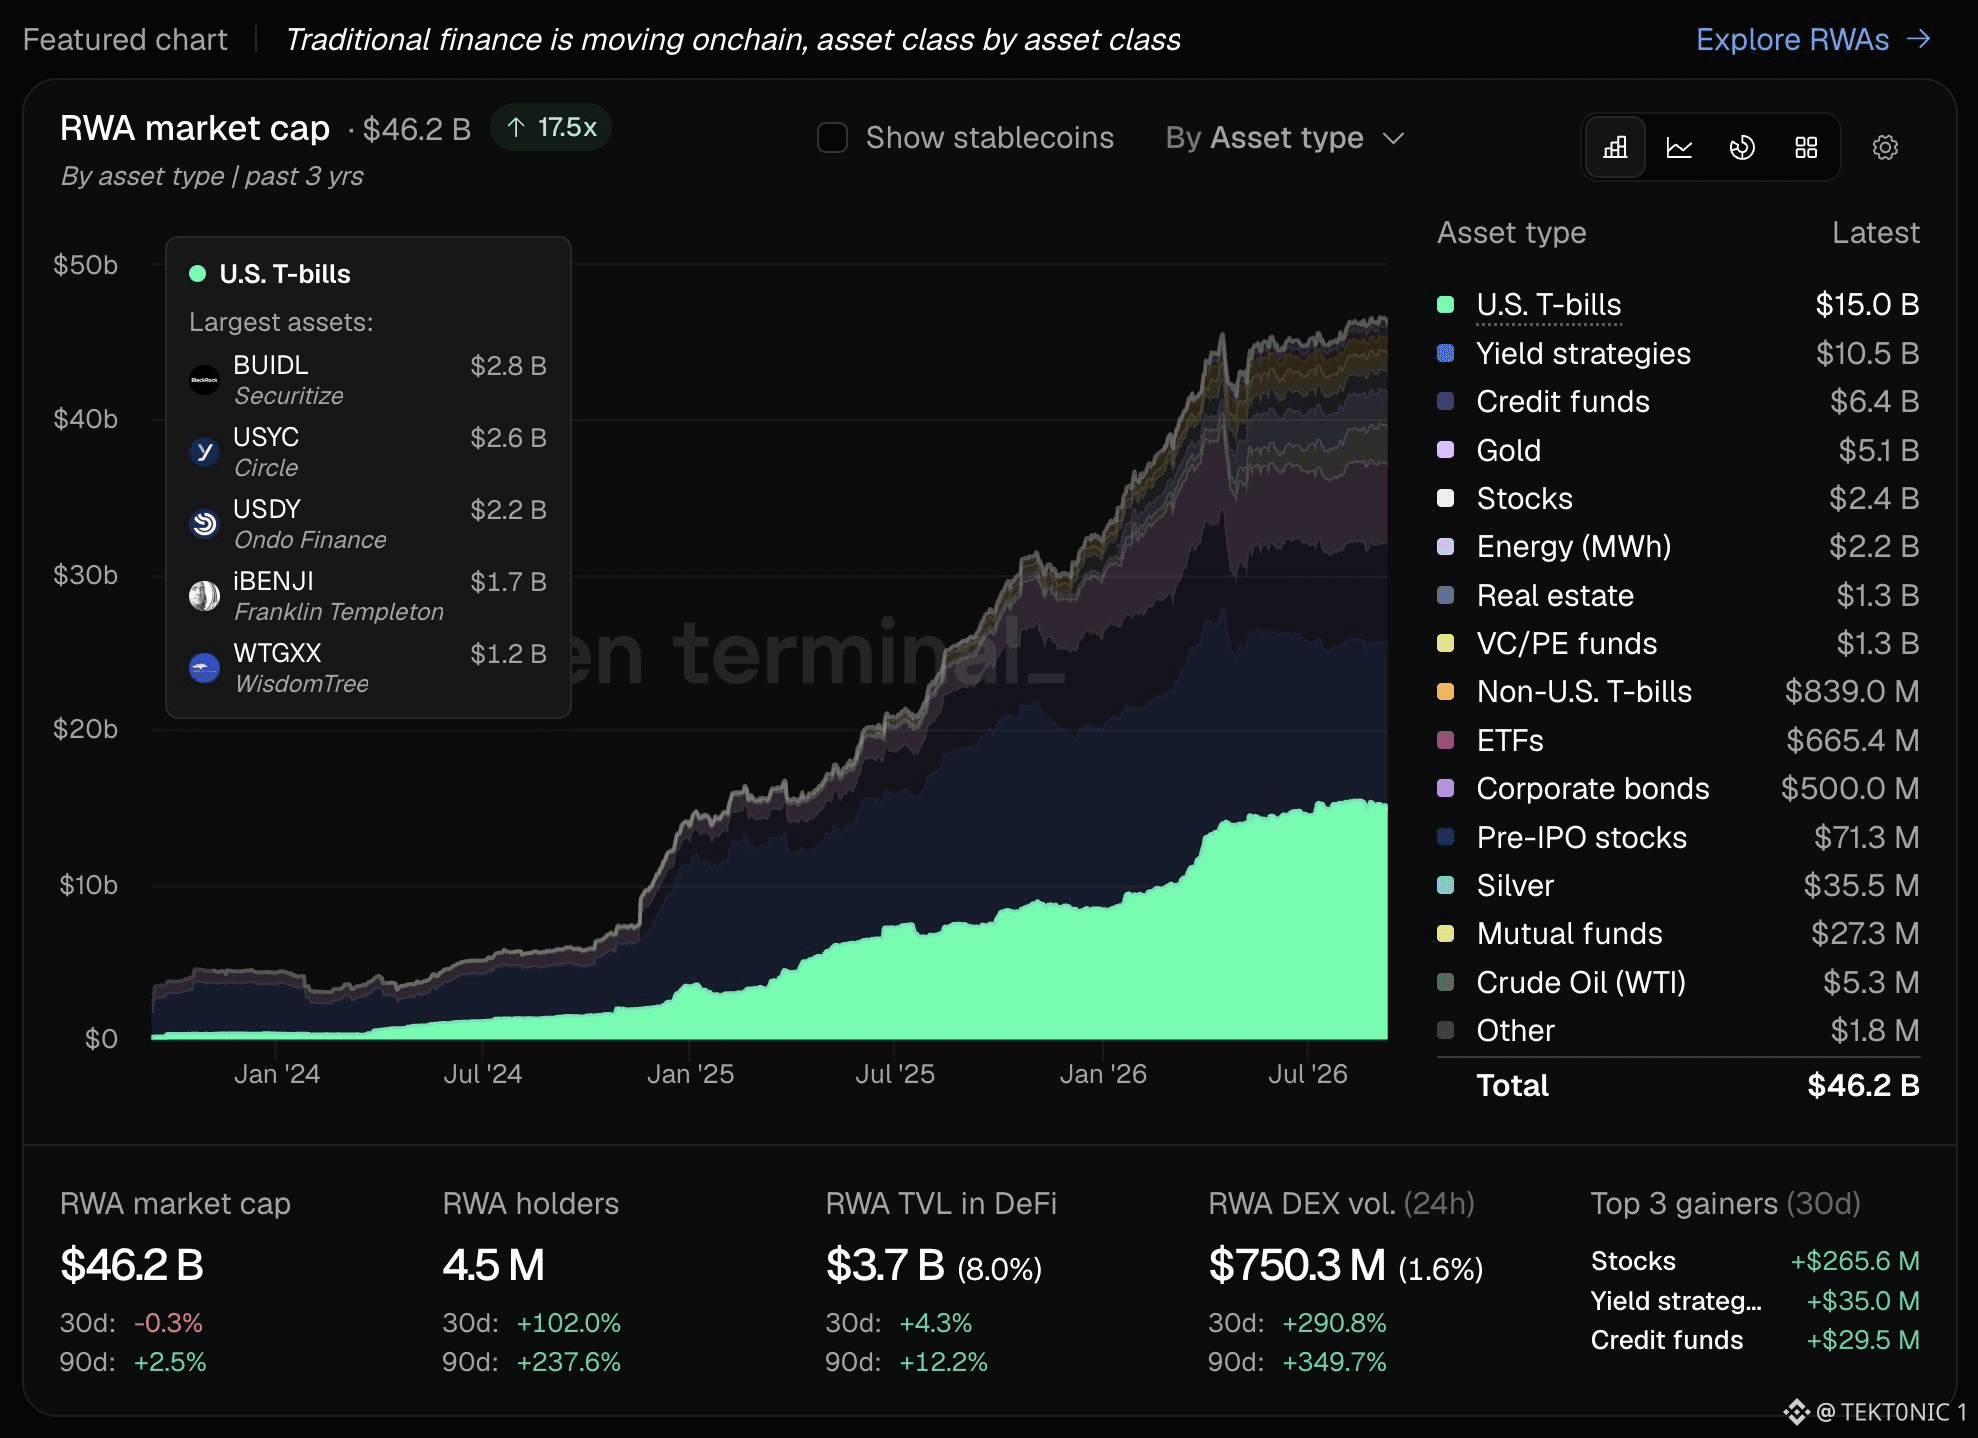
onchain RWAs ឥឡូវបោះពុម្ពបាន 46.2 ពាន់លានដុល្លារ។ Token Terminal មានតម្លៃទីផ្សារនៅ 17.5x ក្នុងរយៈពេល 3 ឆ្នាំ ដោយបិទ stablecoins។ U.S. T-bills នៅតែជាសេកមិនធំបំផុតក្នុងចំណោមផ្នែកនានា ដល់ 15.0 ពាន់លានដុល្លារ។ នេះមិនមែនជាសៀវភៅទាំងមូលទេ។ យុទ្ធសាស្ត្រអត្រាទទួលបានចំណូលគឺ 10.5B, មូលនិធិឥណទាន 6.4B, មាស 5.1B, ភាគហ៊ុន 2.4B និងថាមពល 2.2B។ មូលនិធិចំនួន 5 គ្រប់គ្រងសេកមិន T-bill នោះ។ BUIDL គឺ 2.8B, Circle’s USYC 2.6B, Ondo’s USDY 2.2B, Franklin’s iBENJI 1.7B និង WisdomTree’s WTGXX 1.2B។ ជាមួយគ្នា ពួកគេកាន់កាប់ 10.5 ពាន់លានដុល្លារ ឬ 70% នៃ tokenized T-bills។ អ្នកកាន់កាប់ឥឡូវ 4.5 លាននាក់ កើនឡើង 102% ក្នុង 30 ថ្ងៃ និង 238% ក្នុង 90 ថ្ងៃ។ បរិមាណ RWA DEX រយៈពេល 24 ម៉ោង គឺ 750 លានដុល្លារ។ ភាគហ៊ុននាំមុខក្នុង 30 ថ្ងៃចុងក្រោយ ដោយបន្ថែម 266 លានដុល្លារ។ កំណើនភាគច្រើននេះមកពីការចេញផ្សាយ។ tradfi paper កំពុងត្រូវបាន tokenize និង mark នៅលើ chain។ ការប្រើប្រាស់ DeFi នៅតែស្រាល៖ មានតែ 3.7 ពាន់លានដុល្លារ ឬ 8% នៃ stack ដែលដាក់ពង្រាយក្នុង protocol។ ទីផ្សារមានភាពពិត។ ហើយវាក៏តឹងណែន។ T-bills នាំមុខ មានមូលនិធិ 5 គ្រប់គ្រងសេកមិននោះ ហើយ RWAs ផ្សេងទៀតនៅតែតូចជាង។ #BTC Price Analysis# #Bitcoin Price Prediction: What is Bitcoins next move?# #RWA $BTC $XRP
onchain RWAs ឥឡូវបោះពុម្ពបាន 46.2 ពាន់លានដុល្លារ។ Token Terminal មានតម្លៃទីផ្សារនៅ 17.5x ក្នុងរយៈពេល 3 ឆ្នាំ ដោយបិទ stablecoins។ U.S. T-bills នៅតែជាសេកមិនធំបំផុតក្នុងចំណោមផ្នែកនានា ដល់ 15.0 ពាន់លានដុល្លារ។ នេះមិនមែនជាសៀវភៅទាំងមូលទេ។ យុទ្ធសាស្ត្រអត្រាទទួលបានចំណូលគឺ 10.5B, មូលនិធិឥណទាន 6.4B, មាស 5.1B, ភាគហ៊ុន 2.4B និងថាមពល 2.2B។ មូលនិធិចំនួន 5 គ្រប់គ្រងសេកមិន T-bill នោះ។ BUIDL គឺ 2.8B, Circle’s USYC 2.6B, Ondo’s USDY 2.2B, Franklin’s iBENJI 1.7B និង WisdomTree’s WTGXX 1.2B។ ជាមួយគ្នា ពួកគេកាន់កាប់ 10.5 ពាន់លានដុល្លារ ឬ 70% នៃ tokenized T-bills។ អ្នកកាន់កាប់ឥឡូវ 4.5 លាននាក់ កើនឡើង 102% ក្នុង 30 ថ្ងៃ និង 238% ក្នុង 90 ថ្ងៃ។ បរិមាណ RWA DEX រយៈពេល 24 ម៉ោង គឺ 750 លានដុល្លារ។ ភាគហ៊ុននាំមុខក្នុង 30 ថ្ងៃចុងក្រោយ ដោយបន្ថែម 266 លានដុល្លារ។ កំណើនភាគច្រើននេះមកពីការចេញផ្សាយ។ tradfi paper កំពុងត្រូវបាន tokenize និង mark នៅលើ chain។ ការប្រើប្រាស់ DeFi នៅតែស្រាល៖ មានតែ 3.7 ពាន់លានដុល្លារ ឬ 8% នៃ stack ដែលដាក់ពង្រាយក្នុង protocol។ ទីផ្សារមានភាពពិត។ ហើយវាក៏តឹងណែន។ T-bills នាំមុខ មានមូលនិធិ 5 គ្រប់គ្រងសេកមិននោះ ហើយ RWAs ផ្សេងទៀតនៅតែតូចជាង។ #BTC Price Analysis# #Bitcoin Price Prediction: What is Bitcoins next move?# #RWA $BTC $XRP
19
·
--
ເບິ່ງການແປ
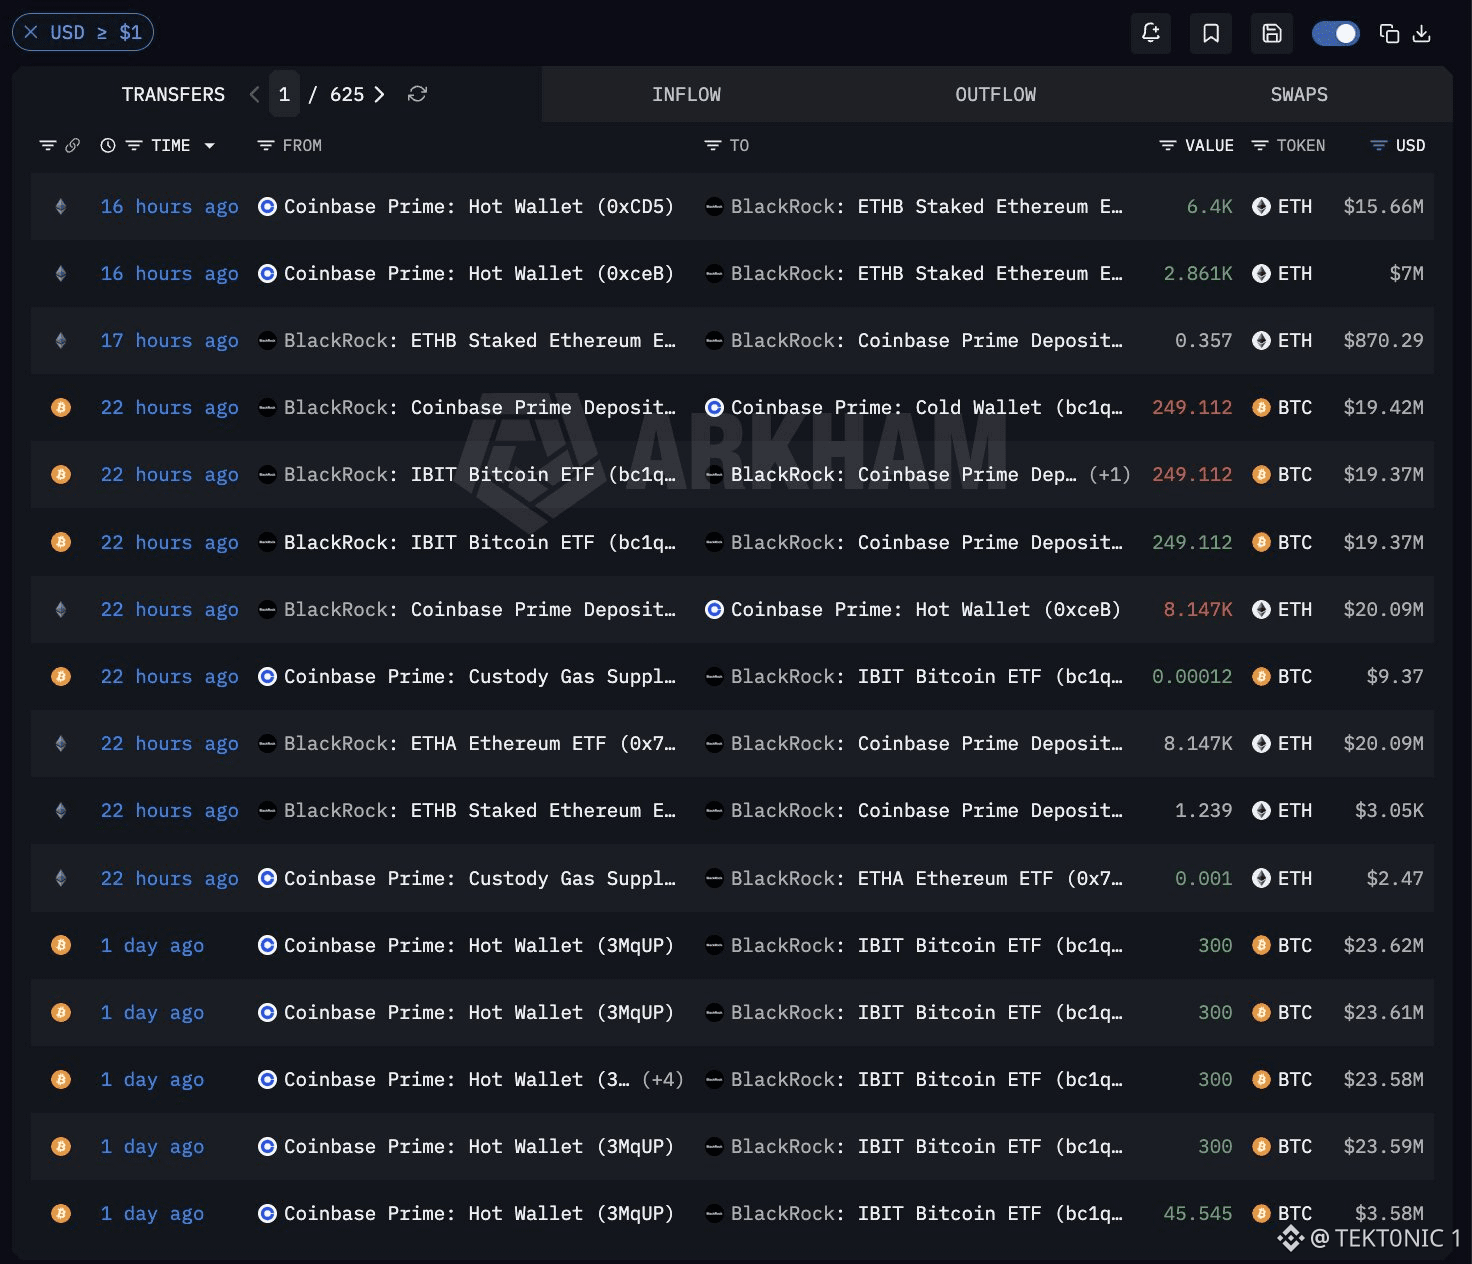
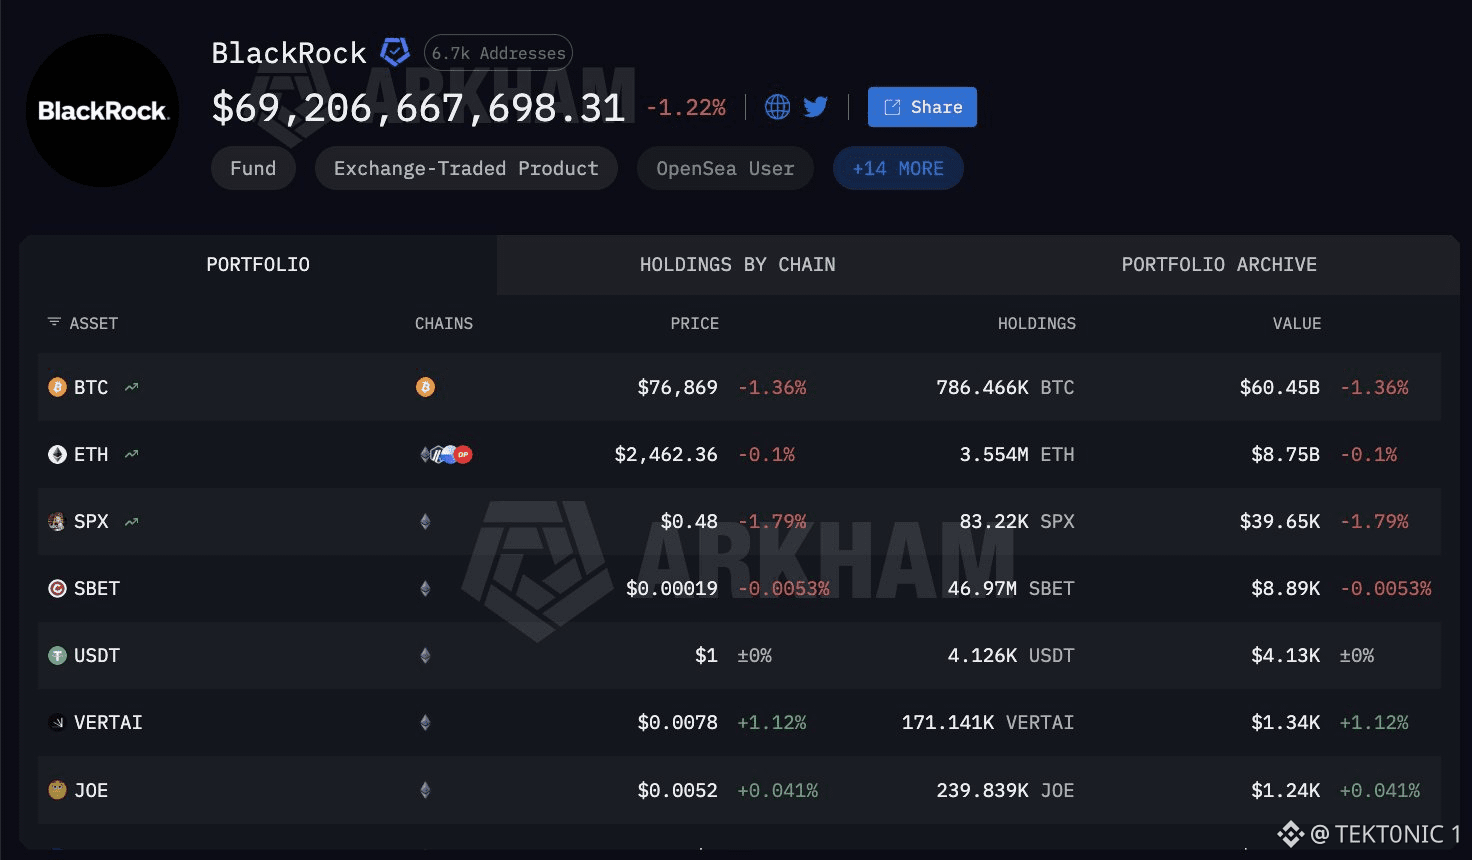
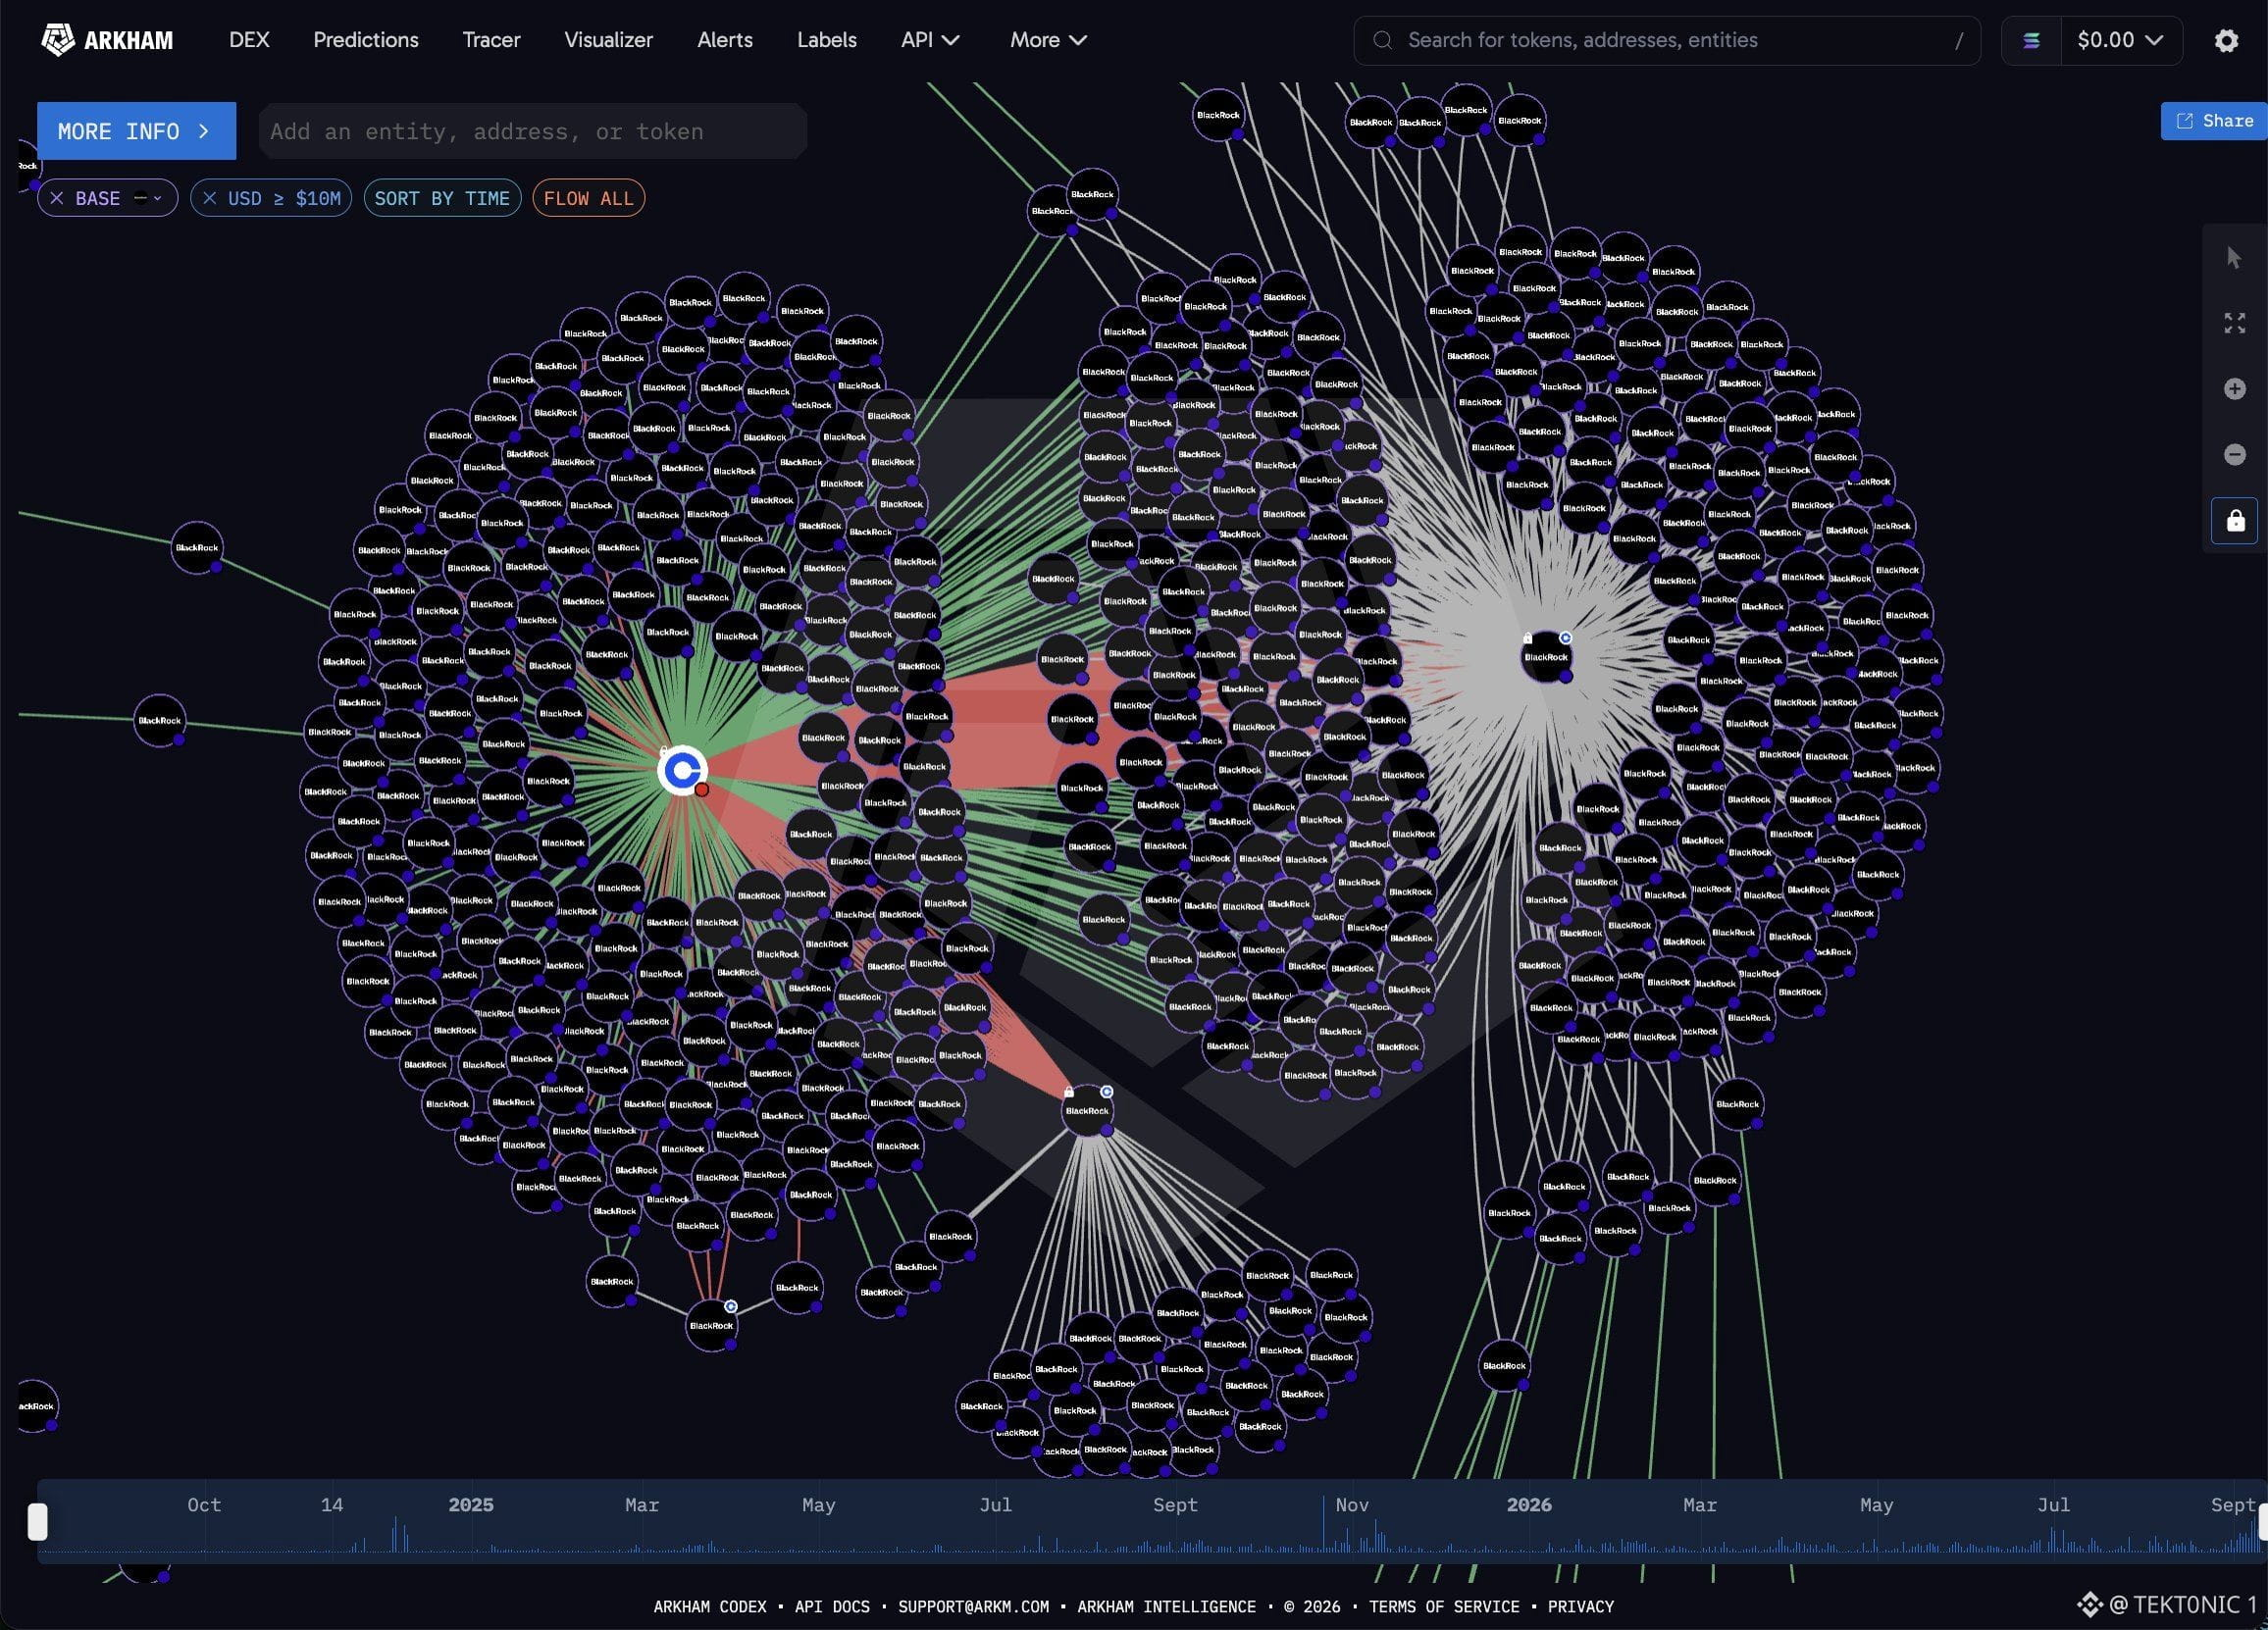
BlackRock’s ETHB Has Taken In $251 Million of Ether in 20 Straight Days One Ether product is buying. The others on the same day were not. According to the latest flow print, BlackRock’s ETHB bought $13.9 million of $ETH yesterday. Sister fund ETHA and Fidelity’s FETH both posted outflows. Over the last 20 trading days ETHB has added $251.4 million of Ether and has not recorded a single outflow day. Key Details: > ETHB yesterday: +$13.9 million. > ETHB over 20 sessions: +$251.4 million, no down days. > ETHA and FETH: outflows on the same day ETHB was green. > This is client demand into one BlackRock Ether share class, not a firm-wide call to sell Bitcoin. Twenty green days in one $ETH product is a real bid. It is not proof Wall Street has rotated out of Bitcoin. IBIT was still taking in hundreds of millions of $BTC earlier this month. The cleaner read is that ETH exposure is being added through ETHB while other Ether funds stay mixed. BlackRock ETHB: +$13.9M Yesterday, +$251M Over 20 Days, Zero Outflow Sessions Do you read a 20-day ETHB streak as Ether catching a bid, or as one share class filling while ETHA and FETH leak? #BTC Price Analysis# #Bitcoin Price Prediction: What is Bitcoins next move?# #Ethereum $BTC
BlackRock’s ETHB Has Taken In $251 Million of Ether in 20 Straight Days One Ether product is buying. The others on the same day were not. According to the latest flow print, BlackRock’s ETHB bought $13.9 million of $ETH yesterday. Sister fund ETHA and Fidelity’s FETH both posted outflows. Over the last 20 trading days ETHB has added $251.4 million of Ether and has not recorded a single outflow day. Key Details: > ETHB yesterday: +$13.9 million. > ETHB over 20 sessions: +$251.4 million, no down days. > ETHA and FETH: outflows on the same day ETHB was green. > This is client demand into one BlackRock Ether share class, not a firm-wide call to sell Bitcoin. Twenty green days in one $ETH product is a real bid. It is not proof Wall Street has rotated out of Bitcoin. IBIT was still taking in hundreds of millions of $BTC earlier this month. The cleaner read is that ETH exposure is being added through ETHB while other Ether funds stay mixed. BlackRock ETHB: +$13.9M Yesterday, +$251M Over 20 Days, Zero Outflow Sessions Do you read a 20-day ETHB streak as Ether catching a bid, or as one share class filling while ETHA and FETH leak? #BTC Price Analysis# #Bitcoin Price Prediction: What is Bitcoins next move?# #Ethereum $BTC
·
--
Ngaphezu kuka-$1.5 Billion Wezimpahla Ezimathokheni (tokenized) Zisefakwe Njengemalimboleko (lending collateral) Manje I-wallet balance ibonisa kuphela ukuthi imali ibanjwe. I-collateral ibonisa ukuthi iyasetshenziswa. Ngokubalwa kwakamuva kwemakethe yezikweletu, cishe u-$1.5 billion wezimpahla zangempela ezimathokheni (tokenized real-world assets) zisebenza njenge-collateral namuhla—zithunyelwe kumaprothokholi ukuze umuntu aboleke ngokumelene nazo. Isibonelo se-Spiko EU T-bill ku-Morpho siyisiqephu esincane salokho: i-collateral enikeziwe ikhuphuke yadlula u-$2 million, kanti isikweletu (debt) esibolekiwe sisondela nje ngaphansi kwalelo zinga kusukela ekukhuphukeni ngo-Ephreli. Imininingwane Ebalulekile: > Izimpahla ezimathokheni ezisetshenziswa njenge-lending collateral: cishe u-$1.5 billion. > Ukubamba i-fund emathokheni ku-wallet kuyigcina (custody). Ukuyithumela ku-Morpho noma kwenye imakethe kuyindlela yokuxhasa (financing). > Ama-Spiko EU T-bills ku-Morpho: i-collateral idlula u-$2 million, ukuboleka inyathelo elilodwa ngaphansi, kube flat kusukela ngoJulayi. > Umehluko phakathi kwemigqa ebomvu neluhlaza yi-collateral engasetshenziswanga—okufakwe kodwa okungakakhishwa ngokugcwele. U-$1.5 billion kuseyincane uma kuqhathaniswa ne-collateral evela ku-crypto-native. Kuyisignali yokuqala ecacile yokuthi ama-T-bills amathokheni namaphepha afanayo akushiya isigaba “sihlezi nje lapho”. Bheka ukuthi le nombolo engu-$1.5 billion iyaqhubeka yini ukukhuphuka—hhayi kuphela ukuthi imaphi amanye ama-fund akhishwa. $1.5B Izimpahla Ezimathokheni Ziphila Njengokuthi I-Lending Collateral — Ama-Spiko T-Bills ku-Morpho Phezulu Kuka-$2M #Ukuhlaziywa Kwenani le-BTC# #Isibikezelo Senani le-Bitcoin: Izoba Nakanjani Yini Ukunyakaza Okulandelayo Kwe-Bitcoins?# $BTC $XRP
Ngaphezu kuka-$1.5 Billion Wezimpahla Ezimathokheni (tokenized) Zisefakwe Njengemalimboleko (lending collateral) Manje I-wallet balance ibonisa kuphela ukuthi imali ibanjwe. I-collateral ibonisa ukuthi iyasetshenziswa. Ngokubalwa kwakamuva kwemakethe yezikweletu, cishe u-$1.5 billion wezimpahla zangempela ezimathokheni (tokenized real-world assets) zisebenza njenge-collateral namuhla—zithunyelwe kumaprothokholi ukuze umuntu aboleke ngokumelene nazo. Isibonelo se-Spiko EU T-bill ku-Morpho siyisiqephu esincane salokho: i-collateral enikeziwe ikhuphuke yadlula u-$2 million, kanti isikweletu (debt) esibolekiwe sisondela nje ngaphansi kwalelo zinga kusukela ekukhuphukeni ngo-Ephreli. Imininingwane Ebalulekile: > Izimpahla ezimathokheni ezisetshenziswa njenge-lending collateral: cishe u-$1.5 billion. > Ukubamba i-fund emathokheni ku-wallet kuyigcina (custody). Ukuyithumela ku-Morpho noma kwenye imakethe kuyindlela yokuxhasa (financing). > Ama-Spiko EU T-bills ku-Morpho: i-collateral idlula u-$2 million, ukuboleka inyathelo elilodwa ngaphansi, kube flat kusukela ngoJulayi. > Umehluko phakathi kwemigqa ebomvu neluhlaza yi-collateral engasetshenziswanga—okufakwe kodwa okungakakhishwa ngokugcwele. U-$1.5 billion kuseyincane uma kuqhathaniswa ne-collateral evela ku-crypto-native. Kuyisignali yokuqala ecacile yokuthi ama-T-bills amathokheni namaphepha afanayo akushiya isigaba “sihlezi nje lapho”. Bheka ukuthi le nombolo engu-$1.5 billion iyaqhubeka yini ukukhuphuka—hhayi kuphela ukuthi imaphi amanye ama-fund akhishwa. $1.5B Izimpahla Ezimathokheni Ziphila Njengokuthi I-Lending Collateral — Ama-Spiko T-Bills ku-Morpho Phezulu Kuka-$2M #Ukuhlaziywa Kwenani le-BTC# #Isibikezelo Senani le-Bitcoin: Izoba Nakanjani Yini Ukunyakaza Okulandelayo Kwe-Bitcoins?# $BTC $XRP

·
--
Binance ພຶ່ງເຫັນຄໍາສັ່ງຊື້ $ETH ແຮງຫນັກ. ໃນຕາລາງ 5 ນາທີຂອງ ETHUSDT, ລາຄາແລ່ນຈາກ $2,433 ໄປຫາ $2,666. ຕອນນີ້ມັນກໍາລັງຢູ່ປະມານ $2,603. Binance USDT cumulative volume delta ອອກມາເປັນ +74.25 ລ້ານ ໃນການແຜ່ງຂຶ້ນນັ້ນ. ນັ້ນແມ່ນການຊື້ໃນຕະຫລາດທີ່ກ້າຫານສຳລັບຄູ່ຫຼັກ. ລາຄາຕໍ່າສຸດຂອງຊ່ວງ (session low) ແມ່ນ $2,433. ສູງສຸດ (high) ແມ່ນ $2,666. ລາຄາໄດ້ກັບມາຢູ່ເຫນືອ $2,550 ແລ້ວ. ການປິດລາຍອາທິດ (weekly close) ເຫນືອ $2,550 ແມ່ນລະດັບທີ່ກຳລັງຈັບຕາເພື່ອເບິ່ງການເຄື່ອນໄປຫາ $3,000. ມັນສຳຄັນ ເພາະ CVD ທີ່ກຳລັງເພີ່ມຂຶ້ນພ້ອມກັບລາຄາ ຄວາມຫມາຍວ່າການຍົກຂຶ້ນນັ້ນຖືກຊື້ (bought) ບໍ່ແມ່ນແຕ່ການກົດດັນບາງໆ (thin squeeze) ທີ່ບໍ່ມີກະແສ. ສິ່ງທີ່ຕ້ອງລະວັງ: $3,000 ແມ່ນເປົ້າໝາຍ (target) ບໍ່ແມ່ນລາຄາທີ່ຈະເຕັມທັນທີ (fill). ຄູ່ອື່ນຂອງ $ETH ໃນຊ່ວງດຽວກັນມີຄວາມແຕກຕ່າງ (mixed) ລວມທັງມີການພິມ -16.58 ລ້ານ. ອຸດສະຫະກຳຊຸກຂຶ້ນ (impulse) ທີ່ແຂງແຮງຂອງ Binance ສາມາດຈາງລົງໄດ້ກ່ອນທີ່ທຽນອາທິດຈະປິດ. ດັ່ງນັ້ນຄຳສັ່ງຊື້ (bid) ເພີ່ມຂຶ້ນມາ. ແຕ່ການປິດທຽນອາທິດຍັງຕ້ອງຖືໄວ້. #BTC Price Analysis# #Bitcoin Price Prediction: What is Bitcoins next move?# $BTC
Binance ພຶ່ງເຫັນຄໍາສັ່ງຊື້ $ETH ແຮງຫນັກ. ໃນຕາລາງ 5 ນາທີຂອງ ETHUSDT, ລາຄາແລ່ນຈາກ $2,433 ໄປຫາ $2,666. ຕອນນີ້ມັນກໍາລັງຢູ່ປະມານ $2,603. Binance USDT cumulative volume delta ອອກມາເປັນ +74.25 ລ້ານ ໃນການແຜ່ງຂຶ້ນນັ້ນ. ນັ້ນແມ່ນການຊື້ໃນຕະຫລາດທີ່ກ້າຫານສຳລັບຄູ່ຫຼັກ. ລາຄາຕໍ່າສຸດຂອງຊ່ວງ (session low) ແມ່ນ $2,433. ສູງສຸດ (high) ແມ່ນ $2,666. ລາຄາໄດ້ກັບມາຢູ່ເຫນືອ $2,550 ແລ້ວ. ການປິດລາຍອາທິດ (weekly close) ເຫນືອ $2,550 ແມ່ນລະດັບທີ່ກຳລັງຈັບຕາເພື່ອເບິ່ງການເຄື່ອນໄປຫາ $3,000. ມັນສຳຄັນ ເພາະ CVD ທີ່ກຳລັງເພີ່ມຂຶ້ນພ້ອມກັບລາຄາ ຄວາມຫມາຍວ່າການຍົກຂຶ້ນນັ້ນຖືກຊື້ (bought) ບໍ່ແມ່ນແຕ່ການກົດດັນບາງໆ (thin squeeze) ທີ່ບໍ່ມີກະແສ. ສິ່ງທີ່ຕ້ອງລະວັງ: $3,000 ແມ່ນເປົ້າໝາຍ (target) ບໍ່ແມ່ນລາຄາທີ່ຈະເຕັມທັນທີ (fill). ຄູ່ອື່ນຂອງ $ETH ໃນຊ່ວງດຽວກັນມີຄວາມແຕກຕ່າງ (mixed) ລວມທັງມີການພິມ -16.58 ລ້ານ. ອຸດສະຫະກຳຊຸກຂຶ້ນ (impulse) ທີ່ແຂງແຮງຂອງ Binance ສາມາດຈາງລົງໄດ້ກ່ອນທີ່ທຽນອາທິດຈະປິດ. ດັ່ງນັ້ນຄຳສັ່ງຊື້ (bid) ເພີ່ມຂຶ້ນມາ. ແຕ່ການປິດທຽນອາທິດຍັງຕ້ອງຖືໄວ້. #BTC Price Analysis# #Bitcoin Price Prediction: What is Bitcoins next move?# $BTC

·
--
Kalshi Puts a 41% Chance on $HYPE Finishing 2026 at $100 or Higher The crowd’s base case is still a four-digit year-end. It is not a lock. ຕາມຕະຫຼາດ “HYPE price at the end of the year?” ຂອງ Kalshi, “$100 or above” ແມ່ນກຸ່ມນຳຢູ່ທີ່ 41%. HYPE ກຳລັງຊື້ຂາຍໃກ້ກັບ $80, ສັນຍານັ້ນຖາມວ່າມັນສາມາດເພີ່ມຂຶ້ນປະມານ 25% ແລະຖືມັນໄວ້ຈົນເຖິງເດືອນທັນວາໄດ້ບໍ. ຊ່ອງລຸ້ນທີ່ຖັດຈາກນີ້ທີ່ລາຍຊື່ແມ່ນ $85–$89 ທີ່ 14%, $45–$49 ທີ່ 12%, ແລະ $50–$54 ທີ່ 10%. ຂໍ້ມູນສຳຄັນ: > ທ້າຍປີ $100 ຫຼືສູງກວ່າ: 41%. > $85–$89: 14%. > $45–$49: 12%. > $50–$54: 10%. ຈຸດຢູ່ໃກ້ $80 ສະນັ້ນ $100 ແມ່ນເປົ້າໝາຍເລກກົມແຖວຖັດໄປຂ້າງເທິງຕະຫຼາດ. 41% ແມ່ນຜົນລັບທີ່ຄົນນິຍົມສຸດໃນກະດານນີ້, ແຕ່ບໍ່ແມ່ນສ່ວນໃຫຍ່. ບວກກຸ່ມ mid-80s ເຂົ້າໄປ ກໍໄດ້ເປັນກຸ່ມໜາແນ້ນພຽງພໍຢູ່ເໜືອລາຄາຂອງມື້ນີ້. ສ່ວນໂຄງຮ່າງຕ່ຳຈະສະແດງວ່າຍັງມີชนส่วນຂ້ອນຂ້າງນ້ອຍທີ່ຕັ້ງລາຄາໃຫ້ກັບໄປທີ່ເຂດ $45–$55. ພາກ Prediction ໃໝ່ຂອງ CryptoRank ຕອນນີ້ຕິດຕາມຄວາມນ່າເປັນໄປໄດ້ປະເພດນີ້ໃນບ່ອນດຽວ. $HYPE Year-End: 41% Odds of $100+, With $80 Spot #Bitcoin Price Prediction: What is Bitcoins next move?# #BTC Price Analysis# $BTC
Kalshi Puts a 41% Chance on $HYPE Finishing 2026 at $100 or Higher The crowd’s base case is still a four-digit year-end. It is not a lock. ຕາມຕະຫຼາດ “HYPE price at the end of the year?” ຂອງ Kalshi, “$100 or above” ແມ່ນກຸ່ມນຳຢູ່ທີ່ 41%. HYPE ກຳລັງຊື້ຂາຍໃກ້ກັບ $80, ສັນຍານັ້ນຖາມວ່າມັນສາມາດເພີ່ມຂຶ້ນປະມານ 25% ແລະຖືມັນໄວ້ຈົນເຖິງເດືອນທັນວາໄດ້ບໍ. ຊ່ອງລຸ້ນທີ່ຖັດຈາກນີ້ທີ່ລາຍຊື່ແມ່ນ $85–$89 ທີ່ 14%, $45–$49 ທີ່ 12%, ແລະ $50–$54 ທີ່ 10%. ຂໍ້ມູນສຳຄັນ: > ທ້າຍປີ $100 ຫຼືສູງກວ່າ: 41%. > $85–$89: 14%. > $45–$49: 12%. > $50–$54: 10%. ຈຸດຢູ່ໃກ້ $80 ສະນັ້ນ $100 ແມ່ນເປົ້າໝາຍເລກກົມແຖວຖັດໄປຂ້າງເທິງຕະຫຼາດ. 41% ແມ່ນຜົນລັບທີ່ຄົນນິຍົມສຸດໃນກະດານນີ້, ແຕ່ບໍ່ແມ່ນສ່ວນໃຫຍ່. ບວກກຸ່ມ mid-80s ເຂົ້າໄປ ກໍໄດ້ເປັນກຸ່ມໜາແນ້ນພຽງພໍຢູ່ເໜືອລາຄາຂອງມື້ນີ້. ສ່ວນໂຄງຮ່າງຕ່ຳຈະສະແດງວ່າຍັງມີชนส่วນຂ້ອນຂ້າງນ້ອຍທີ່ຕັ້ງລາຄາໃຫ້ກັບໄປທີ່ເຂດ $45–$55. ພາກ Prediction ໃໝ່ຂອງ CryptoRank ຕອນນີ້ຕິດຕາມຄວາມນ່າເປັນໄປໄດ້ປະເພດນີ້ໃນບ່ອນດຽວ. $HYPE Year-End: 41% Odds of $100+, With $80 Spot #Bitcoin Price Prediction: What is Bitcoins next move?# #BTC Price Analysis# $BTC

1
·
--
Iimarike Manje Ibheka Ukunyuka KukaSepthemba Njengesisekelo Ikusasa lama-fed funds selishintshe lisuka ekuxoxweni okusobala kuya endleleni eholelwe ukunyuka. Kusukela mhla ziyi-10 kuSepthemba umugqa ubeke ithuba elingu-69.7% lokunyakaza okungu-25 bp emhlanganweni ka-September 16, okwenza izinga elicatshangwayo liye ku-3.804% lisuke ku-3.63% eliyireferensi (effective). Umhlangano ka-October 28 ungeze elinye ithuba elingu-34.3% lokunye ukunyuka, waphakamisa izinga elicatshangwayo laya ku-3.890%. NgoDisemba ijika lase libonisa cishe ukunyuka okungu-1.7 nokuthi izinga elicatshangwayo lisondele ku-4.05%. Lokho kwakungakafiki kwe-CPI yanamuhla. Okuyinhloko (Core) kukhuphuke ngo-0.3% month-over-month uma kuqhathaniswa no-0.2% obekulindelwe. Ngemva kokushicilelwa, ikusasa kanye ne-FedWatch zikhuphule amathuba okunyuka kukaSepthemba aya kuma-80s aphakathi kuya cishe ku-90%, kanti ukunyuka okunye okubili sekufakwe kahle kakhulu ngasekupheleni konyaka. Iqiniso iwukuthi indawo yokuqala. Inqubomgomo ibimile cishe ku-3.75% unyaka wonke. Imakethe ayisekho ibeka phambili ingxoxo yesikhathi esisodwa (one-and-done). Iyaka indlela eqinisa kuze kube ngu-2027, lapho amanani obusuku obucatshangwayo enyuka aye kuma-4s aphakathi. Ukuphrinta amathuba okunyuka angama-70% kwakuyisixwayiso. Ukufundwa okushisayo kwe-core yilokho okwakuguqule kwaba yisibikezelo esisebenzayo. #BTC Price Analysis# #Bitcoin Price Prediction: What is Bitcoins next move?# $BTC $XRP
Iimarike Manje Ibheka Ukunyuka KukaSepthemba Njengesisekelo Ikusasa lama-fed funds selishintshe lisuka ekuxoxweni okusobala kuya endleleni eholelwe ukunyuka. Kusukela mhla ziyi-10 kuSepthemba umugqa ubeke ithuba elingu-69.7% lokunyakaza okungu-25 bp emhlanganweni ka-September 16, okwenza izinga elicatshangwayo liye ku-3.804% lisuke ku-3.63% eliyireferensi (effective). Umhlangano ka-October 28 ungeze elinye ithuba elingu-34.3% lokunye ukunyuka, waphakamisa izinga elicatshangwayo laya ku-3.890%. NgoDisemba ijika lase libonisa cishe ukunyuka okungu-1.7 nokuthi izinga elicatshangwayo lisondele ku-4.05%. Lokho kwakungakafiki kwe-CPI yanamuhla. Okuyinhloko (Core) kukhuphuke ngo-0.3% month-over-month uma kuqhathaniswa no-0.2% obekulindelwe. Ngemva kokushicilelwa, ikusasa kanye ne-FedWatch zikhuphule amathuba okunyuka kukaSepthemba aya kuma-80s aphakathi kuya cishe ku-90%, kanti ukunyuka okunye okubili sekufakwe kahle kakhulu ngasekupheleni konyaka. Iqiniso iwukuthi indawo yokuqala. Inqubomgomo ibimile cishe ku-3.75% unyaka wonke. Imakethe ayisekho ibeka phambili ingxoxo yesikhathi esisodwa (one-and-done). Iyaka indlela eqinisa kuze kube ngu-2027, lapho amanani obusuku obucatshangwayo enyuka aye kuma-4s aphakathi. Ukuphrinta amathuba okunyuka angama-70% kwakuyisixwayiso. Ukufundwa okushisayo kwe-core yilokho okwakuguqule kwaba yisibikezelo esisebenzayo. #BTC Price Analysis# #Bitcoin Price Prediction: What is Bitcoins next move?# $BTC $XRP

·
--
UniCredit ກຳລັງພິຈາລະນາການຮັກສາ (custody) ແລະນາຍໜ້າ (brokerage) ຄຣິບໂຕ ທະນາຄານທີ່ໃຫຍ່ເປັນອັນດັບສອງຂອງອິຕາລີ ກຳລັງພິຈາລະນາການສ້າງ “ທໍ່” ເພື່ອຮັກສາ ແລະຊື້ຂາຍຊັບສິນດິຈິທອນ ບໍ່ແມ່ນພຽງແຕ່ນຳໄປຫໍ່ເປັນບັນທຶກແບບ structured note. Bloomberg ລາຍງານໃນວັນທີ 11 ກັນຍາ ວ່າ UniCredit ກຳລັງປະເມີນຄູ່ຮ່ວມງານດ້ານເຕັກໂນໂລຍີສຳລັບການຮັກສາ (custody) ແລະໂຄງລະບົບນາຍໜ້າ. ການສົນທະນາຍັງເປັນໄລຍະເລີ່ມຕົ້ນ. ບໍ່ມີການຕັດສິນສຸດທ້າຍ. ວຽກທີ່ກຳລັງຢູ່ໃນການທົບທວນຍັງລວມເຖິງຜະລິດຕະພັນການລົງທຶນທີ່ເປັນ tokenized, ຫຼັກຊັບລາຍໄດ້ຄົງທີ່ (fixed-income securities), ການນຳໃຊ້ stablecoin, ແລະການເປີດຮັບຂອງລູກຄ້າຕໍ່ຄຣິບໂຕ. ນັ້ນຈະເປັນກ້າວທີ່ໄປເກີນກວ່າສิ่งທີ່ທະນາຄານເຄີຍເຮັດແລ້ວ. ມັນໄດ້ຂາຍຜະລິດຕະພັນໃຫ້ລູກຄ້າສາຍອາຊີບທີ່ຜູກໂຍງກັບ IBIT ຂອງ BlackRock, ອອກ minibond ແບບ tokenized ຄັ້ງທຳອິດຂອງອິຕາລີໃນ public blockchain, ເຂົ້າຮ່ວມກຸ່ມ Qivalis ທີ່ກຳລັງພັດທະນາ euro stablecoin, ແລະໃນອາທິດນີ້ໄດ້ຖືຮຸ້ນສ່ວນນ້ອຍ (minority stake) ໃນແພລດຟອມ VC Trade ຂອງເຢຍລະມັນ. ການເຄື່ອນໄຫວນີ້ ເຂົ້າກັບການປ່ຽນທີ່ກວ້າງຂຶ້ນຂອງທະນາຄານຢູໂລບ ທີ່ສັບປ່ຽນຕາມ MiCA. ການຮັກສາ (custody) ແລະນາຍໜ້າ (brokerage) ມີຄວາມສຳຄັນຫຼາຍກວ່າບັນທຶກ tokenized ອັນດຽວອີກອັນໜຶ່ງ, ເພາະວ່ານັ້ນແມ່ນສິ່ງທີ່ຊັບສິນຂອງລູກຄ້າຖືກຈັດວາງຢູ່ໃນ balance sheet ຂອງຜູ້ໃຫ້ກູ້ຢືມຂະໜາດໃຫຍ່. ນີ້ຍັງເປັນການທົບທວນ (review) ບໍ່ແມ່ນການເປີດຕົວ (launch). ສັນຍານຄືວ່າທະນາຄານລາຍໃຫຍ່ຂອງອິຕາລີກຳລັງຊອກຫາໂຄງລະບົບ (infrastructure) ແລ້ວ ບໍ່ໄດ້ປະຕິເສດປະເພດນີ້. #BTC Price Analysis# #Bitcoin Price Prediction: What is Bitcoins next move?# $BTC $XRP
UniCredit ກຳລັງພິຈາລະນາການຮັກສາ (custody) ແລະນາຍໜ້າ (brokerage) ຄຣິບໂຕ ທະນາຄານທີ່ໃຫຍ່ເປັນອັນດັບສອງຂອງອິຕາລີ ກຳລັງພິຈາລະນາການສ້າງ “ທໍ່” ເພື່ອຮັກສາ ແລະຊື້ຂາຍຊັບສິນດິຈິທອນ ບໍ່ແມ່ນພຽງແຕ່ນຳໄປຫໍ່ເປັນບັນທຶກແບບ structured note. Bloomberg ລາຍງານໃນວັນທີ 11 ກັນຍາ ວ່າ UniCredit ກຳລັງປະເມີນຄູ່ຮ່ວມງານດ້ານເຕັກໂນໂລຍີສຳລັບການຮັກສາ (custody) ແລະໂຄງລະບົບນາຍໜ້າ. ການສົນທະນາຍັງເປັນໄລຍະເລີ່ມຕົ້ນ. ບໍ່ມີການຕັດສິນສຸດທ້າຍ. ວຽກທີ່ກຳລັງຢູ່ໃນການທົບທວນຍັງລວມເຖິງຜະລິດຕະພັນການລົງທຶນທີ່ເປັນ tokenized, ຫຼັກຊັບລາຍໄດ້ຄົງທີ່ (fixed-income securities), ການນຳໃຊ້ stablecoin, ແລະການເປີດຮັບຂອງລູກຄ້າຕໍ່ຄຣິບໂຕ. ນັ້ນຈະເປັນກ້າວທີ່ໄປເກີນກວ່າສิ่งທີ່ທະນາຄານເຄີຍເຮັດແລ້ວ. ມັນໄດ້ຂາຍຜະລິດຕະພັນໃຫ້ລູກຄ້າສາຍອາຊີບທີ່ຜູກໂຍງກັບ IBIT ຂອງ BlackRock, ອອກ minibond ແບບ tokenized ຄັ້ງທຳອິດຂອງອິຕາລີໃນ public blockchain, ເຂົ້າຮ່ວມກຸ່ມ Qivalis ທີ່ກຳລັງພັດທະນາ euro stablecoin, ແລະໃນອາທິດນີ້ໄດ້ຖືຮຸ້ນສ່ວນນ້ອຍ (minority stake) ໃນແພລດຟອມ VC Trade ຂອງເຢຍລະມັນ. ການເຄື່ອນໄຫວນີ້ ເຂົ້າກັບການປ່ຽນທີ່ກວ້າງຂຶ້ນຂອງທະນາຄານຢູໂລບ ທີ່ສັບປ່ຽນຕາມ MiCA. ການຮັກສາ (custody) ແລະນາຍໜ້າ (brokerage) ມີຄວາມສຳຄັນຫຼາຍກວ່າບັນທຶກ tokenized ອັນດຽວອີກອັນໜຶ່ງ, ເພາະວ່ານັ້ນແມ່ນສິ່ງທີ່ຊັບສິນຂອງລູກຄ້າຖືກຈັດວາງຢູ່ໃນ balance sheet ຂອງຜູ້ໃຫ້ກູ້ຢືມຂະໜາດໃຫຍ່. ນີ້ຍັງເປັນການທົບທວນ (review) ບໍ່ແມ່ນການເປີດຕົວ (launch). ສັນຍານຄືວ່າທະນາຄານລາຍໃຫຍ່ຂອງອິຕາລີກຳລັງຊອກຫາໂຄງລະບົບ (infrastructure) ແລ້ວ ບໍ່ໄດ້ປະຕິເສດປະເພດນີ້. #BTC Price Analysis# #Bitcoin Price Prediction: What is Bitcoins next move?# $BTC $XRP

·
--
Awọn adanu ti Awọn Dimọ Igbà-gun Le Tẹsiwaju Fun Ọdún Kan Ifihan akọkọ ti wahala awọn dimọ kii ṣe kanna bi isalẹ ti a ti parí. Àwòrán LTH-SOPR Glassnode fi hàn pé àwọn owó atijọ lè jẹ́ ní pẹkipẹki pẹ́lú àdánù fún igba pipẹ. Ẹ̀yà ìjàkadì 2014–15 pa ipo náà mọ́ fún ọjọ́ 402, níbi tí ìwọn náà ti ṣubú sí 0.50, tàbí tó fẹrẹẹ jẹ́ 50% adanu apapọ. Ẹ̀yà ìjàkadì 2018–19 pẹ́ fún ọjọ́ 328 ó sì de isalẹ ní nítòsí 0.48, tàbí tó fẹrẹẹ jẹ́ 52% adanu. Oṣù Kẹta 2020 kuru: ọjọ́ 50, sọ̀kalẹ̀ sí 0.80, tàbí tó fẹrẹẹ jẹ́ 20% adanu. Ní Oṣù Keje 2022 ìwọn kan náà wà ní 0.67. Àwọn dimọ̀ ìgbà-gun tí ń gbe owó ń mú adanu apapọ 33% wọlé lẹ́yìn ọjọ́ 51 nínú agbègbè yẹn nìkan. Glassnode ṣì kìlọ̀ pé iye owo le ṣubú síi. Wọn ṣe bẹ́ẹ̀. Ìfiwéra Cryptoquant_com láàrin ìgbà-gun àti ìgbà-kúrò nílò ìkìlọ̀ náà náà. Kí ìwọ̀n èrè rẹ kò dáa ju ẹgbẹ́ míì lọ kò túmọ̀ sí pé o ń gba adanu ní kíkún laifọwọyi. Ìfarapa ìṣe-olójà tí kò dára ju le tẹ̀síwájú láì tí ìmúlò gbooro (reset) bá tí parí. Iyẹn ṣì fi àjọṣe kan sílẹ̀ fún ìjọba láti kó jọ. Kò dá idi kan láti yara. Awọn akoko iṣáájú yẹn nílò àkókò nínú adanu, kì í ṣe ìka akọkọ nínú rẹ nikan. #BTC Price Analysis# #Bitcoin Price Prediction: What is Bitcoins next move?# $BTC $XRP
Awọn adanu ti Awọn Dimọ Igbà-gun Le Tẹsiwaju Fun Ọdún Kan Ifihan akọkọ ti wahala awọn dimọ kii ṣe kanna bi isalẹ ti a ti parí. Àwòrán LTH-SOPR Glassnode fi hàn pé àwọn owó atijọ lè jẹ́ ní pẹkipẹki pẹ́lú àdánù fún igba pipẹ. Ẹ̀yà ìjàkadì 2014–15 pa ipo náà mọ́ fún ọjọ́ 402, níbi tí ìwọn náà ti ṣubú sí 0.50, tàbí tó fẹrẹẹ jẹ́ 50% adanu apapọ. Ẹ̀yà ìjàkadì 2018–19 pẹ́ fún ọjọ́ 328 ó sì de isalẹ ní nítòsí 0.48, tàbí tó fẹrẹẹ jẹ́ 52% adanu. Oṣù Kẹta 2020 kuru: ọjọ́ 50, sọ̀kalẹ̀ sí 0.80, tàbí tó fẹrẹẹ jẹ́ 20% adanu. Ní Oṣù Keje 2022 ìwọn kan náà wà ní 0.67. Àwọn dimọ̀ ìgbà-gun tí ń gbe owó ń mú adanu apapọ 33% wọlé lẹ́yìn ọjọ́ 51 nínú agbègbè yẹn nìkan. Glassnode ṣì kìlọ̀ pé iye owo le ṣubú síi. Wọn ṣe bẹ́ẹ̀. Ìfiwéra Cryptoquant_com láàrin ìgbà-gun àti ìgbà-kúrò nílò ìkìlọ̀ náà náà. Kí ìwọ̀n èrè rẹ kò dáa ju ẹgbẹ́ míì lọ kò túmọ̀ sí pé o ń gba adanu ní kíkún laifọwọyi. Ìfarapa ìṣe-olójà tí kò dára ju le tẹ̀síwájú láì tí ìmúlò gbooro (reset) bá tí parí. Iyẹn ṣì fi àjọṣe kan sílẹ̀ fún ìjọba láti kó jọ. Kò dá idi kan láti yara. Awọn akoko iṣáájú yẹn nílò àkókò nínú adanu, kì í ṣe ìka akọkọ nínú rẹ nikan. #BTC Price Analysis# #Bitcoin Price Prediction: What is Bitcoins next move?# $BTC $XRP

·
--
IMetaplanet Yehlisa Izinketho Zobuholi Ngemuva Kokuphikiswa Abanikazi Bamasheya Ithimba le-Bitcoin lesikhulu kunazo zonke elisohlwini esidlangalaleni e-Japan selinciphise usayizi wesimangalo sobuholi. Ngokwesaziso saso sango-September 11, ibhodi lilungise kabusha amalungelo okuthola amasheya e-Series 10. Izinga lokuguqulwa (conversion ratio) lisethwe kabusha futhi cishe u-41% wamasheya angaba khona ahlobene nawo aqanselwa, okuchitha ngaphezu kuka-$220 million wobalo lamasheke (warrant value). I-CEO u-Simon Gerovich wayesevele esebenzise amalungelo akhe aletha cishe amasheya ayizigidi ezingu-64. Izinketho ezisele ezingakavuthwa (unvested) manje zivuleka ngo-2029, 2030, nango-2031. Imininingwane Ebalulekile: > I-CEO yayivele yathola cishe amasheya ayizigidi ezingu-64 ngokusebenzisa i-exercise ye-Series 10. > Izinketho zinciphisiwe: ichibi (pool) linciphiswe, kwaqanselwa ngaphezu kuka-$220 million wobalo lamasheke kanye namasheya angaba cishe u-41% ahlobene. > Ukuguqulwa (conversion) kubuyiselwe ku-amasheya angu-410 ilungelo ngalinye, ileveli ngaphambi kokunikezwa (pre-offering level). > Ingxenye esele engakavuthwa ivuthwa (vests) ngezigaba (tranches) kusukela ngo-2029 kuya ku-2031. > Ichibi lesinxephezelo esihleliwe labasebenzi elixhunywe kulesi sakhiwo laliqanseliwe. Ukuphikiswa kwakungokokuncipha kobunikazi (dilution): ifomula yezinketho yayikhule ngawo wonke amasheya akhishwa ukuze kuthengwe i-Bitcoin, yandisa isimangalo sobuholi. Ukusika leli phuli kuphakamisa i-Bitcoin kuwo wonke isheya eliguqulwe ngokugcwele (fully diluted share). Akuwubuyiseli emuva amasheya asevele akhishiwe ku-CEO. Umbuso manje usuyingxenye yohwebo lwe-Metaplanet, hhayi nje i-BTC stack. I-Metaplanet: Ukusika Izinketho Zobukhulu-Bu-105M, Kuchithwe u-$220M, Amasheya ka-CEO angama-64M asevele aphumile #BTC Price Analysis# #Bitcoin Price Prediction: Yini ukuhambisa okulandelayo kwe-Bitcoins?# $BTC $SOL
IMetaplanet Yehlisa Izinketho Zobuholi Ngemuva Kokuphikiswa Abanikazi Bamasheya Ithimba le-Bitcoin lesikhulu kunazo zonke elisohlwini esidlangalaleni e-Japan selinciphise usayizi wesimangalo sobuholi. Ngokwesaziso saso sango-September 11, ibhodi lilungise kabusha amalungelo okuthola amasheya e-Series 10. Izinga lokuguqulwa (conversion ratio) lisethwe kabusha futhi cishe u-41% wamasheya angaba khona ahlobene nawo aqanselwa, okuchitha ngaphezu kuka-$220 million wobalo lamasheke (warrant value). I-CEO u-Simon Gerovich wayesevele esebenzise amalungelo akhe aletha cishe amasheya ayizigidi ezingu-64. Izinketho ezisele ezingakavuthwa (unvested) manje zivuleka ngo-2029, 2030, nango-2031. Imininingwane Ebalulekile: > I-CEO yayivele yathola cishe amasheya ayizigidi ezingu-64 ngokusebenzisa i-exercise ye-Series 10. > Izinketho zinciphisiwe: ichibi (pool) linciphiswe, kwaqanselwa ngaphezu kuka-$220 million wobalo lamasheke kanye namasheya angaba cishe u-41% ahlobene. > Ukuguqulwa (conversion) kubuyiselwe ku-amasheya angu-410 ilungelo ngalinye, ileveli ngaphambi kokunikezwa (pre-offering level). > Ingxenye esele engakavuthwa ivuthwa (vests) ngezigaba (tranches) kusukela ngo-2029 kuya ku-2031. > Ichibi lesinxephezelo esihleliwe labasebenzi elixhunywe kulesi sakhiwo laliqanseliwe. Ukuphikiswa kwakungokokuncipha kobunikazi (dilution): ifomula yezinketho yayikhule ngawo wonke amasheya akhishwa ukuze kuthengwe i-Bitcoin, yandisa isimangalo sobuholi. Ukusika leli phuli kuphakamisa i-Bitcoin kuwo wonke isheya eliguqulwe ngokugcwele (fully diluted share). Akuwubuyiseli emuva amasheya asevele akhishiwe ku-CEO. Umbuso manje usuyingxenye yohwebo lwe-Metaplanet, hhayi nje i-BTC stack. I-Metaplanet: Ukusika Izinketho Zobukhulu-Bu-105M, Kuchithwe u-$220M, Amasheya ka-CEO angama-64M asevele aphumile #BTC Price Analysis# #Bitcoin Price Prediction: Yini ukuhambisa okulandelayo kwe-Bitcoins?# $BTC $SOL

·
--
I-<b>Bitcoin</b> iphinde yathola i-$78,000 kanti i-Ether yabuya yathola i-$2,500. Okukhishiwe kwe-CPI bekusezingeni. Ukweqa bekungancane. Ngokusho kwamashadi eseshini, i-$BTC igijime isuka ku-wick eduze ne-$76,100 yabuyela idlule i-$78,000, yenyuka cishe ngo-1% ngosuku. I-$ETH yehlile yaya cishe ku-$2,435, bese iphinde yathola i-$2,500 yaphinde yanyathelwa eduze ne-$2,510, inyuke cishe ngo-3%. Imininingwane Ebalulekile: > I-Bitcoin: cishe $78,000, +$750 / +0.97% eseshini ngemva kokwehla okusheshayo. > I-Ethereum: cishe $2,510, +$74 / +3.03%, ibuye yaphakama ngaphezu kuka-$2,500. > Umongo: I-CPI yangoLwesihlanu ku-3.4%, ihambisana nezibikezelo, emva kwe-PPI kaLwesine engu-5.4%. > I-Ether igijima phambili kune-Bitcoin ngosuku, okuhambisana nokwehla kwakamuva ku-BTC dominance. I-CPI ebelingana ithuse kakhulu ikhiphe uvalo lokukhuphuka okubi kakhulu (scare) ngaphandle kwethephu ntambama. I-$78,000 isengaphansi kwe-$80,000–$83,000 okuyisigaba esibalulekile emasontweni onke. I-$2,500 Ether wukubuyiselwa kwenombolo ephelele, hhayi umkhuba omusha wedwa. Umhlangano we-Fed ngesonto elizayo usengumcimbi onqumayo wokuthi lokhu kweqa kuzoqhubeka yini. I-Bitcoin $78,000 ne-Ether $2,500 Ngemva kwe-CPI Ebelingana Uyakwazi ukuthenga lokhu kubuyiselwa ngesikhathi somhlangano we-Fed, noma ukukulahla uze kube yilapho i-$80,000 ne-$2,550 kuyiqiniso ngempela? #BTC Price Analysis# #Bitcoin Price Prediction: Kuyini ukunyakaza okulandelayo kwe-Bitcoins?# $BTC $ETH
I-<b>Bitcoin</b> iphinde yathola i-$78,000 kanti i-Ether yabuya yathola i-$2,500. Okukhishiwe kwe-CPI bekusezingeni. Ukweqa bekungancane. Ngokusho kwamashadi eseshini, i-$BTC igijime isuka ku-wick eduze ne-$76,100 yabuyela idlule i-$78,000, yenyuka cishe ngo-1% ngosuku. I-$ETH yehlile yaya cishe ku-$2,435, bese iphinde yathola i-$2,500 yaphinde yanyathelwa eduze ne-$2,510, inyuke cishe ngo-3%. Imininingwane Ebalulekile: > I-Bitcoin: cishe $78,000, +$750 / +0.97% eseshini ngemva kokwehla okusheshayo. > I-Ethereum: cishe $2,510, +$74 / +3.03%, ibuye yaphakama ngaphezu kuka-$2,500. > Umongo: I-CPI yangoLwesihlanu ku-3.4%, ihambisana nezibikezelo, emva kwe-PPI kaLwesine engu-5.4%. > I-Ether igijima phambili kune-Bitcoin ngosuku, okuhambisana nokwehla kwakamuva ku-BTC dominance. I-CPI ebelingana ithuse kakhulu ikhiphe uvalo lokukhuphuka okubi kakhulu (scare) ngaphandle kwethephu ntambama. I-$78,000 isengaphansi kwe-$80,000–$83,000 okuyisigaba esibalulekile emasontweni onke. I-$2,500 Ether wukubuyiselwa kwenombolo ephelele, hhayi umkhuba omusha wedwa. Umhlangano we-Fed ngesonto elizayo usengumcimbi onqumayo wokuthi lokhu kweqa kuzoqhubeka yini. I-Bitcoin $78,000 ne-Ether $2,500 Ngemva kwe-CPI Ebelingana Uyakwazi ukuthenga lokhu kubuyiselwa ngesikhathi somhlangano we-Fed, noma ukukulahla uze kube yilapho i-$80,000 ne-$2,550 kuyiqiniso ngempela? #BTC Price Analysis# #Bitcoin Price Prediction: Kuyini ukunyakaza okulandelayo kwe-Bitcoins?# $BTC $ETH

26
·
--
Test a Transfer Before You Move Large Amounts A small test send is the simplest way to avoid a permanent loss. Send one rupee or one dollar first. Confirm it lands on the right address, the right network, and the right asset. That check takes about thirty seconds. It is the difference between a cheap mistake and a full-balance error. Most large wallet losses do not come from market moves. They come from a wrong chain, a mistyped address, or a destination that was never verified. The test is how you catch that before the real amount leaves. The amount itself is trivial. The signal is the confirmation. If you are using a hardware wallet, match the receive address on the device screen, not only in the app. Then send the rest. A small test is still the highest-leverage habit in crypto operations. #BTC Price Analysis# #Bitcoin Price Prediction: What is Bitcoins next move?# $BTC $XRP
Test a Transfer Before You Move Large Amounts A small test send is the simplest way to avoid a permanent loss. Send one rupee or one dollar first. Confirm it lands on the right address, the right network, and the right asset. That check takes about thirty seconds. It is the difference between a cheap mistake and a full-balance error. Most large wallet losses do not come from market moves. They come from a wrong chain, a mistyped address, or a destination that was never verified. The test is how you catch that before the real amount leaves. The amount itself is trivial. The signal is the confirmation. If you are using a hardware wallet, match the receive address on the device screen, not only in the app. Then send the rest. A small test is still the highest-leverage habit in crypto operations. #BTC Price Analysis# #Bitcoin Price Prediction: What is Bitcoins next move?# $BTC $XRP

23
ເຂົ້າສູ່ລະບົບເພື່ອສຳຫຼວດເນື້ອຫາເພີ່ມເຕີມ
ເຂົ້າຮ່ວມກຸ່ມຜູ້ໃຊ້ຄຣິບໂຕທົ່ວໂລກໃນ Binance Square.
⚡️ ໄດ້ຮັບຂໍ້ມູນຫຼ້າສຸດ ແລະ ທີ່ມີປະໂຫຍດກ່ຽວກັບຄຣິບໂຕ.
💬 ໄດ້ຮັບຄວາມໄວ້ວາງໃຈຈາກຕະຫຼາດແລກປ່ຽນຄຣິບໂຕທີ່ໃຫຍ່ທີ່ສຸດໃນໂລກ.
👍 ຄົ້ນຫາຂໍ້ມູນເຊີງເລິກທີ່ແທ້ຈາກນັກສ້າງທີ່ໄດ້ຮັບການຢືນຢັນ.
ອີເມວ / ເບີໂທລະສັບ
ຫົວຂໍ້ທີ່ກໍາລັງນິຍົມ
SECReceivesGrayscaleLitecoinTrustETFFiling
1,544 views
81 ກຳລັງສົນທະນາ
💎 ການໃຫ້ຄວາມສົນໃຈຂອງສະຖາບັນ ເຂົ້າເຖິງ Litecoin
ເອກະສານຍື່ນ ETF ຂອງ Grayscale ໄດ້ເຮັດໃຫ້ $LTC ກາຍເປັນຫົວຂໍ້ໃນການສົນທະນາທີ່ຫຼາຍຂຶ້ນ. ສຳລັບນັກຄ້າ spot, ການພັດທະນາແບບນີ້ແມ່ນການເຕືອນໃຫ້ສຶກສາສິນຊັບທີ່ແຂງແຮງກ່ອນເຂົ້າສູ່ການຊື້ຂາຍ.
#secreceivesgrayscalelitecointrustetffiling
CryptoMahibaloch
·1 ຖືກໃຈ
·348 views
ClarityActFacesProceduralVoteSept15
83,521 views
1,051 ກຳລັງສົນທະນາ
US10YearTreasuryYieldNears5%
30,277 views
541 ກຳລັງສົນທະນາ